
Abstract
This study investigates the effects of corona discharge (CD) on the electrical, dielectric, and morphological properties of HDPE-based nanocomposites with HfO2 and Ta2O5 fillers. Dielectric constant values at 1 kHz significantly increased, with pure HDPE rising from 1.78 to 3.51, indicating enhanced polarization. HDPE/7%HfO2 also exhibited an increase from 3.32 to 4.81, attributed to improved charge trapping and interfacial interactions, as supported by the Maxwell-Garnett model. Electrical conductivity increased with higher nanoparticle loading, with HDPE/7%Ta2O5 showing the highest conductivity of 26.2 × 10⁻¹⁵ S/m, correlating with its elevated dielectric constant. This relationship highlights the role of nanoparticle-induced interfacial polarization in enhancing both dielectric and conductive properties. Breakdown voltage measurements revealed a decline after CD, with HDPE decreasing from 12 kV to 8 kV, and HDPE/7% HfO2 dropping from 13.2 kV to 6.5 kV, indicating partial degradation of insulating properties. Atomic force microscopy (AFM) revealed surface roughness changes for HDPE/HfO2 from 127-250 nm to 65-175 nm after CD. Infrared spectroscopy identified peaks at 720 cm−1, 830 cm−1, and 2901 cm−1, confirming successful nanoparticle interactions with the HDPE matrix, indicating good compatibility for advanced polymer applications.
Introduction
Polymer nanocomposites based on HDPE have become increasingly important among technologically significant materials due to their wide range of applications.1–3 The study of composite materials consisting of a polymer matrix and nanosized fillers is currently a rapidly developing scientific field within physics. The use of nanocomposites instead of pure polymers is particularly relevant because nanofillers impart properties to the material that are unattainable with conventional polymer composites.4,5 Notable among these properties are enhanced strength, thermal stability, dielectric and electrical characteristics, and improved durability of the resulting composite materials. The introduction of nanofillers significantly affects the physicochemical properties and structure of polymer materials, largely due to the formation of interfacial layers within the polymer matrix near the surface of the nanofillers. Moreover, nanofillers can provide mechanical constraints that limit the mobility and deformation of the matrix. Additionally, nanofillers that form van der Waals bonds between chains and particles enhance restrictions between the particles/polymer chains and the polymer chains themselves, causing the chains to bear additional forces. 6
Current research highlights several key studies on how external conditions influence the properties of nanocomposites. In our previous work, we explored the role of polarization charges in enhancing the photoluminescent properties of polyvinylidene fluoride-based nanocomposites, as well as the impact of varying crystallization rates on the dielectric and photoluminescence behavior of PVC/TiO2 systems.7,8 In our previous studies, we investigated the influence of polarization charges on photoluminescence in PVDF/TiO2 nanocomposites, finding that charge accumulation at the interface enhances the polarization of TiO2 nanoparticles, with the interfacial layer thickness peaking at 5% concentration. Another study highlighted how cooling rates affect the photoluminescence and dielectric properties of PVC/TiO2 nanocomposites through changes in the polymer’s supramolecular structure.
Bu et al.9–12 investigated the effects of corona aging on polyimide and polyimide/Al2O3 nanocomposite films. Their study revealed that corona aging leads to physical and chemical changes in the material, including modifications in surface roughness and chemical bonds. The researchers also demonstrated that these structural changes influence trap level density and surface degradation over time, making corona aging a significant factor in the long-term stability of these materials.
However, many studies in the literature lack a detailed analysis of long-term mechanical and dielectric stability of polymer nanocomposites under sustained high-voltage exposure. For example, while some studies address the photoluminescence and dielectric properties of nanocomposites, they often overlook how these properties translate into practical performance in high-stress environments. Furthermore, the impact of CD on the structural integrity and breakdown strength of these materials is not thoroughly examined, especially in the context of different polymer matrices and filler types.2,13–16
Our study aims to fill these gaps by focusing on how high-voltage exposure, specifically CD, influences the structural and mechanical properties of HDPE-based nanocomposites. We investigate HDPE/HfO2 and HDPE/Ta2O5 systems to determine how CD affects their strength and structure, particularly considering the high crystallinity of HDPE, which imparts unique mechanical properties. By examining the interaction between the polymer matrix and nanosized fillers under CD, we seek to provide a more comprehensive understanding of their dielectric and mechanical performance. This research not only enhances the prediction of insulating materials’ performance but also contributes to the development of next-generation materials with superior durability and application potential in fields like electronics and energy storage.17–19
Materials and methods
Materials
HDPE polyethylene granules (SOCAR, “Azerikimya” ProductionUnion “Etilen-Polyethylene” plant, 15803-020), CCl4 organic solvent (Code 141245, 99.5%, Cas No-[56-23-5], Common Chemistry- P.L.C); tantalum oxide nanoparticle (Ta2O5), (Hongwu International Group, Ltd, China, 99.9%, T502), hafnium oxide (HfO2) nanoparticles, size 10-20 nm, Luoyang Tongrun Info Technology Co., Ltd. China, CAS 12055-23-1, 99%).
Preparation of polymer nanocomposites
HDPE/Ta2O5and HDPE/HfO2polymer nanocomposites are prepared as follows: polyethylene granules are dissolved at room temperature in 60 mL of carbon tetrachloride (CCl4) at 77°C. Ta2O5 nanoparticles are then added to the polymer solution at various volume concentrations and mixed for 8 hours until a homogeneous mixture is obtained. The mixture is transferred to a Petri dish and dried in a vacuum oven for 24 hours. Thin films of the nanocomposites are subsequently obtained by hot pressing the dried samples at the melting temperature of polyethylene and a pressure of 15 MPa for 10 minutes. After hot pressing, the films are cooled in water at room temperature. The film thickness is 95–105 µm.
Instrumentation
High-voltage CD
The test is designed to evaluate the material’s resistance to sudden load application. The CD was generated using “needle-plane” electrodes. The needle diameter is approximately 0.3 mm, and the distance between the needles and the film samples is 1 cm. The charging voltage Uc ≈14.5 kV, with a charging time of 10 minutes. The thickness of the samples is 105 µm.
Dielectric properties
Dielectric properties have been measured using IET1920 PRECISION LCR METER at a frequency of 1kHz-1 MHz at T 293K.
SЕМ microscopy
SEM analysis of nanocomposites are made on JEOL JSM 6610-LV scanning electron microscope at an accelerating voltage of 30 kV.
FTIR spectroscopy
Fourier-IR spectra were recorded on the Varian 640 FT-IR spectrometer. Transmittance spectra were recorded in the wavenumber range of 400-4000 cm−1.
AFM spectroscopy
The description of topography and roughness of nanocomposite surface relief has been studied by means of AFM scanning probe microscope by brand Integra-Prima (NT-MDT, Zelenograd). Scanning is carried out under air conditions in semi-contact mode with probes made by the plasma chemical method with resonance frequency of 1-5 Hz and radius of curvature of the tip equal to 20 nm. The scanning speed and the number of scanned lines in the image are 1.969 Hz and 256, respectively.
Results and discussions
High-voltage corona discharge
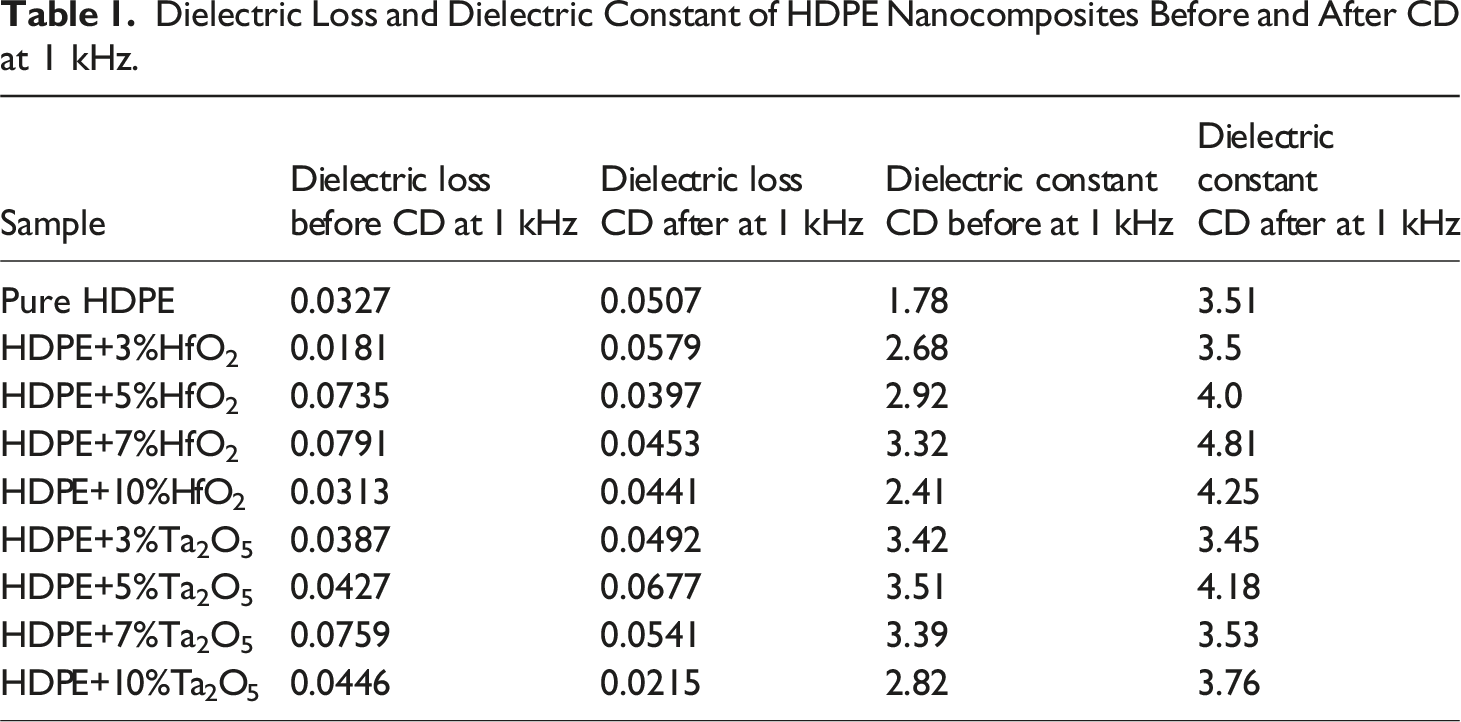
Dielectric Loss and Dielectric Constant of HDPE Nanocomposites Before and After CD at 1 kHz.
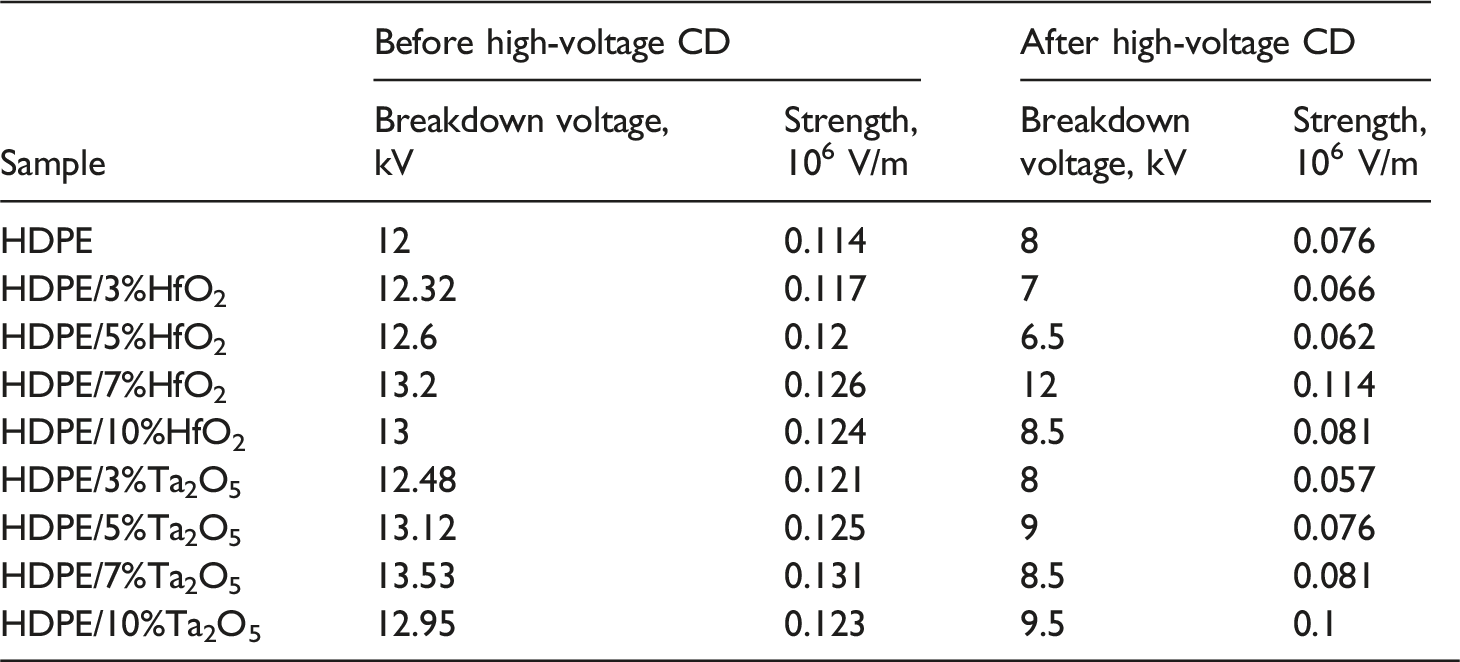
The CD strikes the sample placed between the electrodes (Figure 1), leading to partial breakdown. The initial and final breakdown voltages were measured to observe changes after CD. The results revealed the highest breakdown voltage values for the HDPE/HfO2 and HDPE/Ta2O5 nanocomposites compared to pure HDPE (Table 1). The principal electrical circuit for measuring strength in electrical CD.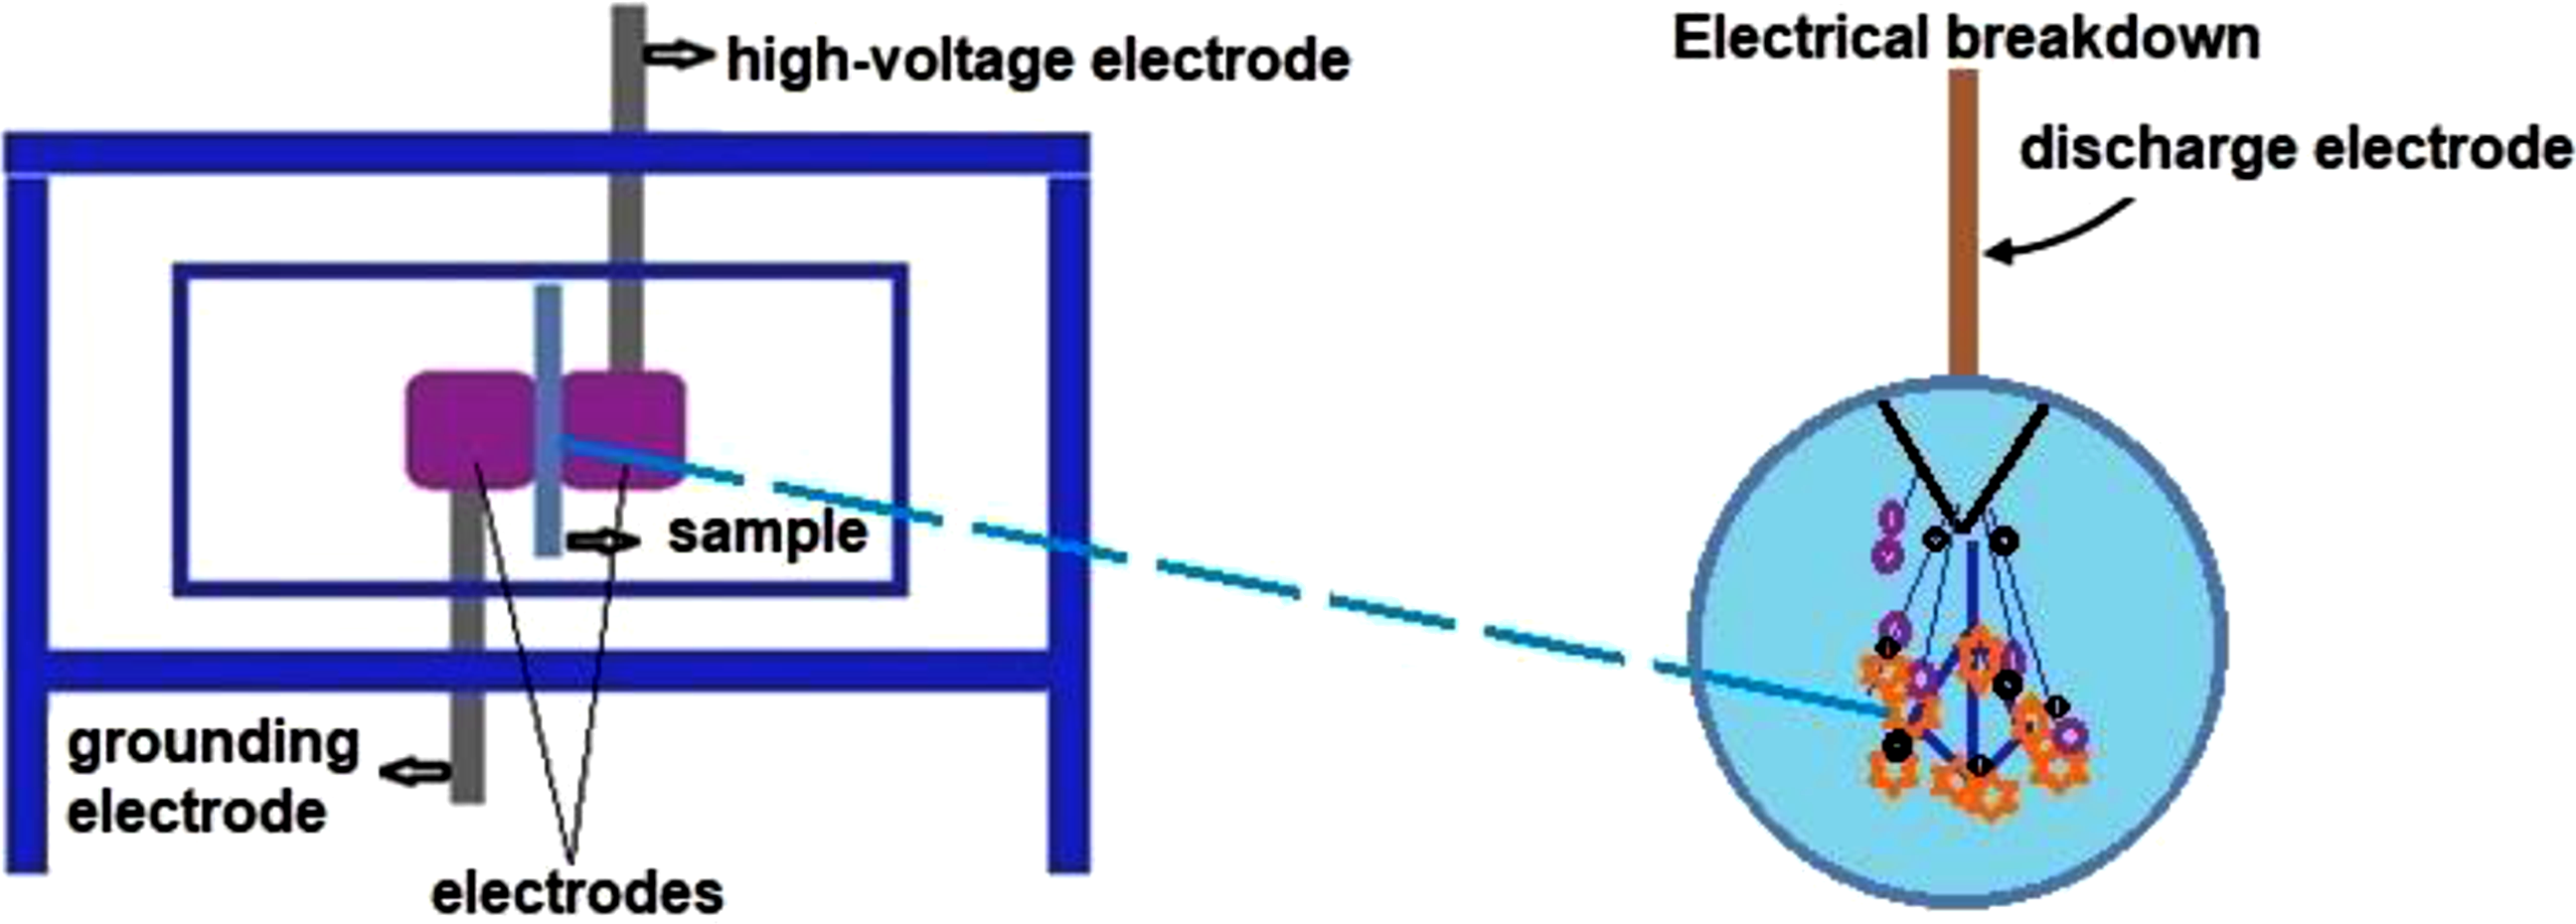
Figure 2 illustrates the breakdown strength of HDPE/HfO2 and HDPE/Ta2O5 nanocomposites as a function of filler concentration: (a) before and (b) after CD. Before CD (Figure 2(a)), the breakdown strength of both nanocomposites increases with filler concentration up to 7%. HDPE/Ta2O5 exhibits a higher breakdown strength compared to HDPE/HfO2 across all concentrations. The improvement at moderate filler concentrations is likely due to better filler dispersion and enhanced interfacial interactions, which improve the dielectric properties. At 10% filler concentration, both nanocomposites show a decline in breakdown strength, possibly due to nanoparticle agglomeration and the formation of weak interfacial regions. After CD (Figure 2(b)), both nanocomposites experience a reduction in breakdown strength. HDPE/HfO2 shows a more pronounced peak at 6% concentration, whereas HDPE/Ta2O5 demonstrates a steady decline with increasing filler content. These trends suggest that higher filler loadings make the nanocomposites more susceptible to CD damage, likely due to increased heterogeneity and defects at the polymer-nanofiller interfaces. These results underscore the importance of optimizing the filler concentration to enhance the breakdown performance of HDPE-based nanocomposites under different electrical conditions. Breakdown strength of HDPE/HfO2 and HDPE/Ta2O5 nanocomposites as a function of concentration before (a) and after (b) CD.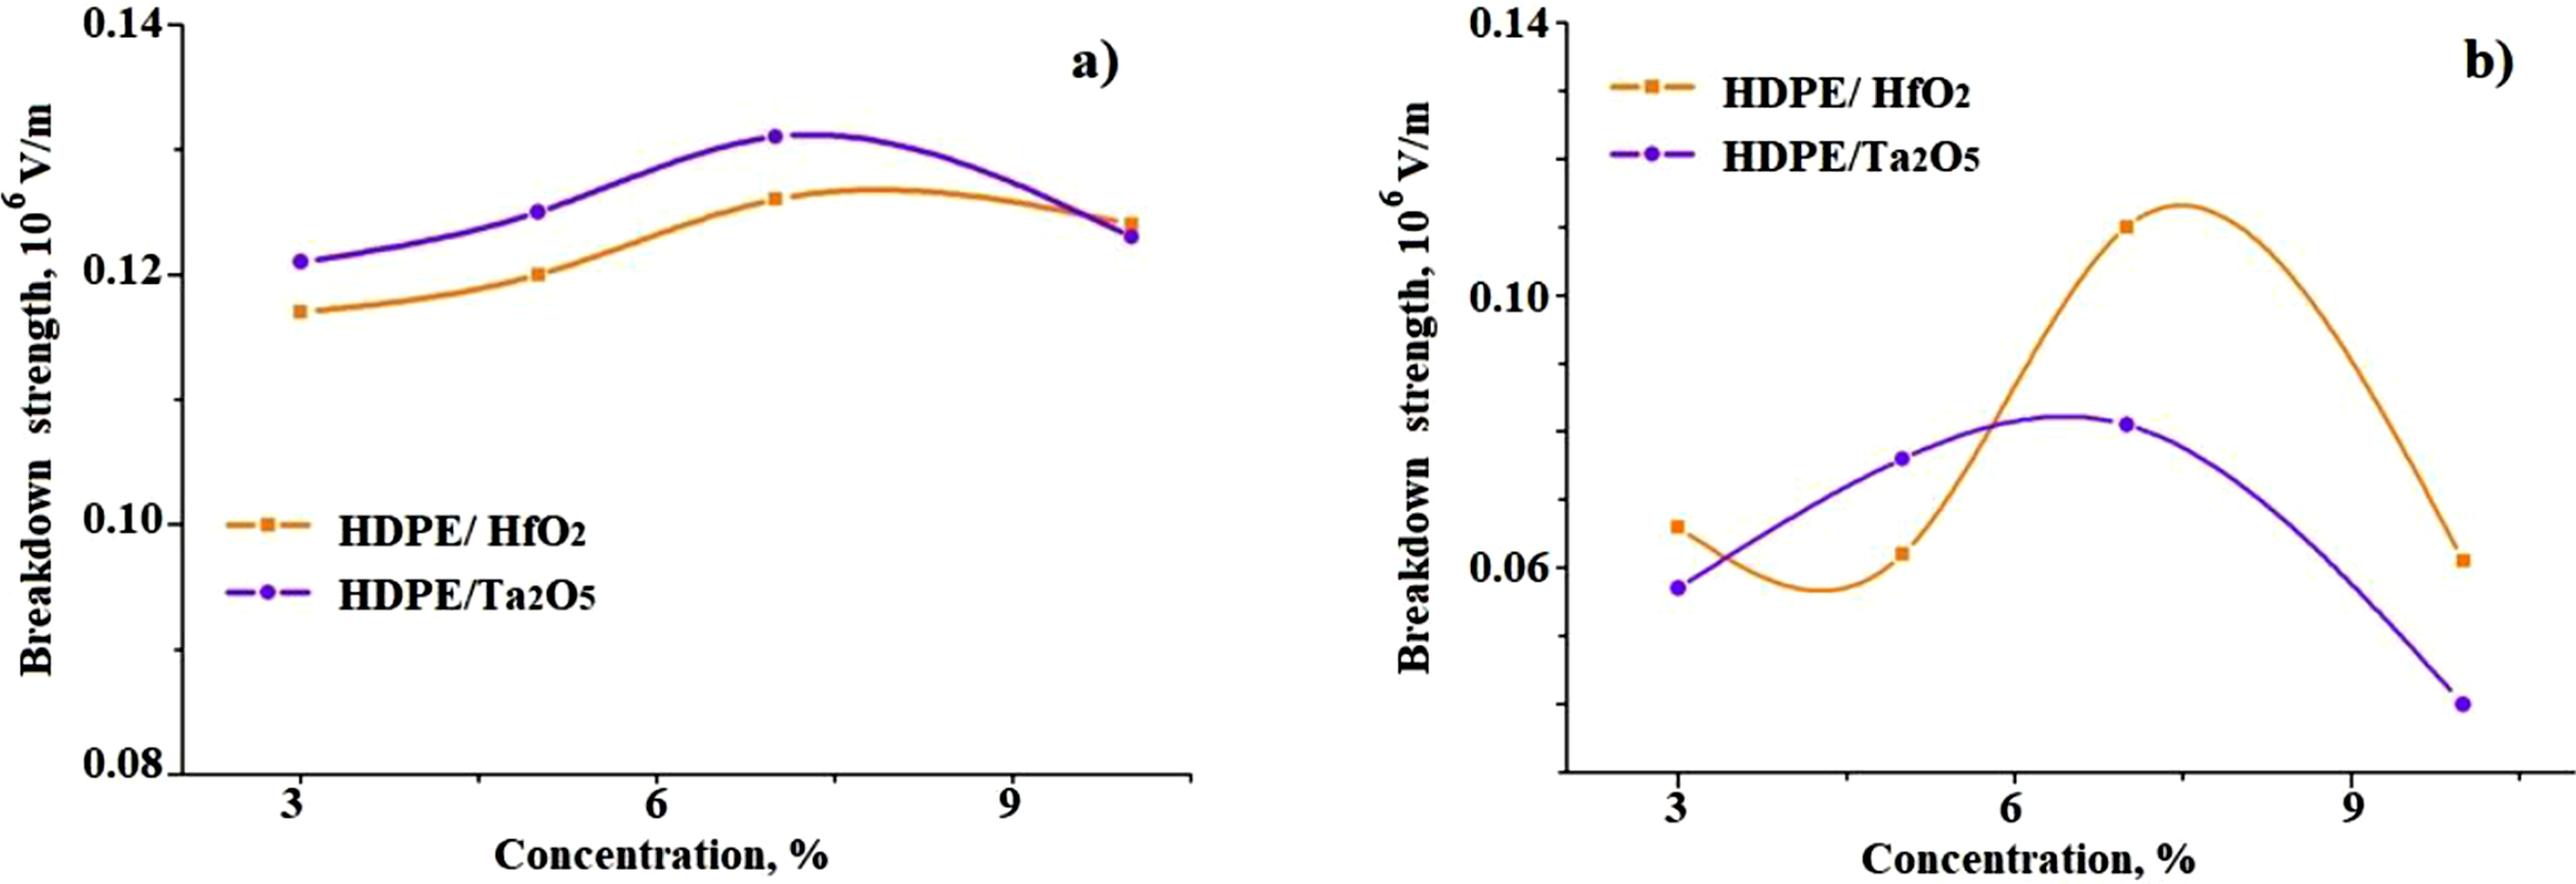
Figure 3 illustrates the breakdown voltage of HDPE-based nanocomposites with varying concentrations of HfO2 and Ta2O5 as a function of failure probability. The results indicate that HDPE/5% HfO2 exhibits the highest breakdown strength, suggesting that this concentration optimally enhances dielectric properties by improving charge trapping and reducing charge mobility. A slight decrease in breakdown voltage at 7% HfO2 may be due to filler agglomeration or increased defect sites. In contrast, HDPE/7% Ta2O5 and HDPE/10% Ta2O5 show lower breakdown voltages compared to HfO2-based samples, indicating that Ta2O5 is less effective at these concentrations. The decrease at HDPE/10% Ta2O5 suggests increased charge transport pathways or interfacial defects that promote premature breakdown. These findings highlight the importance of optimizing filler type and concentration to achieve superior dielectric performance in HDPE-based nanocomposites. Weibull distribution of breakdown voltage for HDPE/HfO2 and HDPE/Ta2O5 nanocomposites.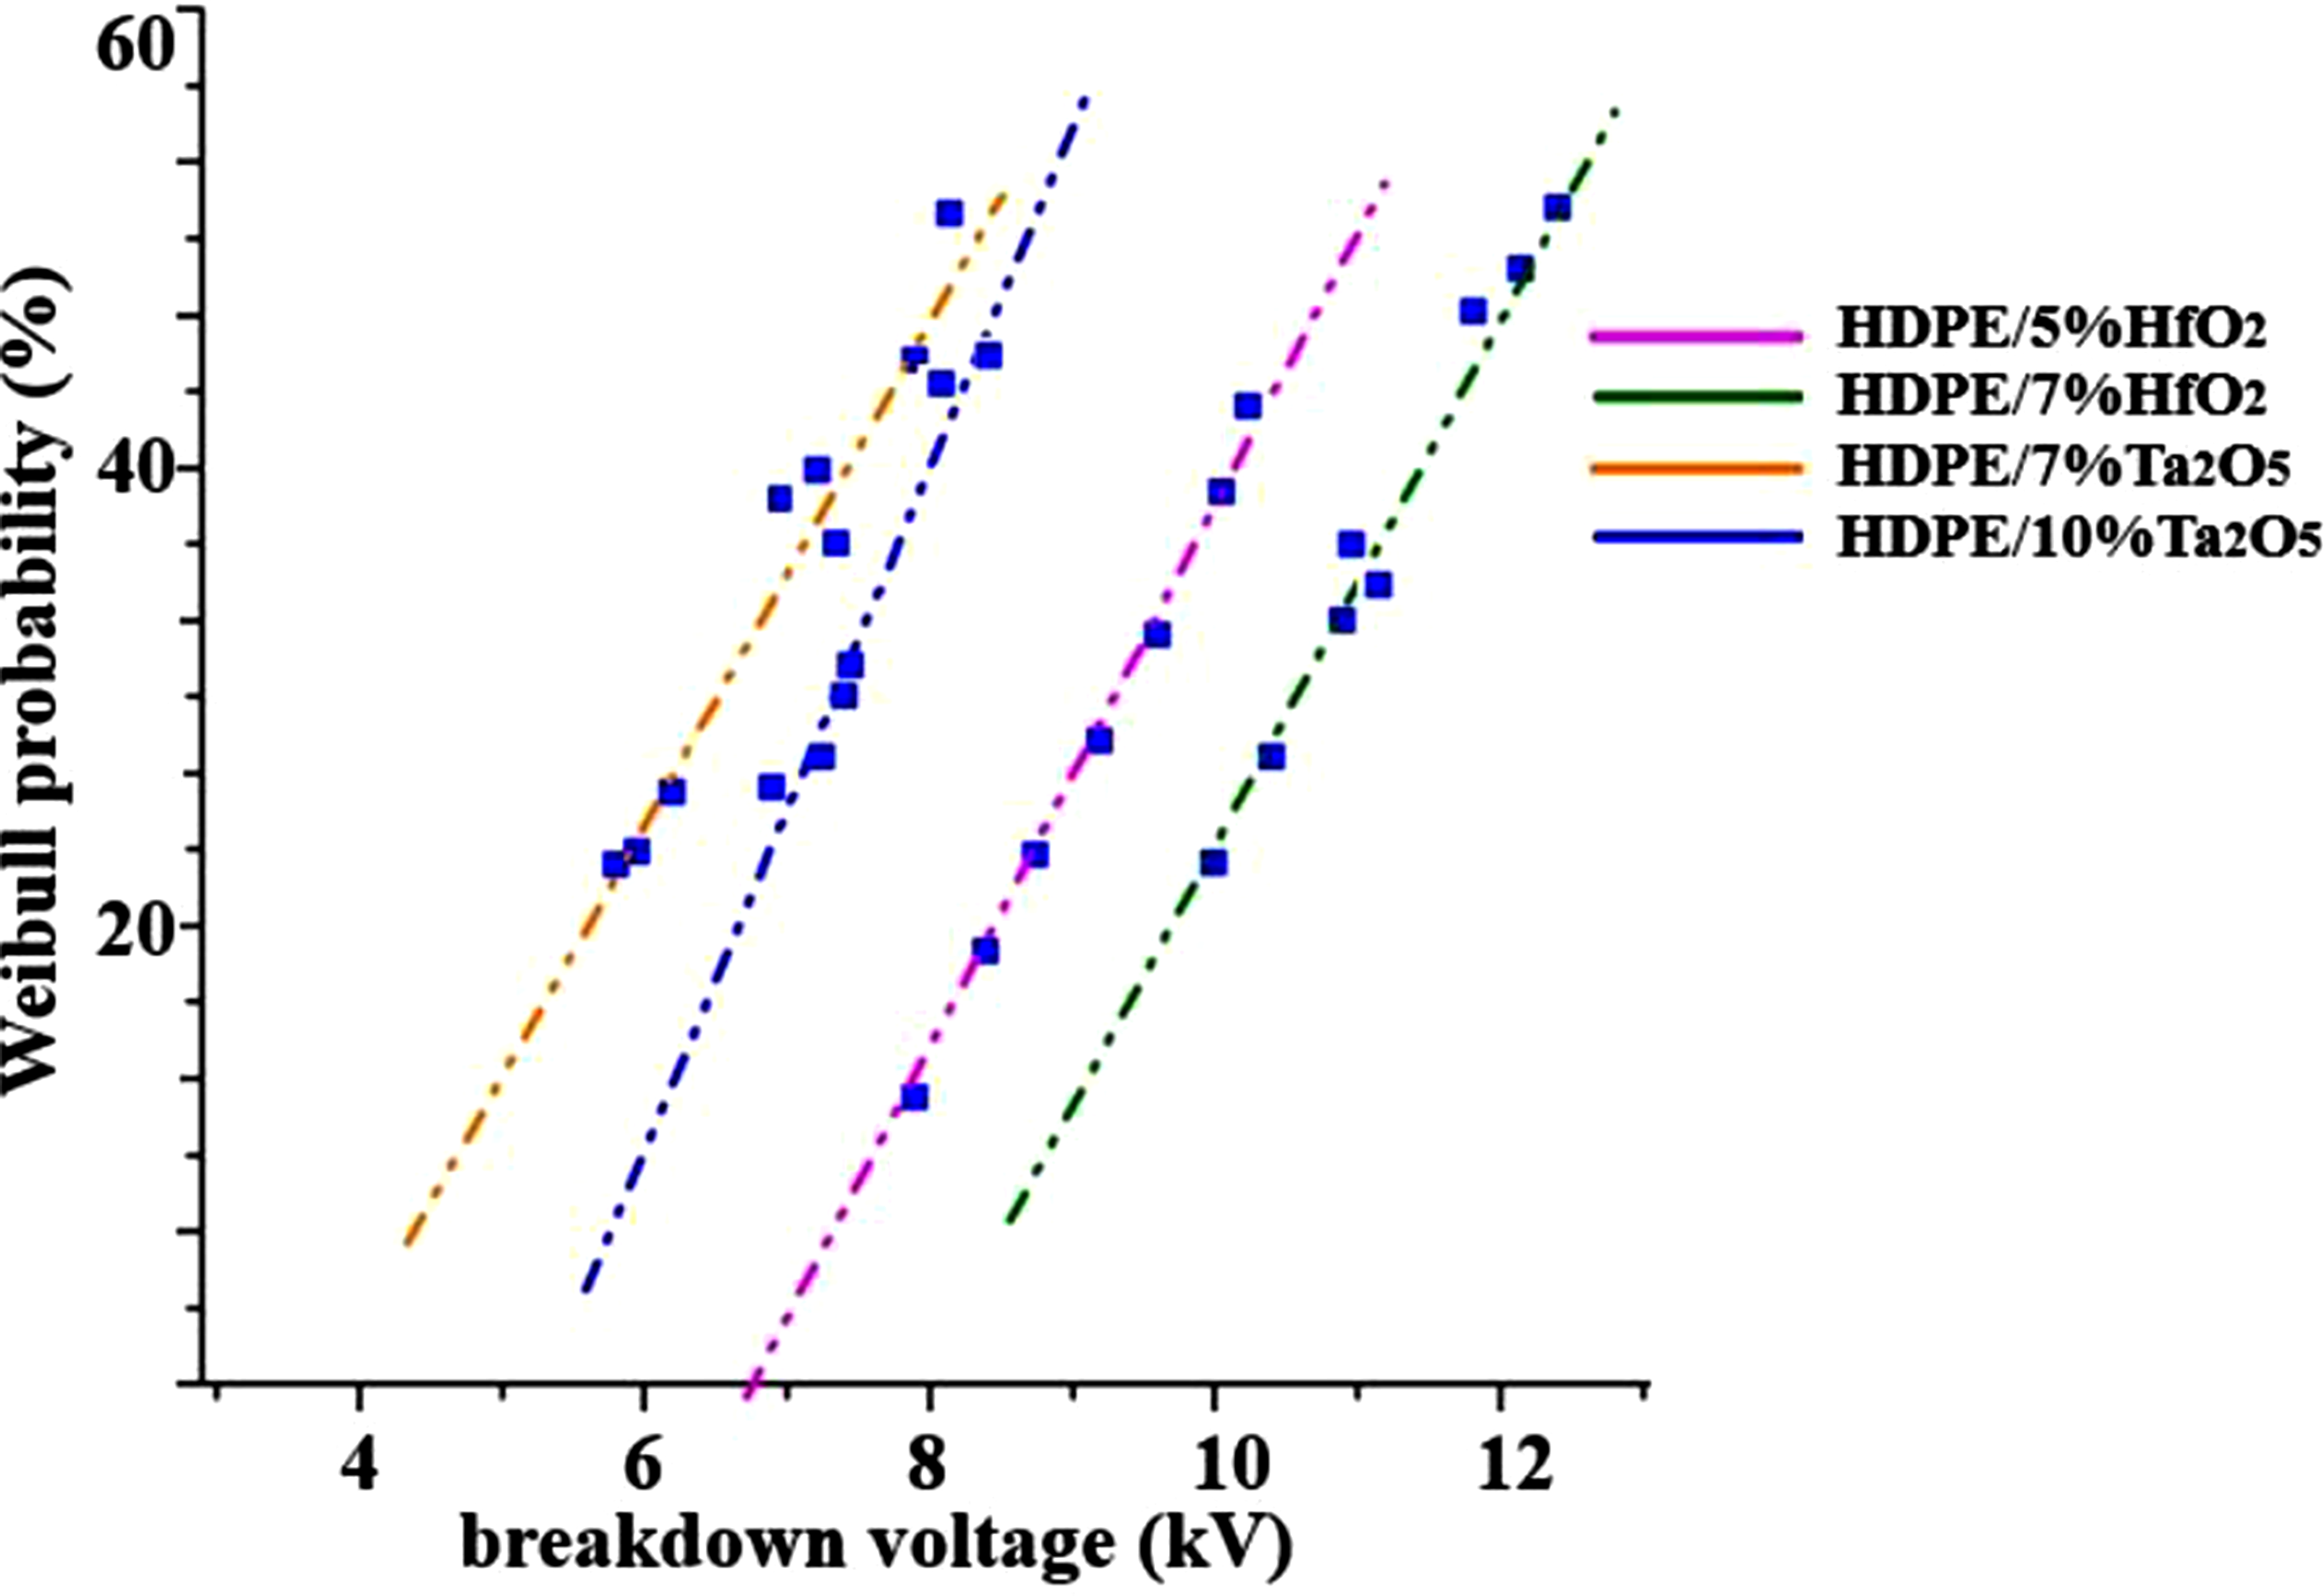
Scanning electron microscopy (SEM)
For HDPE/HfO2 and HDPE/Ta2O5 nanocomposites, SEM and EDS analyses were performed to assess structural and compositional properties. Energy-dispersive X-ray analysis (EDX) using SEM (Figure 4) confirmed the presence of tantalum, hafnium, oxygen, and carbon within the matrix, with weight percentages of Ta (95.49%) and O (4.51%), and Hf (95.55%) and O (4.45%), respectively. The SEM images reveal the distribution of nanoparticles within the HDPE matrix. While elemental mapping indicates a generally uniform dispersion, areas of nanoparticle clustering are observed, particularly in HDPE/5%Ta2O5, supporting the TEM findings of more pronounced agglomeration. These differences in dispersion may be attributed to variations in surface chemistry, influencing nanoparticle interaction with the HDPE matrix and the overall effectiveness of the sonication process. SEM image, corresponding EDX spectra and element mapping of: (a) HDPE/HfO2 and (b) HDPE/Ta2O5 Nanocomposites.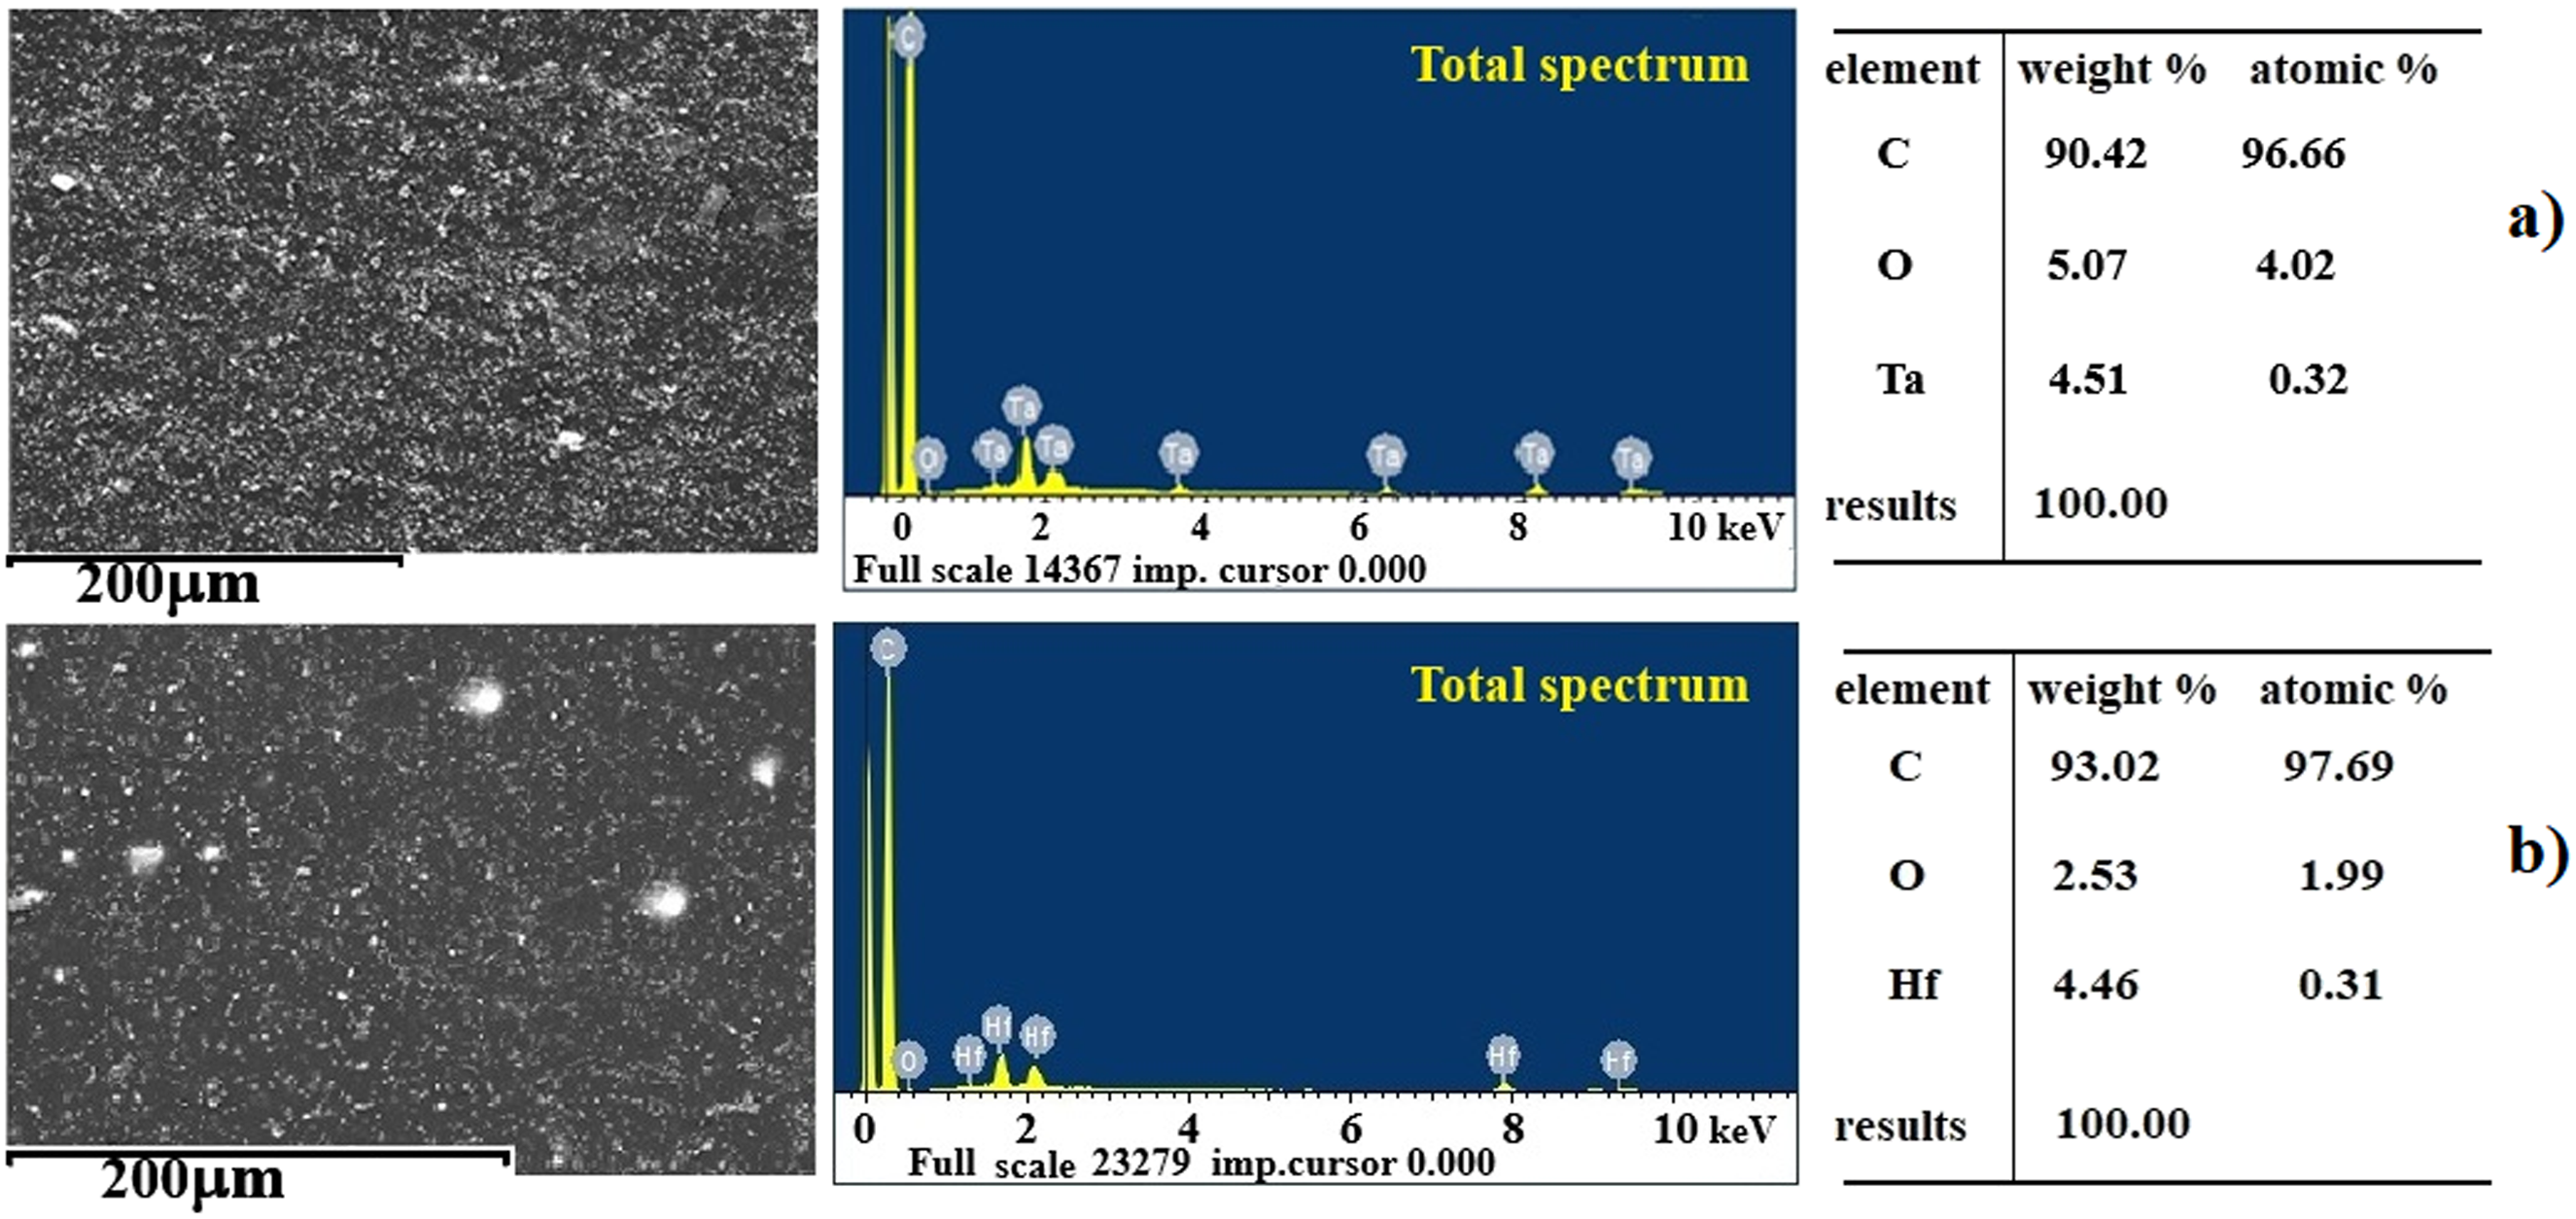
Transmission Electron Microscopy (TEM)
In the HDPE/5%HfO2 sample (Figure 5(a)), the TEM images show HfO2 nanoparticles with a small spherical morphology, ranging in size between 20 and 30 nm. Despite sonication being applied to disperse the particles and reduce aggregation, some agglomeration is still observed. However, the individual nanoparticle size and structure remain distinguishable, indicating that while HfO2 nanoparticles tend to form clusters, the sonication process was sufficient to maintain their distinct characteristics under TEM.
Similarly, in the HDPE/5%Ta2O5 sample (Figure 5(b)), agglomeration is also present, though the Ta2O5 nanoparticles appear to cluster together more noticeably. This could be attributed to differences in surface chemistry between Ta2O5 and HfO2, which may affect their interaction with the PE matrix and the efficiency of the sonication process. Like the HfO2 sample, this agglomeration can influence the homogeneity of the nanocomposite and potentially impact the material’s overall properties, such as mechanical strength and dielectric behavior. TEM images of polymer nanocomposite (a) HDPE/HfO2 and (b) HDPE/Ta2O5.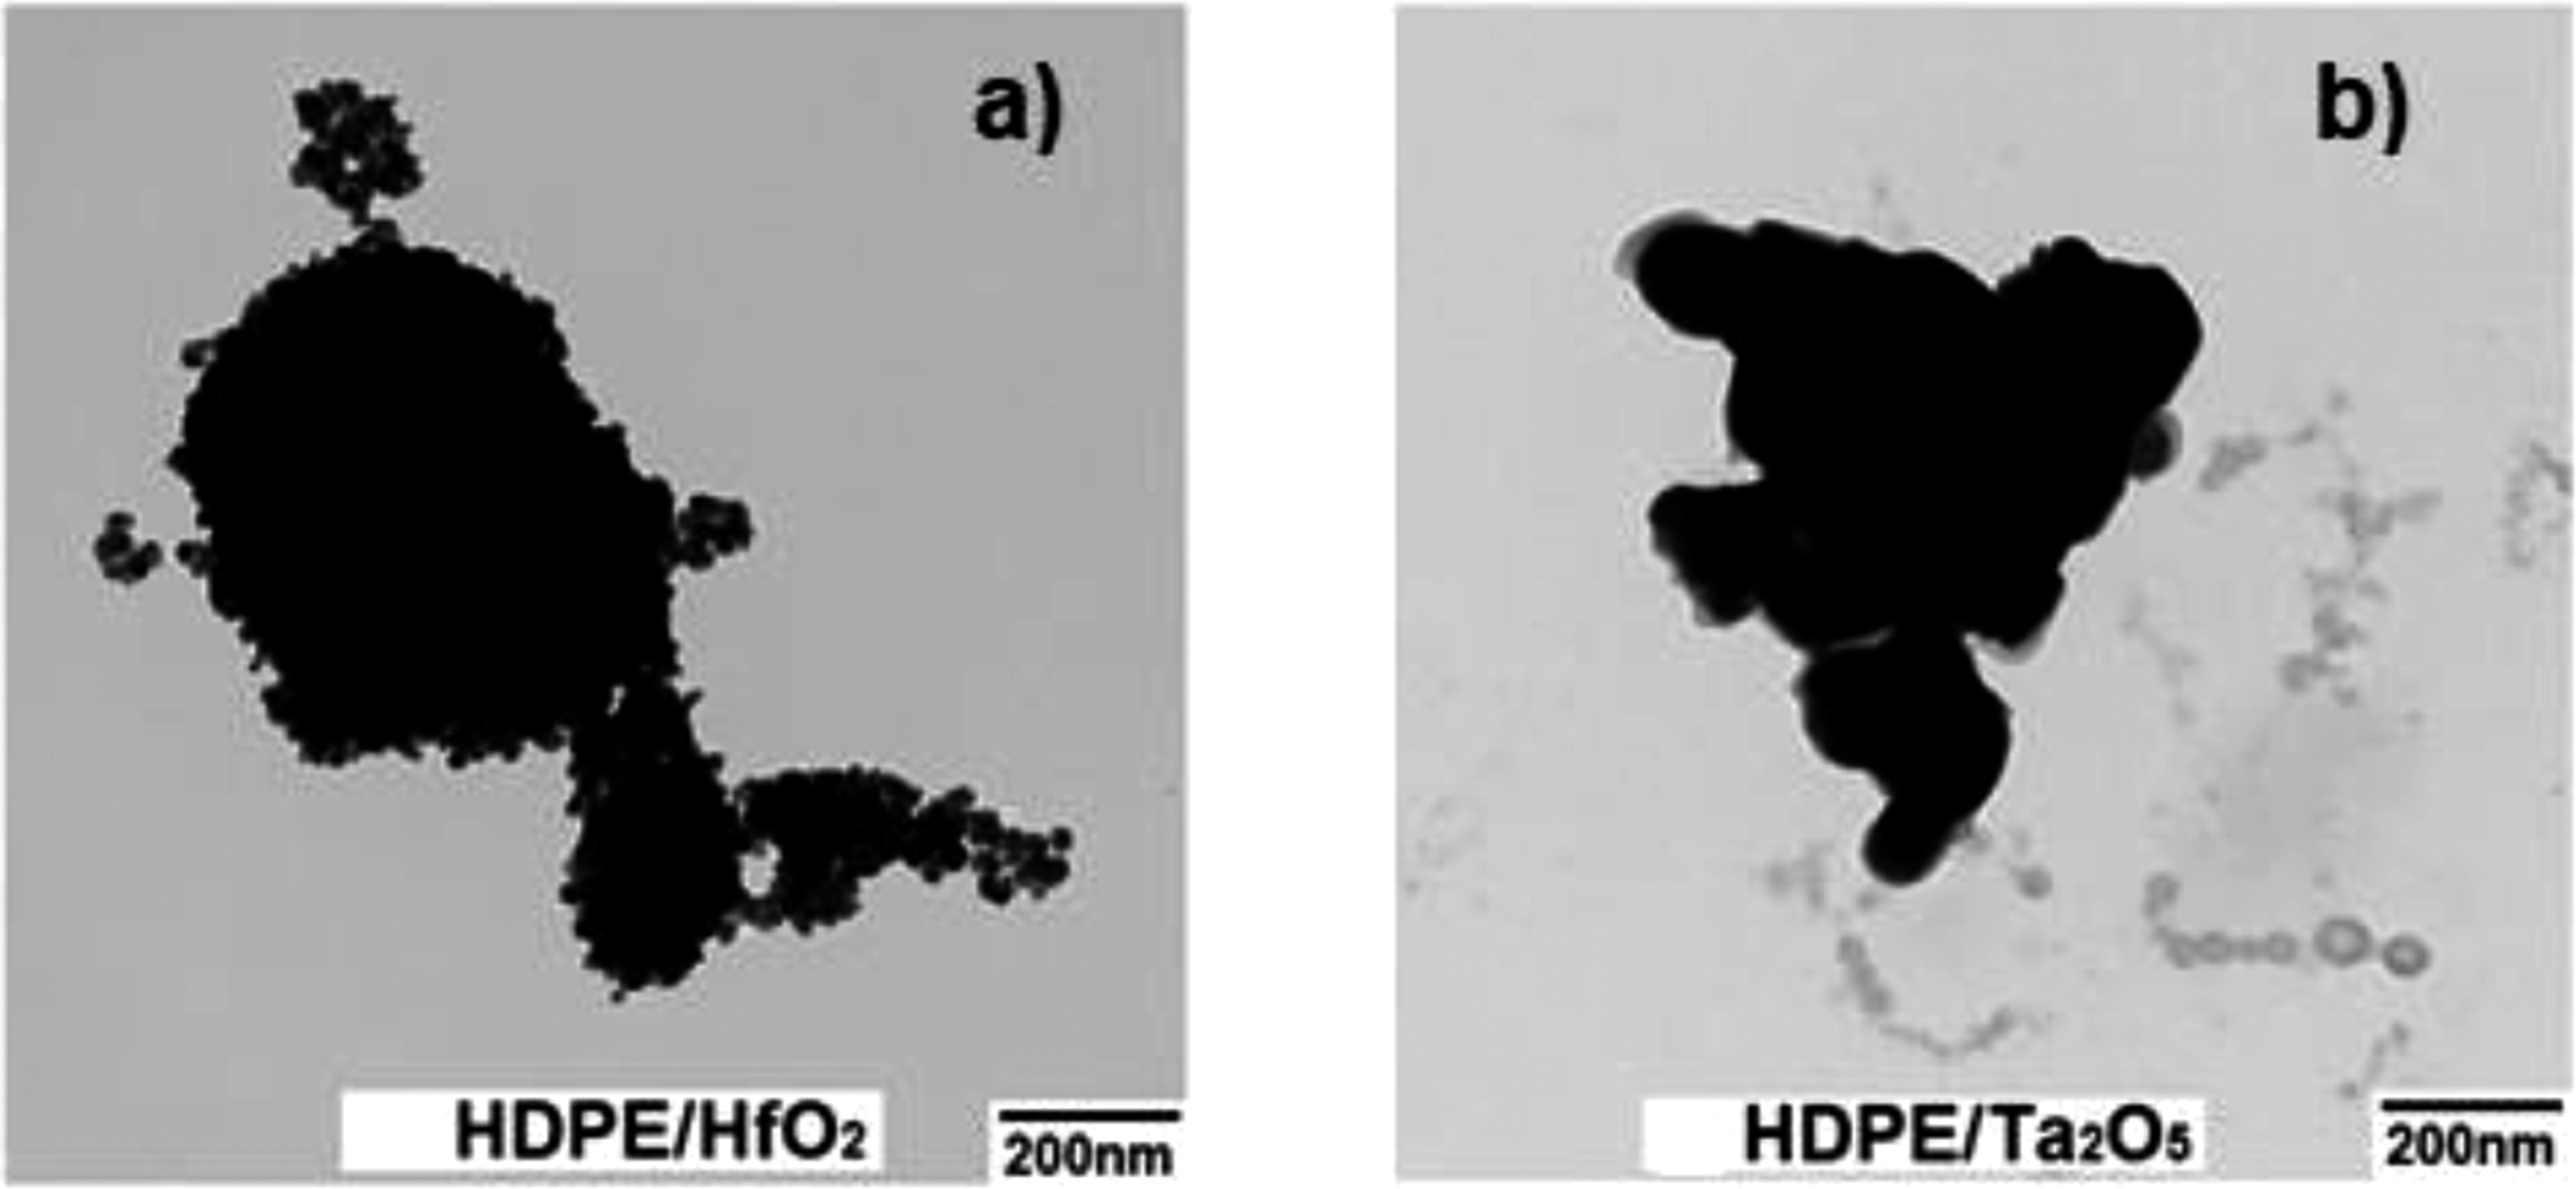
Atomic force microscopy (AFM)
Atomic force microscopy (AFM) was used to observe the morphology of HDPE/HfO2 and HDPE/Ta2O5 nanocomposites before and after CD. Figures 6 and 7 present the 2D, 3D images, and surface histograms of the HDPE/HfO2 and HDPE/Ta2O5 nanocomposites before and after CD. The results indicate that the nanoparticles lead to significant changes in the surface morphology of the nanocomposites. The surface roughness of the nanocomposite samples changes considerably after CD, meaning the surface becomes uneven. It is evident that after CD, the structural elements of the nanocomposites are reduced in size. AFM 3D, 2D and histogram images of polymer nanocomposite HDPE/HfO2 Before (a) and After (b) CD. 3D, 2D AFM and histogram images of polymer Nanocomposite HDPE/Ta2O5 before (a) and after (b) CD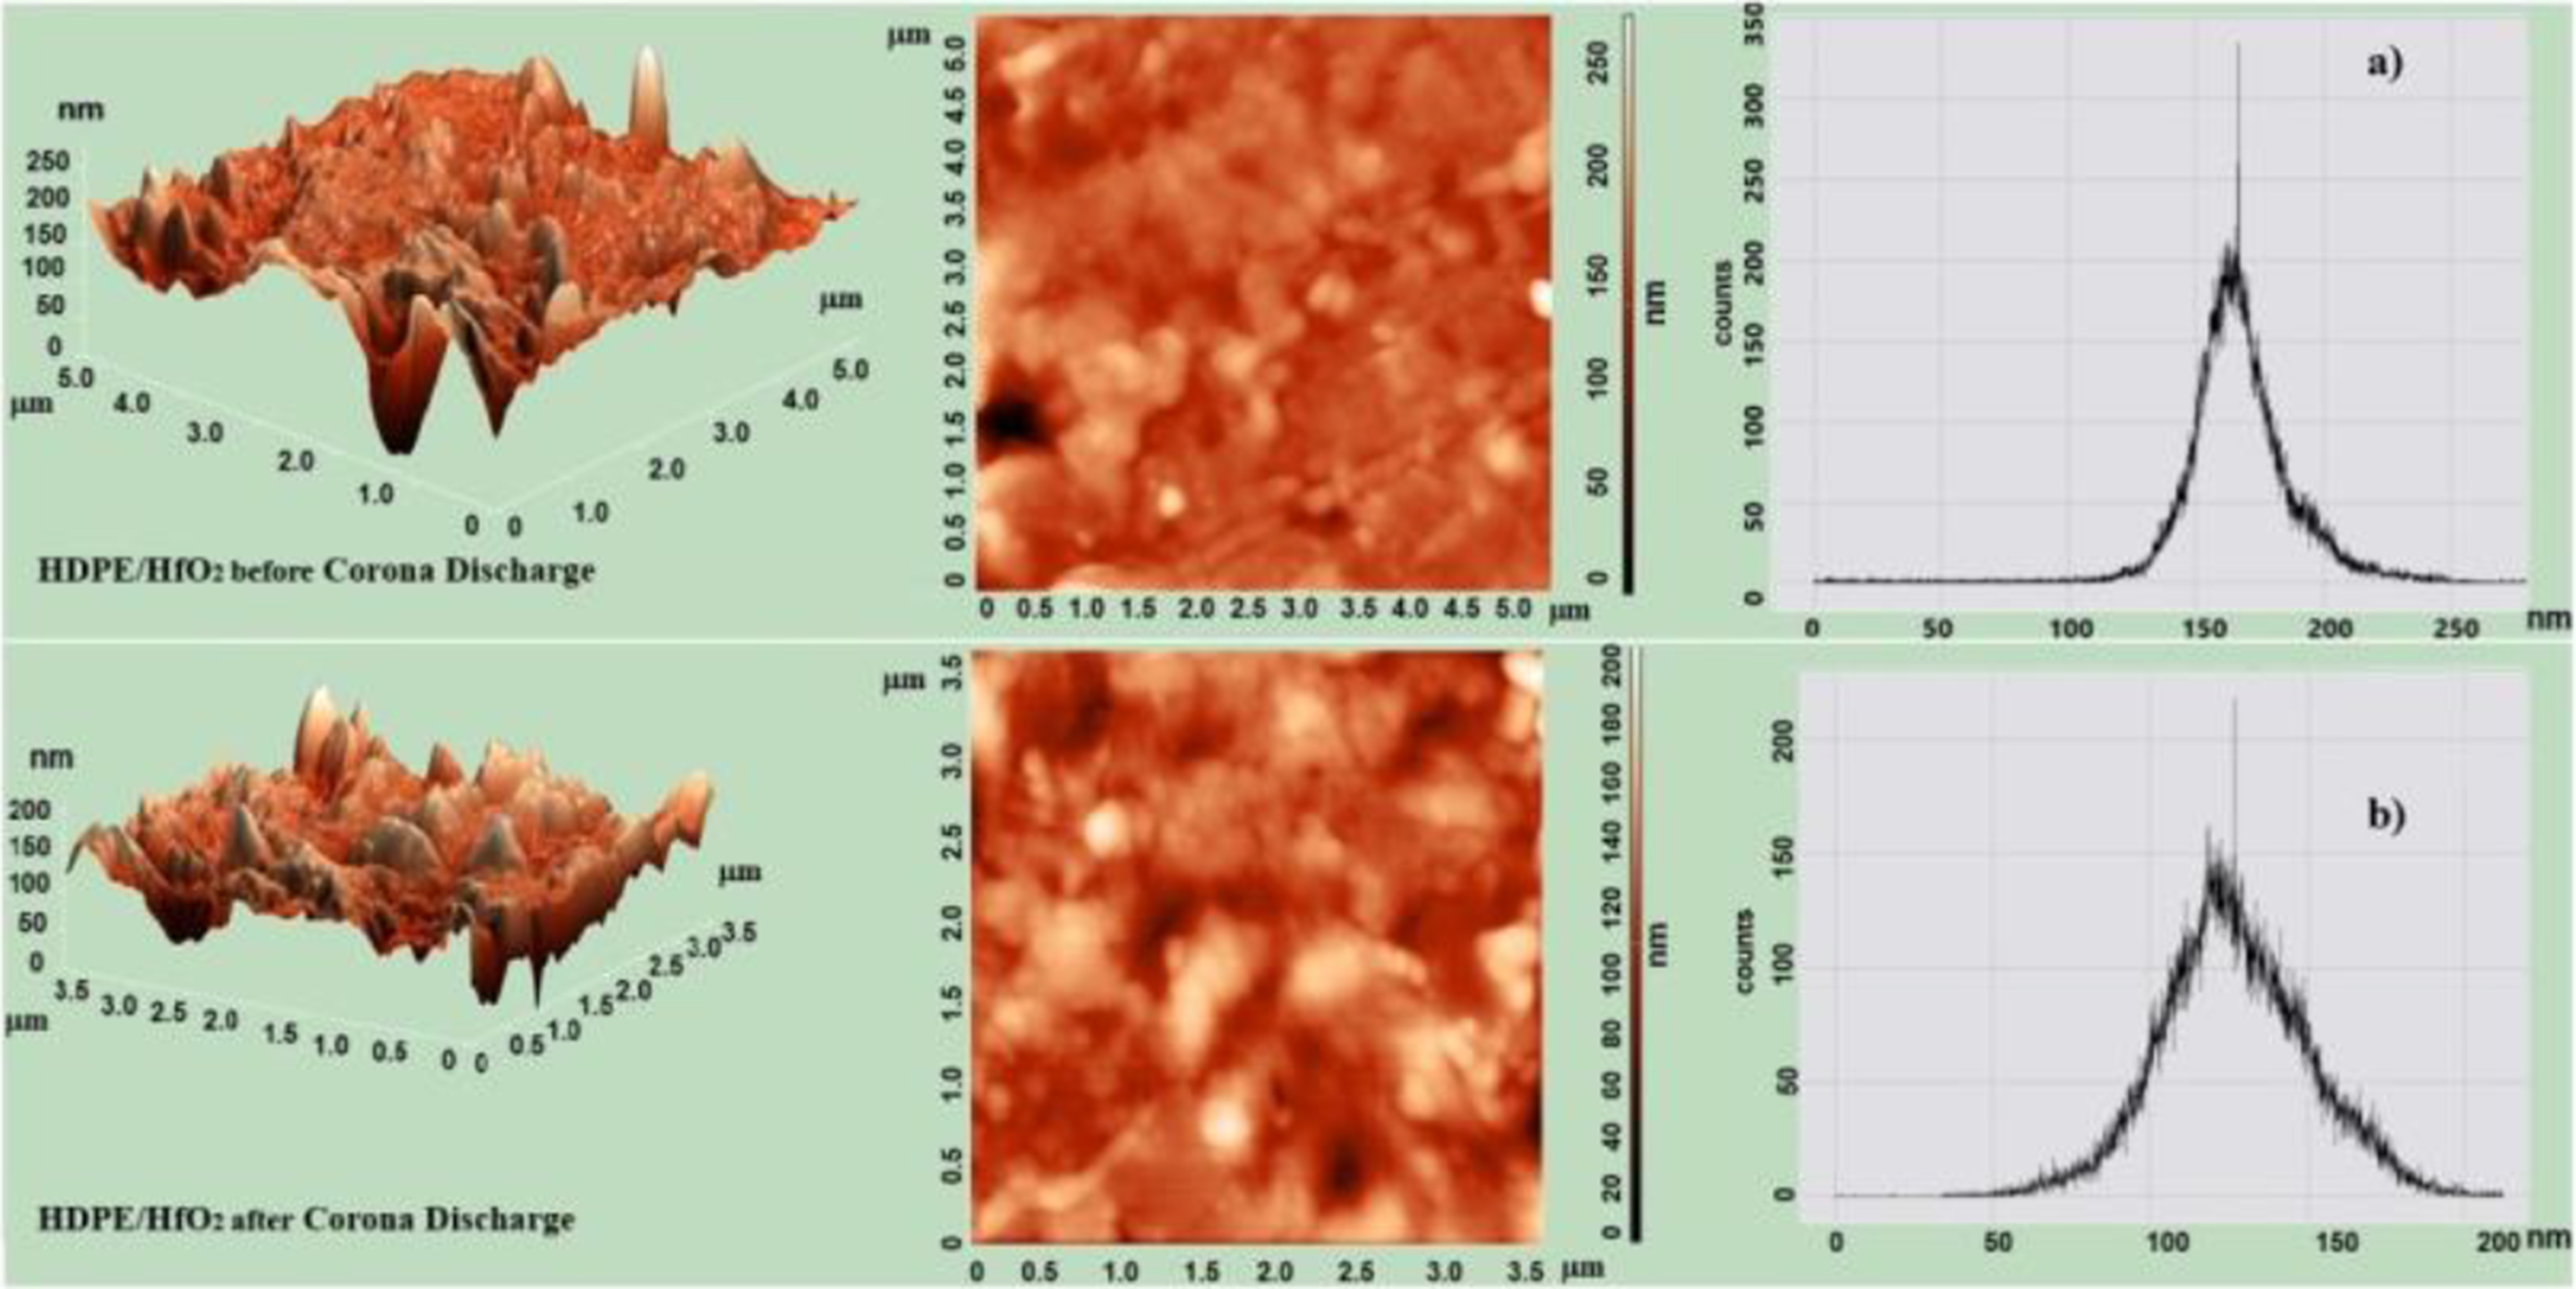
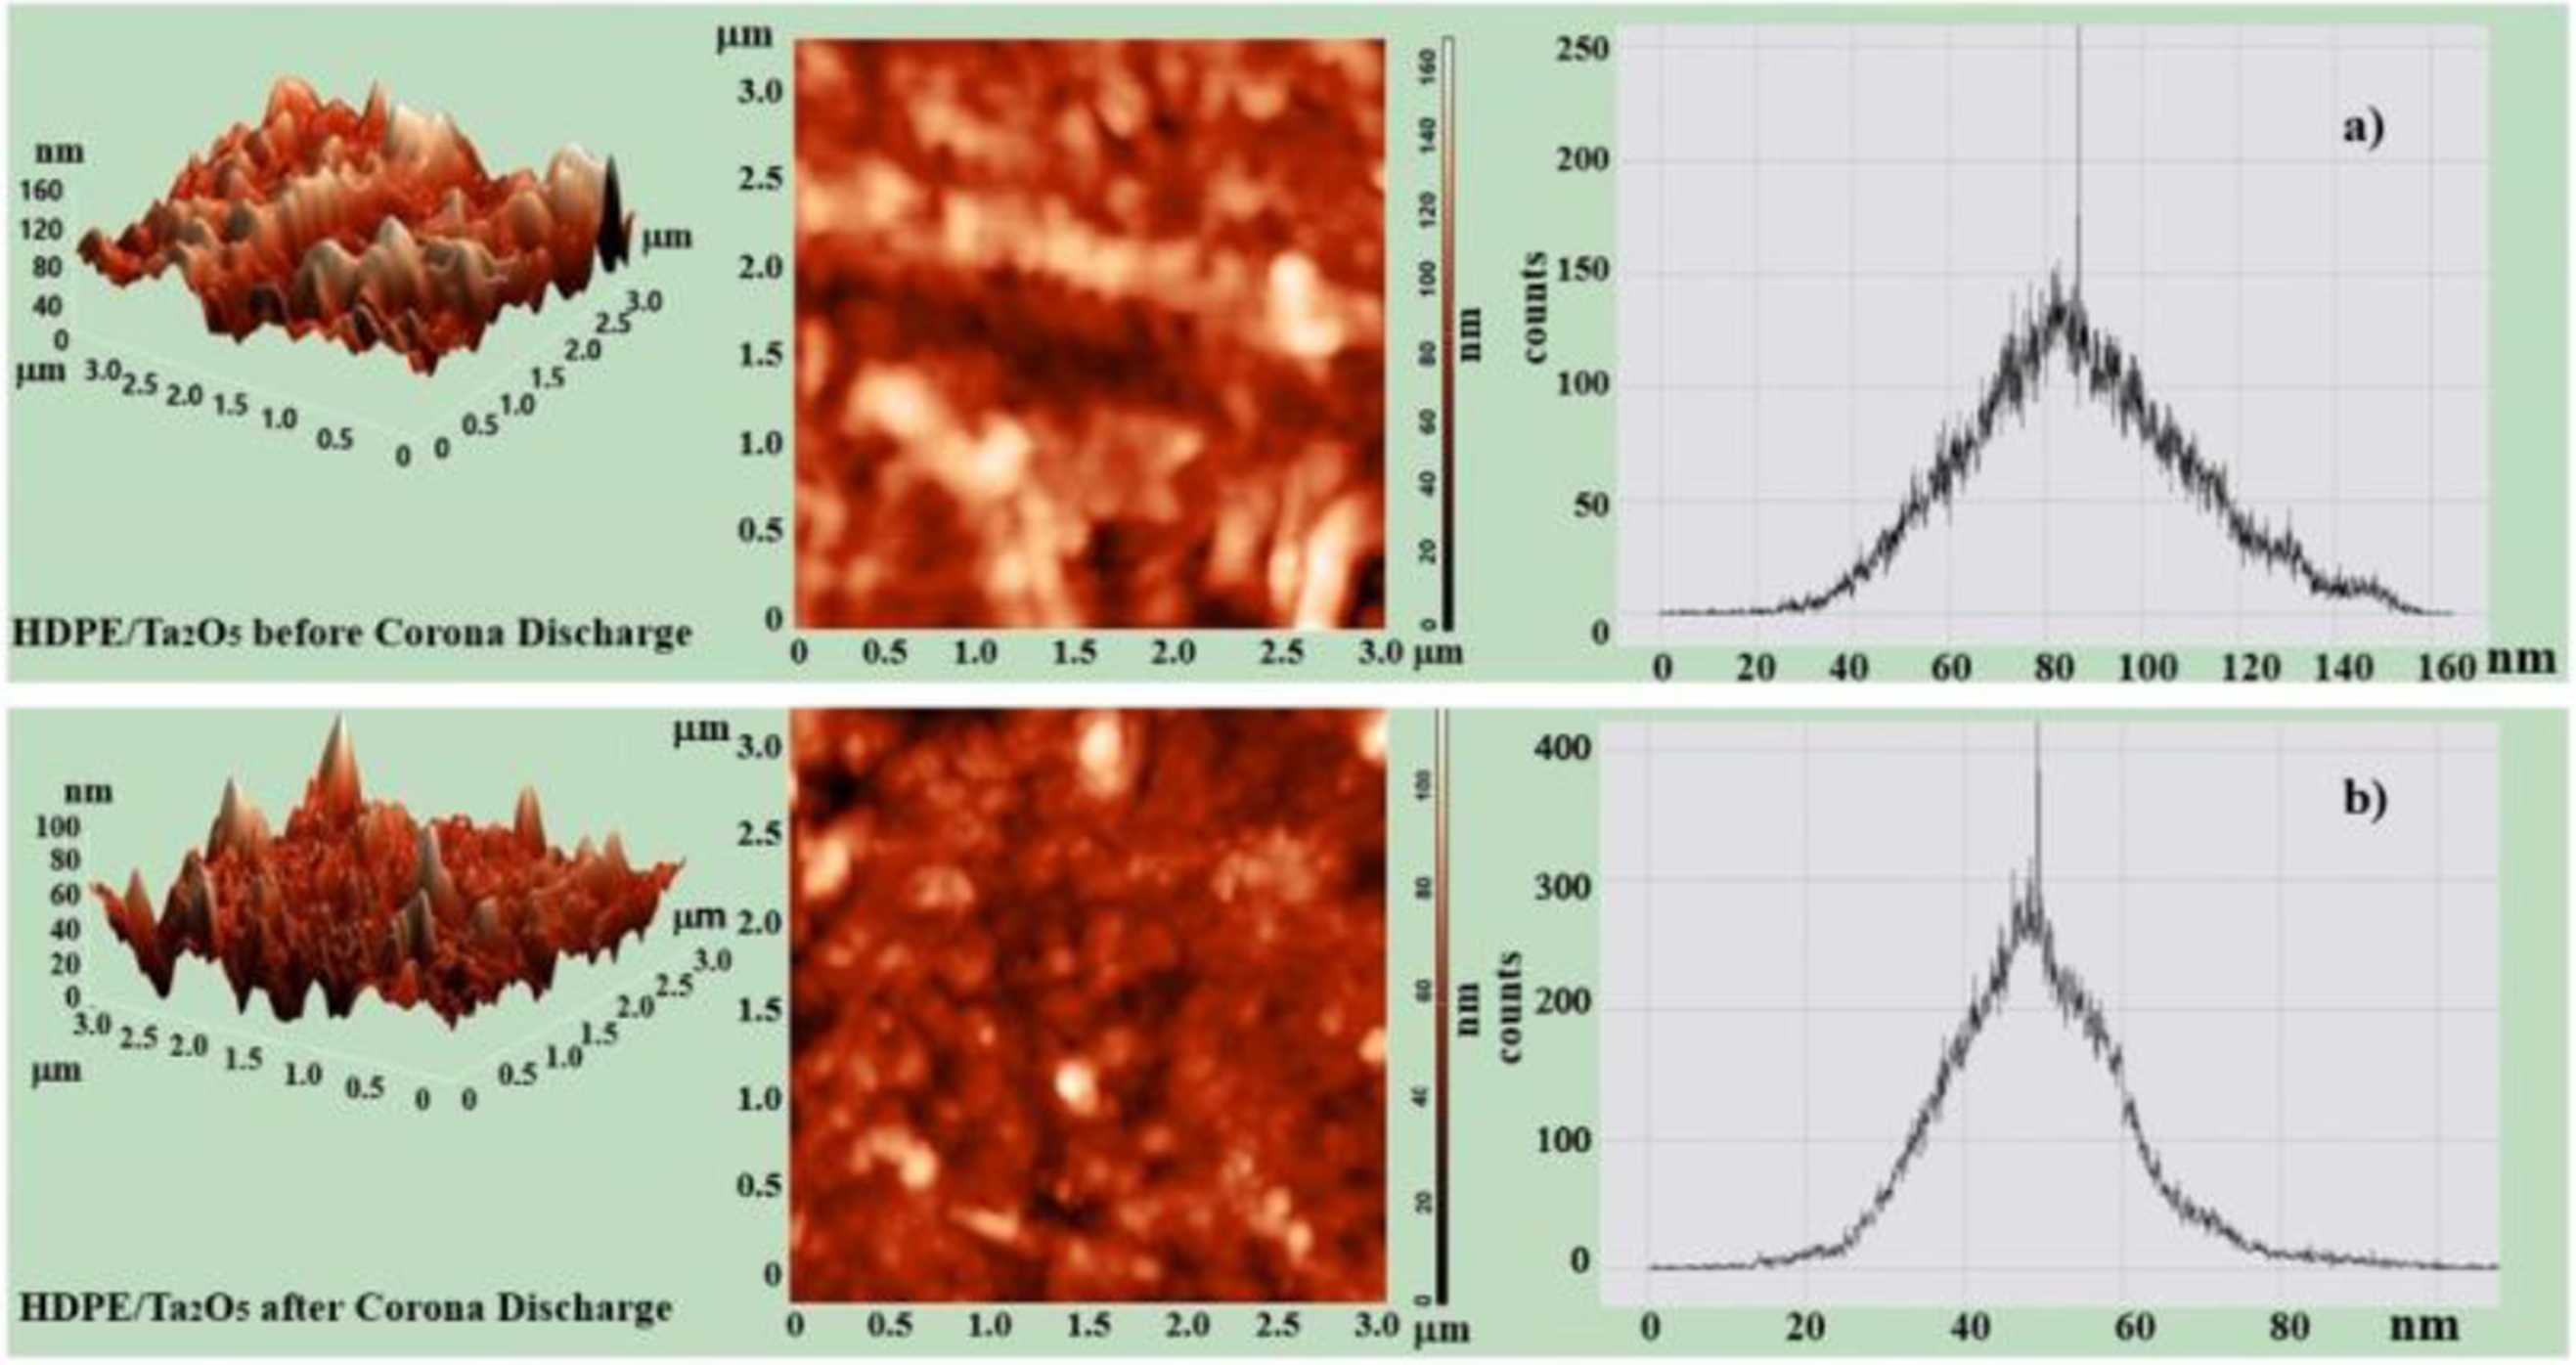
3D images clearly show that after CD, the presence of HfO2 and Ta2O5 nanoparticles increases the surface roughness, indicating a rise in surface inhomogeneity. This suggests that the modification of the polymer with nanoparticles increases roughness.
The histograms from the AFM images before CD (Figure 6(a)) show a broad distribution of HfO2 nanoparticle sizes ranging from 127 to 250 nm. After CD, the size distribution histogram of HfO2 nanoparticles narrows, showing sizes between 65 and 175 nm (Figure 6(b)).
The root mean square roughness of the HDPE/Ta2O5 nanocomposite before CD is measured to be 19-156 nm, while after CD, it ranges from 37 to 85 nm (Figure 7(a)). The results of the surface condition analysis of the nanocomposite indicate a complex and heterogeneous nature of the interfacial layer of the material. Thus, the change in the mechanical properties of HDPE/%HfO2 and HDPE/Ta2O5 due to CD conditions is related to an increase in interfacial boundaries caused by the fragmentation of structural elements. The study demonstrates that CD affects the morphological changes of the nanocomposites’ surfaces, resulting in the smoothing of surface defects and a gradual transition of the observed hills.24,25
Dielectric properties of nanocomposites
The dielectric properties of nanocomposites prepared from HDPE and HfO2, Ta2O5 have been studied under the influence of CD. It was found that the dielectric permittivity of both pure polymer and the nanocomposites with added HfO2 or Ta2O5 decreases with frequency after exposure to CD.26,27
The dielectric constant (ε) was calculated using the equation:
The dielectric constant (εcom) of the nanocomposites was further analyzed using the Maxwell-Garnett model, which predicts how different nanoparticle concentrations influence the dielectric response: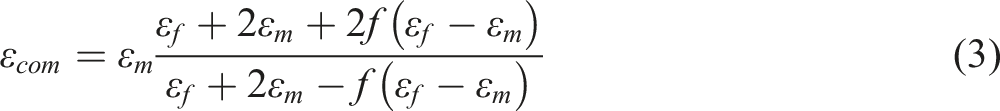
Using these formulas, the dielectric properties of the nanocomposites were analyzed and the results are presented in Figure 8. The graphs present the frequency-dependent dielectric permittivity of HDPE-based nanocomposites before (Figure 8(a) and (d)) and after CD (Figure 8(c) and (f)), along with theoretical values calculated using the Maxwell-Garnett model (Figure 8(b) and (e)). Before CD, the dielectric constant of HDPE and its composites with HfO2 and Ta2O5 remains stable over the frequency range. The HDPE nanocomposite with 10% HfO2 shows a higher dielectric constant, suggesting enhanced polarization and higher permittivity with increased filler content. After CD, a decrease in the dielectric constant is observed across all samples, which may result from structural changes or altered filler-matrix interactions. The Maxwell-Garnett model calculations predict an increase in permittivity with filler concentration. However, the theoretical values do not fully capture the post-discharge permittivity increase observed experimentally, indicating that additional mechanisms, such as charge trapping and defect-induced polarization, influence the permittivity behavior after CD. Theoretical (b), (e) and Experimental (a), (d), (c), (f) Plots of Permittivity Against Frequency For HDPE/HfO2 and HDPE/Та2О5 Nanocomposites Before And After CD.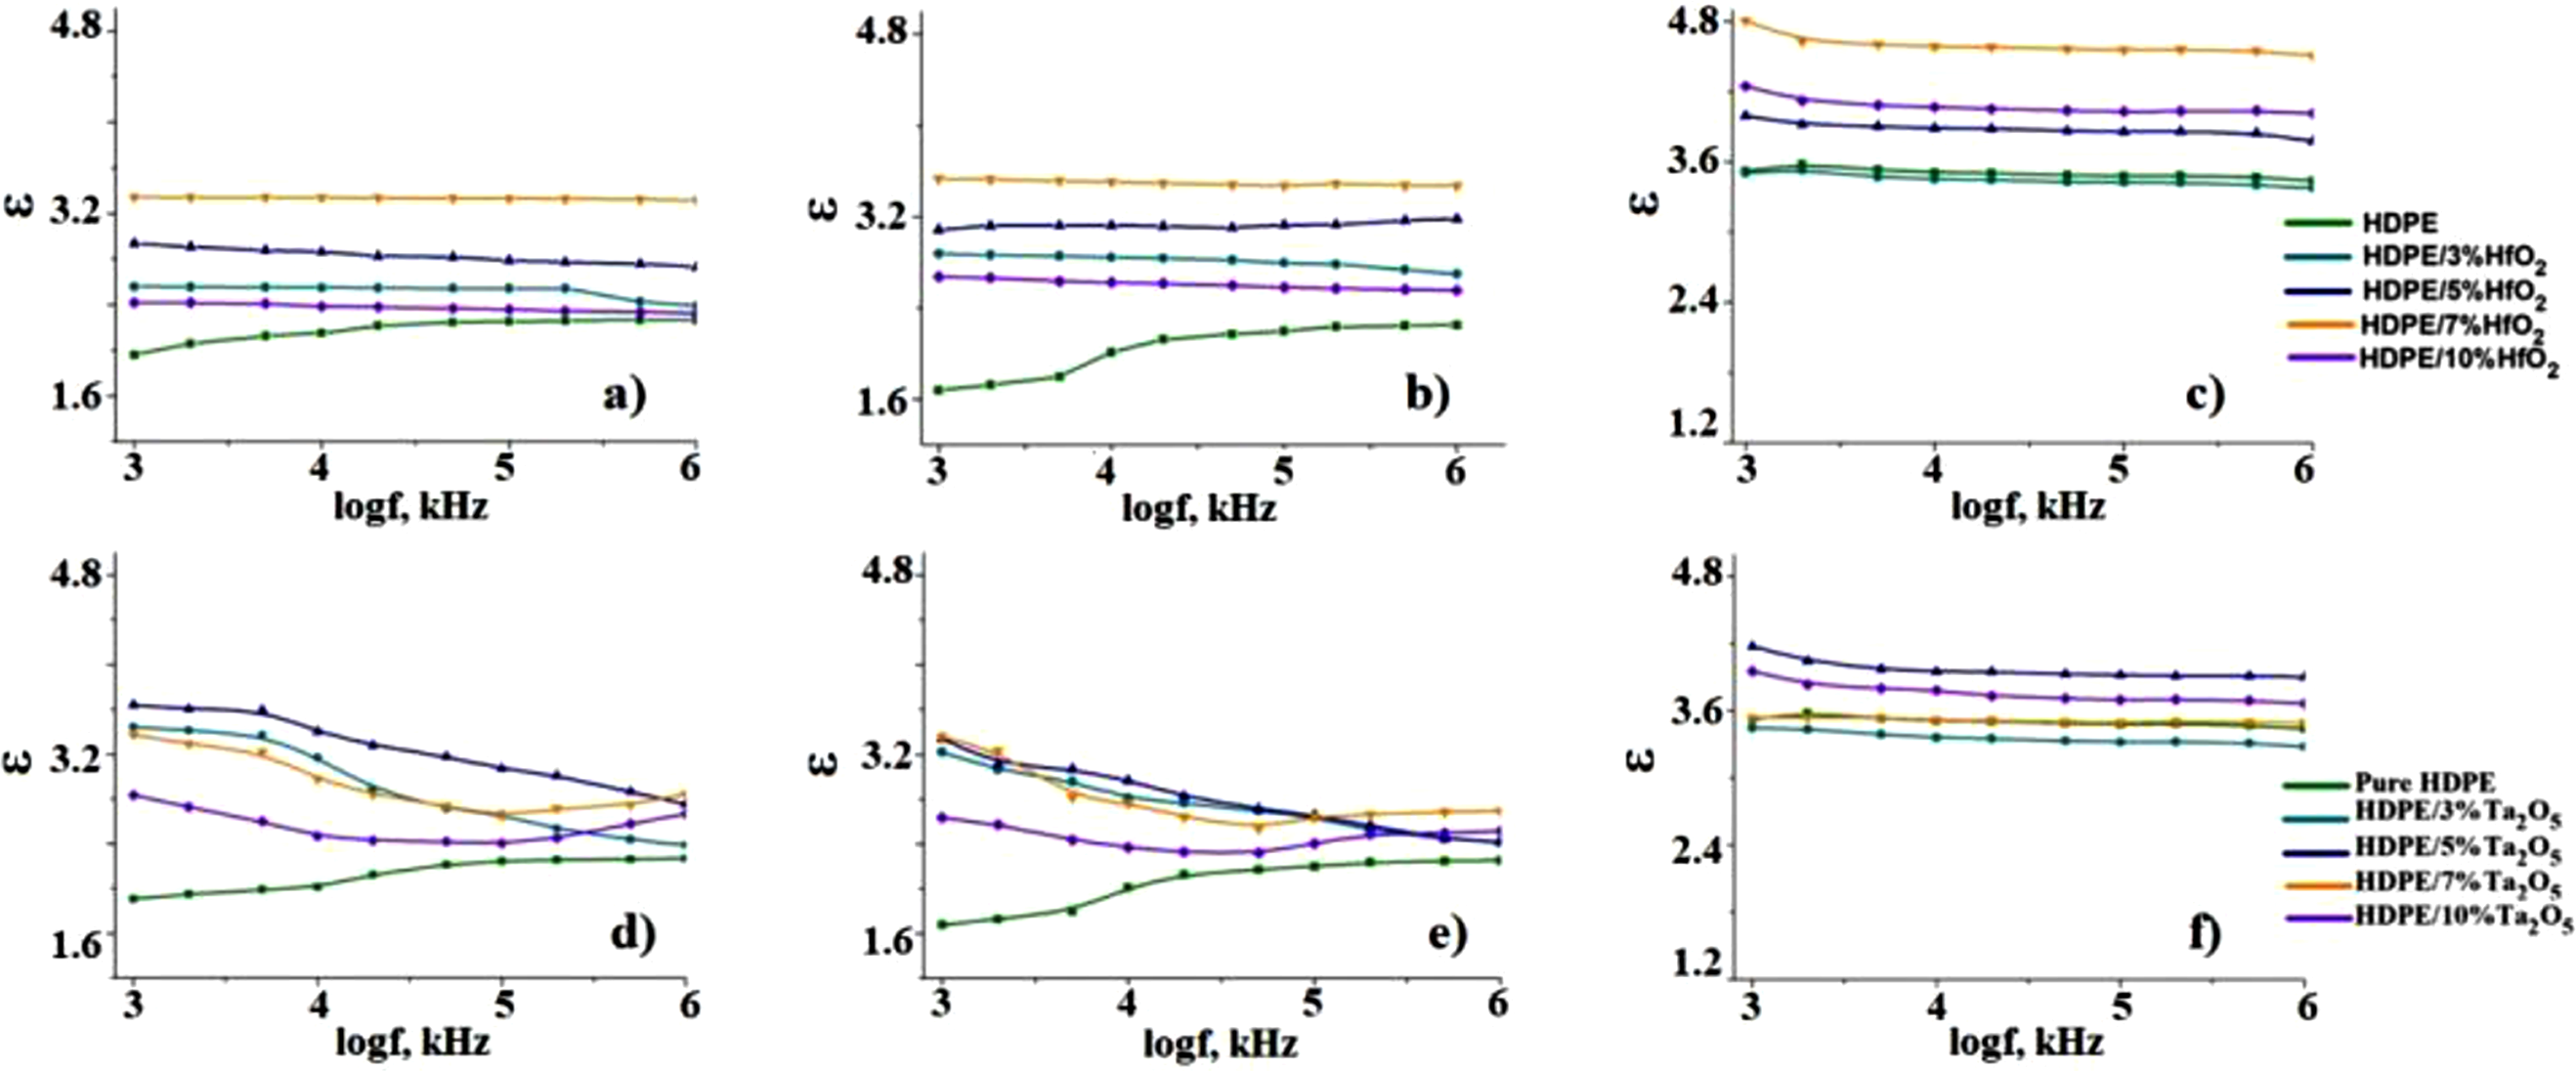
Figure 9 shows the frequency dependence of the dielectric loss tangent for HDPE/HfO2 and HDPE/Ta2O5 nanocomposites before (a, b) and after (c, d) CD. Before CD, the dielectric loss tangent is higher at lower frequencies, indicating greater energy loss due to relaxation processes, which decreases as frequency increases. After CD, a further reduction in dielectric loss suggests changes in charge carriers or interfacial polarization, leading to overall lower energy losses. Frequency Dependence of Dielectric Loss Tangent of Nanocomposites Before (a), (b) And After (c), (d) CD.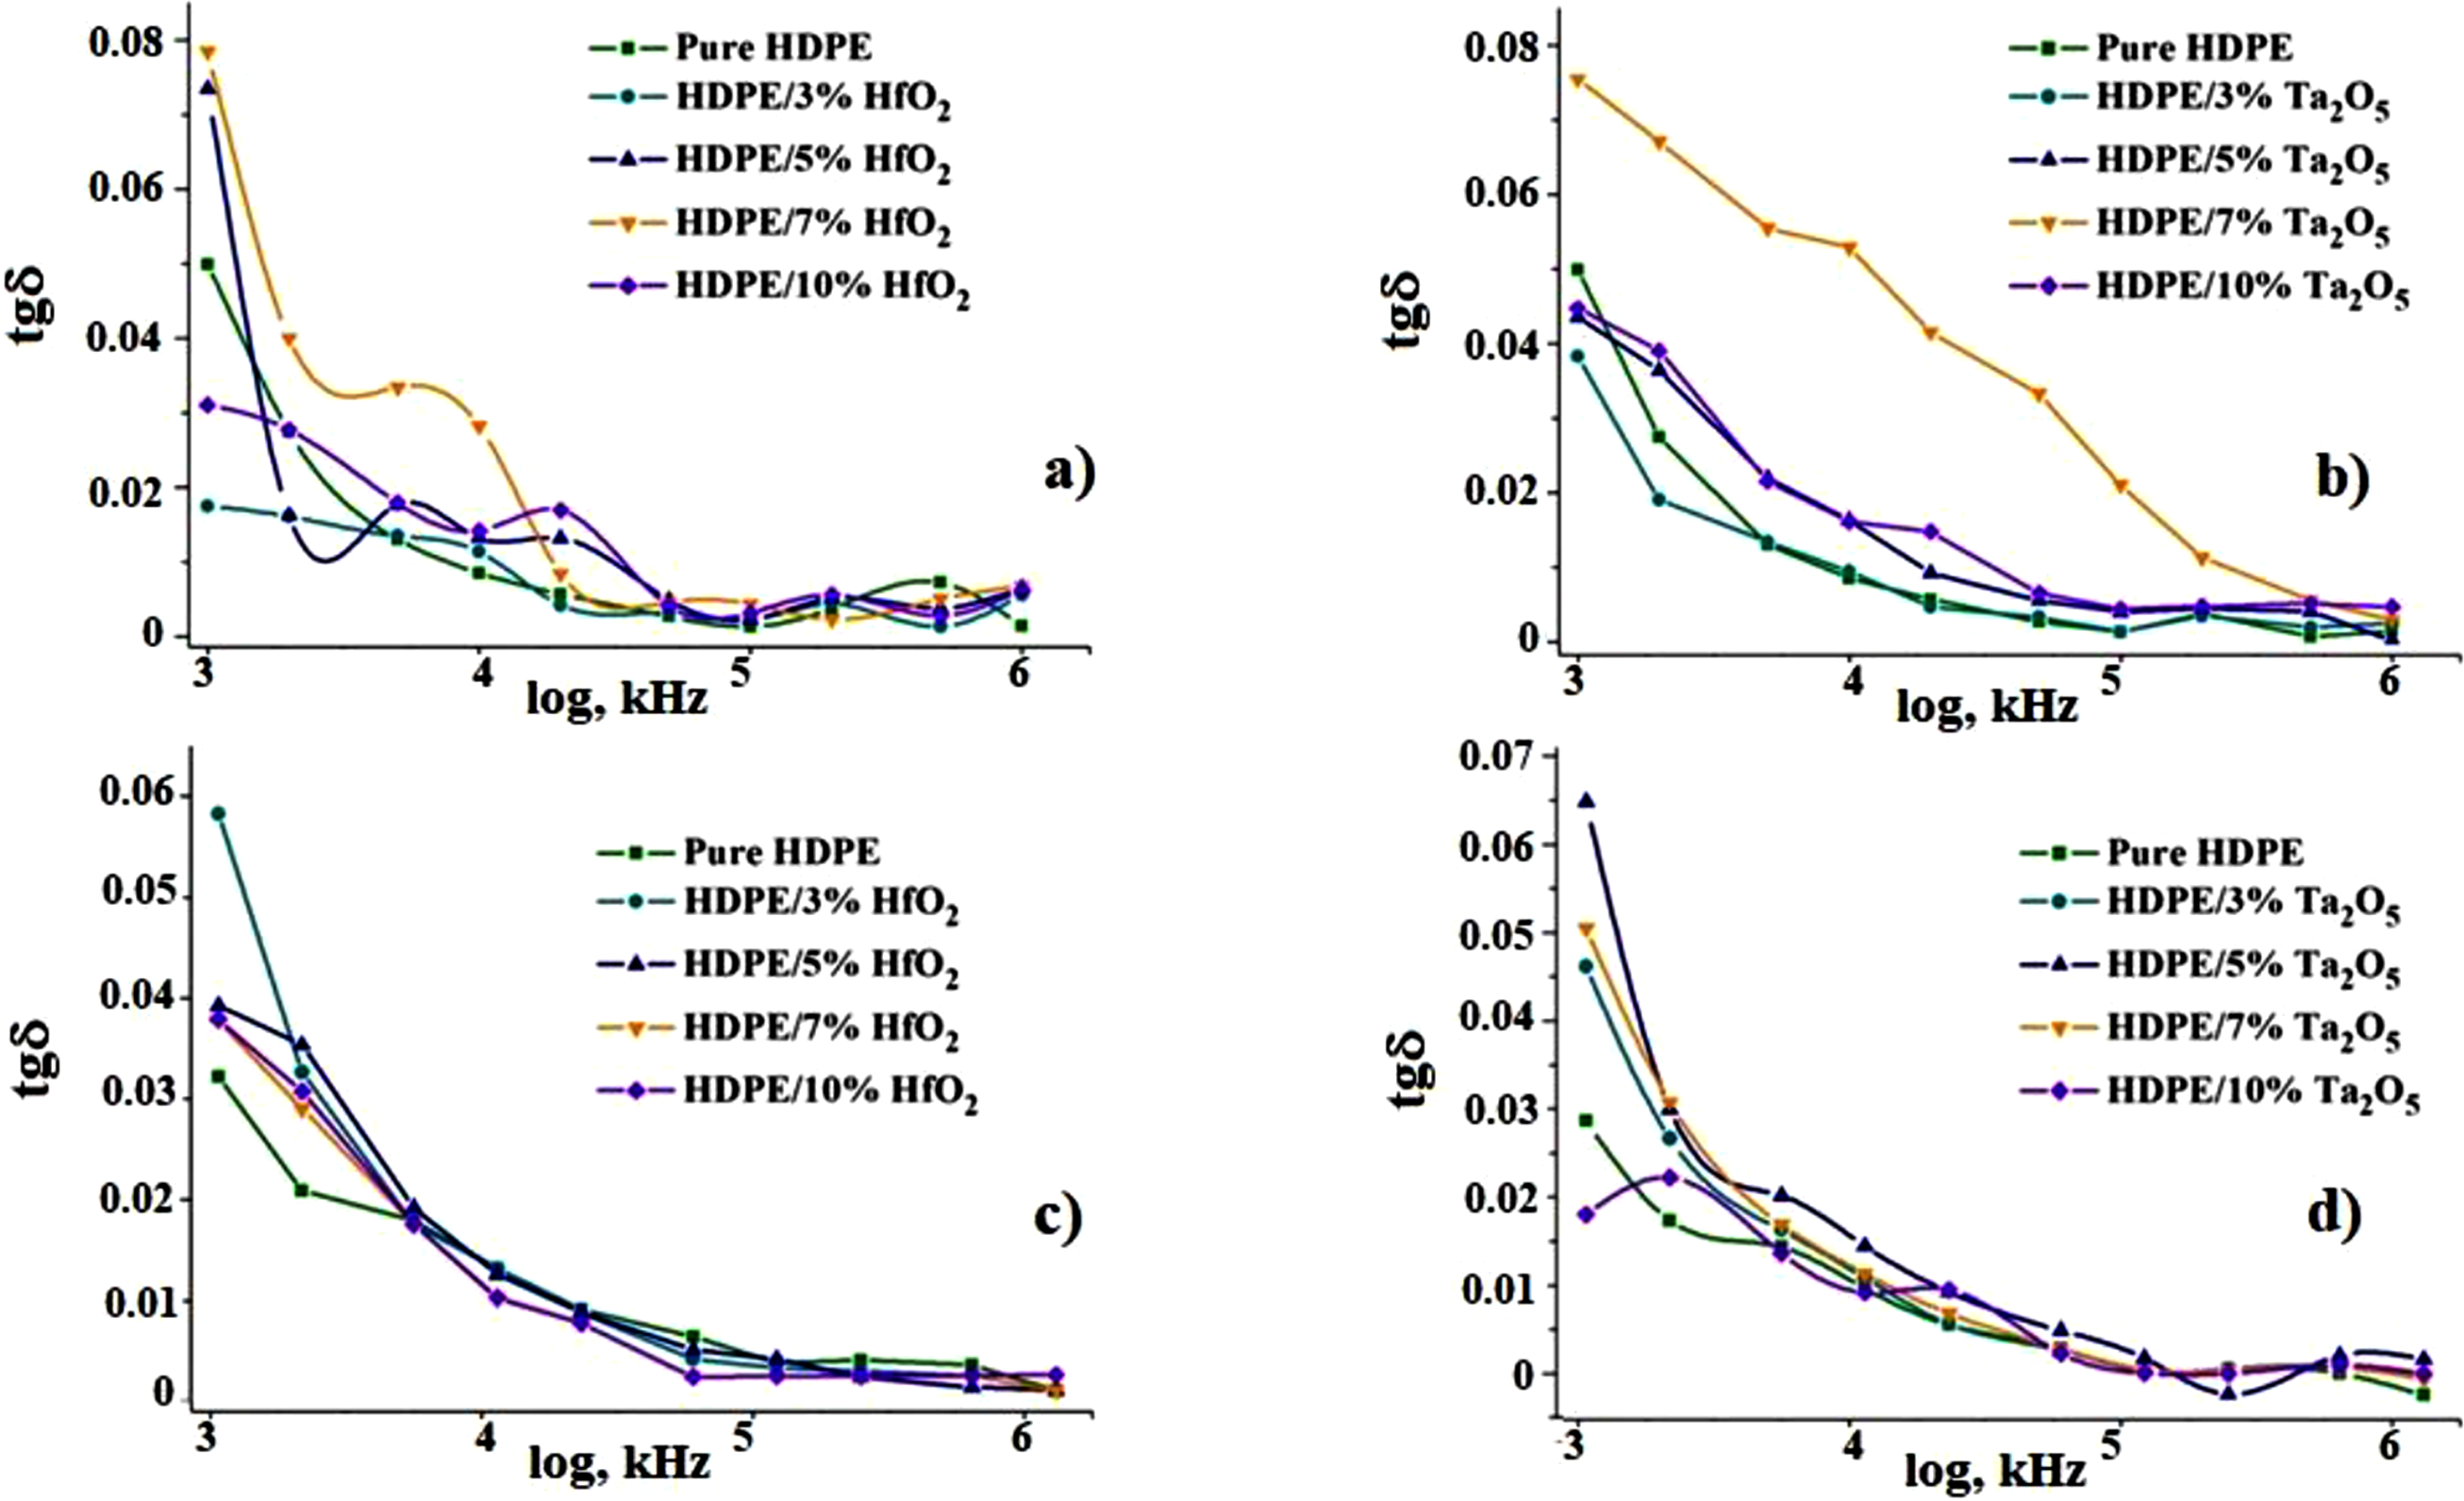
The reduction in both dielectric constant and loss after CD indicates possible structural reorganization or changes in interfacial polarization. Higher filler concentrations, such as 10% HfO2, enhance the dielectric constant before CD, but differences between samples diminish after treatment, indicating a leveling effect. This behavior is mainly attributed to Maxwell-Wagner polarization, which becomes more pronounced at lower frequencies. The increase in nanoparticle concentration reduces dielectric losses by filling voids, but at high frequencies, polarization struggles to keep up with the electric field, leading to a decrease in dielectric permittivity. The findings suggest that CD treatment stabilizes the dielectric properties by enhancing the interface between the polymer and nanoparticles and adjusting the material structure.
The table presents the dielectric loss and dielectric constant of HDPE nanocomposites with HfO2 and Ta2O5 fillers before and after CD at 1 kHz, highlighting changes across different filler concentrations (3%, 5%, 7%, and 10%) and comparing with pure HDPE. After CD, both properties generally increase, indicating enhanced polarization and charge trapping. Pure HDPE shows the lowest dielectric loss before discharge, while HDPE+5%HfO2 has the highest. The dielectric constant also increases after discharge, with HDPE+7%HfO2 showing the largest increase. These results suggest that CD treatment enhances dielectric properties, especially with higher filler concentrations, though some variations exist depending on the filler type and concentration.
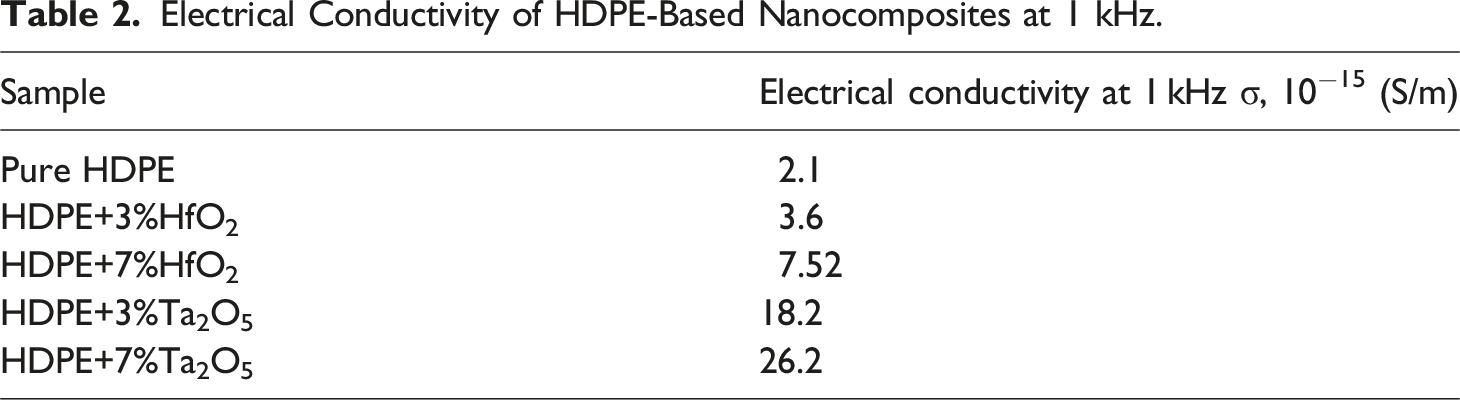
Figure 10 shows the frequency dependence of the electrical conductivity for HDPE and its nanocomposites with HfO2 (a) and Ta2O5 (b). As the frequency increases, the conductivity of all samples shows notable variation, with the nanocomposites exhibiting higher conductivity compared to pure HDPE. Table 2 summarizes the conductivity values at 1 kHz. The conductivity of pure HDPE is quite low at 2.1 × 10⁻¹⁵ S/m at 1 kHz. Adding 3%HfO2 increases the conductivity to 3.6 × 10⁻¹⁵ (S/m), while 7% HfO2 more than doubles it to 7.52 × 10⁻¹⁵ (S/m), showing significant enhancement with increasing nanoparticle content. In comparison, 3% Ta2O5 results in a much higher conductivity of 18.2 × 10⁻¹⁵ (S/m), indicating a stronger effect than HfO2. At 7% Ta2O5, conductivity reaches 26.2 × 10⁻¹⁵ (S/m), the highest among all samples. These results highlight the greater impact of Ta2O5 compared to HfO2 on improving electrical conductivity, likely due to better charge transfer and interfacial effects. Frequency dependency of electrical conductivity of HDPE/HfO2 (a) and HDPE/Ta2O5 (b) nanocomposites. Electrical Conductivity of HDPE-Based Nanocomposites at 1 kHz.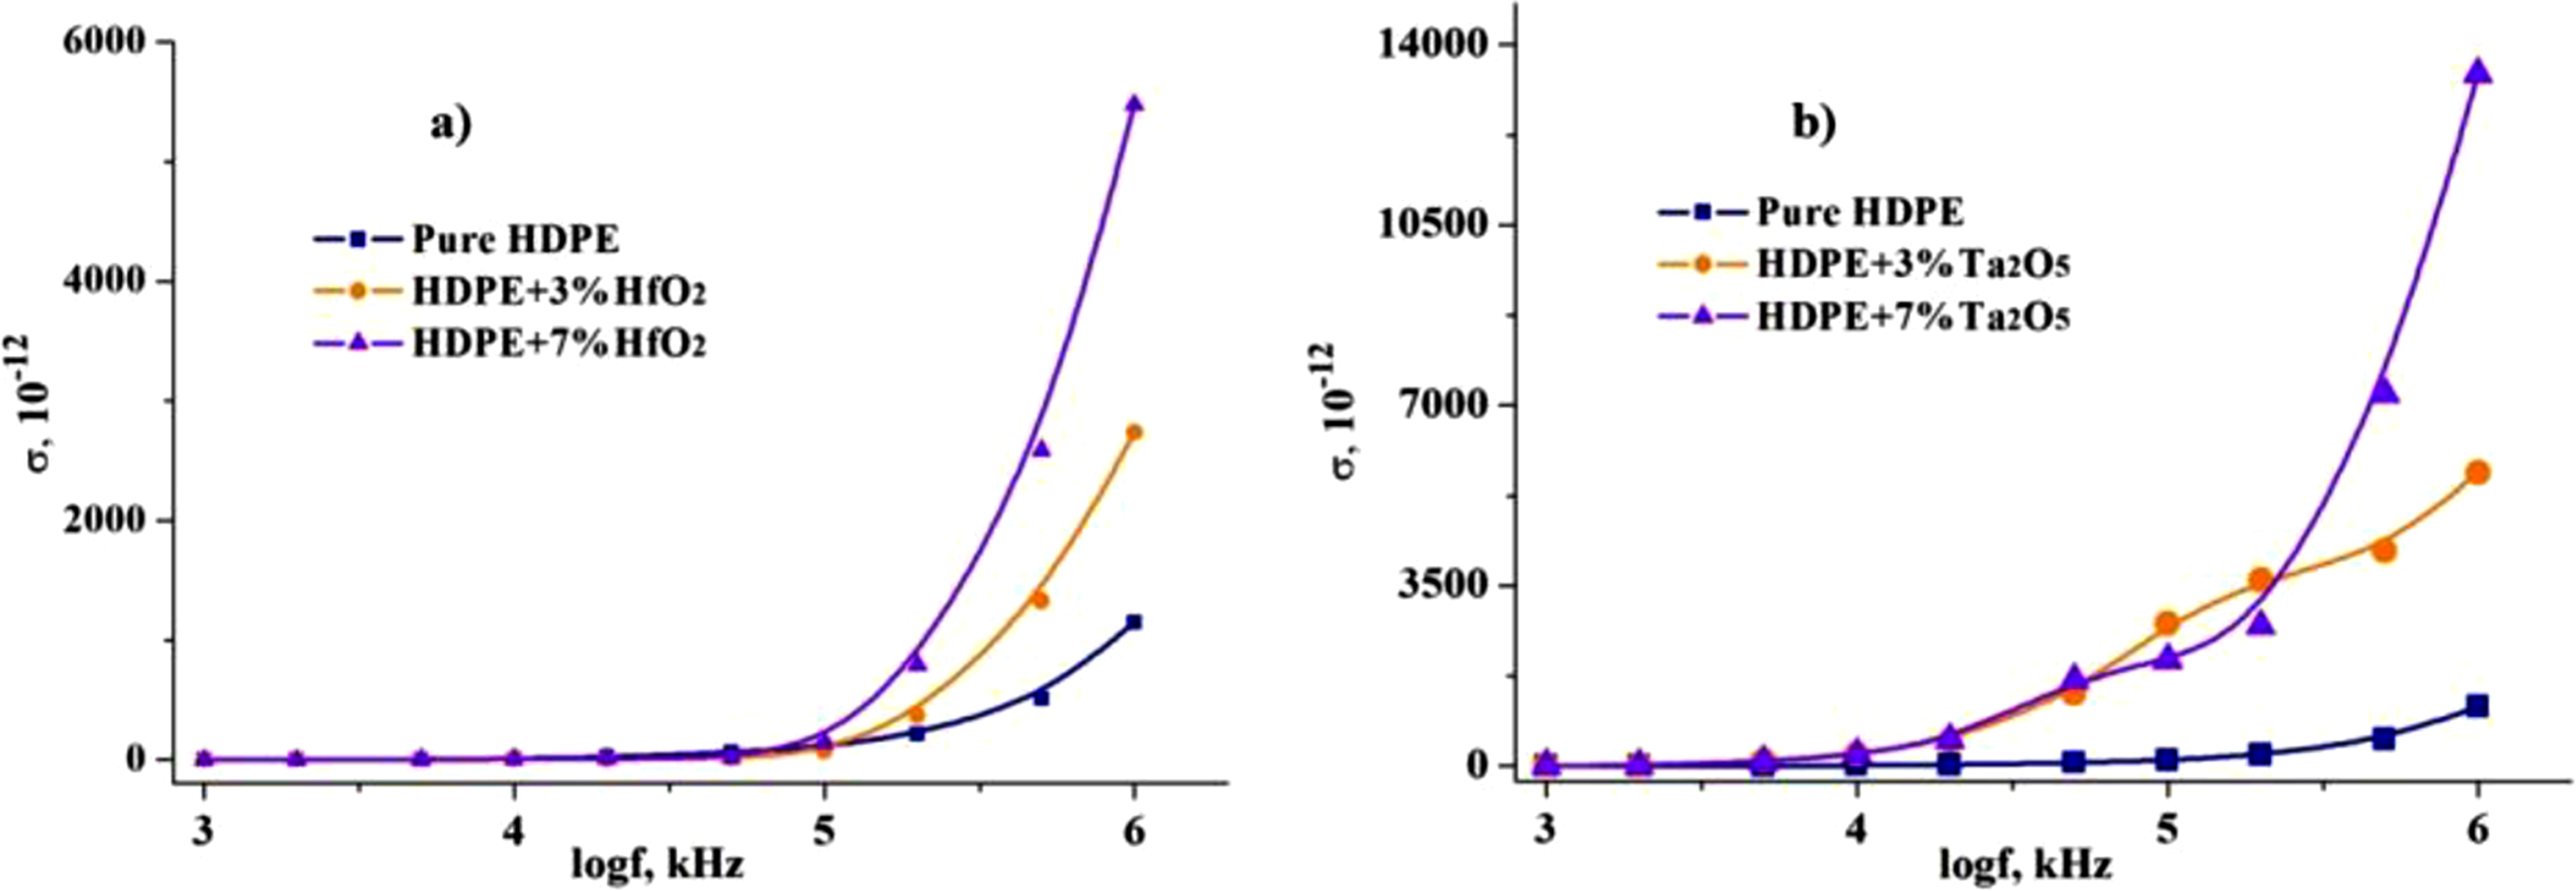
IR spectroscopy
Figure 11 shows the IR spectra of pure HDPE and HDPE/HfO2 nanocomposites. The spectra of the HfO2-containing samples resemble that of pure HDPE, with changes observed only in the range of 100-700 cm−1. In this region, new peaks appear, attributed to Hf-O vibrations, affecting only peak intensities. The interaction between HDPE and HfO2 was analyzed through IR spectra of HDPE/HfO2 samples at varying HfO2 concentrations (3%, 5%, 7%, and 10%) in the 400 cm−1 to 4000 cm−1 range. fx11 FTIR spectra of HDPE- based and HDPE/%HfO2 polymer nanocomposites: (a) HDPE; (b) HDPE/3%HfO2; (c) HDPE/5%HfO2; (d) HDPE/7%HfO2; (e) HDPE/10%HfO2.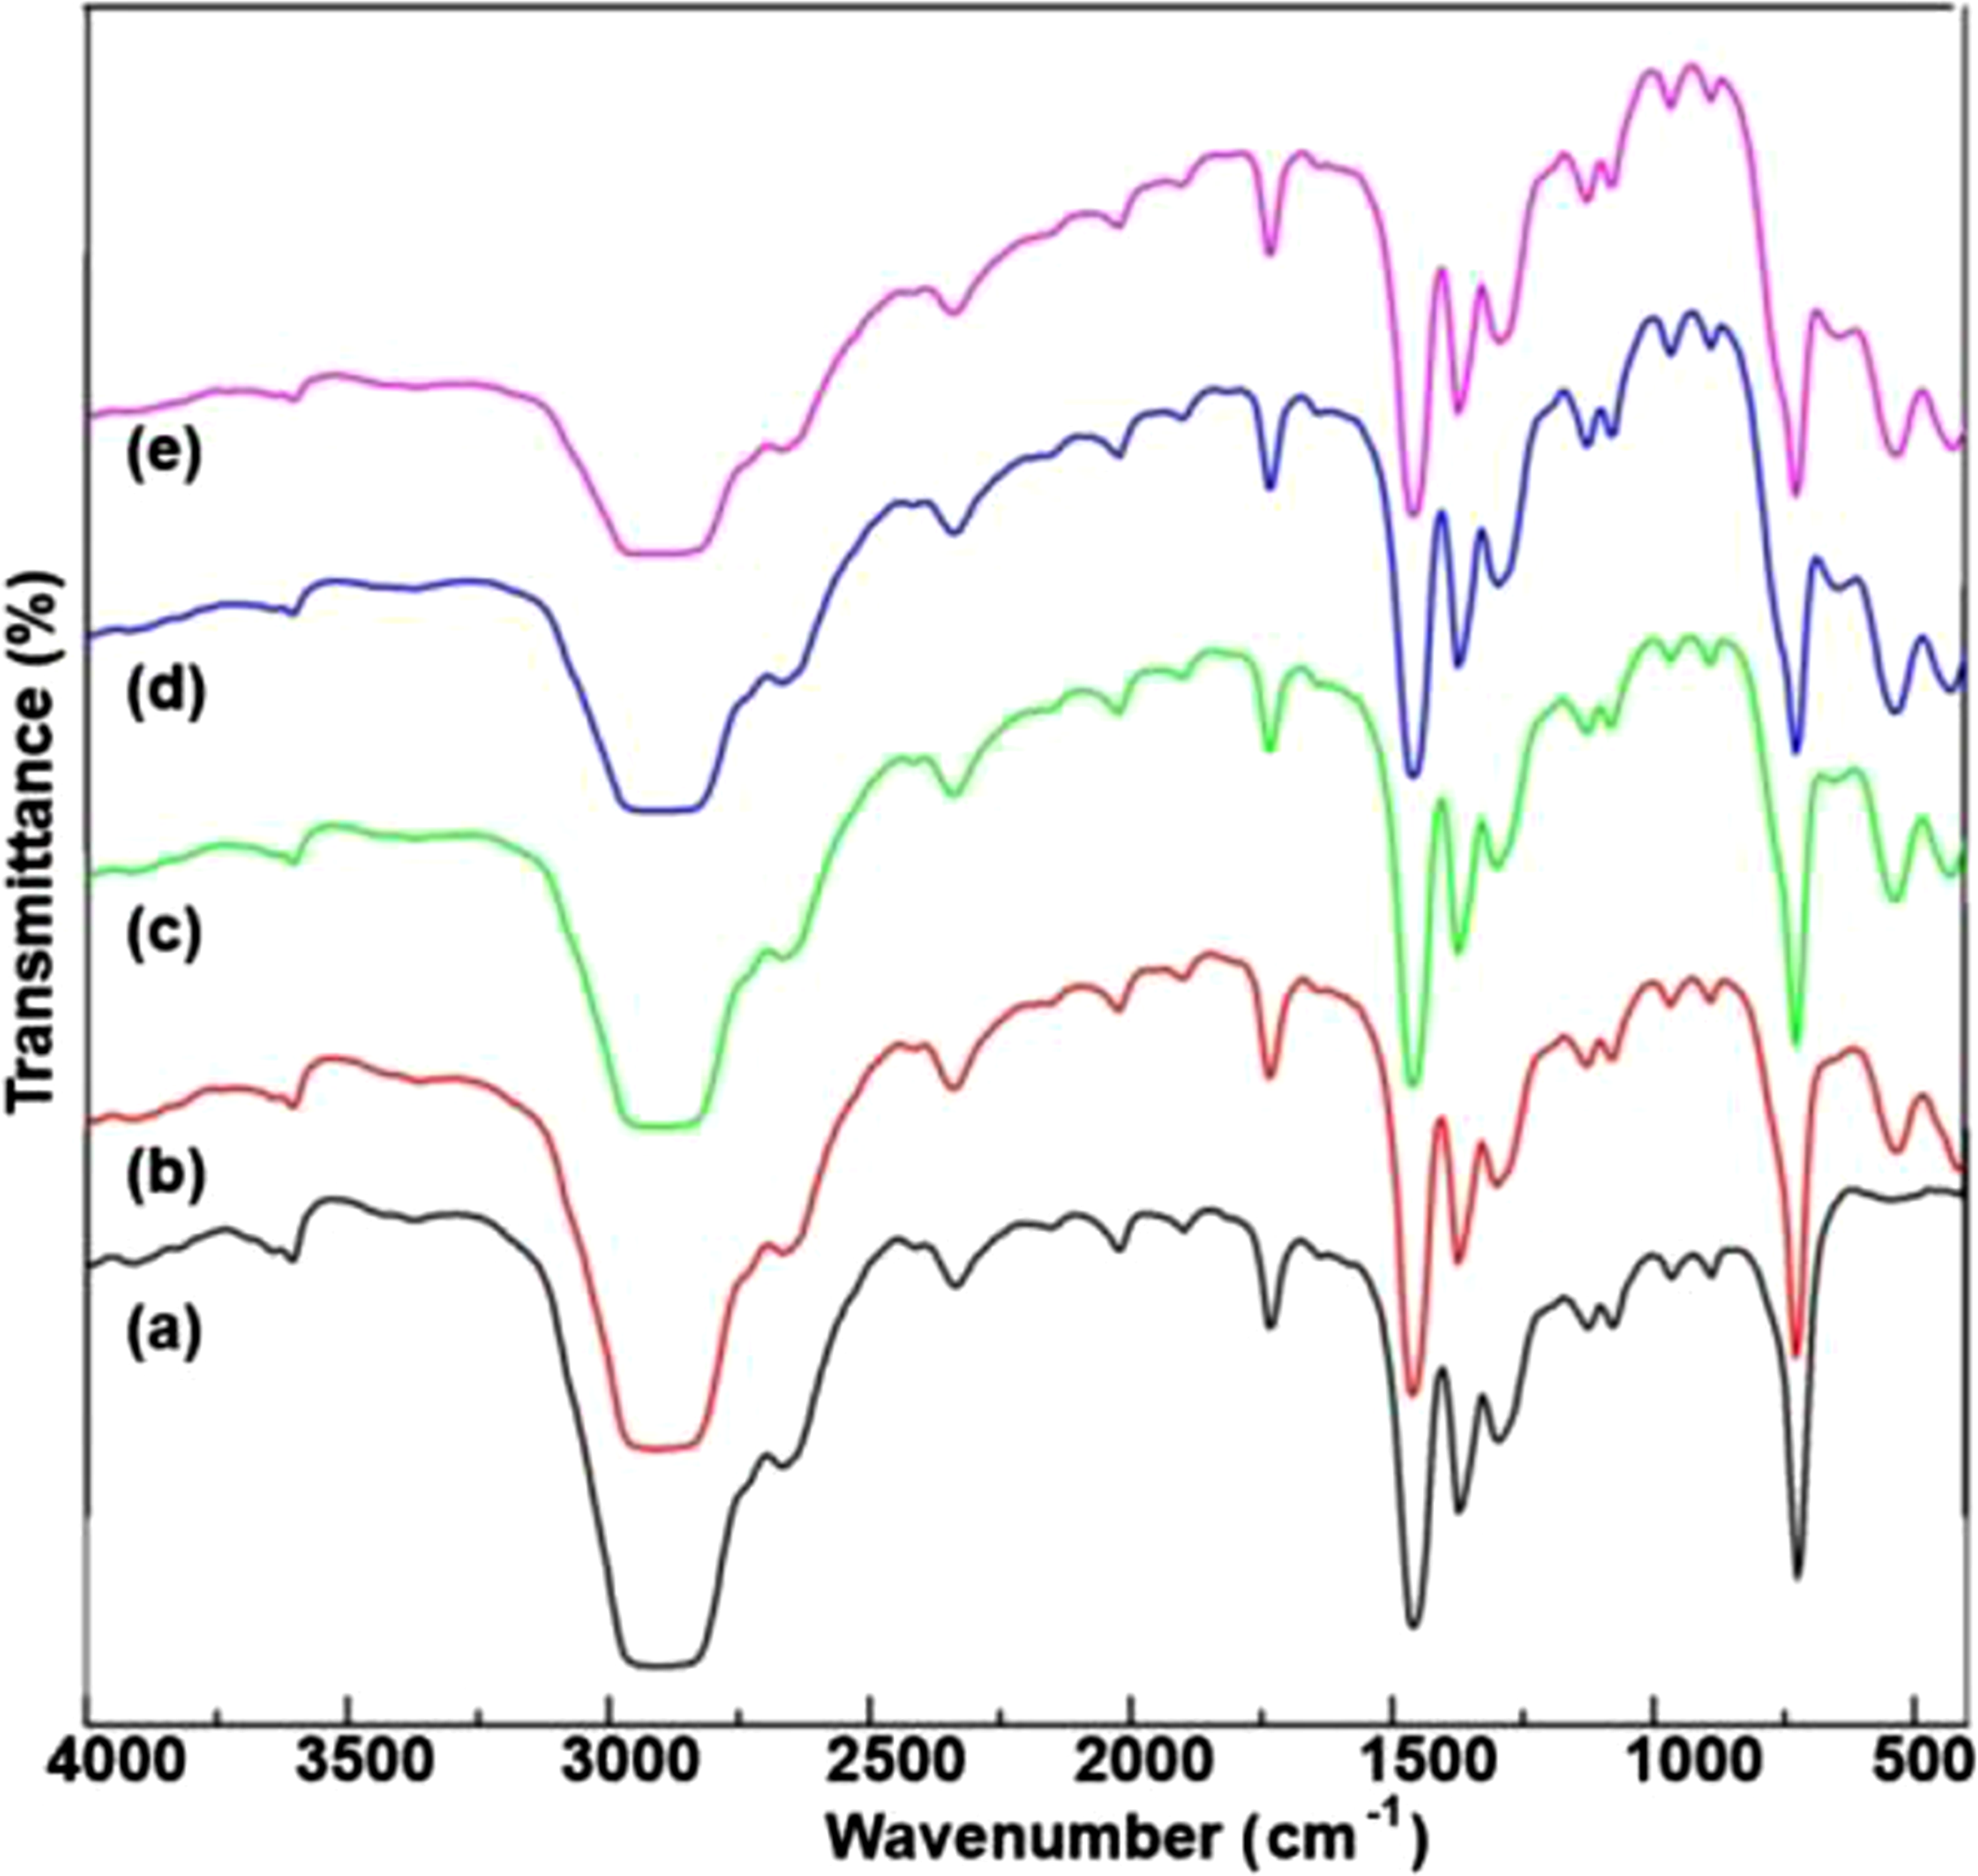
Characteristic CH2 bond bands confirm the integrity of the polymer matrix. In the pure HDPE spectrum, a weak peak at 548 cm−1 is absent in the HfO2 samples (Figure 11(c)). For HDPE/3%HfO2, a new peak appears at 415 cm−1, attributed to Hf-O stretching, shifting to 427 cm−1 in samples with higher HfO2 concentrations, indicating interaction between HfO2 and the HDPE matrix (Figure 11(b)). A peak at 533 cm−1, also from Hf-O stretching, appears across all HfO2 concentrations, and a new peak at 647 cm−1 emerges in samples with 5%, 7%, and 10% HfO2 but not in pure HDPE or the 3% HfO2 sample. Several other peaks, including 720 cm−1 (CH2 rocking), 830 cm−1, 965 cm−1, 1078 cm−1, 1128 cm−1 (C-C stretching), 1298 cm−1 (CH2 twisting), 1372 cm−1 (CH2 wagging), and 1461 cm−1 (CH2 bending), show no significant intensity changes, indicating minimal effect on the polymer structure. Strong C-H stretching bands between 2835 and 2960 cm−1, especially the peak at 2901 cm−1, remain stable, demonstrating that C-H bonds are largely unaffected by HfO2 inclusion. Higher wavenumbers show a peak at 3602 cm−1 for -OH stretching, possibly indicating slight moisture absorption or oxidation, while peaks at 1646 cm−1, 1736 cm−1, and 1898 cm−1 may relate to minor oxidative degradation of the HDPE polymer.
The IR spectra of pure HDPE and HDPE/Ta2O5 nanocomposites show characteristic HDPE bonds across the 400 cm−1 to 4000 cm−1 range (Figure 12). FTIR spectra of HDPE- based and HDPE/%Ta2O5 polymer nanocomposites: (a) HDPE; (b) HDPE/3%Ta2O5; (c) HDPE/5%Ta2O5; (d) HDPE/7%Ta2O5; (e) HDPE/10%Ta2O5.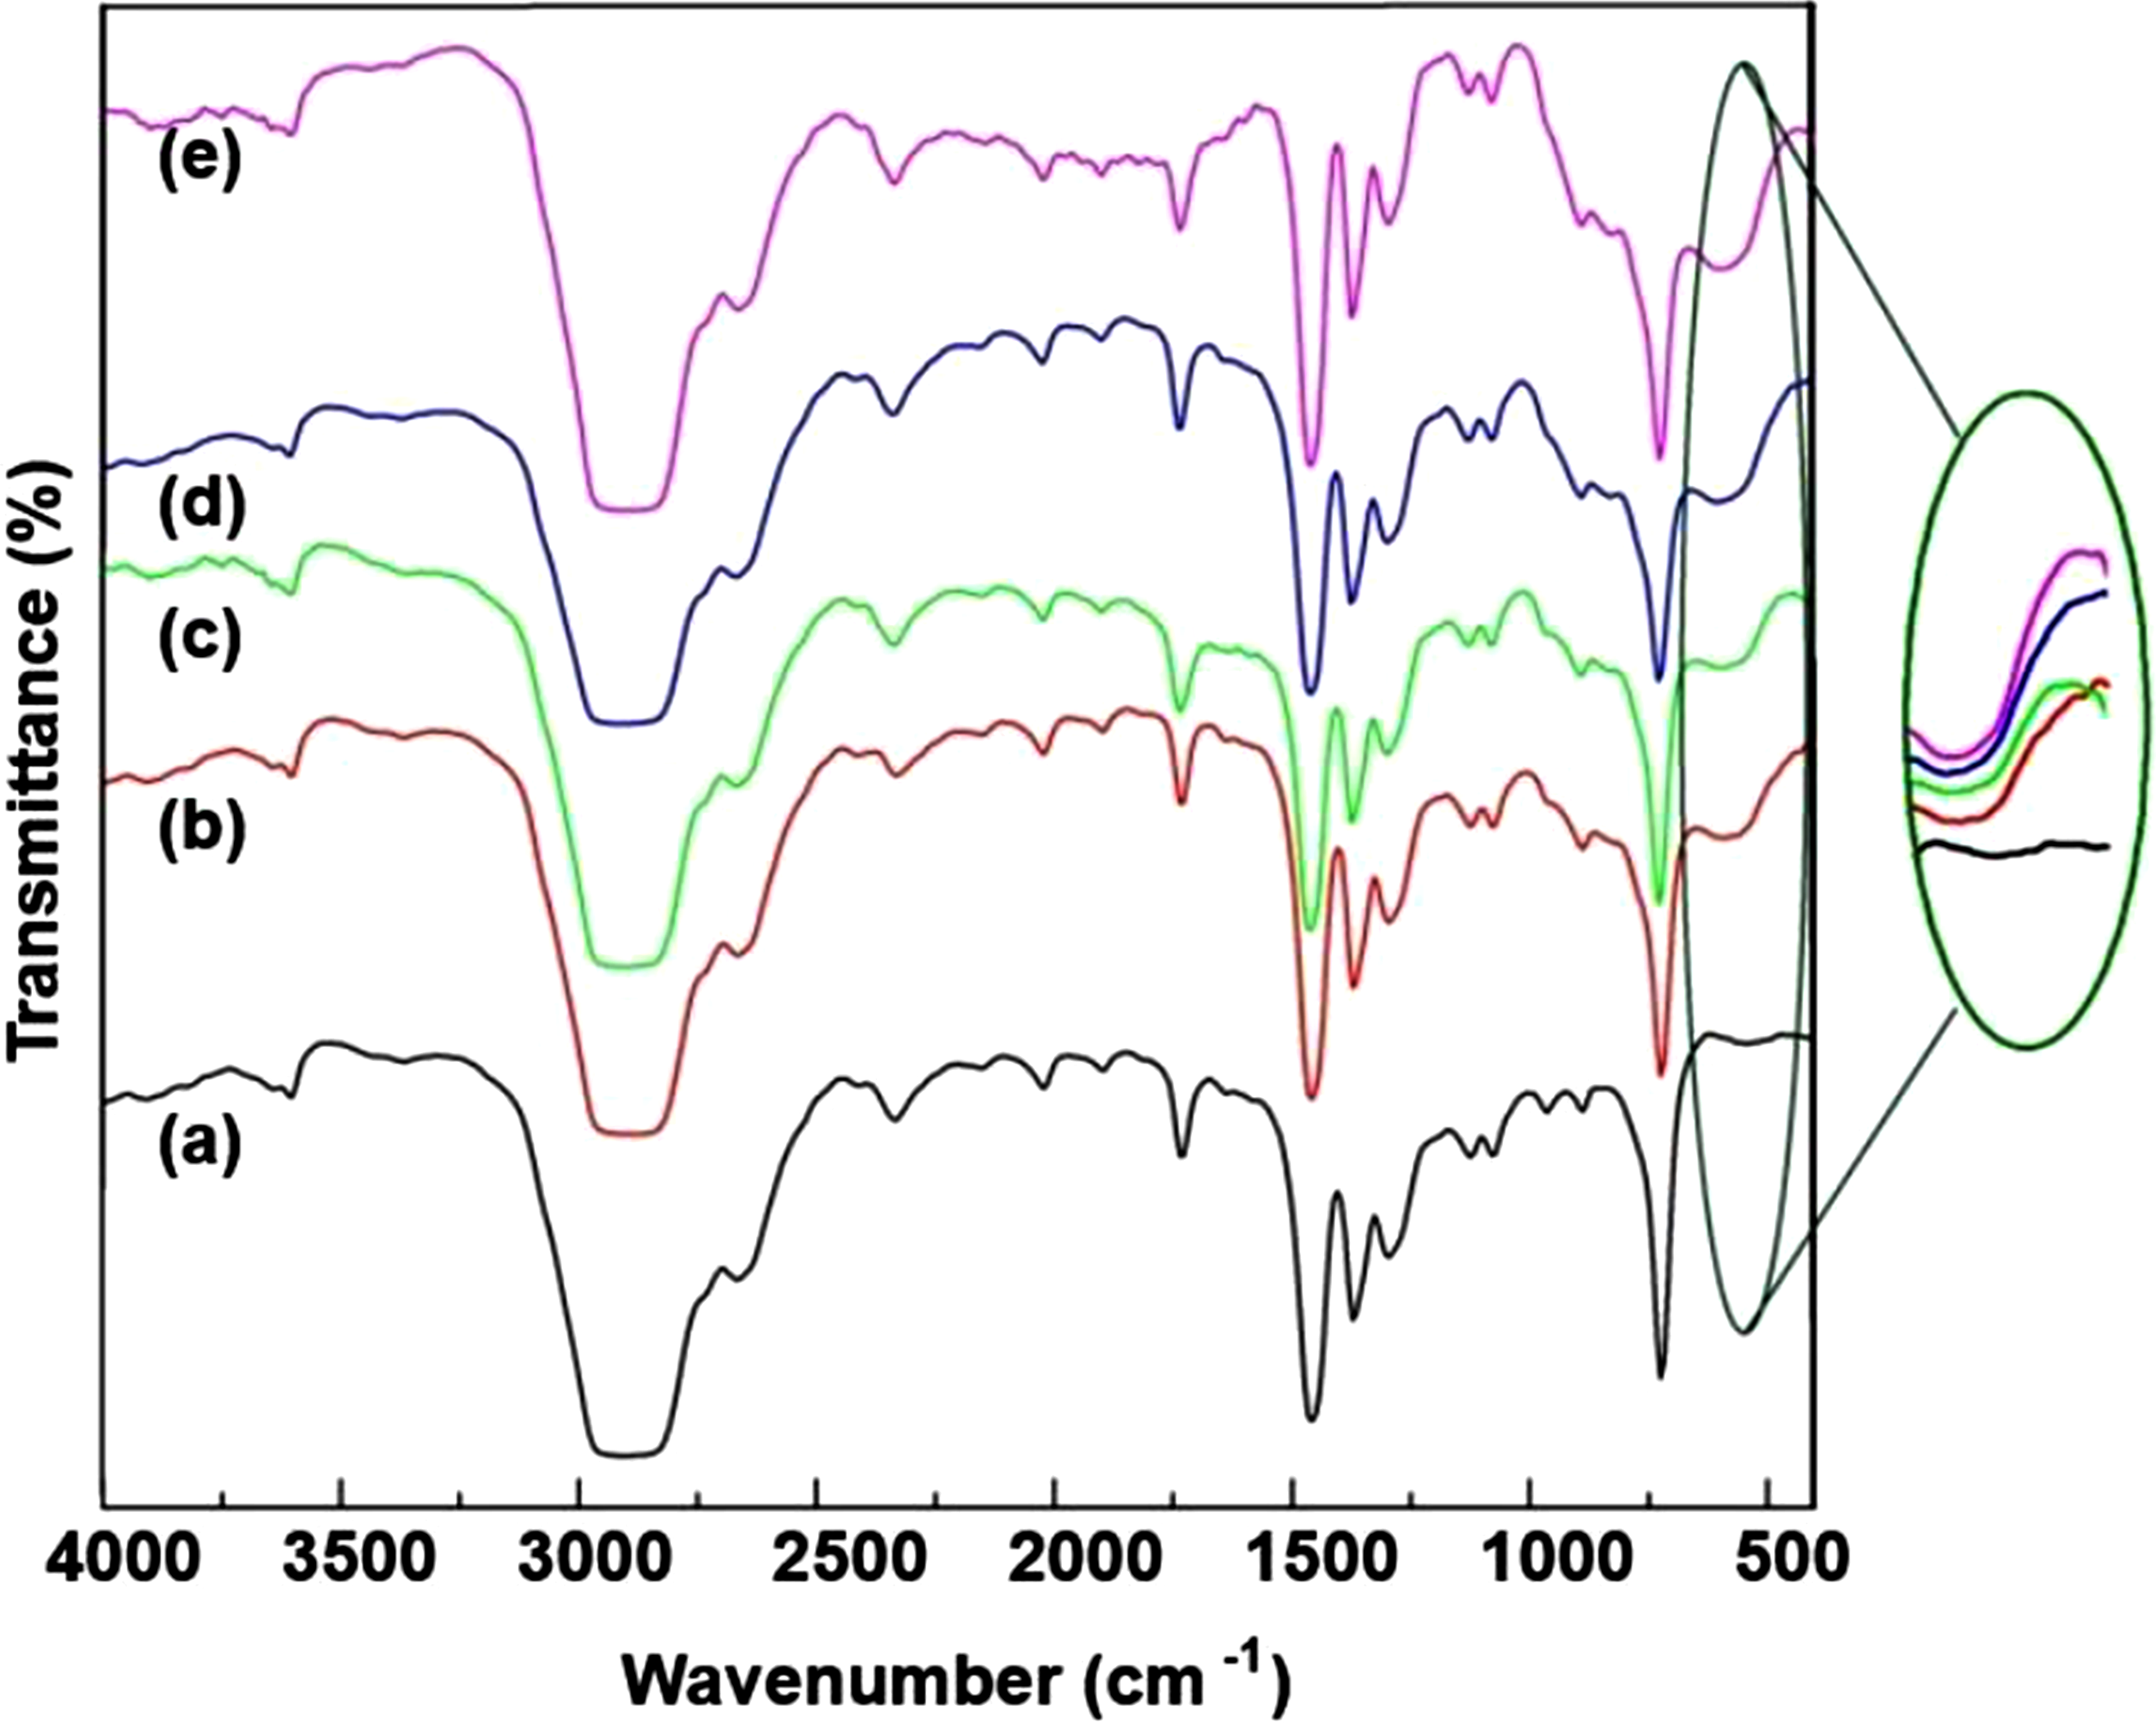
As the Ta2O5 content increases, additional peaks emerge, such as a new peak at 589 cm−1 in HDPE/3%Ta2O5, which intensifies with higher Ta2O5 concentrations and is attributed to Ta-O-Ta stretching vibrations, confirming the presence of Ta2O5 (Figure 12(b)). Other peaks, including 720 cm−1, 830 cm−1, and 965 cm−1, remain consistent across both pure HDPE and HDPE/Ta2O5 samples, indicating minimal disruption to the HDPE matrix. Peaks around 1078 cm−1 and 1128 cm−1 are related to C-O or C-C stretching, while peaks at 1298 cm−1 and 1372 cm−1 correspond to CH2 wagging and twisting vibrations. The strong peak at 1461 cm−1 is attributed to CH2 bending, and peaks near 1646 cm−1 and 1736 cm−1 suggest C = O stretching, likely due to minor oxidative changes in the polymer. A peak at 2334 cm−1 may be linked to CO2 absorption, while the 2835-2960 cm−1 range (with a prominent peak at 2901 cm−1) corresponds to C-H stretching. The peak at 3602 cm−1, likely due to O-H stretching, may indicate slight moisture absorption or oxidation.
In summary, both HfO2 and Ta2O5 nanoparticles introduce new vibrational bands related to their metal-oxide interactions without significantly altering the HDPE structure. HfO2 introduces peaks at 415 cm−1 and 533 cm−1, while Ta2O5 introduces a prominent peak at 589 cm−1, with the characteristic HDPE peaks remaining consistent, indicating good nanoparticle dispersion and compatibility within the polymer matrix.
Conclusion
In conclusion, this study demonstrates that corona discharge (CD) significantly impacts the electrical, dielectric, and morphological properties of HDPE-based nanocomposites containing HfO2 and Ta2O5 fillers. The breakdown voltage of both pure HDPE and the nanocomposites decreases after CD exposure, indicating a weakening of insulating properties, with Ta2O5-based composites showing a higher susceptibility to breakdown. The dielectric constant increases for all samples after CD, highlighting enhanced polarization. Notably, HfO2 nanocomposites exhibit a more pronounced improvement in charge trapping and interfacial interactions, as supported by the Maxwell-Garnett model, which links filler concentration to permittivity. Additionally, electrical conductivity increases with higher nanoparticle loading, with HDPE/7% Ta2O5 showing the highest conductivity (26.2 × 10⁻¹⁵ S/m), reflecting its elevated dielectric constant. This relationship underscores the role of nanoparticle-induced interfacial polarization in enhancing both dielectric and conductive properties. Atomic force microscopy results confirm significant changes in surface roughness, further supporting the impact of corona discharge on the material’s properties. Infrared spectroscopy also verifies successful interactions between the nanoparticles and the HDPE matrix, indicating good compatibility and potential for future applications in advanced polymer industries. These findings provide valuable insights into the behavior of nanocomposites under corona discharge, suggesting their potential for improved electrical performance in practical applications.
Footnotes
Declaration of conflicting interests
The author(s) declared no potential conflicts of interest with respect to the research, authorship, and/or publication of this article.
Funding
The author(s) received no financial support for the research, authorship, and/or publication of this article.