
Abstract
The impact of thermal history on ultimate thermoplastic composite properties is often overlooked, provided the final parts are compliant. This work investigated the influence of temperature and time of common manufacturing processes of poly phenylene sulfide (PPS) thermoplastic composites (TPC), which resulted in long chain branching and crosslinking of the PPS matrix. This was determined through measurable changes such as rheological properties, crystallization behavior, and fusion joint strength of PPS/CF TPCs. TPC melt processing steps included unidirectional (UD) tape manufacturing, large panel layup and consolidation, individual panel thermal treatment, and fusion joining. During thermal treatment, nine sets of two 10″ × 4″ panels were exposed to either 300°C, 320°C, or 340°C, for 5 min, 30 min, or 60 min. Using thermal profiles identical to TPC manufacturing steps, rheological and calorimetric techniques mimicked the thermal history of the PPS/CF composites to observe changes in PPS matrix properties at discrete process steps. Complex viscosity of PPS increased across all test frequencies, while percent crystallinity decreased, indicative of thermal degradation in the melt state. The increase in viscosity inversely related to single lap shear strength (SLSS) of fusion joined panels. Through combining matrix-level measurements (SAOS rheology and DSC) to composite mechanical testing, we gain significant insight regarding the influence of process-induced polymer matrix properties on fusion joint strength.
Keywords
Introduction
TPCs offer a unique opportunity to simultaneously address modern needs for high-rate, sustainable, carbon fiber reinforced polymer matrix composite (CFRP) manufacturing. Thermosetting polymer matrices are stabilized through the formation of covalent crosslinks between liquid monomers, creating a solid phase around the carbon fibers which locks them into place. In the absence of strategic monomer design, final thermoset matrix composites are permanent entities and the high cost/energy intensive carbon fibers within them are not recoverable without exposure to extreme conditions.1–3 In contrast, thermoplastic matrices are intrinsically recyclable. TPC structures are able to be reshaped or molded when heated above a workable temperaure.4–6 TPCs also enable higher rate processes such as automated layup and fusion joining which depend on the application of heat and pressure and addresses growing demand for aircrafts worldwide. 7
While the production rate is faster for thermoplastic matrix composites, engineering thermoplastics often require higher processing temperatures. This demands the development and adoption of technologies that are unique to TPCs. Like other thermoplastic manufacturing methods (i.e., injection molding and extrusion), TPCs are processed by heating beyond their glass transition temperature (if amorphous) or their melting point (if semi-crystalline) to transition into the molten state before external forces are applied to shape parts that can be demolded upon cooling and solidifying. For structural TPC applications, linear high molecular weight polymers are applied to fiber reinforcements in the melt-state and are then assembled into preforms before exposure to various process steps. TPC preforms are heated and consolidated into engineered flat panels, then reheated to shape (thermoform) them into finished composite parts. Consolidation and shaping are often not the endpoints of manufacturing as formed panels must be joined together. Fusion joining is a process unique to TPCs where structural joints are created between existing TPC parts using only the polymer as an adherent by applying localized heat and pressure at the interface of two composite laminates. 8 Understanding and evaluating the strength and stability of the thermoplastic polymer weld is critical to part quality and process robustness.
Among engineering thermoplastics, semi-crystalline polymers feature clusters of packed chains and crystal lamellae separated by disordered amorphous regions. 9 The crystalline domains within semi-crystalline polymers improve stiffness and solvent resistance, two critical properties for TPCs in aerospace applications, making them the focus of materials development for primary and secondary structures. 10 For primary structure applications (i.e., fuselage and wing-skin), poly aryl ether ketones (PAEKs) such as poly ether ether ketone (PEEK) and poly ether ketone ketone (PEKK) are of recent interest.11–14 Secondary structure applications (i.e., leading edges and control surfaces) consider polyphenylene sulfide (PPS) as a TPC matrix, where PPS/CF TPCs are featured as a prominent material on the Gulfstream G650 business jet.15–17 PPS, a lower cost engineering thermoplastic, is renowned for rapid crystallization from the melt state, high crystalline content (∼60%), workable melt viscosity, and high stiffness.18–21 PPS is traditionally melt processed at temperatures between 300°C and 340°C, and often shifts from a white/light grey color toward dark brown as it proceeds through various process steps.22,23 The color shift is a known consequence of melt-state degradation, marked by polymer chain rupture and reconnection to branched and crosslinked structures during melt processing. The destruction of polymer chain linearity and the generation of more complex polymer architectures influences the polymer melt viscosity and crystallization behavior.24,25 PPS has been evaluated as a matrix in TPCs for various applications involving both glass fiber and carbon as fiber reinforcements. Much of the focus of research surrounding PPS TPCs aim to improve fracture toughness and interfacial shear strength, two properties influenced by the high crystalline content of PPS.26–29 Other PPS TPCs studies cover mechanical performance after environmental wear,30–34 processing parameter dependent consolidation, 35 and process dependence on crystallization and mechanical robustness.36–38 Exactly how repeated heating, holding in the melt state, and cooling cycles influences the efficacy of fusion bonding and resulting fusion bond strength, is currently unknown.
Herein, the effects of extended melt processing conditions (300°C to 340°C, up to 1 hour), similar to PPS TPC process parameters, are related to the single lap shear strength of a fusion joined a PPS/CF TPC through small amplitude oscillatory shear (SAOS) rheology, differential scanning calorimetry (DSC), and single lap shear (SLS) mechanical testing.
Experimental
Materials
UD PPS/carbon fiber composites were prepared from PPS/CF tape manufactured at the University of Southern Mississippi containing unsized, HexTow® IM7 carbon fiber (Hexcel) and micronized PPS QA200N (Solvay Materials). The 6″ wide UD thermoplastic tape was found to contain a 55% volume fraction of carbon fiber. During unidirectional tape manufacturing PPS was in the melt state for 3 min at a temperature of 340°C. Polymer matrix only experiments were conducted with commercially sourced PPS, Ryton® PPS QA200P (Solvay Materials).
PPS/CF composite manufacturing
Several manufacturing steps were required to prepare SLS test specimens including: (1) UD tape manufacturing, (2) hand layup and preform consolidation, (3) thermal treatment of subsets of the larger panel, and (4) autoclave fusion joining of the heat-treated panel subsets. The large panel was partitioned into 10 sets of two, 10″ × 4″ panels which were heat treated and cut into to yield eight test specimens for each thermal treatment condition. Heat treatment of the panel subsets were designed to specifically mimic realistic industrial process parameters. The thermal profile over the course of these manufacturing steps is outlined in Figure 1 which shows a post consolidation thermal treatment temperature of 300°C. Thermal profile of the PPS/CF manufacturing process used in this study featuring a thermal treatment temperature of 300°C.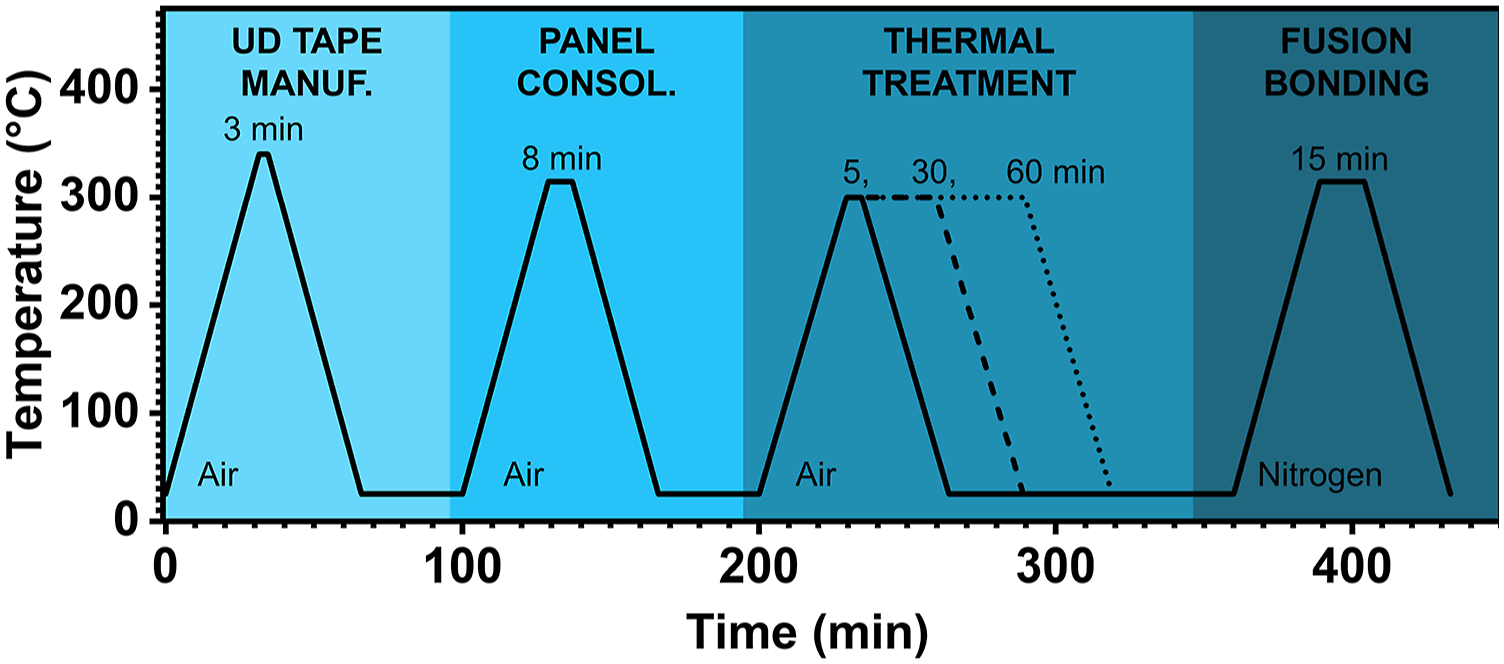
Initial PPS/CF panel lay-up and consolidation
A 31″ × 31″ PPS/CF 16-ply laminate was prepared with a stacking sequence of [45/0/-45/90]2S. Individual plies of unidirectional PPS/CF tape were tacked together using a handheld ultrasonic welder to create a preform. The preform was then placed in between two layers of Upilex (UBE Corp.) polyimide high temperature release film, and transferred to a press heated to 315°C. The aluminum tool, previously coated in Loctite® Frekote 770-NC mold seal and mold release (Henkel Adhesives), together with the high temperature film create a slip condition in the press (Figure 2(a)). Upon closure, the laminate was held at 315°C for 8 min at 20 ± 2 psi, after which the press was cooled to room temperature at 1°C/min and the panel was removed (Figure 2(b)). (a) 31″ × 31″ PPS/CF panel at temperature inside the heated press, (b) consolidated PPS/CF laminate inside release film upon removal from press.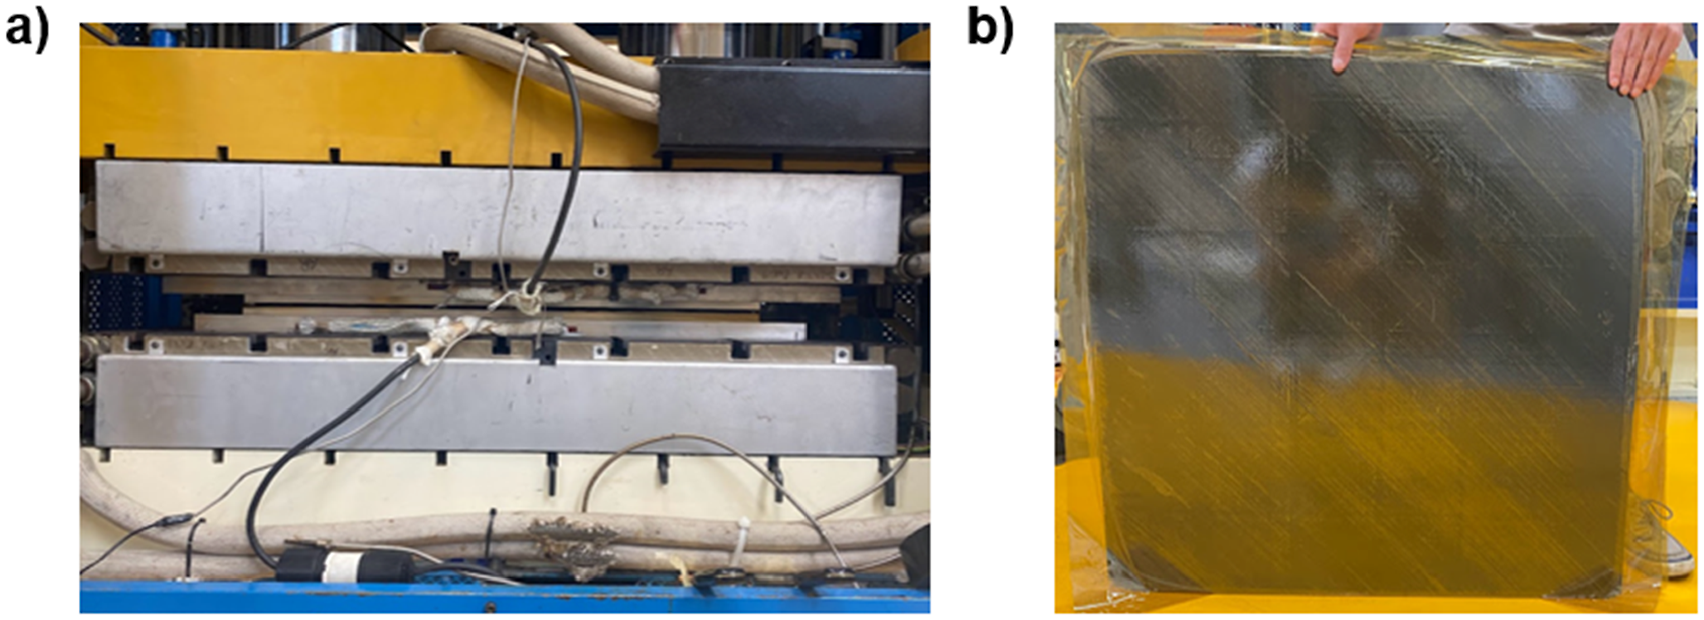
Thermal treatment of PPS/CF composites
A water jet and diamond saw were utilized to cut panels to be thermally treated before fusion joining. Ten sets of 10″ × 4″ panels were cut along the 0° fiber orientation (Figure 3). Cutting pattern of the 31″ × 31″ consolidated laminate into sets of two 4″ × 10″ panels for thermal treatment, fusion joining, and single lap shear testing.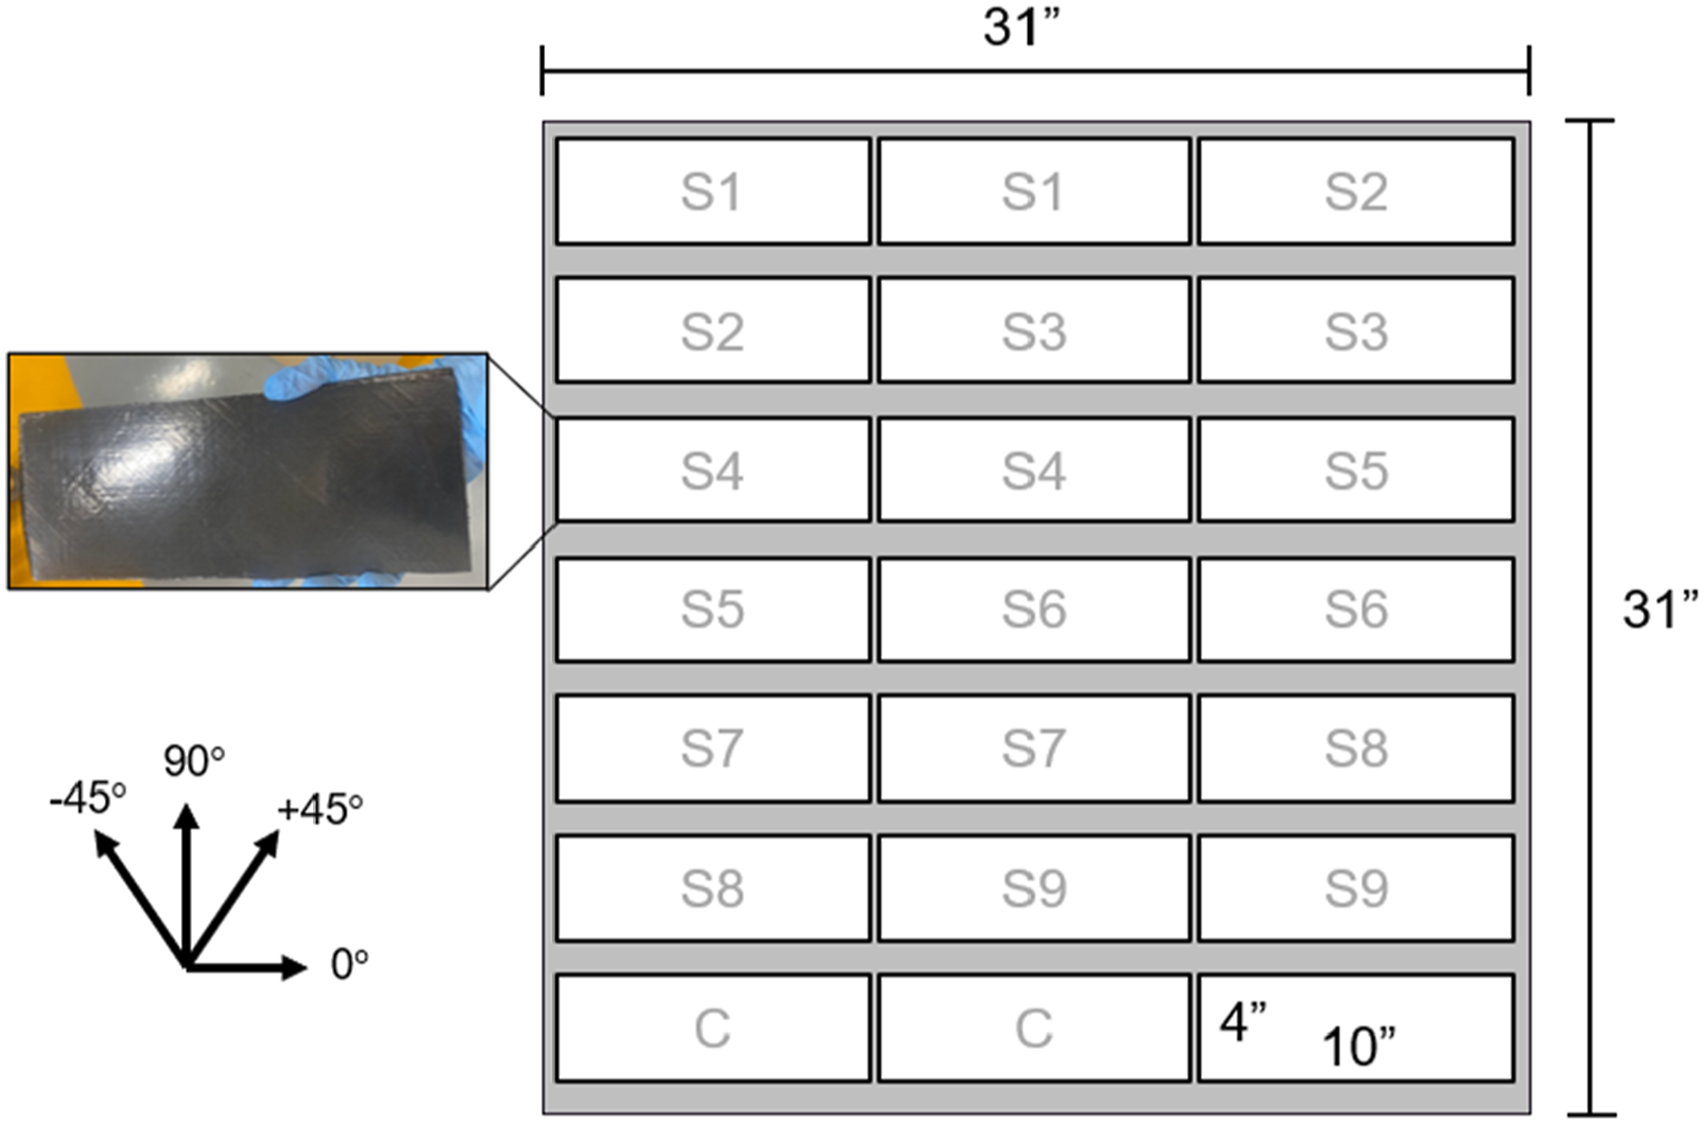
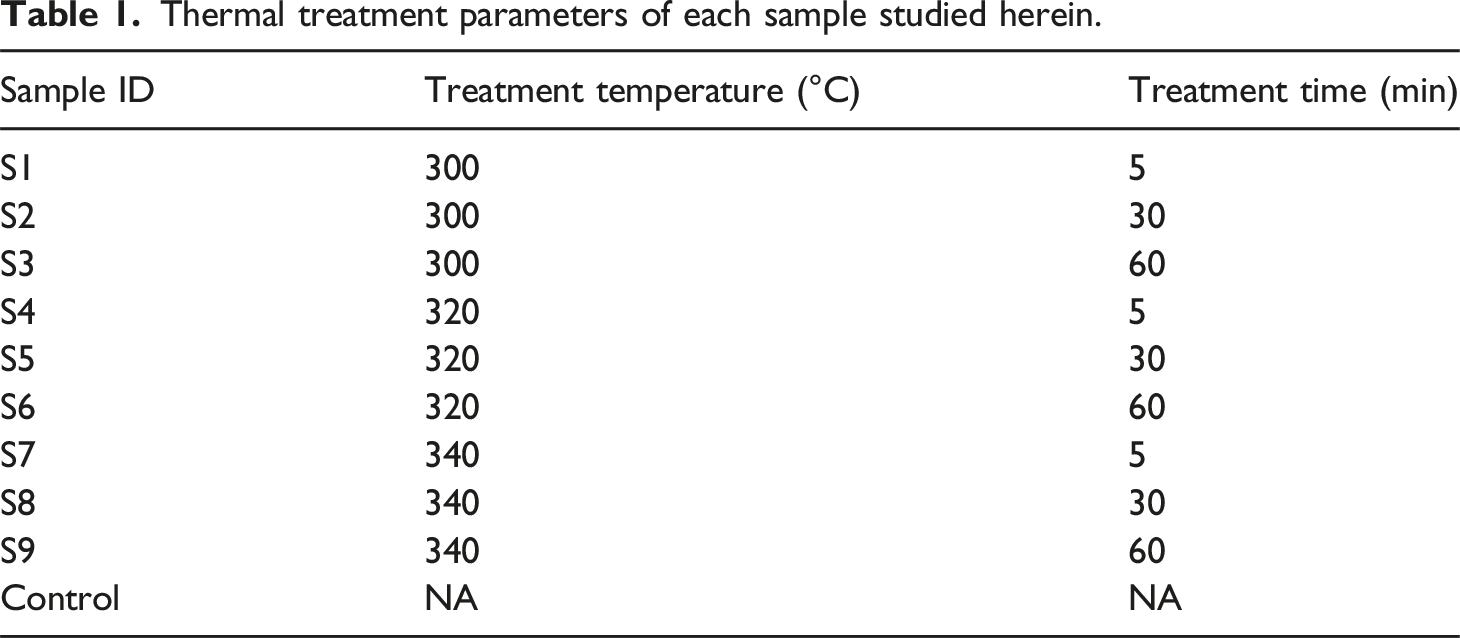
Thermal treatment parameters of each sample studied herein.
Upon removal from the press, panels were placed between aluminum caul plates to cool to room temperature.
Fusion joining of thermally treated PPS/CF single lap shear panels
Co-consolidation of thermal treatment subpanels with similar thermal treatment was performed in an autoclave. The autoclave was selected for the fusion joining process to further consolidate the panels and eliminate voids. Lap-joint specimens were configured using pairs of thermally treated 10″ × 4″ PPS/CF laminates with a 1 in overlap. Autoclave samples were then ramped to 315°C at 3°C/min; followed by a dwell at 315°C for 15 min prior to cooling at a rate of ∼5°C/min all under vacuum bag −25 inHg and autoclave pressurization of 6.8 bar (100 lbf/in2).
SAOS rheology
Frequency sweeps of neat PPS polymer in the melt state were performed using a TA Instruments ARES-G2 rheometer equipped with a forced air convection oven fitted with 25 mm stainless steel parallel plates, a gap of 0.7 mm in the presence of air. Frequency sweeps were conducted from 0.2 rad/s to 628 rad/s at 5% strain. Samples were loaded at 290°C and heated to thermal conditions of the first processing step (UD tape manufacturing, 340°C), and held 3 min before cooling to 290°C and collecting frequency sweep data. This sequence was repeated for all melt processing steps (large panel consolidation, thermal treatment, and fusion joining) on the same PPS sample, resulting in viscoelastic data snapshots of the PPS polymer material following each manufacturing process step.
Differential scanning calorimetry (DSC)
Crystallization was examined using non-isothermal heating and cooling in a TA Instruments Q2500 DSC. PPS pellets were reduced to ∼2–3 mg and placed in a Tzero aluminum pan/lid before heating to 340°C and holding for 3 min in a nitrogen environment to erase the polymer thermal history. Samples were then cooled to 70°C and cyclically heated to the melt processing temperatures outlined in Figure 1 (refer to Table 1 for thermal treatment temperature step) for the specified amount of time. Once at melt processing temperature, the cell environment was switched to air for the duration of the isothermal hold, after which the environment was switched back to nitrogen and the sample was cooled to 50°C (the switch to nitrogen gas mimics the fusion joining step autoclave environment). All ramp rates were set at 10°C/min. Percent crystallinity (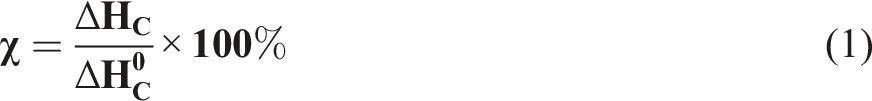
Single lap shear (SLS) testing of PPS/CF fusion joints
Lap shear test specimen (equivalent thickness to fusion joined panels) were tabbed with glass fiber reinforced epoxy shims with to reduce the coupling moment during loading, per ASTM D5868-01. For each thermal treatment, eight single lap-shear coupons of 1″ width was tested. A total of 100 lap shear specimens were tested overall, (10 for each thermal condition nine conditions plus the control). Testing was performed on an MTS Criterion Model 43 equipped with a 50 kN load cell (Figure 4) using a loading rate of 1.27 mm/min (0.05 in/min), and testing environment of 50% ± 10% relative humidity at 23°C ± 5°C. Failure load and single lap shear strength (defined in this work as the failure load divided by the fusion jointed interface area of the single lap shear coupon) were recorded and evaluated from the experimental results. PPS/CF SLS coupon in the MTS.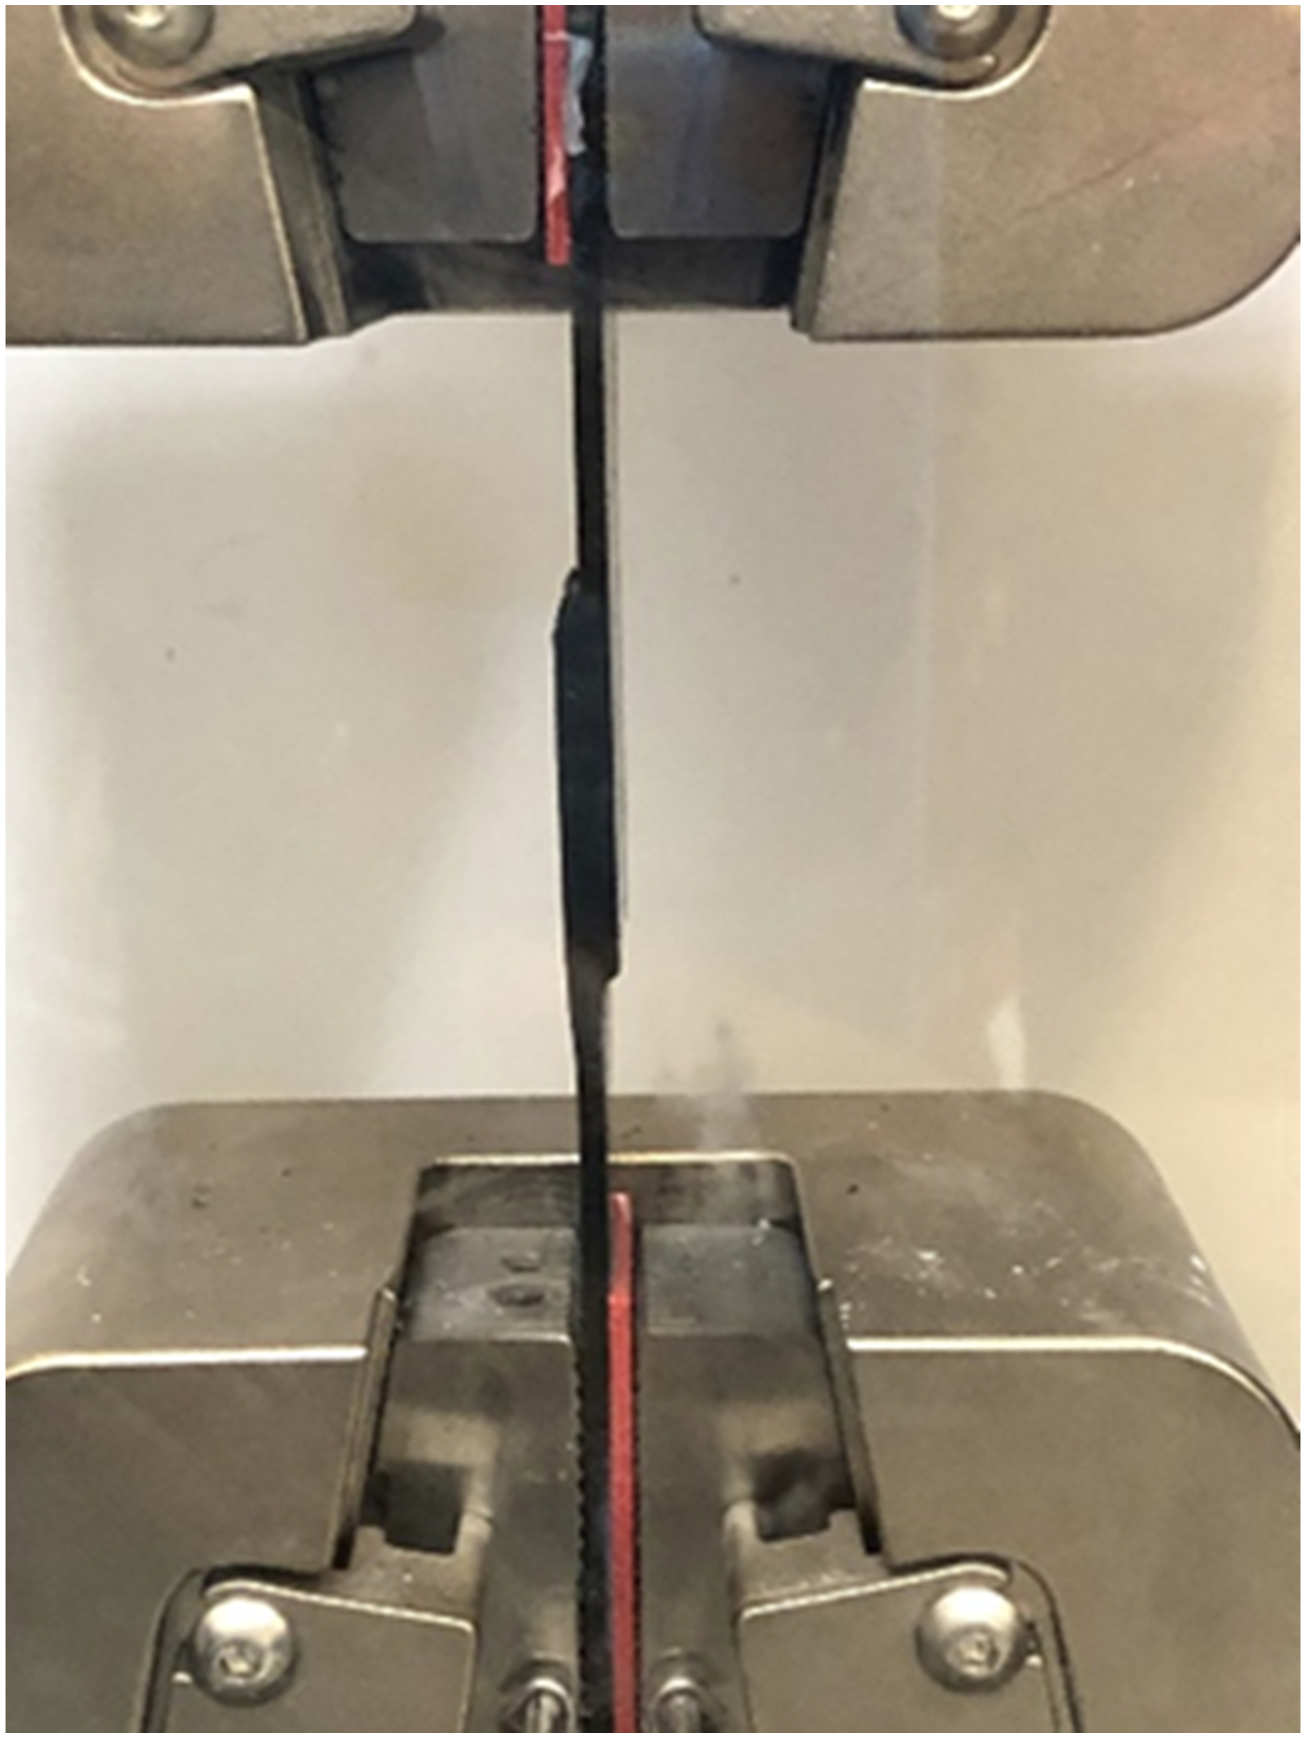
Results
Viscoelastic and crystallization behavior of PPS during PPS/CF TPC manufacturing
The thermal process-dependent changes to the rheological and crystallization profiles of PPS were determined through SAOS rheometric measurement and DSC. All thermal profiles of these experiments were identical apart from thermal treatment (see Figure 1 and Table 1).
Unstable melt viscosities of PPS
Frequency dependent rheology of thermoplastics in the melt state provides structural insight of polymers; where within certain parameters, complex viscosity (η*) is directly dependent on chain architecture (linear, branched, or partially crosslinked). The frequency sweeps were conducted at 290°C following controlled exposure to the conditions corresponding to each previously identified melt processing step. A single curve was generated for each step, corresponding to unprocessed PPS, UD tape manufacturing (340°C, 3 min), large panel consolidation (315°C, 8 min), thermal treatment (Table 1), and fusion joining (315°C, 15 min). Resulting complex viscosities in linear and logarithmic form for sample S1 are shown in Figure 5 (for all frequency sweep results see Figure S1). Frequency dependent η* in (a) linear and (b) logarithmic form for PPS after each processing step for S1.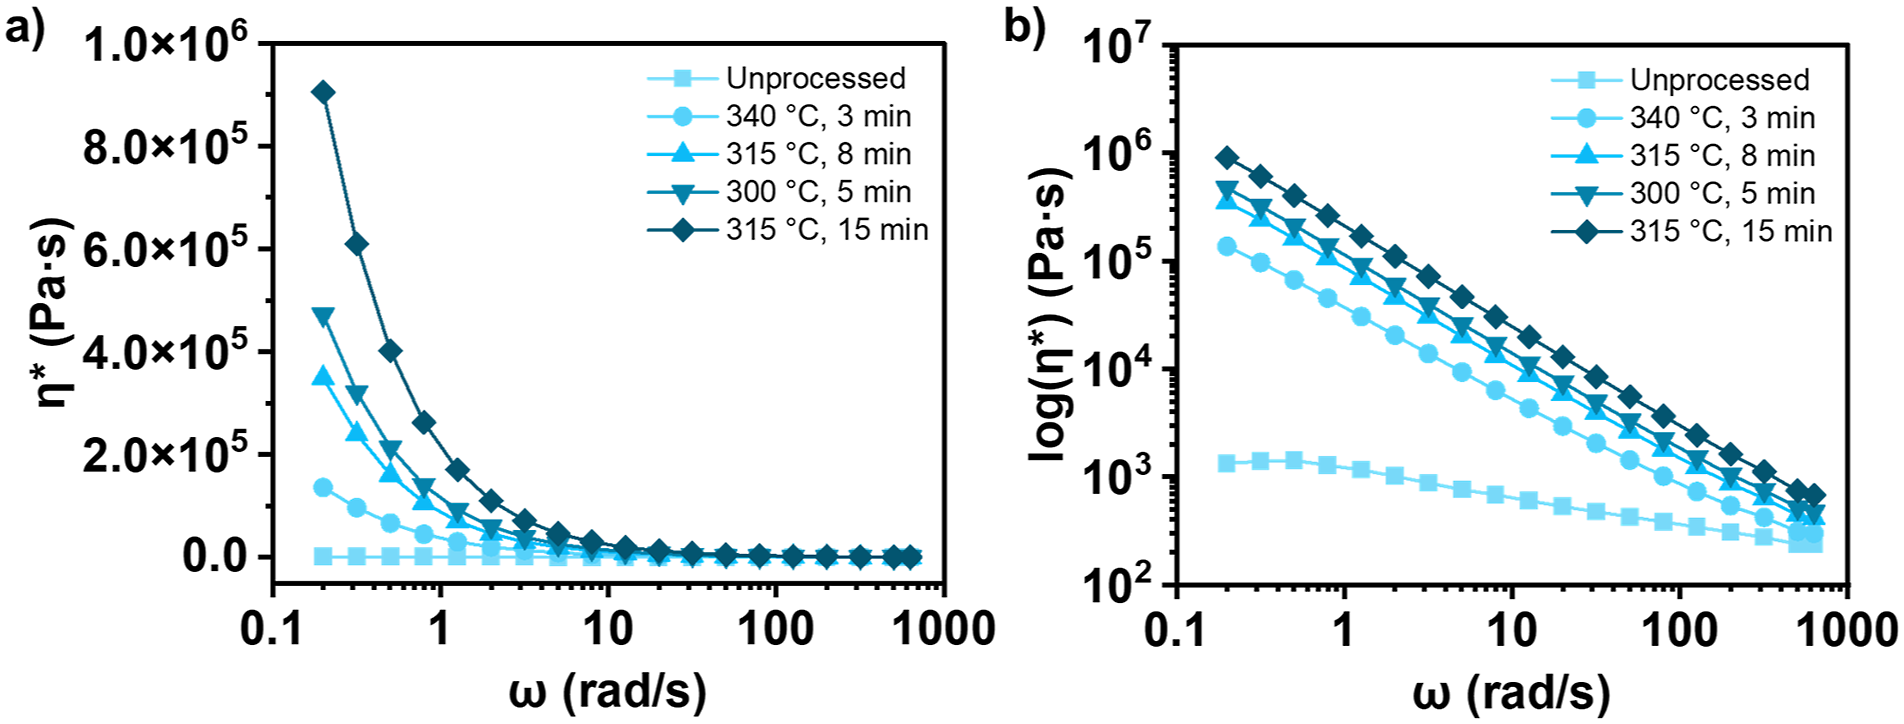
Zero shear viscosity (η0) increased post each process step. The most notable change in η0 was from ∼450 Pa s to ∼117,000 Pa s (over 250×) between unprocessed PPS and after UD tape manufacturing (the initial process involved in part manufacturing). None of the following melt processing steps replicated on the SAOS rheometer had as significant increase in η0 despite the longer hold times. In previous studies of PPS melt viscosity at varied isothermal hold temperatures, a strong temperature dependence was observed, expressing drastic increase in η* within one to 2 min, while higher isothermal temperatures exacerbated the rate of η* growth. 25
The order of processing steps played a role in the magnitude of the viscosity increase relative to the prior step. Based on prior knowledge, is likely that the higher temperature component of the isothermal hold of the first processing step (UD tape manufacturing) is responsible for the greatest change in PPS η0. This is due to a polymer structural change from a fully linear state to a more hindered state, such as branched or lightly cross-linked. Subsequent steps began with the restructured PPS, and further degraded the chains, therefore, the change in η0 relative to the step before less significant compared to the initial increase. Values of η* increased with the addition of each melt processing step at all frequencies. Examining η* at 628 rad/s is of particular importance, as this value is representative of the ability of the polymer melt to disentangle at higher frequencies. At this frequency, η* increased, but to a lesser degree. Higher applied shear can force polymer chain disentanglement and promote flow, overcoming the effects of branching and crosslinking. Figure 6 compares the η0 and η* at 628 rad/s after their respective thermal treatment steps. (a) η0 and (b) η* at 628 rad/s for all PPS samples after thermal treatment processing step. The black dotted line indicates the control sample.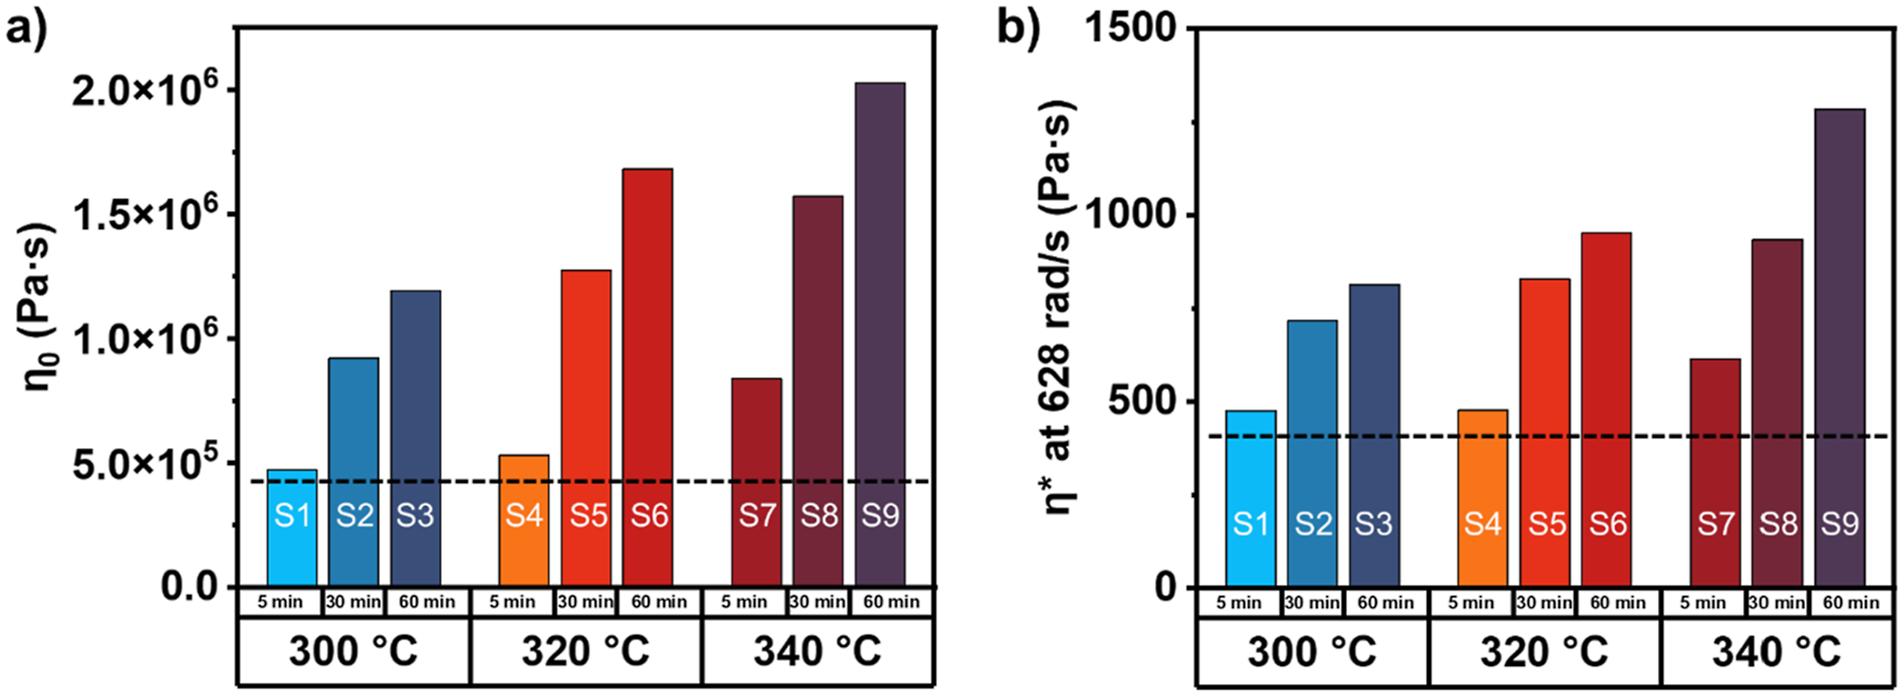
All samples that underwent thermal treatment displayed higher η0 and η* at 628 rad/s compared to the control, and increased according to thermal treatment temperature and time, indicating a greater fraction of branched and crosslinked PPS chains unable to disentangle. Greater effects were observed for processes having higher isothermal hold temperatures.
At all frequencies, samples that underwent thermal treatment exhibited greater complex viscosities than the control (the dotted black line in Figure 6). At short time scales, chain scission has been shown to decrease viscosity, 41 but due to the late-stage thermal treatment step, the dominant mechanisms influencing the viscosity of PPS was branching and crosslinking, and no reductions in viscosity were observed. Samples with more severe thermal treatment appear less processable at low frequencies, which could lead to inability of chains to diffuse/intermingle in a low-shear environment such as fusion joining. At high frequencies (>100 rad/s), all samples displayed complex viscosities of ≤5,000 Pa s, a processable viscosity, especially for high shear processing applications such as injection molding. 42
Crystallization behavior of thermally processed PPS
Structural changes to the PPS backbone resulting from melt-state degradation display distinctly different crystallization behavior compared to purely linear PPS. DSC was employed to mimic the PPS/CF TPC manufacturing environment and predict how the crystallinity of PPS was influenced by each melt processing step. The cell environment was switched between air and N2 gas during the experiment, once for erasing thermal history, and again to mimic the autoclave environment fusion joining step. Experiments were conducted by cyclically heating the same sample to the process temperature, holding for the predetermined amount of time, and cooling at a rate of 10°C/min to measure crystallization enthalpy. After each melt processing step, the crystallization curve was analyzed to quantify and qualify the effect of each processing step PPS crystallization behavior. The crystallization enthalpy and percent crystallinity following each process step for sample S1 (thermal treatment at 300°C for 5 min) are shown in Figure 7. (a) Heat flow as a function of temperature for S1 during PPS crystallization after exposure to the individual manufacturing steps, and (b) the corresponding percent crystallinity associated with each exotherm.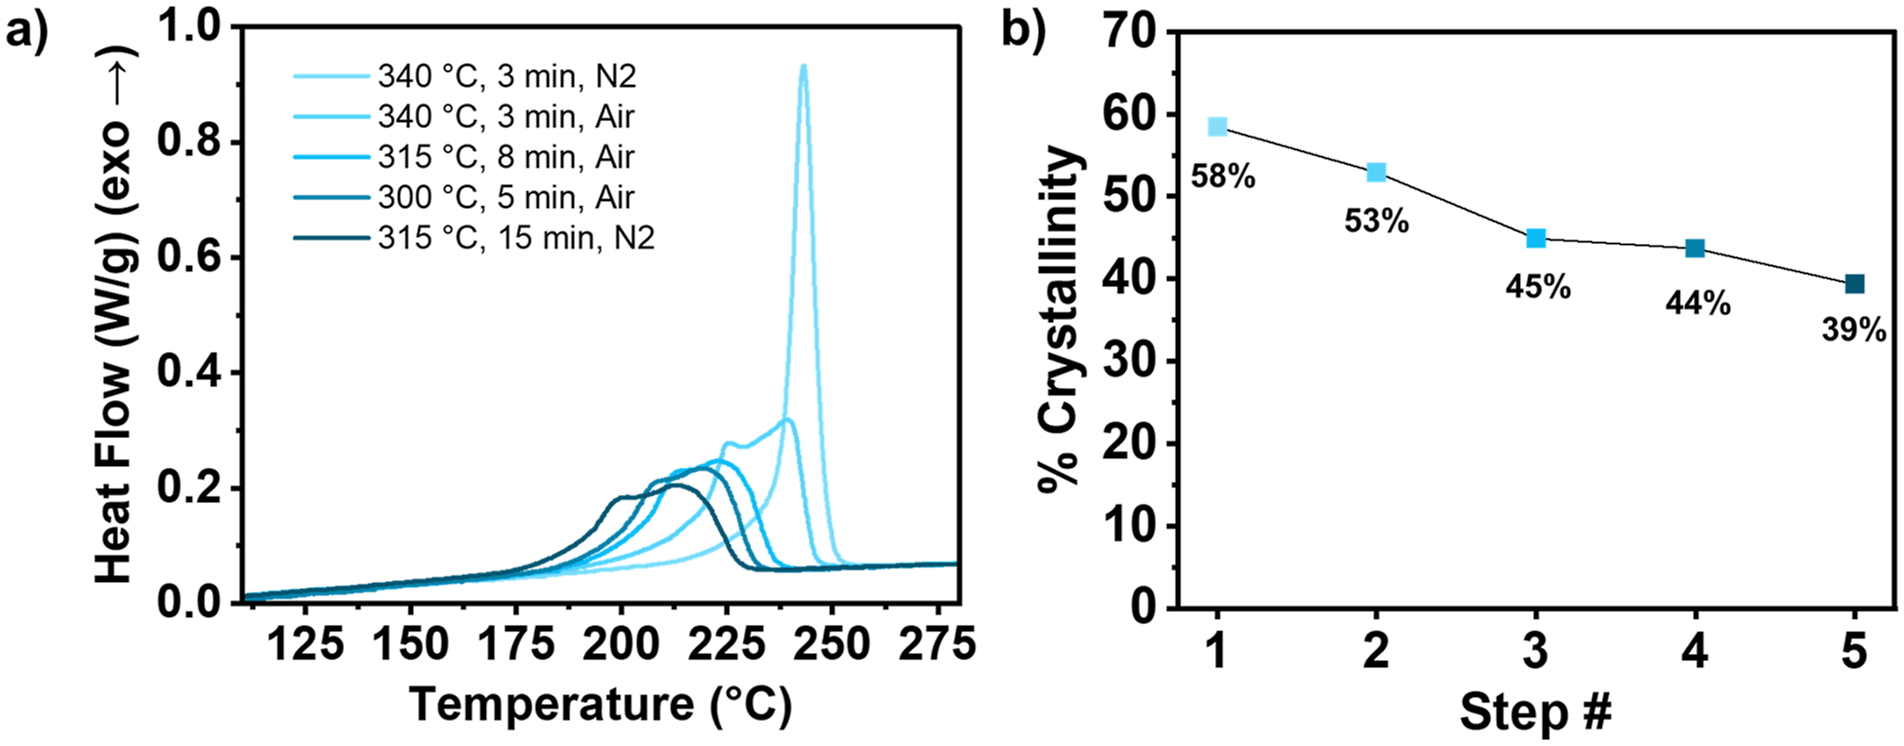
In the first step, the sample was heated to 340°C and held for 3 min under a nitrogen purge to erase thermal history and measure the crystallinity of pristine PPS polymer. The resulting crystallization exotherm is a monomodal curve having a percent crystallinity of 58%. After mimicking the UD tape manufacturing process (340°C, 3 min, air), the crystallization exotherm shifted to lower temperatures, broadened and appeared bimodal. The total percent crystallinity obtained following this step was 54%, indicating the formation of polymer architectural changes which hinder rapid uniform crystallization. The exotherm continued to shift to lower temperatures and broaden after the large panel consolidation step (315°C, 8 min, air) with a percent crystallinity of 45%. The fusion joining step (315°C, 15 min, N2) displayed little to no effect on crystallization behavior or final crystalline content. The oxygen starved environment hinders oxidative degradation, resulting in a small 1% decrease in percent crystallinity. This experiment was repeated for all samples (S1–S9) with the addition of a thermal treatment step after the consolidation (Supporting Information, Figure S2 and S3). The onset of PPS crystallization shifted to lower temperatures following each processing step. In the case of S1 (Figure 7), the incorporation of thermal treatment of 300°C for 5 min minimally affected final PPS final percent crystallinity, however, did noticeably shift the crystallization onset temperature from 236°C after consolidation to 231°C after thermal treatment. The difference in crystallization onset temperature between large panel consolidation and thermal treatment increased as thermal treatment duration and temperature were increased.
In general, with each processing step, PPS crystallization exotherm onset shifted to lower temperatures. There was very little difference in the crystallization exotherms corresponding to S6 thermal treatment and subsequent fusion joining. This similarity between thermal treatment and fusion joining exotherms was the case for samples with thermal treatment durations of 30 and 60 min (S3, S5, S6, S8, and S9). For samples with shorter thermal treatment, the exotherms for these two processing steps were distinct from one another. While fusion joining occurs in an inert environment, if radicals formed through chain scission of a linear PPS segment are present, degradation will still occur. If during the prior step (in this case, thermal treatment) the sample is held for a longer duration, radicals, capable of coupling reactions will form non-linear moieties within the polymer and subsequent steps are essentially performed on a completely different polymer and observed changes will be with respect to the new structure. We propose the following hypothesis to explain the diminishing effects of thermal treatment at subsequent process steps: (1) there are fewer radical species remaining following longer thermal treatments because radical species are more difficult to generate in the new polymer architecture, (2) radical species are generated however the new architecture stabilizes the radicals and they are not as reactive, or (3) radical species are still generated and react but the new generated structures have little to no effect on the global structural effect leading to similar crystallization behavior after a subsequent inert melt-processing step.
Increasing the thermal treatment temperature further reduces the measured percent crystallinity (Figure 8). Between samples, however, a stark contrast is observed between percent crystallinities obtained as a function of the thermal treatment over time. For example, the thermal treatment temperature of 320°C for 5, 30, and 60 min had resulting percent crystallinities of 43% (S4), 34% (S5), and 28% (S6). In the most extreme case, S9 displayed a percent crystallinity of only 1.4%. A wide range of crystallinities resulting from thermal processing may lead to differences in TPC stiffness and is a direct consequence of branching/crosslinking of PPS and altered melt viscosity. It is worth noting that changes in the polymer structure resulting from thermal degradation can not only reduce percent crystallinity but also have been shown to influence the glass transition temperature.
43
In the PPS melt processing study by Ghanbari and coworkers prior to this work, the glass transition observable via DSC became more prominent as the percent crystallinity decreased as a function of degradation but did not shift to higher or lower values. Percent crystallinity after thermal treatment for all samples (black dotted line represents the control sample with no thermal history).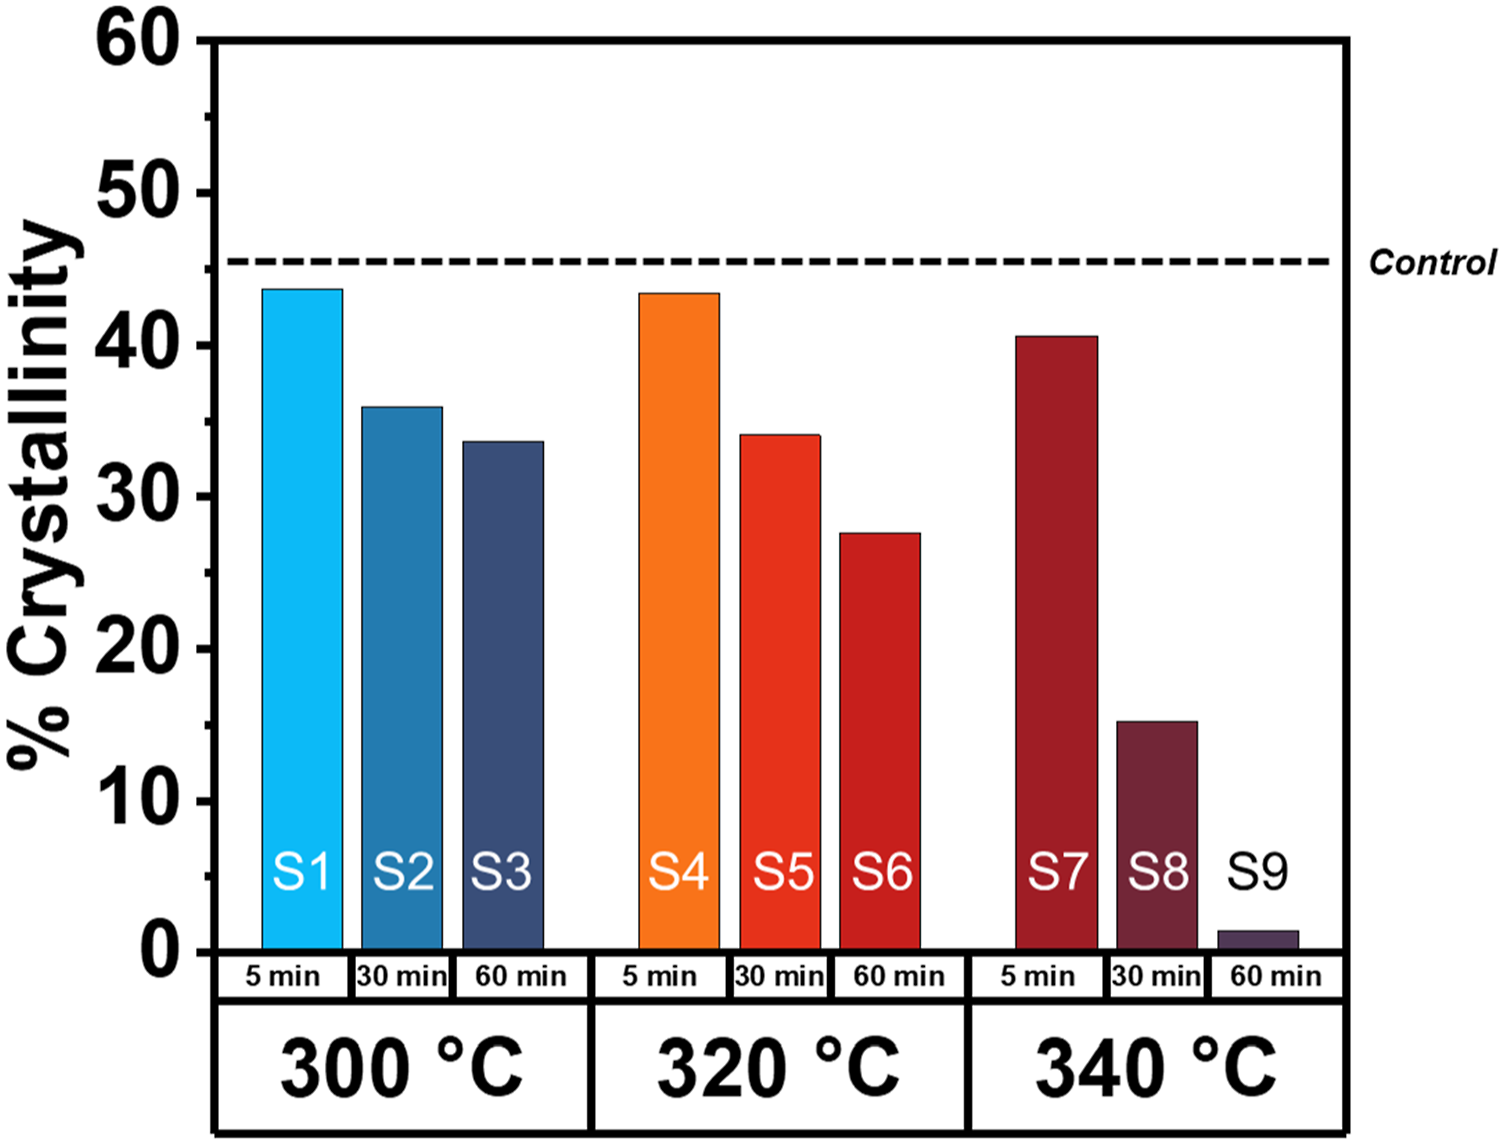
Mechanical properties of fusion joined PPS/CF panels with varied thermal history
Single lap shear strength
The single lap shear strength (SLSS) of the PPS/CF TPCs were tested (ASTM D5868-01) to determine the influence of process parameters on mechanical performance of fusion joints. Average SLSS of the PPS/CF control sample was 13.6 ± 1.6 MPa (shown as the solid black line in Figure 9). The SLS test results of all samples are shown in Figure 9 and Table S1. (a) Average single lap shear strength and (b) average failure load of fusion joined PPS/CF panels.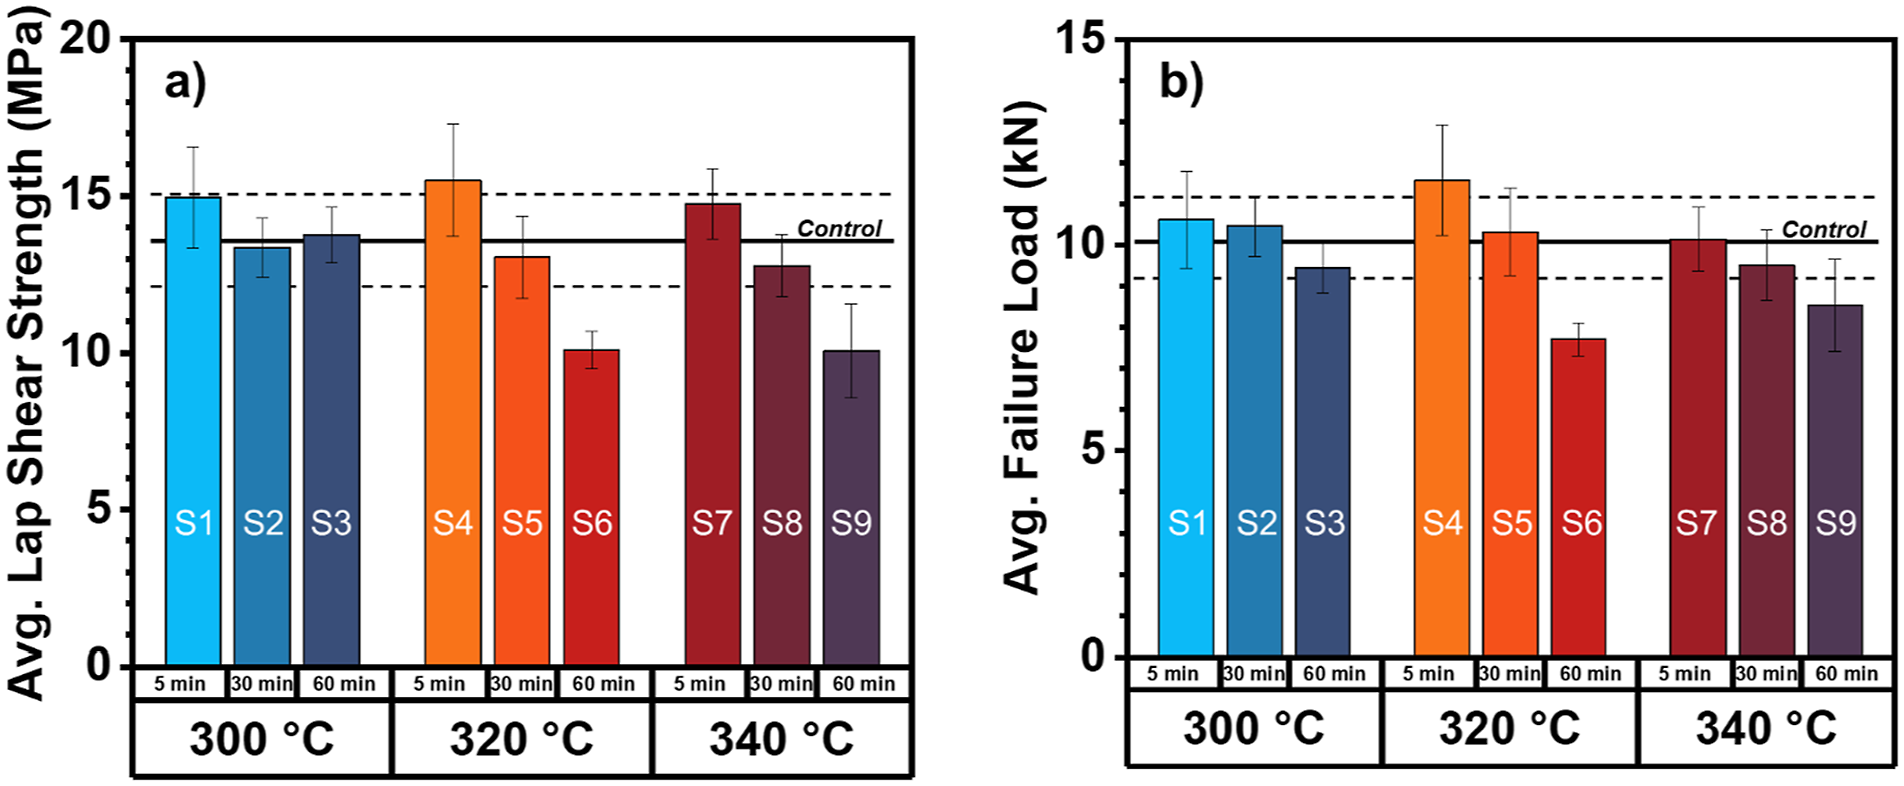
The SLSS results indicate a direct dependence of processing conditions on the over-all strength of the fusion joint. In most cases, increasing processing temperature and time resulted in lowered SLSS. At all processing temperatures, the samples thermally treated for 5 min (S1, S4, and S7) showed increased SLSS in comparison to the control although the values were within error. SLSS of samples S1-S3 (processed at 300°C) displayed no temporal dependence on joint strength. Only samples thermally treated at 320°C and 340°C demonstrated stepwise decreases in SLSS with increasing hold time. The melt processing conditions that decreased the SLSS to a point of statistical significance within the finite number of tests were thermal treatments at 320°C and 340°C for 60 min, however clear trends are present. Similar trends of SLSS data were realized with maximum load to failure (kN). Results from the mechanical testing indicate that PPS/CF can be processed at 300°C, 320°C, or 340°C for 30 min with little consequences to the SLSS or load at failure. According to the prior rheological and calorimetric measurements in this study, η0 corresponding to S6 and S9 (thermal treatment 320°C and 340°C for 60 min) were 1.6 × 10⁶ Pa s and 2.0 × 10⁶ Pa·s, and the percent crystallinities for neat PPS polymers receiving similar thermal treatment were 28% and 1.4%. By applying neat PPS model results to the percent crystallinities during processing we find that although percent crystallinity of S6 was significantly higher than S9, the SLSS values were within error of each other. This finding indicates that viscosity may play a more significant role in determining strength between two interfaces of a of PPS/CF composite. Previous work has shown how the evolution of branched/crosslinked structures can alter the interdiffusion of polymer chains (or healing) mechanism during fusion bonding, 44 in the case of PPS, non-linear structures resulting from degradation could have different heat dissipation behavior and also dictate the strength of the fusion bond.
Optical inspection of failure surfaces of lap shear specimen
Upon optical inspection of broken PPS/CF composites, it was determined all SLS composites samples failed at the weld seam and the failure mode was classified as cohesive per ASTM D5573-99. Representative failure surfaces from each thermally treated panel are shown in Figure 10. (a) Failure surfaces of PPS/CF SLS specimens, (b) enlarged image of S9 where (i) polymer rich regions and (ii) section of a ply from the opposite side of the weld are indicated.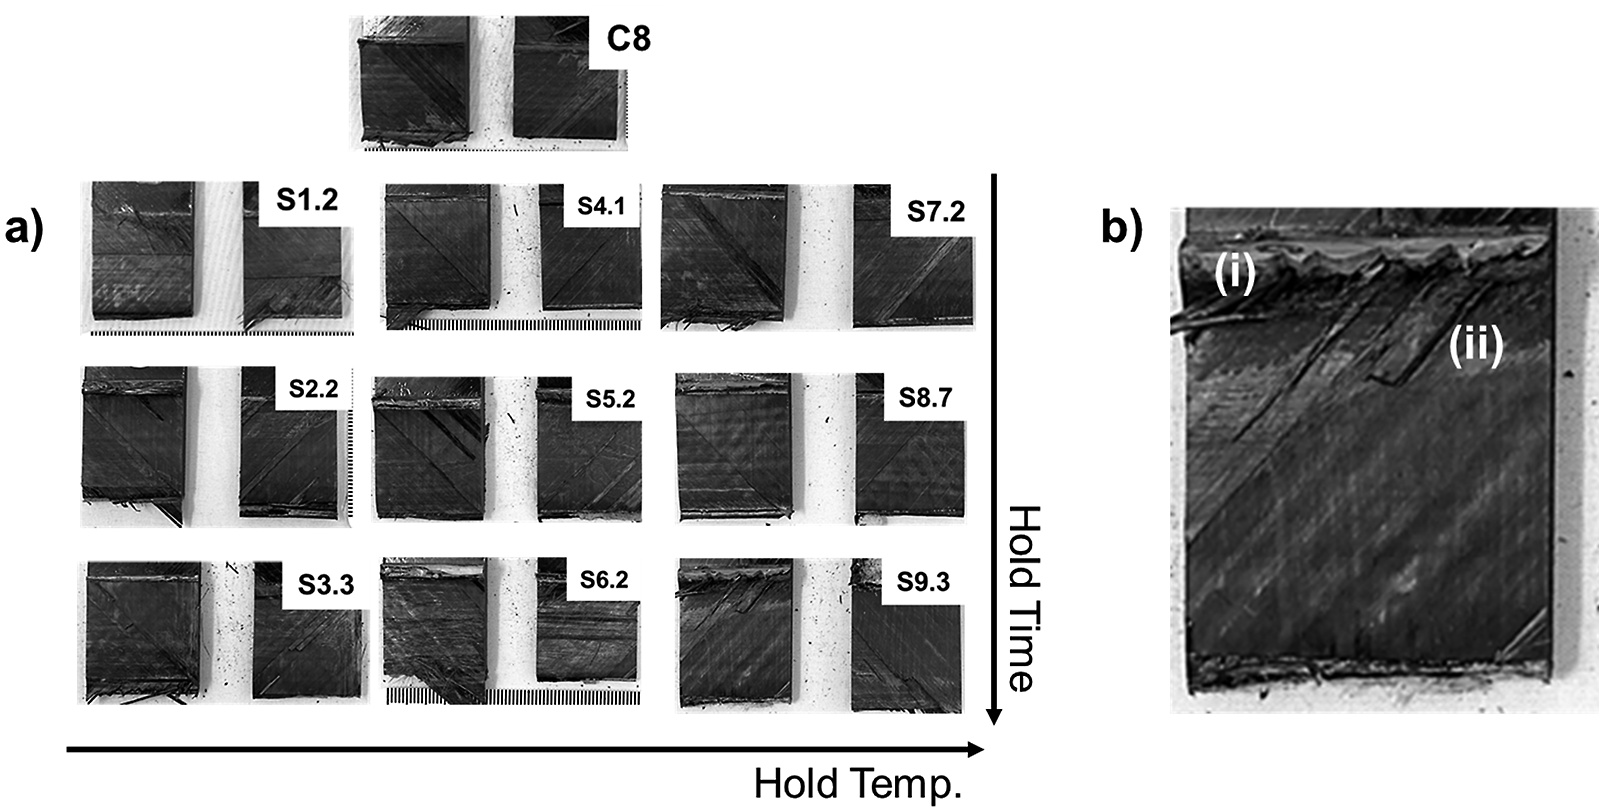
All samples showed evidence of sufficient fusion joining, as plies from each side of the weld were present on both failure surfaces. Dry fibers were observed in some replicates which could be alleviated by increasing pressure during joining process steps. Extended time in the melt during fusion joining encouraged polymer flow as vacuum pressure was applied. At longer hold times/temperatures an increase in PPS polymer “squeeze out” from the composite panel occurred and a clear color change in the polymer was observed. This phenomenon was most prominent for sample S6 and S9, which were thermally treated at 320°C and 340°C for 60 min. S6 showed more squeeze out compared to S9, as the PPS in the S9 sample is higher viscosity due to the formation of a non-linear polymer architecture. PPS squeeze out was not observed in the panels prior to fusion joining. Fracture surface analysis provided evidence of sufficient fusion joining during the autoclave process, which resulted in cohesive failure in all samples.
Conclusions
In this work, the effects TPC melt processing parameters, specifically temperature and time, on PPS/CF fusion joint strength were tested by preparing PPS/CF panels with varied thermal history. In tandem, the melt viscosity and crystallinity of the PPS matrix throughout TPC manufacturing were measured using SAOS rheology and DSC after each sequential process step to capture macromolecular-level chain dynamics and correlate results to the composite fusion joint strength on the continuum level. SLSS negatively correlated to temperature and hold time associated with thermal treatment. Fracture analysis of tested SLS specimens revealed a cohesive failure mode at the joint interface of all specimens despite thermal treatment. The resulting SLSS of PPS/CF was determined to be tethered to polymer viscosity as it illustrates the ability of PPS chains to diffuse across the weld line during fusion joining process steps. Exposing PPS to melt state conditions, especially oxidative environments, induces more complex polymer architectures such as branched chains and cross-linked structures which are less likely to form strong entanglements during joining due to restricted motion. Efforts to reduce peak temperature and total time, in the melt state during PPS/CF TPC manufacturing should be made a priority to maintain sufficient fusion joint strength of TPC parts.
Supplemental Material
Supplemental Material - Thermal history dependent rheology, crystallization, and fusion joint strength of polyphenylene sulfide/carbon fiber thermoplastic composites
Supplemental Material for Thermal history dependent rheology, crystallization, and fusion joint strength of polyphenylene sulfide/carbon fiber thermoplastic composites by Lina N Ghanbari, Joseph P Previte, Jeffrey S Wiggins and Olivia D McNair in Journal of Thermoplastic Composite Materials
Footnotes
Acknowledgements
Synthetic Design Synthesis of ‘Thermoplastic UD Tape-based, Fastener-free assemblies’ for Urban Air Mobility Vehicles; Atoms-to-Aircraft-to-Spacecraft. The authors wish to acknowledge Solvay Materials for the kind donation of PPS. Fusion joining and subsequent mechanical testing was performed by the Smart State Center for Multifunctional Materials and Structures (MFMS) at the University of South Carolina McNAIR center.
Declaration of conflicting interests
The author(s) declared no potential conflicts of interest with respect to the research, authorship, and/or publication of this article.
Funding
The author(s) disclosed receipt of the following financial support for the research, authorship, and/or publication of this article: This research was partially supported by the National Aeronautics and Space Administration (NASA) under the University Leadership Initiative program; grant number 80NSSC20M0165.
Supplemental Material
Supplemental material for this article is available online.
References
Supplementary Material
Please find the following supplemental material available below.
For Open Access articles published under a Creative Commons License, all supplemental material carries the same license as the article it is associated with.
For non-Open Access articles published, all supplemental material carries a non-exclusive license, and permission requests for re-use of supplemental material or any part of supplemental material shall be sent directly to the copyright owner as specified in the copyright notice associated with the article.