
Abstract
This study investigated an anomalous frequency shift observed in collected spectra from an inline monitoring system based on guided ultrasonic waves, with the changing flow rate of an extrusion compounding process for fiber-reinforced thermoplastics. Three possible process parameters to explain the ultrasonic peak shifting, namely melt temperature, velocity, and fiber length were evaluated. The unlikely potential of a doppler moment due to melt velocity, was readily dismissed in the analysis since fluid flow through the die was too slow and while resonance frequency variation may be possible from the related fiber damage associated with increasing flow rates, there was insufficient physical evidence of this anticipated effect in this study. Melt temperature variation associated with viscous dissipation was concluded to be the dominant cause for the frequency shifting noted in the acoustic spectra. The changes in material temperature through which the sound travelled were varying the extent and frequency of the dispersion modes in the polymer melt. These findings are new guidance to processors on setting up a system using active ultrasonics for in-line monitoring in the polymer composites industry.
Keywords
Introduction
Polymer composite materials offer designers and engineers with a novel capability of mass producing complex, lightweight parts meant for structural application in place of metals. The ability to reinforced inexpensive and chemically inert polymer matrices with readily available short- or long-length fibers has increased demand for composite materials in the automotive, aerospace and energy sectors. 1 With their increased use in manufacturing, the anisotropic nature of these fibers within a polymer matrix add new challenges that need addressing like developing reliable quality assurance tools for these composite materials.
The use of sound waves to non-destructively quantify materials has been used for decades. 2 The ability to assess a material and obtain information related to its structural integrity, without the need to destroy it, is invaluable for parts intended to remain in service or too high in value to be used in quality assurance during production, for example. Ultrasonic waveforms are commonly considered for this non-destructive testing to minimize ambient interference, being used in a variety of engineering fields to characterize the integrity of materials, such as concrete or polymers, from their exposure to aggressive environments.3,4 One driving factor in implementing non-destructive acoustic monitoring techniques in manufacturing right now is the shift towards industrial digitization. This philosophy requires inline or online sensors used on either batch or continuous processes and often demand integrating very large data sets with computational models to monitor material properties in real-time and, when necessary, adjust the process before substantial off-spec product is generated as waste. There are a variety of technologies that can be utilized for monitoring, including ultrasonic transducers which are the focus of this paper.5–8 The benefits of using ultrasonic transducers for advanced manufacturing applications is their low capital cost relative to other methods, and ease of integration with current manufacturing systems.
With regards to the information obtained by ultrasonic sensors, the recorded sound waves can be expressed in either the time-domain, as an amplitude-time waveform or in the frequency-domain as an amplitude-frequency spectra. There is a great amount of literature on time-domain analysis, where artifacts within a material can be observed, localized density changes can be monitored, and the underlying composition of a material can be determined.9–12 The frequency domain is considered to contain a dense collection of unique data that has been previously disregarded in real-time acoustic monitoring due to the complexity of postprocessing the obtained signals. However, with less expensive computational power now available and the new ability to remotely access data in the cloud, the handling and storage issues with large datasets associated with the frequency-domain are now more feasibly analyzed using computational non-linear models. Furthermore, passive and active testing is possible where acoustic emissions associated with the rapid release of energy within a material are detected in the passive case, 13 or an acoustic sensor emits propagating waves of predetermined frequencies that are subsequently monitored in the active case. 14 Distinctive information can be obtained about the material in question using an active method, such as predicting the fiber orientation in composite materials, observing crack propagation within materials, monitoring polymer flow, or quantifying the degree of polymerization during production.14–16
For frequency domain bulk assessment of single- or multiple-material properties arising from a continuous process, a novel area of focus is the integrity of received signals during in-line monitoring. This concern arose while translating a newly developed active ultrasonic method from benchtop 14 to a continuous extrusion system where the authors noticed frequency shifts of spectral peaks in the detected signals while studying process variables despite the highly unlikely case of doppler shifting. The purpose of this study was to first verify the observed frequency shifting was a physical attribute of the glass-fiber polypropylene compounding process rather than being an artifact of data collection/processing and then to understand the cause for the phenomenon. The goal of the study was to devise guidance on using in-line active ultrasonic monitoring for polymer composite processing applications.
Materials and methods
Materials
The chosen resin was an extrusion-grade HL781G isotactic polypropylene (LyondellBasell; Texas, USA) supplied in pellet form. Chopped glass fibers with sizing applied for polyolefin applications were supplied from Dow-Corning for reinforcement. The fibers had an average fiber length and diameter of 4 mm and 14
Composite preparation
An 18 mm 40 L/D co-rotating intermeshing twin screw extruder (Leistritz Extrusion Technology; New Jersey, USA) was used to compound the different composite formulations (0–40% fiber loading). The screws were designed to allow adequate wetting and mixing of the fibers into the polypropylene melt, as seen in the supplementary documentation, Figure S1. Each composite formulation was fed into the extruder at varying mass flow rates ranging from 0.50 to 2.00 kg/h. The screw speed was set to 100 RPM. The temperature inside the extruder barrel of Zone 1 was maintained at 180°C with the other zone temperatures, Zones 2 to 6, set to 225, 230, 230, 245, 245 and 220°C respectively. The slit die with 40 mm (W) × 2 mm (H) opening was used to prepare sample tapes, with its temperature set to 210°C. The extrudate was pulled from the extruder and air cooled, resulting in a tape with an average width of 34.31 mm and thickness of 1.86 mm. Melt temperature of the polymer was monitored continuously using a FLIR E5 thermal camera (FLIR, Oregon, USA) positioned at the outlet of the die. The melt temperature measurement was intermittently validated with a thermocouple immersed into the extrudate melt.
Fiber length distribution
Solidified extruded tapes collected at 80 and 320 mm/min melt velocities (corresponding to mass flow rates of 0.5 kg/h and 2 kg/h) for polymer composites with 10 wt% or 40 wt% glass fiber content, were cut to 2.54 cm lengths for ashing. These fiber weight fractions and velocities were chosen to observe the fiber length distribution spanning the lowest and highest shear stress conditions of the trials. Ashing was conducted in a Sentry Xpress 4.0 furnace (Paragon, Texas, USA) preheated to 600°C, with samples in ceramic dishes placed within 1 hour to remove all organics. The collected fibers were spread out on a glass slide and imaged with a VistaVision optical microscope (VWR International, Pennsylvania, USA). Multiple cut lengths of a sample were evaluated by this approach until a minimum of 1000 fibers could be measured; fiber lengths in the images were measured using ImageJ software (National Institute of Health, USA). An example microscopic image used for measurement is shown in the supplementary documentation, Figure S2. Repeated trials for two conditions were assessed for uncertainty: 10 wt%/80 mm/min and 40 wt%/320 mm/min. A probability density function (PDF) and a cumulative distribution function (CDF) were fit to the measured fibers to better articulate the distribution; the non-parametric ( Representation of the fiber length distributions. (A) is the probability density function using a 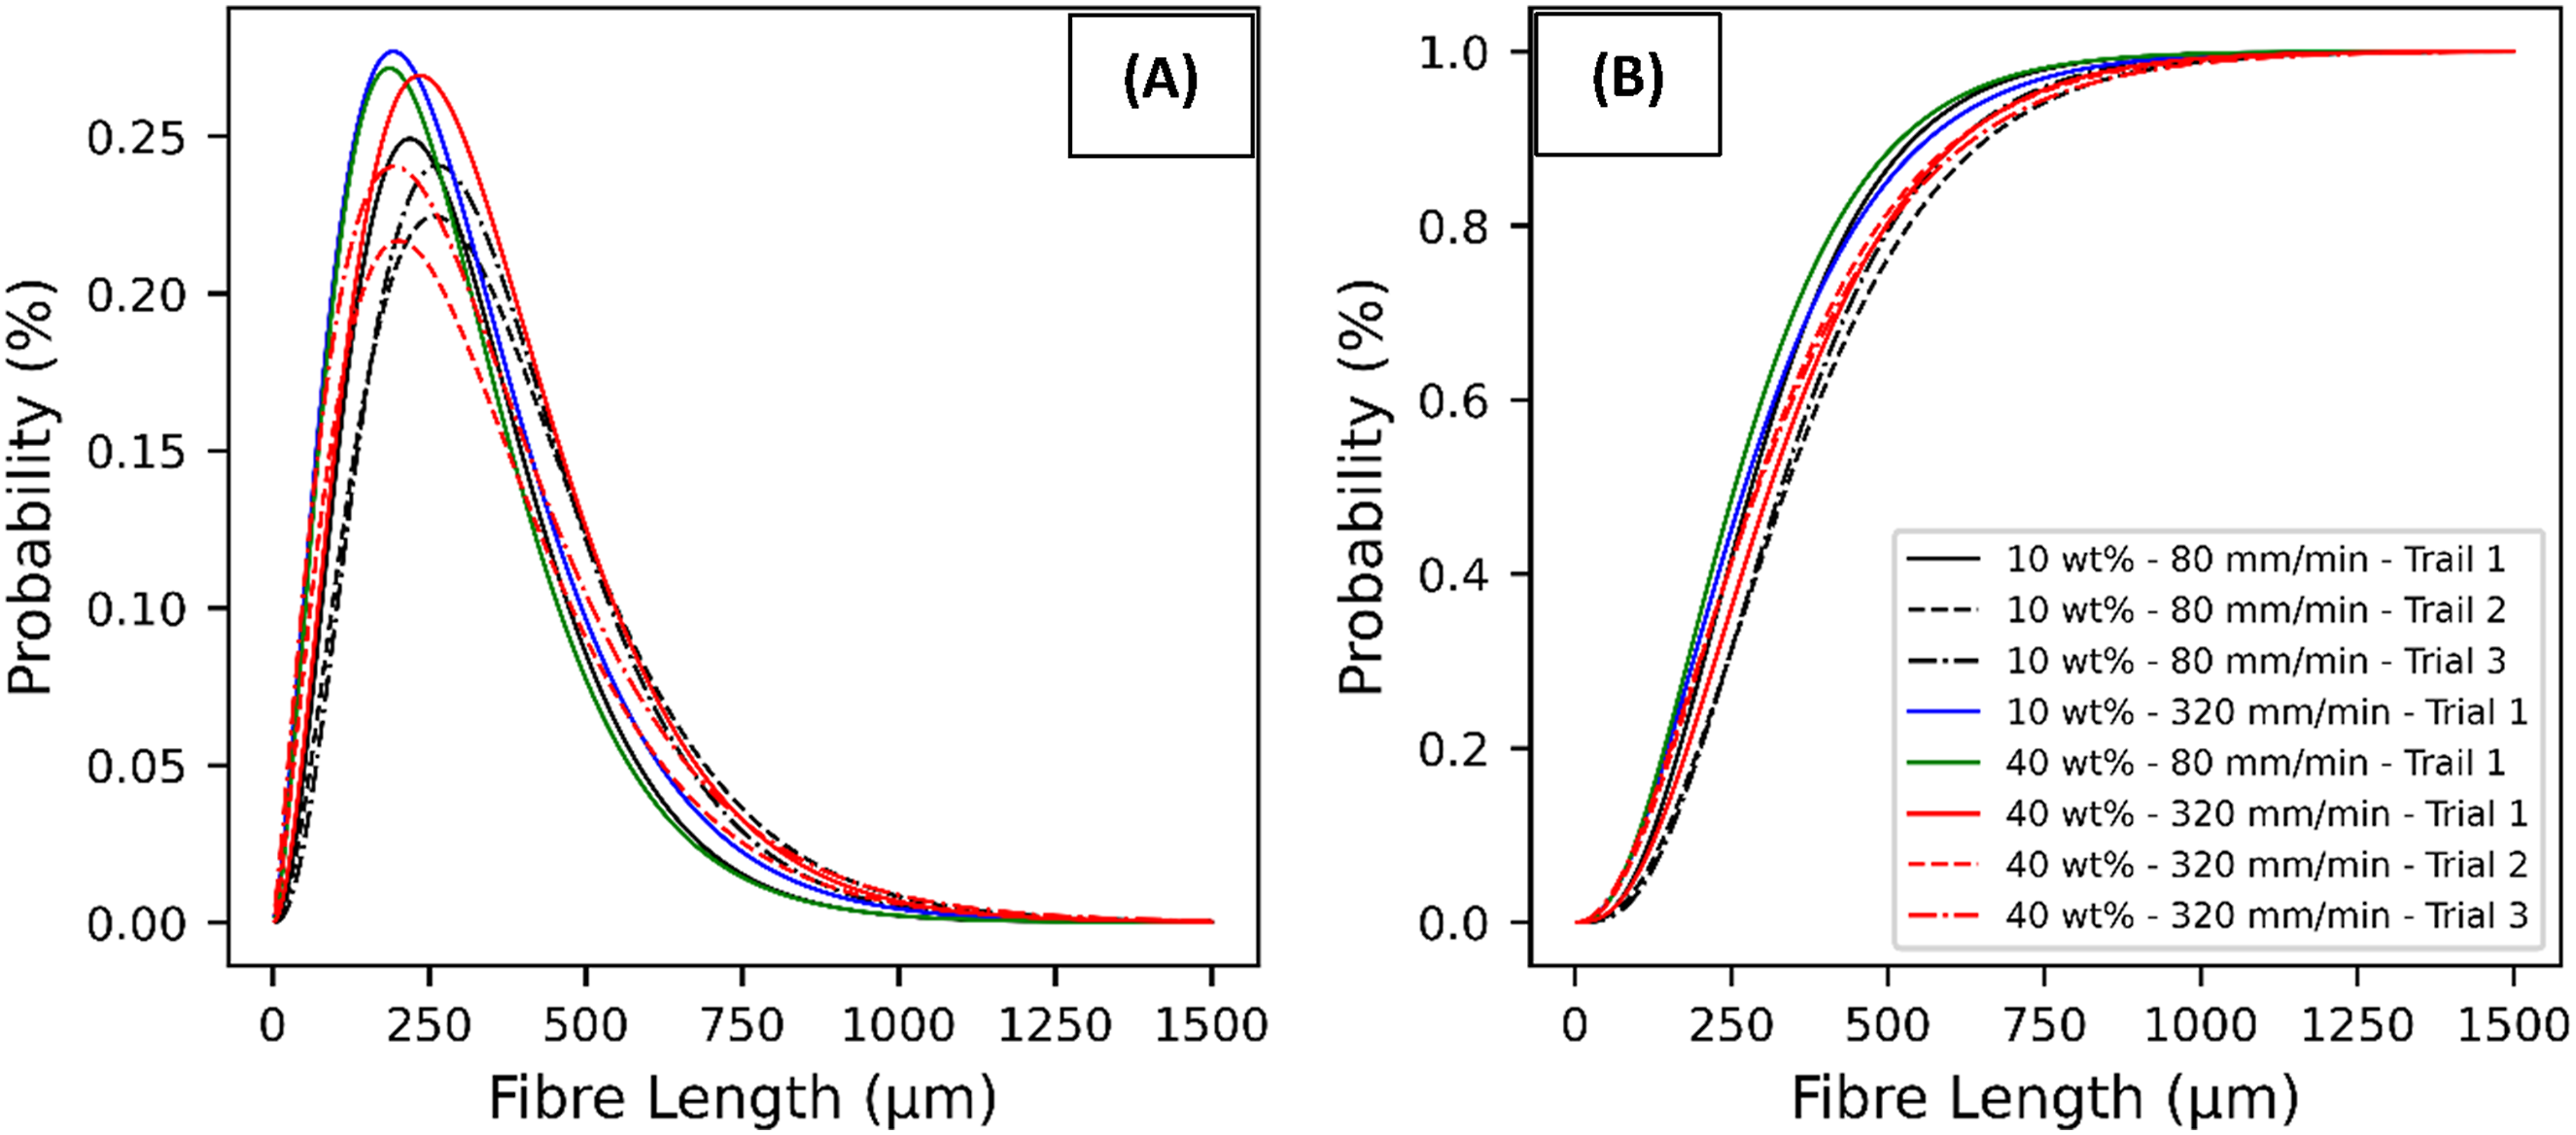
Acoustic setup
The monitoring method used active ultrasonics which was adapted from previous work for composite fiber orientation analysis.
14
An emitter (resonant type, R15 Custom acoustic die for 18-mm twin screw extruder. (A) is die setup with the acoustic system. The emitting sensor (1), coupled to a PEEK buffer rod (2) with silicon vacuum grease transmits the ultrasonic signals through the composite melt within the die (3) towards the second PEEK buffer rod (4) which transmits the signal to the receiving sensor (5). The die is a circle-to-slit die, with the polymer exiting as a rectangular tape. (B) is the Autodesk Inventor drawing for the die with the associated measurements. All values report are in mm.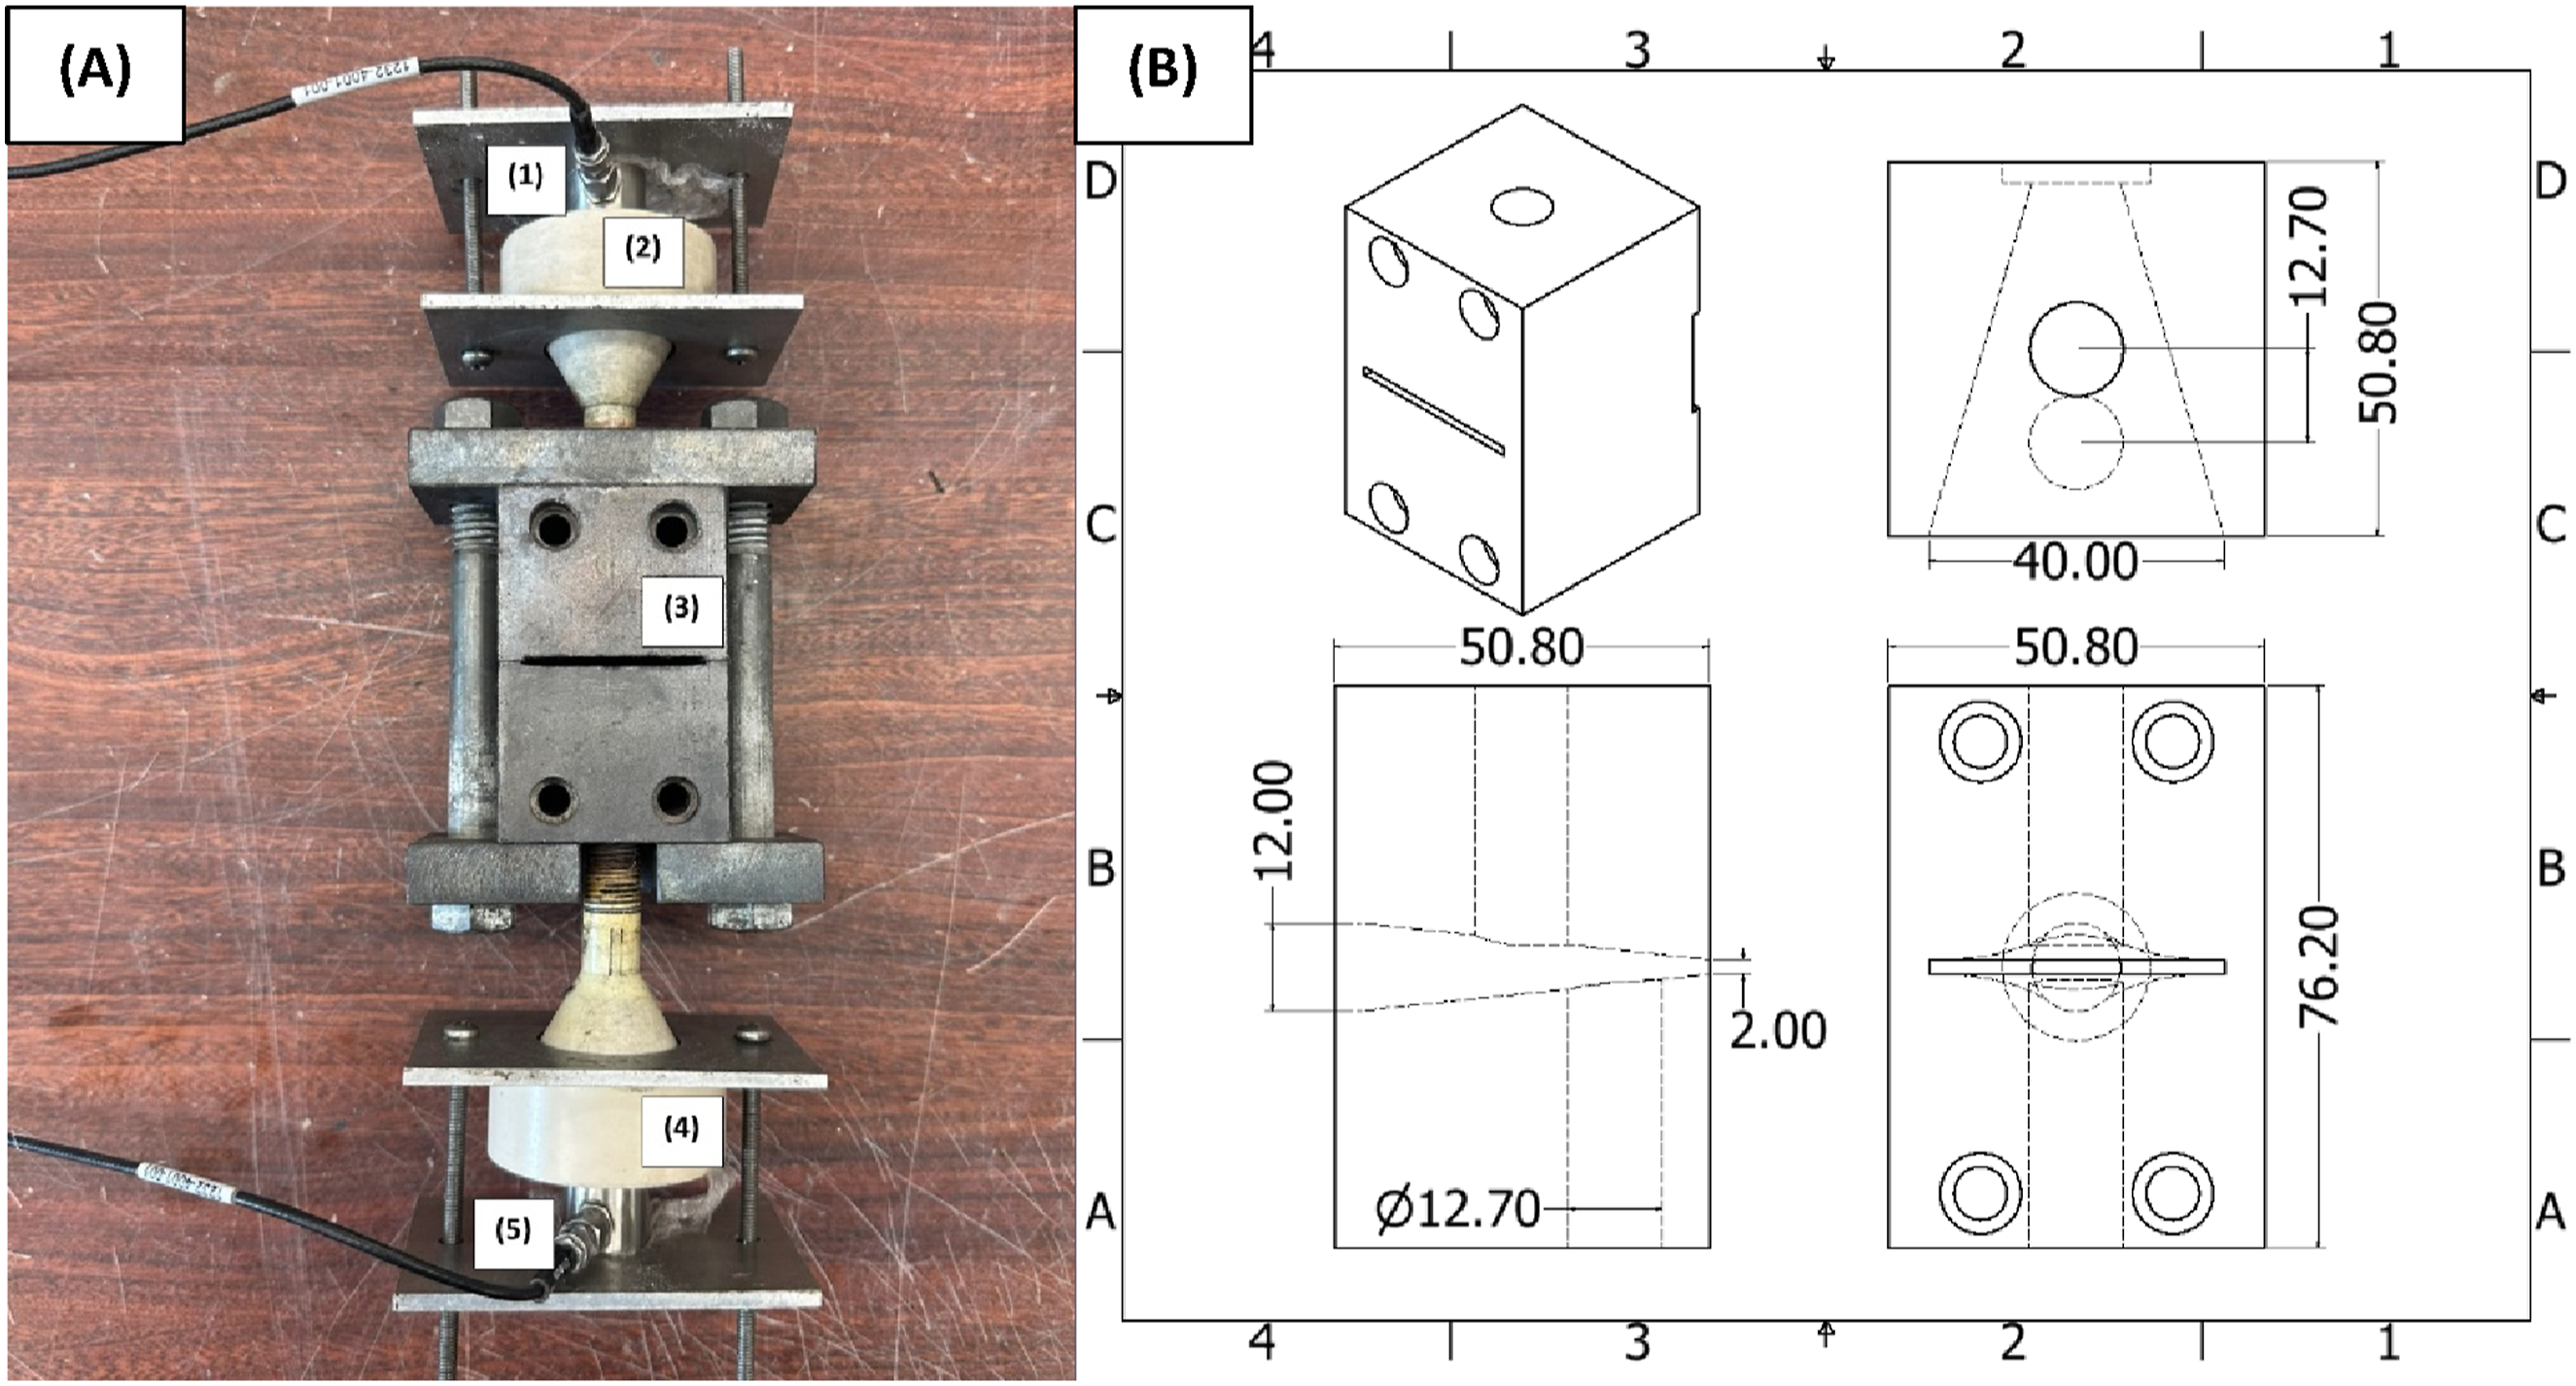
Ultrasound signal analysis
The results of the statistical analysis discussed in the statistical methods section indicated clear differences in the spectrum exist for each weight fraction. The spectrum at each melt velocity was plotted to determine if any trends/ changes in the frequency domain could be identified. It appeared by this analysis that only distinctive peaks within the spectrum were consistently changing with increasing melt velocity and not by changes in fiber content. Some of those distinctive peaks were shifting towards higher frequencies while others were shifting towards lower frequencies, with increasing melt velocity. A Python script using the SciPy ‘find peaks’ function was developed to seek the frequency bands varying uniquely in the extruded composite melt. The script identified the frequency and amplitude of local maxima (peaks) in the spectrum of collected signals from trials varying fiber content and melt velocity. This analysis was independent from the PCA analysis as the entire spectrum was analyzed to identify and select peaks. This peak selection is demonstrated in Figure 3, where the identified peaks found by the script are marked with an ‘x’. A distribution of the frequency values for the located peaks were made for each fiber content where the y-axis was the number of peaks identified and the x-axis being the spectrum frequency. This resulted in a multimodal distribution consistently appearing for each fiber content. These multimodal distributions were compared based on fiber content to identify which frequencies and frequency bands were consistently identified as a peak by the script. Instead of using the exact frequency for the peak, the surrounding regions (frequency bands) that were consistent in every fiber content were identified as distinctive peaks. Peaks only seen for one fiber content but not the others were not included for analysis. As a result, twelve peaks were identified as varying with melt velocity for all the different fiber contents examined, at 222–227 kHz, 227–229 kHz, 229–232 kHz, 232–235 kHz, 235–240 kHz, 240–244 kHz, 252–255 kHz, 258–261 kHz, 261–264 kHz, 264–266 kHz, 266–269 kHz and 269–272 kHz. Determined frequency peaks shown with X, identified for an extruded FFT signal. The threshold line can be seen, which limits the script from identifying any peaks below the associated amplitude range. The Y-axis represents the signal amplitude (a.u.), the X-axis represents the frequency (kHz).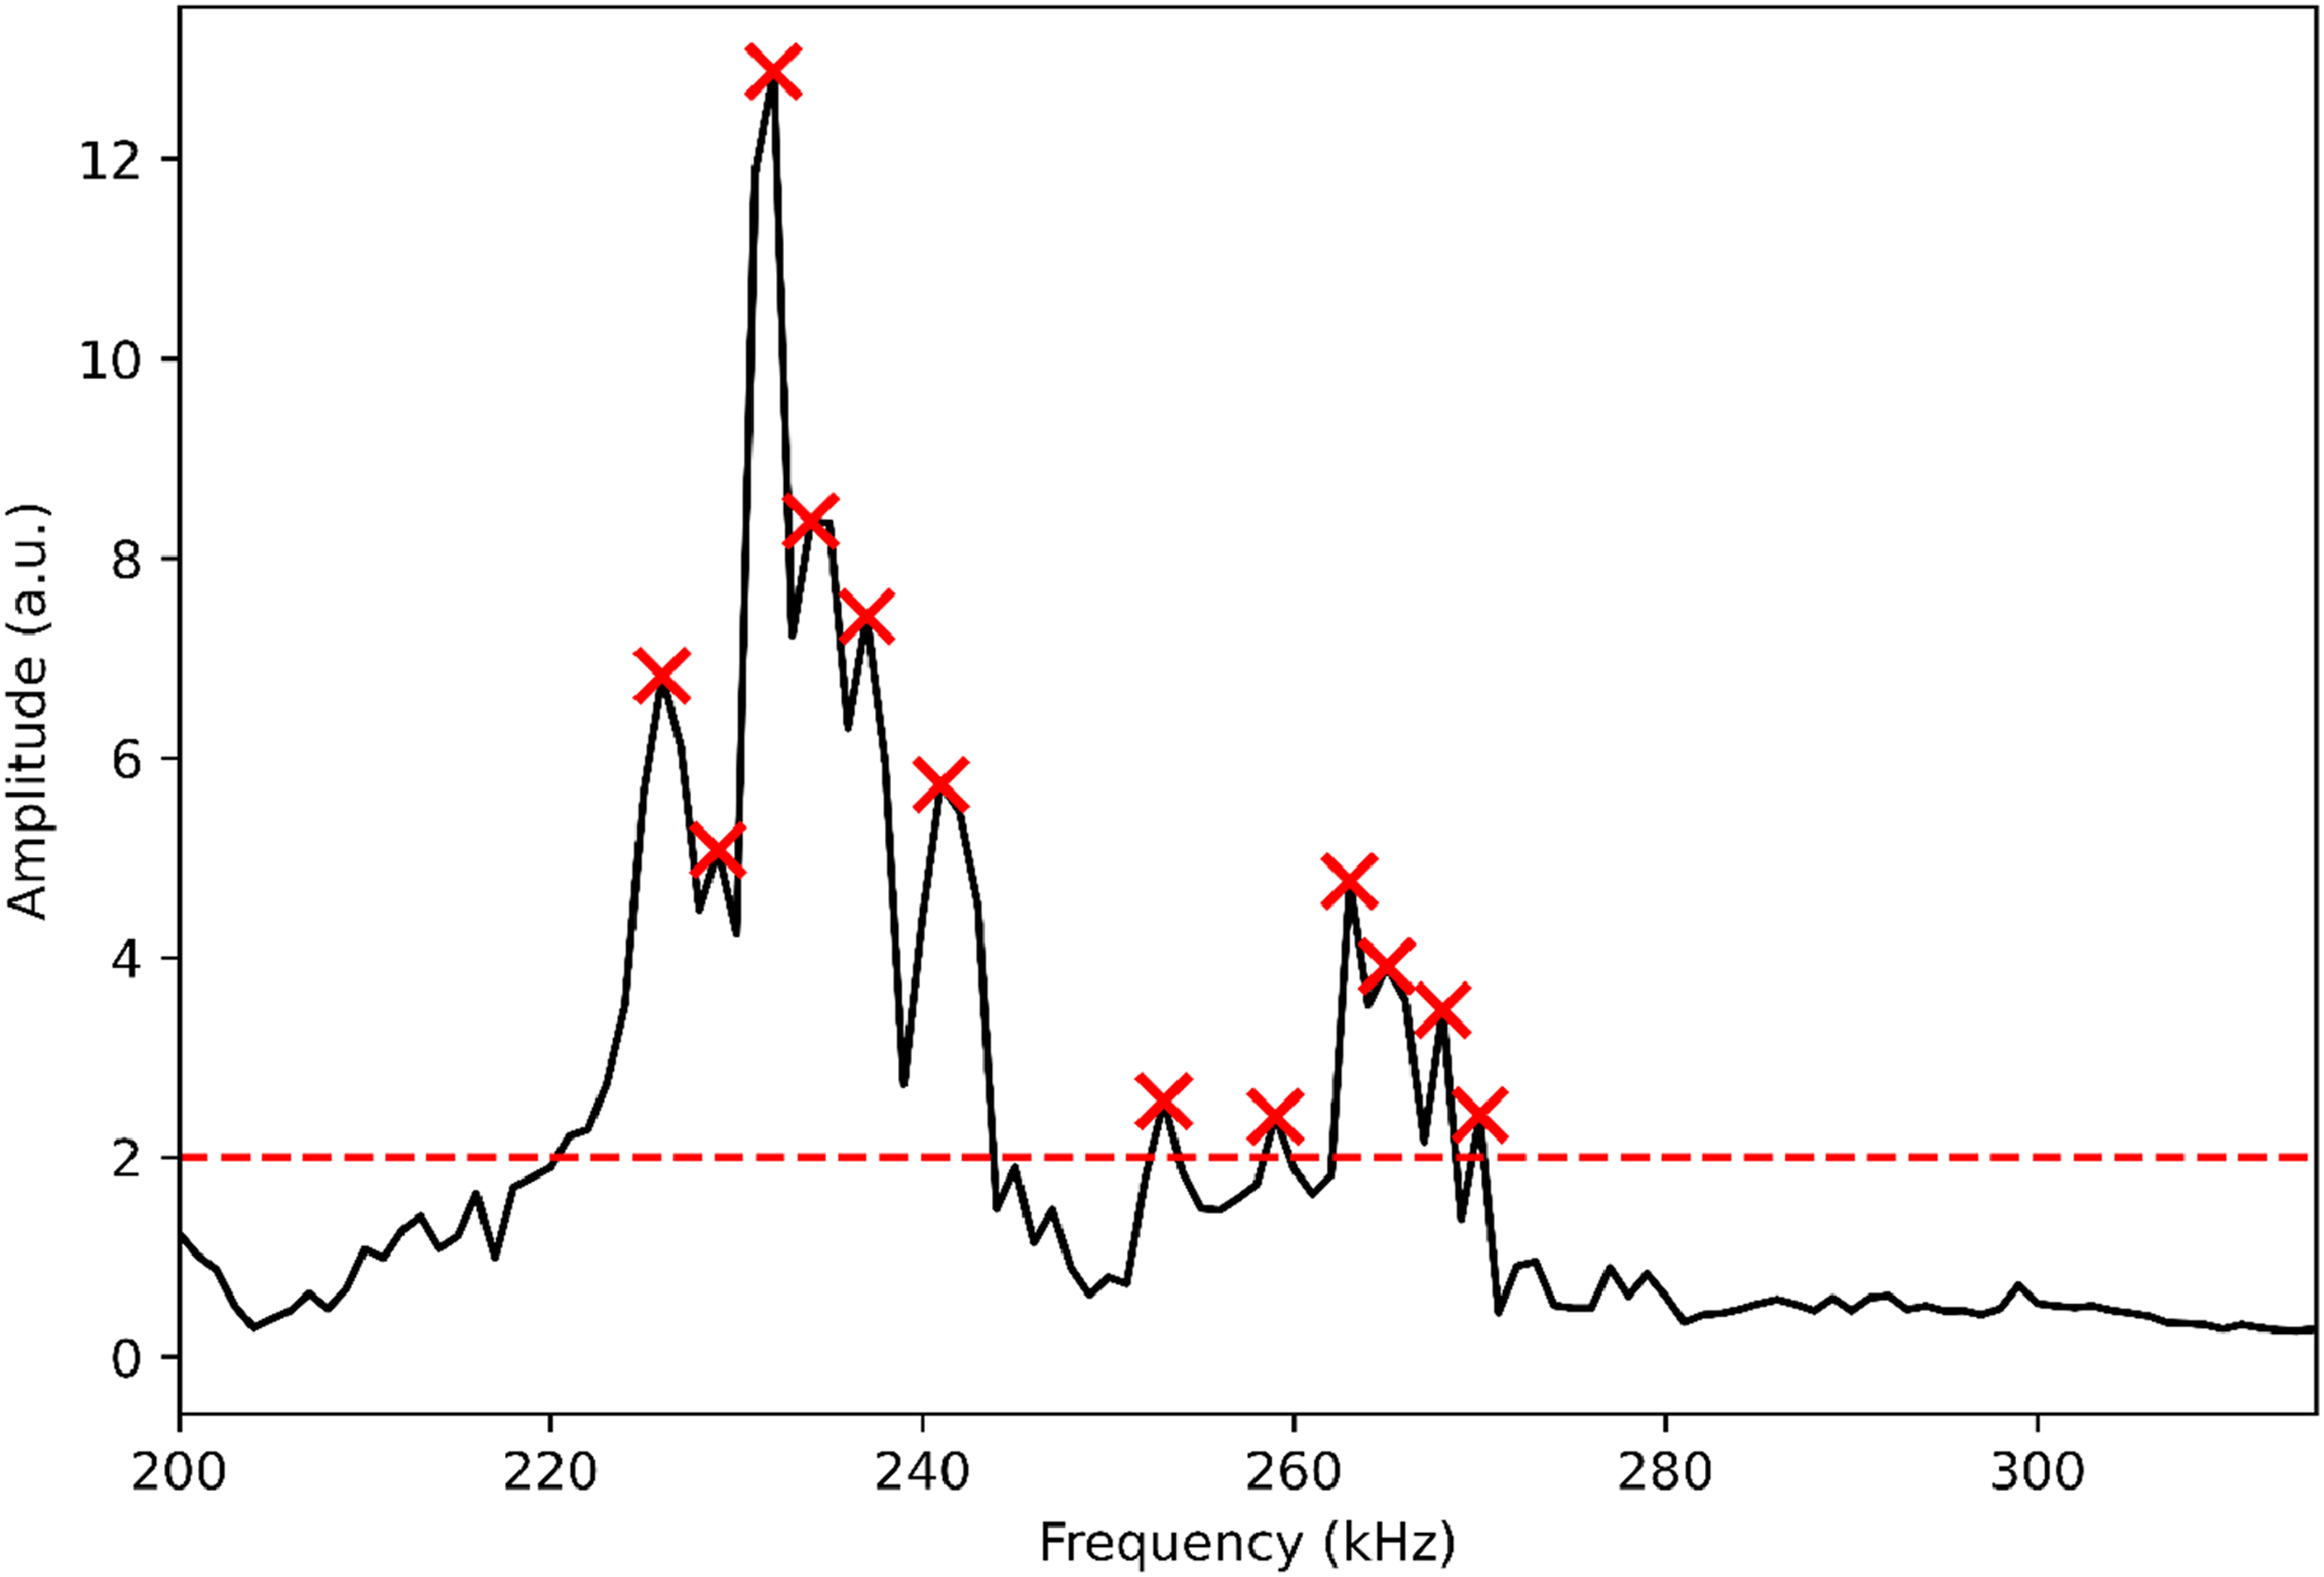
Dispersion mode determination
An important calculation for conducting acoustic monitoring is the calculation of dispersion modes. In all materials there exist frequencies where the propagated acoustic waves travel with limited resistance through the material medium. The mechanical waves force the material to expand/contract as they travel throughout the medium, being highly dependent on the moduli and density of the material components. Crystalline structures with compact internal structures limit the expansion / contraction caused by the wave, allowing propagation much faster through the medium while amorphous content experience more changes, slowing down the mechanical wave. This is not a linear relation, as various bending modes, either symmetrical or antisymmetrical, exist within the ultrasonic domain. The acoustic dispersion curves were calculated to display the phase velocity at various frequencies within the polymer melt; this velocity is the rate at which waves propagate through materials at various frequencies. Plotting these curves provided an understanding about which dispersion mode(s) were associated with the peaks being monitored in this study. The calculations were done using the open-sourced Lamb-Wave-Dispersion Python package (Version 0.0.0).
17
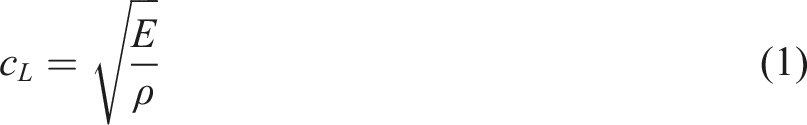
To calculate the dispersion modes, the melt channel thickness, h, longitudinal speed of sound c
L
and transverse speed of sound c
S
were required. These speeds of sound were calculated using the theoretical elastic modulus E, shear modulus G and density

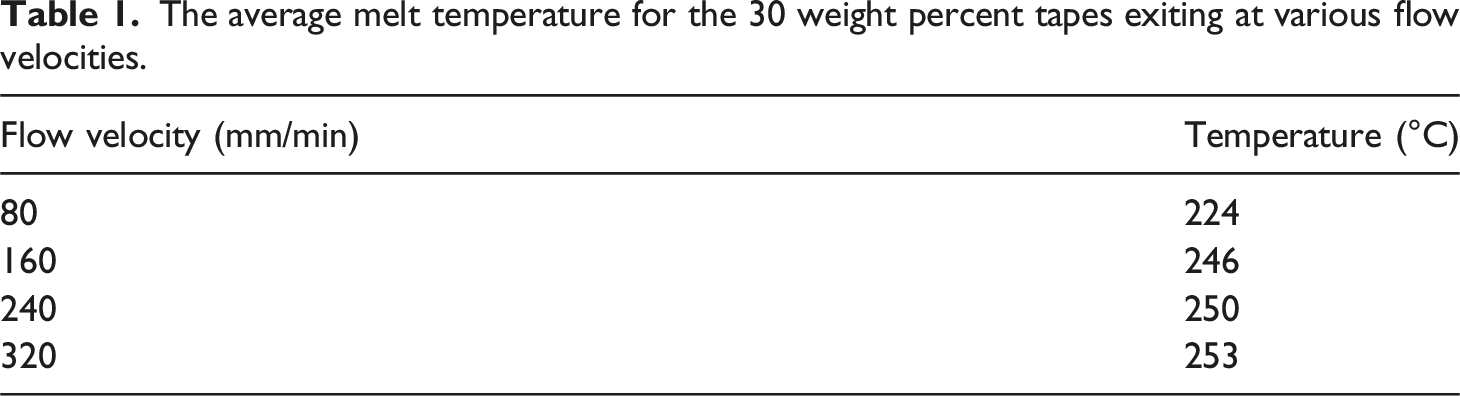
The average melt temperature for the 30 weight percent tapes exiting at various flow velocities.
Examples of calculated dispersion curves are shown in Figure 4, plotted alongside an acoustic spectrum collected at the die for the exiting composite melt, where both the antisymmetric (A4, A5) and symmetric (S3, S4) modes phase velocities are seen at the respective frequency range. Simulated dispersion mode results for increasing melt temperature caused by changing melt velocity, plotted with an extruded FFT signal. The dashdot lines ( for 224°C,
  for 246°C,
  for 250°C and
  for 253°C. The arrows indicate the transition of the modes as the melt temperature changes, changing the frequencies of the dominant modes.
Statistical methods
Several statistical methods were applied in this work using Python. The first method was to identify statistical differences in the fiber length from each operating state in the extruder. The Kolmogorov-Smirnov (KS) similarity test, using the SciPy ‘kstest’ function, was conducted on the CDFs and evaluated against each other. Three KS tests were conducted for each distribution pair; is distribution A different from distribution B
The second method used Principal Component Analysis (PCA) to differentiate frequencies influenced by the fiber content versus melt velocity in the collected spectra. The principal components were calculated using the NumPy library, and the spectral data was mean centered for each frequency band. For each melt velocity, score plots of the first two principal components compared the clustering of results for each extruded fiber content. The score plots, seen in the supplementary figure, Figure S3, displayed the scores for each individual fiber weight fraction clustered separately from one another. The separation of the scores indicated there were clear differences in the spectra for each weight fraction. PCA was also used to determine if the clustering behavior was present for a single plot regardless of melt velocity. The score plot indicated that each fiber weight fraction other than the polypropylene samples were unable to cluster separately, there was a large degree of score overlap occurring. The scores must be separated by melt velocity to clearly demonstrate clustering region.
The third method explored the impact melt velocity had on the peak frequency value. The variability of the peak frequency as the melt velocity changed was calculated using the NumPy library. The variability was calculated for each processing condition and for each peak, and then averaged. The variability was quantified as the standard deviation in peak frequency over the four melt velocities for each of the 12 peaks, assessed for each of the six fiber weight fractions and polypropylene. The calculated variability provided insight into how much the peaks were shifting by this phenomenon with melt velocity to ensure it was not related to experimental variability.
Finally, an analysis of experimental variability was explored through repeated trials over 3 days. There were sufficient time gaps between the 3 days chosen, with the extruder extensively cleaned after each run. Using the NumPy library, the experimental variability was calculated as the standard deviation in peak frequency over the 3 days of repeated trails. For each specific peak and fiber weight fraction that was repeated, the variability over the melt velocity (physical phenomenon) was compared with the variability over the 3 days of repeated trials (experimental uncertainty). The comparisons could yield three conclusions; larger variability in the physical phenomenon indicated that the shifted peak was a systematic issue rather than due to experimental uncertainty; larger variability in the experimental uncertainty would disregard the peak from further consideration; similar magnitudes of variability result in no conclusions to be drawn.
Results
Process-dependent shifting of the mean peak frequency
The acquired acoustic signals that passed through the molten flow field were compared based on the glass fiber weight fraction present and the melt velocity, to determine the effect of these variables on the frequency of each peak under study. To aid in observing trends among the twelve regions determined in the ultrasound signal analysis section, the mean frequency for each respective range was evaluated for a given extrusion condition; this method of using the mean peak frequency was done in a previous work as to manage the large datasets generated by the acoustic sensors.
14
Figure 5 plots each of the twelve determined mean frequencies as polymer melt velocity increased, based on fiber weight fraction. Since the shift behavior with pure polypropylene was distinctly different from the fiber-filled, its variability was separately stated. The averaged variability in frequency shift was ± 0.33kHz for the fiber-filled samples and ± 0.50 kHz for the pure polypropylene samples, matching our observations of the data in Figure 5. Mean frequency position for each of the 12-significant peak ranges (symbols), fitted with a  , the 10 wt % data is indicated in blue
 , the 25 wt % data is indicated in magenta
  , the 30 wt % data is indicated in yellow
  and the 40 wt % data is indicated in black
With specific consideration for fiber content as an influential variable, the peak frequencies were found to be unaffected; the peaks in spectra occurred at the same determined frequencies regardless of fiber content at each velocity. Melt velocity had the only significant impact on the peak frequencies, which is not a previously noted phenomenon in the literature. The shifts in frequency for the baseline sample (0 wt% fiber fraction) were much larger than with fibers present, as mentioned above, especially for the frequency peaks of 227–229 kHz, 229–232 kHz, 232–235 kHz, 258–261 kHz, 264–266 kHz, and 266–269 kHz. Some of the frequency peaks showed greater variability with changing melt velocity than others, notably at 227–229 kHz and 240–244 kHz with both showing a shift to higher frequencies as the melt velocity increased. Other peaks, such as 235–240 kHz and 252–255 kHz demonstrated very little variability with changing melt velocity, where excluding one or two outlier trials, their mean peak frequency remained statistically unchanged in each case.
The possibility of a correlated interaction between fiber weight fraction and melt velocity was considered and not found to be significant. The PCA analysis conducted earlier tested the entire dataset, not just subsets based on melt velocity, and was unable to differentiate the fiber-filled scores as they clustered on top of one another. The inability to differentiate the data without the need to separate based on the melt velocity led to this assertion that there was no interaction to be influencing the frequency shift phenomenon.
The following is an analysis of potential cause, attempting to dismiss all but one explanation for the frequency shifting phenomenon associated with melt processing. Since this phenomenon interferes with accurately correlating acoustic signals with end product properties, the goal was to determine whether, based on cause, the issue could be avoided or simply accommodated.
Discussion
The observed frequency shifting that initiated this study impeded attempts to establish a correlation between material properties and the acoustic signal by an inline monitoring system meant to provide quality assurance for polymer composite manufacturing. Working within the frequency domain is rather attractive for non-destructive monitoring because multiple descriptors of the product can foreseeably be recorded simultaneously if a unique spectral fingerprint can be correlated to each characteristic. This frequency shifting phenomenon, if not compensated, will invariably produce incorrect values from those correlations should changes in flow rate be a normal part of operations, making understanding of the matter important. To understand the phenomenon, three hypotheses were postulated and then explored below. These hypotheses were that (1) melt temperature changes attributed to viscous dissipation influenced the acoustic dispersion mode of the melt; (2) velocity associated changes in the heterogeneous melt composition passing between the two sensors were causing the shift; or (3) the signal was sensitive to shear damage of the glass fibers, notably their length distribution, with varying flow rates. The analyses will show that a changing dispersion mode was the most likely cause for the phenomenon.
Changing dispersion mode
For sound propagation, both the longitudinal and transverse speeds of sound are proportional to the medium (polymer melt) temperature, decreasing as the system temperature increases (which also results in a corresponding decrease in modulus of the medium).18,20,21 Since changing melt temperature would be expected with changing fiber content or polymer melt velocity due to viscous dissipation and an altered shear distribution, 24 the dispersive behavior of the acoustic waves within a polymer melt may explain the shifts in mean frequency seen at the die; dispersive materials experience signal attenuation dependent upon frequency and if this nature was changing, peaks in an acoustic spectrum would appear to shift as a result. To explore this nature as the cause for the peak shifting observed, dispersion curves were first calculated for pure polypropylene over the range of recorded melt temperatures (Table 1). The curves can be seen within the supplementary file in Figure S4. At the lower melt temperature conditions (224°C), associated with faster speeds of sound, a single dispersion mode for the studied spectral region can be identified as the antisymmetric A4 mode. As melt velocity and correspondingly melt temperature increased, the effects of viscous dissipation caused a reduction in the moduli of polymer melt, decreasing the speed of sound. This change in speed caused a shift in the frequencies of the acoustic wave which may easily propagate through the polymer melt to lower values in the analyzed spectral region; in other words, the A4 mode had shifted towards lower frequencies. The impact of the altered modal frequencies appeared to be substantial for most of the recorded frequencies but not all. Of the twelve studied frequency peaks, only four did not indicate any non-linear change to the peak frequency as the melt velocity changed, those being the 222–227 kHz, 235–240 kHz, 252–255 kHz and 261–264 kHz peaks. The lack of change is a result of these frequency regions not being influenced by polypropylene but rather by the glass fibers, which we noted are less dispersive materials than the polymer matrix.
To calculate the dispersion curves in Figure 4 for the fiber-filled composite and then simulate the effect of temperature during processing on the melt, a mixed material approach was used, as described in the dispersion mode determination section; the example of simulated modes shown in the figure corresponded to a glass fiber weight fraction of 30 wt%. This method of calculation captured the combined effects of fiber weight fraction and melt velocity in the dispersion curves. At the lower temperature conditions associated with faster speeds of sound (224°C), the antisymmetric A4 mode was once again identified as the dominant mode for the studied spectral region, with the greatest phase velocity at 234 kHz. Unlike the pure polypropylene modal analysis where only a single mode was present, the symmetric S4 mode was also present at the edge of the spectral region, with the greatest phase velocity being at 267 kHz. The same modal shifts seen in the pure polypropylene analysis were observed for the fiber-filled composite with the frequencies of the modes decreasing as the speed of sound decreased from increasing melt temperature. This shift resulted in two dominant modes. The frequencies of the A4 and S4 modes with the greatest phase velocity would change based on the fiber content, however the behavior of the changing modes would be seen for all extruded materials. Unlike the results with pure polypropylene which had some frequency peaks not experiencing any shift with melt velocity, all twelve peaks displayed notable changes for the fiber-filled results indicating this phenomenon was consistently appearing for all fiber weight fractions. There were some exceptions to this; 10 wt% experienced no shifts for the 264–266 kHz peak; 15 wt% experienced no shifts for either the 232–235 kHz peak nor the 235–240 kHz peak; and 30 wt% experienced no shifts for the 222–227 kHz peak nor the 240–244 kHz peak. The reason why these peaks did not experience this shifting phenomenon can be related back to the modes themselves. These dispersion modes are highly dependent on the speed of sound travelling through the polymer melt and decrease by a fixed rate associated with temperature as discussed in the dispersion mode determination section. Glass is a natural sound insulator and the speed of sound in our glass fibers decreased at a large rate per change in temperature than the polymer, and so acoustic signals propagating became increasingly dampened as glass content increased, making certain peaks appear negligibly affected by this phenomenon.
The greater variation in frequency shifting (based on melt velocity) with pure polypropylene compared to the glass-filled composites can be explained by the number of shifting modes present within the analyzed spectral region; average variation in peak frequency shift was ± 0.33 kHz for the glass-filled composite compared to ± 0.50 kHz for pure polypropylene. The increase in the number of modal descriptors indicates that there will be more frequencies easily propagating through the polymer melt with limited impedance. For the fiber-filled experiments having two modes, one at the lower frequencies and the other at the higher frequencies of the analyzed spectral region, the recorded frequencies will resonate accordingly with those modes. The ∼ 50 % increase in variability for the pure polypropylene compared to the fiber-filled can be related to where the identified peak frequencies are relative to the modal frequencies. The modal frequencies calculated in Figure 4 for the composite indicate that the first six identified peaks were best described by the A4 mode and the final six identified peaks were best described by the S4 mode; when both of those modes shift to the lower frequencies due to viscous dissipation the surrounding peak frequencies to those modes will change. The pure polypropylene experiments only had the singular mode present in the entire analyzed frequency region; all twelve identified peaks were described by the A4 mode. There also is the consideration of the acoustic properties of the glass reducing the degree of variability in the case of the composite. As discussed earlier, the speed of sound for glass decreased at a much larger rate relative to temperature change compared to pure polypropylene and glass is a natural sound insulator, hence signal dampening occurred at the respective peak frequencies for the fiber-filled melt that diminished the system sensitive to melt velocity.
We are acknowledging that this may not fully explain why the shifts are occurring, but it is the best explanation for the changing behavior. The recorded frequencies are highly dependent on the mode, as the frequency of the modes changes the recorded frequencies at each of the individual peaks will change accordingly. There is strong support from this analysis for variation in melt temperature on dispersion modes as the cause for peaks experiencing frequency shifts in our testing. This appears to be a real and novel effect for active acoustic monitoring of continuous processing not previously shown in the literature. However, two other possible effects still need to be considered.
Doppler effects
Doppler effects are more commonly attributed to fast moving objects (e.g., vehicles) but have also been considered in the biomedical field for much slower phenomena such as determining cardiovascular blood flow where velocities more closely match those in our die.25–27 Hence, the second hypothesis explored the possibility of a doppler shift affecting our acoustic signal. Normally, signals demonstrating a doppler shift were collected using a pulse-echo protocol with a single sensor. When the emitter and receiver are separate and not in the same location, the differences in sensor positions need to be accounted for, which causes a bistatic doppler moment.
28
The equation for a bistatic doppler moment is given as:
Changing fiber length distribution
Another hypothesis that was explored was whether shear-dependent fiber breakage, a known issue in twin-screw compounding operations, was correspondingly affecting the acoustic signal; it has been previously shown that glass fiber breakage increases with its increasing weight fraction in a composite during extrusion but also that breakage decreases with increasing melt flow rate.32–35 The screw speed would also have an influence on the fiber length, decreasing the length until a critical fiber length is achieved.34,36 Since the screw speed was maintained at 100 RPM, determining if this critical value was achieved was not explored, and the effects of screw speed were negated. Since the resonance frequency of a glass fiber is inversely proportional to the square of its fiber length, any statistically significant change to the fiber length distribution should change the overall resonance frequency of the glass phase in the melt and possibly impact the detected signal. 14
The fiber length distribution for the trial condition of 10 wt% and 80 mm/min for fiber content and melt velocity, respectively appeared to have longer fibers than those for the 40 wt% and 320 mm/min condition. To test for significance, the KS test described in the statistical methods section was performed on the CDFs. Each of the eight CDFs were compared against one another using three KS tests (different, greater than, less than) to determine if any underlying distributions were statistically different, resulting in 28 × 3 KS tests being conducted. For each of the 84 KS tests, the null hypothesis was only rejected for two repeats at the 40 wt% and 320 mm/min condition for fiber content and melt velocity, respectively. All other distributions spanning the tested range of experiments showed no statistical difference. This may indicate the critical fiber length was achieved, and that the shear forces exerted onto the fibers within the extrusion system were too small to cause further fiber damage.34,36 Based on the near negligible changes in fiber length found, this hypothesis for explaining the frequency shifting was dismissed.
Repeatability
To confirm the observed frequency shifts changing with melt velocity were repeatable physical phenomenon and distinctive from experimental uncertainty, an expanded set of trails was conducted. The compounding of 5 wt%, 25 wt% and 40 wt% fiber loaded blends was repeatedly done over several days in a random order, with two additional melt velocities added at 120 and 200 mm/min included in the testing. The plots for the respective frequency ranges were provided as Supplementary information in Figure S5 where the same shifting phenomenon is seen in comparison to the original trials (the results section). The KS tests for significance found once again that there were no underlying differences in the fiber length distributions, even for the new melt velocity conditions.
A full visual comparison between the two variability sets can be seen in the Supplementary Information in Figure S6. In general, larger variability associated with the physical phenomenon was found for all twelve analyzed peaks recorded during the new trials with the 25 wt% and 40 wt% glass-filled composites. For the 5 wt% glass-filled composite, shifting seen by most peaks in the results section was attributed to the physical phenomenon, however, experimental uncertainty could not be dismissed as an explanation for shifts corresponding to the 264–266 kHz peak; both measures of variability were similar (
In this analysis, the peaks showing high repeatability in the magnitude of shifting over the tested range of melt velocities (and being distinctive from experimental uncertainty) corresponded to those at 229–232 kHz and 261–264 kHz, varying by
Conclusions
Glass fiber reinforced polypropylene composites at different weight fractions was compounded in a twin screw extruder at varying velocities and monitored with active acoustics to develop a quality assurance system for the industry. In the course of the system development, it was observed that the recorded signals changed as flow rate changed, presenting a challenge in correlating frequencies in the monitored signal to material properties. The observed frequency shifts were noticeable in twelve distinct frequency regions. Through analysis of the changing signal under different processing conditions, the shifting phenomenon was attributed to local modulus changes in the polymer melt causing the dominant acoustic dispersive modes to shift towards lower frequencies, influencing the analyzed spectra. These local moduli changes were related to viscous dissipation as the melt velocity increased. This effect was stronger for pure polypropylene compared to the fiber-filled composite due to the glass fibers which dampened the phenomenon. The repeatability in this shifting over multiple trials demonstrated the physical phenomenon was not an artifact of experimental uncertainty.
Supplemental Material
Supplemental Material - Understanding a frequency shifting phenomenon interfering with in-line acoustic monitoring of an extrusion compounding process for polymer composites
Supplemental Material for Understanding a frequency shifting phenomenon interfering with in-line acoustic monitoring of an extrusion compounding process for polymer composites by Austin D Bedrosian, Andrew Hrymak, Gisela Lanza and Michael R Thompson in Journal of Thermoplastic Composite Materials
Footnotes
Acknowledgements
They would also like to thank Paul Gatt and Thomas Wire Die (Burlington, Canada) for aid in developing the extrusion die and PEEK buffer rods; Hassan Abdulhussain, Jierui Jian, Vladimir Gritsichine and Heera Marway for aid during extrusion trials; the International Composite Research Group (ICRG), Dr. Natalia Nikolova and Andy Krbavac for conceptual aid during the studies; and Doug Culley for ashing the extruded tape samples.
Declaration of conflicting interests
The author(s) declared no potential conflicts of interest with respect to the research, authorship, and/or publication of this article.
Funding
The author(s) disclosed receipt of the following financial support for the research, authorship, and/or publication of this article: The authors would like to thank both the NSERC Collaborative Research and Training Experience (CREATE) Program: Advanced Polymer Composite Materials and Technologies No. 401209347 and the Deutsche Forschungsgemeinschaft (DFG, German Research Foundation), project number 255730231, within the International Research Training Group “Integrated engineering of continuous-discontinuous long fiber-reinforced polymer structures” (GRK 2078) for the joint funding of this project.
Supplemental Material
Supplemental material for this article is available online.
References
Supplementary Material
Please find the following supplemental material available below.
For Open Access articles published under a Creative Commons License, all supplemental material carries the same license as the article it is associated with.
For non-Open Access articles published, all supplemental material carries a non-exclusive license, and permission requests for re-use of supplemental material or any part of supplemental material shall be sent directly to the copyright owner as specified in the copyright notice associated with the article.