
Abstract
The current research explores the impact of tool geometry on the drilling performance of carbon fiber-reinforced polypropylene thermoplastic composite. Three distinct tools, namely conventional twist drill (CTD), split point drill (SPD), and brad spur drill (BSD), were used to investigate their geometrical effect on the critical parameters such as drilling temperature (DT), thrust force (TF), exit delamination factor (EDF), and surface roughness (SR). Increasing spindle speed caused the drilling temperature to increase, while increasing the feed rate caused it to decrease. Thrust force increased and decreased in response to increased feed rate and spindle speed, respectively. The exit delamination factor decreased by changing the feed rate from 60 mm/min to 120 mm/min and again started to increase up to 180 mm/min. Surface roughness increased as the feed rate increased from 60 to 120 mm/min and then decreased when the feed rate increased from 120 to 180 mm/min. Drilling with Brad spur tool with a feed rate of 60 mm/min and a spindle speed of 900 rpm provided the optimized result. Compared to the conventional twist drill, the brad spur drill produced 37.72%, 49.53%, 16.67%, and 34.25% less drilling temperature, thrust force, exit delamination factor, and surface roughness, respectively.
Introduction
The current era of advanced technologies mandates composite materials in various industries. Carbon fiber-reinforced polymer (CFRP) composites have gained attention in many sectors like automobile, aerospace, defense, marine, and life sciences due to their exceptional strength-to-weight ratio, anti-corrosiveness, and excellent fatigue properties. 1 Polymeric composites that have thermoplastic as a matrix have extra advantages like recyclability, processability, and enhanced toughness, which makes them potential materials for industries.2–4 Drilling, a primary machining process, creates holes to mechanically join the parts. 5 However, Drilling fiber-reinforced composites is difficult due to the composite’s anisotropy and inhomogeneity and the significant differences in reinforcement and matrix mechanical properties. 6 The abrasive fiber reduces the tool life. 7 During machining, they often lead to defects like delamination, surface irregularities, fiber pull-out, uncut fibers, tool wear, and thermal degradation. 8
Since thermoplastic composites are heat sensitive, their thermal analysis during drilling becomes essential. Ge et al. 9 studied the machining zone and chip temperature during CF/PEEK composite drilling and compared it with CF/Epoxy. For the same input parameters, the thermoplastic composite produced approximately 50% larger thrust force and 99% more temperature than the thermoset one. Xu et al 10 compared the drilling machinability of carbon epoxy thermosetting and carbon/polyimide thermoplastic composite. The thermoplastic composite showed better machinability regarding lower forces, temperature, and hole inaccuracy. Machining responses depend on the level of input parameters. 11 Optimizing the input parameters is one approach to achieving cost-effective, high-quality product manufacturing. Kaushik et al. 12 studied the drilling performance of flax/PP composite considering five different tool geometries. Process parameters were optimized using three distinct techniques, namely, genetic algorithm (GA), particle swarm optimization (PSO), and teaching learning-based optimization (TLBO). All techniques provided almost similar results. Low feed rate and medium spindle speed gave the optimum result for all tool geometries. Mudhukrishnan et al. 13 optimized the drilling parameters for thrust force and torque during the drilling of the CFRP composite. A sensitive analysis was done to identify the most influencing parameter. Thrust force and torque decreased with increased spindle speed due to lessened tool bouncing and increased matrix softening. Both responses first increased with feed rate, but after a certain point, they decreased due to matrix softening. Hole quality depends on drilling techniques and tools.14,15 Debnath et al. 16 used a newly developed tool to improve the hole quality during drilling of GF/epoxy composite laminate. The study revealed that the developed tool produces less thrust force and damage than a conventional twist drill. Krishnaraj et al. 17 used high-speed drilling to make holes in CFRP composite laminate. Spindle speed is the most crucial parameter for the hole circularity, and feed rate is for thrust force, hole size, and exit delamination factor. Xu et al. 18 compared the machinability of two carbon fiber-reinforced thermoplastic composites (CF/PEEK and CF/PI). CF/PEEK showed poor machinability regarding higher forces, temperature, and delamination compared to CF/PI composite but better-quality holes due to the ductility of the PEEK matrix. Lin et al. 19 explored the uncoated brad spur drill for making holes in the CFRP composite. The dominant tool wear was abrasion; no adhesion was found during drilling. During the literature survey, machinability studies on conventional thermoset composites are more readily available than thermoplastic composites. 20
Very few research have been found on the drilling performance of carbon fiber-reinforce polypropylene composite besides the potential to be used in various industries. Exploring the drilling behavior of CFRP thermoplastic composite motivates the current study. The important parameters (tool geometry, feed rate, and spindle speed) were analyzed for the machining responses (drilling temperature, thrust force, exit delamination factor, and surface roughness). Further, the parameters were optimized to get the optimum solution. This research will help identify the optimal conditions of the input parameters to achieve better machinability.
Materials and methodology
Materials
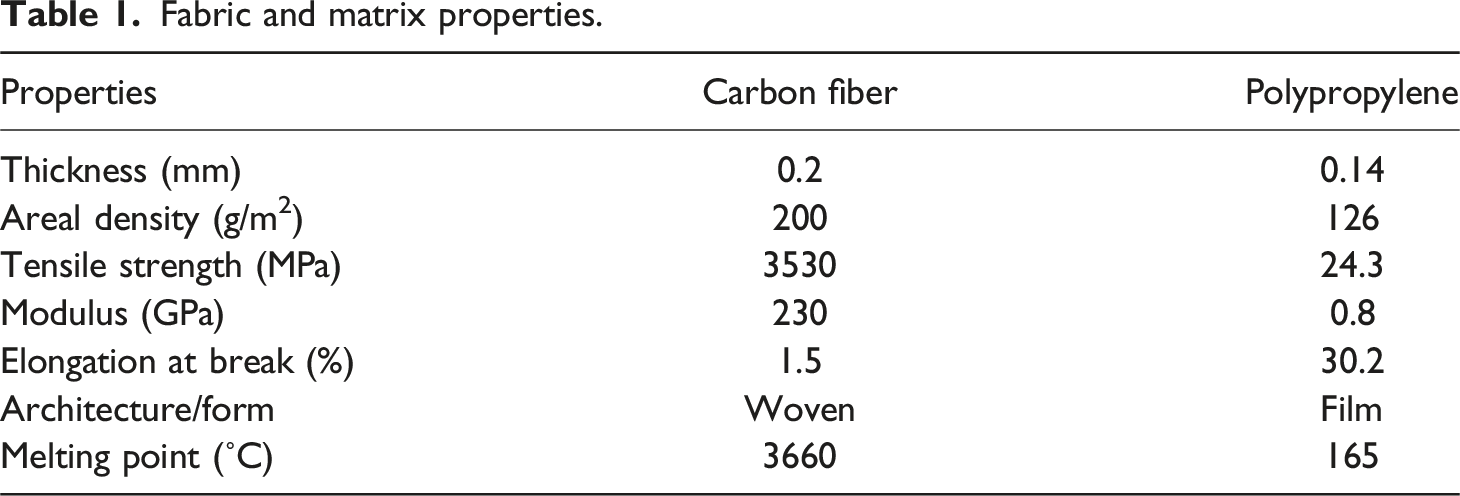
Fabric and matrix properties.
Specimen preparation
The compression molding technique was employed to fabricate the composite laminates. The process involves the application of heat and pressure to the stacked raw materials. Heating decreases the viscosity of the matrix, making it less resistant to flow, while pressure aids in the penetration of the molten matrix into the fibers. The silicone-releasing agent was sprayed on the properly cleaned mold surface before the twenty-one layers of polypropylene matrix and twenty layers of reinforcement were stacked. Polyester films with a melting point of 260°C were applied at the interface between the mold and the composite material to facilitate the easy removal of the laminates after completing the compression molding process. The fibers and matrix were arranged in alternating layers in a closed mold.
The mold was placed into a hydraulic compression molding machine with a capacity of 20 tons (manufactured by SS Air Hydro Power, Delhi). It was subjected to a temperature of 200°C and a pressure of 10 bar for 15 minutes. The composite was cooled to room temperature under a pressure of 10 bar to ensure effective consolidation and dimensional stability. Once the composite laminate had reached room temperature, it was removed from the mold. The entire fabrication process is illustrated in Figure 1. The specimens measuring 110 mm × 110 mm x 4 mm were prepared for the machining study. Fabrication process.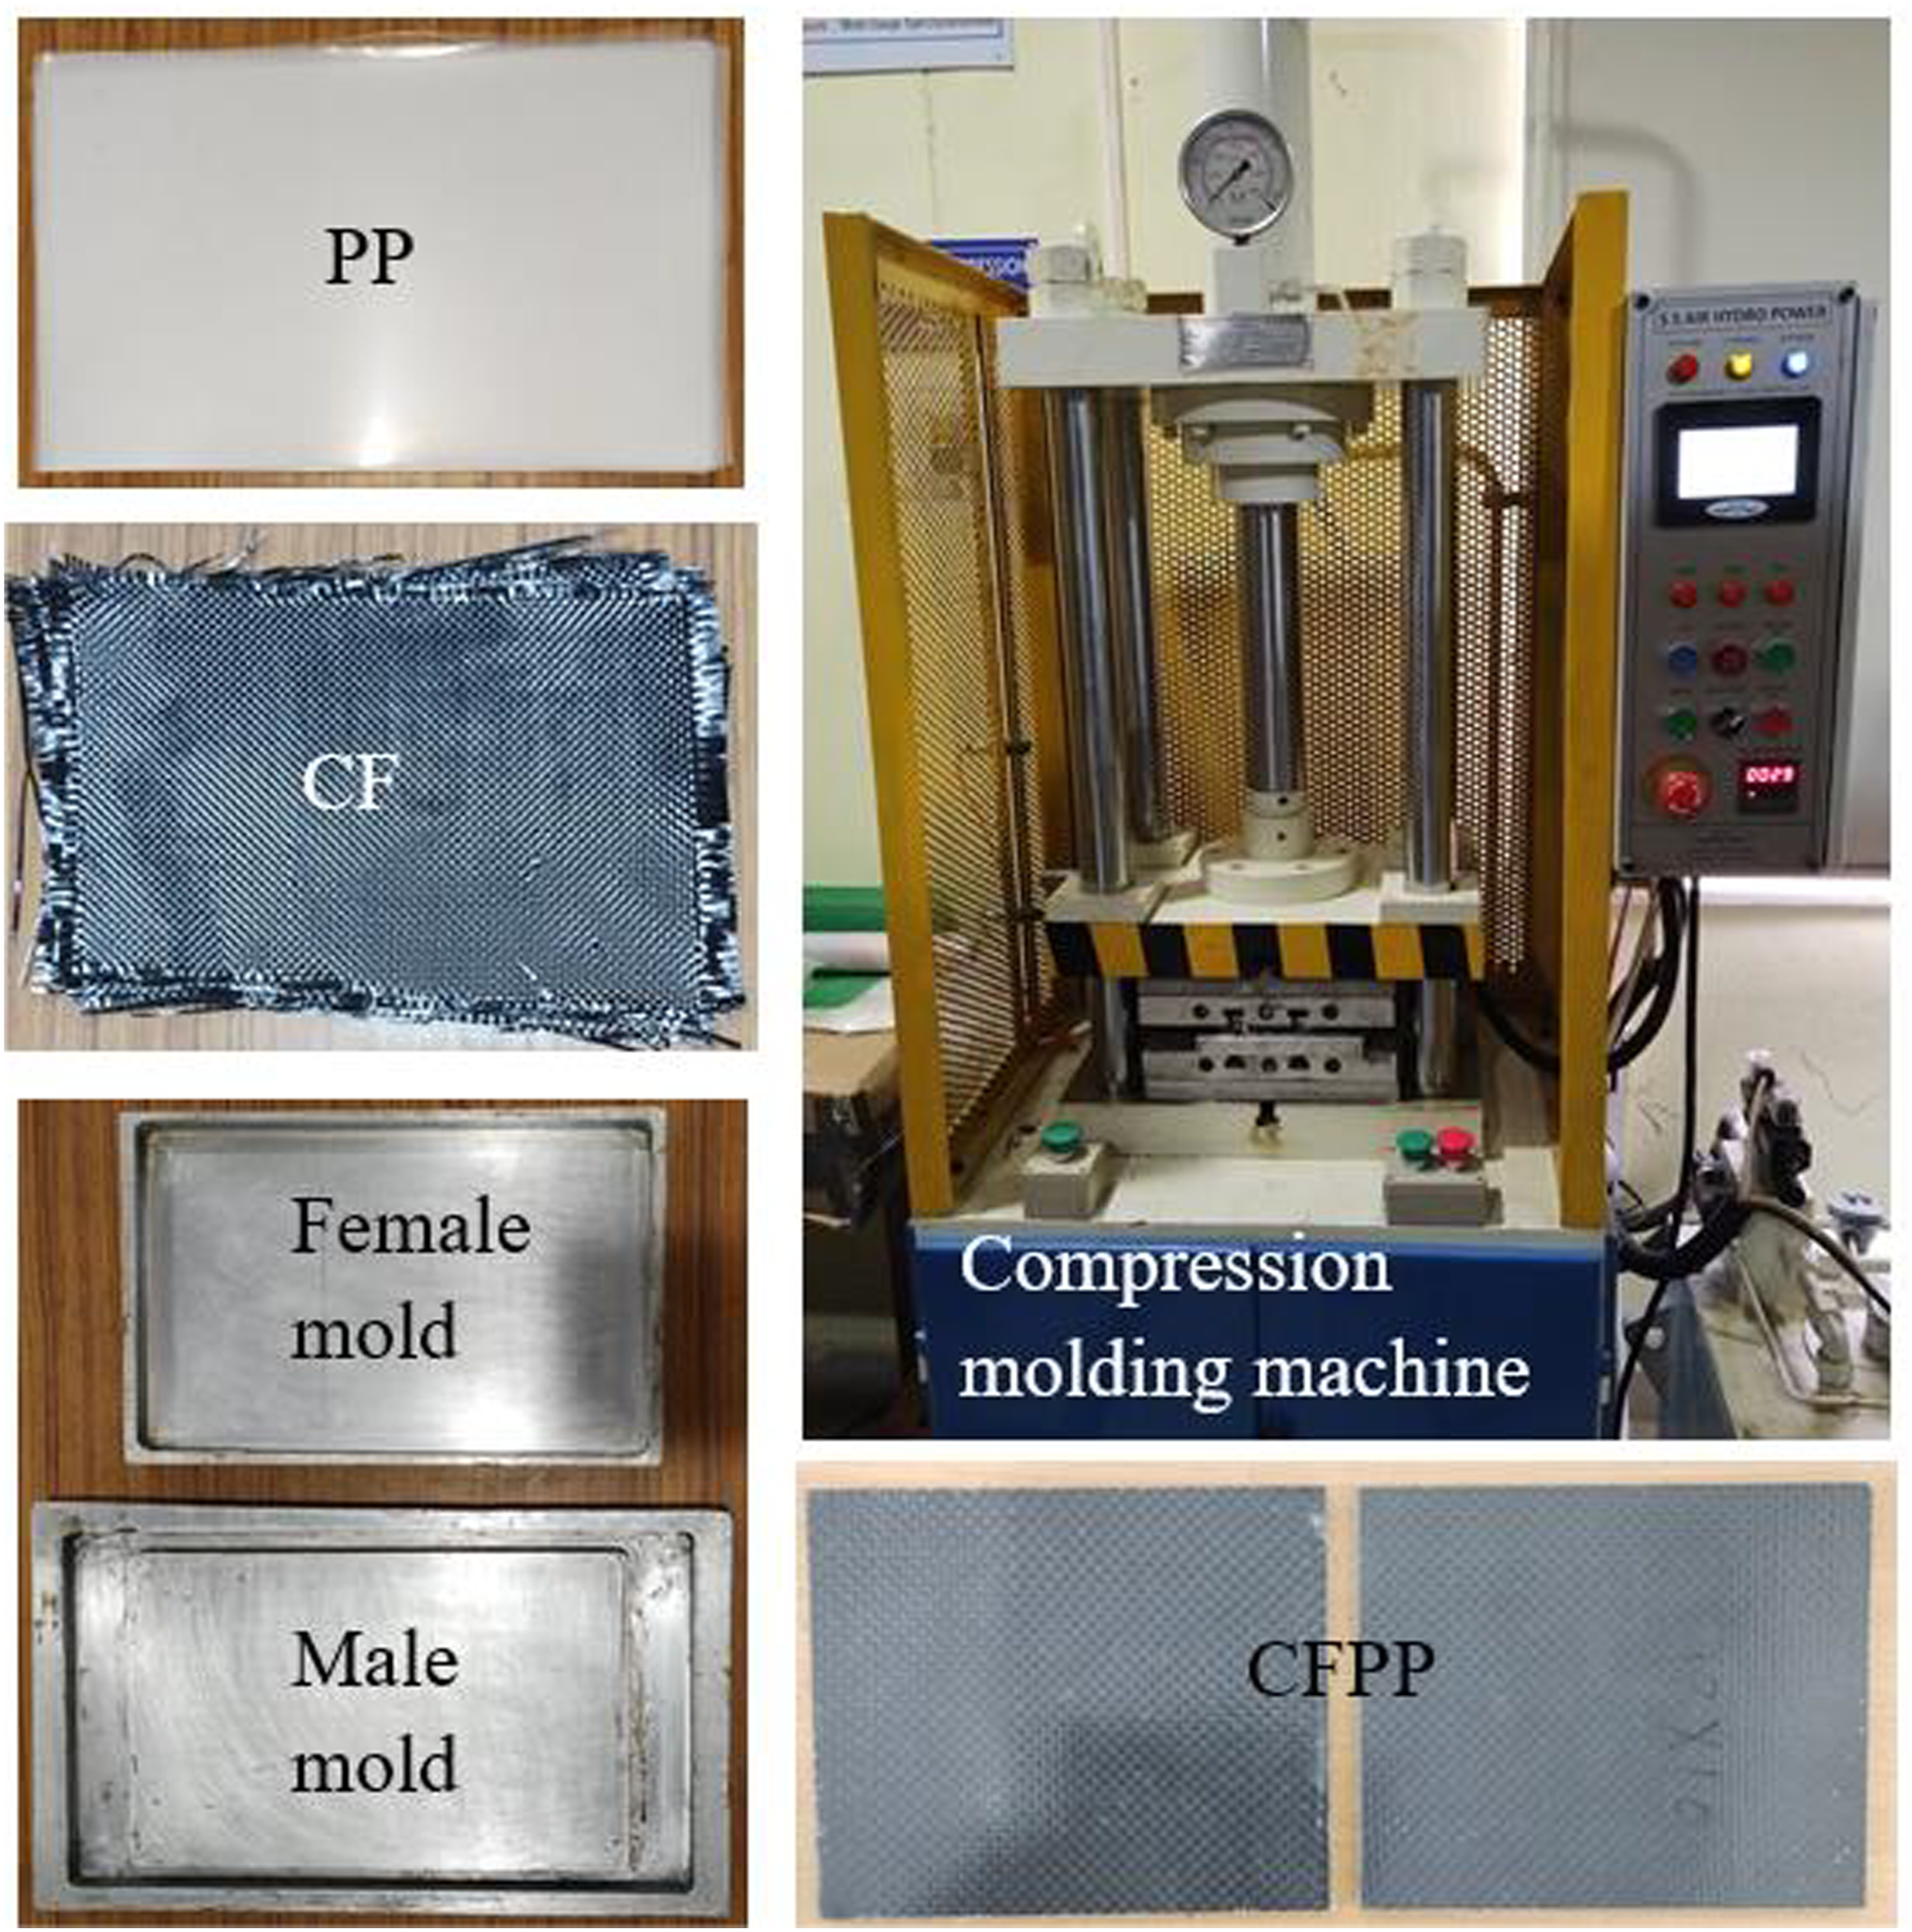
Drilling experiment
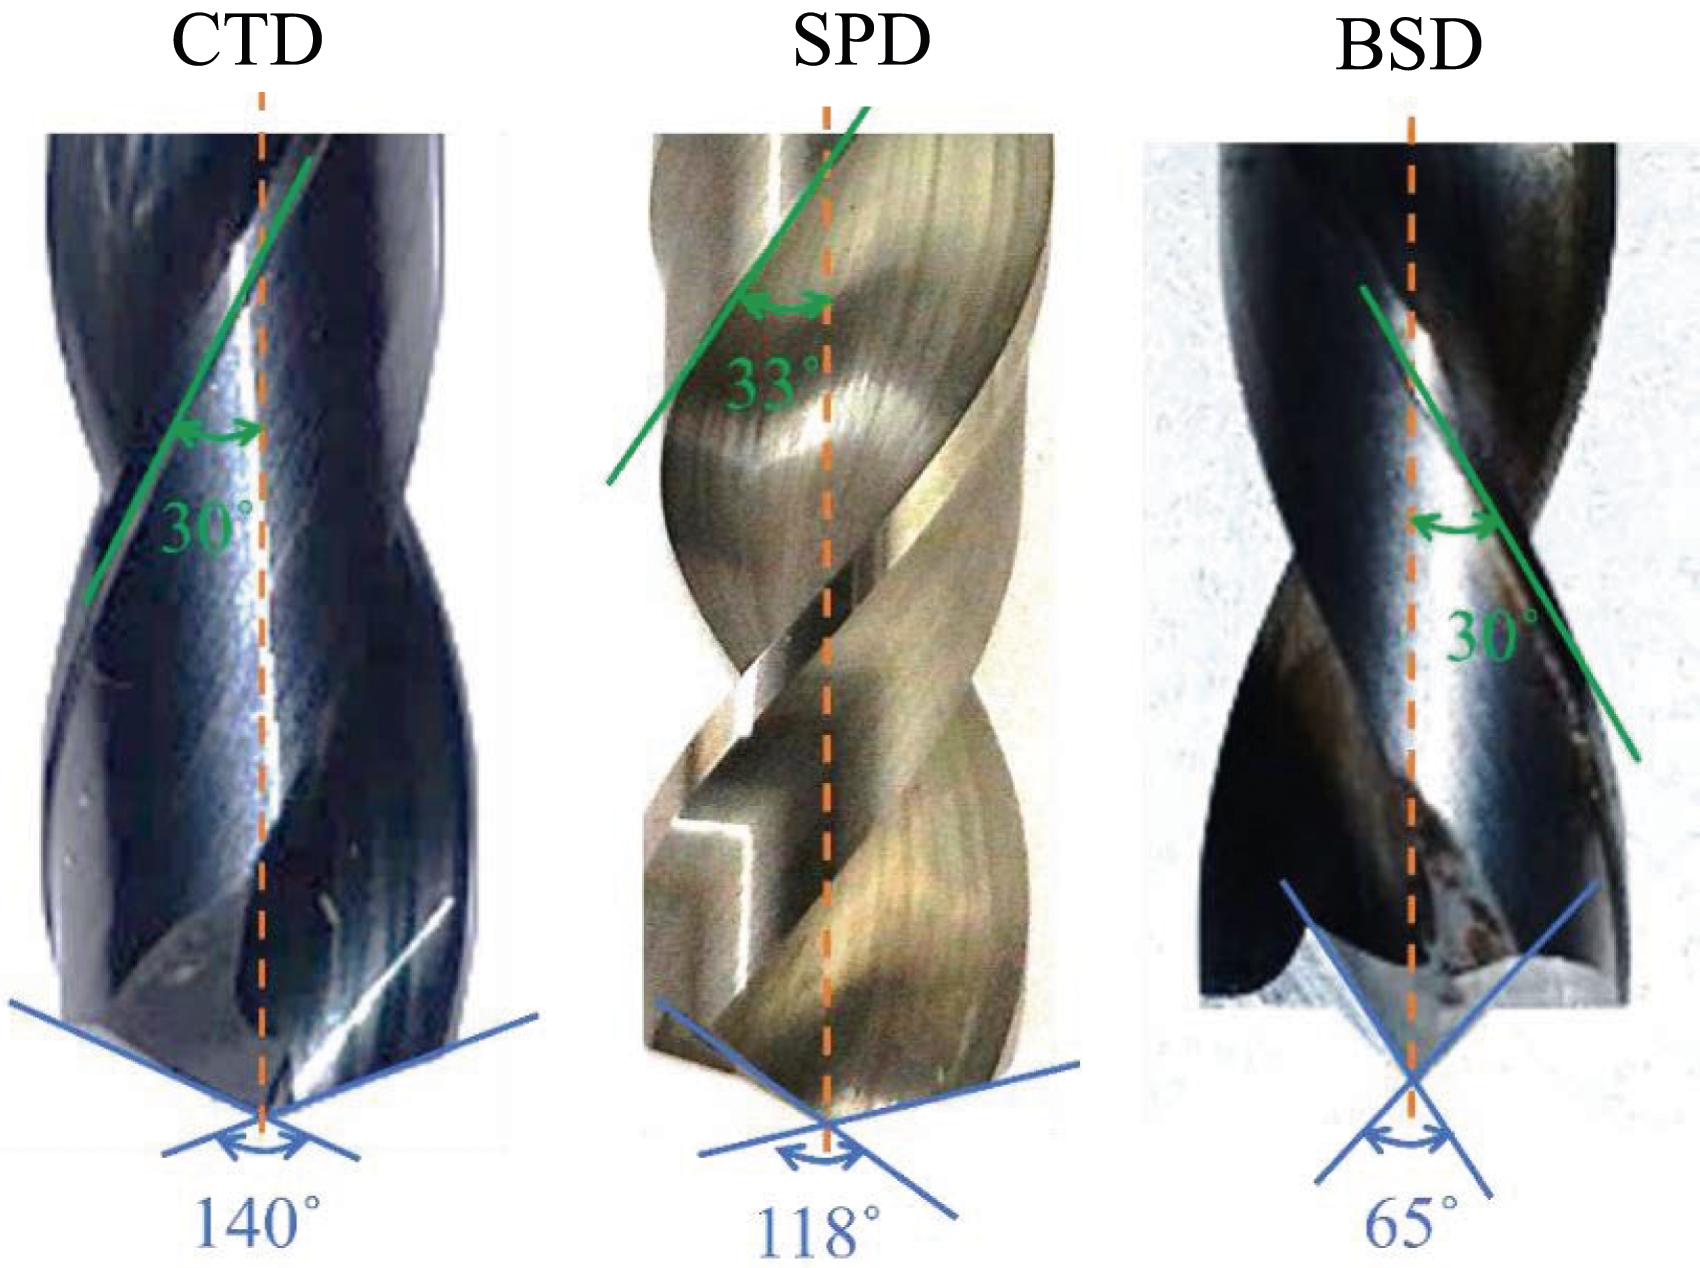
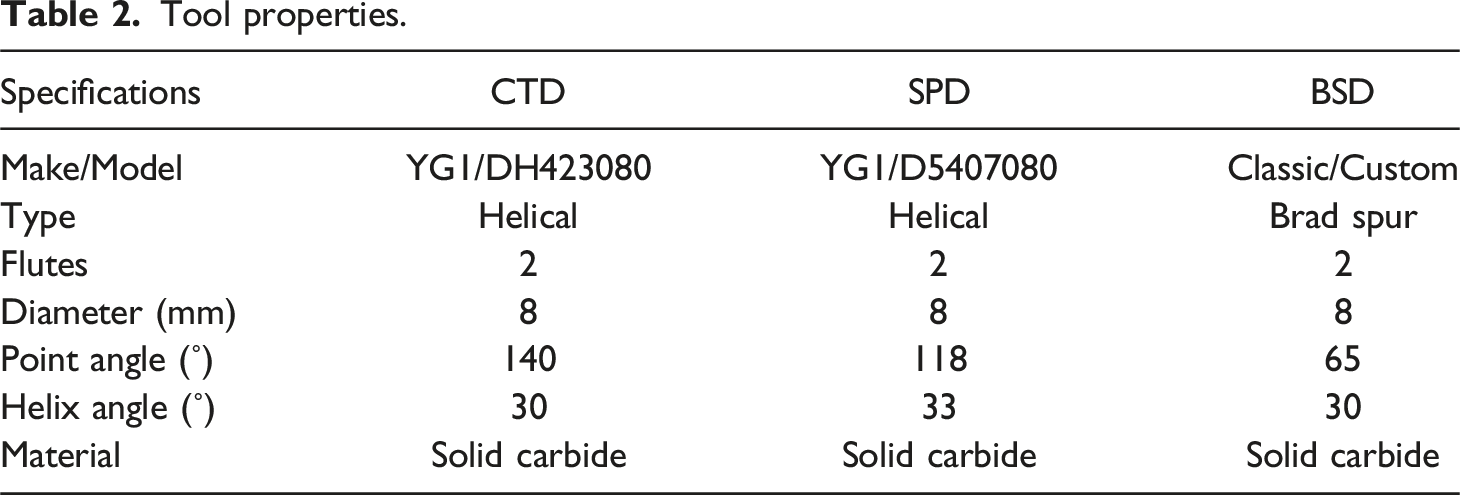
A 3-axis vertical CNC milling machine (Bridgeport Interact I) was used to make holes in the composite laminates. A stationary dynamometer was mounted on the machine’s bed. Composite laminates were clamped on the dynamometer with the help of a fixture tightly to prevent vibrations and misalignment during drilling, as shown in Figure 2(a). The dynamometer was attached to the charge amplifier for rectification and amplification of the charge, shown in Figure 2(b). A wooden block with 10 mm predrilled holes was positioned between the fixture and the composite laminate to support the laminates and prevent deflection. Holes were made into composites using three different drill tools (shown in Figure 3) in dry conditions. Tool properties of conventional twist drill (CTD), split point drill (SPD), and brad spur drill (BSD) were provided in Table 2. Each tool was replaced after making five holes to eliminate the effect of progressive tool wear.
21
Delamination refers to the process of layers being separated due to external forces. Delamination occurs at the entry and exit points of the hole during the drilling of the composite material. The delamination factor is a term used to quantify the extent of delamination. Delamination factor was measured using an open-source image processing software (ImageJ). A schematic for the calculation of the delamination factor is shown in Figure 2(d). For the calculation of the delamination factors, equations (1)–(3) were used.
22
Measurement setup (a) dynamometer, (b) charge amplifier, (c) thermal camera, (d) schematic for exit delamination factor, (e) surface roughness tester. Tool geometry. Tool properties.


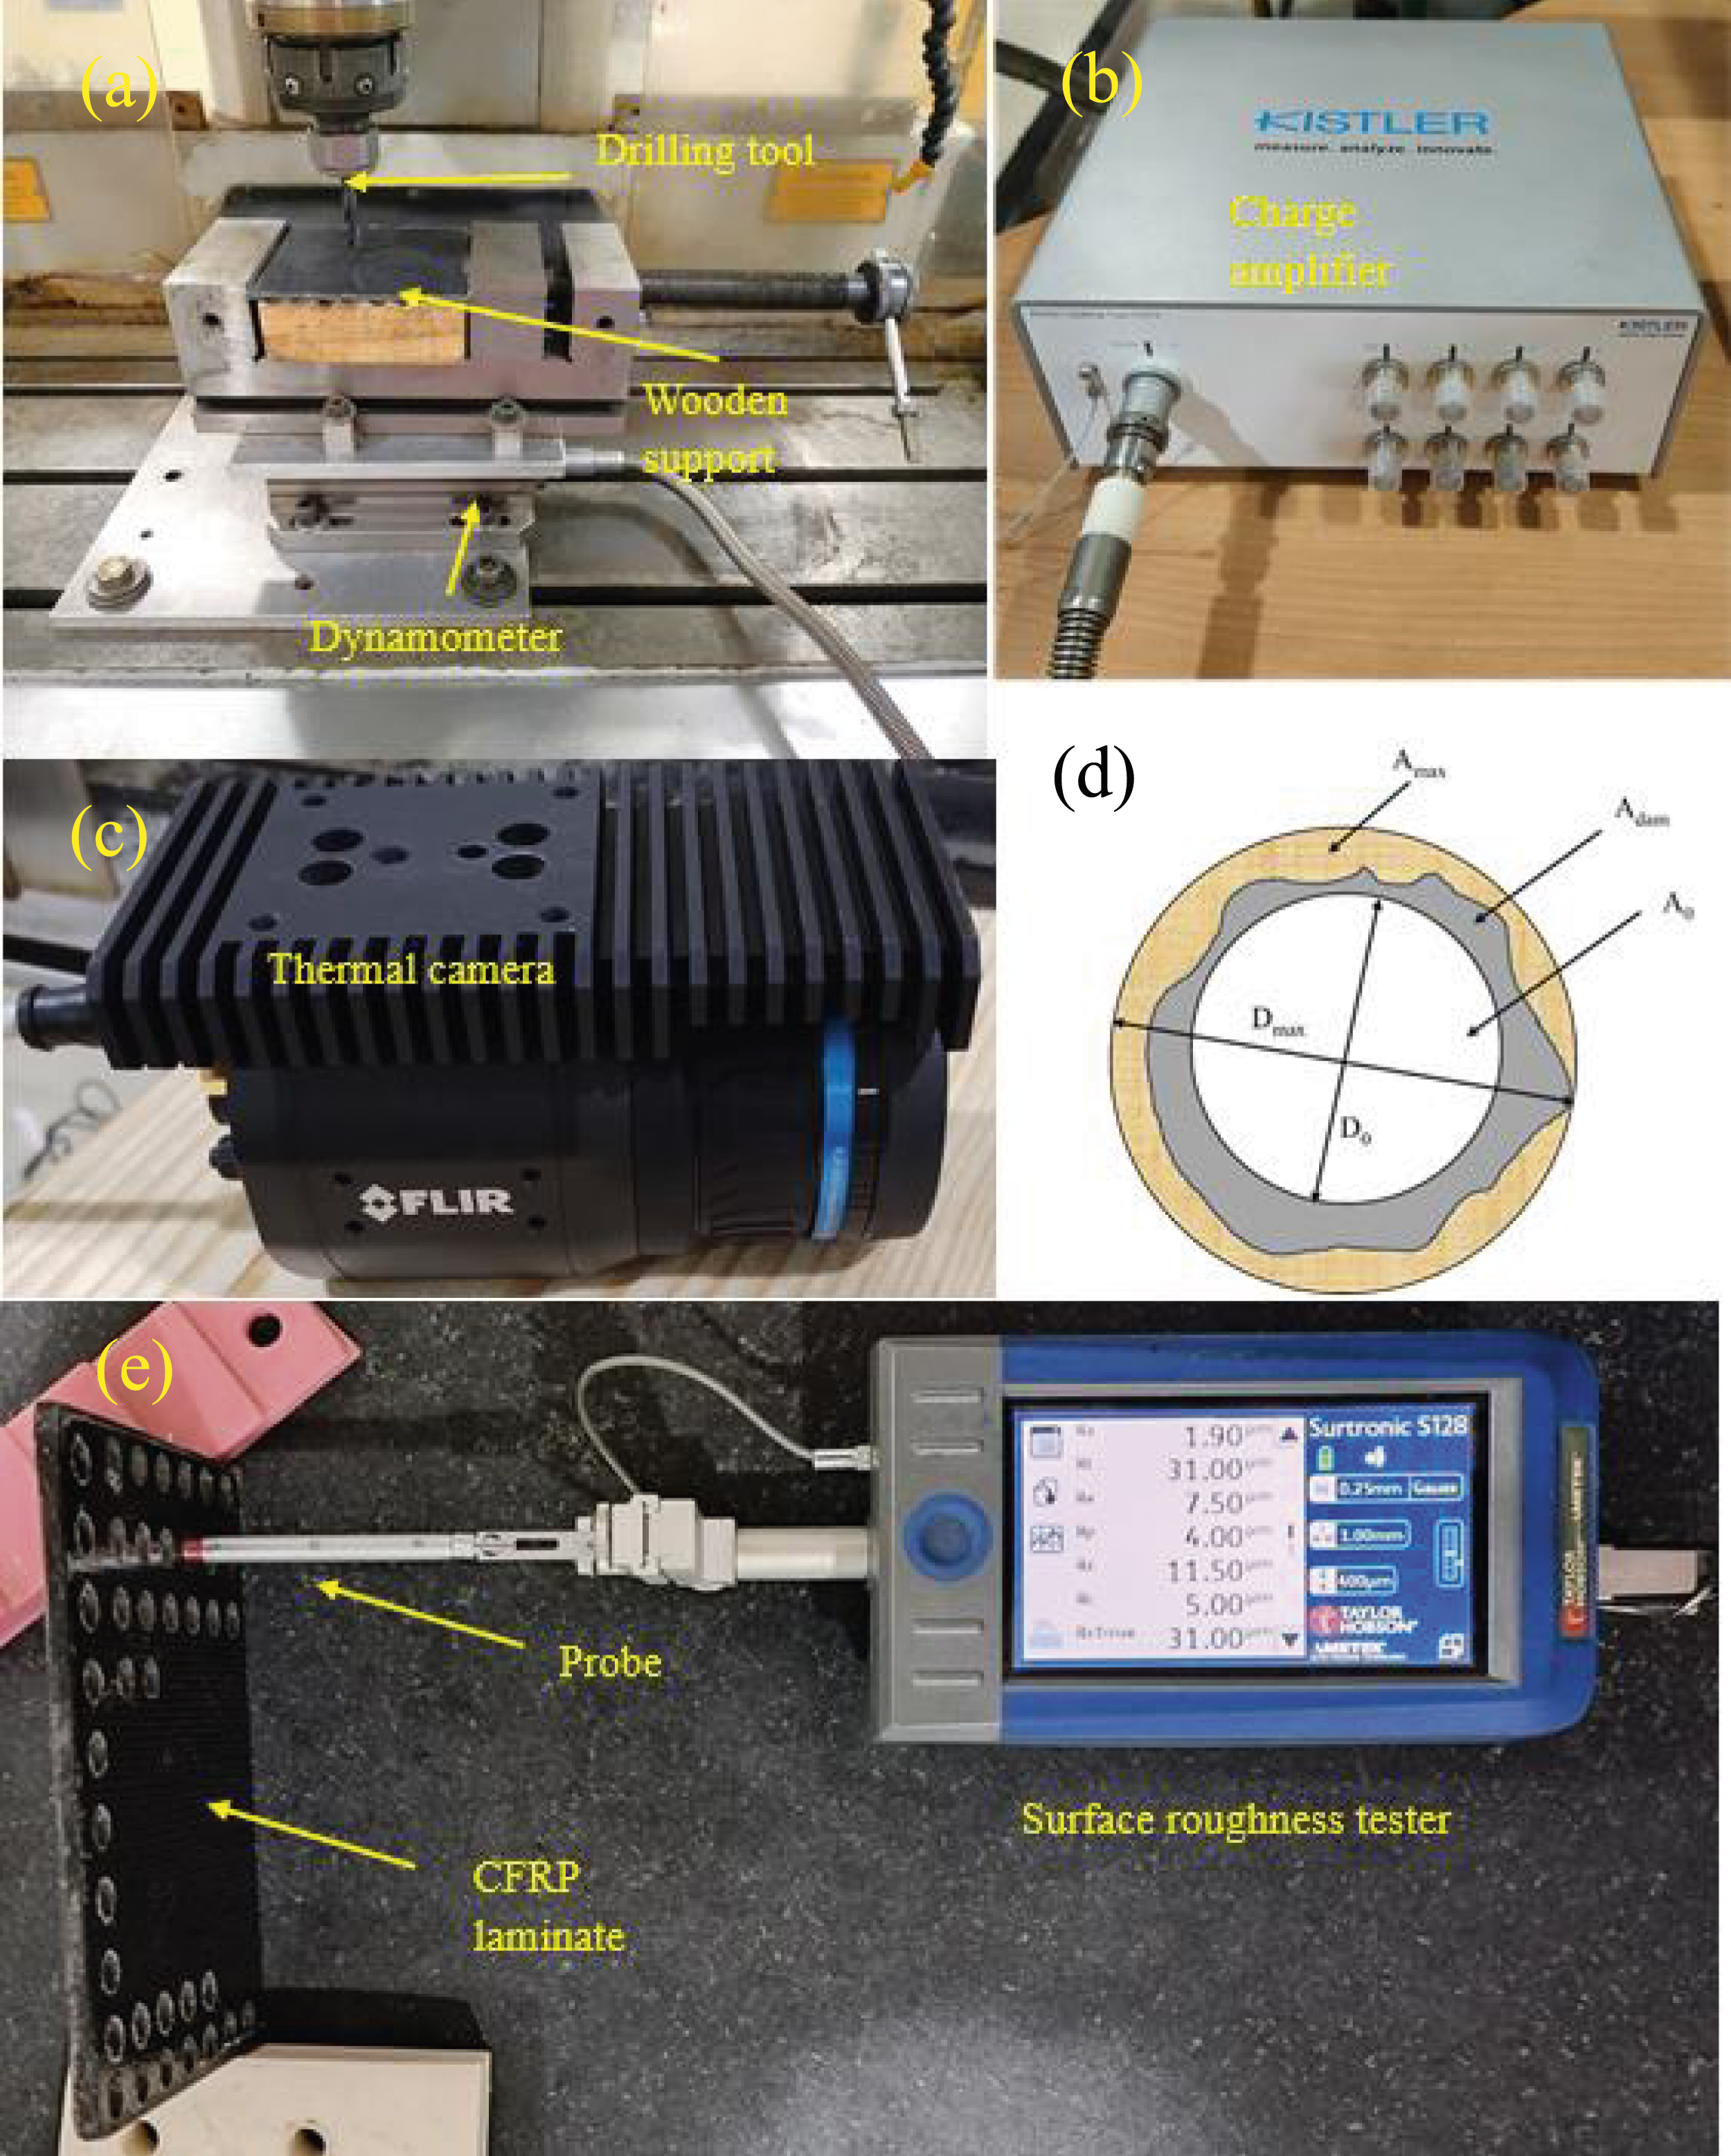
The surface roughness of the hole was measured using a contact-type surface roughness tester (Taylor Hobson S-128). The probe is moved in the feed direction to take the average roughness value (Ra), as shown in Figure 2(e). Surface roughness was measured at four places. Measurement was repeated three times at each location. The average roughness was considered for the analysis following ISO 4287. A scanning electron microscope (Nova Nano FE-SEM 450) was used for the microscopic analysis.
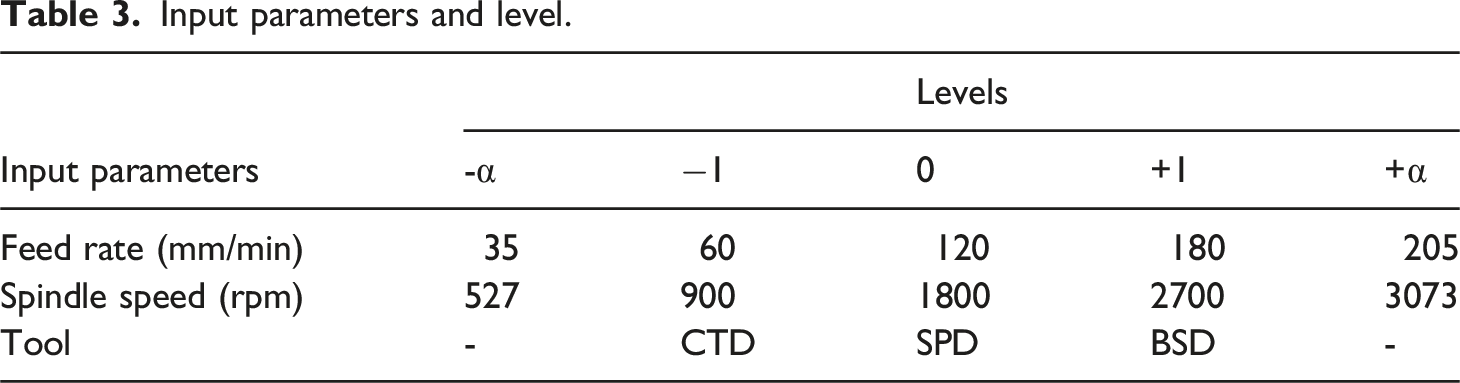
Input parameters and level.
Results and discussion
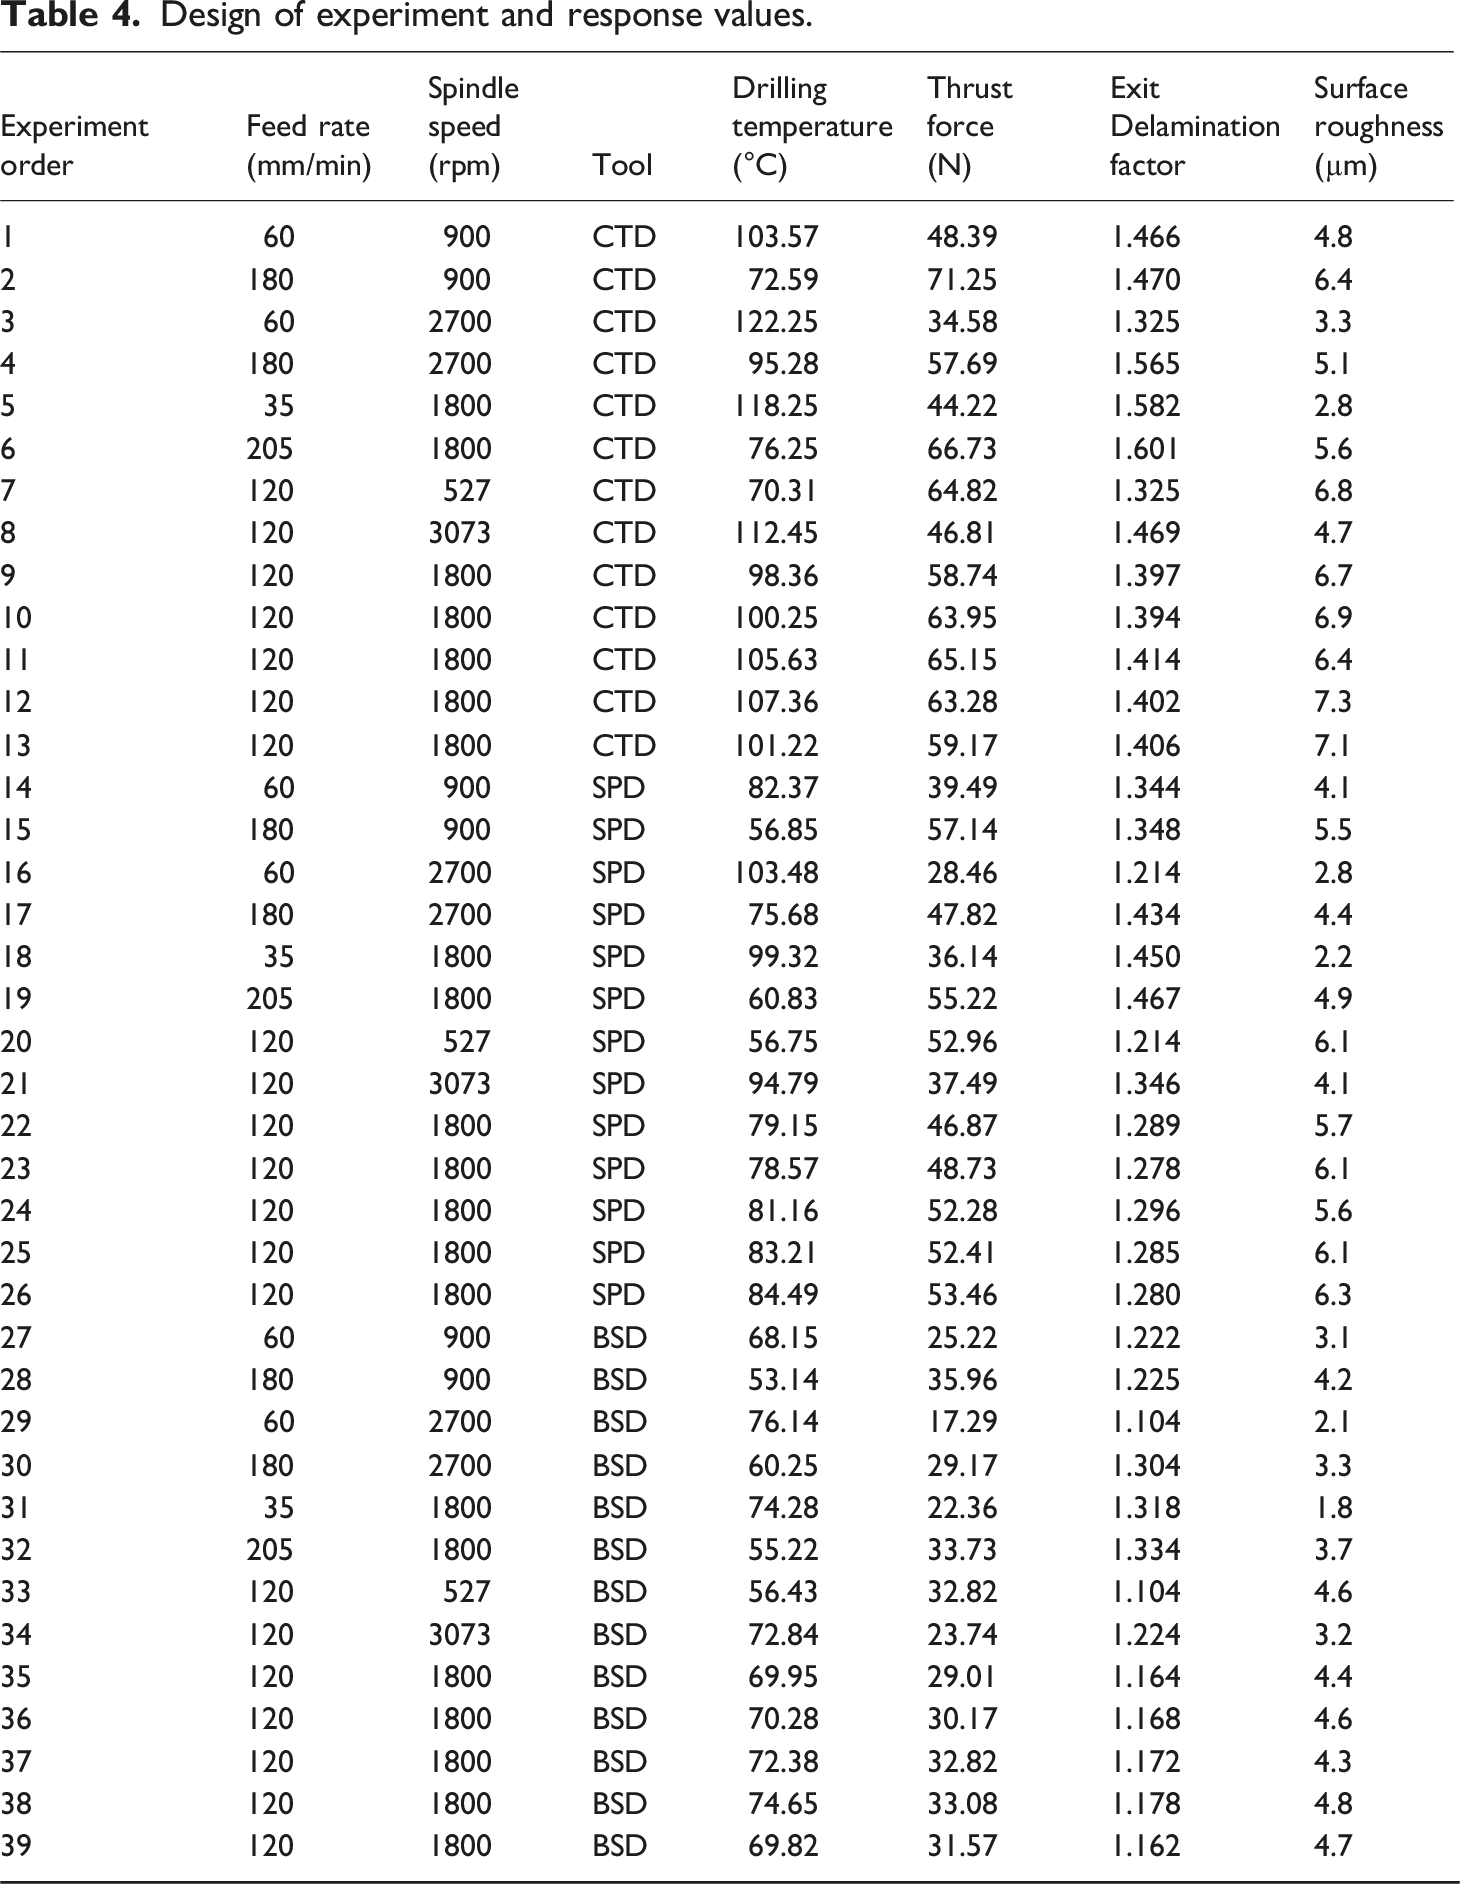
Design of experiment and response values.
Drilling temperature analysis
During drilling, temperature is generated by shearing off the material and friction between the tool and the workpiece. 24 The generated heat is dispersed throughout the workpiece, tool, and chips. Temperature analysis is critical in thermoplastic composite drilling due to the matrix’s heat-sensitive properties. Temperature influences tool life and thermal degradation of fiber and matrix. Heat can reduce the thermoplastic matrix’s fiber holding capacity, resulting in delamination and fiber pull-out. Furthermore, matrix softening affects hole quality through matrix smearing and material adhesion to tool edges. During the experiments, the drilling zone temperature, which included the tool and the hole wall, was measured. Holes were made 0.5 mm away from the edges for the temperature analysis.
To make the drilling process easy to understand, the whole process was divided into four parts, shown in Figure 4. The figure shows the tool locations in relation to the laminate thickness. L1 corresponds to the point at which the tool has just begun to remove material. L2, where the tool tip is completely dipped in the laminate. L3 is the point at which the tool tip makes contact with the final layer of the composite laminate. L4 represents the exit of the tool tip from the laminate. The maximum drilling temperature for all tools was observed at L3. Hence, for the analysis, temperature of this location was considered. Tool locations.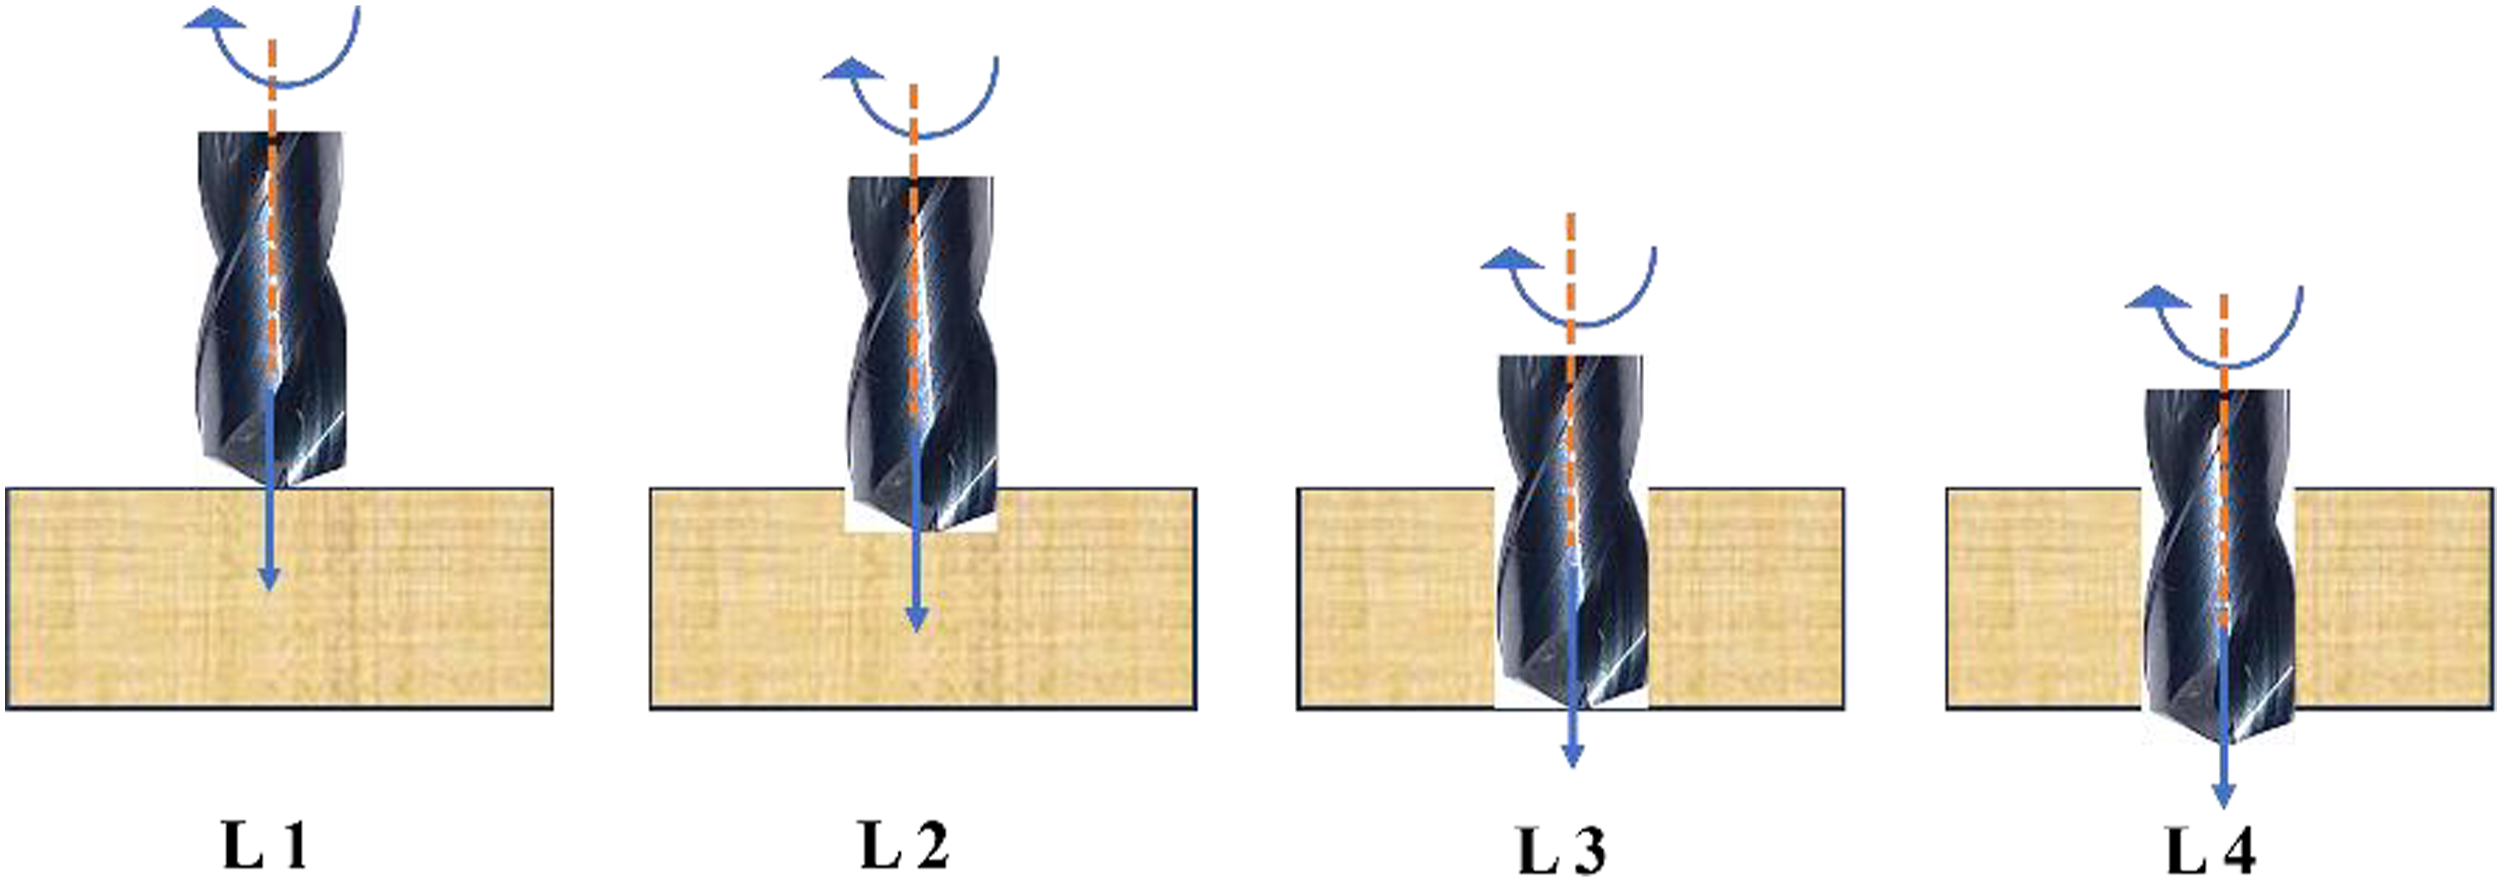
The temperature fields during the drilling process were measured using an infrared (IR) thermal imaging camera (FLIR A400) with a frame rate of 30 Hz, temperature range of 0°C to 650°C, and temperature accuracy of ±2°C. The thermal camera was positioned at a 30 cm distance from the tool-workpiece interface. The camera was calibrated before the experiments to ensure accurate measurements. The holes were made at a 0.5 mm distance from the edge of the composite laminate. The average emissivity value of the CFPP composite was found 0.91 according to ASTM E1933-14. Similar values have been reported in other studies.9,25,26 Since The maximum temperature was recorded at location L3. At this point, the tool was not directly exposed to the thermal camera; the emissivity value for CFPP was considered only. Figure 5 shows the thermal image captured during drilling by the IR thermal camera. Thermal image of the drilling zone at F: 120 mm/min and S: 1800 rpm.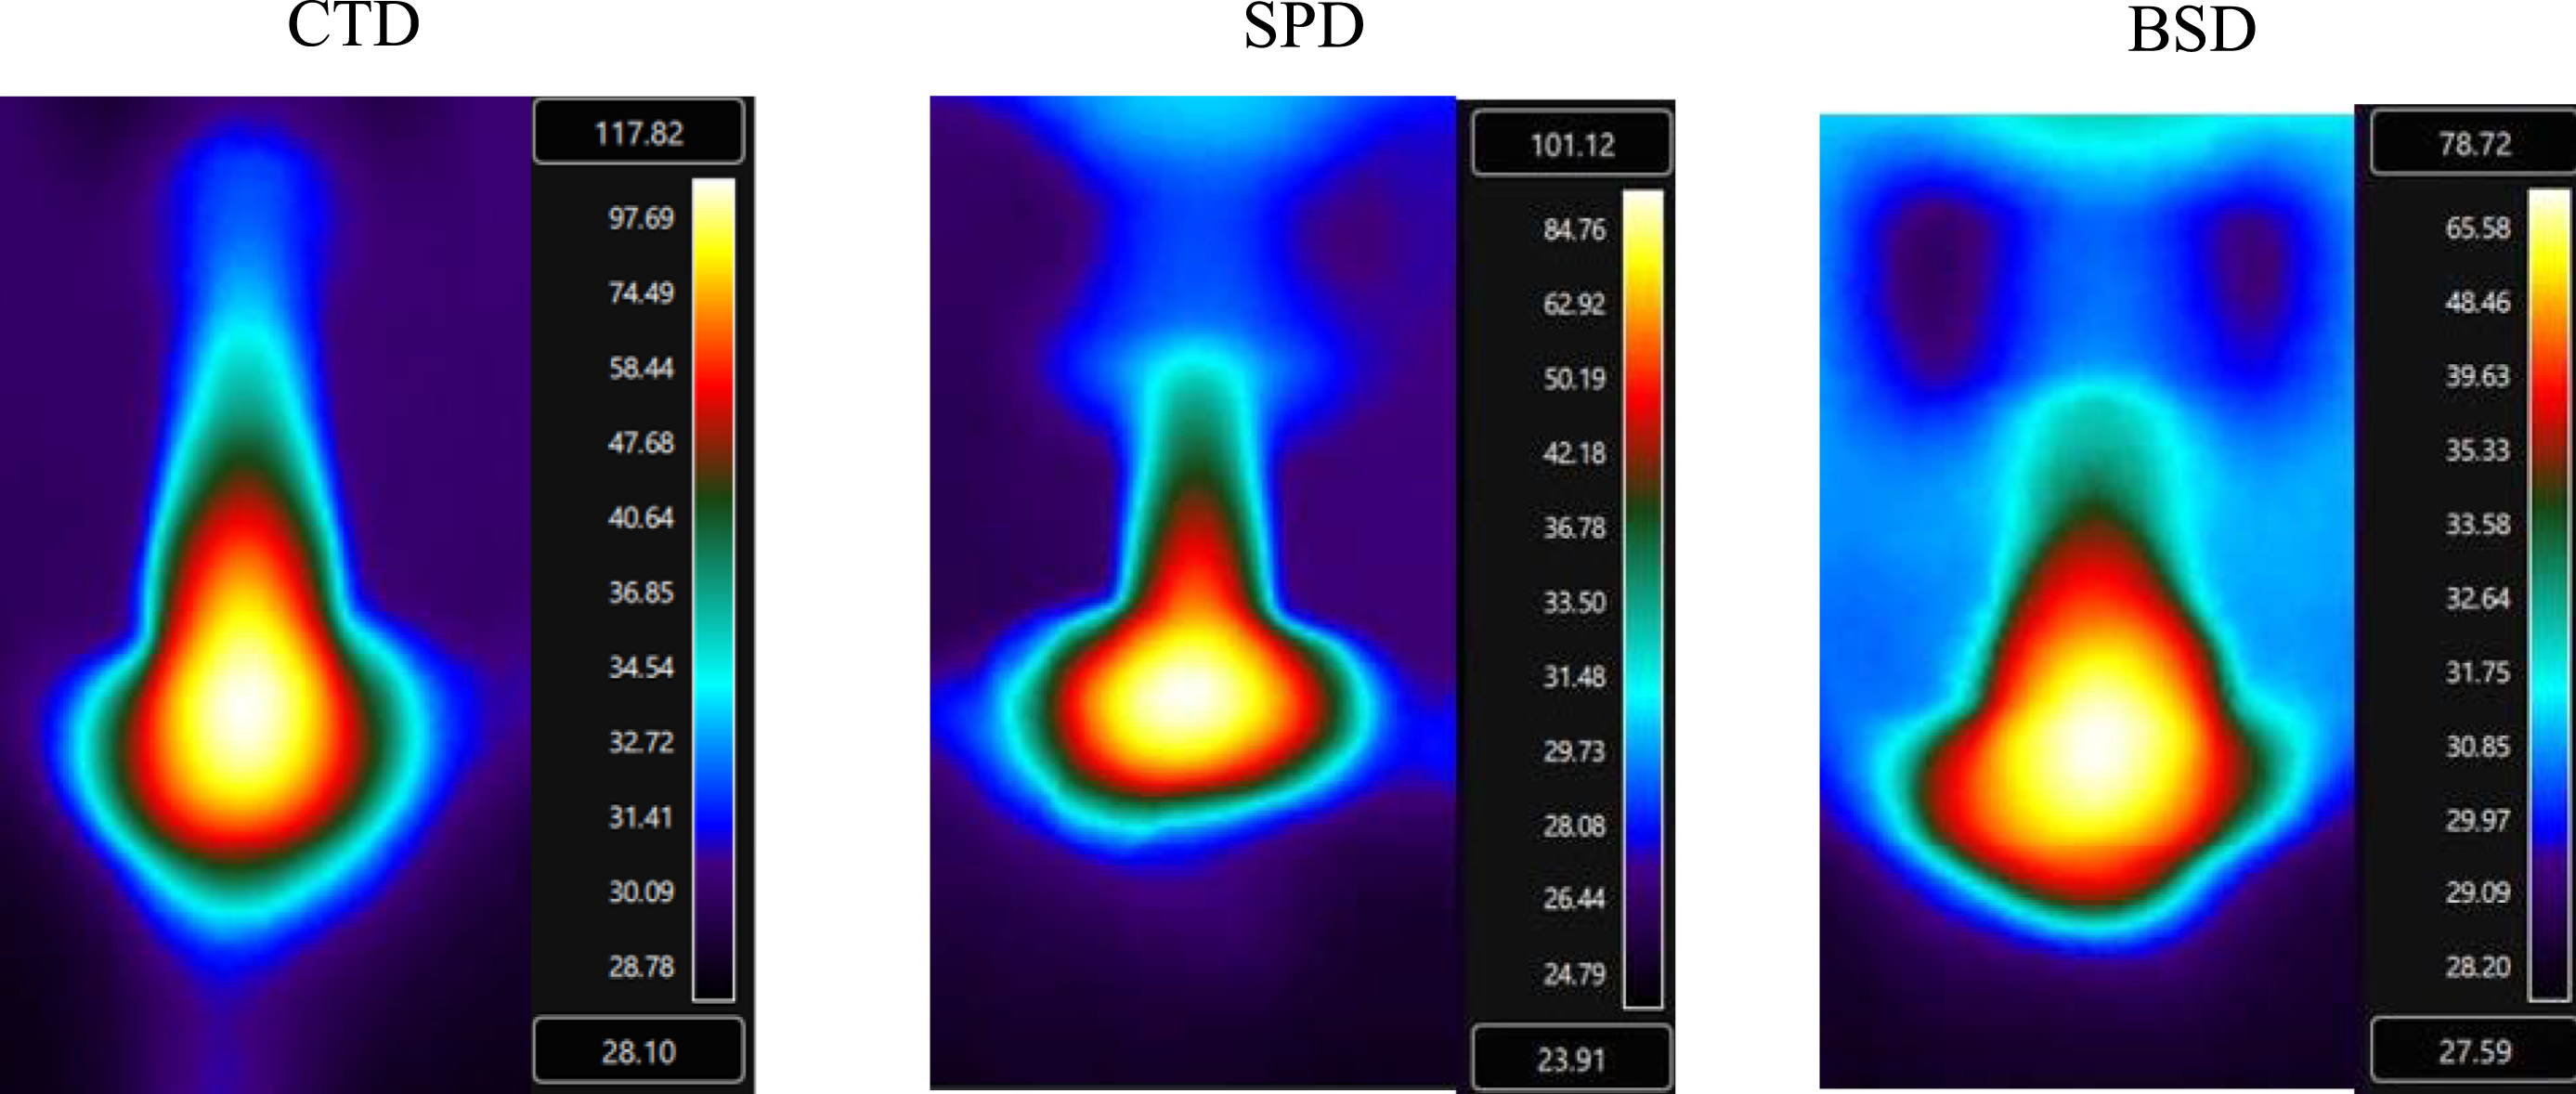
Figure 6(a) shows the variation of drilling temperature for all tools with experiment order. Figure 6(b) shows the main effects plot for drilling temperature. It illustrates the variation of drilling temperature with the input parameters. Drilling temperature decreases with the increase in feed rate due to less tool-workpiece interaction time. Prolonged contact time between tool and workpiece for lower feed rate produces more drilling temperature. Drilling temperature increases with the increase of spindle speed. As spindle speed increases, the rubbing between the tool-workpiece increases, increasing the friction, which results in more heat production. At lower spindle speed, friction decreases, which results in lower drilling temperature. BSD produced the lowest drilling temperature compared to both tools at the same parameter level. The sharp center helps in better penetration, and balanced cutting of BSD permits efficient chip evacuation. The minimum contact with the hot chip stops the heat accumulation compared to CTD and SPD. Figure 6(c) shows the interaction plots for the drilling temperature. The lines are parallel for feed rate and tool interaction; hence, their combined effect is insignificant. Some interaction is seen between the feed rate and tool, which means the effect of feed rate on drilling temperature depends on the tool geometry chosen. Table 4 shows that the feed rate had a greater impact on drilling temperature than spindle speed. Changing the feed rate from 60 mm/min to 180 mm/min at a constant spindle speed of 900 rpm results in a 29.91% decrease in drilling temperature from 103.57°C to 72.59°C, and an 18.04% rise in drilling temperature from 103.57°C to 122.25°C at a constant feed of 60 mm/min for the CTD tool. Changing the feed rate from 60 mm/min to 180 mm/min at a constant spindle speed of 900 rpm resulted in a 30.98% drop in drilling temperature from 82.37°C to 56.85°C and a 25.63% increase in drilling temperature from 82.37°C to 103.48°C at a constant feed of 60 mm/min for the SPD tool. When the feed rate is changed from 60 mm/min to 180 mm/min at a constant spindle speed of 900 rpm, the drilling temperature for the BSD tool decreases by 22.02% from 68.15°C to 53.14°C and increases by 11.72% from 68.15°C to 76.14°C with a constant feed rate of 60 mm/min. Plots for drilling temperature (a) variation with experiment order, (b) main effects, (c) interaction.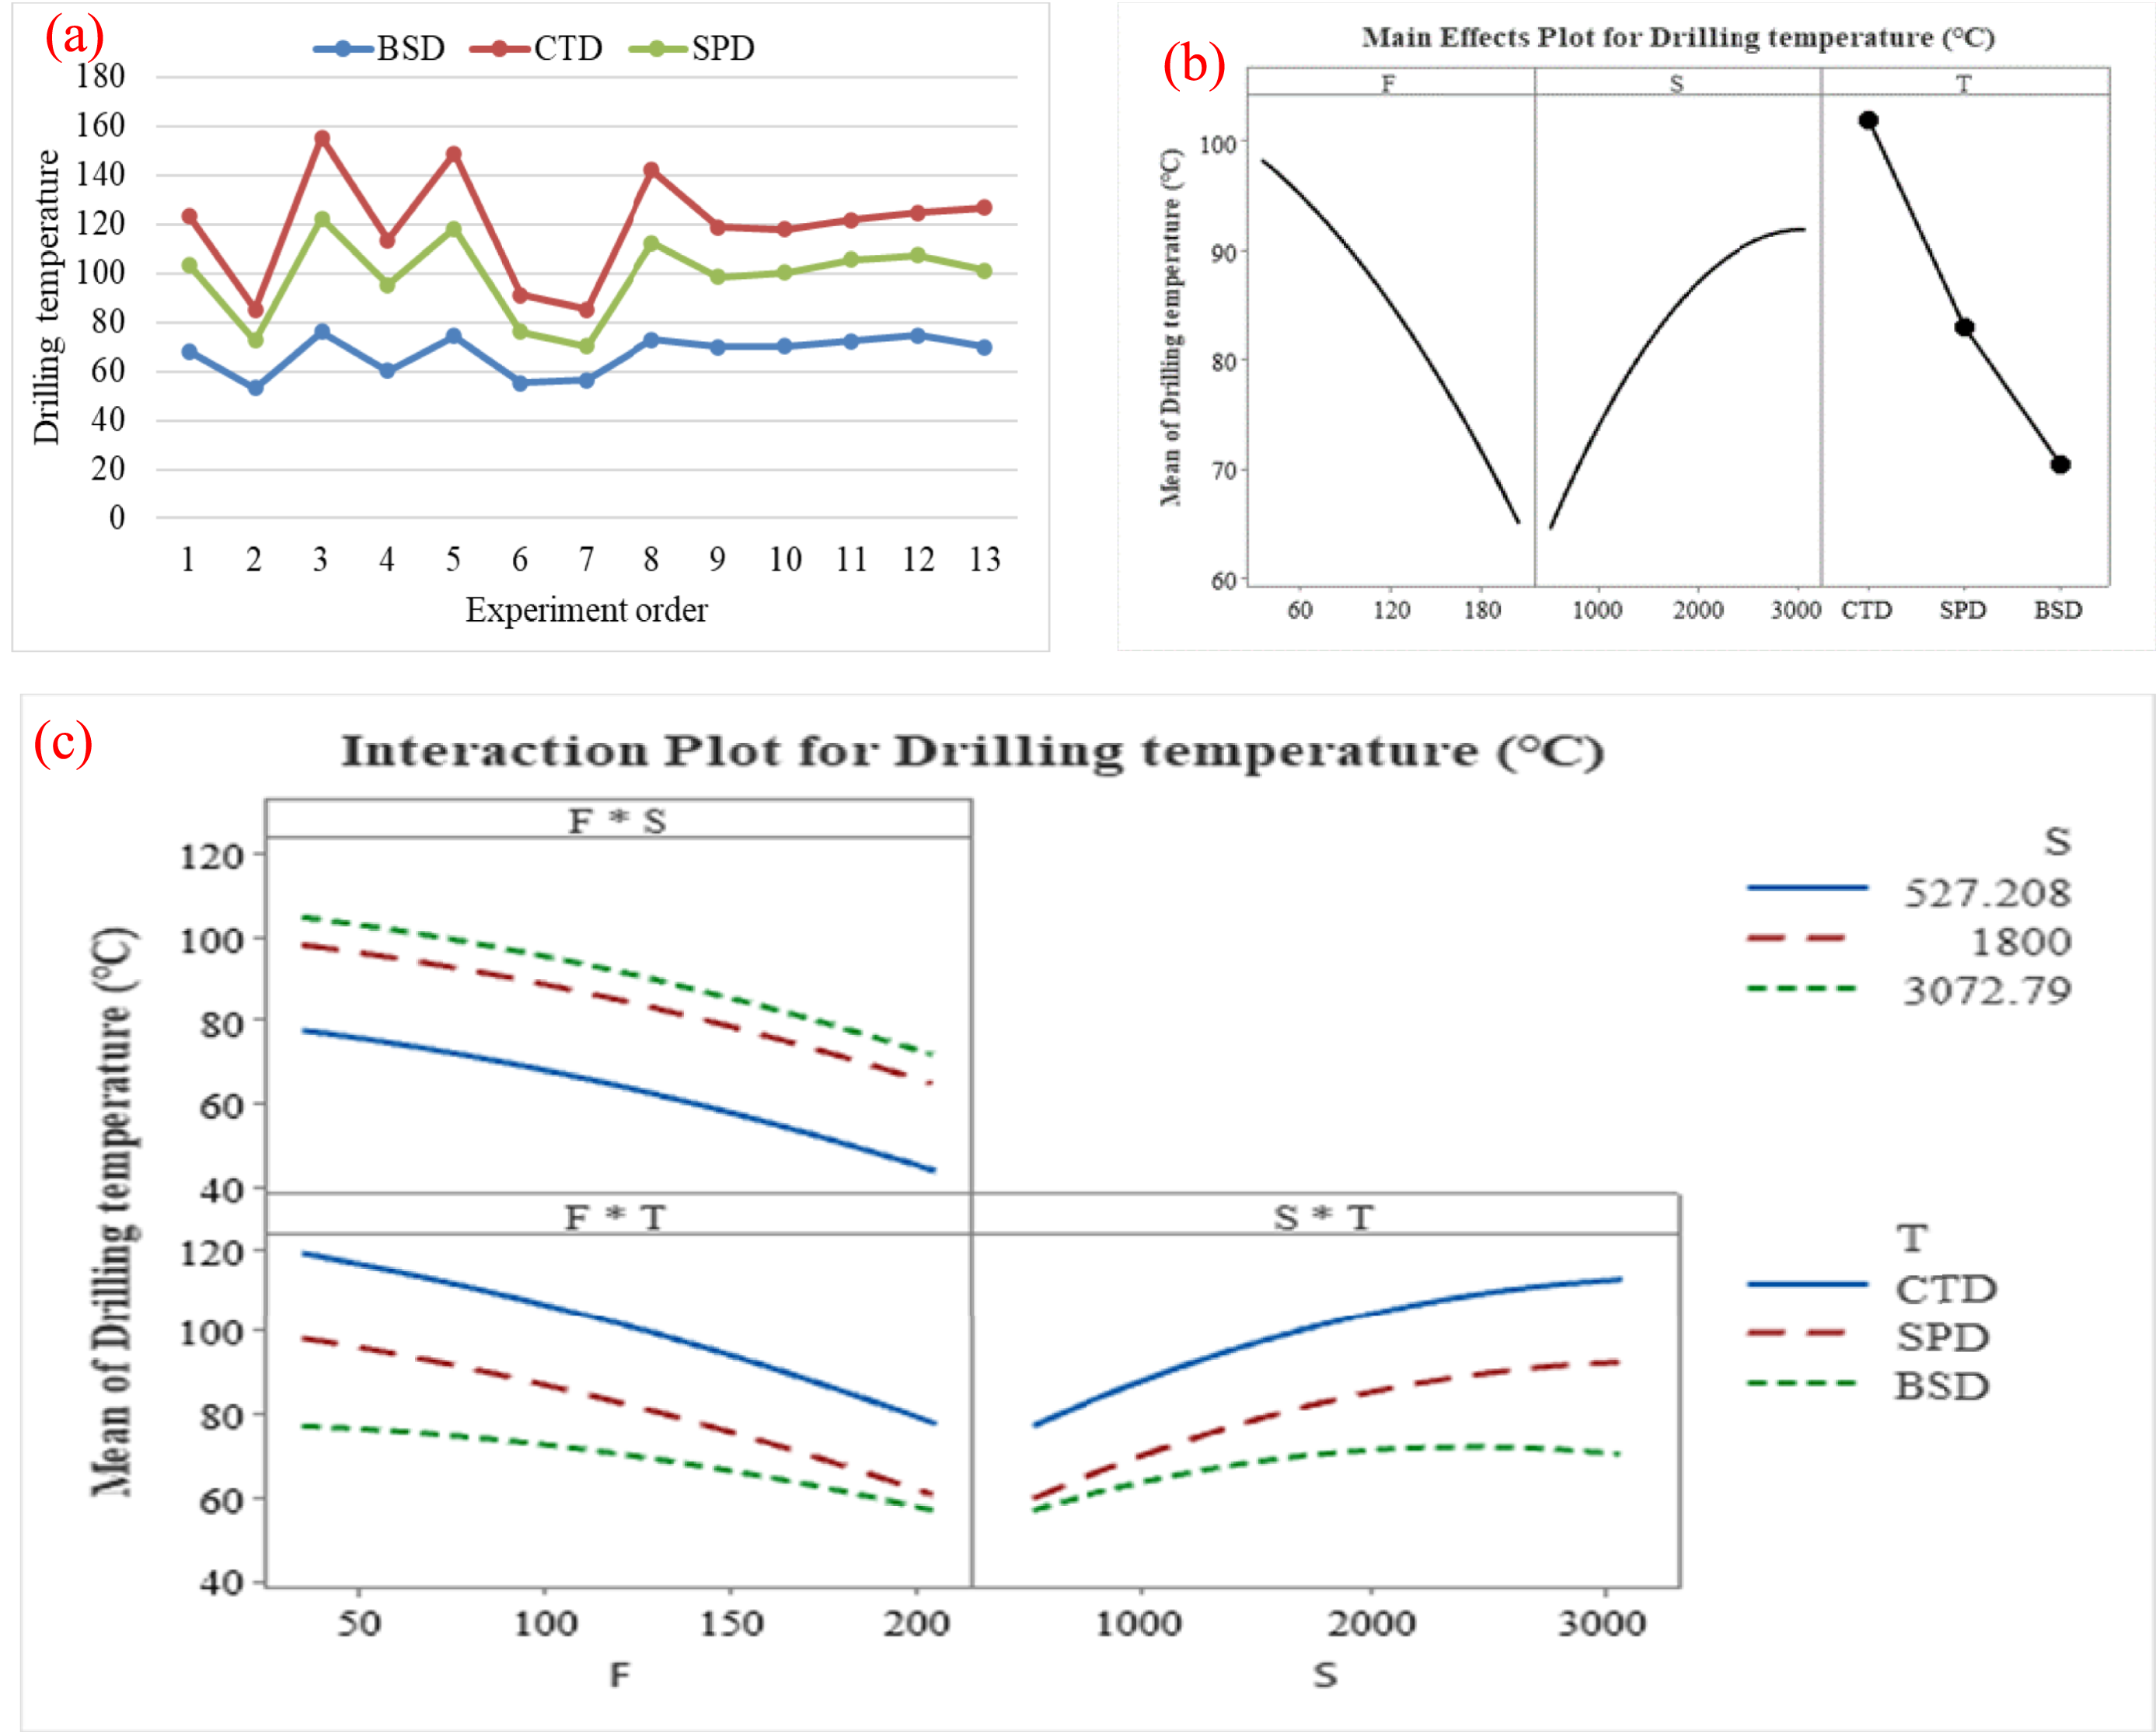
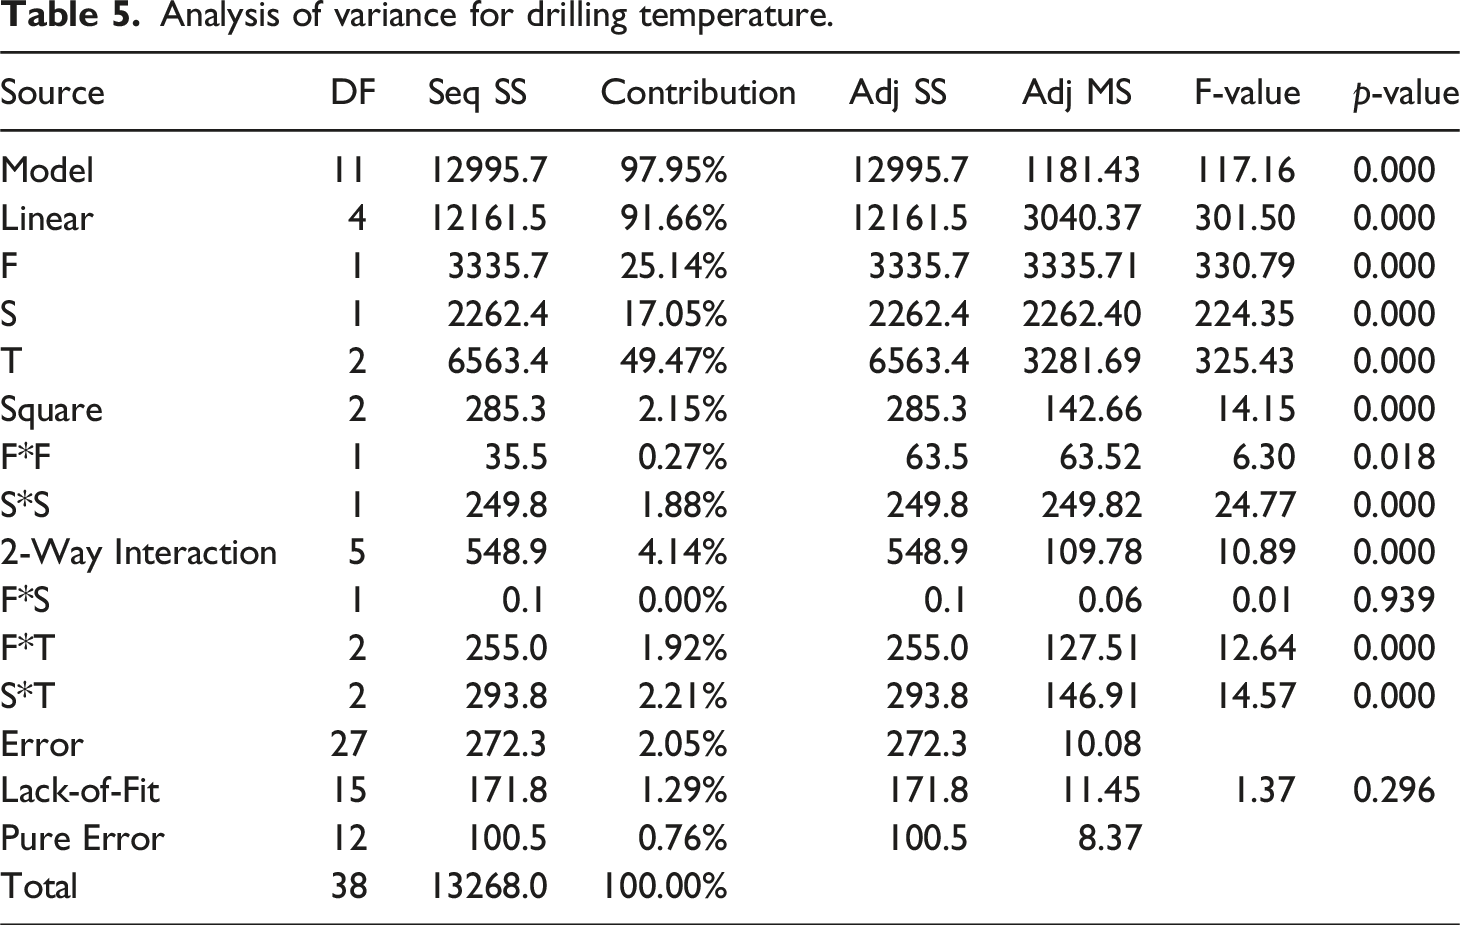
Analysis of variance for drilling temperature.
Thrust force analysis
Thrust force (TF) is the amount of force in the axial direction of the drill. This force is responsible for delamination during drilling of the composite materials. Its magnitude controls the amount of delamination in the composite laminates. It is a primary measure to evaluate machinability and the machining setup required for machining on a particular material.
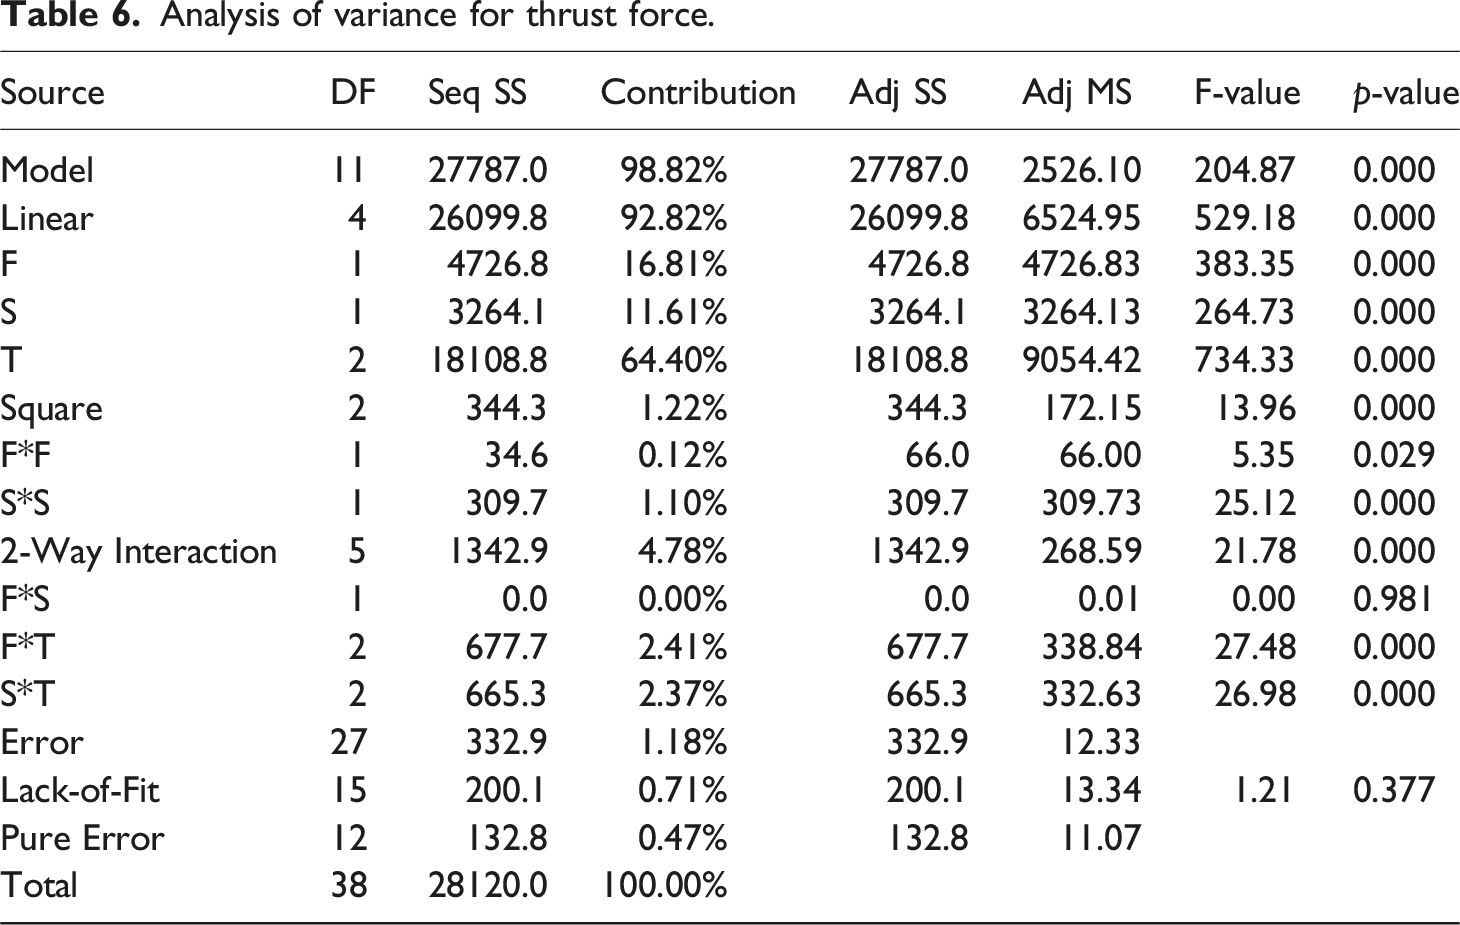
Figure 7(a) shows the variation of thrust force with the experiment order for all tools. Tool BSD has the least thrust force at same input parameters due to its unique geometry compared with SPD and CTD. Figure 7(b) shows the main effects plot for the thrust force. The curve shows a non-linear relation between feed rate and spindle speed with thrust force. Thrust force increased with an increase in feed rate and decreased with an increase in spindle speed. As the feed rate increases, a more aggressive material removal takes place, which increases the thrust force. As the spindle speed increases due to increased rubbing between tool and workpiece, temperature of the machining zone increases. This temperature gain softens the polypropylene matrix and decreases the thrust force. Figure 7(c) shows the interaction plots for the thrust force. Feed rate and spindle speed have no interaction effect. On the other hand, the interaction between feed rate and tool, along with spindle speed and tool, took place. Table 4 shows that feed rate had a greater effect on thrust force than spindle speed. Thrust force increases by 47.24% from 48.39 N to 71.25 N when the feed rate is changed from 60 mm/min to 180 mm/min at a constant spindle speed of 900 rpm and decreases by 28.54% from 48.39 N to 34.58 N when the spindle speed is changed from 900 rpm to 2700 rpm at a constant feed rate of 60 mm/min while using a CTD tool. The thrust force decreases by 27.93% from 39.49 N to 28.46 N when the spindle speed is changed from 900 rpm to 2700 rpm at a constant feed rate of 60 mm/min while using an SPD tool, and increases by 44.69% from 39.49 N to 57.14 N when the feed rate is changed from 60 mm/min to 180 mm/min at a constant spindle speed of 900 rpm. When the spindle speed is changed from 900 rpm to 2700 rpm at a constant feed rate of 60 mm/min, the thrust force decreases by 31.44% from 25.22 N to 17.29 N, and it increases by 42.58% from 25.22 N to 35.96 N when the feed rate is changed from 60 mm/min to 180 mm/min while using a BSD tool. Plots for thrust force (a) variation with experiment order, (b) main effects, (c) interaction.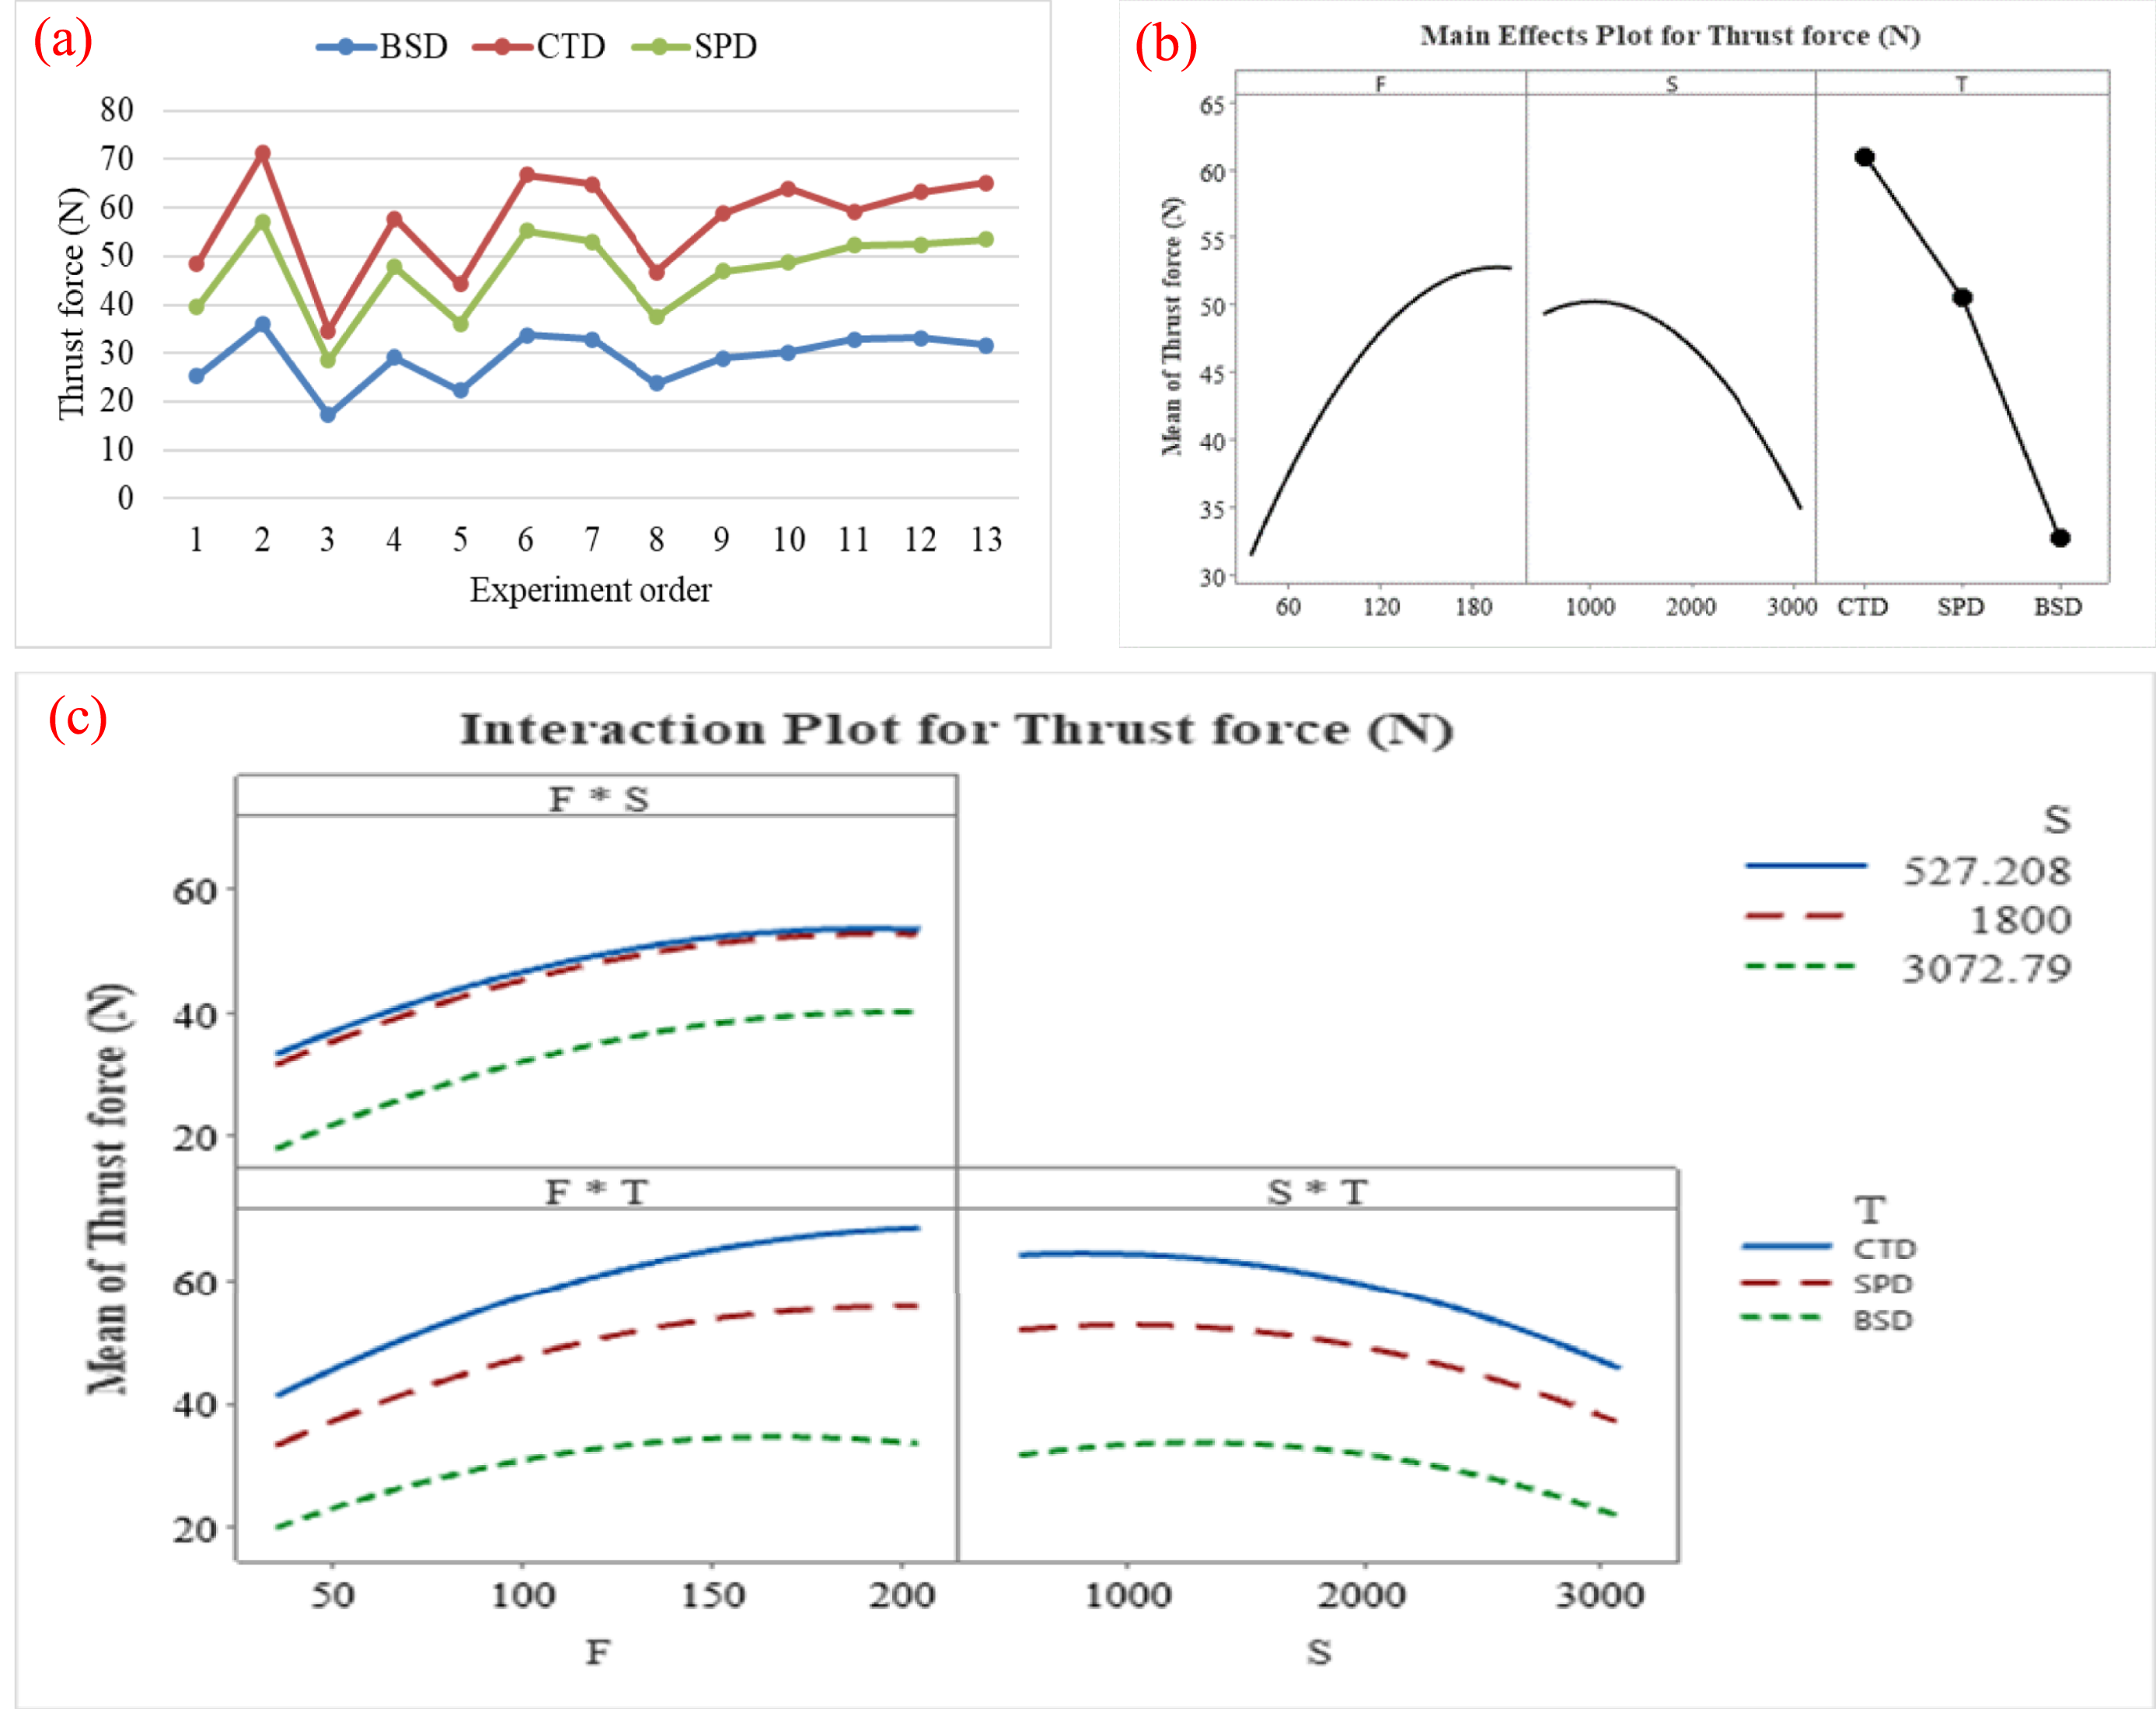
Analysis of variance for thrust force.
Exit delamination factor analysis
Delamination occurs when the tool and workpiece interact during machining, causing layer separation. Delamination reduces the component’s mating precision, strength, and reliability. 27
Almost 60% rejection of the part during assembly indicates its importance in real life. Analysis and reduction of the delamination factor are essential for reducing waste and increasing product reliability.
28
The term delamination factor is used to quantify the extent of delamination. The delamination factor at entry is called peel-up, and at exit, push-out. The push-out delamination factor is always found to be greater than the peel-up delamination factor.
29
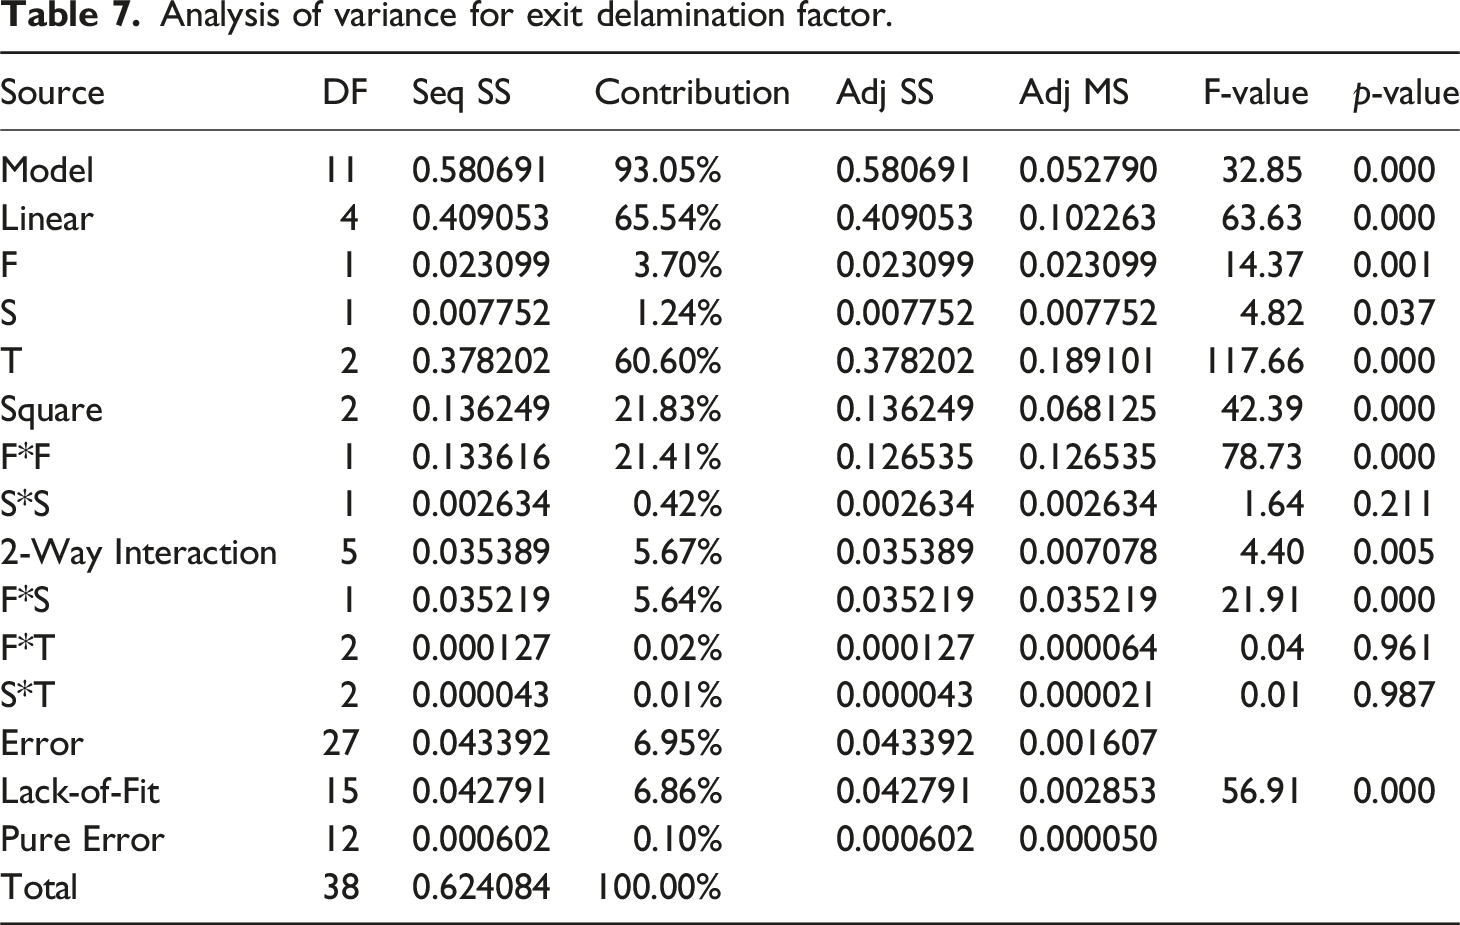
In this research exit delamination factor is taken into consideration. Figure 8(a) shows the exit delamination factor with experiment order. For all composites, BSD outperformed CTD and SPD in terms of lower exit delamination factor due to its distinct design advantage that minimizes both critical responses thrust force and drilling temperature responsible for delamination. According to Table 4, BSD produced 16.67% and 9.07% smaller maximum exit delamination factor than CTD and SPD, respectively. The lowest exit delamination factor for CTD, SPD, and BSD is 1.325, 1.214, and 1.104, respectively, with a feed rate of 120 mm/min and a spindle speed of 527 rpm. The maximum EDF for CTD, SPD, and BSD is 1.601, 1.467, and 1.334 with a feed rate of 205 mm/min and a spindle speed of 1800 rpm. CTD produced the maximum thrust force and drilling temperature for all composites at the same parameters. Figure 8(b) shows the main effects plot for exit delamination factor. The exit delamination factor increased with increased spindle speed due to elevated temperature, and the fiber holding capacity of the matrix was reduced. Meanwhile, it showed an interesting trend with feed rate; it decreased from 60 mm/min up to 120 mm/min and again started to increase up to 180 mm/min. The delamination factor at a lower feed rate is more influenced by thermal, while at a higher feed rate, it was controlled by thermal-mechanical interaction. Figure 8(c) shows the interaction plot for the exit delamination factor. Feed rate and spindle speed lines cross each other within the taken range of parameters. Hence, interaction exists for the feed rate and spindle speed. Since the lines are parallel for the feed rate tool and spindle speed tool, no interaction takes place. Plots for exit delamination factor (a) variation with experiment order, (b) main effects, (c) interaction.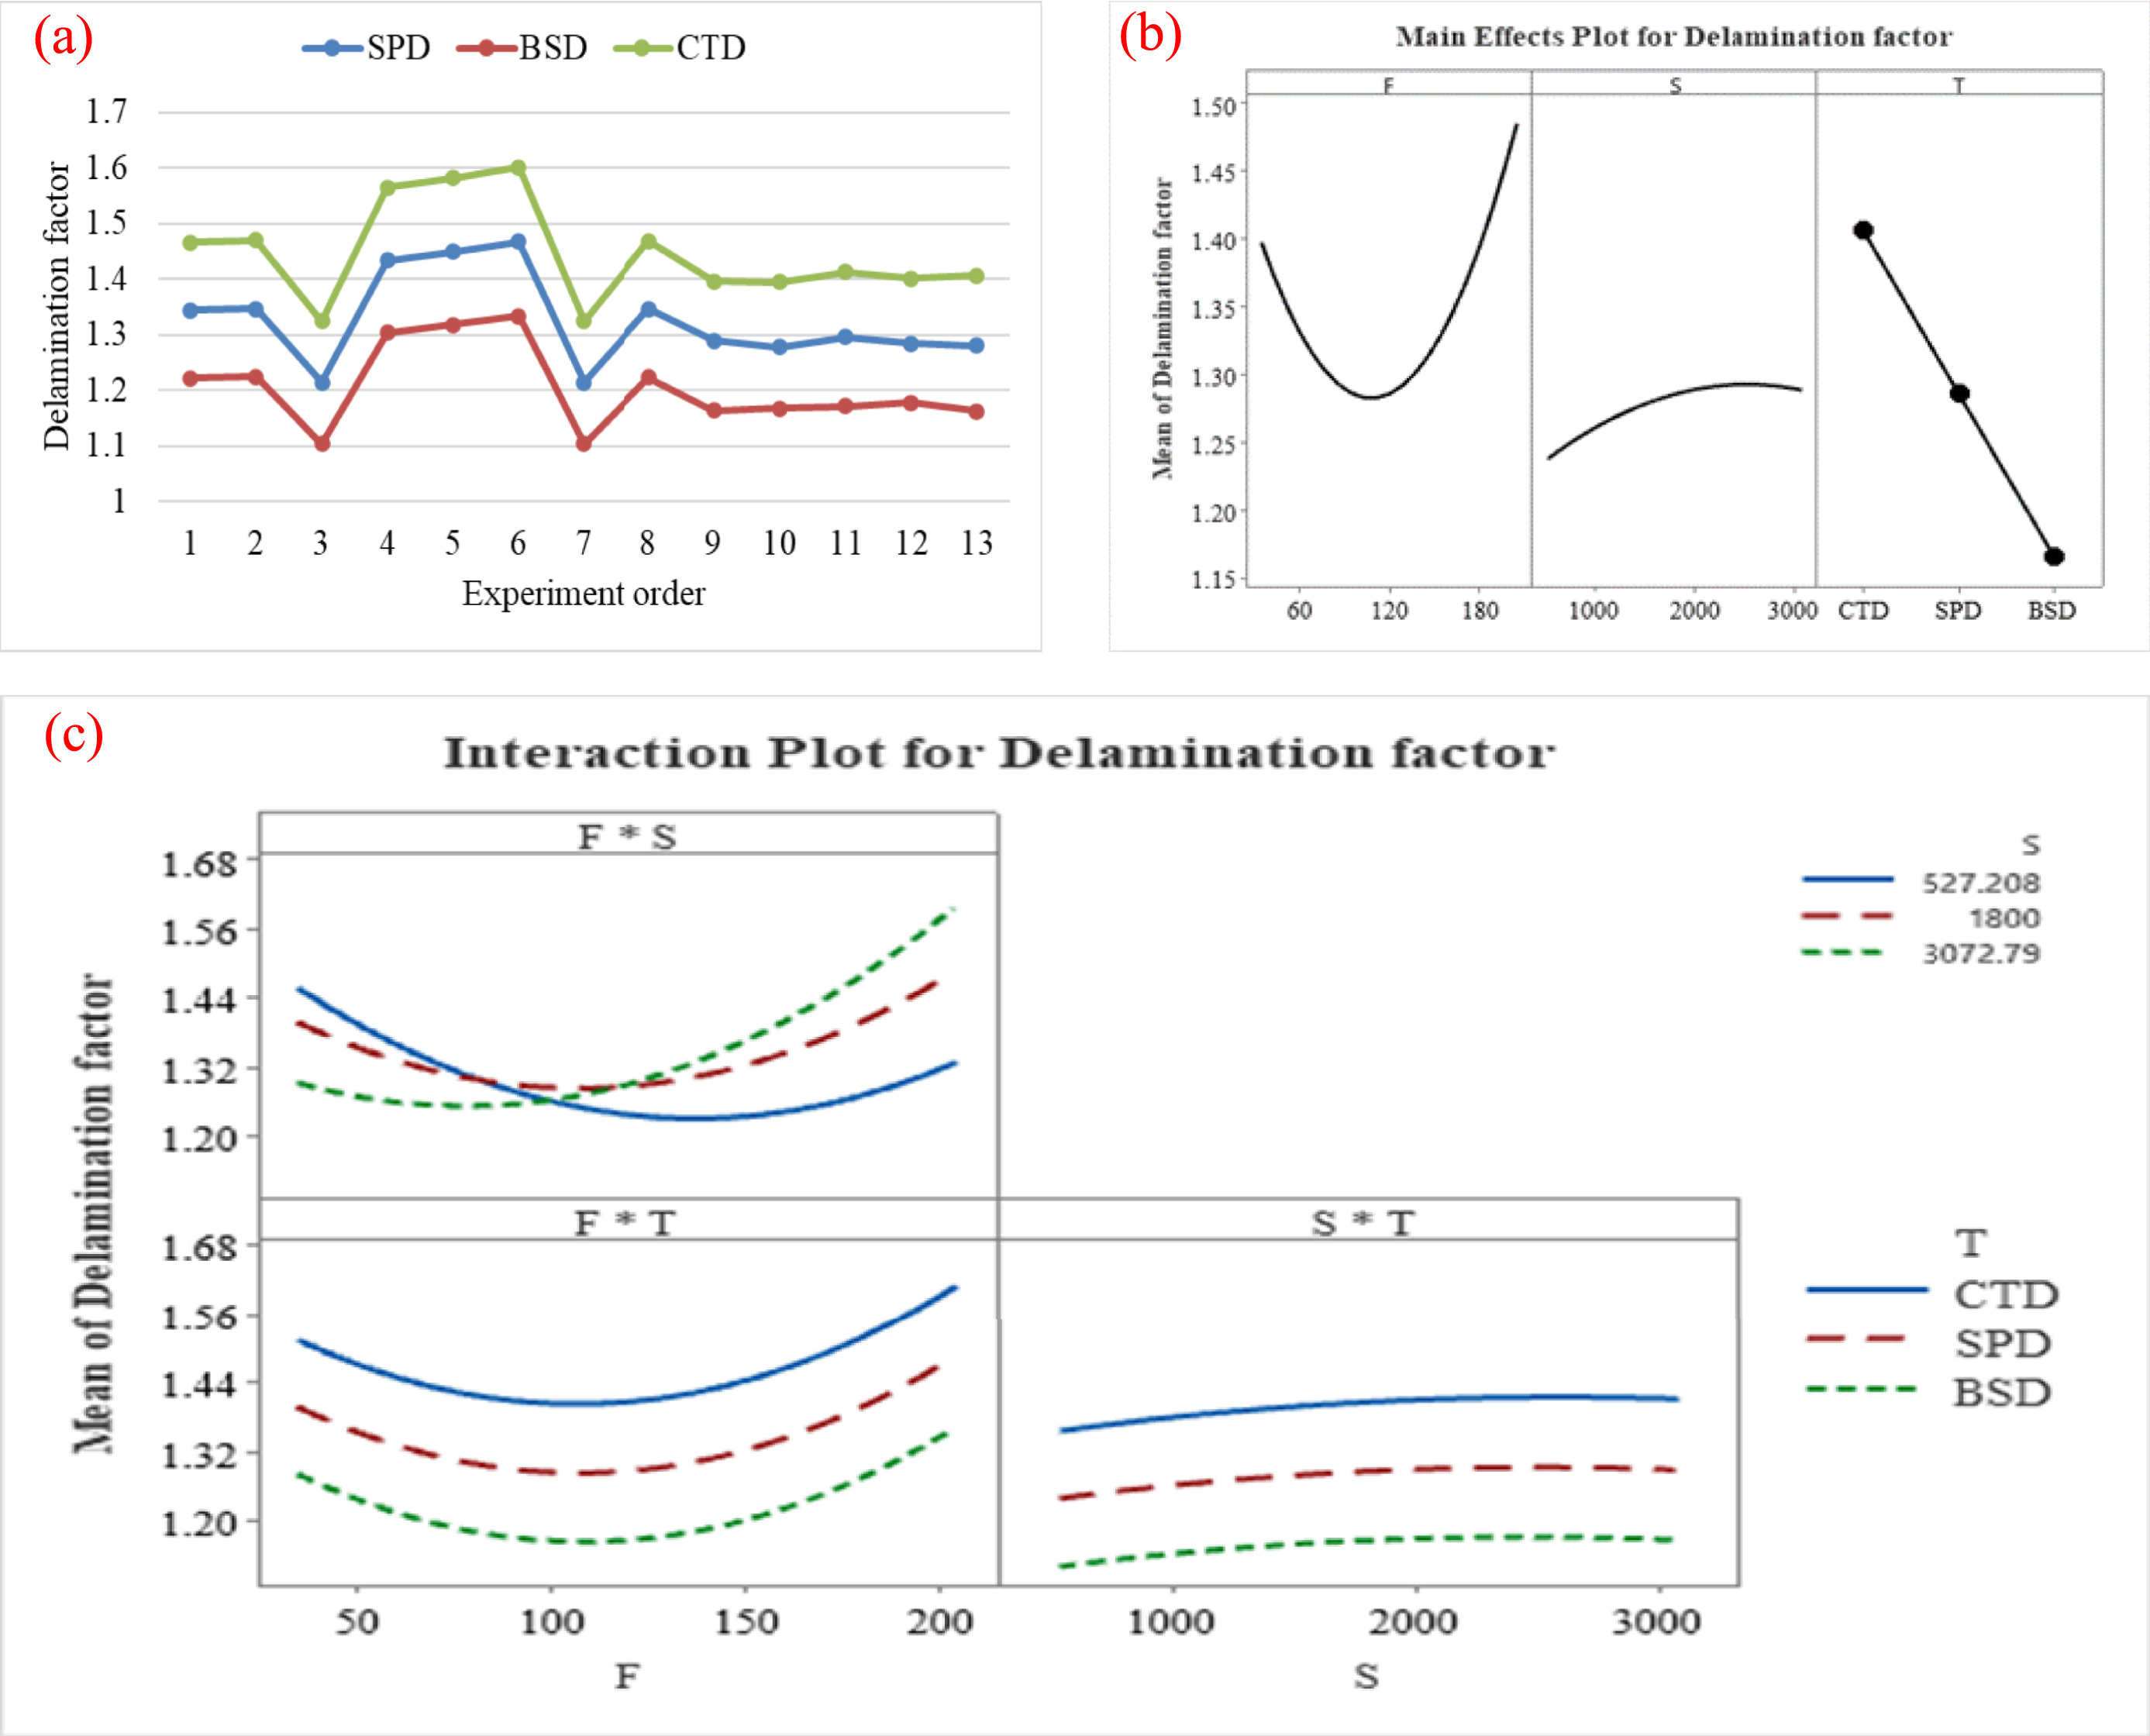
Analysis of variance for exit delamination factor.
Surface roughness analysis
A smooth surface finish is vital for the aesthetics, assembly, functionality, and reliability of the component. Inhibit heterogeneity in the composite laminate due to stiff carbon reinforced in polypropylene thermoplastic matrix encounters complications in producing smooth surfaces during drilling.
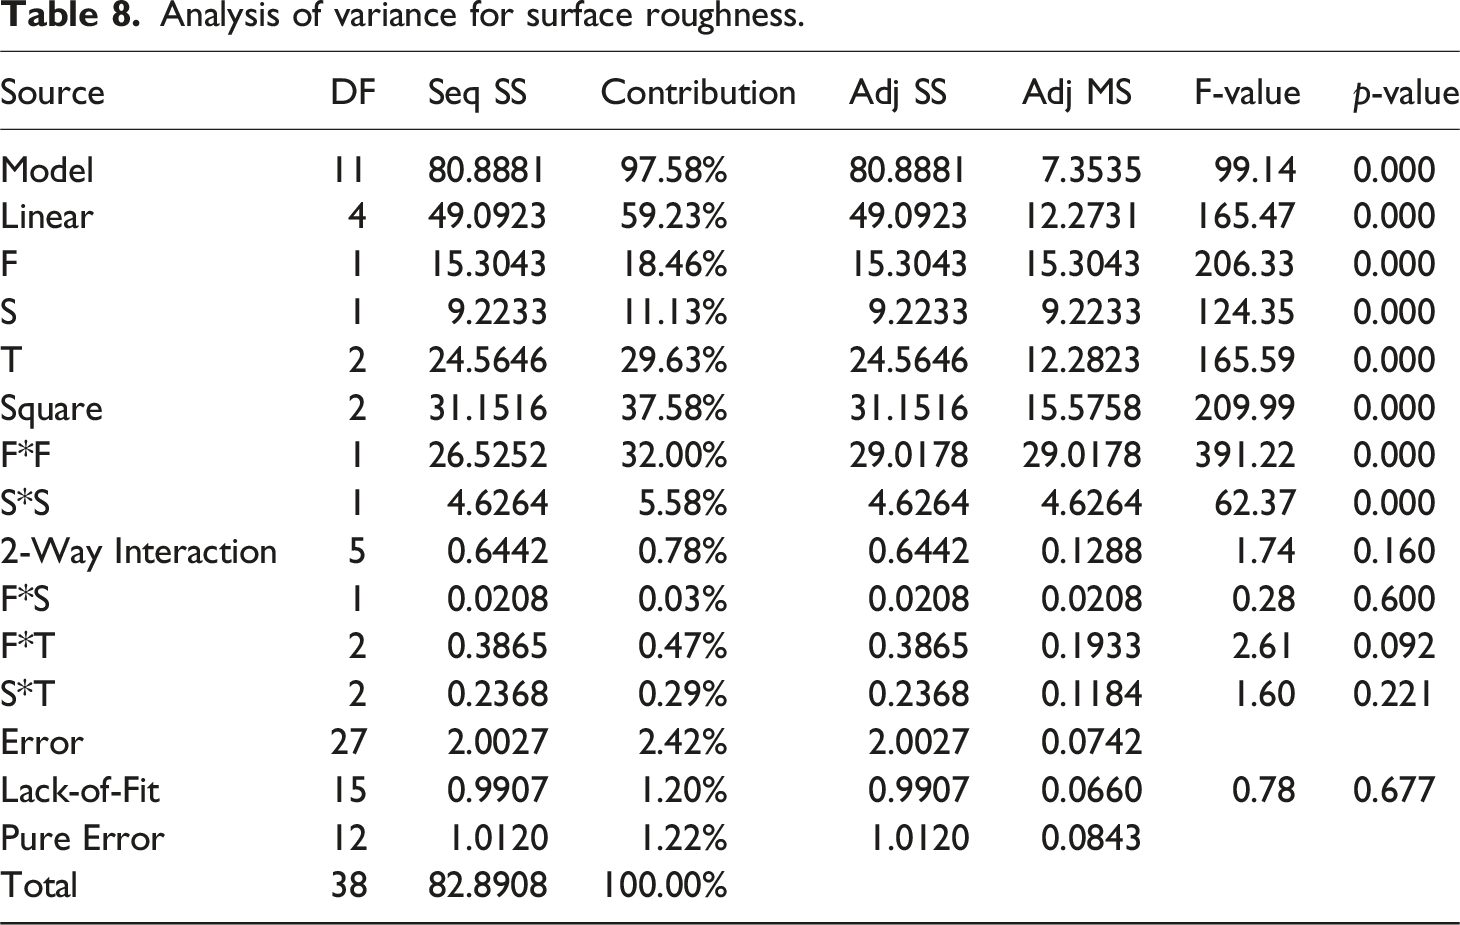
According to Table 4, BSD produced 34.25% and 23.81% lesser surface roughness than CTD and SPD tools, respectively. CTD, SPD, and BSD had minimum surface roughness values of 2.8 µm, 2.2 µm, and 1.8 µm at 35 mm/min and 1800 rpm, respectively. The maximum surface roughness for CTD, SPD, and BSD is 7.3 µm, 6.3 µm, and 4.8 µm with a feed rate of 120 mm/min at a spindle speed of 1800 rpm. The same trend can be also seen in Figure 9(a). It has a sharp edge and chisel tip, resulting in better stability and reduced vibration, which helps achieve a precise hole compared to both SPD and CTD. BSD produced lesser thrust force and heat. Figure 9(b) shows the plot of the main effects of surface roughness. Initially, surface roughness increases with the increase of feed rate. After 120 mm/min, it again started to decrease with the increase of feed rate. Thrust force increases with the increase of feed rate. Hereafter, force-induced damages like fiber pull-out increase, resulting in increased surface roughness. Also, less thrust force decreases delamination and helps in lesser surface roughness. Higher temperature reduces the fiber holding capacity of the matrix, which increases the surface roughness by phenomenon like fiber pull out at increased thrust force. Surface roughness was found to be a function of mechanical and thermal interaction in the case of thermoplastic composite. The interaction plot for the surface roughness is displayed in Figure 9(c). All lines within the selected range of parameters are parallel, implying no interaction occurred. Plots for surface roughness (a) variation with experiment order, (b) main effects, (c) interaction.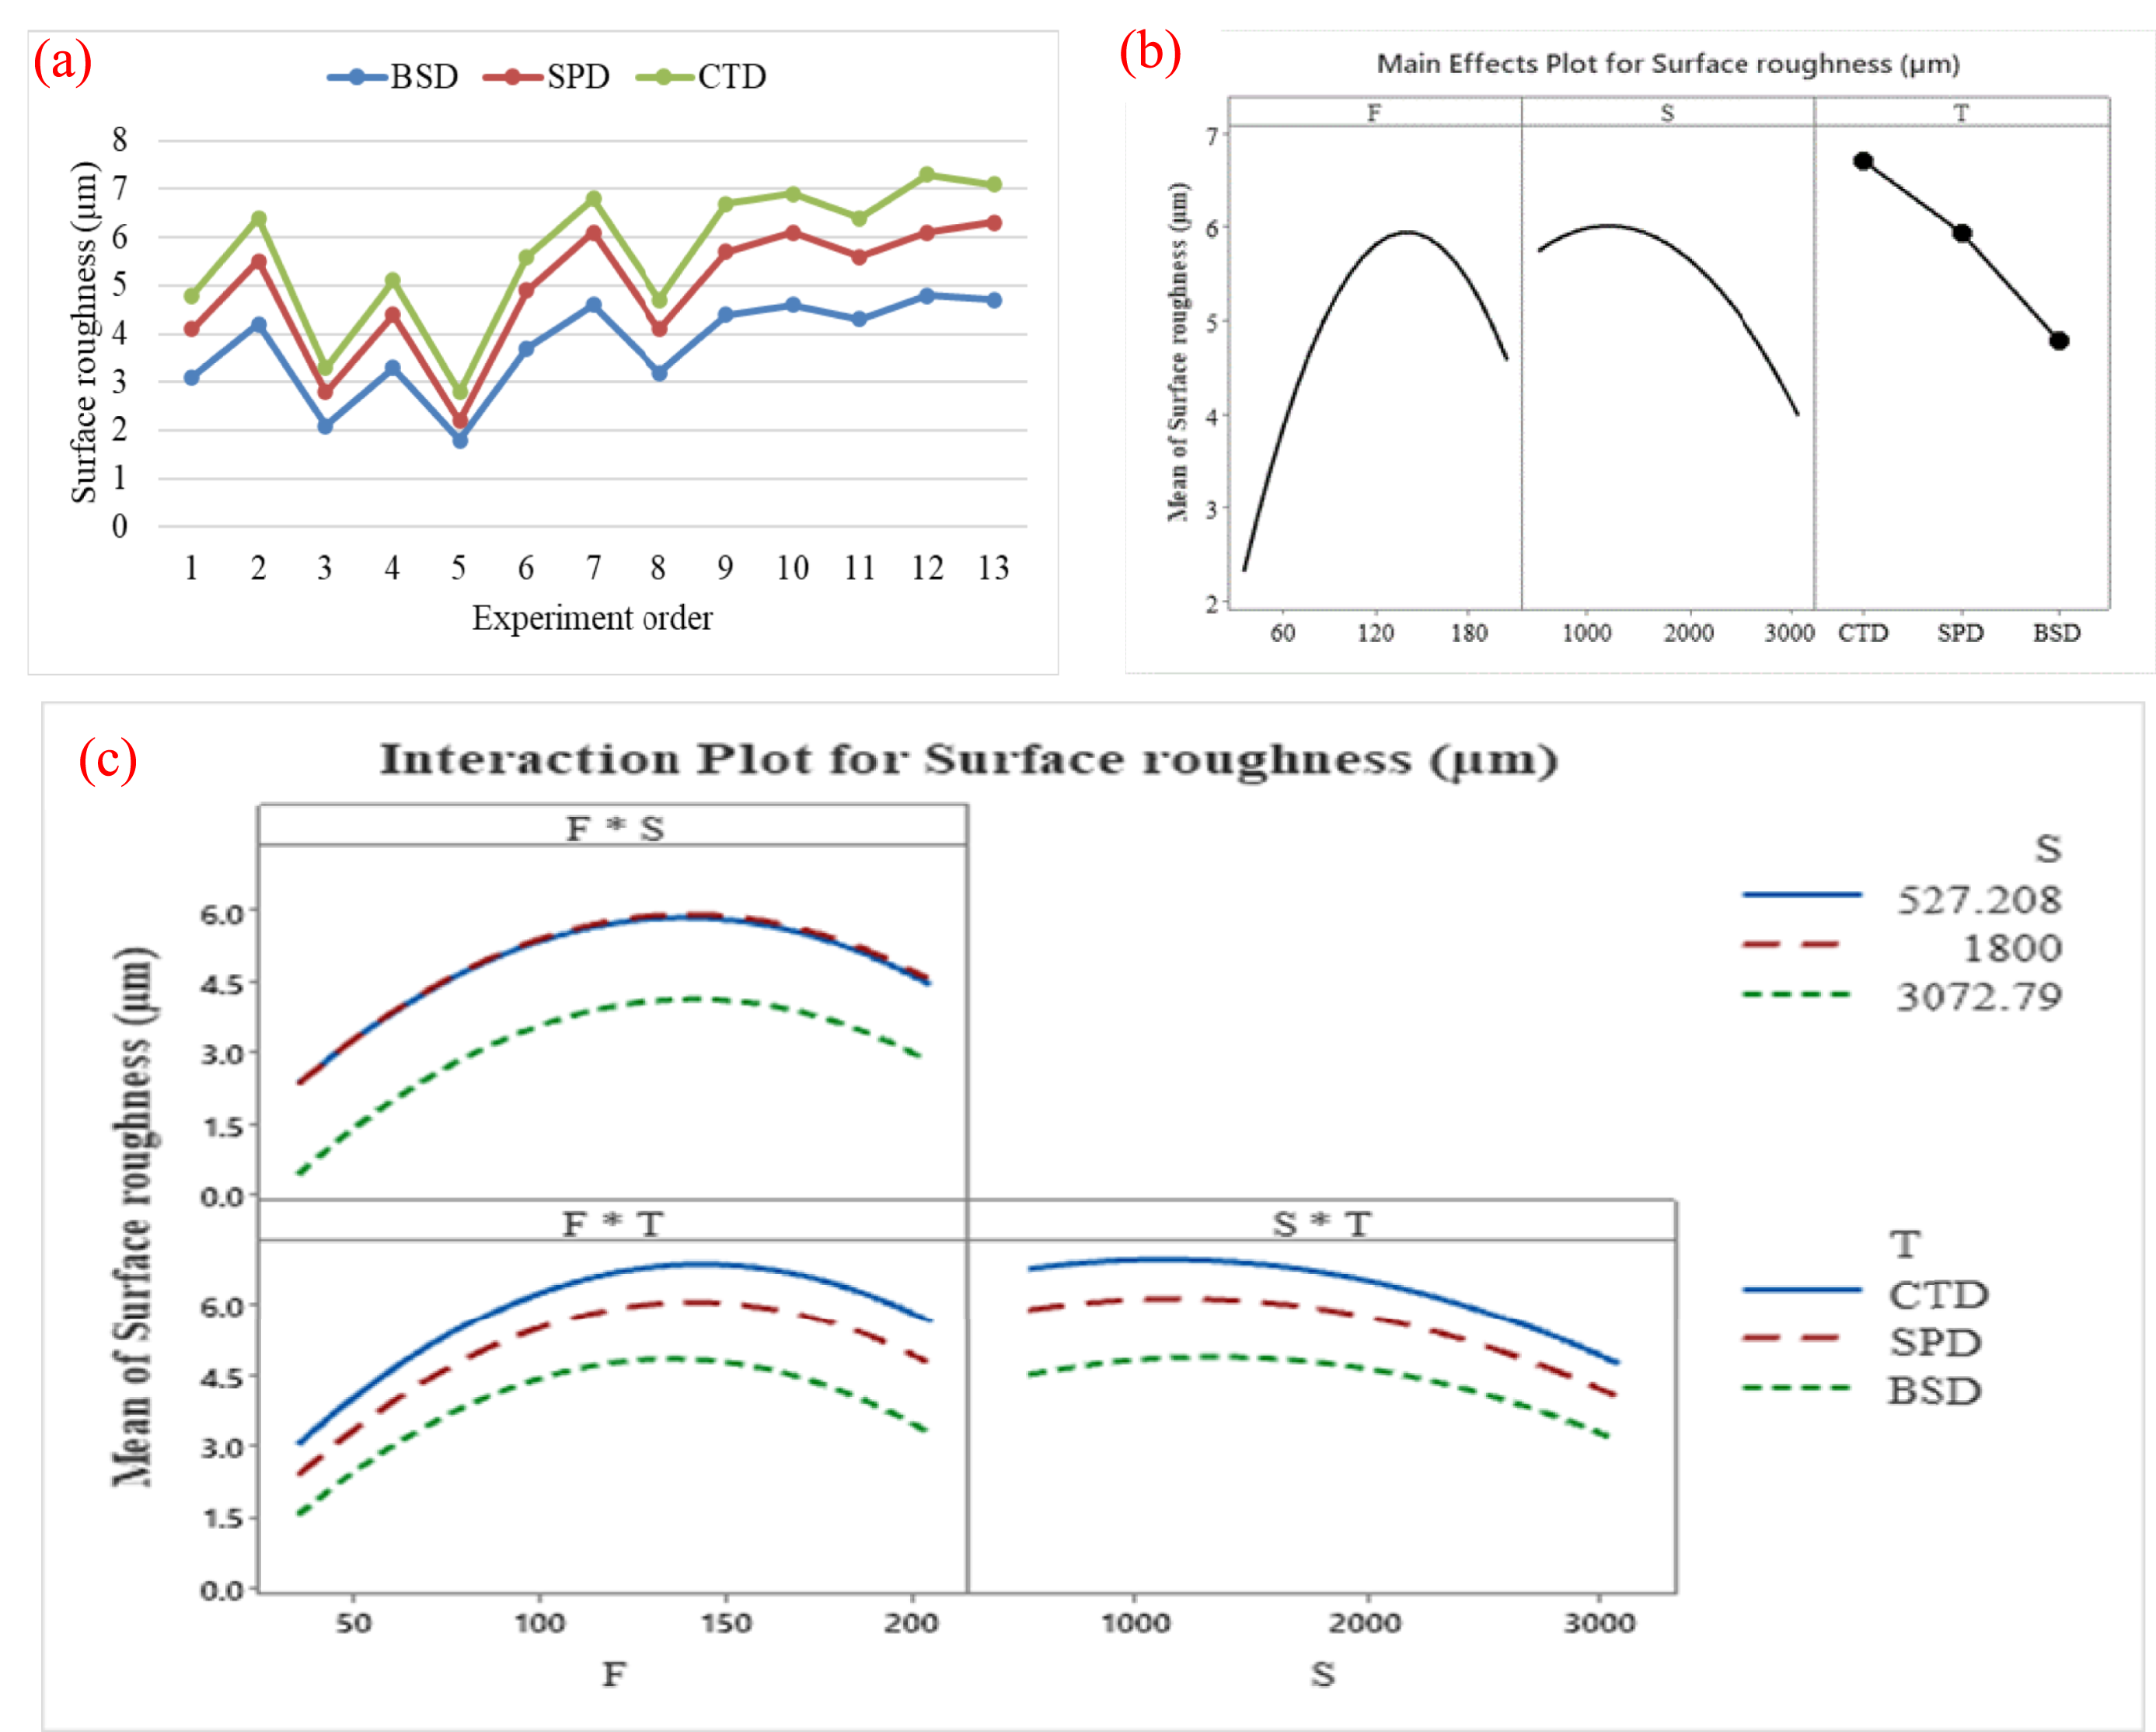
Figure 10 shows the scanning electron microscopic images of the hole wall made by the BSD tool. For the microscopic study, the hole was cut, as shown in Figure 10(a). The surface irregularity and feed direction are shown in Figure 10(b). Fiber-matrix debonding is seen in Figure 10(b). This phenomenon occurs due to high mechanical stresses generated perpendicular to the fiber.
30
When these stresses exceed the bonding force of the fiber-matrix interface, both get separated. Debonding leads to delamination. Carbon fibers are brittle in nature; hence, they failed due to brittle fractures, as shown in Figure 10(c). Matrix loss is a localized phenomenon that occurs due to a combination of thermal and mechanical effects. The drilling-induced heat softens the matrix, and mechanical stresses from cutting forces detach the matrix, forming a local void (Figure 10(c)). During drilling, the produced heat softens or sometimes melts the thermoplastic matrix. With the help of a tool, the softened matrix gets spread and is known as matrix smearing, as shown in Figure 10(d). Matrix smearing locally decreases the surface roughness by filling the uneven surfaces created by fiber cutting.
31
SEM image of the hole drilled at 60 mm/min and 900 rpm with BSD.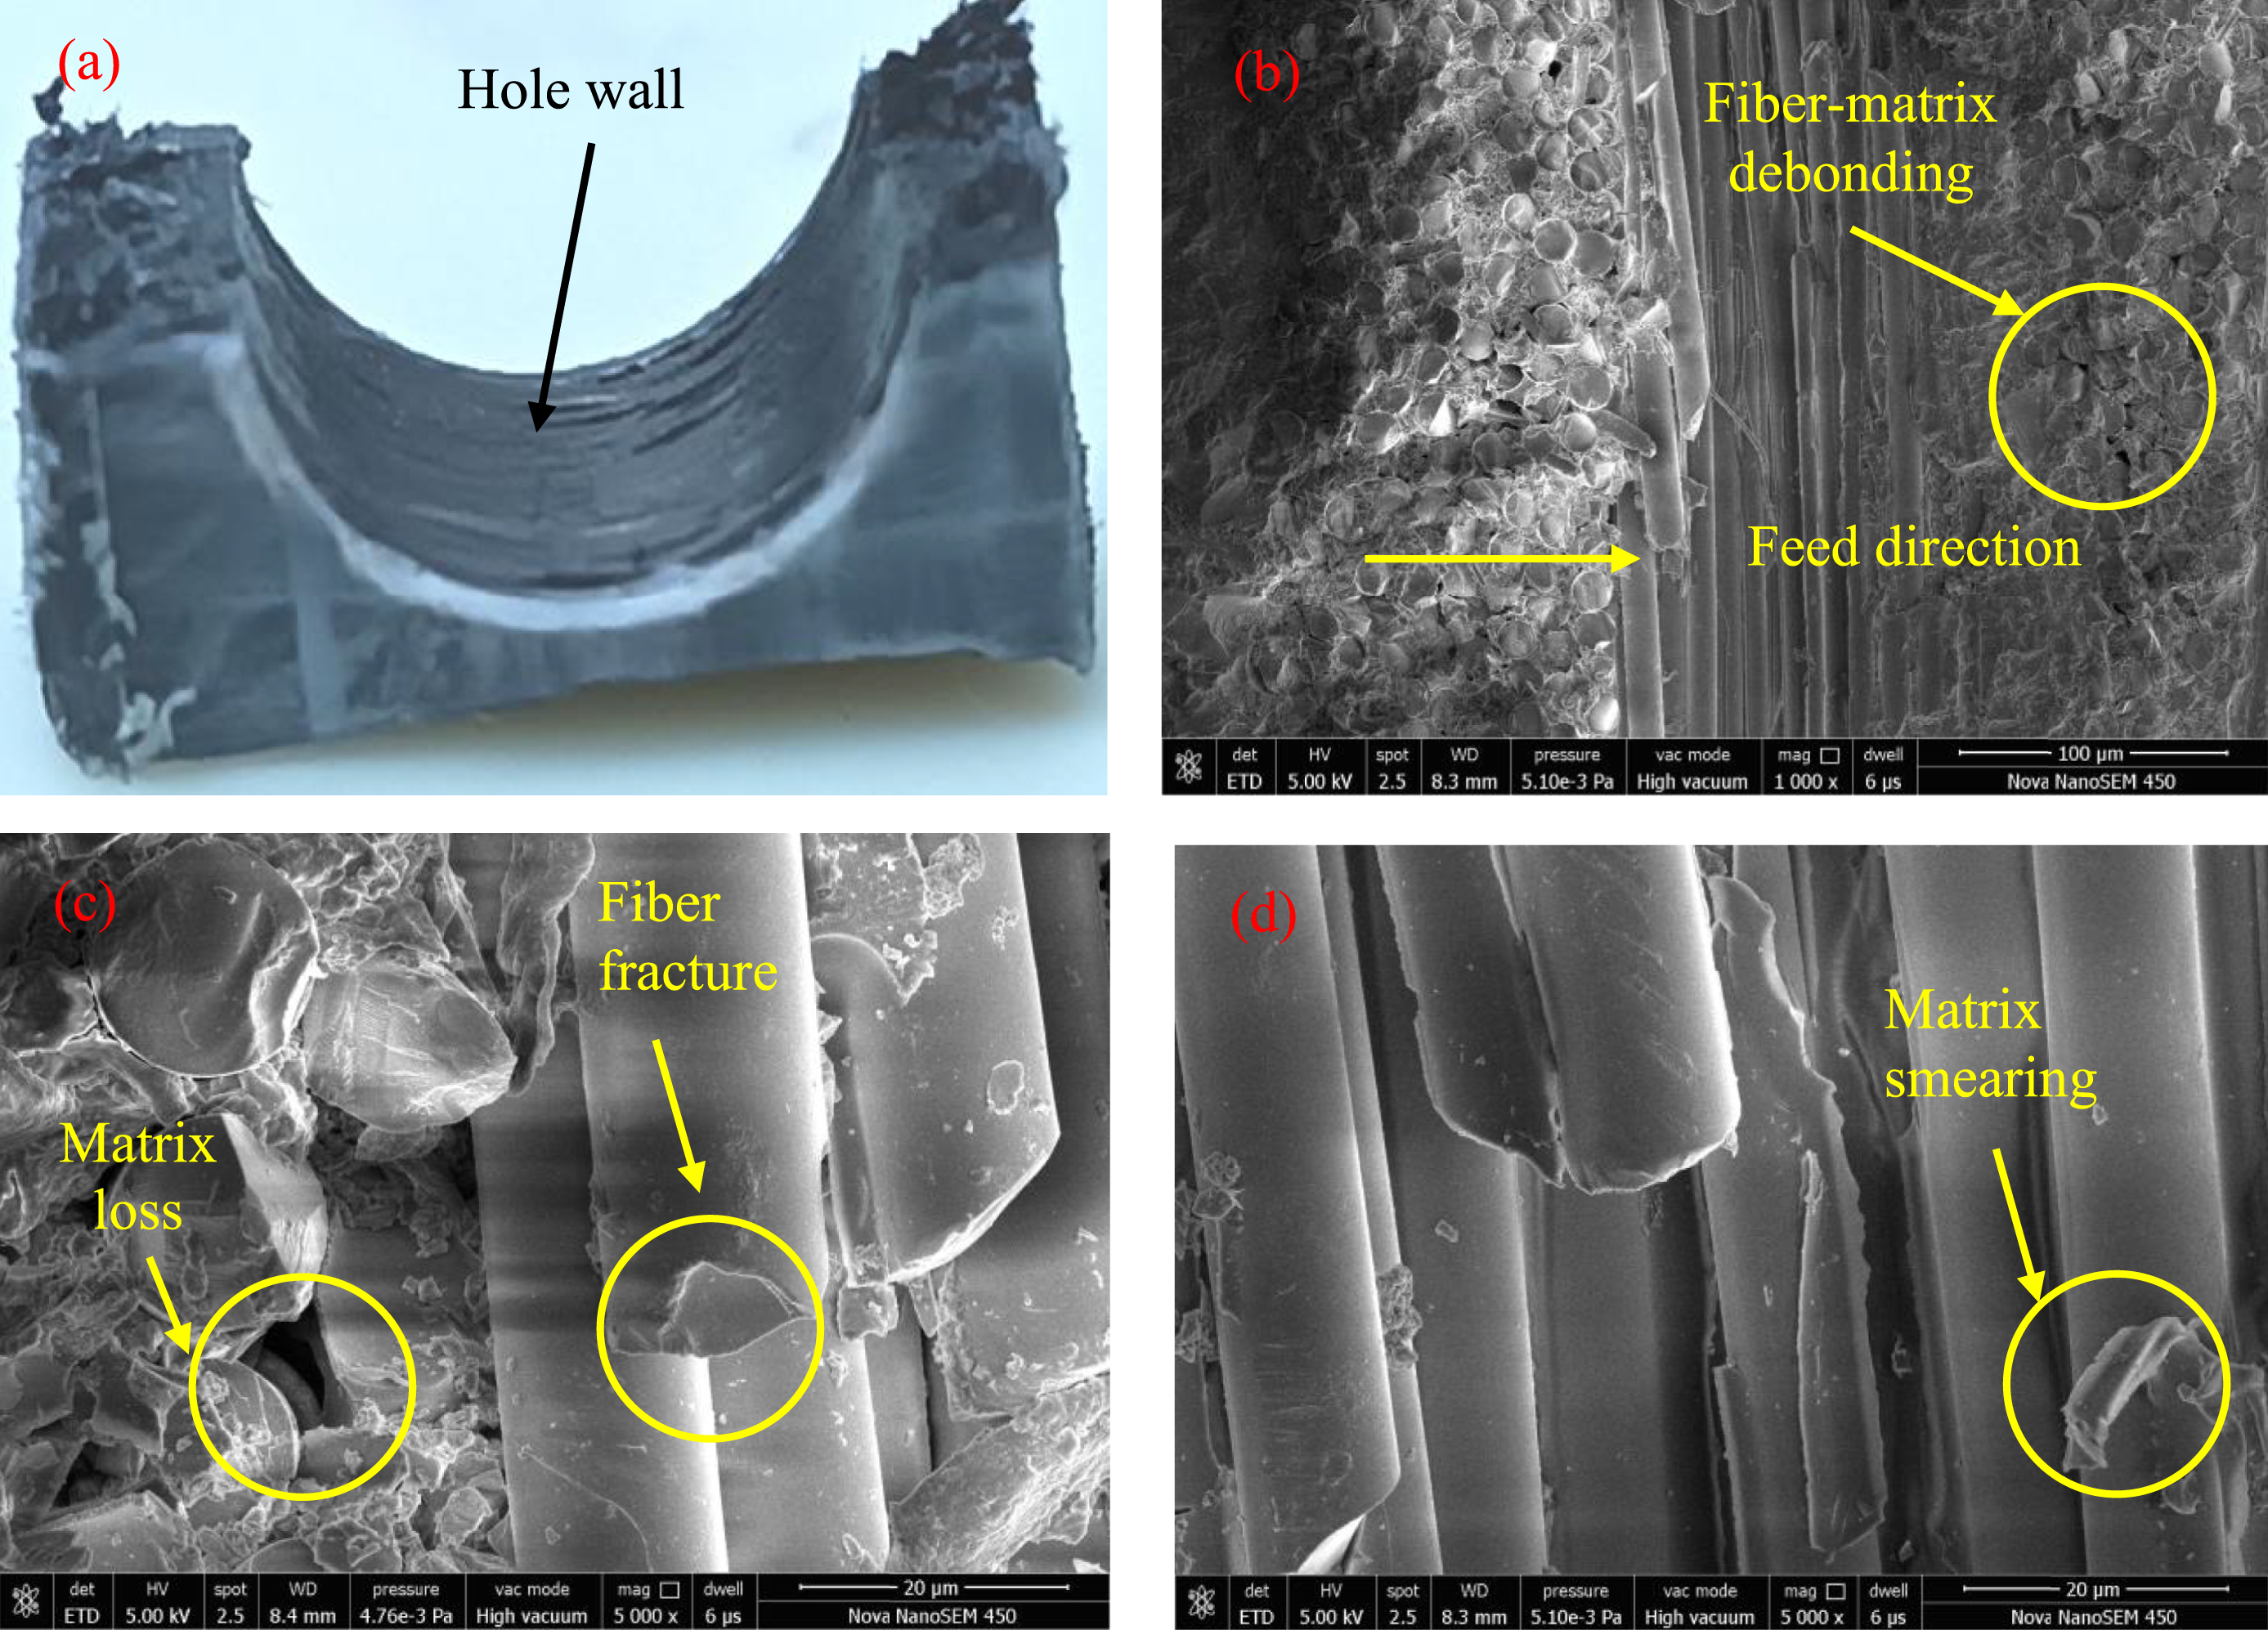
Analysis of variance for surface roughness.
Optimization of the input parameters
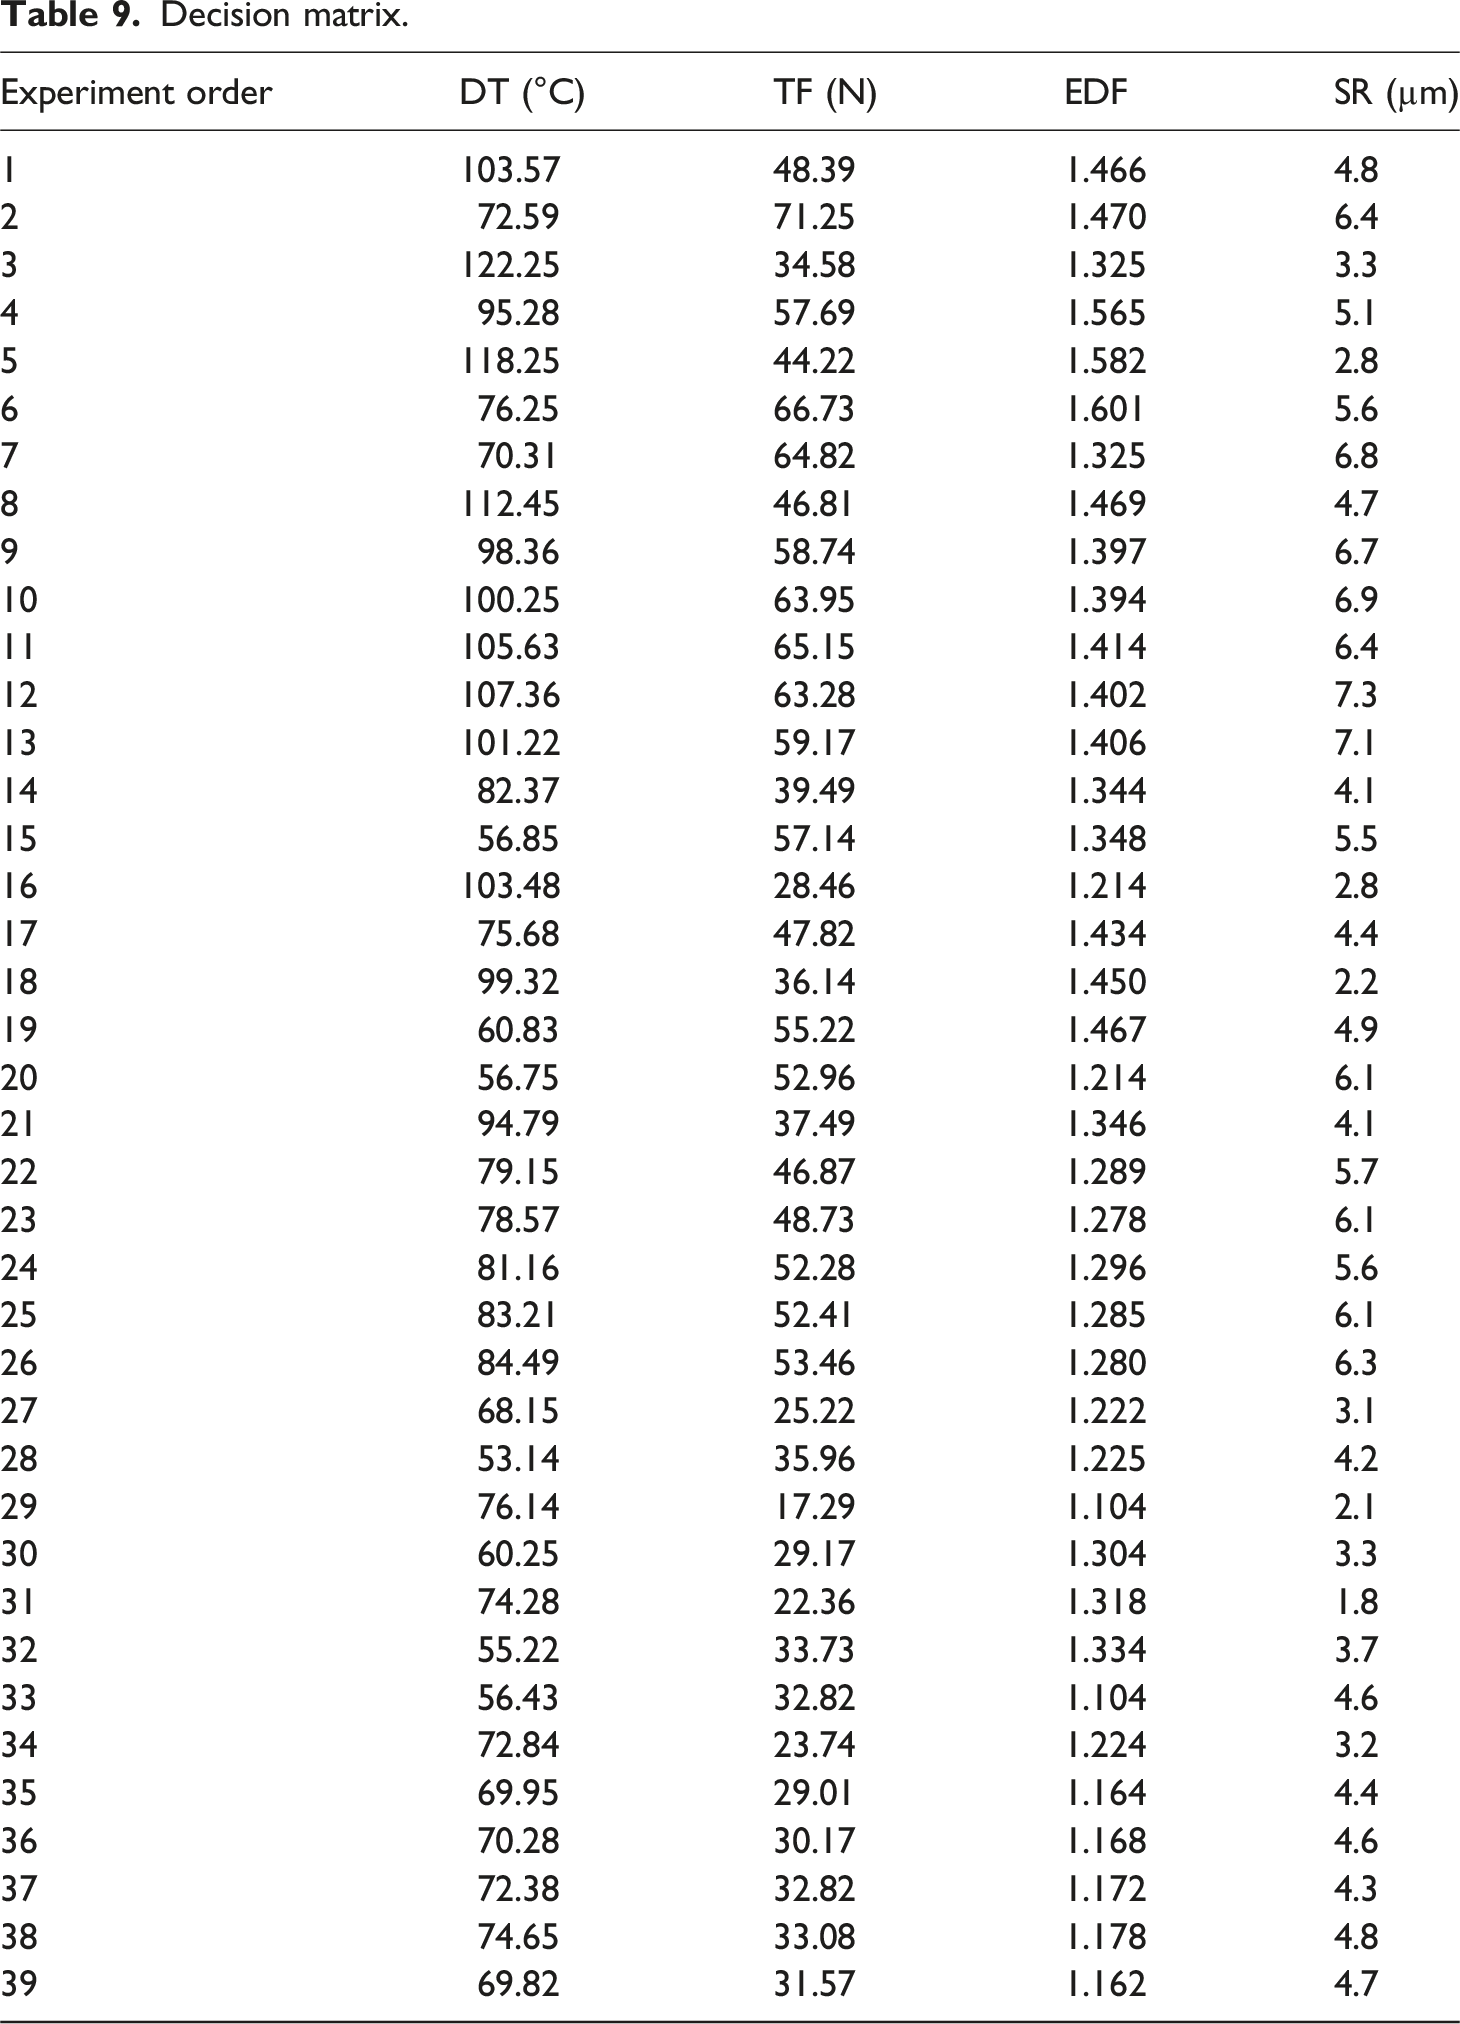
TOPSIS (Technique for Order of Preference by Similarity to Ideal Solution) was used to optimize the input parameters for the best possible result. TOPSIS is a multi-criteria decision-making method (MCDM) that ranks the alternative solutions by comparing their closeness to ideal positive and negative solutions. TOPSIS is applied to find the best possible solution. It has seven steps, starting from constructing the decision matrix to ranking the alternatives.
Step 1: Construction of the decision matrix
Decision matrix.
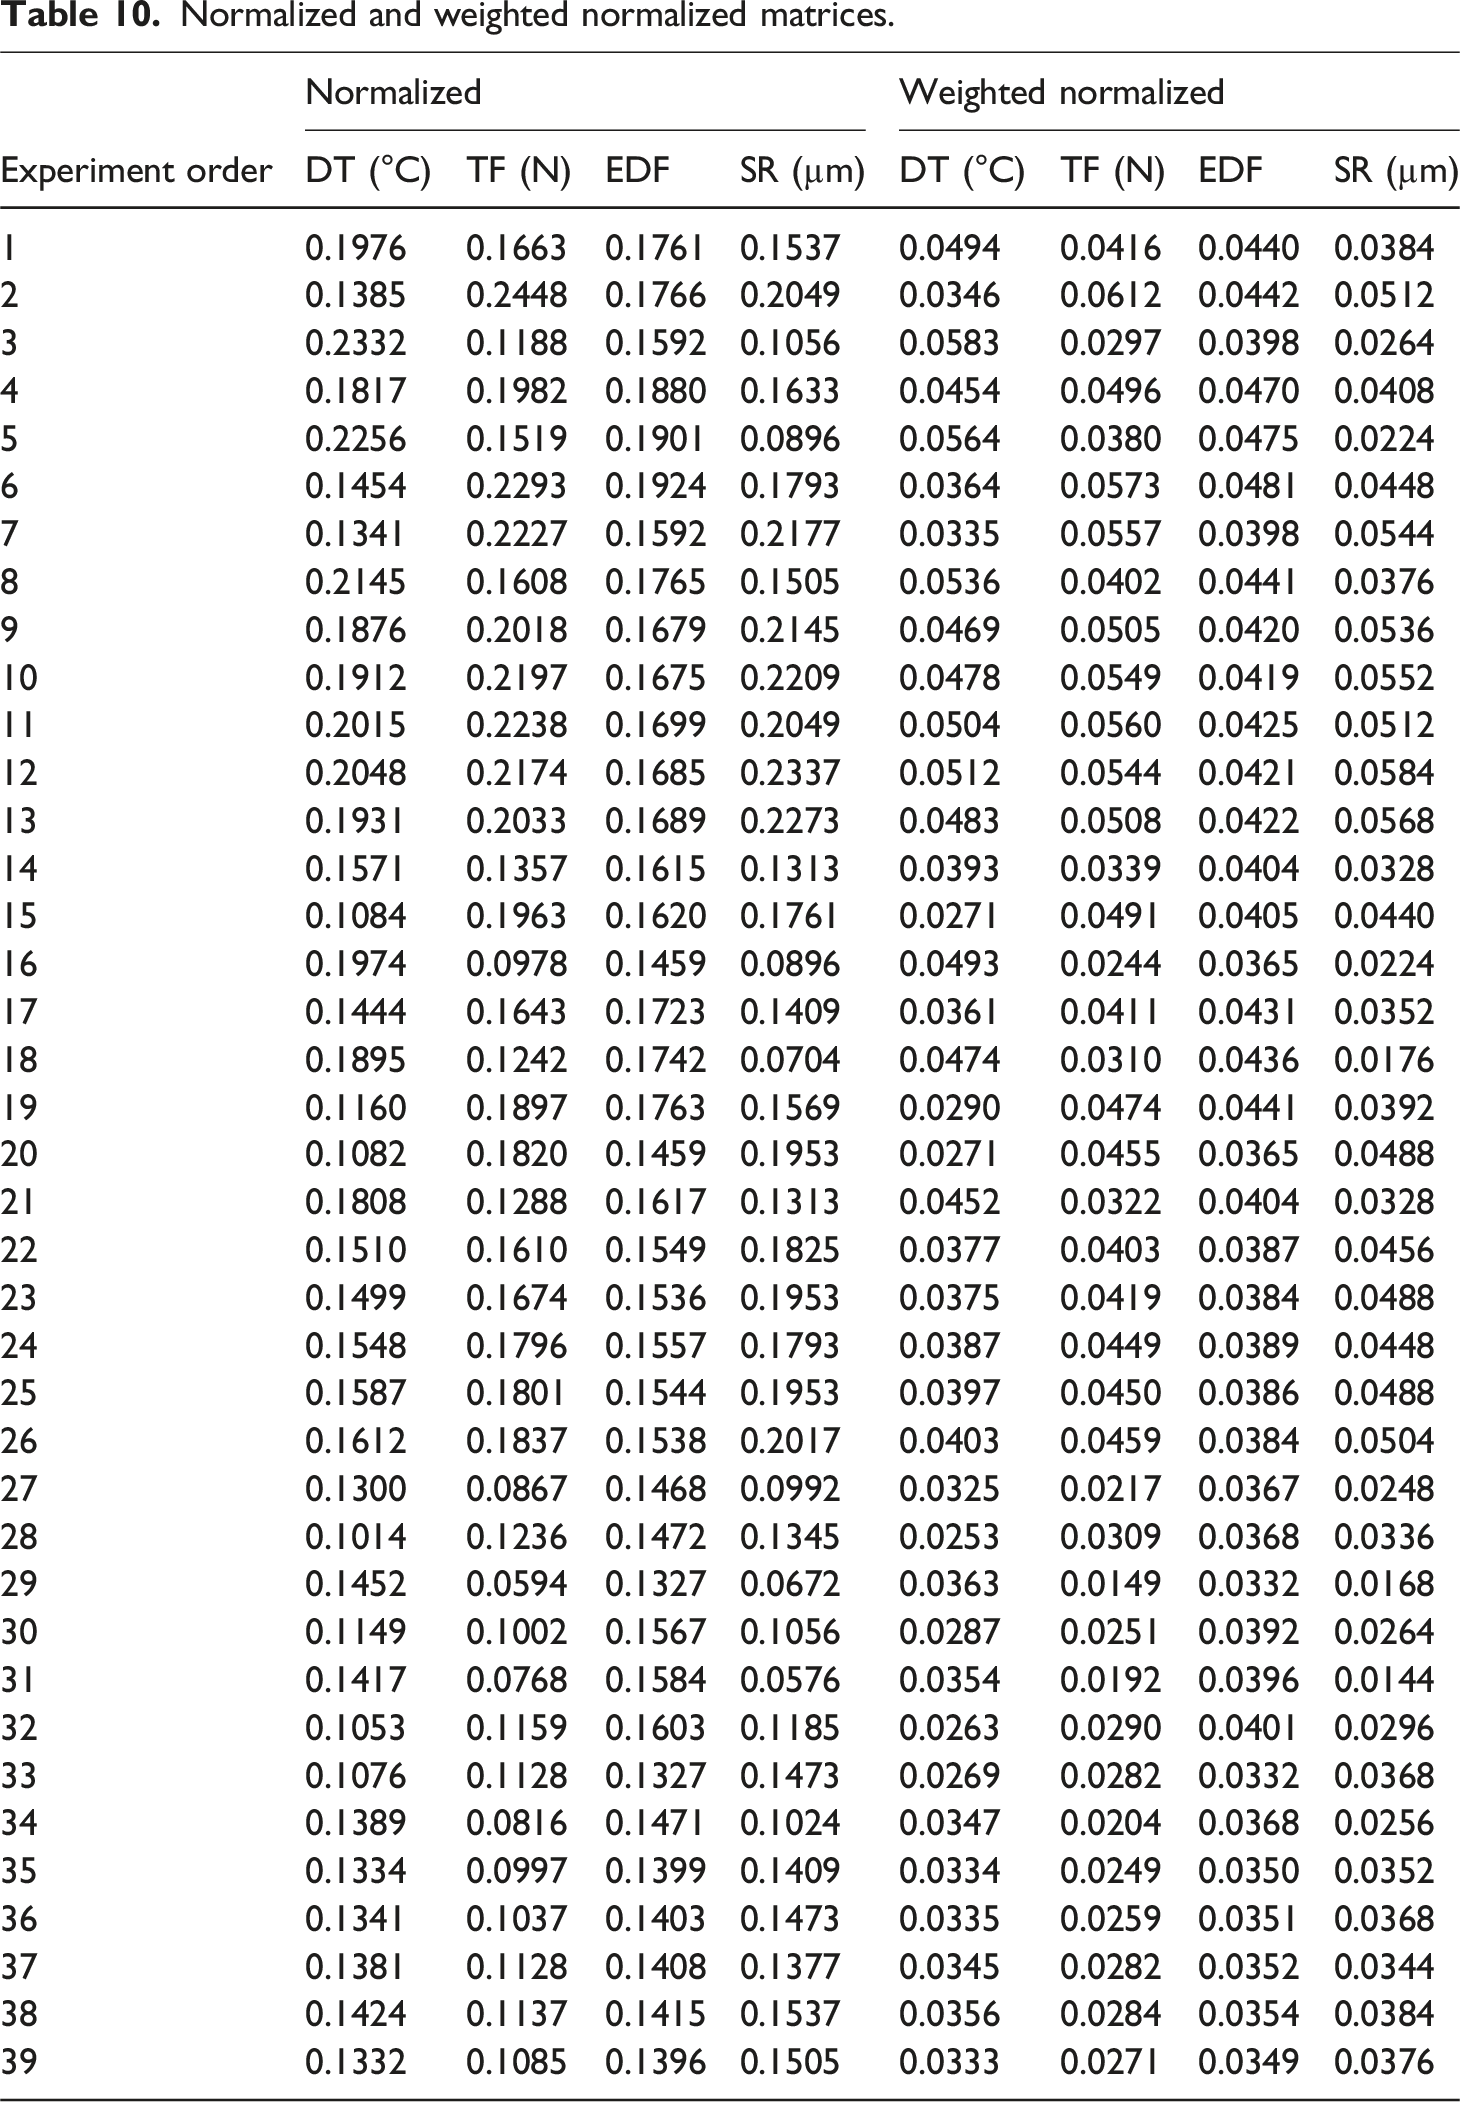
Step 2: Normalization of the decision matrix
Normalization removes the non-uniformity of the data. It brings the data in the range of 0 and 1. For normalizing the data equation (4) was used.
Step 3: Calculation of the weighted normalized matrix
Each output response is assigned a weight based on its importance.
Normalized and weighted normalized matrices.
Step 4: Finding the ideal and negative ideal solution
The ideal solution (A+) is the best value of the response. A minimum value of the drilling temperature, thrust force, delamination factor, and surface roughness is best. Hence, the minimum value of each response was taken as the ideal solution, according to equation (6). A negative ideal solution (A−) is the worst solution, calculated using equation (7). In this case, the maximum value of each response was taken as the negative ideal solution.

Step 5: calculating separation measures
The separation measure tells how far an alternative is from the ideal (equation (8)) and negative ideal solution (equation (9)). Step 6: Calculating relative closeness to the ideal solution

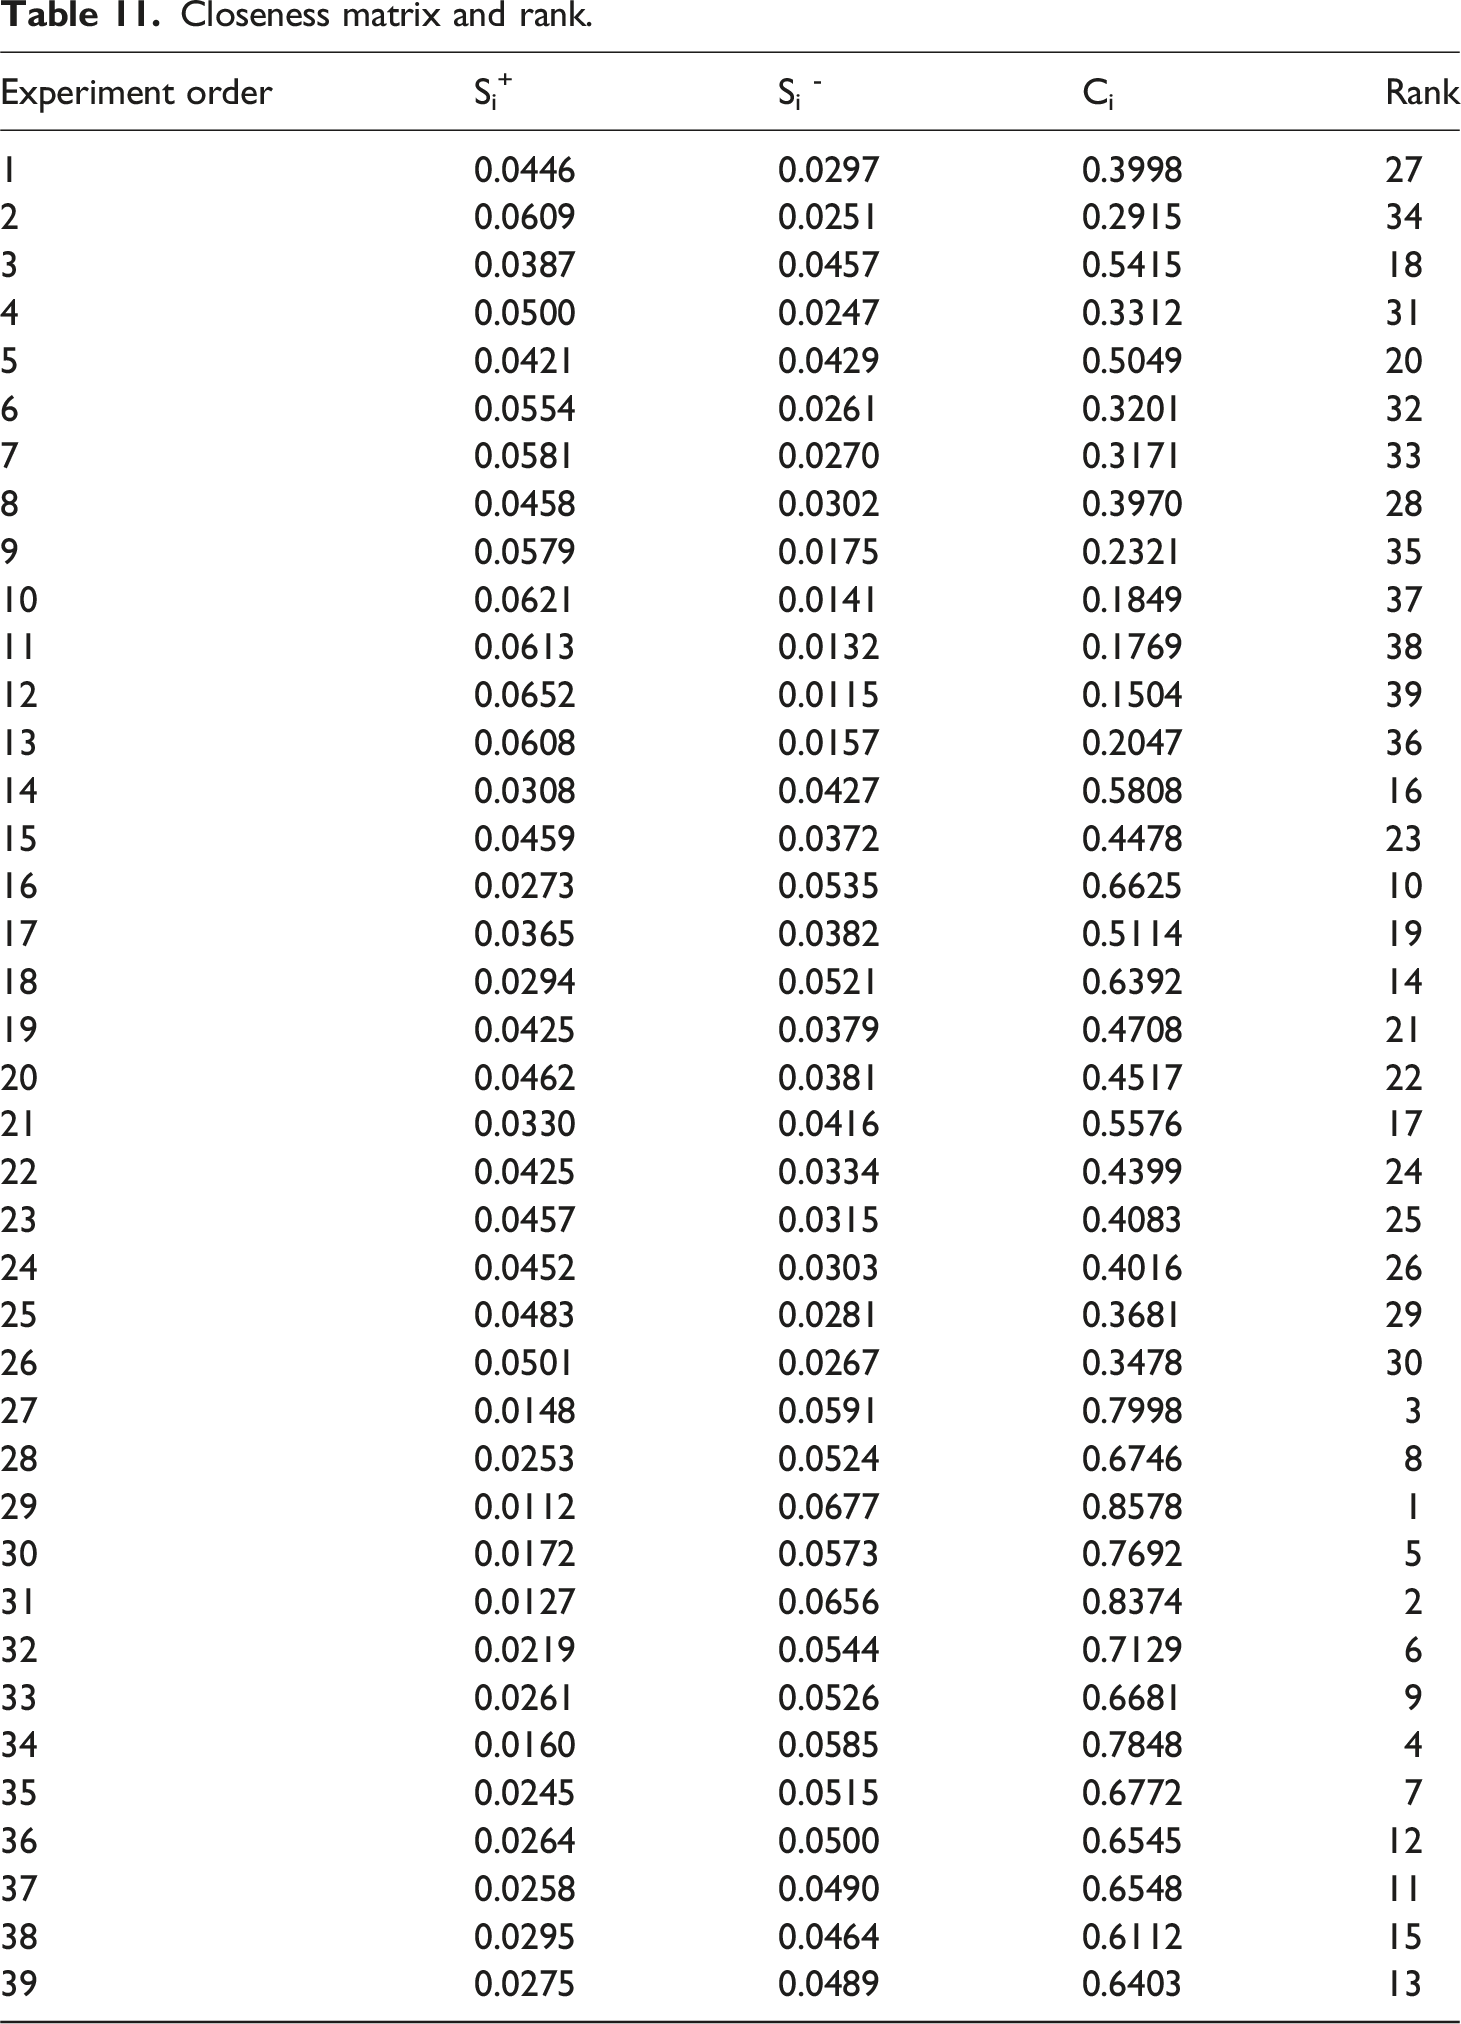
The relative closeness signifies the closeness of the alternative solution from the ideal solution as compared to the negative ideal solution. The relative closeness was calculated using equation (10). Step 7: Ranking of the alternative solutions
Closeness matrix and rank.
Conclusions
The current study systematically explores the machinability of carbon fiber-reinforced polypropylene composite during drilling, taking critical responses such as drilling temperature (DT), thrust force (TF), exit delamination factor (EDF), and surface roughness (SR). Machinability studies on traditional thermoset composites are more easily available in the literature study than thermoplastic composites. The current work is motivated by the need to investigate the drilling behavior of CFRP thermoplastic composite. The effect of three tool geometries, CTD, SPD, and BSD, along with feed rate (F) and spindle speed (S), were analyzed and optimized. Scanning electron microscopy was done to see the insights of the drilled holes. The following conclusion can be drawn from this study: • Tool geometry was found the most influencing drilling parameter. ANOVA results show that tool geometry has 49.97%, 64.40%, 60.60%, and 29.63% contribution in DT, TF, EDF, and SR, respectively, for the linear model. • DT decreases with the increase of F and increases with the increase of S. TF increases with the increase of F and decreases with the increase of S. • EDF is affected by combined effects of thermal and mechanical. EDF decreased from F of 60 mm/min up to 120 mm/min and again started to increase up to 180 mm/min. EDF increases with S. • SR increases with F from 60 mm/min to 120 mm/min and again decreases with a decrease of F from 120 mm/min to 180 mm/min. SR decreases with the increase of S. • Brittle fiber fracture and matrix smearing have been seen in scanning electron microscopic images due to the brittleness of carbon fiber and softening of the polypropylene matrix. • The BSD produced 37.72%, 49.53%, 16.67%, and 34.25% lower DT, TF, EDF, and SR than the CTD. • TOPSIS provided the best solution at the F of 60 mm/min, S of 900 rpm, and BSD tool.
Footnotes
Author contributions
The authors confirm their contribution to the paper as follows:
Study, conception and design, data collection, experimentation, draft manuscript preparation: SRP
Analysis and interpretation of results, draft manuscript preparation, supervision: AM
Design, resources, supervision: HSM
All authors reviewed the results and approved the final version of the manuscript.
Declaration of conflicting interests
The author(s) declared no potential conflicts of interest with respect to the research, authorship, and/or publication of this article.
Funding
The author(s) disclosed receipt of the following financial support for the research, authorship, and/or publication of this article: This research is financially supported by the DRDO-ARMREB, Government of India, in accordance with Grant No. ARMREB/MAA/2019/213.