
Abstract
This study investigates the effects of varying environmental conditions on the interfacial properties of carbon fiber-reinforced polyamide 6 (CF-PA6). The primary focus is the impact of temperature and humidity on the Interfacial Shear Strength (IFSS), debonding energy release rate, and surface-specific work of friction. The study reveals that caused by polymer swelling both temperature and humidity lead to a relaxation of the radial residual stress within the interface and a subsequent reduction in IFSS. Notably, the effects of these factors appear to be superimposed up to the debonding of the fiber-matrix interface. Furthermore, while the debonding energy release rate also follows a declining trend with an increase in temperature or humidity, it displays non-linear characteristics and increases again for simultaneously increased humidity and temperature, implying a coupled effect between temperature and humidity. The study also identifies that humidity alone significantly decreases the surface-specific work of friction, irrespective of the surrounding temperature, so that after debonding a simple superposition is not feasible. To ensure precise results, a microscale climate chamber was developed using the principle of deliquescence to maintain a constant relative humidity during testing. The findings offer valuable insights into the performance of CF-PA6 under varying environmental conditions, informing potential improvements in its design and application.
Introduction
The use of fiber reinforced polymers (FRPs) has increased dramatically in various industries due to their superior mechanical properties. In recent years, the traditional use of thermoset polymers has been partially replaced by thermoplastics. The reasons for this are better recyclability and shorter process times as no curing is required. 1 Glass fiber reinforced polyamides are established materials in the automotive sector by now, e.g., in the underbody construction due to their weight saving potential. 2 When carbon is used as a fiber material, higher specific stiffness and strength values are achieved, which makes carbon fiber-reinforced polyamides (CF-PA) an interesting material for expanding lightweight construction potential. Within this study, a carbon fiber reinforced PA6 (CF-PA6) is investigated. A challenging aspect of using thermoplastic matrix materials is their non-linear visco-elastic stress-strain relation and their high sensitivity towards environmental boundary conditions, such as temperature. When hygroscopic polymers are used as a matrix material, such as PA6, the effects of moisture must also be taken into account. Multiple studies on environmental effects on the mechanical response of unreinforced and fiber reinforced thermoplastics have been conducted. Silvia et al. 3 observed a reduction in stiffness properties in unreinforced PA6 and a decrease of the glass transition temperature (Tg) for an increase in moisture. Parodi et al. 4 measured a decrease in stiffness and strength properties in unreinforced PA6 for increased temperature or humidity, respectively, and confirmed the shift in Tg due to polymer plasticizing and a consequent increase in chain mobility and crystallinity. In the case of CF-PA6, Piao et al. 5 investigated the effects of humidity and temperature on the composite utilizing the three point bending test. They observed a change in failure modes from brittle to ductile at elevated temperatures, which is more pronounced for wet specimens, a decrease in flexural modulus and an increase in failure strain. The reduction in modulus is explained by a weakening effect of elevated temperature and humidity on the fiber-matrix Interfacial Shear Strength (IFSS). This influence of various climate conditions on the fiber-matrix interface, a critical factor determining the overall mechanical performance, remains an underexplored area of research.
Typical tests on single fiber specimens for examining interface properties and strength are the fiber fragmentation test, the microbond test, the fiber push-out test and the fiber pull-out test, each of which has its own advantages and disadvantages.6,7 In general, the fiber-matrix bonding is based on physical, mechanical and chemical adhesion and is highly dependent on sizing agents, which are individual chemical compounds applied to the fiber surface and are different for different fiber-matrix pairings, e.g., thermoset or thermoplastic matrix systems and carbon or glass fibers.8–11 Since the sizing used is often not disclosed as a trade secret and is unknown, it is not discussed in detail in this study, but environmental factors within this sizing must not be disregarded.
The fiber fragmentation test goes back to Kelly and Tyson and consists of a single fiber completely embedded into a dogbone shaped matrix specimen. 12 A requirement is that the matrix failure strain needs to be at least three times larger than the failure strain of the fiber, which leads to repeated fiber breakage each time the failure strain is reached along the embedded fiber under tensile load. 6 Once all fiber segments are shorter or just as long as the critical fiber length l c , which is the length over which enough shear stress can be transferred for the fiber to break, the measured critcal fiber length is used to calculate the IFSS based on a simple analytical model. The fiber fragmentation test has been used to address the effects of environmental conditions on the fiber-matrix interface, i.e., in Schutte et al., 13 who investigated hydrothermal treatment and Ramirez and Carlsson, 14 who characterized the IFSS under sea water conditions. Both concluded that the respective conditioned specimens showed a decrease in IFSS. Despite its ease of specimen preparation and test procedure, the test has numerous shortcomings, since it relies on measuring multiple fiber segments with varying lengths shorter than l c and the test setup is prone for penny-shaped cracks at the fiber-matrix interface, leading to error-prone assessments of the IFSS. 7 Another drawback based on analytical studies can be found in Piggot, 15 who concluded that the fiber fragmentation test predominantly provides frictional data and the results suggest the utilization of another test method.
The development of the microbond test dates back to the mid-1980s, when a method was sought to alleviate the difficulty of embedding individual fibers in pull-out samples with an embedding length smaller than the critical fiber length l c , which is necessary to prevent early fiber rupture. 16 For the microbond test, a single or multiple droplets of a thermosetting resin or a thermoplastic matrix material are applied to a single fiber, from which they are sheared off after solidification. Advantages include low cost manufacturing of the specimens and the possibility to perform multiple tests on a single fiber, while the downsides are large scattering in the results and the dependence of the mechanical properties on the droplet size. 6 Research using the microbond test considering environmental effects include Bori et al., 17 who studied the effects of hygrothermal aging on a carbon-epoxy combination who saw a significant reduction of the IFSS after conditioning using the already mentioned explanatory model of plasticization effects in the matrix and a reduction of radial pressure due to thermal expansion and Straub et al., 18 who investigated the effects of elevated temperature and pull-out rates on an aramid-epoxy system and concluded that an increase in temperature leads to a decrease in pull-out force. More recent research can be found in Downes and Thomason, 19 who investigated moisture effects on steel fibers inserted in PA6 and concluded that water has a diminishing effect on the IFSS, without going deeper into the underlying mechanics, and in Bedi et al., 20 who utilized the microbond test to investigate the dependence of the IFSS and the energy release rate on the pull-out rate in carbon fiber reinforced epoxy composites, with and without the addition of nanotubes. They concluded that both the IFSS and energy release rate show a monotonic non-linear increase for an increase in pull-out rate for the composite without nanotubes.
The single fiber push-out test resembles the only micro-mechanical in-situ test introduced within this study, which can be applied on the material of interest without the need to fall back on model specimens containing a single fiber. 6 As such, important history variables such as the pressure and temperature during manufacturing affect the test results directly. The test requires to cut and polish thin slices from the composite material, followed by the pushing out of fibers which are perpendicular to the polished surface using a nano-indenter. A major advantage of the push-out test is that the effects of adjacent fibers, i.e., the fiber volume fraction, are taken into account directly in the experiment, which on the other hand makes it more difficult to isolate the fiber-matrix interaction. A major disadvantage is that the cutting and polishing process usually requires the use of coolant (in the form of added water) and polishing agent in the form of a diamond suspension. This means that possible damaging influences of water on the interface properties can no longer be separated from the subsequent conditioning.
The single fiber pull-out test, as employed in this study, is a direct method that offers a straightforward interpretation of the fiber-matrix interface properties under the influence of various climatic conditions. Its key advantage lies in its ability to directly calculate the IFSS, a critical determinant of load transfer efficiency in composite materials. However, one limitation is that it requires careful sample preparation and precise control of experimental parameters to achieve accurate results. Doshi et al. 21 used the single fiber pull-out test to focus on the uncoupled influence of temperature and humidity on the IFSS in glass fiber reinforced epoxy. In their study they saw an increase/decrease of the IFSS when the temperature was decreases/increased. The IFSS also dropped by 25% for specimens that were immersed in water. They explained the observed effects by matrix expansion mechanisms due to an alteration of temperature and by a plasticizing effect of moisture on the polymer. Multiple studies on the effects of temperature and humidity on PA based FRPs utilizing the fiber pull-out test were made by the group around researcher K. Tanaka.22–24 Conditioning was realized by submersing the specimens directly into distilled water, which is a more aggressive conditioning method due to the direct water contact compared to the present study. Their main results are that water absorption not only leads to a softening of the matrix behavior, but also directly decreases the IFSS by diffusing water. Comparing the mentioned studies, different fracture patterns are described for different conditioning states. While it is mentioned in one study 22 that dried specimens resulted in blank fibers and wet specimens showed an early failure in the matrix which resulted in matrix residue remaining on the pulled out fiber, another study 23 of the same group states the opposite for multi-fiber tensile tests, leaving room for further investigations. They observed varying effects of water absorption between PA6, PA66 and PA12 based specimens and concluded that the transcrystallinity in the vicinity of the fiber-matrix interface in CF-PA6 and CF-PA12 specimens decreased the water absorption and subsequently saw a lower reduction in the IFSS. In this study the weakening effect of water on the IFSS was found to be reversible, which is demonstrated in re-dried specimens, which is in direct contradiction with the findings in Chen and Piggot, 25 who found no restoration of the IFSS after re-drying their carbon-PEEK specimens. The explanation for a decreasing IFSS for increased humidity or temperature levels, respectively, as given in Tanaka et al. 24 is strongly based on a comparable expansion mechanism due to both environmental factors and a consequent decrease in radial pressure within the fiber-matrix interface, which was backed up in a linear-elastic thermal finite element analysis (FEA) in an earlier study. 26 Open questions, which have not been addressed in the mentioned studies are how the simultaneous combination of temperature and humidity within a stable climate affect the IFSS, which will be discussed in the present study.
As can be seen above, the standard for testing environmental effects on microsamples is to condition the samples at elevated temperatures and in full contact with water and then only test them at room climate or elevated temperatures without keeping the corresponding conditioning atmosphere constant during the test. The reason for this is that the test methods require special microscopic test equipment, which generally cannot be used in commercial climate chambers. Multiple studies have been conducted on the diffusivity of water into PA6 and CF-PA6, e.g., in Abacha et al. 27 and Sang et al. 28 While carbon fiber reinforced PA6 shows a diminished diffusivity in comparison to neat PA6, the effect of a single fiber should be neglectable. A numerical study on the water uptake in reinforced and unreinforced PA6 was conducted in Lei et al., 29 where a good agreement with the Fickian and Langmuir model was found, with the latter performing better. According to both models, the water uptake is accelerated for a shorter characteristic length of the specimen. Whether this relation scales linearly to the microscopic length scale remains debatable, but a rapid diffusion rate for micro-mechanical specimens with a large surface to volume ratio is probable, especially at elevated temperatures. 30 Combining the characteristic length scale of the single fiber pull-out specimens of a few millimeters and the measured diffusion coefficients of around 8 ⋅ 10−6 mm2/s for dried PA6, a full saturation at 8m.% is predicted in less than 1 hour, which is well within the time required for the specimen handling before the actual testing begins. This quick deconditioning of pull-out samples was confirmed in Doshi et al., 21 who saw a reduction of the conditioned weight gain of 5% after 3 min and 11% after 10 min, respectively. A test environment that differs from the conditioning environment, as was the case in the studies mentioned, is likely to rapidly alter the water content within a micro-scale specimen. Consequently, this would prevent the correlation of the test result with the conditioning state. Therefore, to develop a test methodology that maintains the climatic conditions during the test phase is a strong incentive.
The significance of this study lies in its potential to enhance our understanding of the climatic effects on CF-PA6 performance, potentially paving the way for improved material design and utilization in industry.
Materials and method
The material of interest is a CF-PA6 hybrid. In its real life application the material is processed in a long fiber thermoplastic direct (LFT-D) compression moulding process. The designation as a hybrid stems from the combination of an LFT-D plastificate, which corresponds to a discontinuously reinforced PA6, and local continuous tape reinforcements to further increase the stiffness and strength properties. Previous studies on the geometrical and mechanical properties of this material can be found in Scheuring et al. 31 and a study on the macroscopic interface between the discontinuous and continuous reinforcements considering humidity effects was presented in Christ et al. 32 In the following, the method for investigating the microscopic interface, i.e., the fiber-matrix interface, is explained, taking hydrothermal effects into account. The matrix material TechnylStar XS 1352 BL PA6 and matching masterbatch was provided by DOMO Chemicals GmbH, Germany. The fibers were cut from a ZOLTEK PX 35 tow with sizing for PA6 procured from Zoltek Corporation. The exact sizing composition remains unknown.
Specimen preparation
The manufacturing of the specimens was done at the Faserinstitut Bremen e.V. (FIBRE) utilizing the FIMABOND machine developed by Textechno. The FIMABOND is one part of a more complex system, which offers a combined solution of embedding the fiber and performing the pull-out test sequentially. The work flow of the machine is described in detail in Stefan et al.
33
The exact temperature curve during the manufacturing of the specimens for this investigation is given in Figure 1. Temperature over time during the manufacturing of the pull-out specimens. A representative state of a specimen at the indicated circles is depicted in Figure 2. Production steps for the pull-out specimens. (a) shows the solid PA6 granulate, (b) shows the start of the melting of the granulate before inserting the fiber. (c) shows the specimen right after inserting the fiber with fully melted PA6, (d) shows a later stage with the first formation of a meniscus at the fiber entry point, while (e) shows an advanced formation of a meniscus. The fully solidified single fiber pull-out specimen is given in (f) with visible deviations of the hemispherical shape due to crystallinity within PA6. The according temperature over time is given in Figure 1.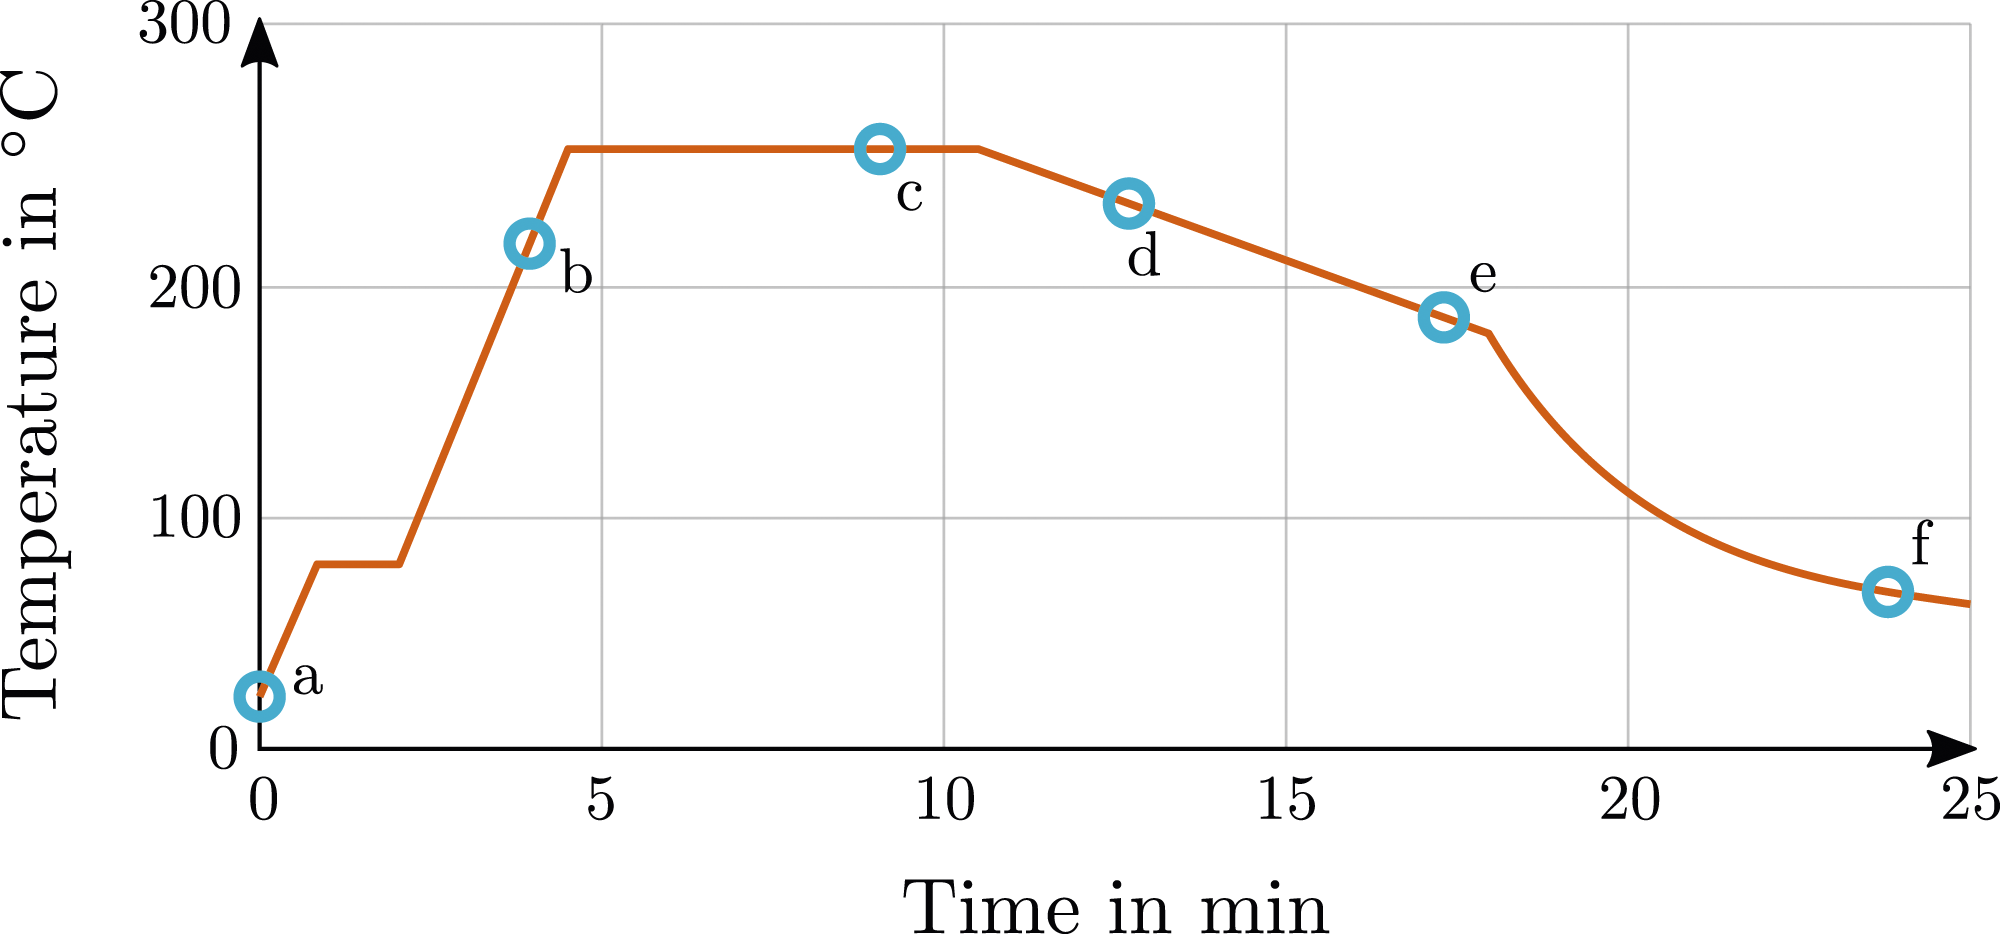
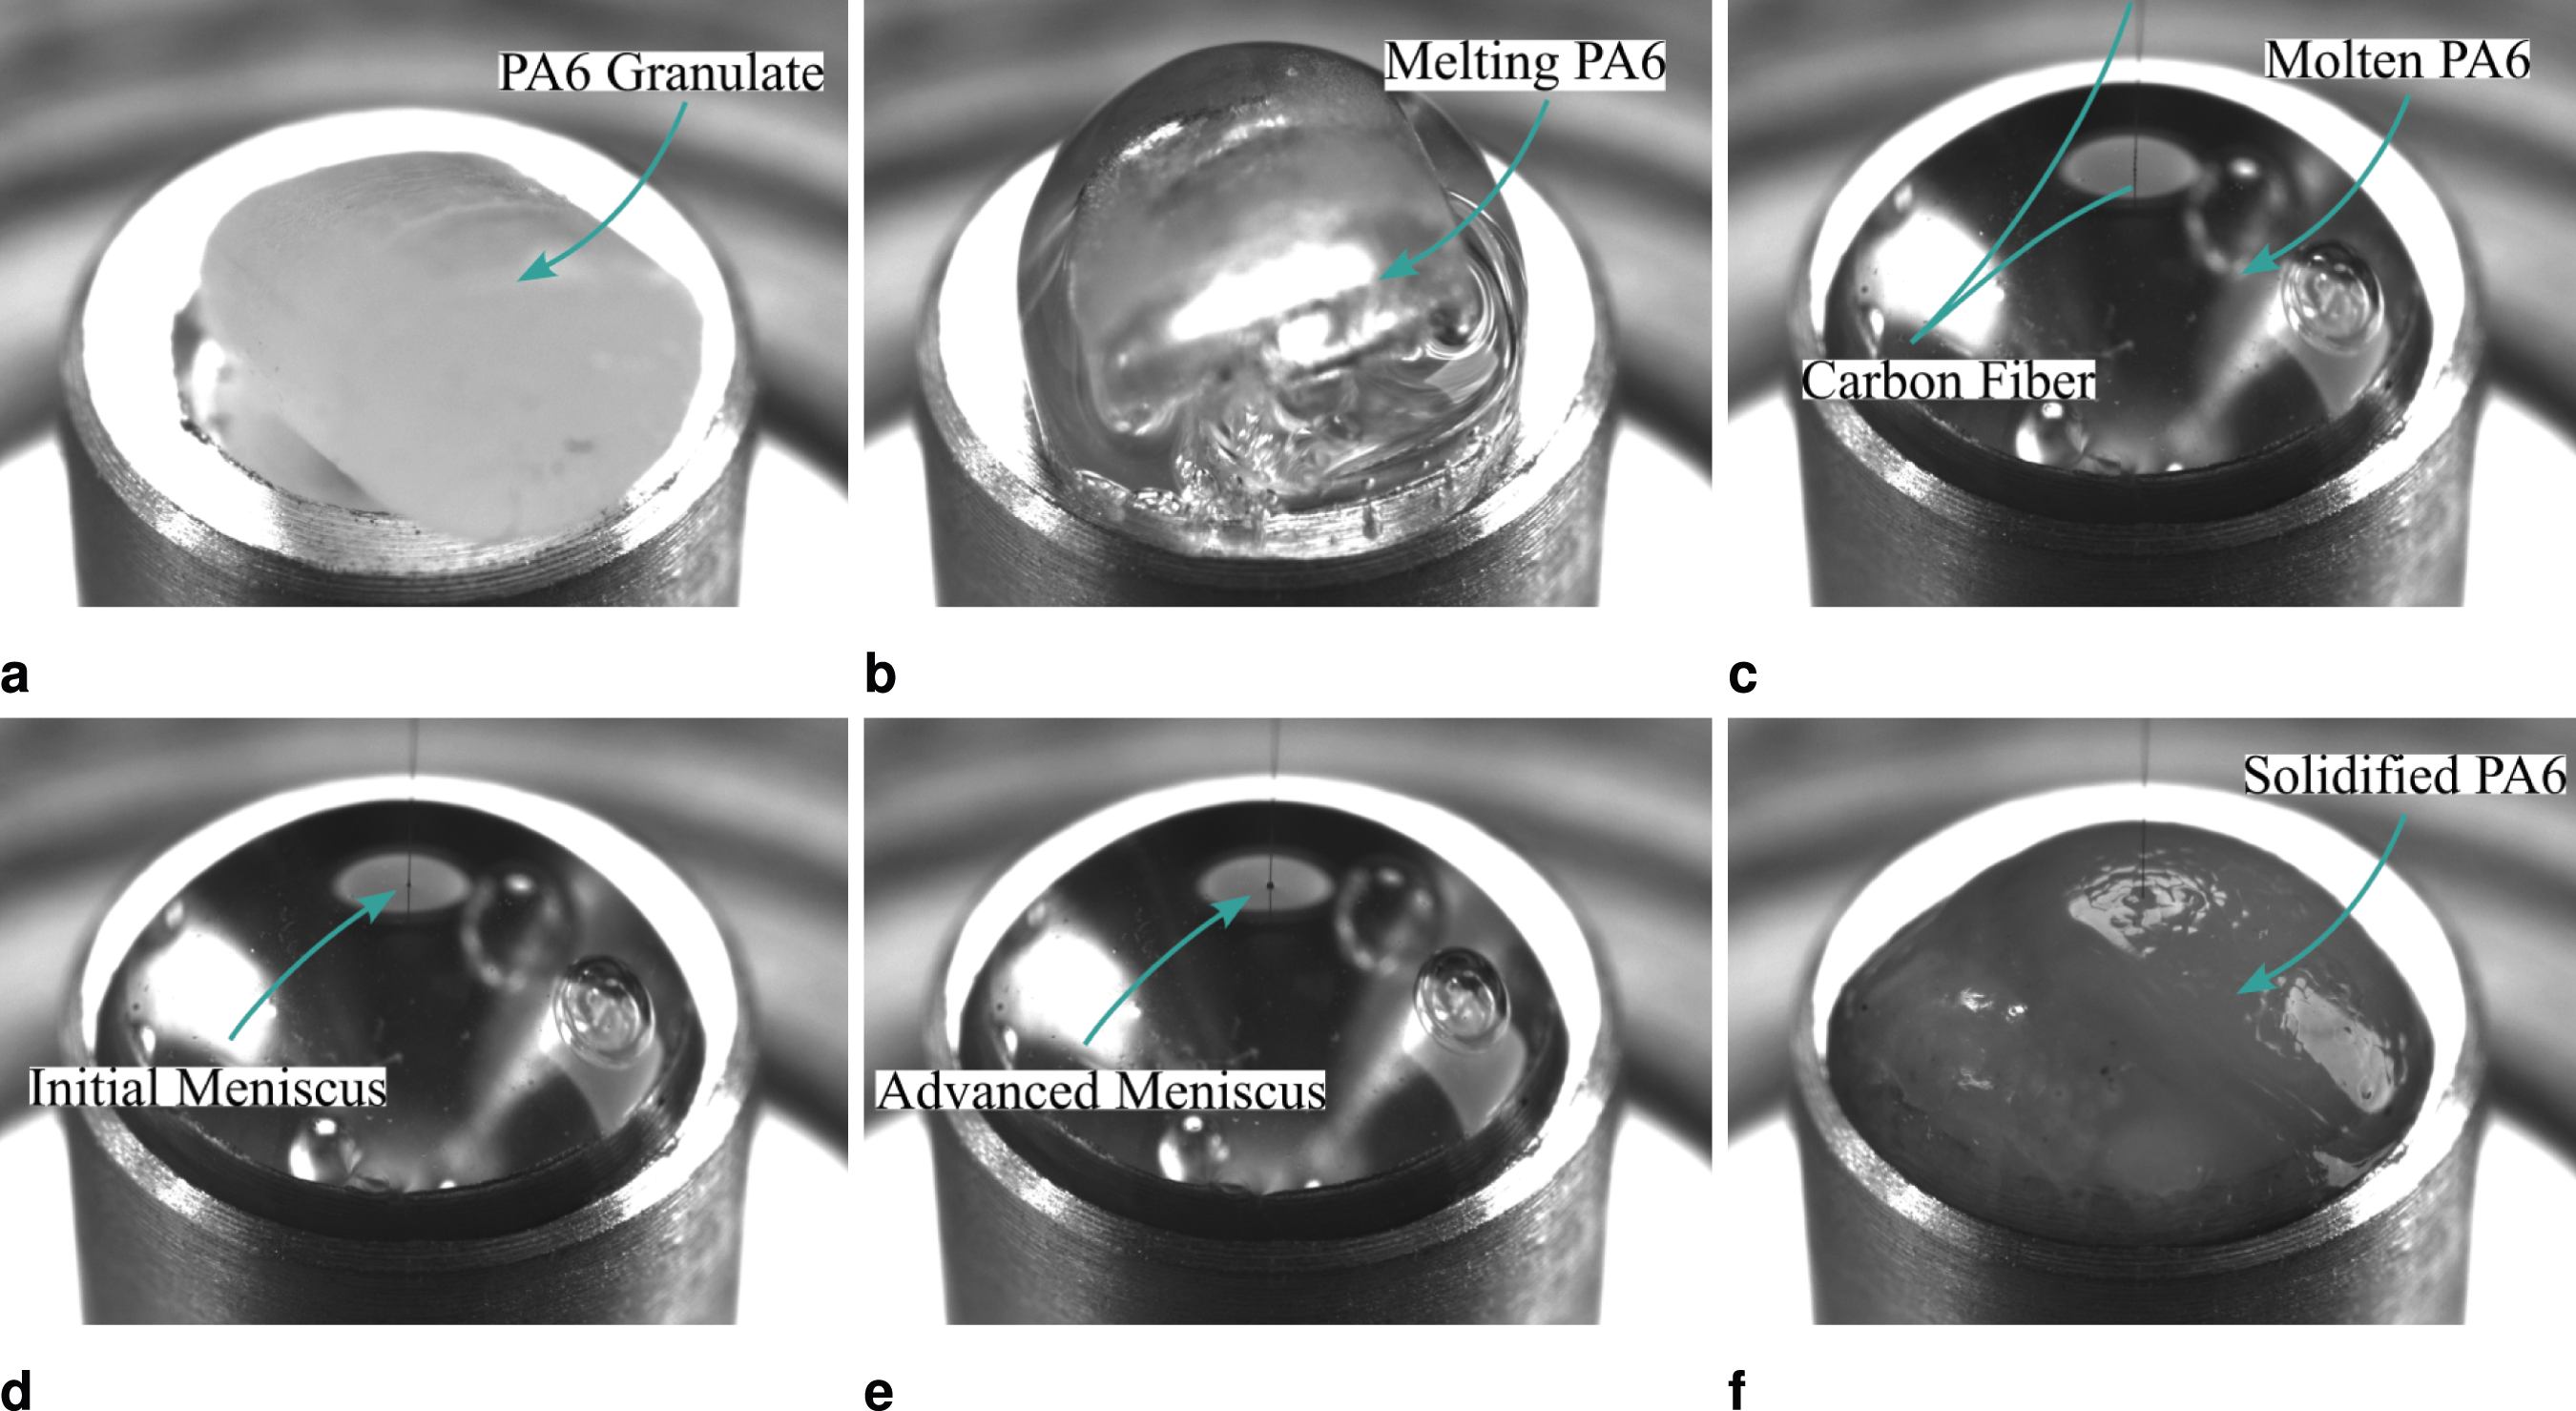
First, a PA6 granulate is positioned on a specimen holder and a single carbon fiber is inserted in a fiber gripper above the specimen (cf. Figure 2(a)). It must be emphasized once again that the fibers were used as they were delivered, without removing or manipulating the sizing applied by the manufacturer. The system is heated to 80 °C at a heating rate of about 100 K/min at which nitrogen is flushed into the chamber, which acts as an inert gas to prevent oxidative degradation at the polymer surface and reduces the formation of air inclusions within the specimen. To overcome the crystallization and melting temperature of PA6 at around 180 °C and 215 °C,
34
respectively, the temperature within the FIMABOND is raised to 260 °C at the same heating rate. Consequently, the PA6 starts to liquefy (cf. Figure 2(b)). The molten state of the PA6 is kept stable for about 5 min before the fiber is inserted into the polymer with a nominal embedded length of 100 μm at a displacement rate of 500 μm/min. The inserted fiber is shown in Figure 2(c), whereby the formation of a meniscus at the fiber entry point has not yet begun. In a preliminary study, the optimal embedded length of 100 μm was determined iteratively through pull-out tests, as a fiber whose embedded length exceeds the critical fiber length would lead to fiber breakage instead of pull-out, while a very short embedded length would lead to fewer data points during the test. Combined with the average fiber diameter of 7 μm, an average embedded surface area of about 2200 μm2 is realized. From 260 °C to 180 °C the specimen is cooled down with a prescribed cooling rate of 10 K/min, at which a clear formation of a meniscus is visible in Figure 2(d) and (e). Below 180 °C crystallization occurs and the temperature is lowered further through passive cooling to room temperature. Due to the inherent property of forming crystalline sections within the PA6, the smooth hemispherical surface of the molten state transitions to an irregular, non-convex solidified surface (cf. Figure 2(f)). As a result, some samples solidify with a pronounced deviating fiber angle to the symmetry axis of the sample holder, as shown in Figure 3. SEM image of pull-out specimens with a straight embedded fiber (a and b) and a deviated embedded fiber due to ireggular crystallization (c and d).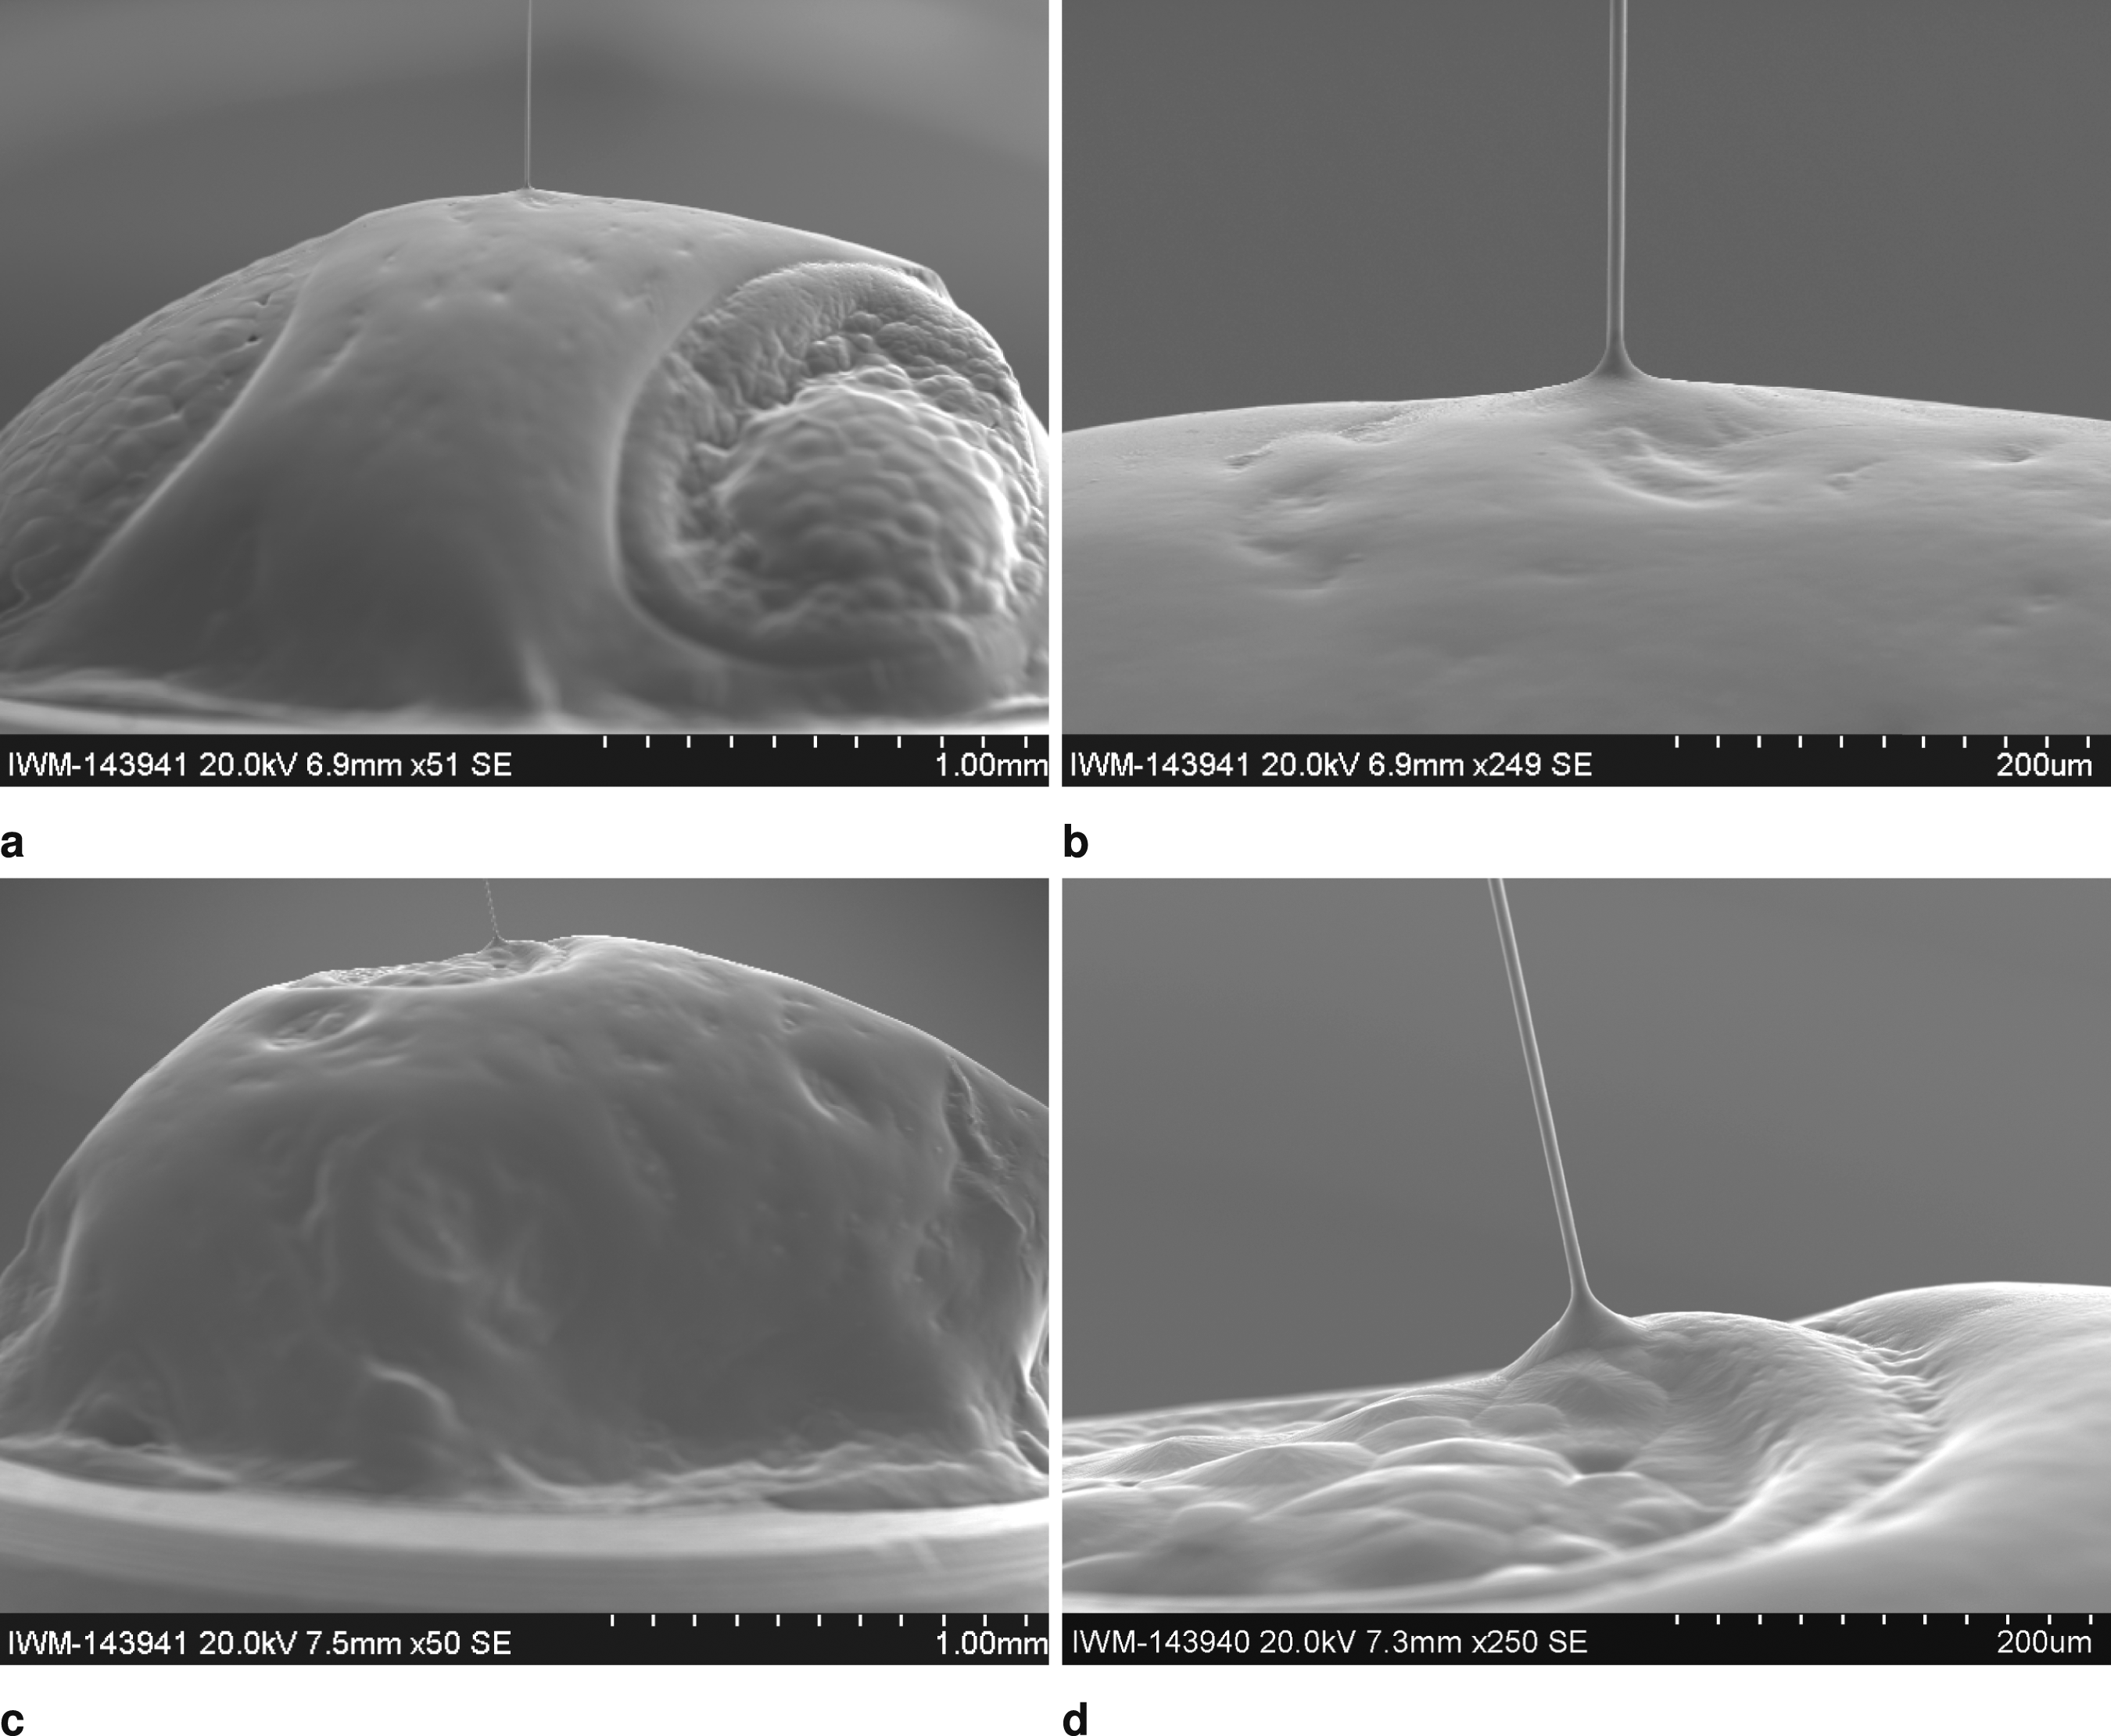
Microscale climate chamber
It was mentioned in the introduction, that using commercial climate chambers for micro-mechanical test setups is often not feasible, due to the incompatibility to the specific test equipment. No commercially available climatic chamber is small enough to enclose only the test specimen. The test rig cannot be placed as a whole in a climatic chamber, as several devices, e.g. the load cell or the motor controller, are not designed for use in a hot and humid environment.
To circumvent the shortcoming of not having a stable climate and a resulting undefined conditioning state of the specimen during the testing, a microscale climate chamber was developed based on the principle of deliquescence, which is explained in detail in Mauer and Taylor.
35
Deliquescence is a phenomenon that occurs because solutes reduce the equilibrium vapor pressure of water.
36
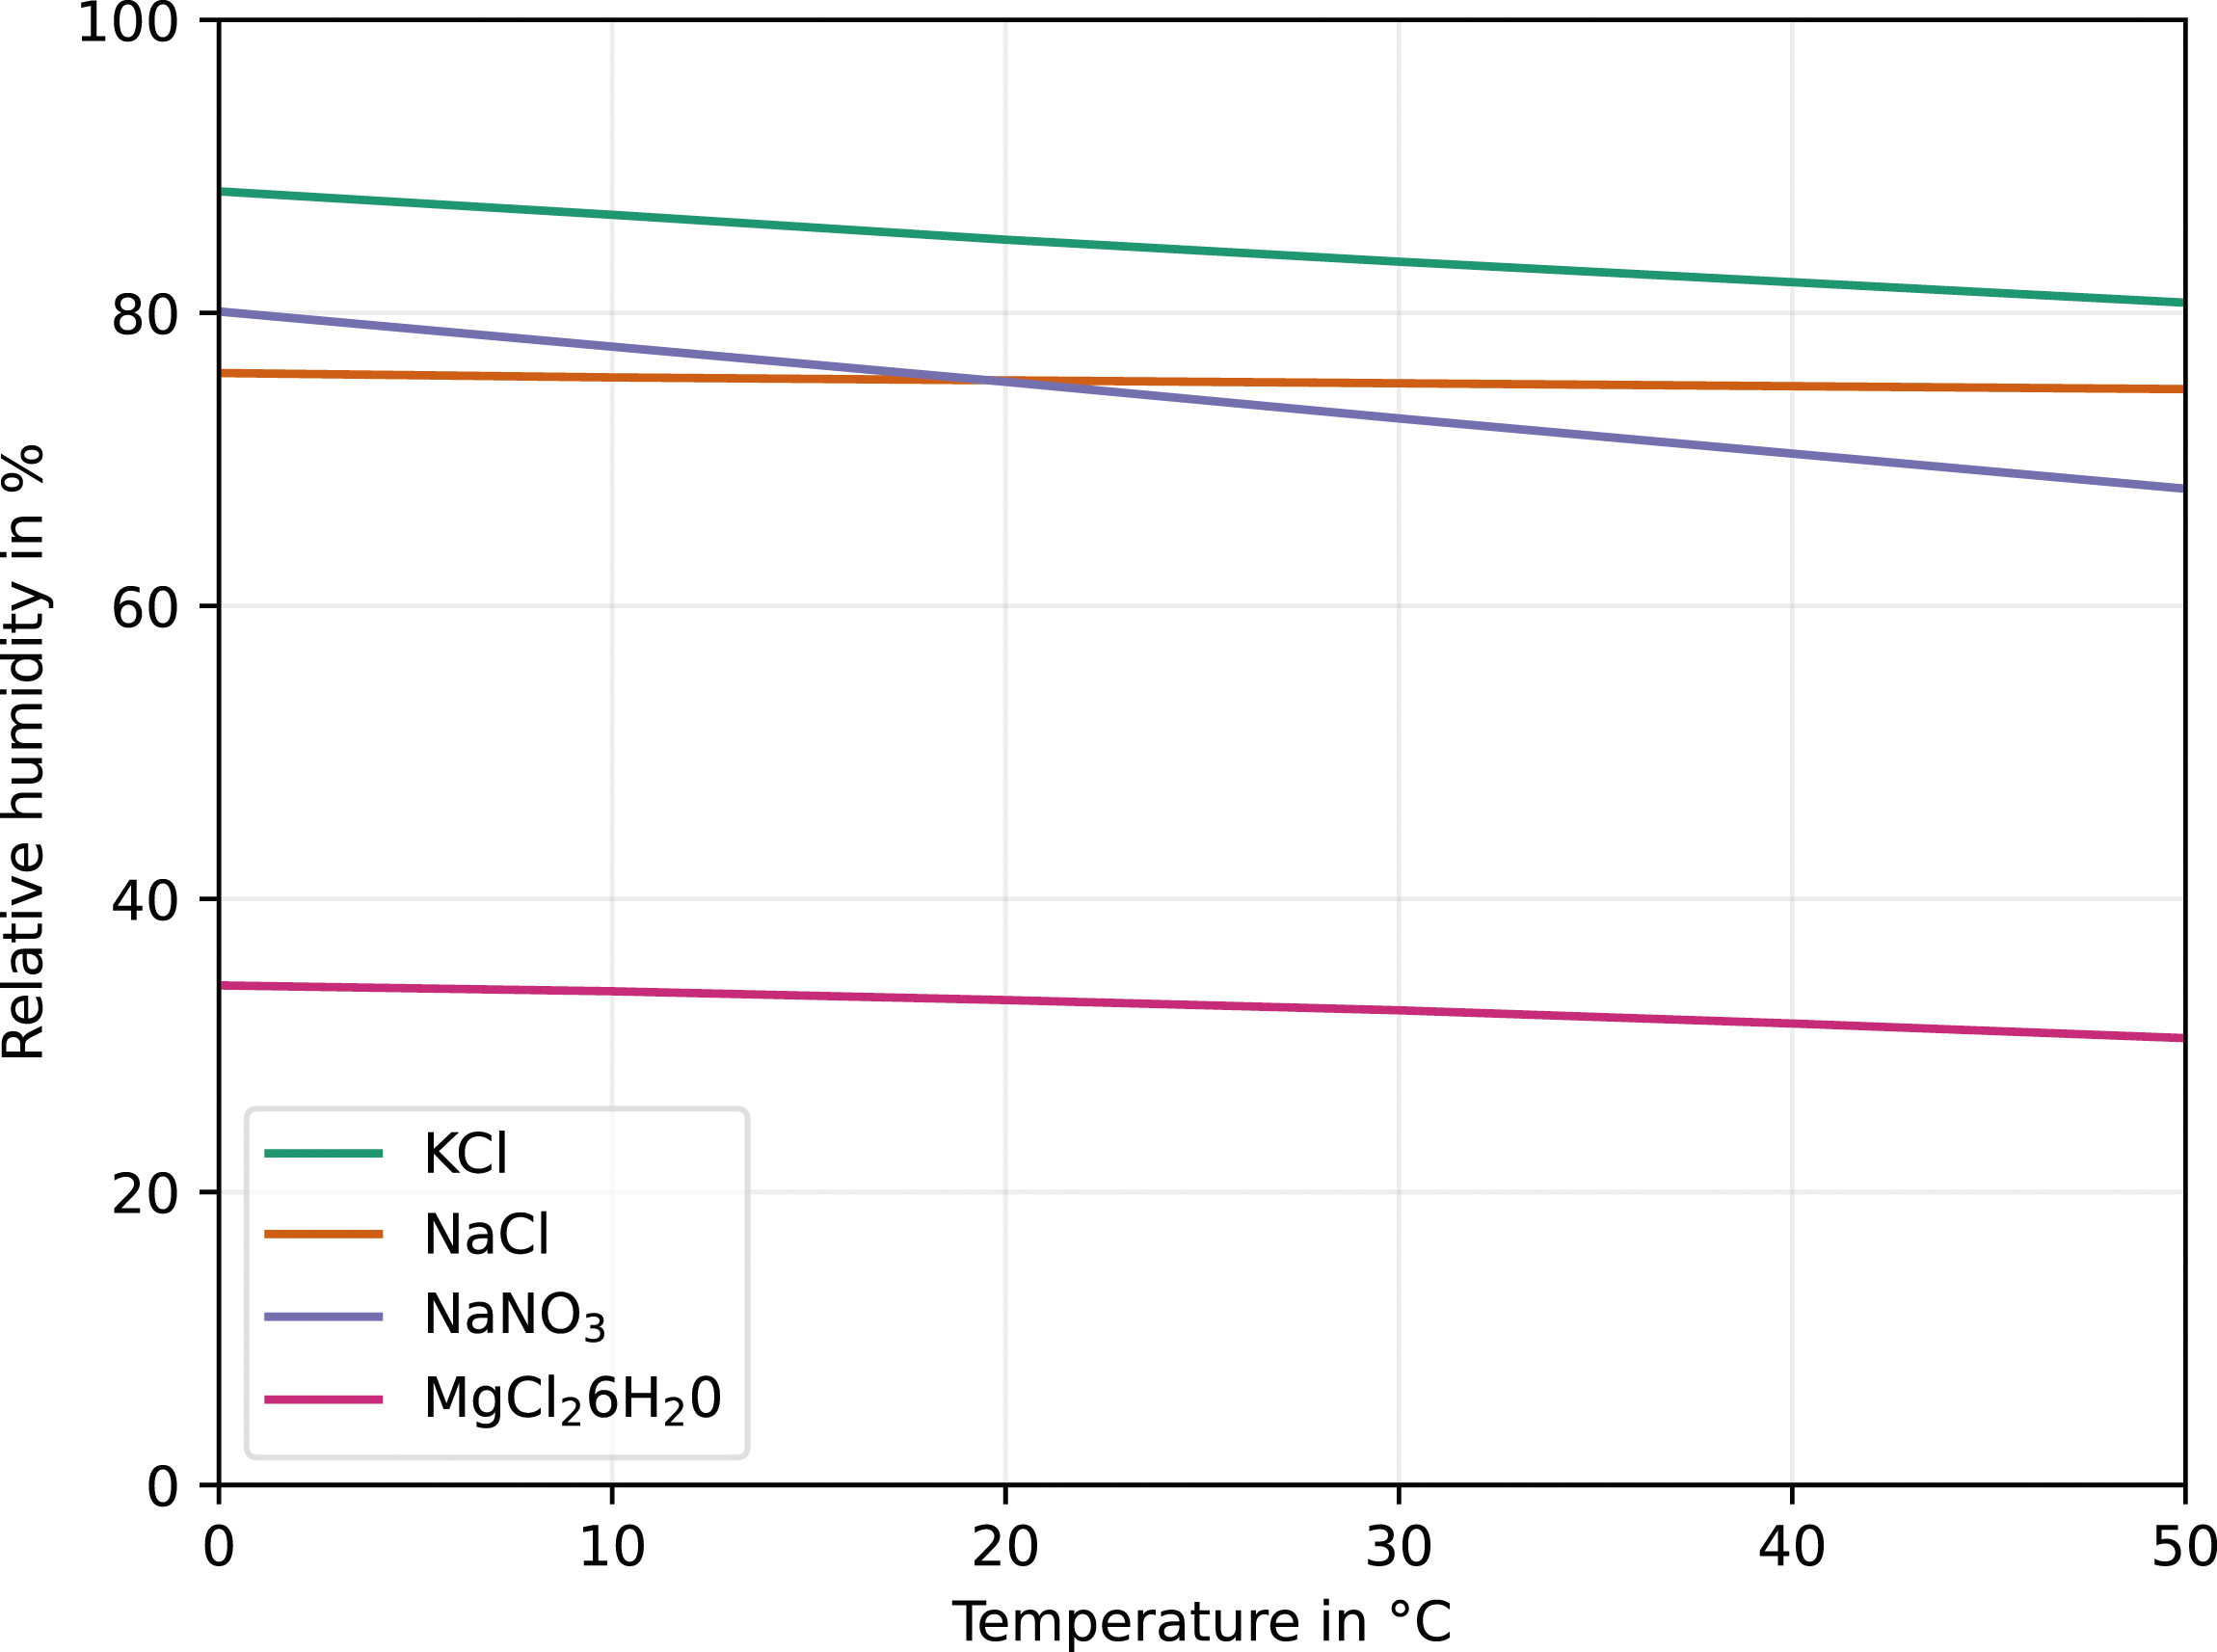
The degree of vapor pressure reduction is proportional to the amount of dissolved substance and is also influenced by its type. The maximum degree of vapor pressure reduction that a given substance can cause is achieved when the substance is dissolved to its saturation limit. Therefore, substances with higher solubility tend to have lower deliquescence humidities. If the solubility of a substance increases with increasing temperature, its deliquescent moisture decreases with increasing temperature. It is possible to use the deliquescence properties of salts to maintain a specific relative humidity in sealed containers, such as desiccators. Since the replenishment of moisture from the air is limited, a self-regulating hysteresis occurs. If the initial air humidity is above the deliquescence humidity, condensation of moisture on the salt solution causes the relative air humidity to decrease until it reaches the deliquescence humidity and is in equilibrium with the saturated solution.
37
Conversely, if the air humidity is below the deliquescence humidity, the air above the solution will be undersaturated and water will evaporate from the solution, increasing the air humidity until equilibrium with the deliquescence humidity is reached. This mechanism can be used to maintain a constant relative humidity in a container by introducing a saturated salt solution. For this it is necessary to provide a solution with sufficient undissolved sediment. A qualitative diagram of the deliquesence humidity for different salt solutions over a range of temperature is given in Figure 4. As was mentioned before, the relative humidity drops slightly for an increase in temperature.The advantage of choosing a passive adjustment of the relative humidity by deliquescence instead of an active control (cf. the proposed active system in Boulogne
39
) is that there is no need to implement a complicated control mechanism to humidify the air, which would entail significantly higher development costs, and the system is better protected from external influences. Relative humidity due to deliquesence over temperature for different salt solutions based on the data given in O’Brien.
38
To adjust the temperature inside the climate chamber, four power resistors (each with a power rating of 25 W and a resistance of 2 Ω) were connected in series and controlled by a microcontroller (Arduino Micro). The actual temperature and humidity were measured using a sensor (Sensirion SHT85) and the set temperature was controlled using a PID algorithm. The microcontroller uses a PWM signal to control the 24 V power supply to the desired effective voltage.
The chamber itself is constructed from acrylic glass to allow full visibility during the experiment and is sealed against air transfer with the lab environment, with the exception of small gaps around the specimen holder on both sides, to avoid measuring frictional forces between the moving grips and the stationary chamber. The total volume is only 2.25 L, which allows the equilibrium state to be reached quickly. A fan is placed in the chamber to circulate the air with a low flow rate, which prevents the build up of concentrated micro-climates throughout the chamber and further reduces the time needed to reach equilibrium. The finished setup is shown in Figure 5. Installed microscale climate chamber from above with labeled components. The silica gel was used for the dry testing. For the wet testing, it was replaced with a sodium chloride solution.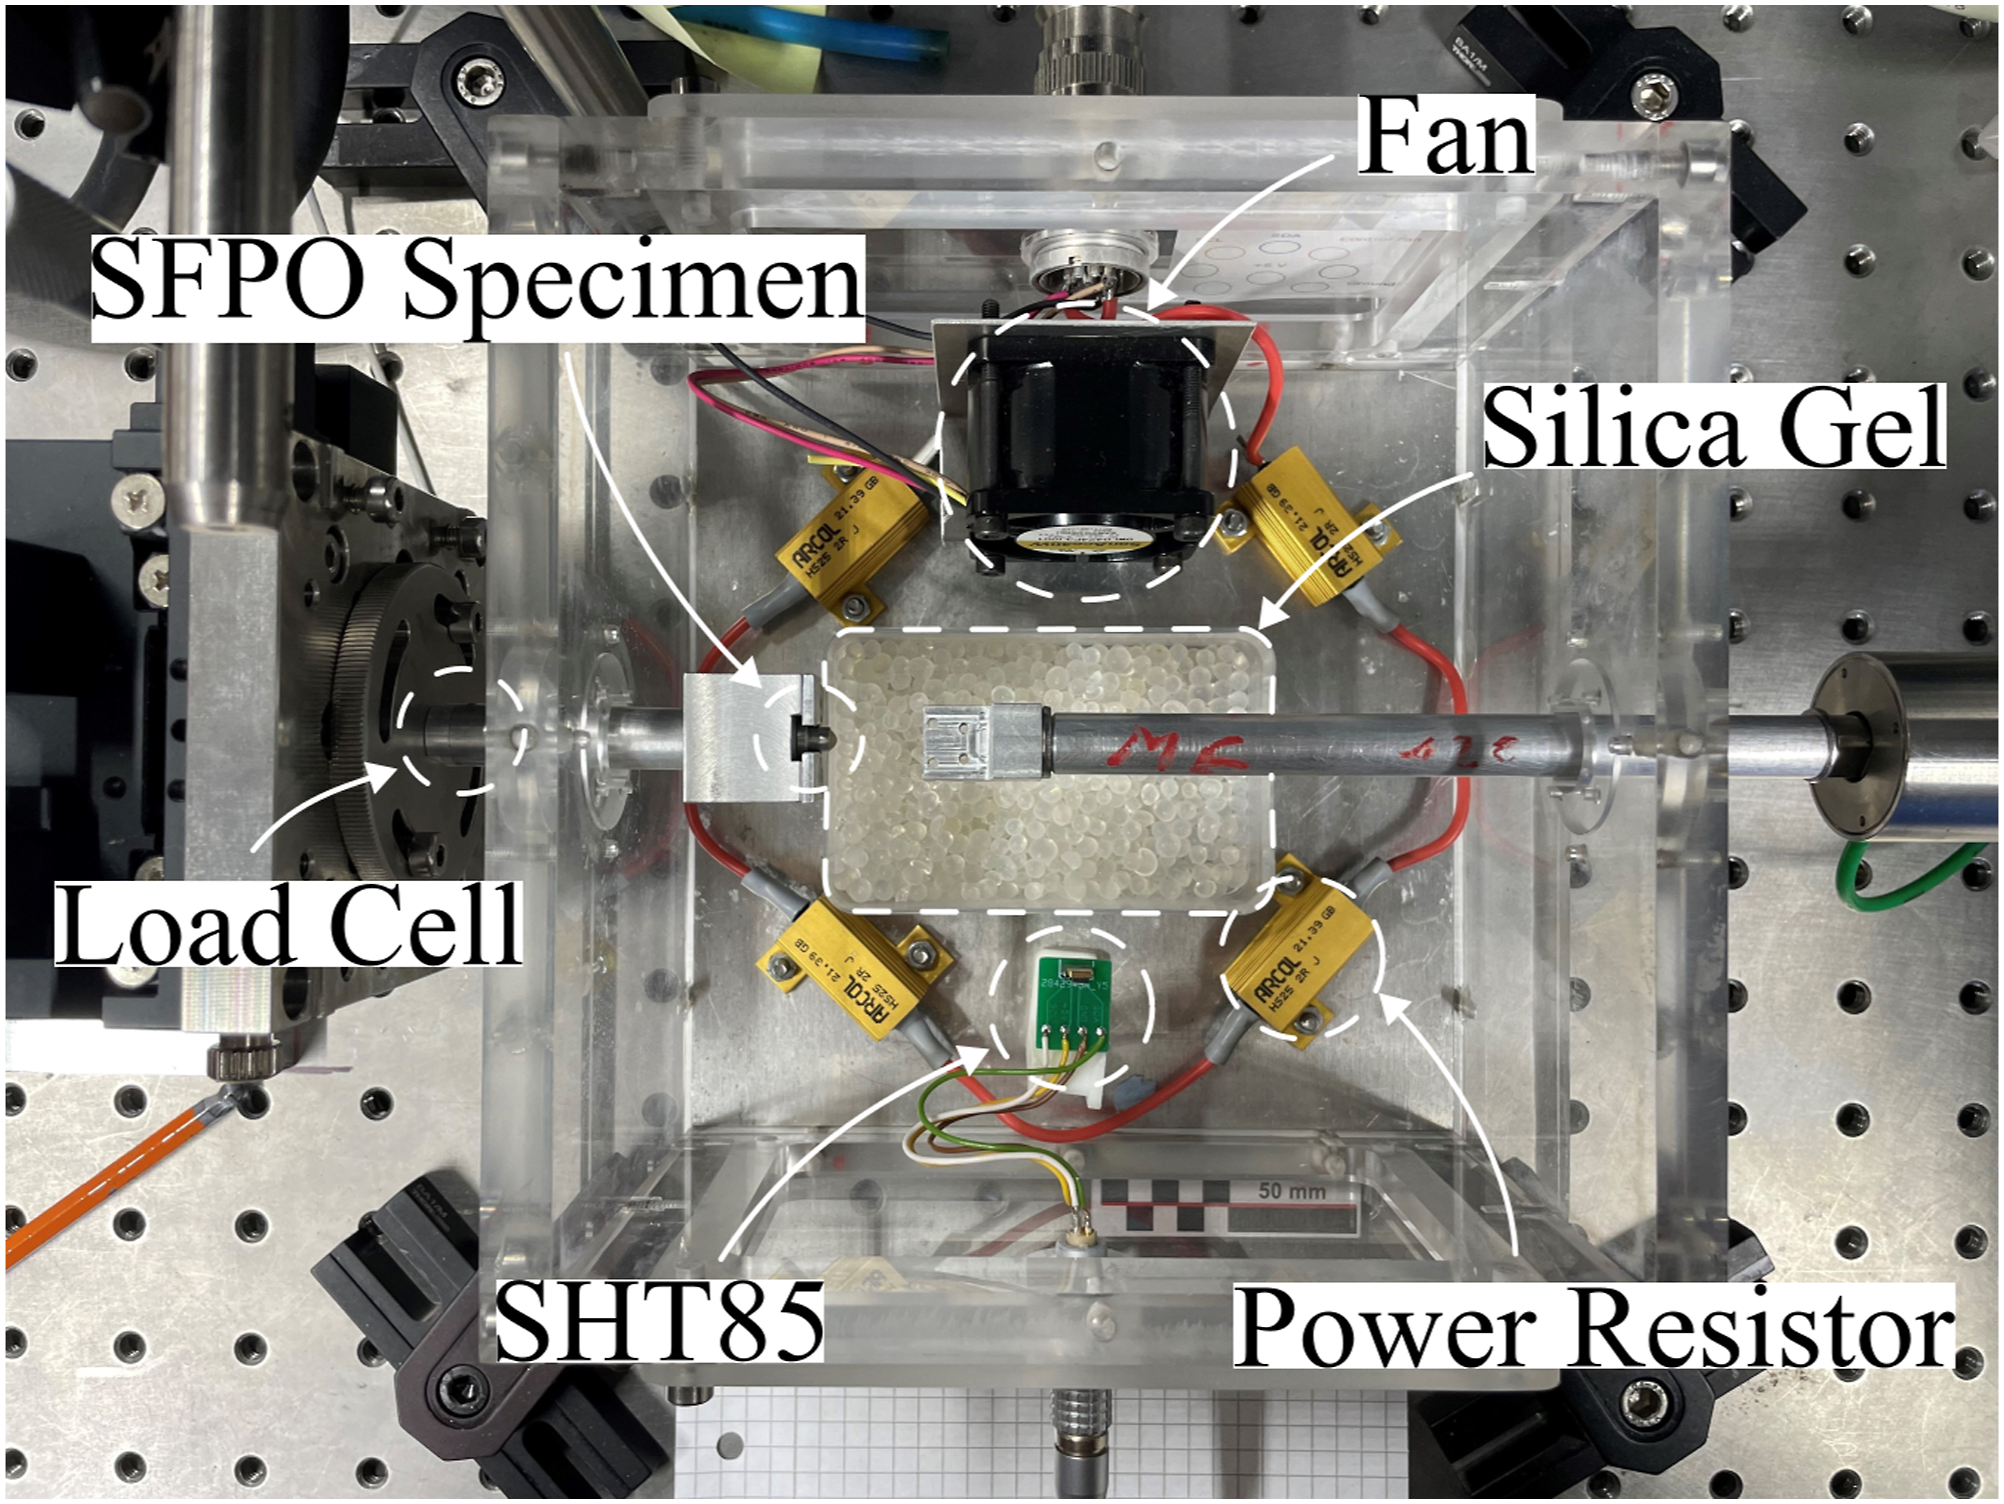
Conditioning and testing
In accordance to the section above, the conditioning of the specimens took place in a sealed container filled with a saturated salt solution, utilizing the resulting relative humidity due to deliquescence. To investigate the effects of humidity, it was differentiated between a dry and a wet state. As can be seen in Figure 4, the salt solution of sodium chloride (NaCl) provides a high relative humidity of around 75%, which is stable over the temperature range of interest. Therefore, NaCl was used for the wet conditioning. The dry conditioning state was realized by using pure silica gel, as it is used in desiccators, without additional water. For the conditioning, the specimens were placed in a separate open box above the salt solution within a container, to prevent direct contact with the salt solution. The container was placed in an oven for 240 h at 50 °C. The elevated temperature of 50 °C specifically refers to the conditioning temperature only, which accelerates the diffusion of water molecules at a given relative humidity level to reach equilibrium within this relative humidity quicker.
After conditioning, a specimen was clamped to the load cell and the fiber was carefully glued to a plate on the displacement-controlled side of the test rig, which is illustrated in Figure 6. The free fiber length between the fiber entry point in the matrix droplet and the adhesive was set to 1.2 mm. If the free fiber length is too long, too much elastic energy is stored within the fiber during the test, which can lead to a sudden pull-out without measuring the frictional phase. Both sides of the test rig were aligned so that the pull-out plane runs through the entry point of the fiber from the matrix. Afterwards, the corresponding salt solution was added to the climate chamber, to passively adjust the ambient humidity level again to the dry or wet state, respectively. Schematic of the gripping mechanism through adhesive glue. The elements shown are not true to scale.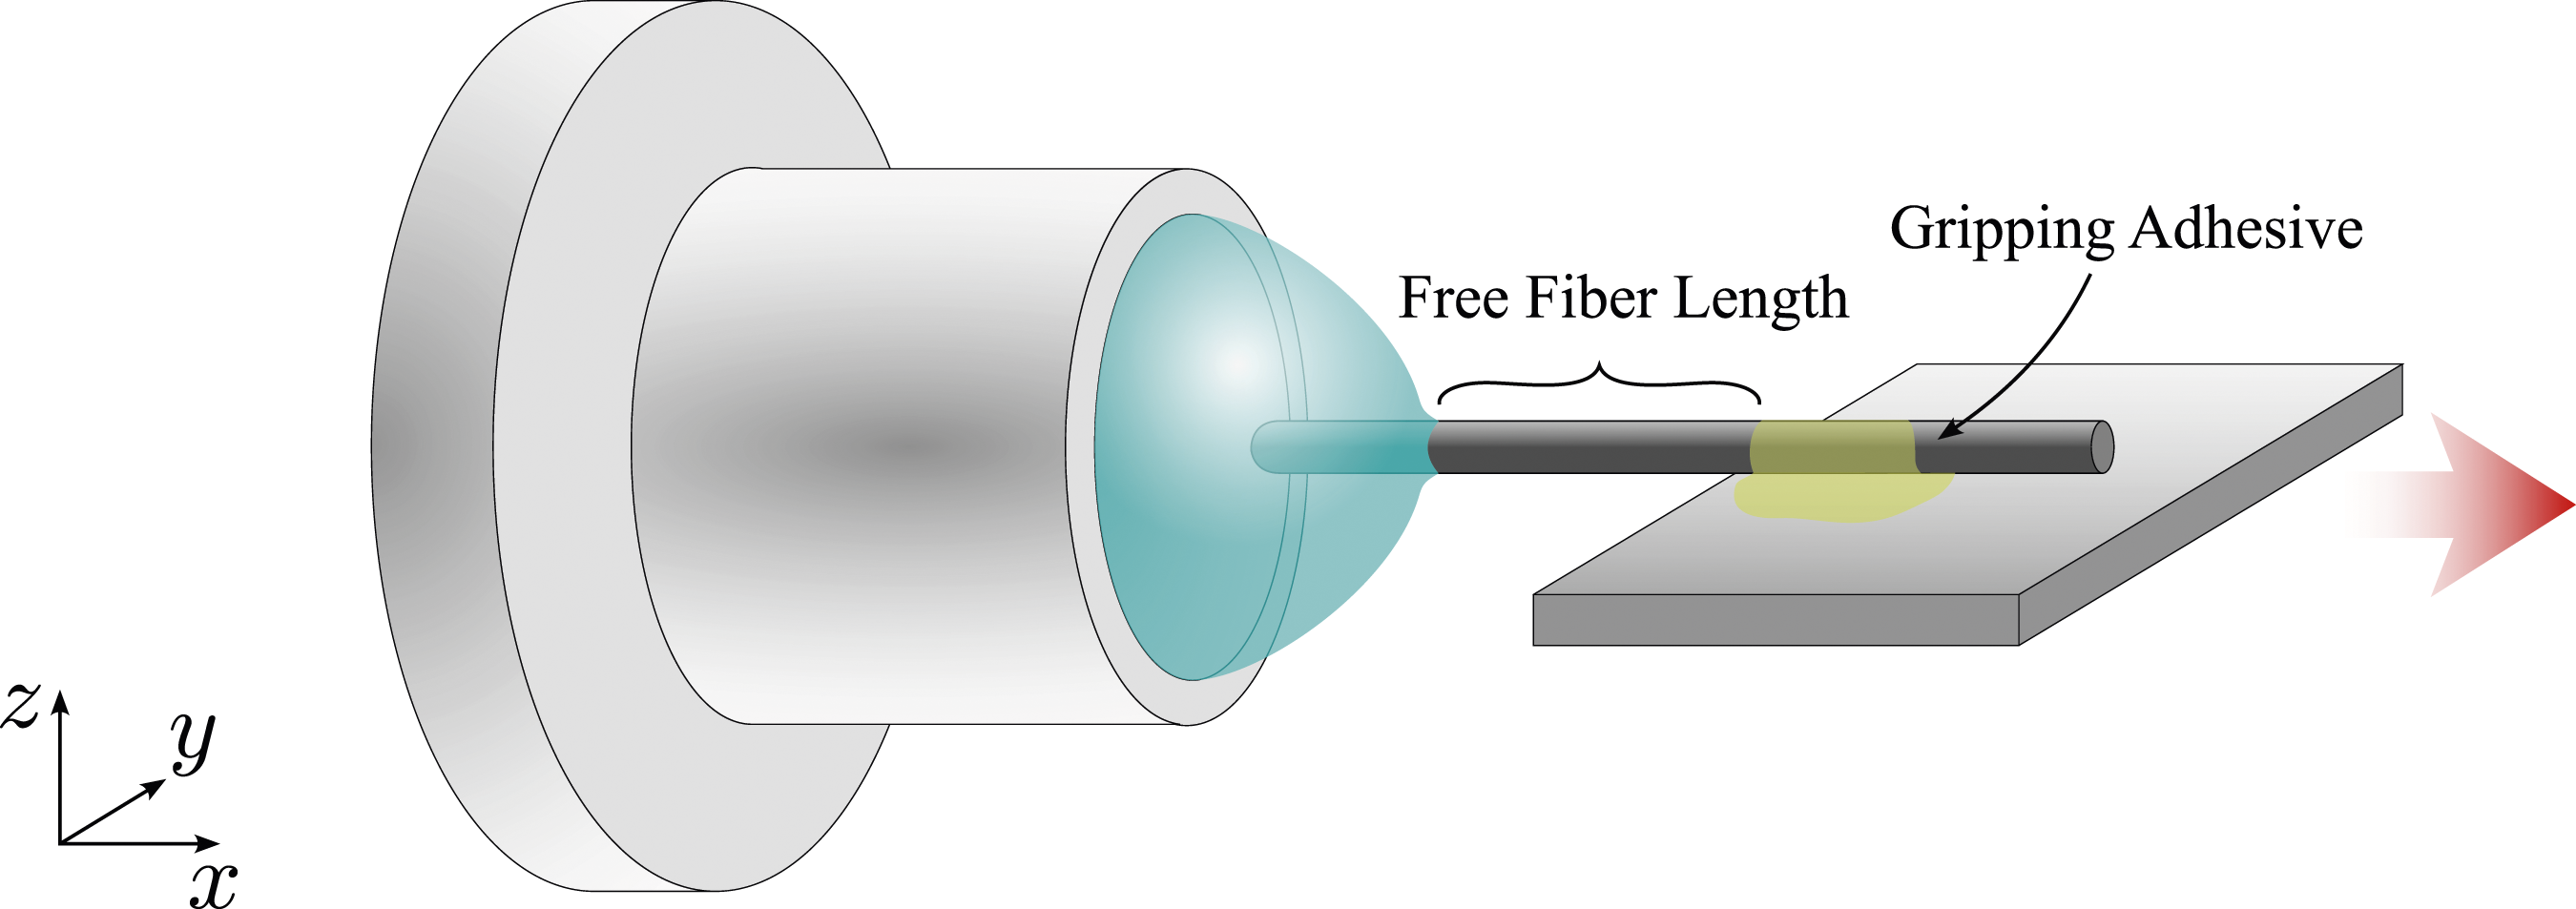
To investigate the effects of temperature on the pull-out behavior in combination with humidity effects, two different temperatures were chosen, i.e., a warm and cold climate. The cold and warm climate were chosen to be at a temperature of 25 °C and 45 °C, respectively, which are below Tg of PA6 at standard climate. This gives four possible combinations for the experiment, i.e., cold/warm and dry/wet. Once the conditioned specimen was positioned in the climate chamber and the fiber was glued to the plate on the displacement-controlled side of the set-up, the lid of the climate chamber was closed and the temperature was set to the desired value of 25 or 45 °C, respectively. Glue curing was monitored visually, climate build-up was tracked by sensor readings, and after a stable climate was reached, a further 20 minutes was waited to reverse any deconditioning effects during specimen handling. For each conditioning state, 4 − 5 samples were tested, giving a total of over 16 specimens.
In theory a classical pull-out curve qualitatively looks as the schematic in Figure 7. The initial incline of the force signal is still within the elastic region and its slope correlates with the stiffness of the system. As such, it is not to be confused with the stiffness of the interface alone, since the stiffness of the free fiber length and the test rig (even though neglectable) contribute to that value. At a certain force value, which in general is the maximum force value Fmax measured for one test, the interface fails abruptly which results in a significant drop of the force signal. From that point on the fiber is being pulled out of the matrix with a debonded interface under frictional forces due to residual pressure stresses caused by difference in thermal expansion coefficients. Schematic of a typical pull-out curve. The green area represents the energy used for breaking the interface, while the red area represents the energy due to frictional forces.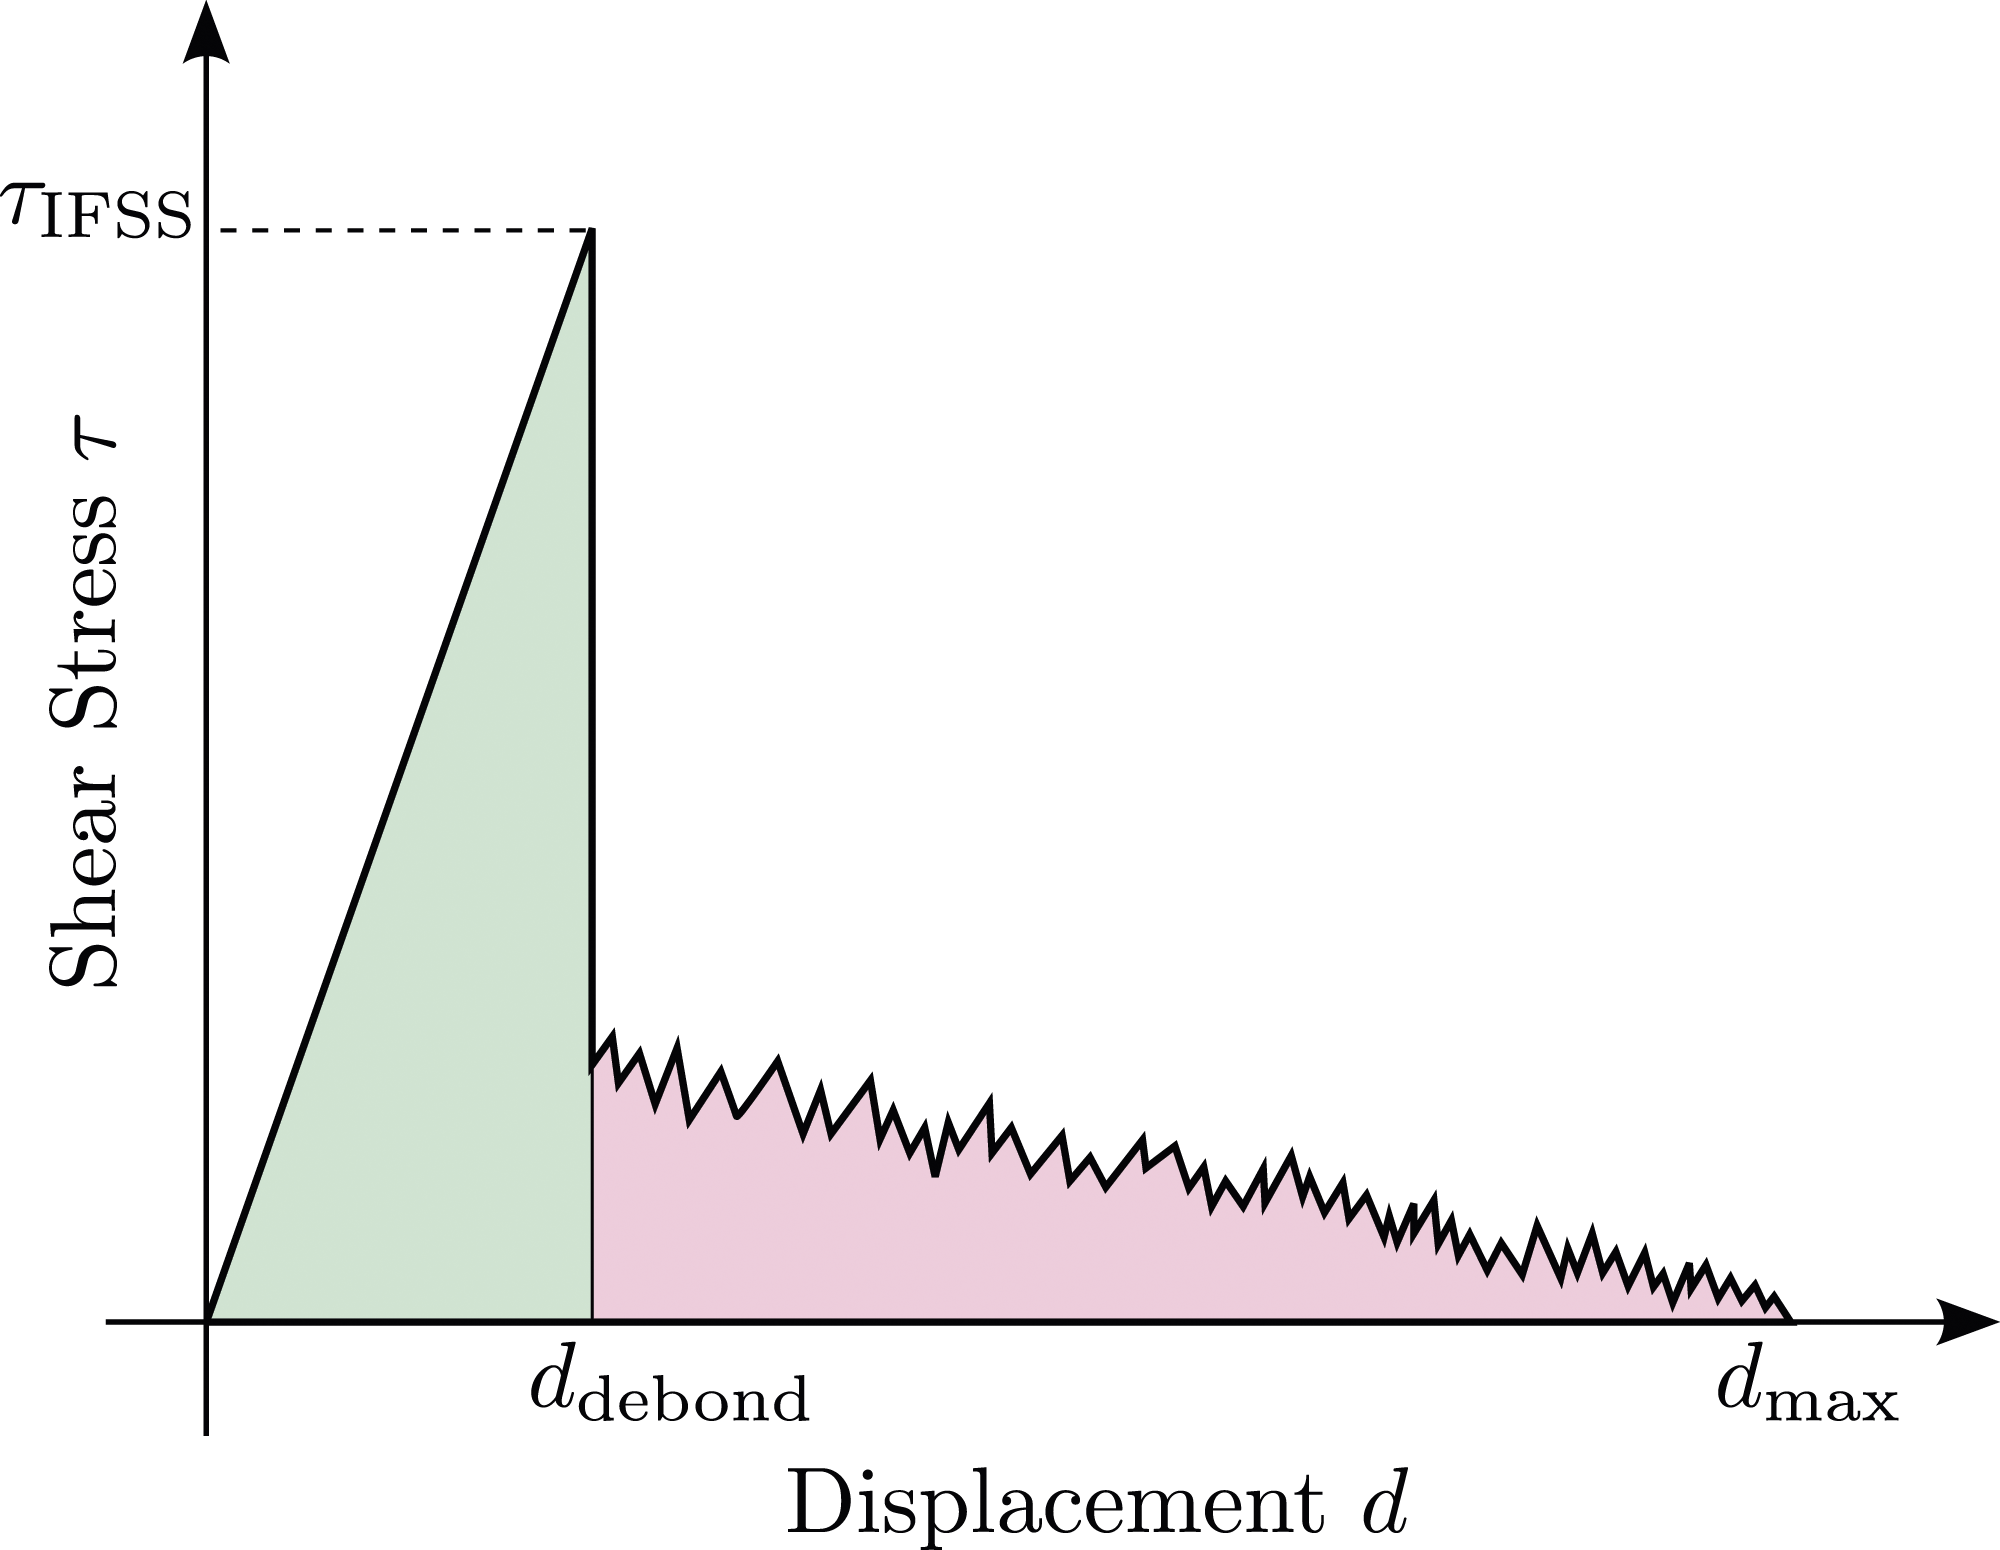
The testing took place with a prescribed displacment rate of 1 μm/s. Since crystallization of the PA6 matrix leads to angled fibers in some cases, a completely straight pull-out cannot be guaranteed. During the test the measured force and recorded displacement are saved and a picture is taken with a frequency of 1/s. Once the fiber is completely pulled out of the matrix, the test is finished.
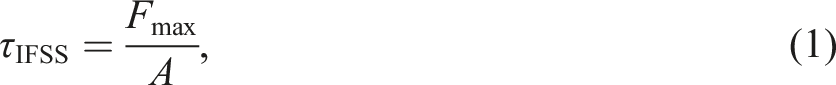
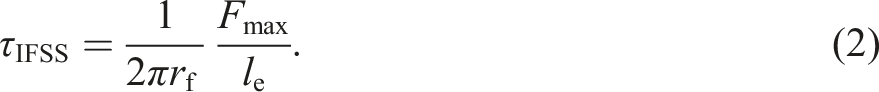
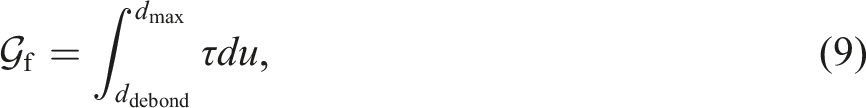
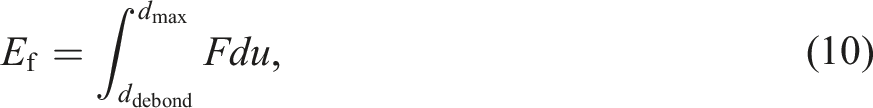
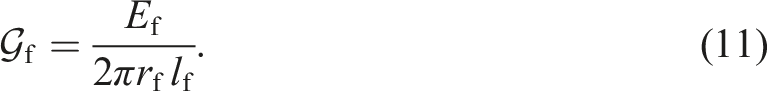
The relevant measurements of interest to characterize the fiber-matrix interface contain the Interfacial Shear Strength (IFSS) and the energetic proportions of the debonding and frictional sections. The IFSS is an averaged strength value, which is built upon the assumption that the shear stress during the experiment is distributed equally over the embedded fiber surface and is given with


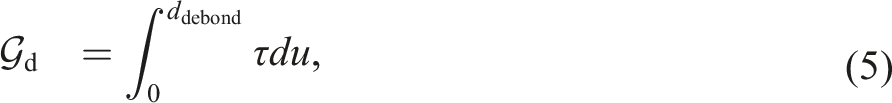
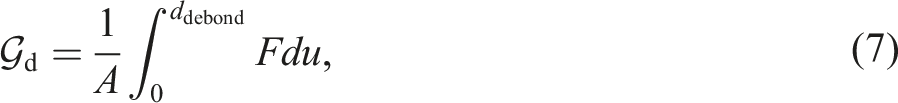
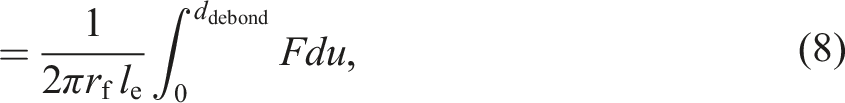
The surface specific debonding energy (green area in Figure 7), or debonding energy release rate, follows with

The remaining frictional surface specific energy is given with

The previously mentioned embedded length le is equal the max. measured displacement when the force drops to zero


SEM investigation of the pulled out fiber
To assess the actual embedded fiber length instead of relying on the reported embedded length from the manufacturer, the pulled out fiber was investigated using a S-3400n SEM from Hitachi Ltd. Corporation, Chiyoda, Japan. This allows to measure the embedded length le from the fiber end to the remaining meniscus on the pulled out fiber and the actual fiber radius rf, as it is indicated in Figure 8. Furthermore, the pulled out fiber is investigated qualitatively to see if the debonding occured along the fiber-matrix interface or within the matrix material itself (based on polymer residues sticking to the fiber surface) and the remaining fiber angle due to crystallization is measured. Measurement of the embedded fiber length le and the fiber radius rf after pull-out using a SEM.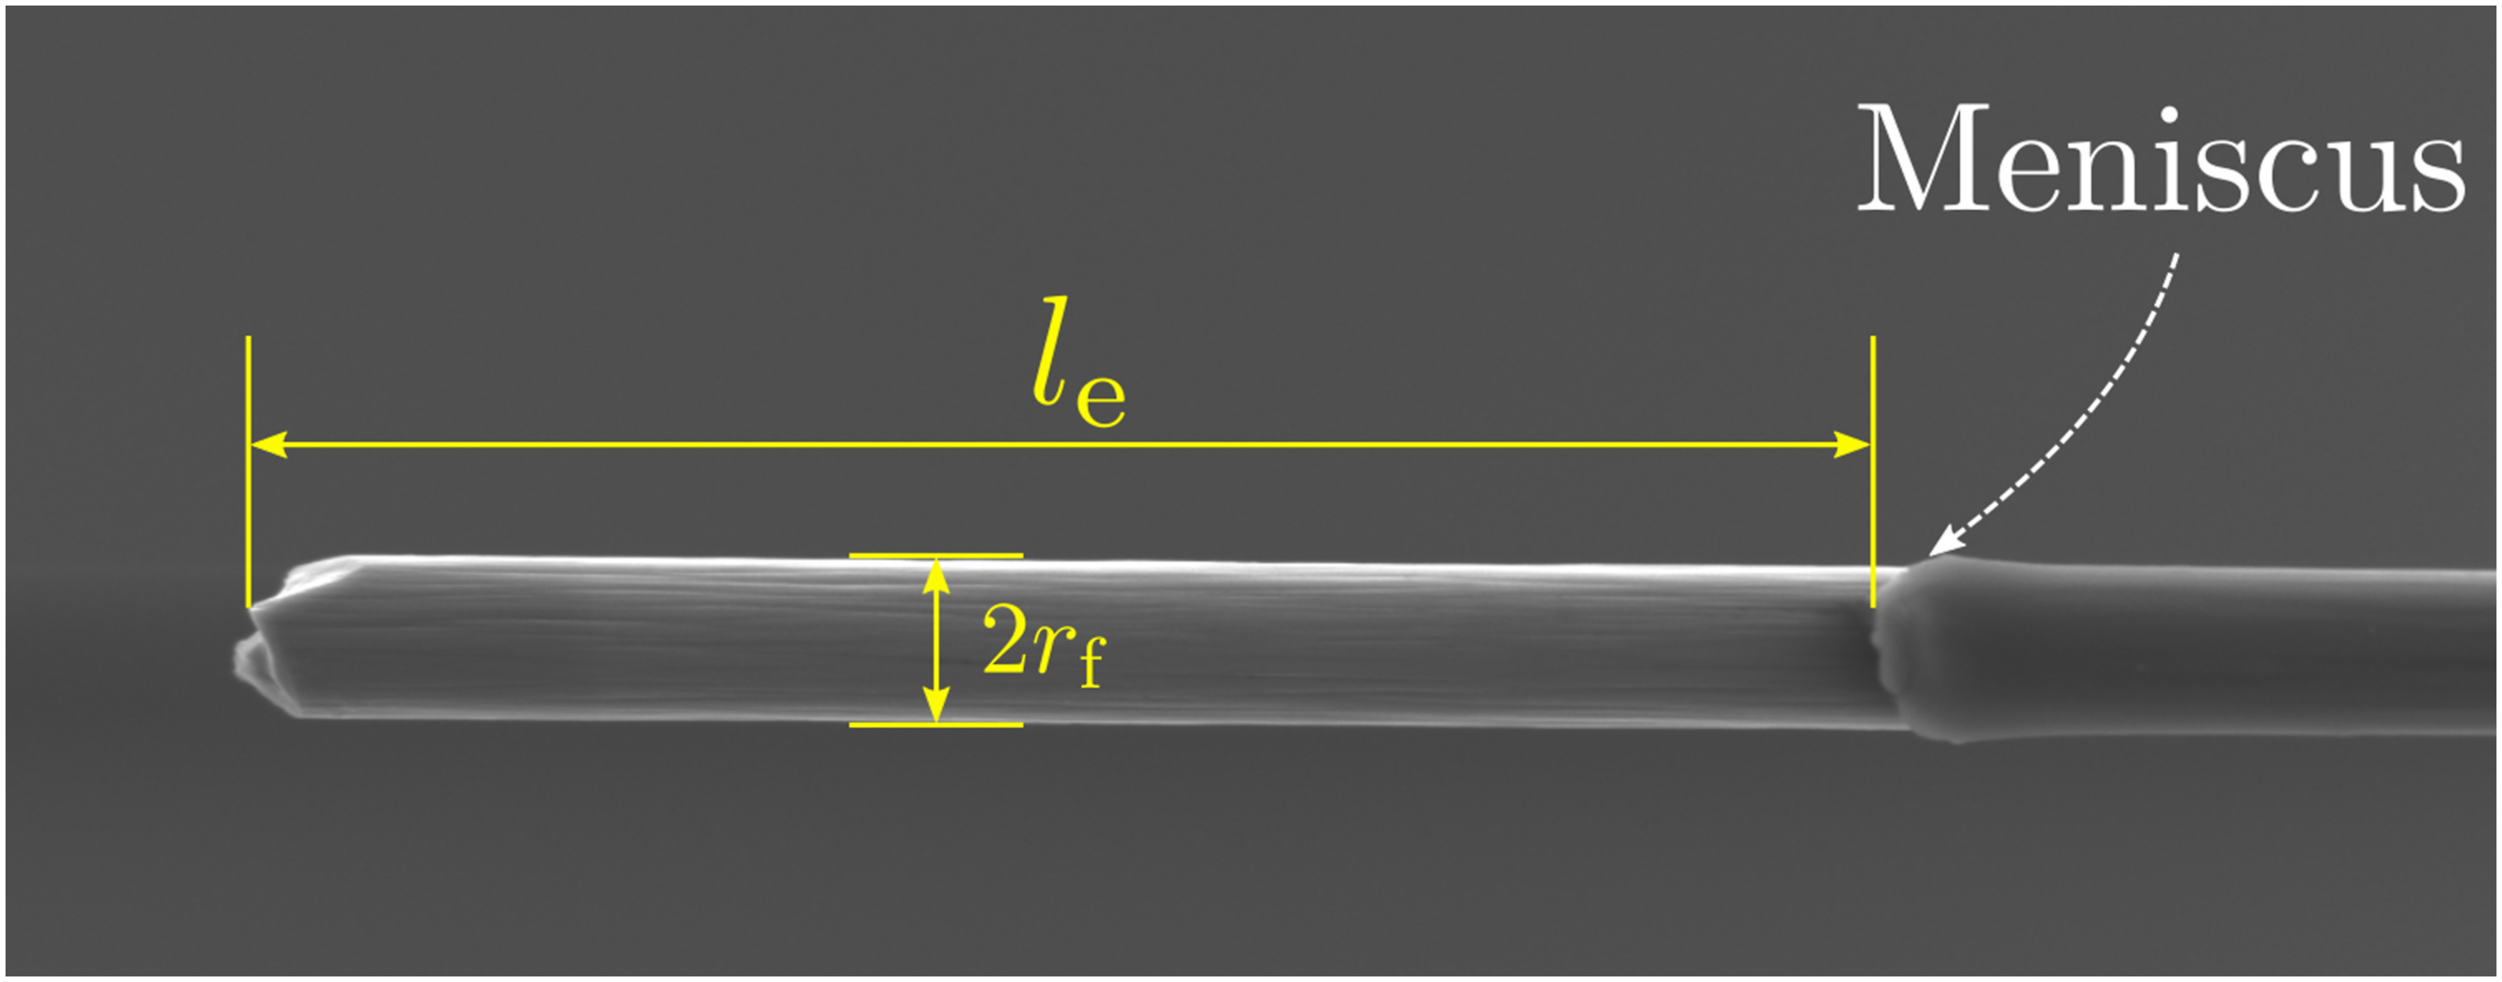
For the SEM investigations an acceleration voltage of 10 kV and an emission current of 76000 nA was chosen, while the working distance was kept around 13 mm. When the acceleration voltage was set too high, thermal effects within the adhesive keeping the fiber in place was observed which lead to thermal strains and a consequent movement of the fiber within the SEM. The pulled-out fiber was not sputtered before placing it into the SEM. A SEM image of each specimen was recorded for the full embedded length at a magnification of ×1000 and a detailed image was taken of the meniscus of the fiber at a magnification of ×2000.
Results
The experimental pull-out curves for the different conditioning states are given in Figure 9, where Figure 9(a) visualizes the force over displacement, while Figure 9(b) is the averaged shear stress (force over embedded area) over displacement curve. A slightly reduced variation of the curves between the conditioning states for stress values instead of force values indicates the significance of measuring the embedded fiber surface area individually after each test. In order to filter the data without introducing significant smoothing, as is common with the usual averaging methods, the arc-length based averaging method in Hartlen and Cronin
40
was used, which additionally provides a confidence envelope of the data. Its advantage lies in the property of preserving local characteristics, e.g., the sudden force drop, within the averaged curves. The resulting curves are given in Figure 10. Experimental pull-out curves with (a) depicting the force displacement curve, while (b) shows the stress displacement curve averaging the measured forces with the individual embedded length. Stress displacement curve for the pull-out experiment for different conditioning states after filtering the data utilizing the arc-length averaging tool in Hartlen and Cronin.
40
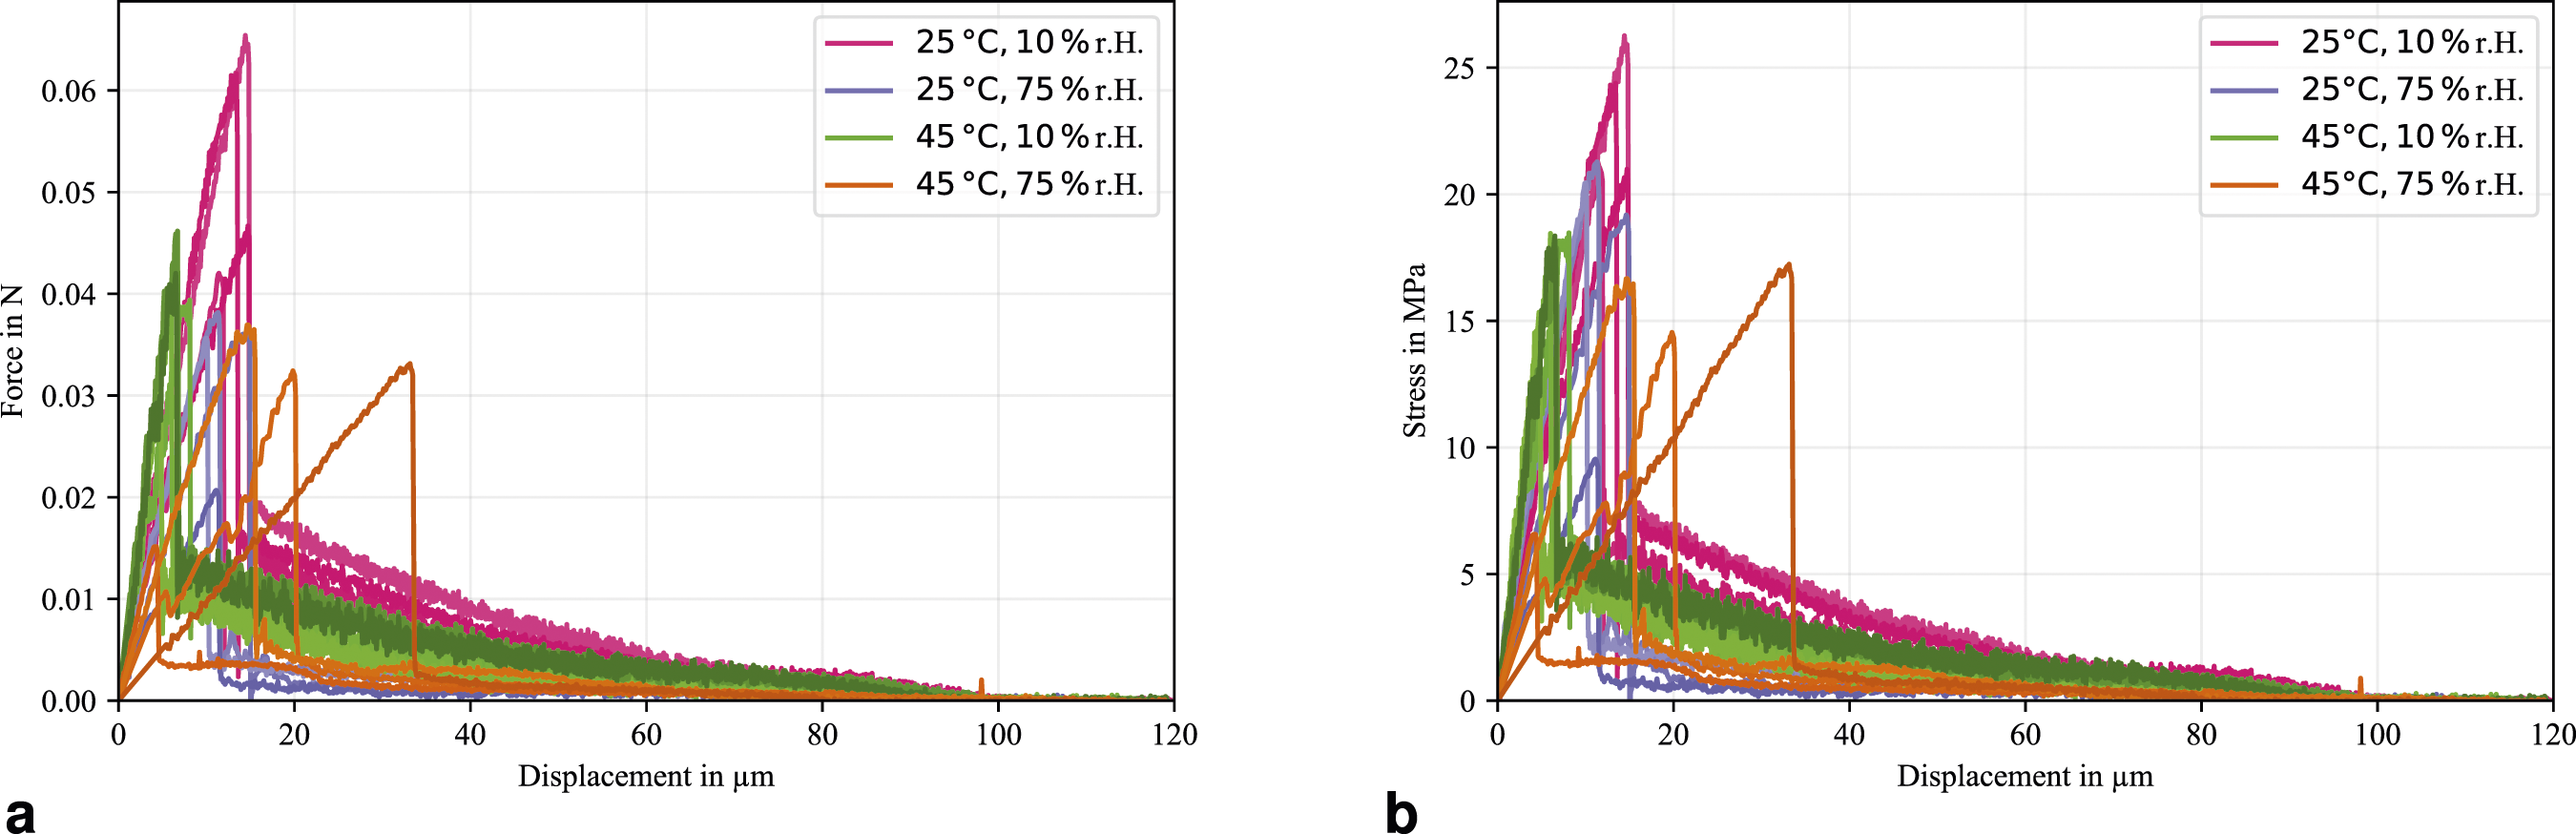
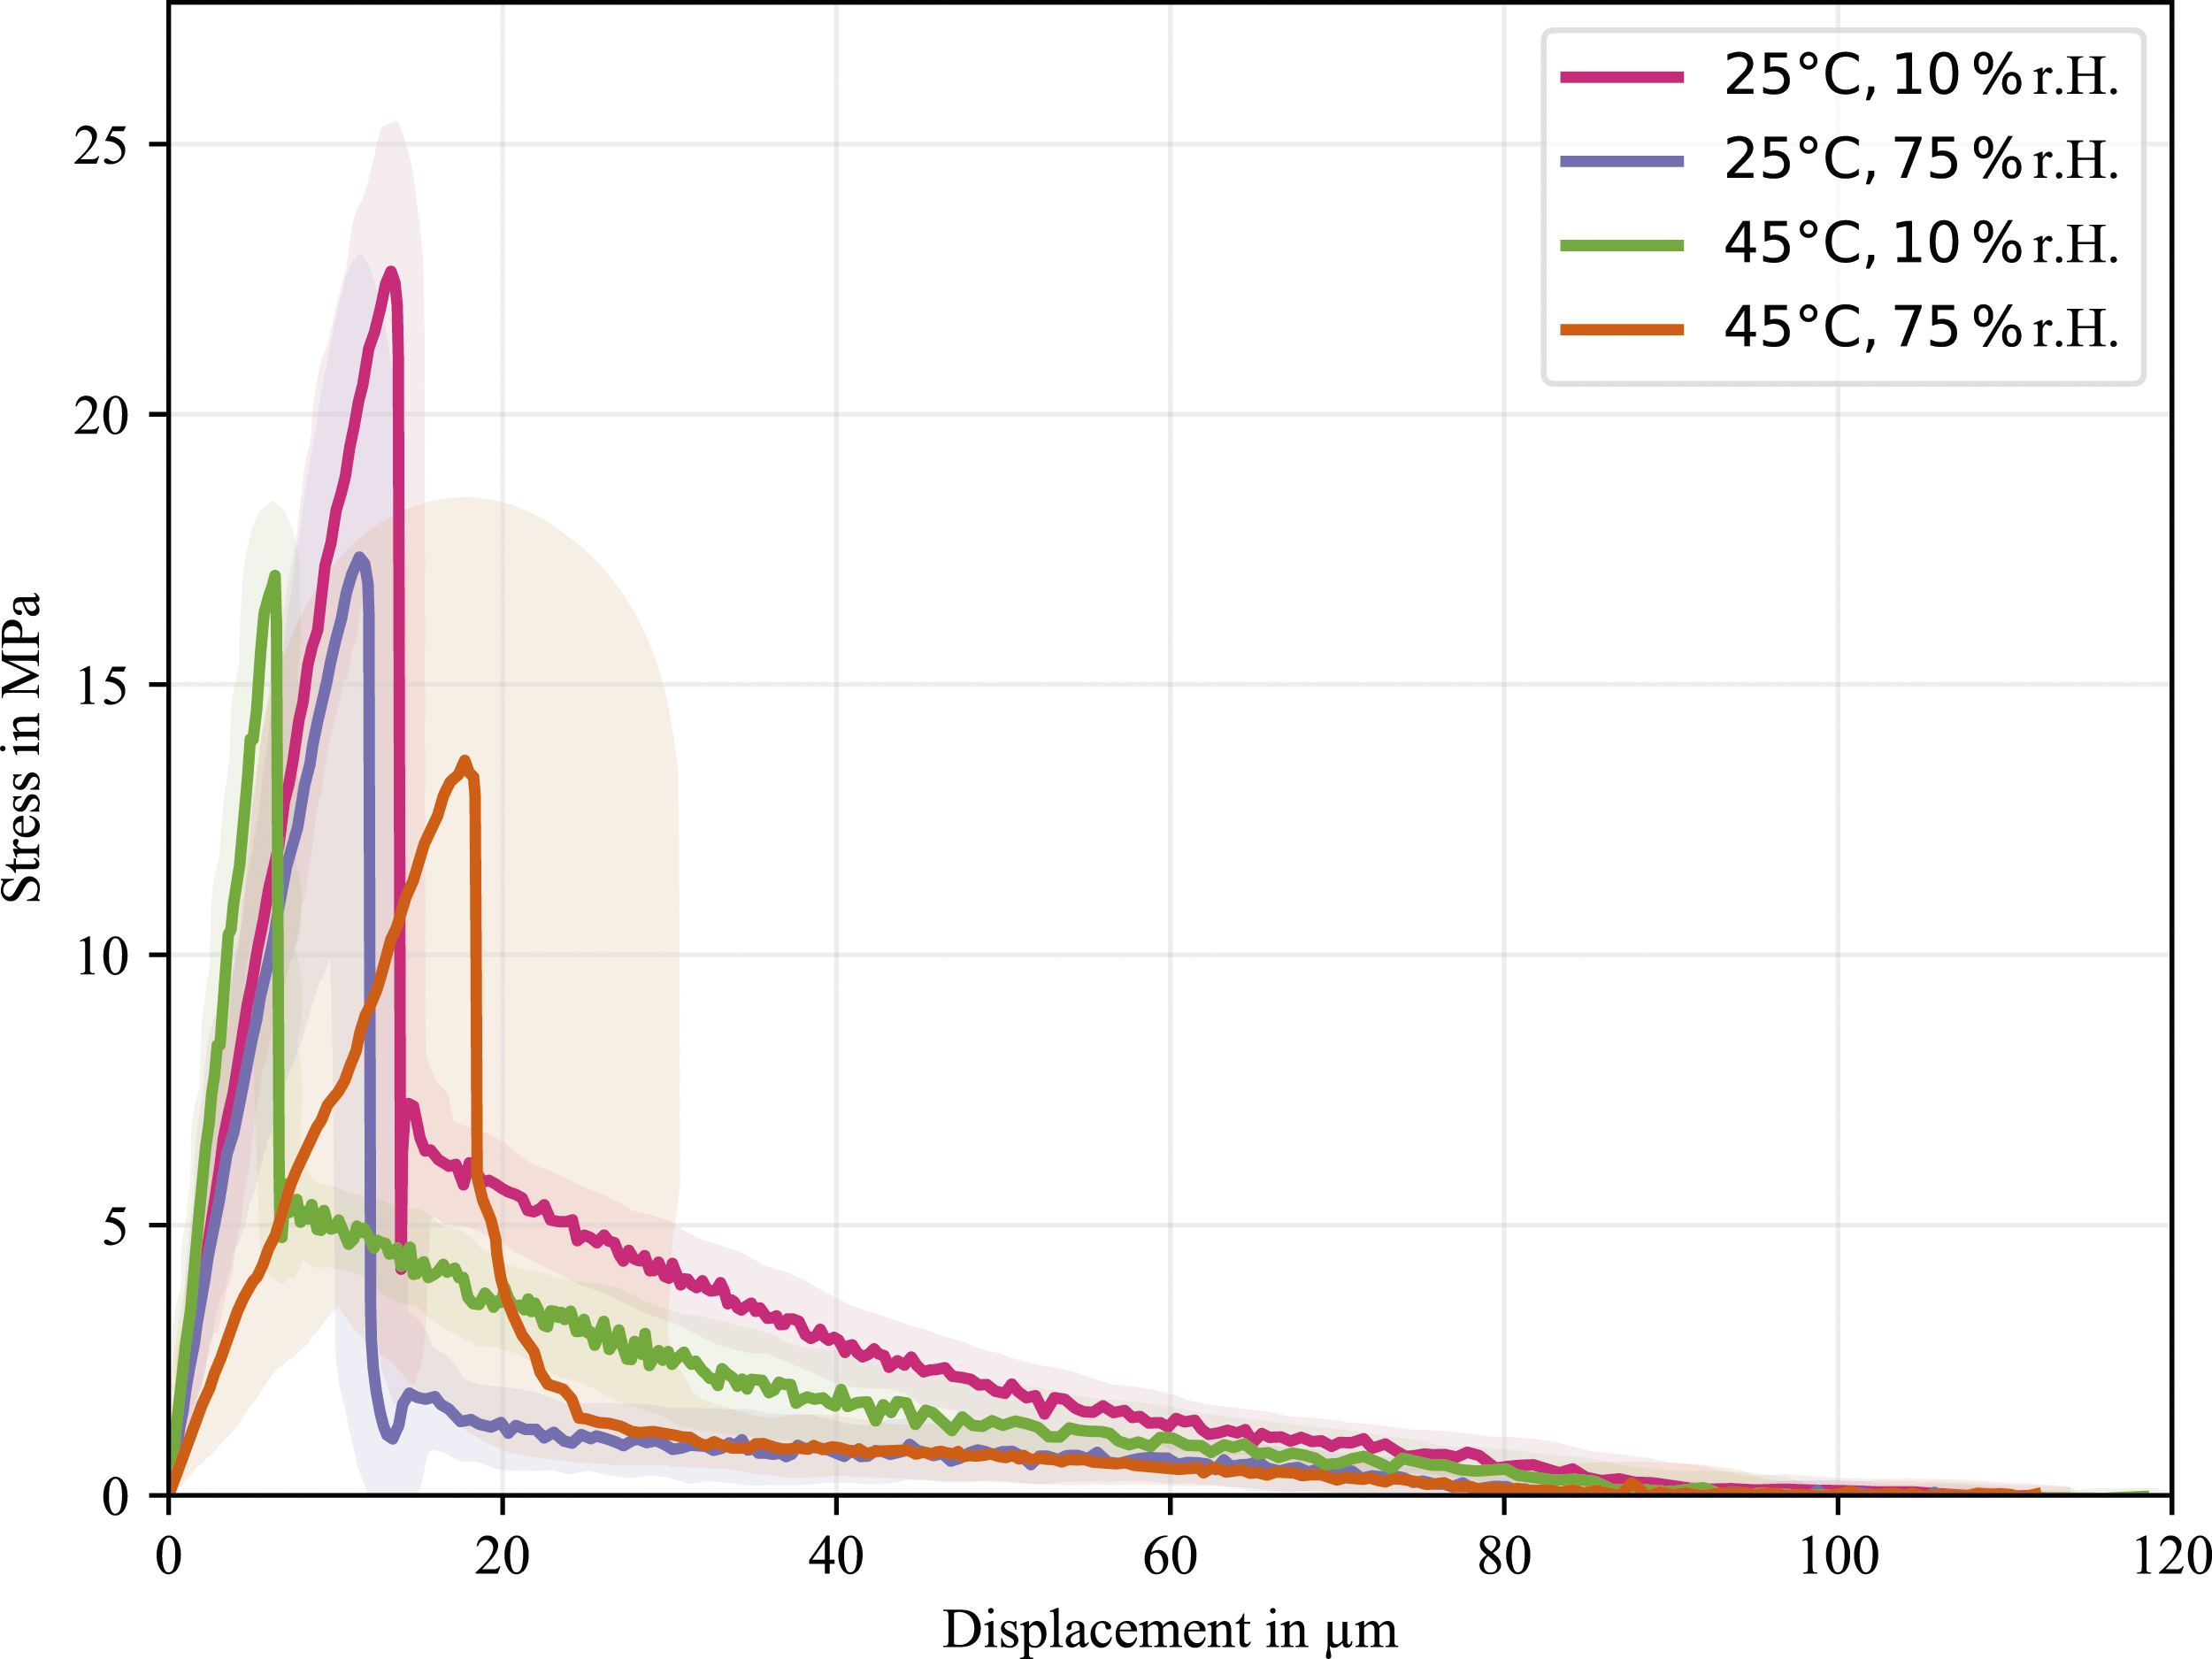
It is clearly visible that the different conditioning states result in significantly different pull-out curves, indicating a sensitivity towards both thermal and hygroscopic effects. Firstly, the authors would like to point out that significant differences were measured within the initial slope of the stress-displacement data between the conditioning states. It needs to be stressed again that the slope is deliberately not referred to as stiffness, as drawing conclusions about the fibre-matrix properties is complicated. While the slopes between the two colder conditioning states are on average the same, the warm and dry conditioning shows an increased slope and the warm and moist conditioning a significantly reduced slope.
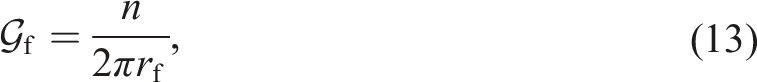
The pull-out force measurement over the embedded length for the different conditioning and their statistical distributions are given in Figure 11. In general, slightly different distributions of the embedded fiber length can be seen for the different conditioning states with embedded lengths in the range of 80 − 110 μm. The highest mean and median pull-out forces were measured for the dry and cold conditioning at around 0.054 N, as can be seen in the right box plot in Figure 11. This is followed by the dry and warm conditioning with a mean and median pull-out force of 0.04 N, and the cold and wet conditioning with a mean pull-out force of 0.033 N and a median pull-out force of 0.036 N. The lowest pull-out force was measured for the warm and wet conditioning, with a mean value of 0.029 N and a median value of 0.033 N. Based on the assumptions made in the methodology, the IFSS for each conditioning state are proportional to the slope of the linear regression in the given figure. Thereby, the highest IFSS was calculated to be 24.78 MPa for the dry and cold conditioning, followed by warm and dry with 18.32 MPa and cold and wet at 16.87 MPa. The lowest IFSS was calculated to be 14.19 MPa for the warm and wet conditioning state. Measured pull-out force over embedded length for different conditioning states with linear regression (with forced zero interception) and statistical evaluation of the embedded fiber length (top) and the pull-out force scatter (right). The slope of the regression is proportional to the IFSS. The indication color for each conditioning state can be extracted from the box plots and is in alignment with Figure 10.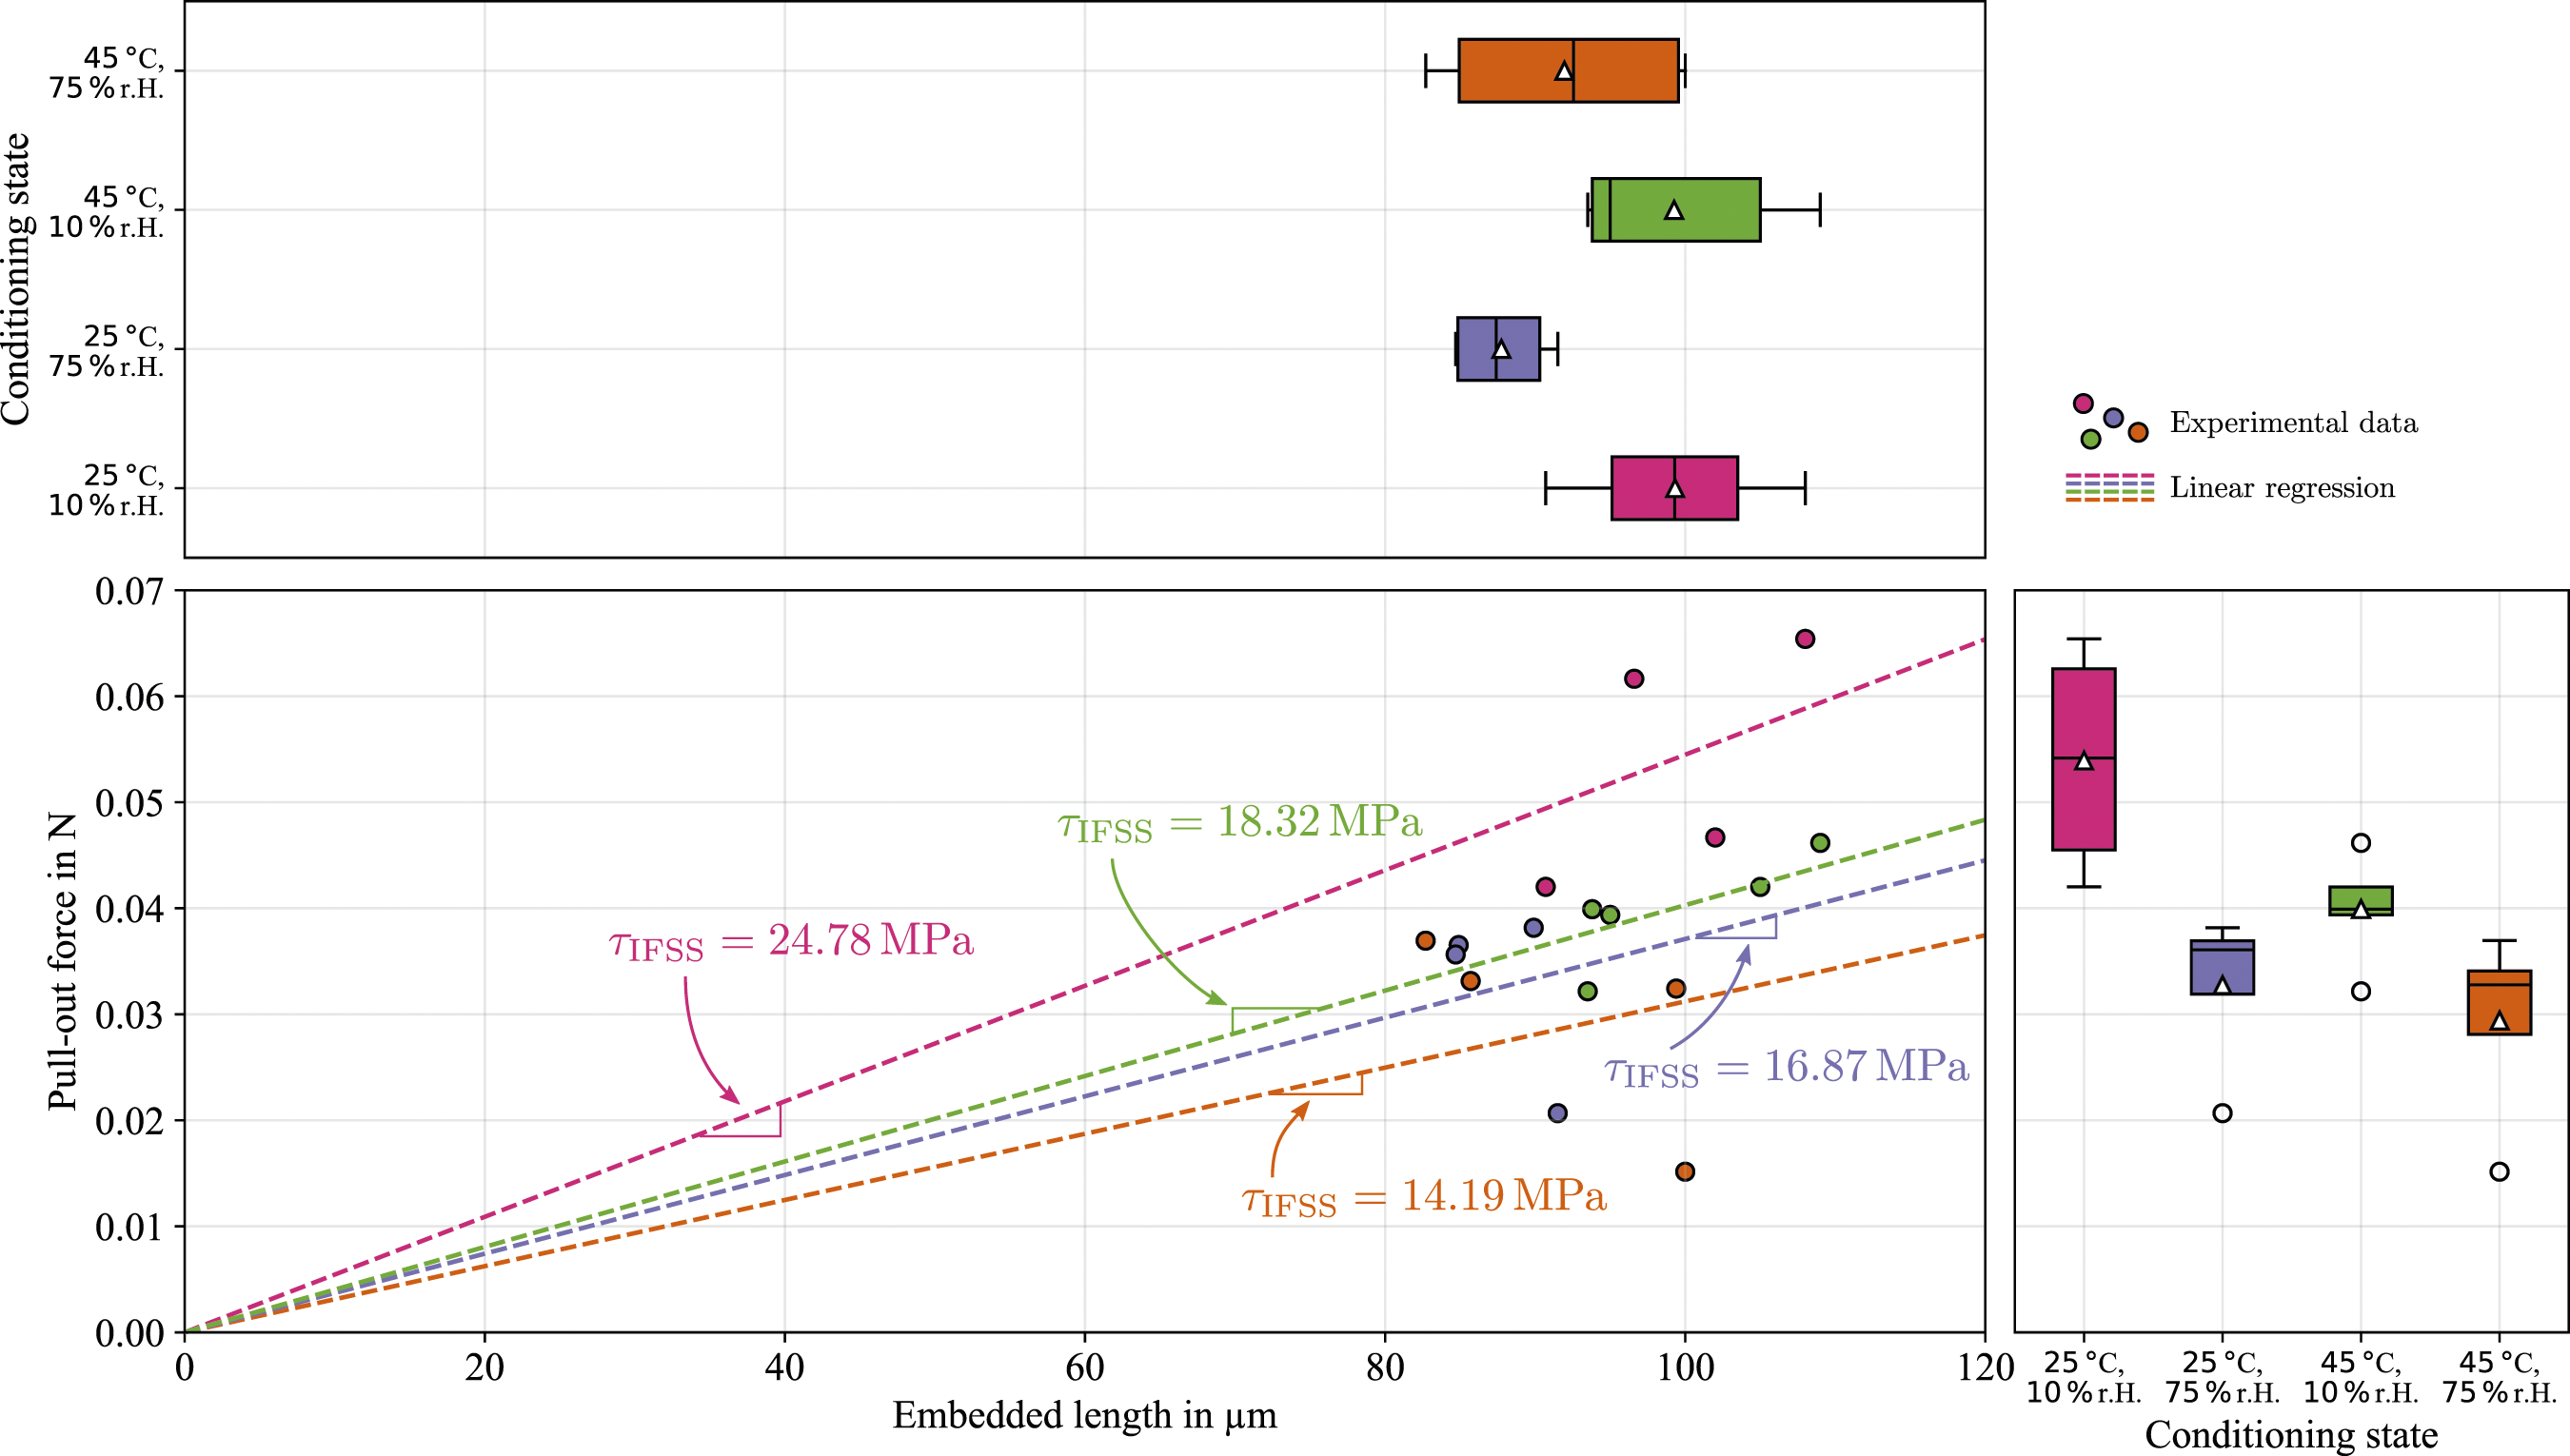
In contrast, when the IFSS is directly evaluated as the average measured pull-out force over the embedded area, instead of being interpreted as the slope of the linear regression, a slightly different picture emerges. These measurements are given in Figure 12. The highest mean IFSS was measured for the cold and dry conditioning at around 23 MPa, followed by similar mean IFSSs for a single elevated environmental factor, i.e., humidity or temperature, with a mean shear strength of about 18 MPa, which is a loss of Interfacial Shear Strength of roughly 26%. When both climatic boundary conditions are elevated simultaneously a relative drop of 43% is measured in relation to the IFSS for the dry and cold conditioning to just under 13 MPa. Since the single fiber pull-out test is prone to experimental scatter and outliers, which is partly explained by angled fibers within the specimen, a comparatively better quantity than the mean IFSS is the median IFSS. For the dry and cold conditioning the median IFSS and mean IFSS are almost identical at roughly 23 MPa, which also applies for the dry and warm conditioning at around 18 MPa. The wet conditioning states show a greater deviation between mean and median IFSS. Both cases reveal an elevated median IFSS in comparison to the mean IFSS to 20 MPa and just under 15 MPa for cold and warm temperatures, respectively. Statistical distribution of directly evaluated IFSS for different conditioning states. The indication colors are in alignment with Figure 10.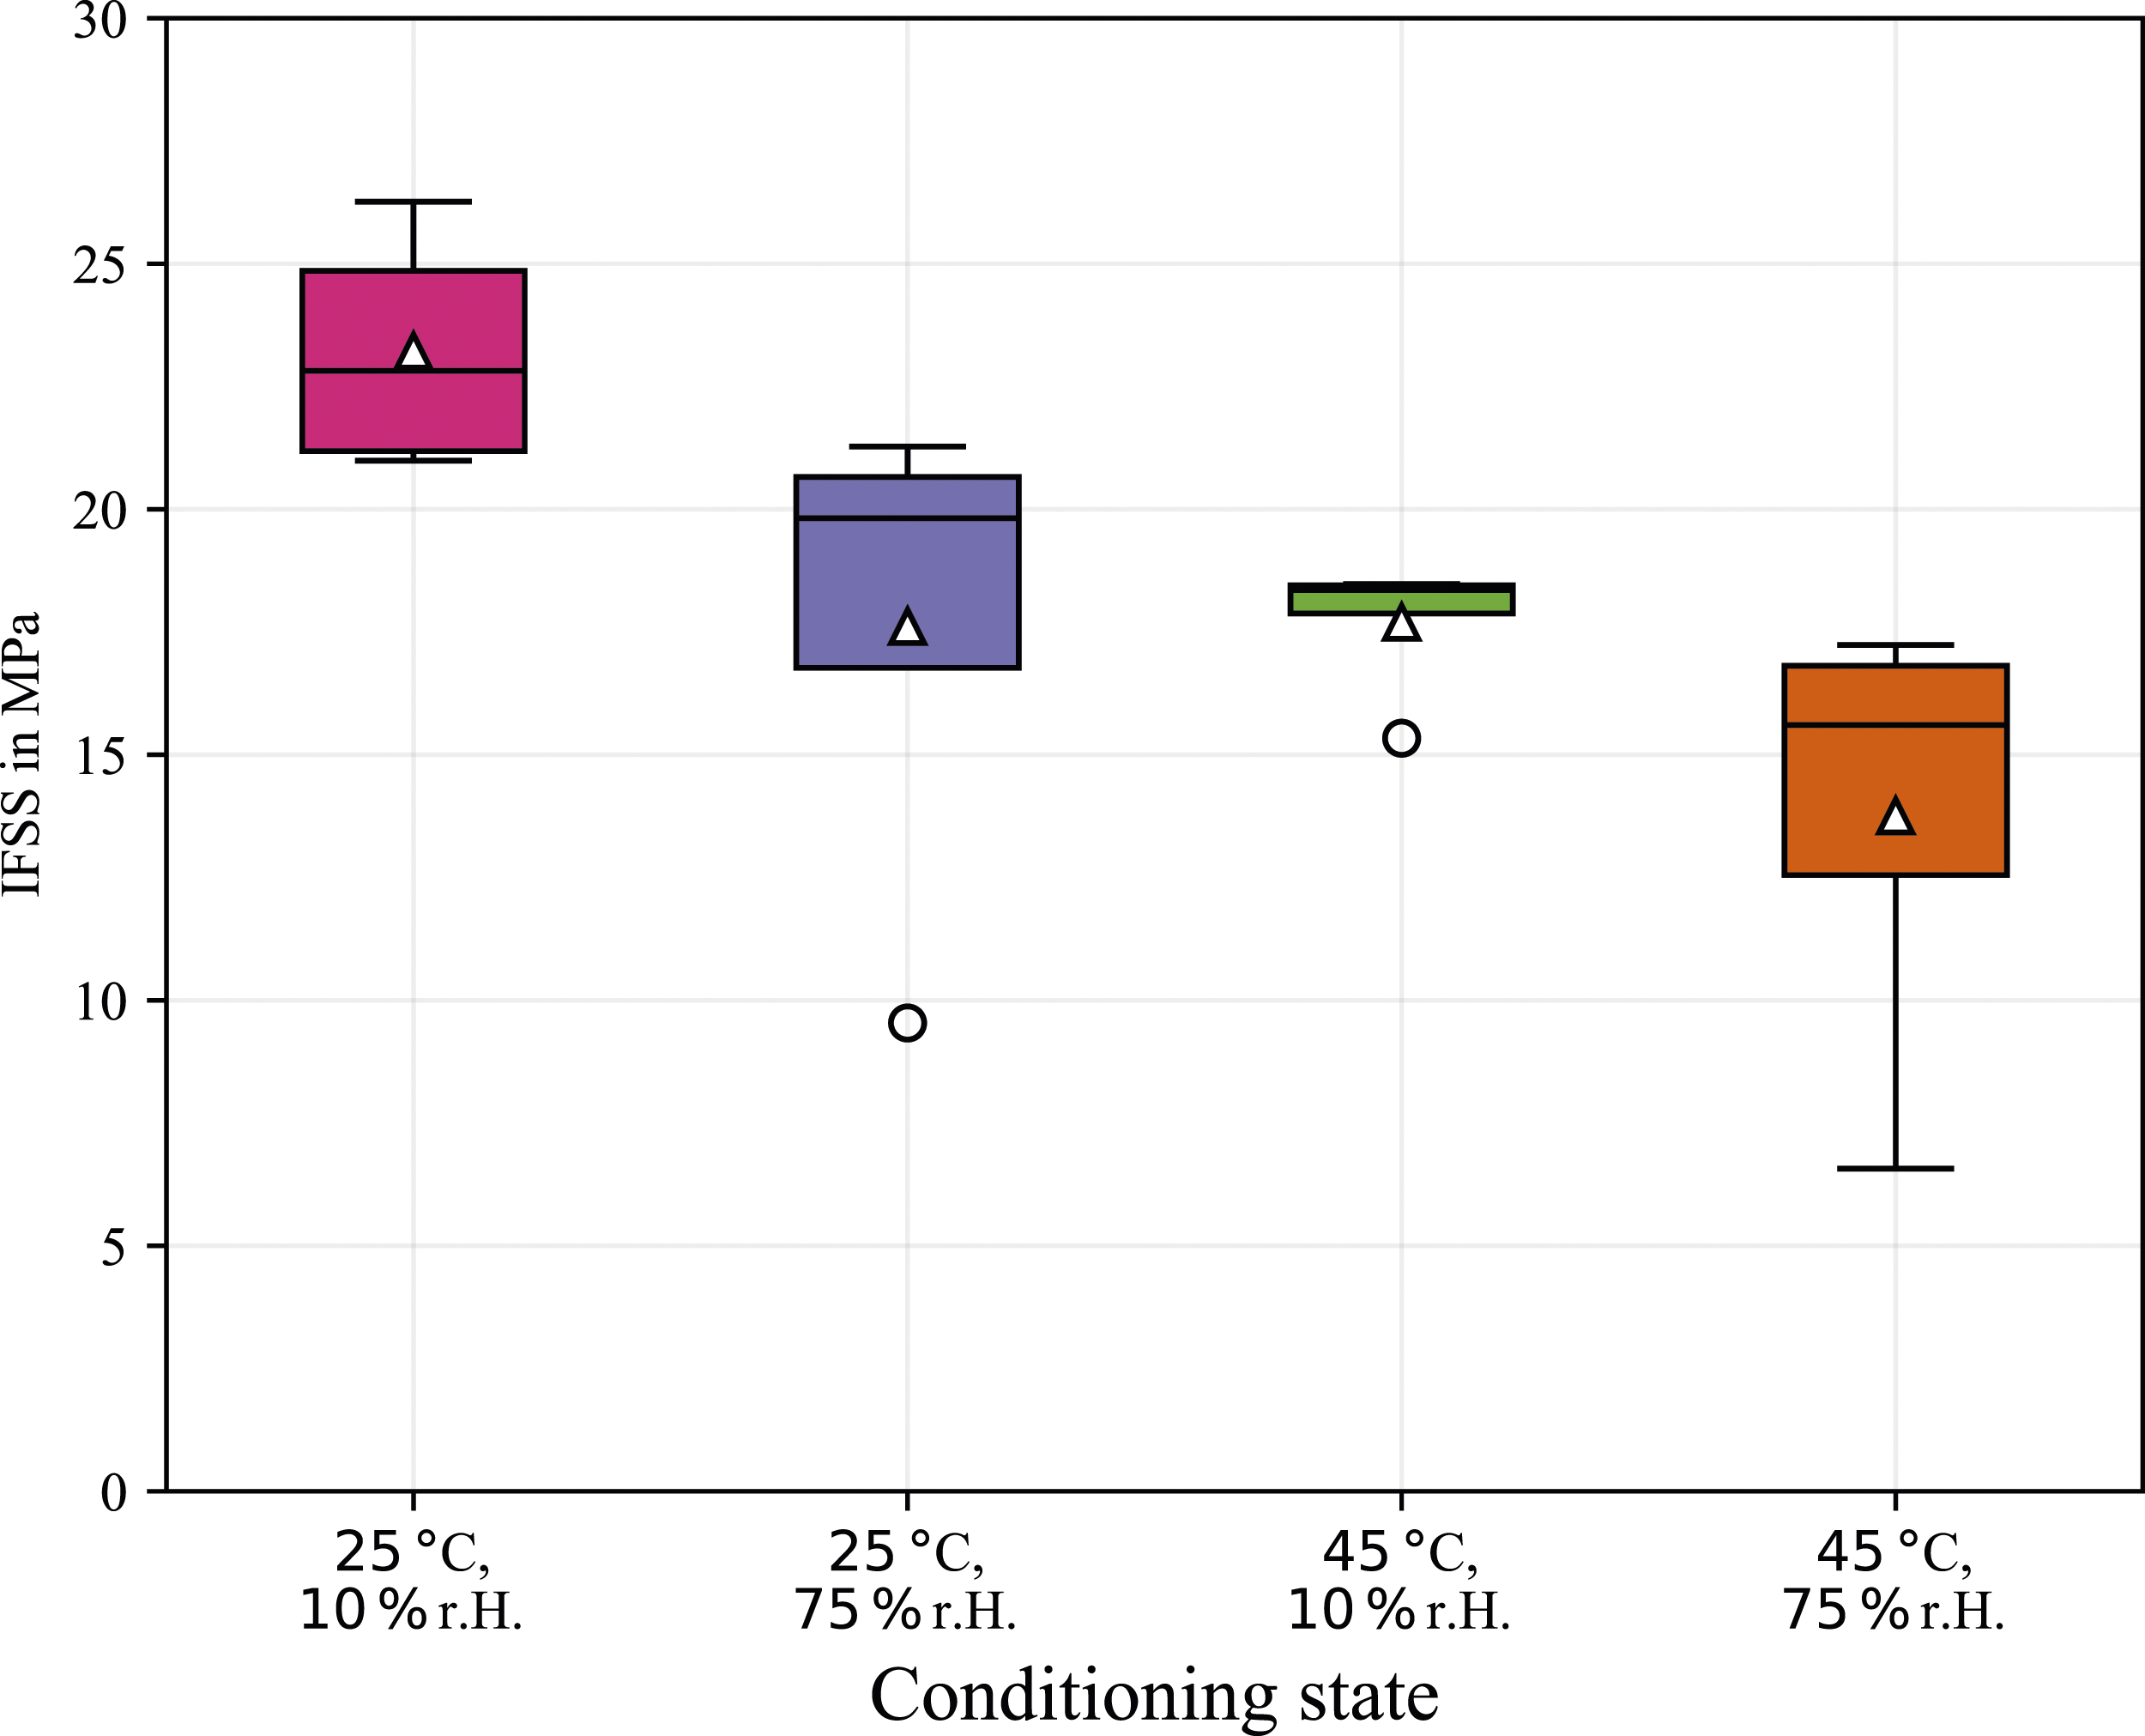
The statistical moments for the debonding length and the debonding energy release rate Calculated debond energy release rate over debond length for different conditioning states and statistical evaluation of the debond length (top) and the debond energy release rate (right). The indication colors are in alignment with Figure 10.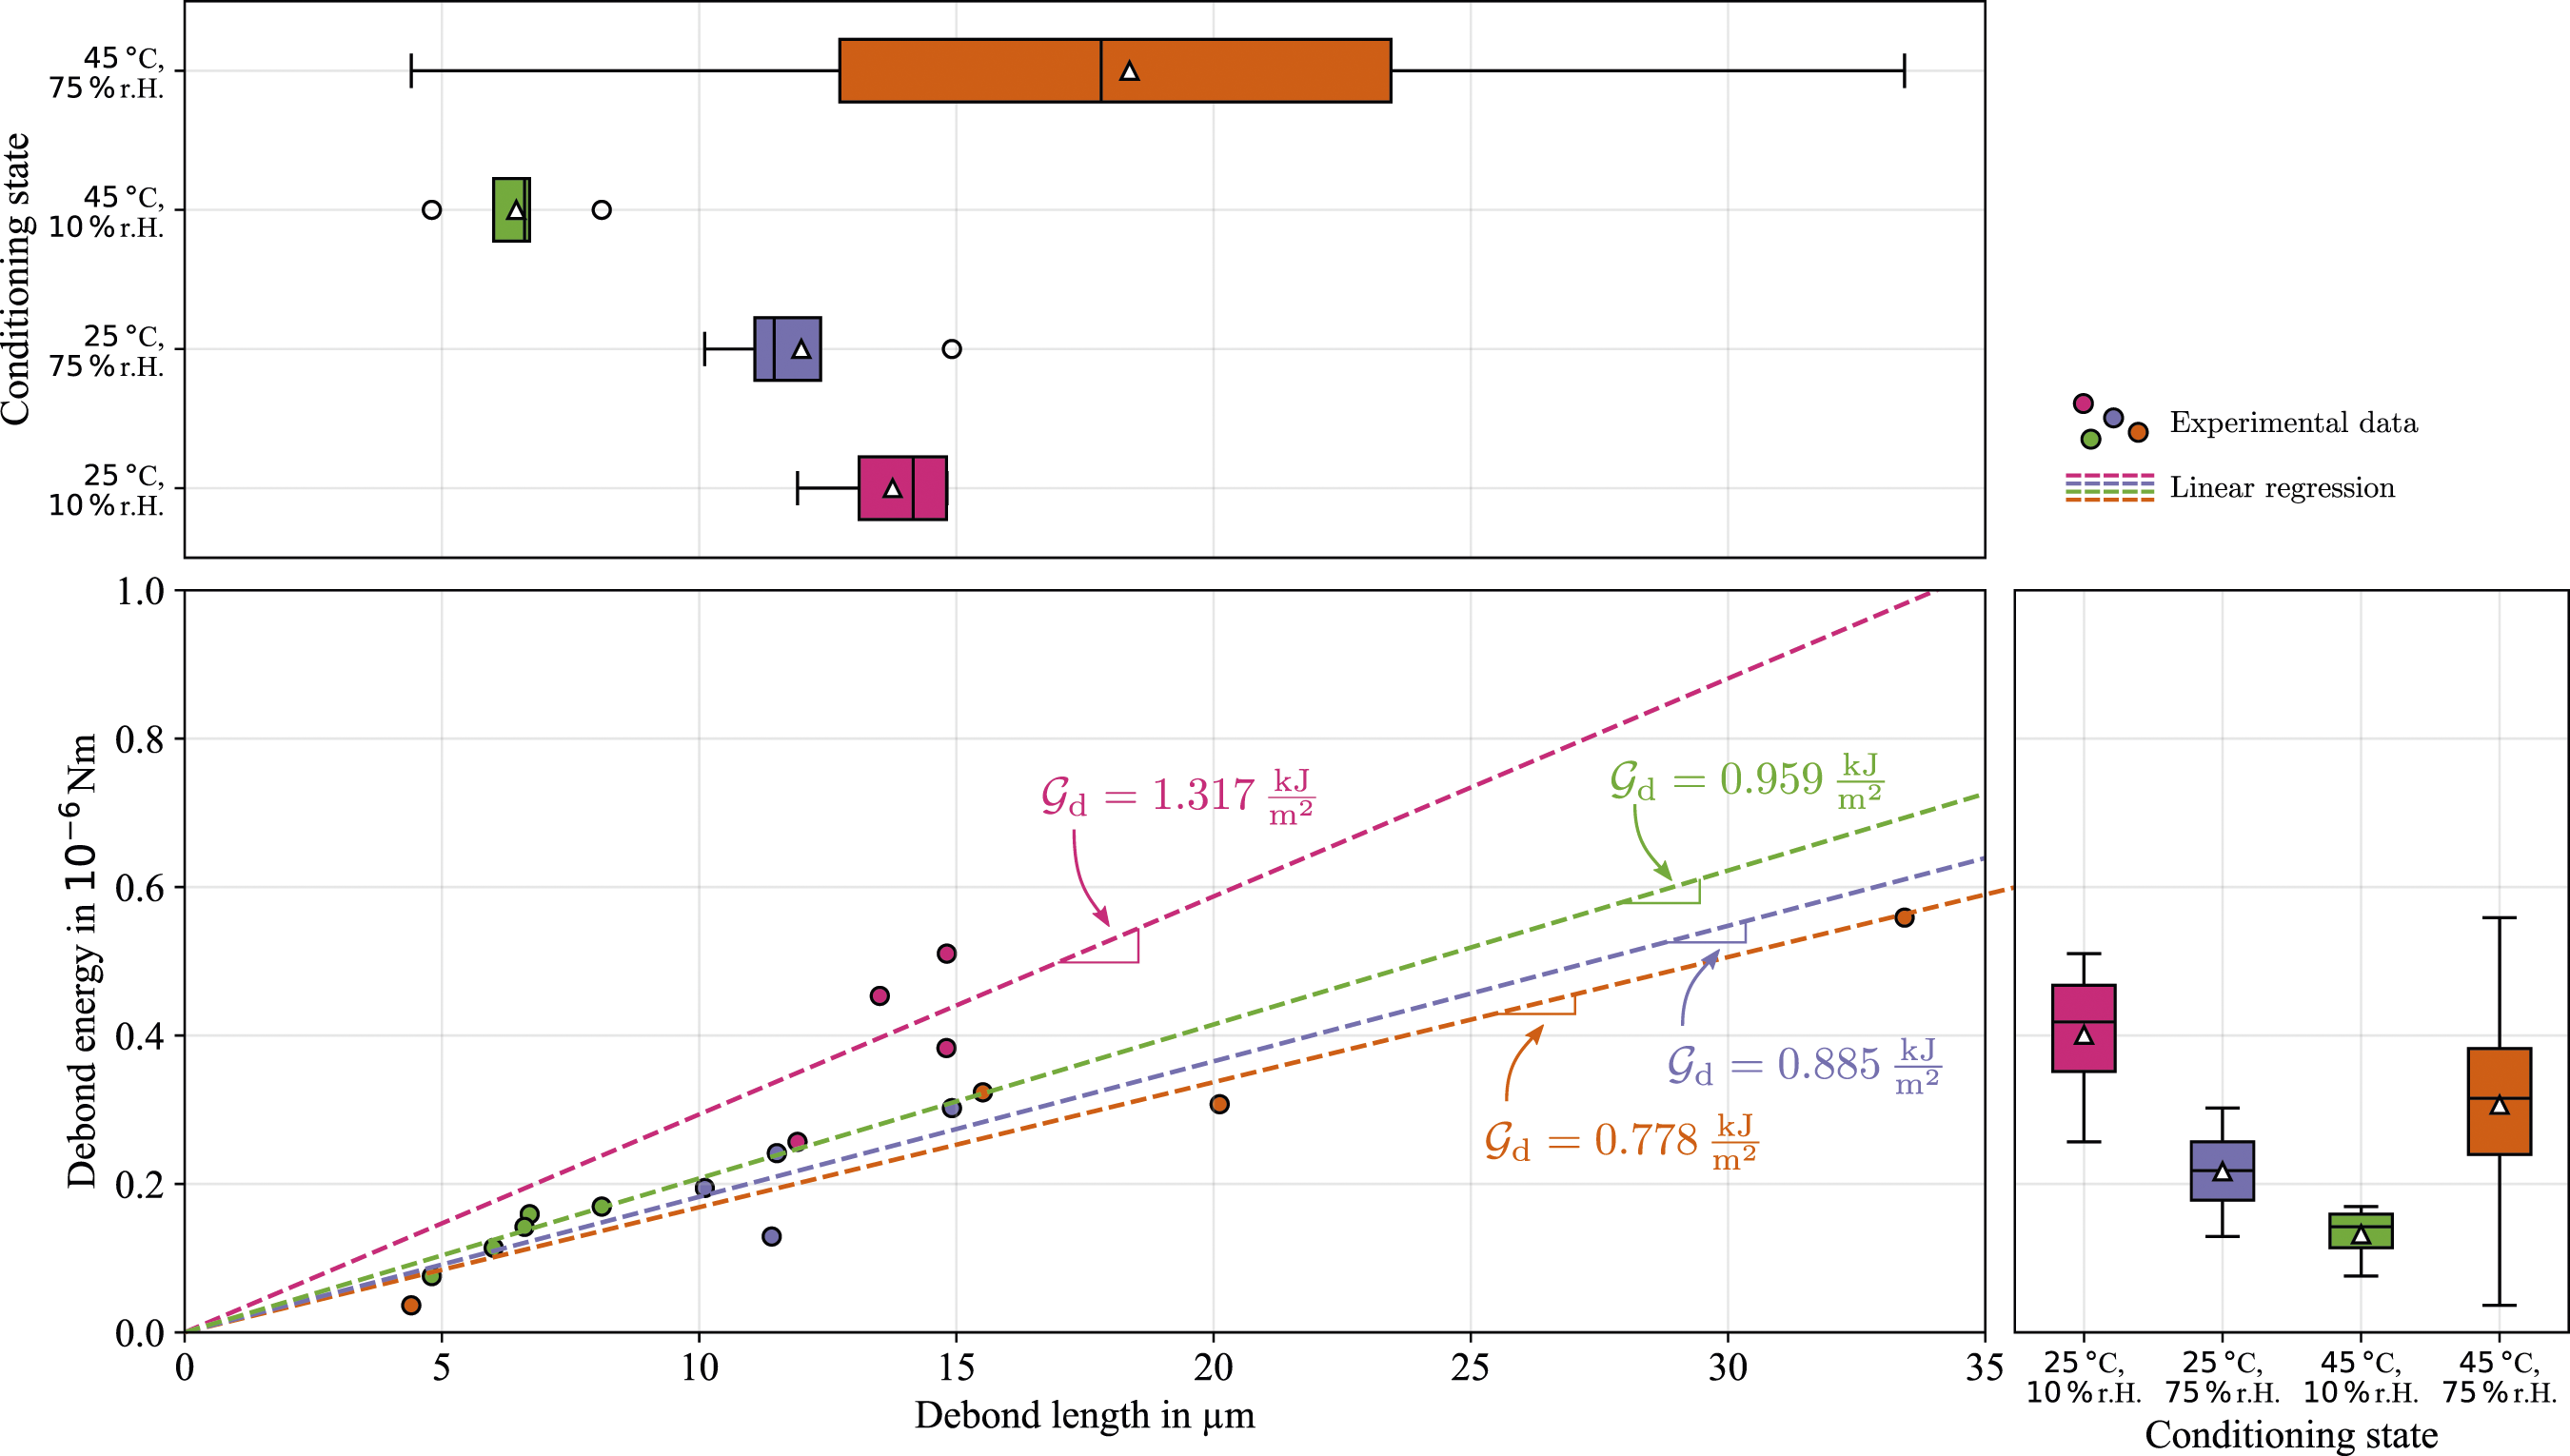
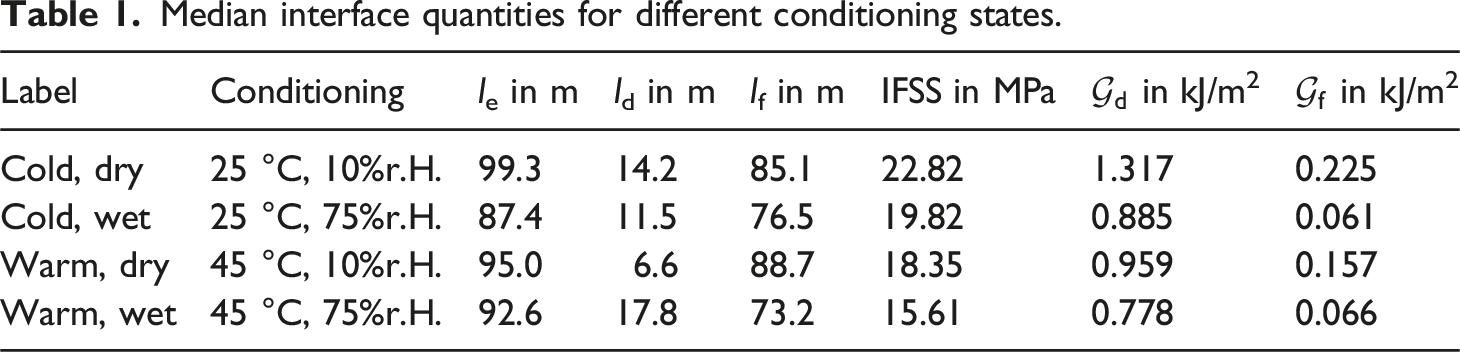
Different effects on the frictional forces due to humidity and temperature are obvious and their energetic proportions are visualized in Figure 14. The frictional length is just the difference between the embedded length and the debond length. Given the large scatter of the debond length for the wet and warm conditioning in Figure 13, the frictional length of this conditioning state shows the greatest scatter, while the other conditioning states have comparable values and scatter bands. The energetic portion of the frictional stresses show a clear difference between dry and wet conditioning states, regardless of the surrounding temperature. When the humidity is kept low, frictional stresses after debonding are significantly increased in comparison to a wet environment. The highest median frictional energy was measured for the dry and cold conditioning with about 0.426 μJ, followed by the dry and warm conditioning with 0.313 μJ. Significantly lower are the measured energies for the wet conditionings, with roughly 0.1 μJ for cold and warm temperatures, respectively. The area specific work of friction again correlates with the slope of the regression. Once more the highest values were measured for the dry conditionings with 0.223 kJ/m2 and 0.157 kJ/m2 for cold and warm temperatures, respectively. The wet conditionings showed an almost equal specific work of friction with 0.066 kJ/m2 and 0.061 kJ/m2 for warm and cold temperatures, respectively. The median quantities for the different conditioning states are given in Table 1. Measured frictional energy over frictional length for different conditioning states with linear regression (with forced zero interception) and statistical evaluation of the frictional length (top) and the frictional energy scatter (right). The slope of the regression is proportional to the frictional energy rate. The indication color for each conditioning state can be extracted from the box plots and is in alignment with Figure 10. Median interface quantities for different conditioning states.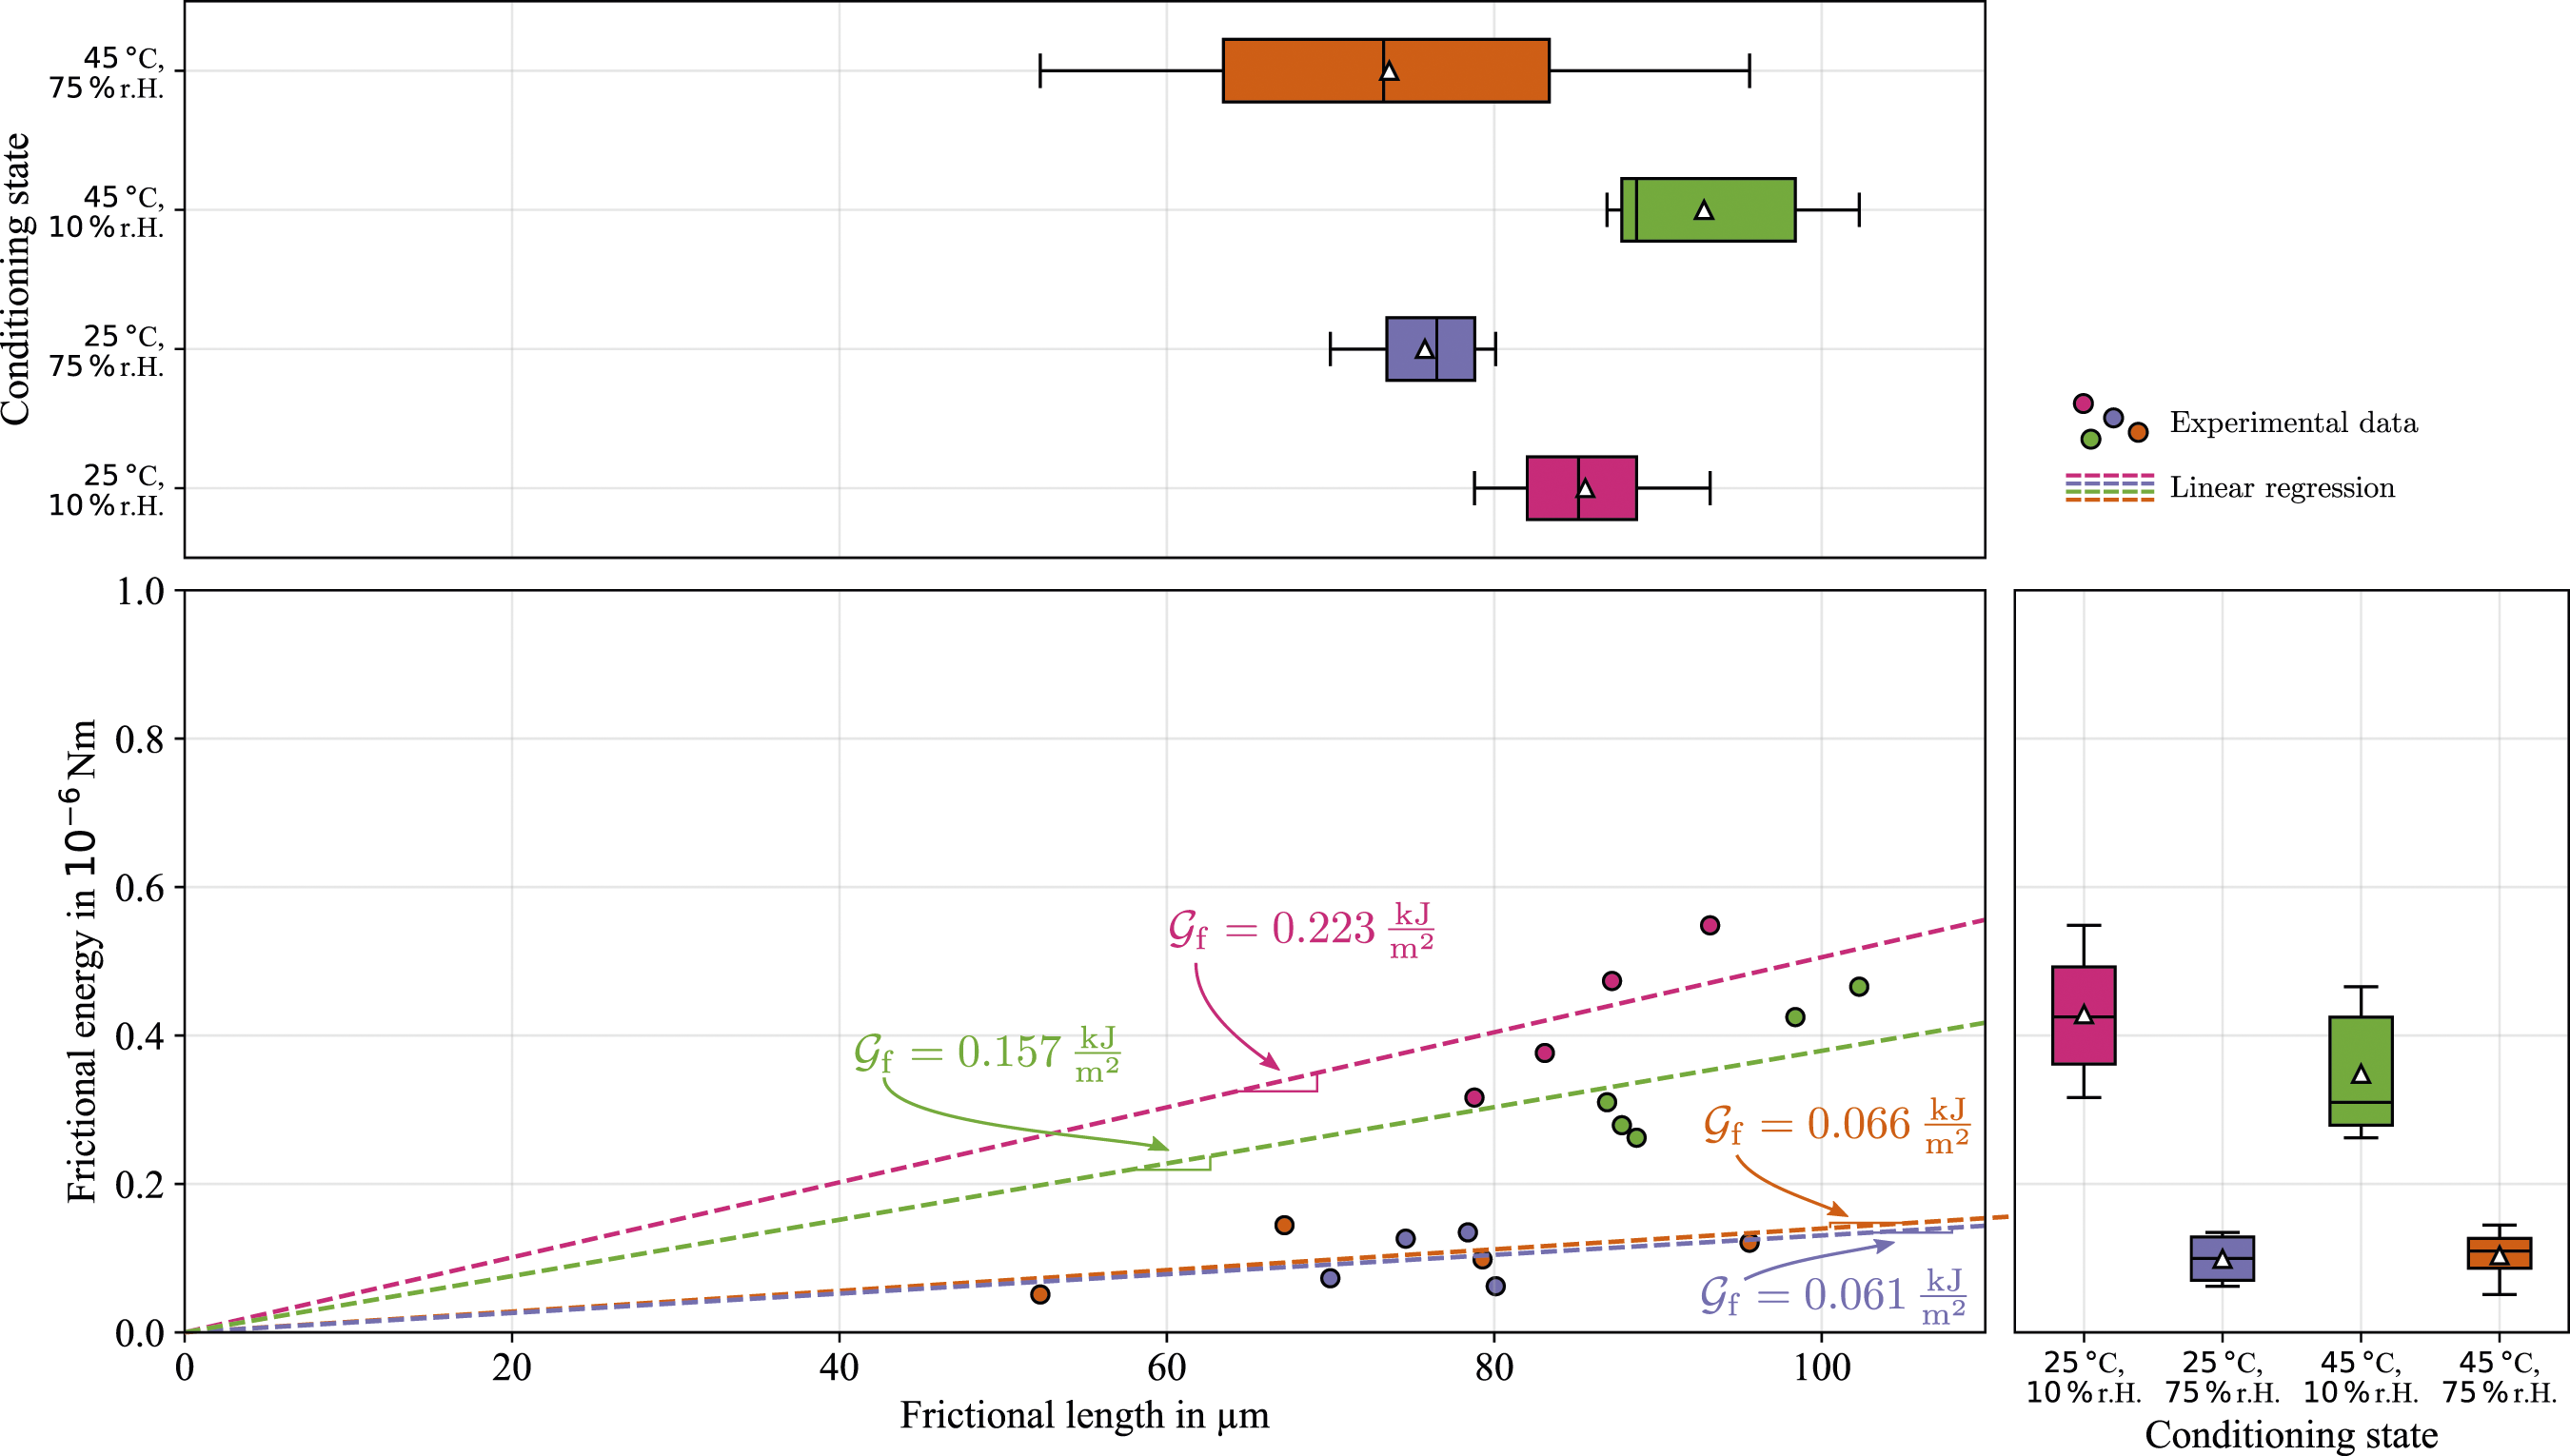
After successful pull-out each specimen was investigated in the mentioned SEM analysis to measure the embedded length, the fiber radius and qualitatively assess the pulled-out fiber. For each conditioning state a representative fiber is given in Figure 15. It can be seen that for all conditioning states no matrix residue is found on the fiber, i.e., a blank fiber. The embedded lengths can easily be measured by the characteristic formation of a meniscus at the fiber entry point, at which visible matrix fracture occurs after fiber pull out. While the blank fiber surfaces reveal no differences between the conditioning states, a slight deviation in the fracture pattern of the meniscus is visible. For the dried cases, the meniscus seems to fracture more rigidly with a slightly increased fracture surface area, while the wet cases reveal a smoother fracture zone of the meniscus. SEM image of pulled-out specimens for different conditioning states: dry and cold (a and b), dry and warm (c and d), wet and cold (e and f) and wet and warm (g and h). All conditionings states were pulled out with a blank fiber with slight differences in the deformation of the meniscus.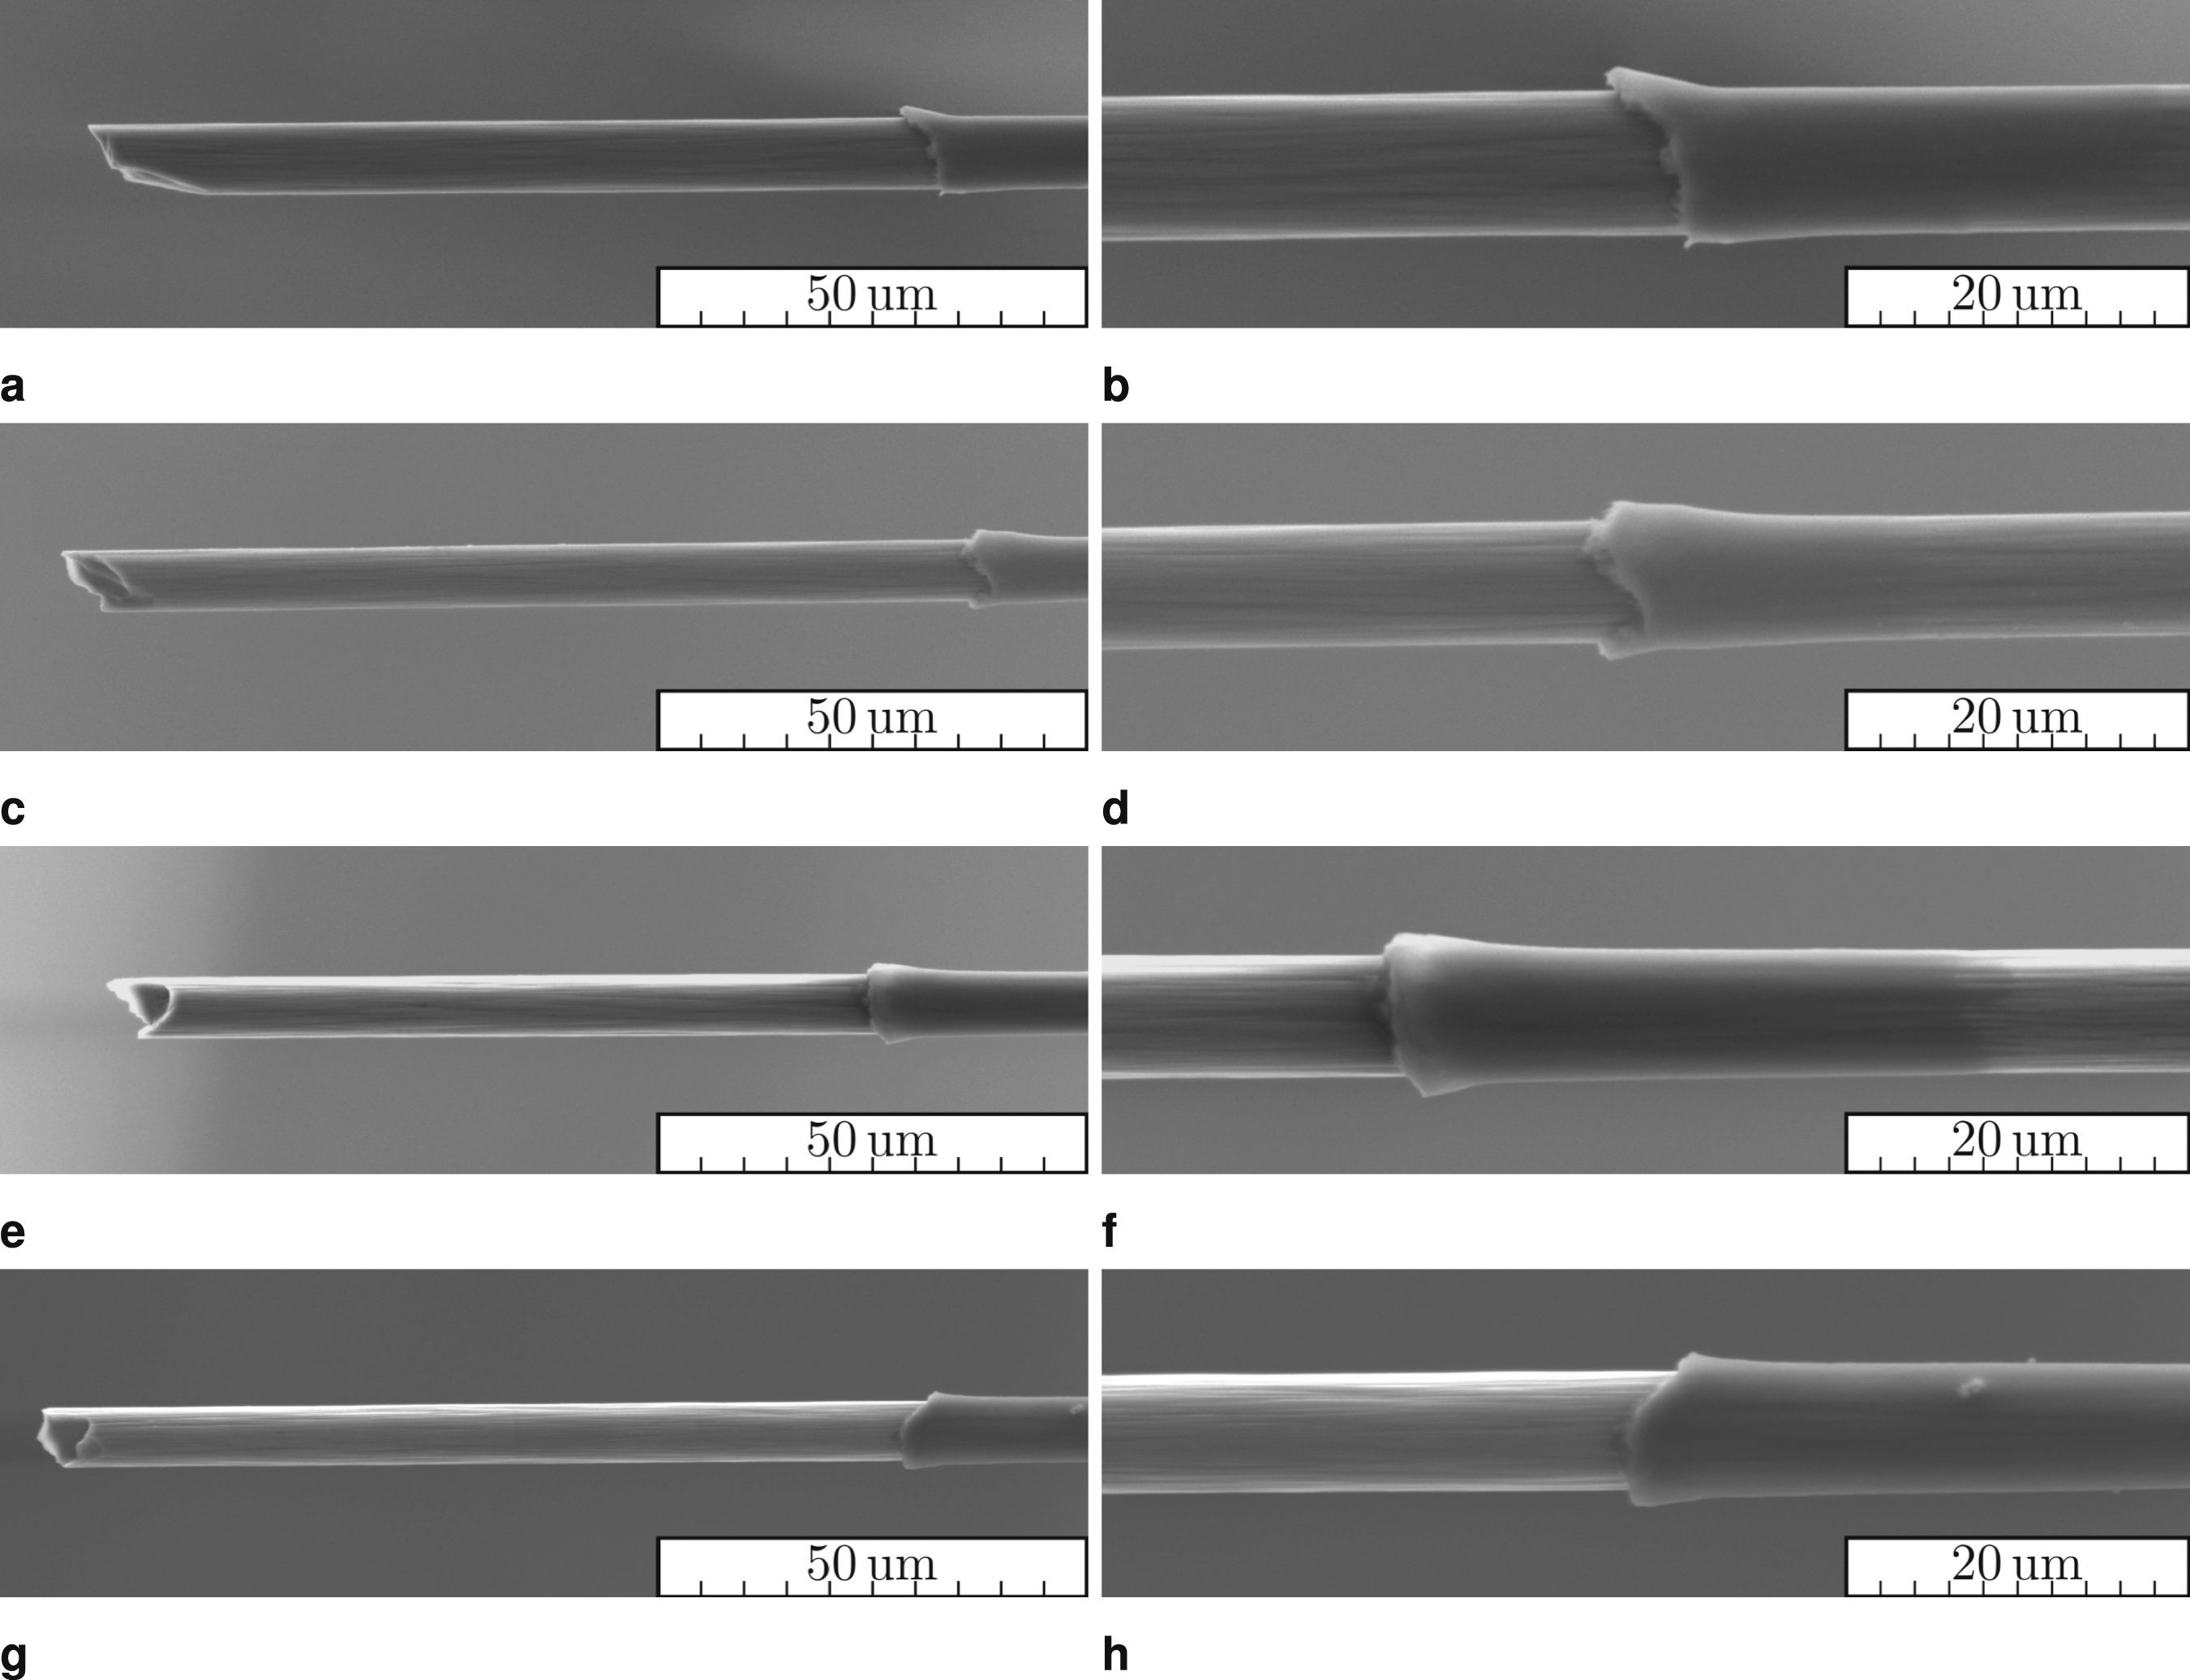
Discussion
Differing embedded fiber lengths were observed across the conditioning states. However, as these lengths do not change during conditioning, we attribute these differences to the small sample size. With larger experimental studies, these distributions should become more equal. Furthermore, various slopes were measured in the initial range of the stress-displacement data between the conditioning states. There is a risk here that this slope could be equated with the stiffness of the fiber-matrix interface alone or in combination with the matrix stiffness. With this approach, it would be difficult to argue why the highest stiffness was measured for the warm and dry conditioning state, when generally the viscous properties of the matrix and thus its overall stiffness should be reduced by the increased temperature. In fact, the initial slope represents much more the total stiffness of the experimental setup. The free fiber length, which drastically reduces the total stiffness when increased, has a major influence on this. Although care was taken during the experiment to keep the free fiber length between the conditioning states comparable, this cannot necessarily be guaranteed due to varying sample geometries. Consequently, the said initial slope was not included in the evaluation for characterizing the interface properties.
The observed reduction of the Interfacial Shear Strength (IFSS) with increased environmental factors implies an interplay between temperature and humidity effects. This is supported by the fact that each elevated factor independently led to a comparable reduction in IFSS, and their combination caused a further reduction. However, it remains unclear whether there is a systematic reason for the deviation between the mean and median values of the IFSS, exclusively for the wet cases. We could not answer this question with our limited data set, but it should be investigated in future studies. As previously mentioned, several studies report similar diminishing effects on the IFSS due to increased temperature and humidity. A plausible explanation is that both factors cause polymer swelling, albeit via different physical mechanisms. Increased temperature results in larger distances between polymer chains, due to additional thermal energy and increased molecular vibrations. Moistening, on the other hand, expands the polymer by incorporating water molecules between the polymer chains. Regardless of the expansion mechanism, both lead to polymer swelling away from the fiber, resulting in a relaxation of the radial residual stress within the interface caused by thermal shrinkage during manufacturing. This phenomenon was demonstrated in a linear-elastic thermal investigation by Tanaka et al., 26 and we assume it’s also valid for hygroscopic swelling. Given that all conditioning states resulted in blank fiber after pull-out, a primarily mechanical bond, rather than a strong chemical one, is probable. This suggests that frictional effects are important for the interlocking mechanisms between fiber and matrix, and these effects are directly correlated with the radial pressure between the constituents. Therefore, a reduction in radial pressure due to increased humidity, temperature, or both, results in a subsequent reduction in IFSS due to decreased internal friction. In the case of the IFSS, the effects of temperature and humidity appear to be superimposed. Since no matrix residues were present on the extracted fibers for any conditioning state, it is not possible to draw direct conclusions from the temperature- and moisture-dependent strength of the polymer to the measured IFSS, as was done, for example, in Chen et al., 41 where a direct correlation was found. Nevertheless, thermoplastic materials in general behave more viscous and more compliant for increased temperatures which is also the case for increased humidity levels in PA6. Therefore, the effects of varying compliance and strength properties of the polymer on the IFSS should be investigated more closely in the future.
A similar reduction effect is observed for the debonding energy release rate. This can be attributed to the weakened interface due to the reasons mentioned in the previous paragraph. According to equation (6), a reduction in shear stress within the fiber-matrix interface results in a decrease of
While humidity and temperature effects on the pull-out mechanisms up to debonding seem similar, a different picture arises when studying the post-debonding process or frictional phase. It is evident that humidity alone leads to a significant reduction in the surface-specific work of friction, regardless of the surrounding temperature. This indicates that a simple superposition after debonding is not feasible. Models postulating a proportional relation between frictional forces and normal forces, such as Coulomb friction, would provide a simple explanation for a decrease in friction due to the polymer’s expansion. Since both temperature and humidity cause the polymer to expand, but only temperature within the tested range does not affect the frictional forces, a different explanation is required. Earlier studies have shown that the penetration of water between PA and hydrophilic surfaces, such as glass, reduces the coefficient of friction due to a lubrication effect caused by a water film only a few molecules thick. 42 As carbon fibers also have a hydrophobic structure, 43 the combination of the two materials in CF-PA6 is expected to produce a similar lubrication effect, leading to a reduction in frictional resistance, as observed in the experiment. Remarkably, increasing the temperature from the cold and wet conditioning to the warm and wet conditioning does not further decrease the specific work of friction. This suggests that a reduction of the radial pressure reaches a limit for the wet conditioning, such that the added elevated temperature does not further lower the frictional stresses. Another possible interpretation, which requires further numerical investigations, is that the relaxation of the radial pressure due to water absorption has fully annealed the radial eigenstresses, regardless of the surrounding temperature, which could explain why the temperature has no further effect on the measured frictional forces.
While the underlying study shows coupled effects between temperature and humidity on the effective interface properties, such as IFSS, energy release rate and surface specific friction work, it raises more questions about the underlying mechanisms, which can only be answered based on strong assumptions and hypotheses as stated above. Possible answers could be found in the field of molecular dynamics, which takes into account the exact chemical composition and its respective interaction with environmental factors. Recent studies on the effects of moisture and temperature on the interfacial properties include Wang et al., 44 Xie et al. 45 and Wu et al. 46 Wang et al. argue that the uptake of water and the increase in temperature leads to a reduction in the compactness of the interface and consequently to a reduction in the integrity of the interface. In addition, the uptake of water molecules leads to the formation of hydrogen bonds within the interface, reducing the adhesion energy between the fiber and the matrix, which in turn reduces the ability to transfer stress. An increase in temperature accelerates the diffusion process without any other changes, which would explain why only minor differences in interfacial properties were observed between cold and wet conditioning and warm and wet conditioning in the current study, assuming that equilibrium was reached in both cases. Xie et al. confirm the loss of compactness for an increase in temperature without causing additional damage to the interface. Furthermore, they report a damaging mechanism of the water molecules on the investigated epoxy system. If this is assumed to be transferable to a thermoplastic system, the effects of temperature would be reversible, while the moisture induced damage would not. Since this was not investigated here, further studies are advised, which would allow to understand the individual effects of water and temperature in more detail. Wu et al. report that the absorbed water acts as an initiation site for the formation of matrix voids which accelerate the debonding between matrix and fiber, creating a clearer picture on the damage mechanisms which could explain the here observed effective effects. A shortcoming of the current state of the art is that most studies in the field of molecular dynamics focus on thermoset composites, which inherently behave differently to thermoplastic composites as they are made up of different reactive groups, have a cross-linked microstructure and are therefore not as strongly influenced by environmental conditions. Nevertheless, some results may be extrapolable although further research focusing on thermoplastic composites is encouraged.
Conclusion
This study has examined the influence of various environmental conditions, namely temperature and humidity, on the interfacial properties of carbon fiber-reinforced polyamide 6 (CF-PA6). Both factors were found to cause a reduction in the Interfacial Shear Strength (IFSS), which was explained by polymer swelling, leading to a relaxation of the radial residual stress within the interface. These effects were found to be superimposed, indicating a complex interplay between temperature and humidity at the fiber-matrix interface.
It was observed that the debonding energy release rate is influenced by overlapping effects between moisture and temperature, which show a non-linear relationship. This suggested a coupled effect between temperature and humidity. The study also revealed that humidity alone significantly reduces the surface-specific work of friction, regardless of the surrounding temperature, suggesting the importance of considering both temperature and humidity in understanding the pull-out mechanisms in CF-PA6.
In addition, the study highlighted the importance of maintaining a stable climate during testing to ensure accurate results. To achieve this, a microscale climate chamber was developed, utilizing the principle of deliquescence to maintain a constant relative humidity. This approach proved effective in controlling the climate conditions during the experiment, offering a promising strategy for future micro-mechanical testing.
These findings provide valuable insights into the effects of environmental conditions on the performance of CF-PA6, and underline the need for further investigation into the interaction between temperature and humidity at the fiber-matrix interface. The knowledge gained from this study could inform improvements in the design and application of CF-PA6 in various industries.
Footnotes
Acknowledgements
The support by the German Research Foundation (DFG) is gratefully acknowledged. Support from DOMO Chemicals GmbH in form of trial materials is gratefully acknowledged.
Author contributions
Conceptualization, N.C.; methodology, N.C.; formal analysis, N.C. and J.H.; investigation, N.C.; resources, J.H. and P.G.; data curation, N.C.; writing and original draft preparation, N.C.; visualization, N.C.; supervision, J.H.; project administration, J.H. and P.G.; funding acquisition, J.H. and P.G.; All authors have read and agreed to the published version of the manuscript.
Declaration of conflicting interests
The author(s) declared no potential conflicts of interest with respect to the research, authorship, and/or publication of this article.
Funding
The author(s) disclosed receipt of the following financial support for the research, authorship, and/or publication of this article: The research documented in this manuscript has been funded by the Deutsche Forschungsgemeinschaft (DFG, German Research Foundation), project number 255730231, within the International Research Training Group “Integrated engineering of continuous-discontinuous long fiber reinforced polymer structures” (GRK 2078).