
Abstract
In this study, zinc oxide nanoparticles (ZnO NPs) were successfully integrated into polystyrene (PS) matrices through solution casting and hot-pressing, producing a series of PS/ZnO nanocomposites. The structural and morphological properties of these nanocomposites were characterized using FTIR, XRD, and SEM techniques. FTIR analysis revealed characteristic bands associated with C-H and C = C vibrations in PS, with increased IR absorption observed in the ZnO-doped samples, particularly at 418 cm⁻1, indicative of Zn-O valence vibrations. X-ray diffraction (XRD) confirmed the hexagonal wurtzite structure of ZnO nanoparticles and showed a notable decrease in crystallite size from 3.88 nm to 1.58 nm, demonstrating the influence of ZnO concentration on the structural properties. SEM images illustrated that ZnO nanoparticles were uniformly dispersed within the polymer matrix, with the PS/5%ZnO nanocomposite exhibiting a smooth surface and well-integrated nanoparticles, suggesting effective dispersion and prevention of agglomeration. Optical properties were examined using UV-Visible and photoluminescence (PL) spectroscopy, which revealed improved optical characteristics in the nanocomposite films. PL spectra showed wide emission bands in the violet and blue regions, indicating transitions from excitonic levels and/or zinc interstitials (Zni) to the conduction band, alongside contributions from defects such as zinc interstitials (Zni) and natural zinc vacancies (Znv).
Keywords
Introduction
In recent decades, numerous research groups have concentrated on organic-inorganic nanocomposite materials.1–3 These composites display distinctive mechanical, optical, chemical, and physical properties compared to their parent polymers and nanofillers. Polymers serve as an ideal host matrix for nanocomposite materials due to their straightforward synthesis procedures, affordability, lightweight nature, and resistance to moisture and corrosion.4,5 Nanocomposites find diverse applications, including solar cells, UV-shielding materials, sensors, photocatalysis, hybrid OLEDs, and optoelectronics.6–9 Polystyrene (PS) stands out among other polymers due to its lightweight, cost-effectiveness, transparency, and optical stability. It boasts high biocompatibility and stability in chemical, electrical, and mechanical aspects. PS is a rigid, easily processable, recyclable, and reusable material.10,11 The structure of PS polymer comprises an aromatic ring and a connected aliphatic chain. These aromatic rings contain delocalized electrons, facilitating control over the polymer’s conductivity. Additionally, due to its superior optical characteristics, PS can serve as an excellent UV absorber.12–14 To enhance the characteristics of polystyrene (PS), nanoparticles such as SiO2, CNTs, NiO, TiO2, Fe2O3, CuO, Cu, and ZnO can be incorporated as fillers into the matrix. Consequently, polystyrene (PS) composites have garnered significant interest across industrial and academic fields, particularly when nanoparticles are integrated into the PS matrix, resulting in nanocomposites with versatile applications. These additions provide PS with new attributes like low density, thermal conductivity, processability, and electrical conductivity. Furthermore, the dispersion of nanoparticles within the matrix has negligible effects on the quality of PS nanocomposites.2,7 In this study, we utilized ZnO nanoparticles to enhance the properties of polystyrene (PS). ZnO is considered one of the prime alternatives for TiO2 as a semiconductor due to its similar band gap energy (3.37 eV) to TiO2 (3.2 eV).15–17 However, ZnO’s photocatalytic activity is limited to UV light irradiation, utilizing only 4%-5% of the solar spectrum. Modifications of ZnO with metals,16–18 nonmetals,15,19,20 or linking semiconductors.21,22 have been proposed to enhance its absorption of broad solar light, thereby reducing its band gap energy. Stoichiometric zinc oxide exhibits a wurtzite structure and behaves as an insulator. The structure contains significant voids capable of accommodating interstitial atoms, making the production of pure crystals challenging, which also tend to lose oxygen at high temperatures. 23 ZnO possesses inherent flaws, including oxygen deficiency and zinc excess, contributing to its n-type semiconductor characteristics. Typically, at room temperature, ZnO exhibits a UV emission peak due to the recombination of free excitons and possibly one or more peaks in the visible spectral range attributed to defect emissions.24–26 Investigating the photoluminescence (PL) properties of ZnO is therefore intriguing, as it can offer significant insights into the quality and purity of the materials. Moreover, owing to the high surface-to-volume ratio of ZnO, it facilitates enhanced interfacial coordination between polymers and nanoparticles, resulting in improved optical characteristics and crystallization degree.15,27 The unique properties of ZnO nanoparticles make them attractive for technological optoelectronic applications when incorporated into polymer matrices. The interaction between ZnO and the polymer can also lead to several new radiative recombination mechanisms, potentially enabling broadband light emission or wavelength-tunable emission. Since these mechanisms are influenced by various parameters, including the individual features and relative concentrations of both organic and inorganic components, emission properties can be adjusted in multiple ways. In this study, ZnO/PS nanocomposites were synthesized by embedding varying weight percentages of ZnO in polystyrene membranes using the solution cast method and hot-pressing. The optical-structural properties of these nanocomposites were investigated based on the concentration of zinc oxide nanoparticles in the polymer matrix. The influence of nanoparticle content on the mechanism of UV and PL emissions from PS/ZnO nanocomposite thin films is explored.
Materials and methods
Materials
All chemicals were utilized as received without undergoing purification. Polystyrene (PS) with CAS code 9002-86-2 exhibits a density of 1.04 g/cm3, a melting temperature range of 150 °C–220 °C, a spark temperature of 625°C, an ignition temperature of 500°C, and an auto-ignition temperature exceeding 1100°C. Tetrahydrofuran (THF) with PLC 143,537 was also used as received. Zinc oxide nanoparticles with a particle size ranging from 10 to 30 nm were purchased from Sky Spring Nanomaterials, Inc.
Synthesis of polymer nanocomposites
Polymer nanocomposite materials were prepared as follows: Polystyrene was dissolved in its organic solvent, tetrahydrofuran (THF). The precise weight of zinc oxide nanoparticles with varying volume contents (1%, 5%, 10%) was then added to the solution under vigorous stirring for 2 h to ensure the complete dispersion of ZnO nanoparticles in the PS–THF solution. The resulting mixture was transferred to a Petri dish and air-dried throughout the day. To remove the solvent completely from the polymeric matrix, the nanocomposites were subsequently dried in a vacuum oven at room temperature for an hour. Thin films of nanocomposites were then obtained from these samples using the hot pressing method at a melting temperature of PS (180°C) and a pressure of 10 MPa. Cooling of the films after hot pressing was achieved by immersion in water.
Instrumentation
The morphology of the surface of the nanocomposites was examined by scanning electron microscope (SEM; JEOL JSM-6610 LV), to study the dispersion and size of nanoscale zinc oxide powder in the polymer. Scanning was conducted at an accelerating voltage of 30 kV.
X-ray diffraction analysis was conducted using a Rigaku Mini Flex 600 XRD diffractometer at ambient temperature. For all experiments, Cu Kα radiation operating at 15 mA and 30 kV was employed. The samples were scanned within the 10°–90° range of the Bragg angle 2θ.
FTIR analysis of the samples was performed using IR Affinity- 1 FTIR spectroscopy by Shimadzu (Japan). Transmittance spectra was recorded in the wavenumber range 400 cm−1 - 4000 cm−1.
The absorption spectra of the prepared films were recorded using a B Specord 250 Plus UV-vis spectrophotometer, enabling research within the wavelength range of 250 nm–600 nm.
Photoluminescent properties of the nanocomposite films were examined utilizing a spectrofluorimeter Varian Cary Eclipse, covering a wavelength range of 200 nm – 900 nm.
Results and discussions
Scanning electron microscopy (SEM)
The dispersion of zinc oxide nanoparticles (ZnO NPs) within the polystyrene (PS) matrix was evaluated using scanning electron microscopy (SEM). The SEM images reveal distinct differences in the morphology of pure ZnO powder, pure PS films, and PS/ZnO nanocomposites.
The SEM micrographs of pure ZnO powder (Figure 1(a)) show that the nanoparticles exhibit a range of sizes and quasi-striped spherical shapes, with some degree of agglomeration. The ZnO particles appear spherical, irregular, and spongy, reflecting their tendency to cluster into zones of different sizes. In contrast, the SEM images of pure PS (Figure 1(b)) display a uniform and homogeneous surface morphology, indicative of the smooth and consistent structure of the polymer matrix. SEM micrographs and element mapping of: (a) ZnO nanoparticles and (b) PS polymer.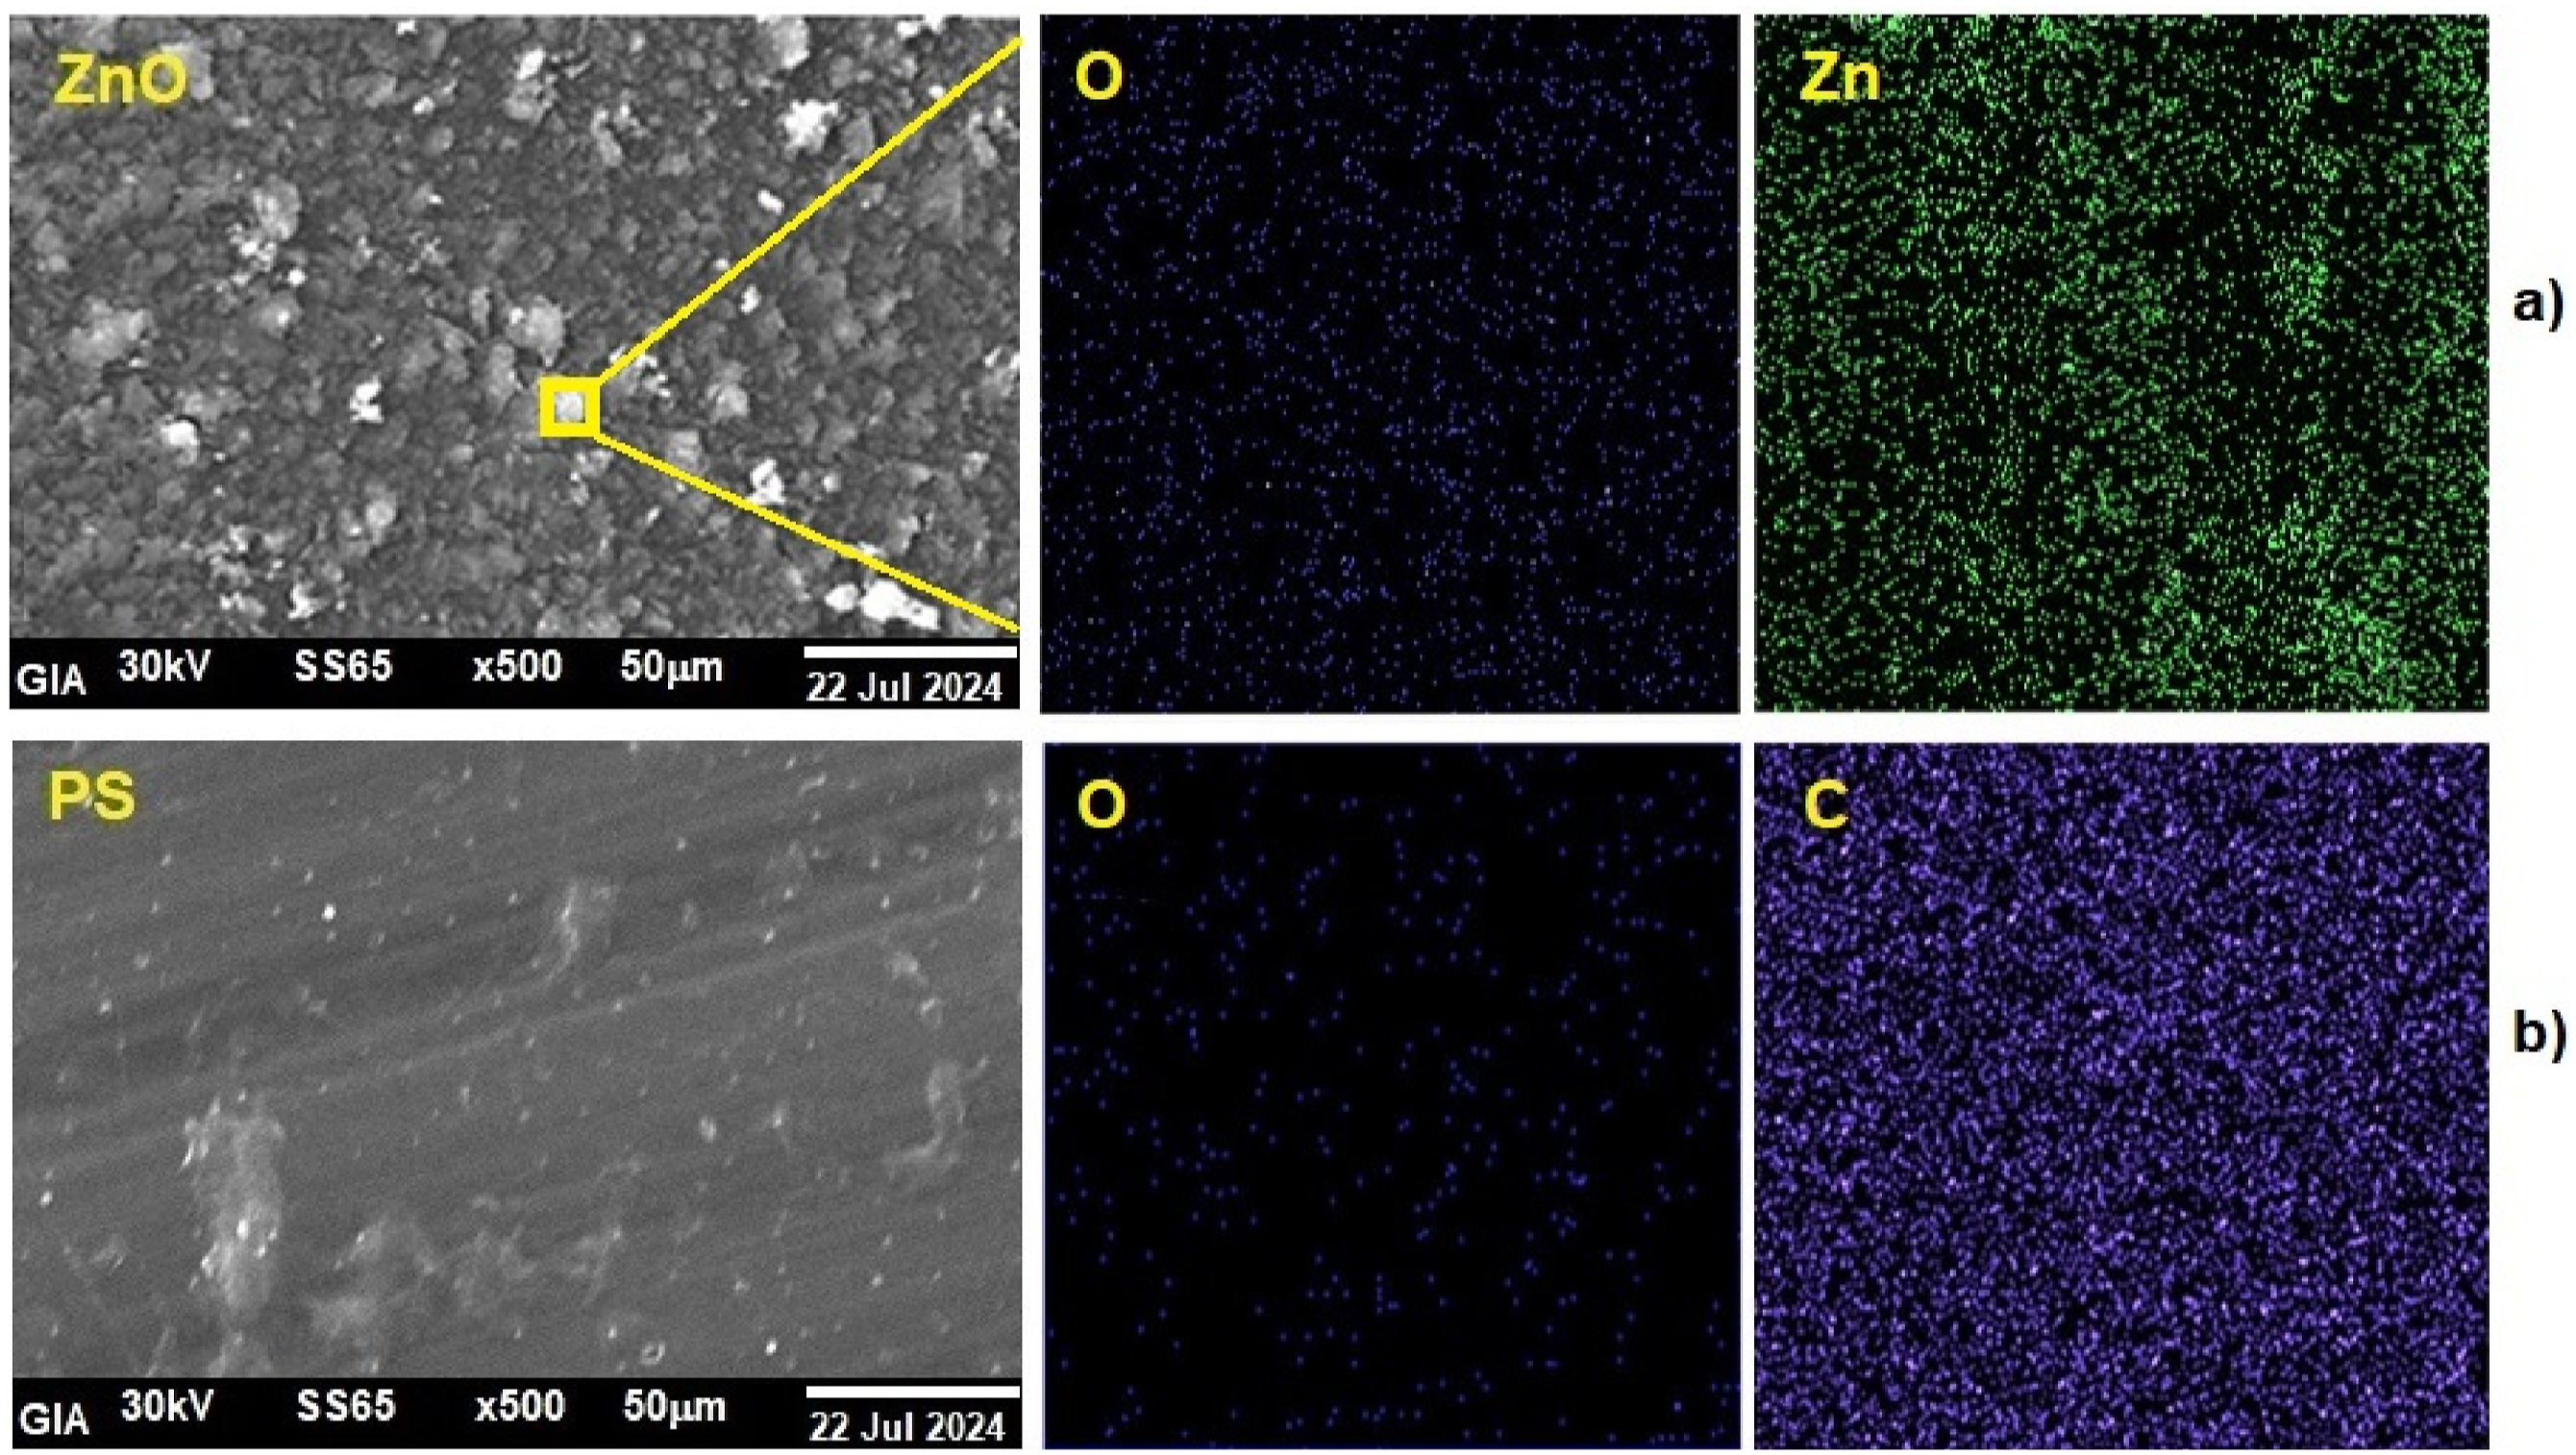
When examining the PS/5%ZnO nanocomposite, the SEM images illustrate that the ZnO nanoparticles are well-integrated into the PS matrix (Figure 2). The nanoparticles appear to be evenly distributed, with no significant aggregation observed, suggesting effective dispersion within the polymer. This observation aligns with the XRD analysis, which confirmed the successful incorporation of ZnO without causing excessive aggregation. Additionally, the pores within the PS/5%ZnO nanocomposite are uniformly distributed and feature smooth surface characteristics, which further supports the even distribution of ZnO nanoparticles throughout the polymer matrix (Figure 2). SEM micrographs and element mapping of 5 wt%ZnO-doped PS nanocomposites.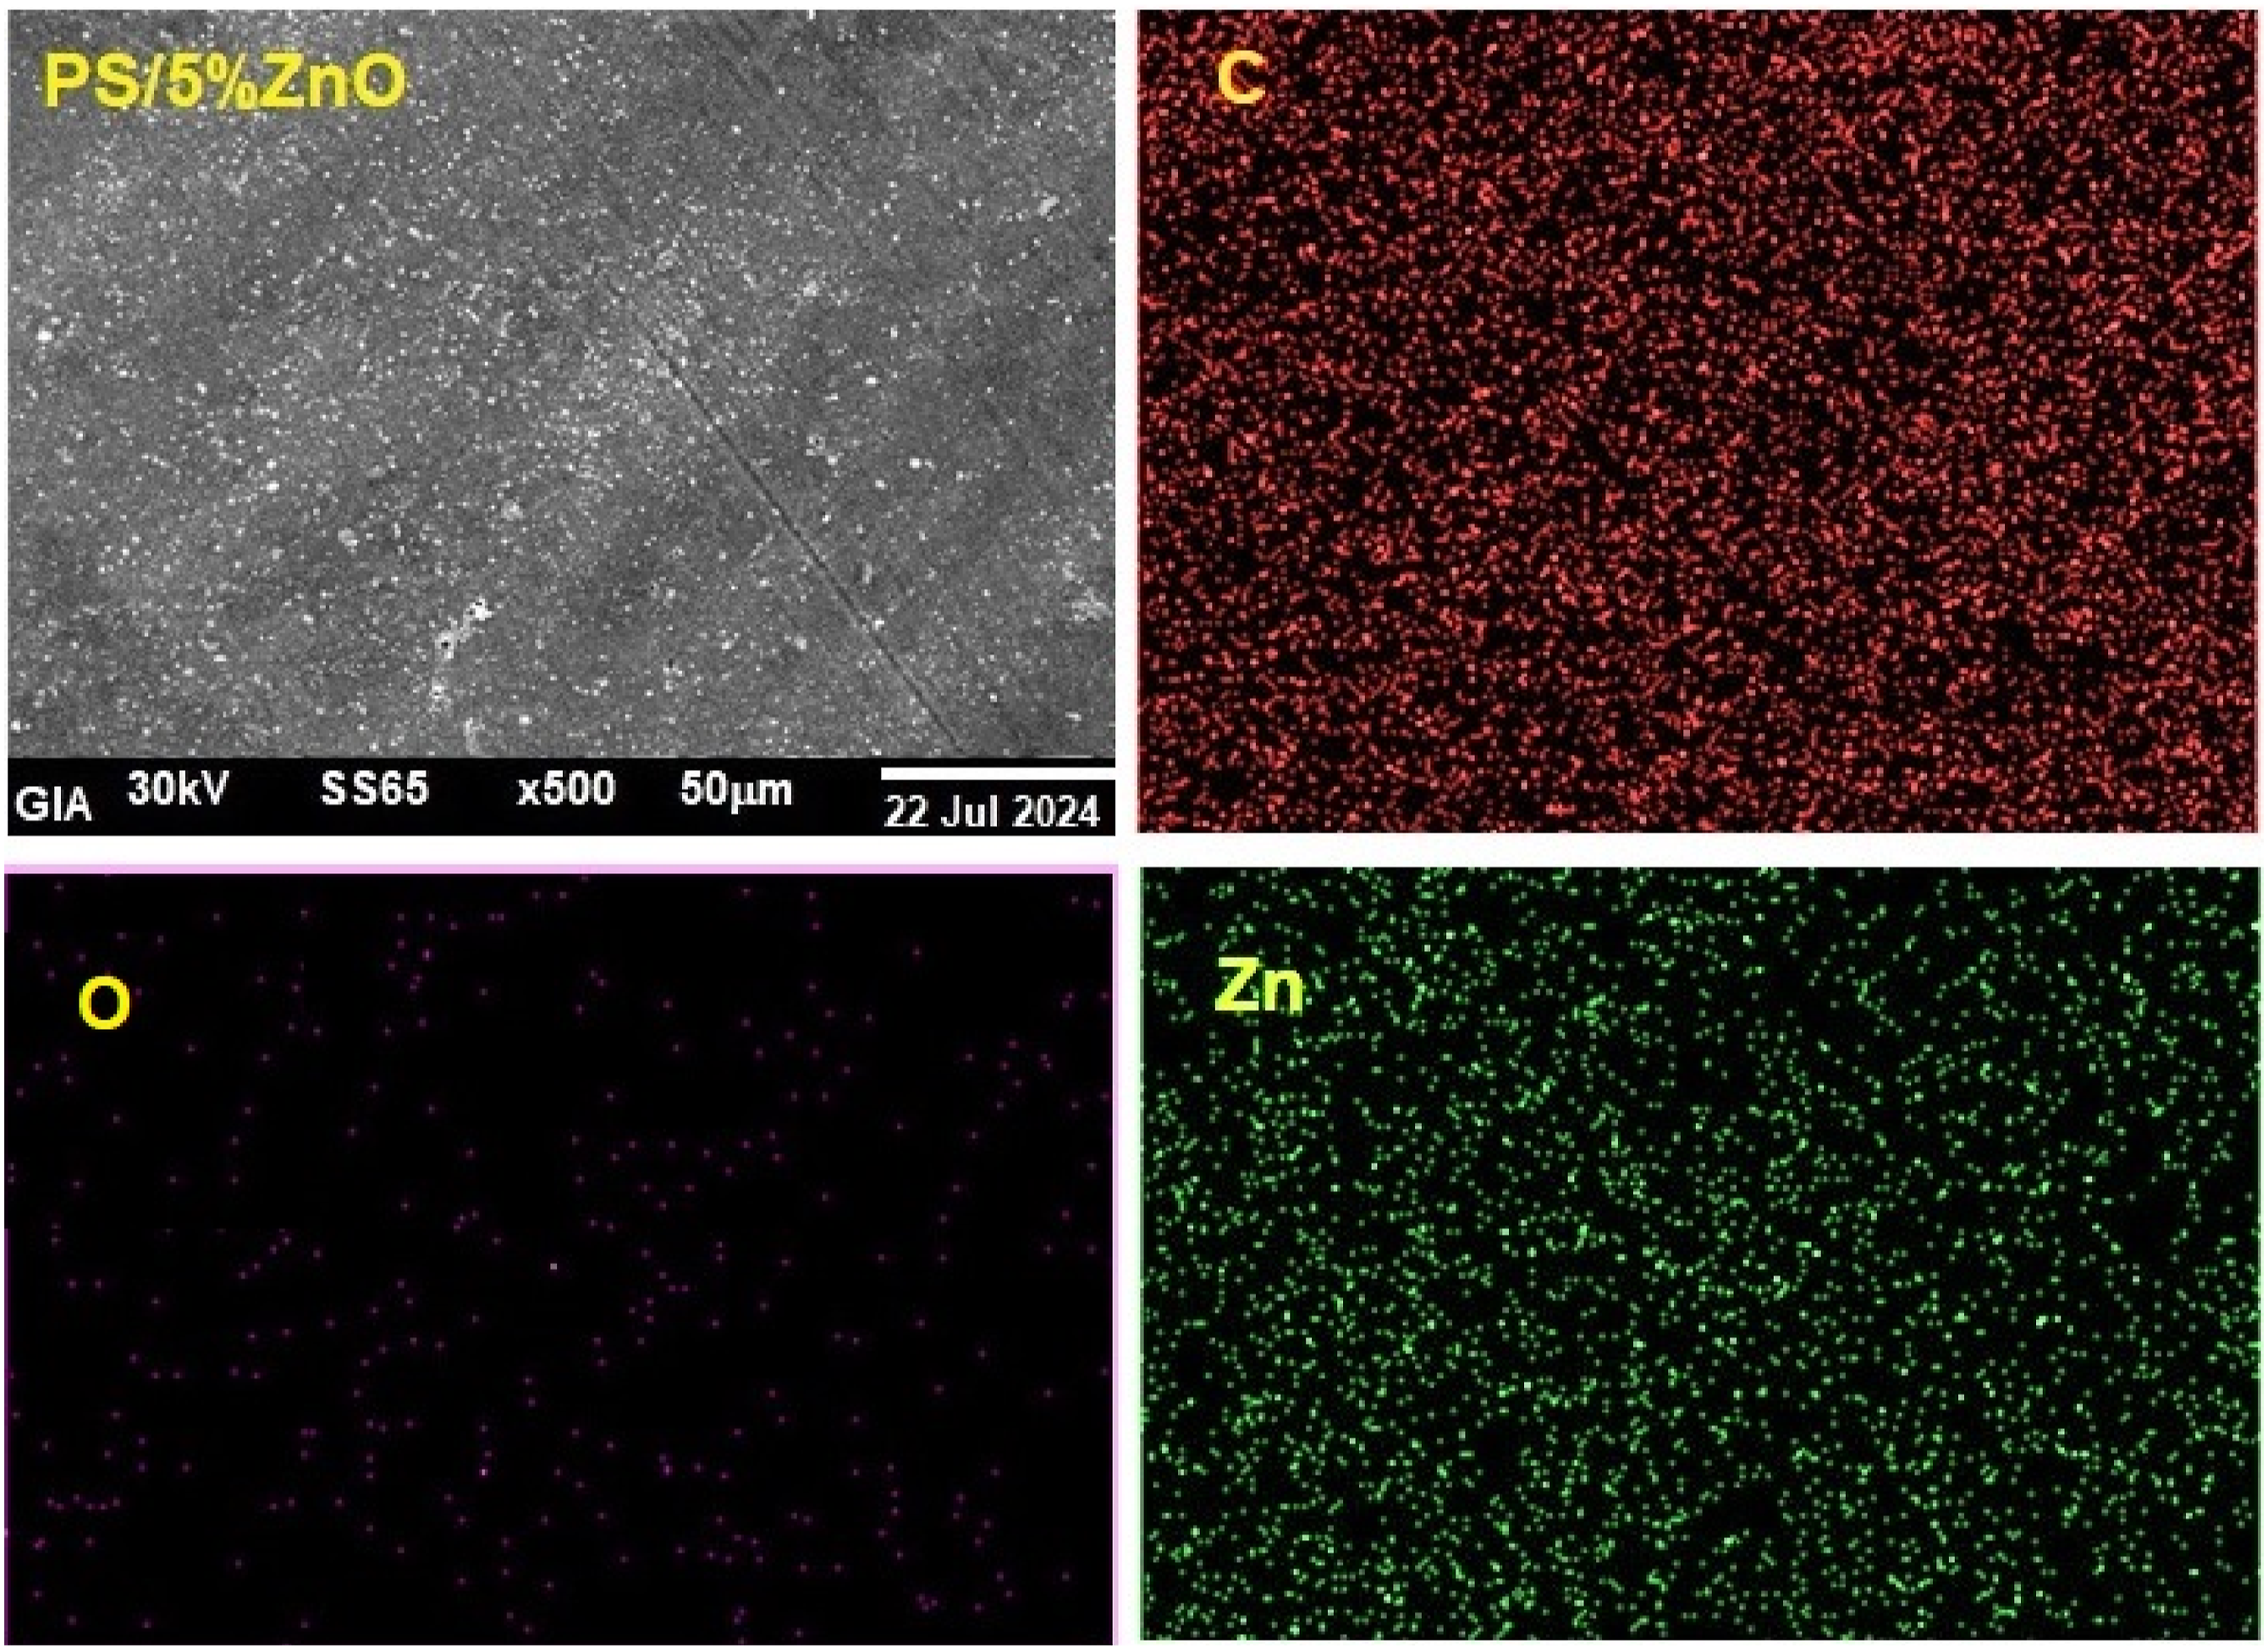
Energy dispersive spectroscopy (EDS) mapping was performed to further elucidate the composition and distribution of elements within the samples, as shown in Figure 3. The EDS spectra confirm the presence of zinc (Zn), oxygen (O), and carbon (C), indicating the successful formation of ZnO nanoparticles and their integration into the PS matrix. Specifically, the EDS analysis of pure PS, ZnO nanoparticles, and the PS/5%ZnO nanocomposite (Figure 3(a)–(c), respectively) shows strong signals for zinc and oxygen in the ZnO nanoparticles, validating their significant presence. The distinct peaks for Zn and O in the EDX spectrum at their respective energies confirm the formation of ZnO and its incorporation into the PS matrix. Scanning electron microscopy–energy dispersive spectrum (SEM-EDS) of: (a) PS; (b) ZnO and (c) PS/5%ZnO nanocomposites.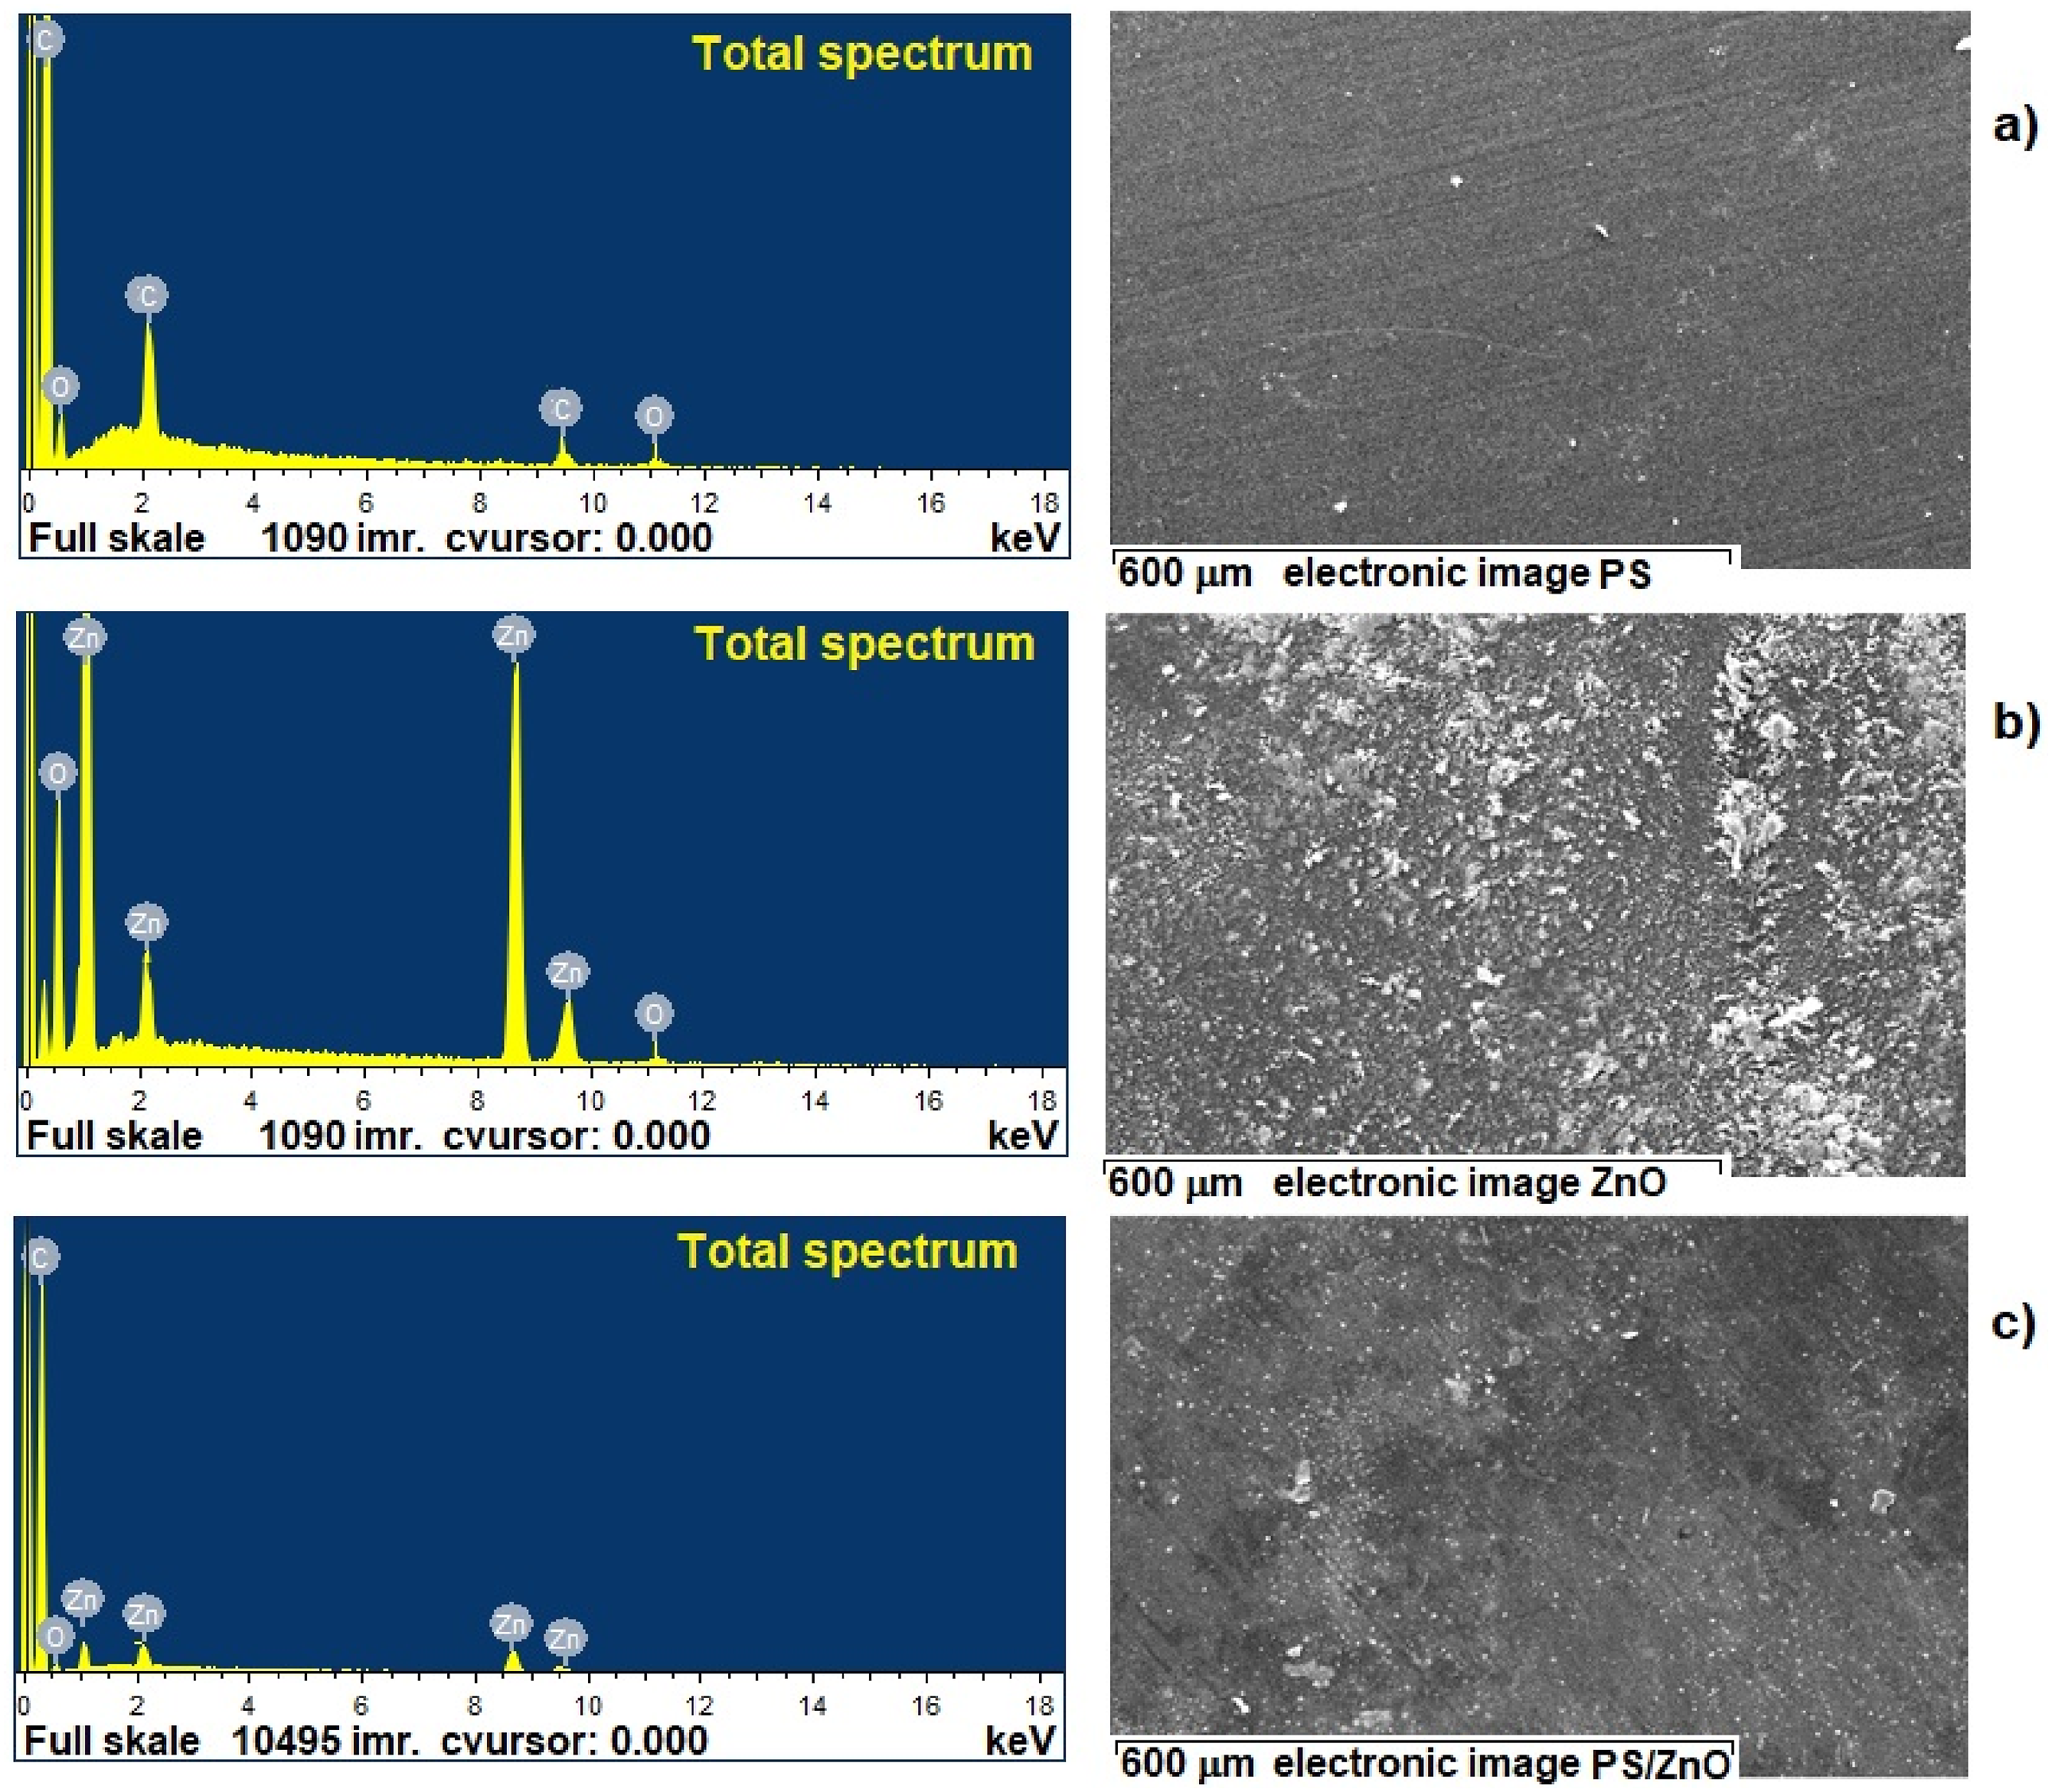
In summary, the SEM and EDS analyses collectively demonstrate that ZnO nanoparticles are effectively dispersed within the PS matrix, with a homogeneous distribution observed in the nanocomposite films. The results underscore the successful integration of ZnO into the polystyrene matrix and confirm the purity and proper formation of the nanocomposites.
X-ray diffraction technique
X-ray diffraction (XRD) is a valuable technique for studying the structure of polymeric materials, providing insights into parameters such as crystallite size, degree of crystallinity, dislocation density, and microstrain. In this study, XRD analysis was conducted to investigate the influence of ZnO nanoparticles on the structure of the PS polymer matrix. Figure 4 presents the diffraction pattern of pristine PS and PS/ZnO nanocomposites. The spectrum exhibits a broad peak around 2θ value of 20°, indicating the amorphous nature of the PS film.12,28 XRD spectra of: (a) Pure PS and (b) PS/1%ZnO (c) PS/5%ZnO (d) PS/10%ZnO nanocomposites.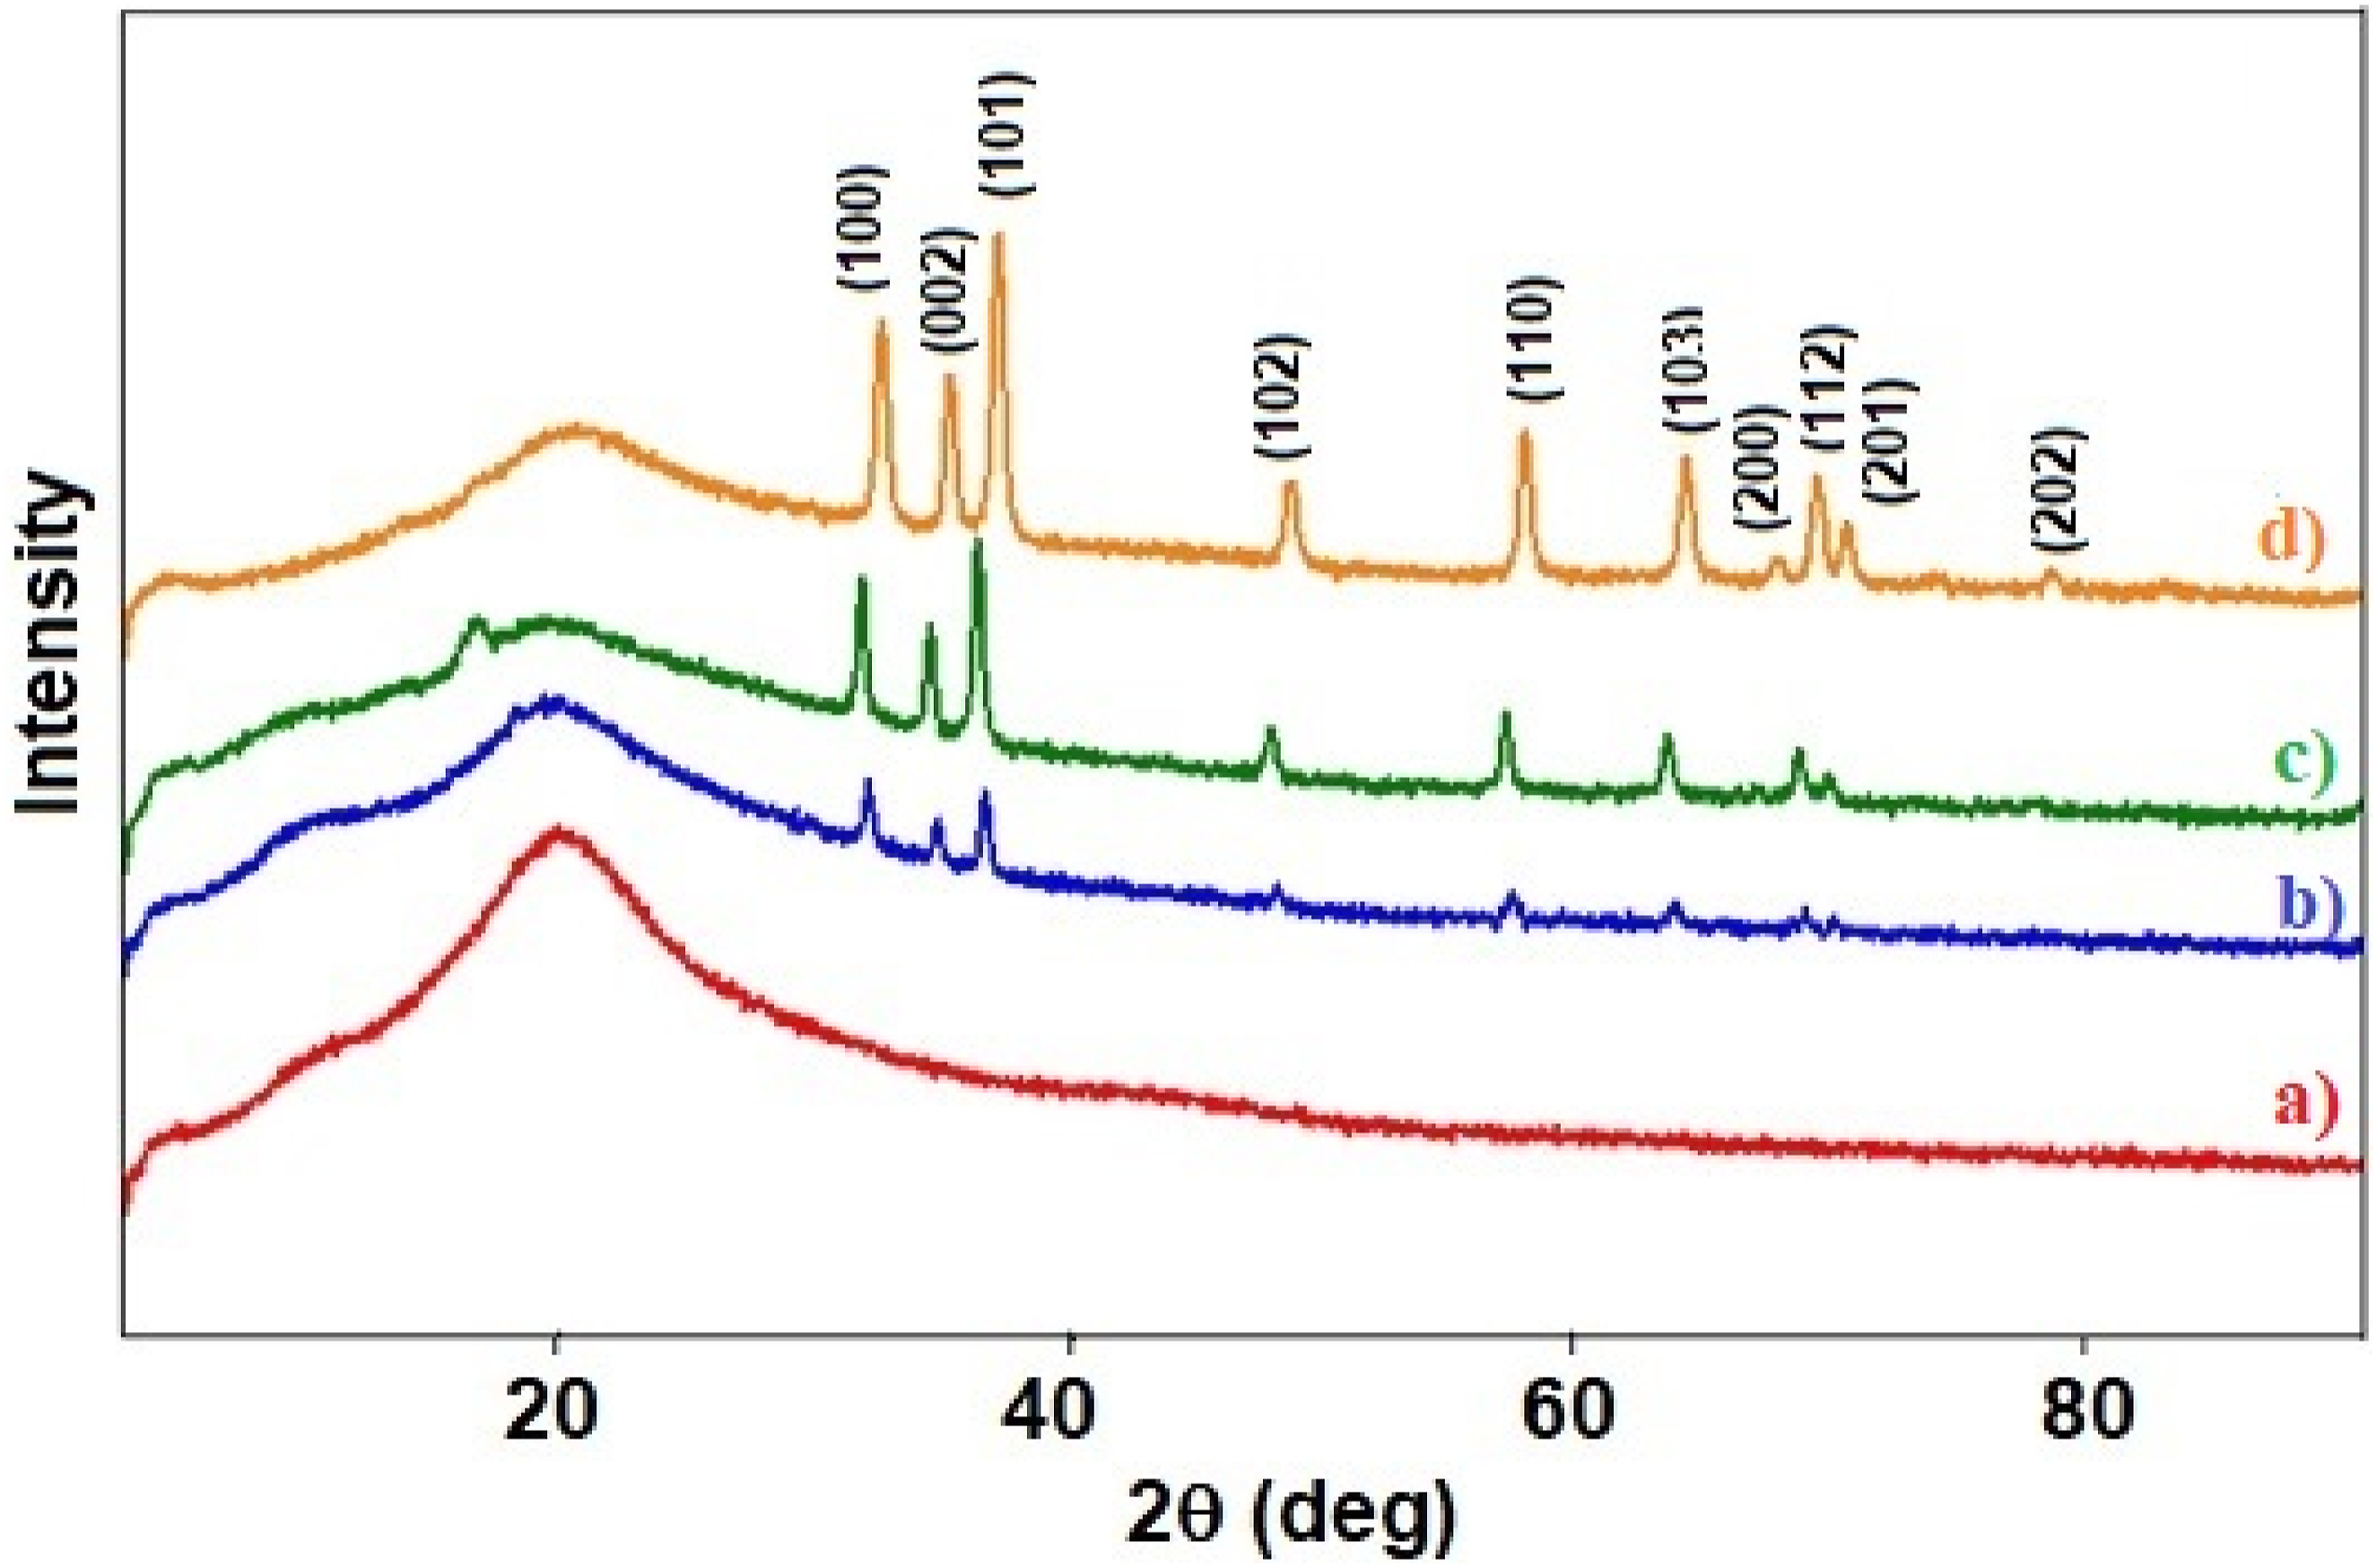
A broad suppressed peak at 20° is observed for pristine PS (Figure 4(a)), which diminishes as ZnO is introduced into the PS matrix. With increasing ZnO content from 1 wt% to 10 wt%, new sharp and intense peaks emerge at 31.71°, 34.53°, 36.26°, 48°, 56.67°, 62.85°, 66°, and 68.07°, as depicted in the spectra of the nanocomposite films. These peaks correspond to the presence of ZnO within the PS polymer matrix, aligned with the Miller indices (100), (002), (101), (102), (110), (103), (200), (112), and (201), respectively. They become more prominent with increasing ZnO wt% (Figure 4(d)). Comparison of these peaks with the XRD peaks of ZnO nanopowder and JCPDS (No. 36-1451) file confirms the presence of ZnO.
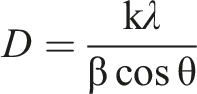
The average crystallite size (D) for the nanocomposites was estimated using Scherrer’s formula:
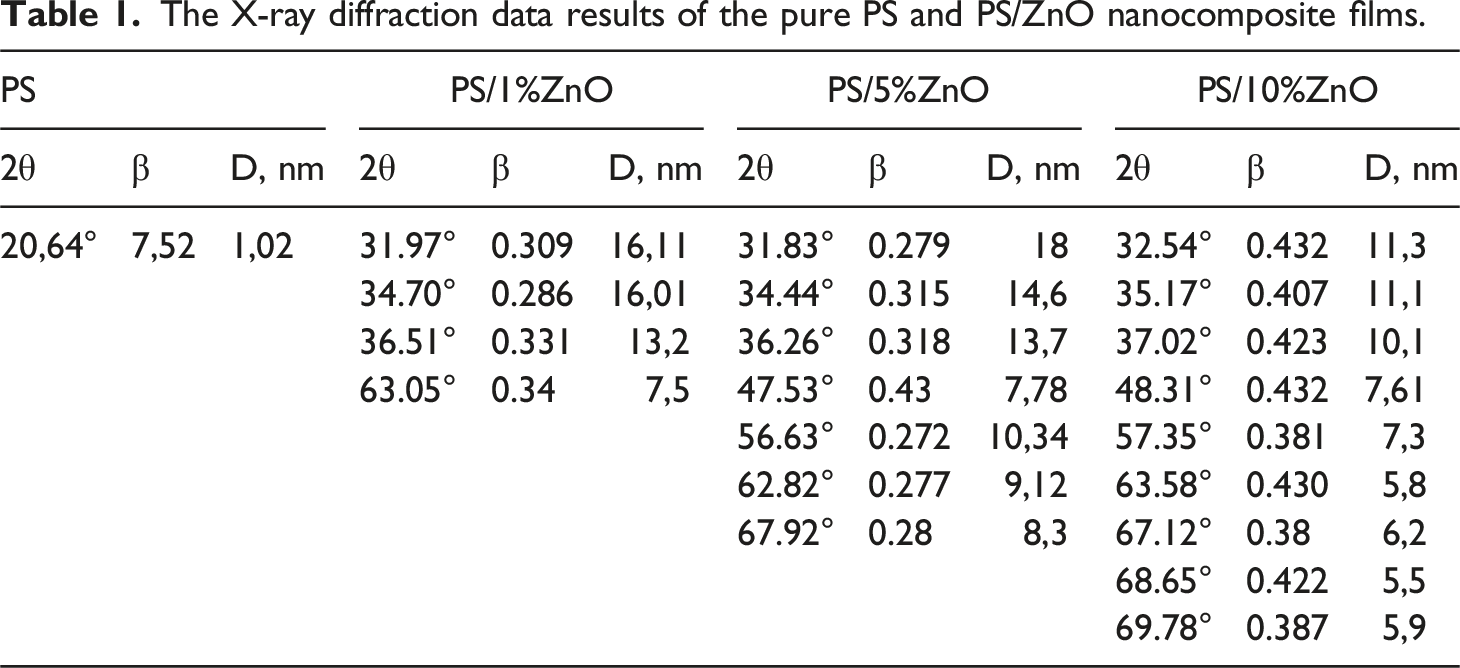
The X-ray diffraction data results of the pure PS and PS/ZnO nanocomposite films.
FT-IR spectroscopy
FT-IR spectroscopy was employed to analyze the chemical composition and interactions within the PS and PS/ZnO nanocomposites, spanning a wavenumber range of 400-4000 cm⁻1. The FT-IR spectra of both pure PS and PS/ZnO nanocomposite films reveal several distinctive features that elucidate the structural characteristics of these materials (Figure 5). FTIR spectrum of: (a) PS and (b) PS/1%ZnO; (c) PS/5%ZnO; (d) PS/10%ZnO nanocomposites.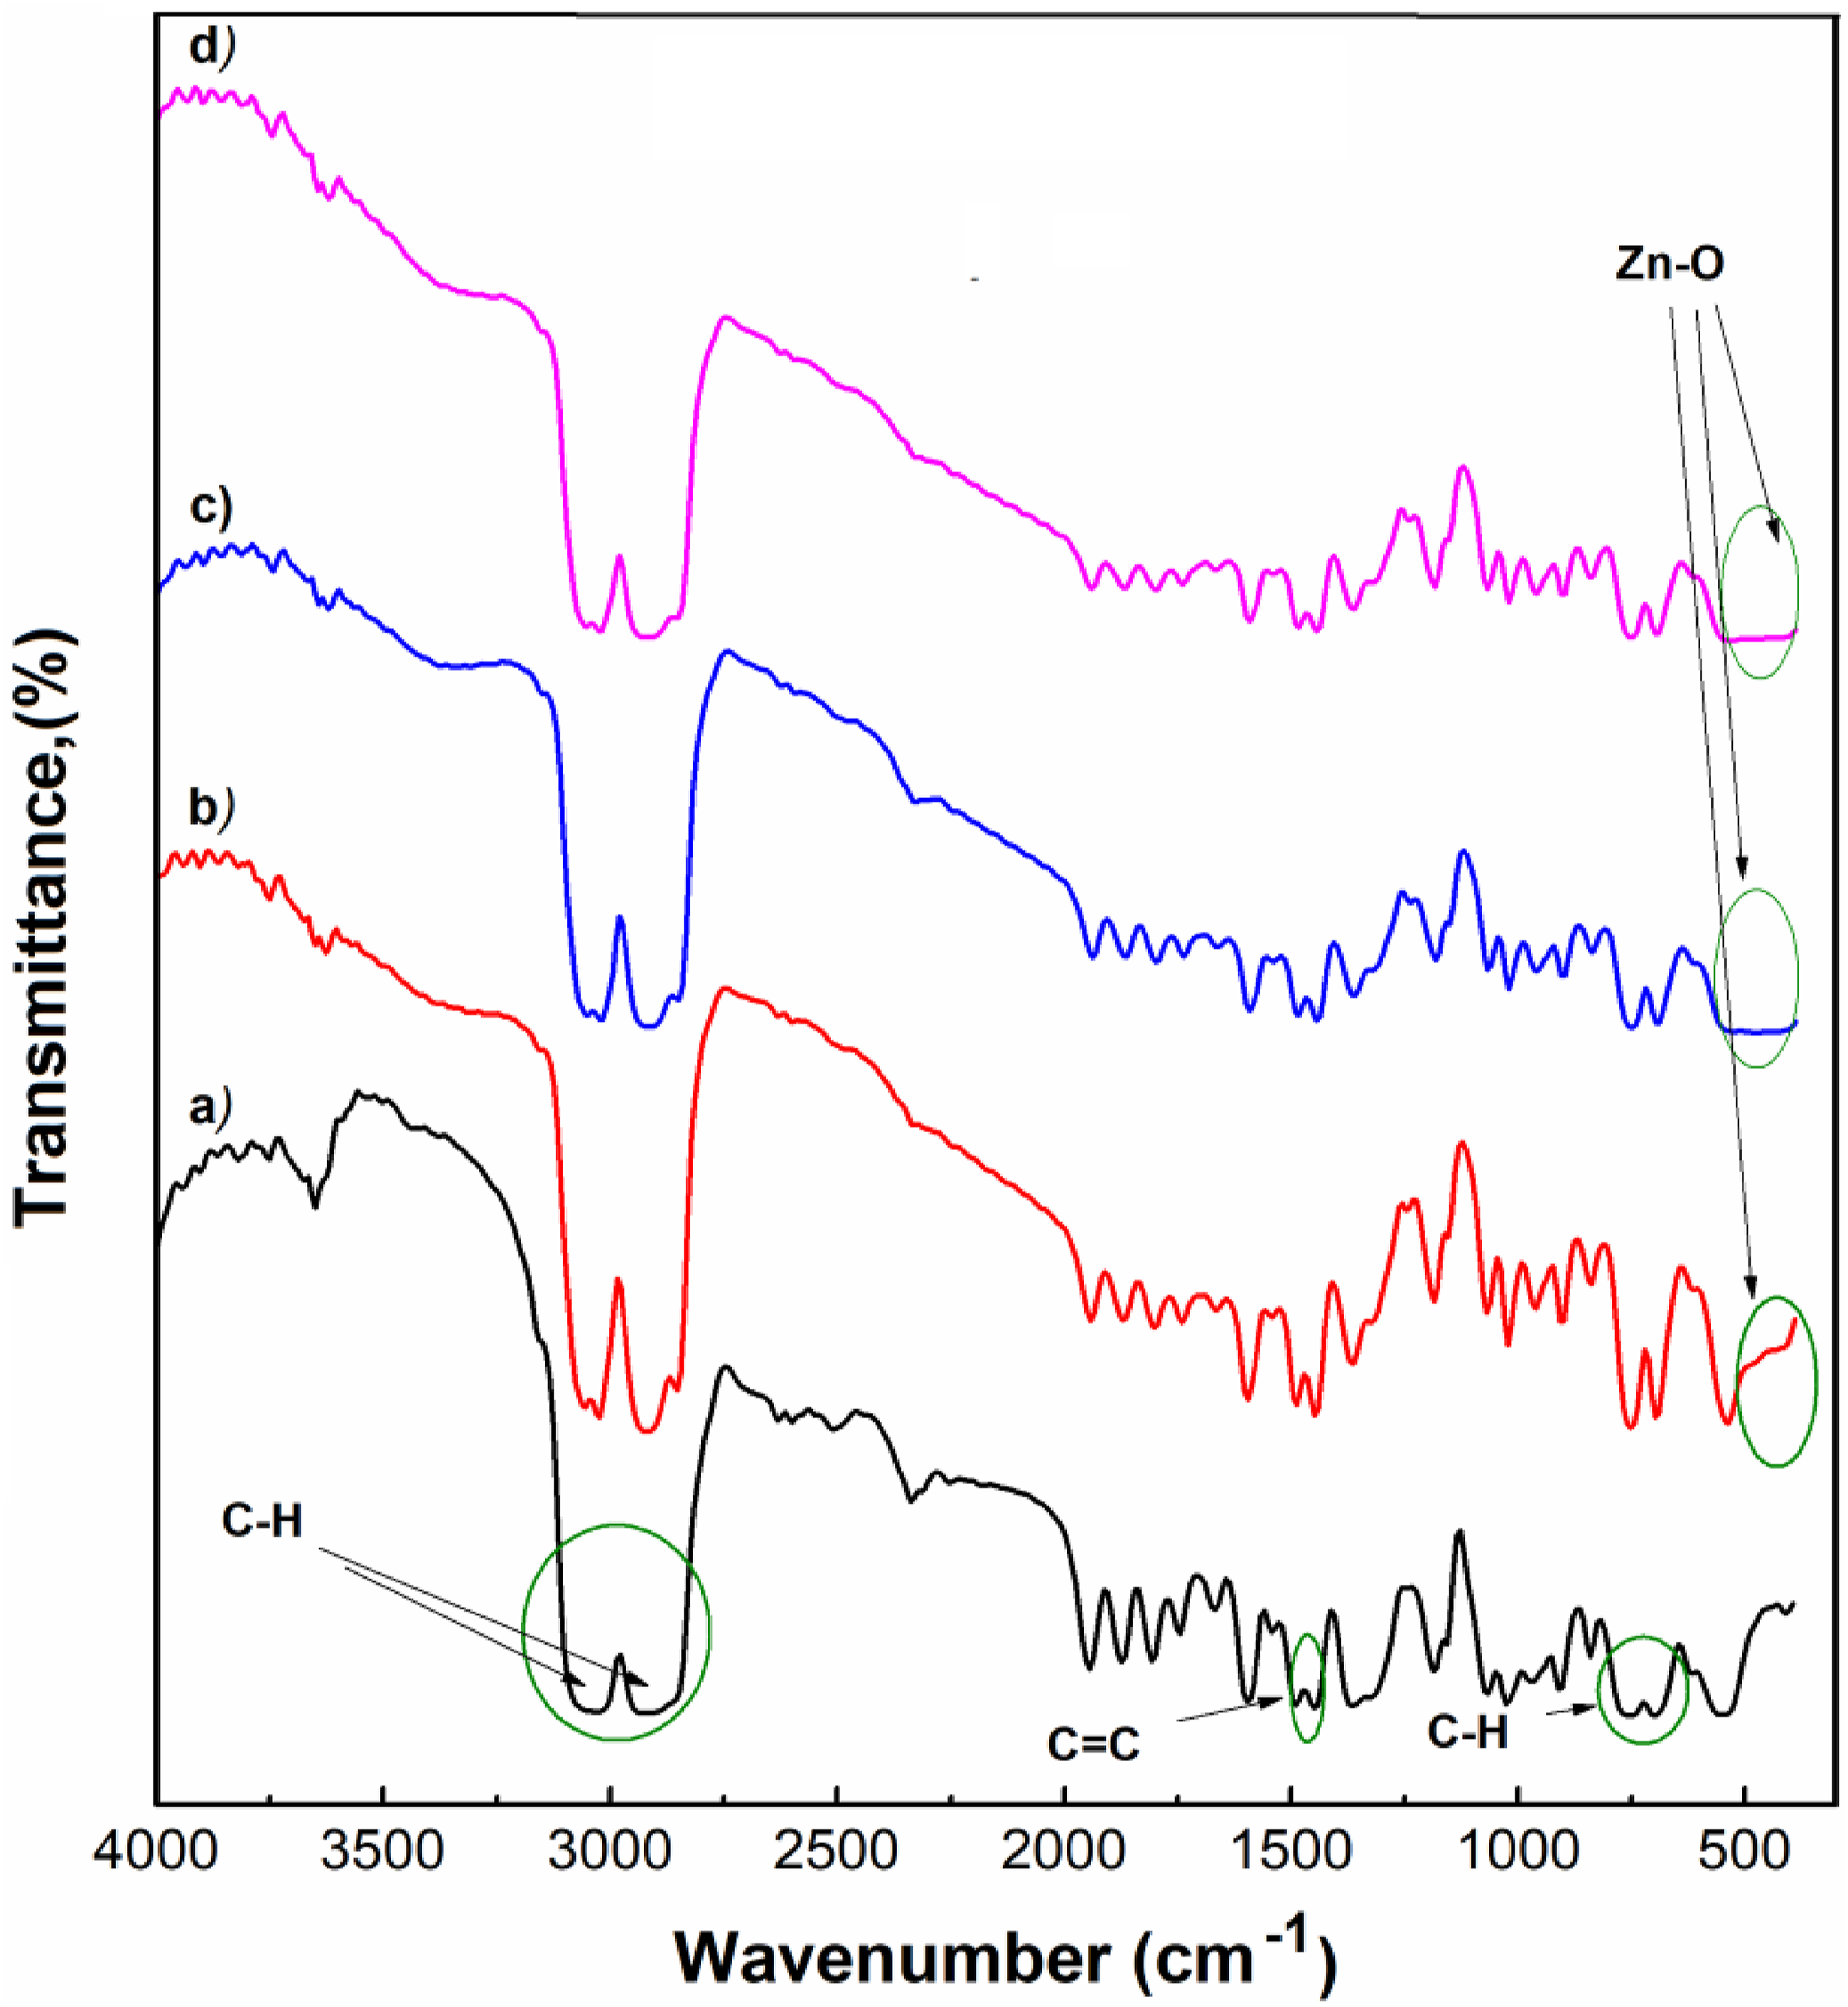
The spectra show prominent bands associated with various vibrations in polystyrene. Notably, bands between 3099 cm⁻1 and 3024 cm⁻1 are attributed to C-H stretching vibrations within the benzene rings of the polystyrene chains. These bands indicate the presence of aromatic C-H bonds, which are characteristic of the polystyrene polymer matrix.
Further, the bands observed at 2921 cm⁻1 and 2850 cm⁻1 correspond to asymmetric and symmetric C-H stretching vibrations in the aliphatic main chain of PS. These peaks confirm the typical aliphatic C-H bond vibrations in polystyrene, reflecting the polymer’s backbone structure.
In addition to these, the FTIR spectra display bands at 1595 cm⁻1, 1494 cm⁻1 and 1449 cm⁻1, which are attributed to C = C stretching vibrations in the aromatic ring of the polystyrene. These bands indicate the presence of conjugated double bonds within the polymer, reinforcing the structure of the polystyrene matrix.
The analysis also reveals bands between 1027 cm⁻1 and 907 cm⁻1 that are associated with -CH = CH- cis/trans out-of-phase bending vibrations of the PS. 33 This feature provides further confirmation of the polystyrene’s structural integrity and its characteristic vibrational modes.
Another interesting observation is the presence of peaks at 1365 cm⁻1 and 1595 cm⁻1, which can be explained as symmetric and asymmetric O-C-O stretching vibrations. These peaks might be due to the interaction of IR radiation with any carbonyl or ester groups, suggesting some influence of these groups on the IR spectrum. 34 A significant finding in the spectra is the band observed at 418 cm⁻1, which corresponds to Zn-O valence vibrations. 35 This peak is particularly noteworthy because it becomes more pronounced in the FTIR spectra of the ZnO-doped samples. The increased absorption in this region for samples containing 5% and 10% ZnO suggests effective incorporation of ZnO nanoparticles into the polystyrene matrix. This enhanced absorption indicates that the ZnO nanoparticles introduce additional IR-active modes that are absent in pure polystyrene, thus confirming the successful integration of ZnO within the polymer.
Overall, the FTIR analysis reveals the characteristic vibrational modes of polystyrene and highlights the impact of ZnO incorporation. The presence of Zn-O vibrations in the nanocomposite spectra signifies the successful interaction and dispersion of ZnO nanoparticles in the polystyrene matrix, providing valuable insights into the chemical interactions and structural modifications induced by the ZnO addition.
UV–VIS spectroscopy
The effect of zinc oxide nanoparticles on optical absorbance of PS was studied through UV-vis spectra. UV–Visible spectra of nanocomposite films was recorded in the wavelength range of 250 nm–600 nm. Figure 6 illustrates the absorption spectra of pristine PS and PS/ZnO nanocomposite films. UV-Visible spectra of: (a) PS; (b) 1%ZnO/PS; (c) 5%ZnO/PS; (d) 10%ZnO/PS nanocomposites.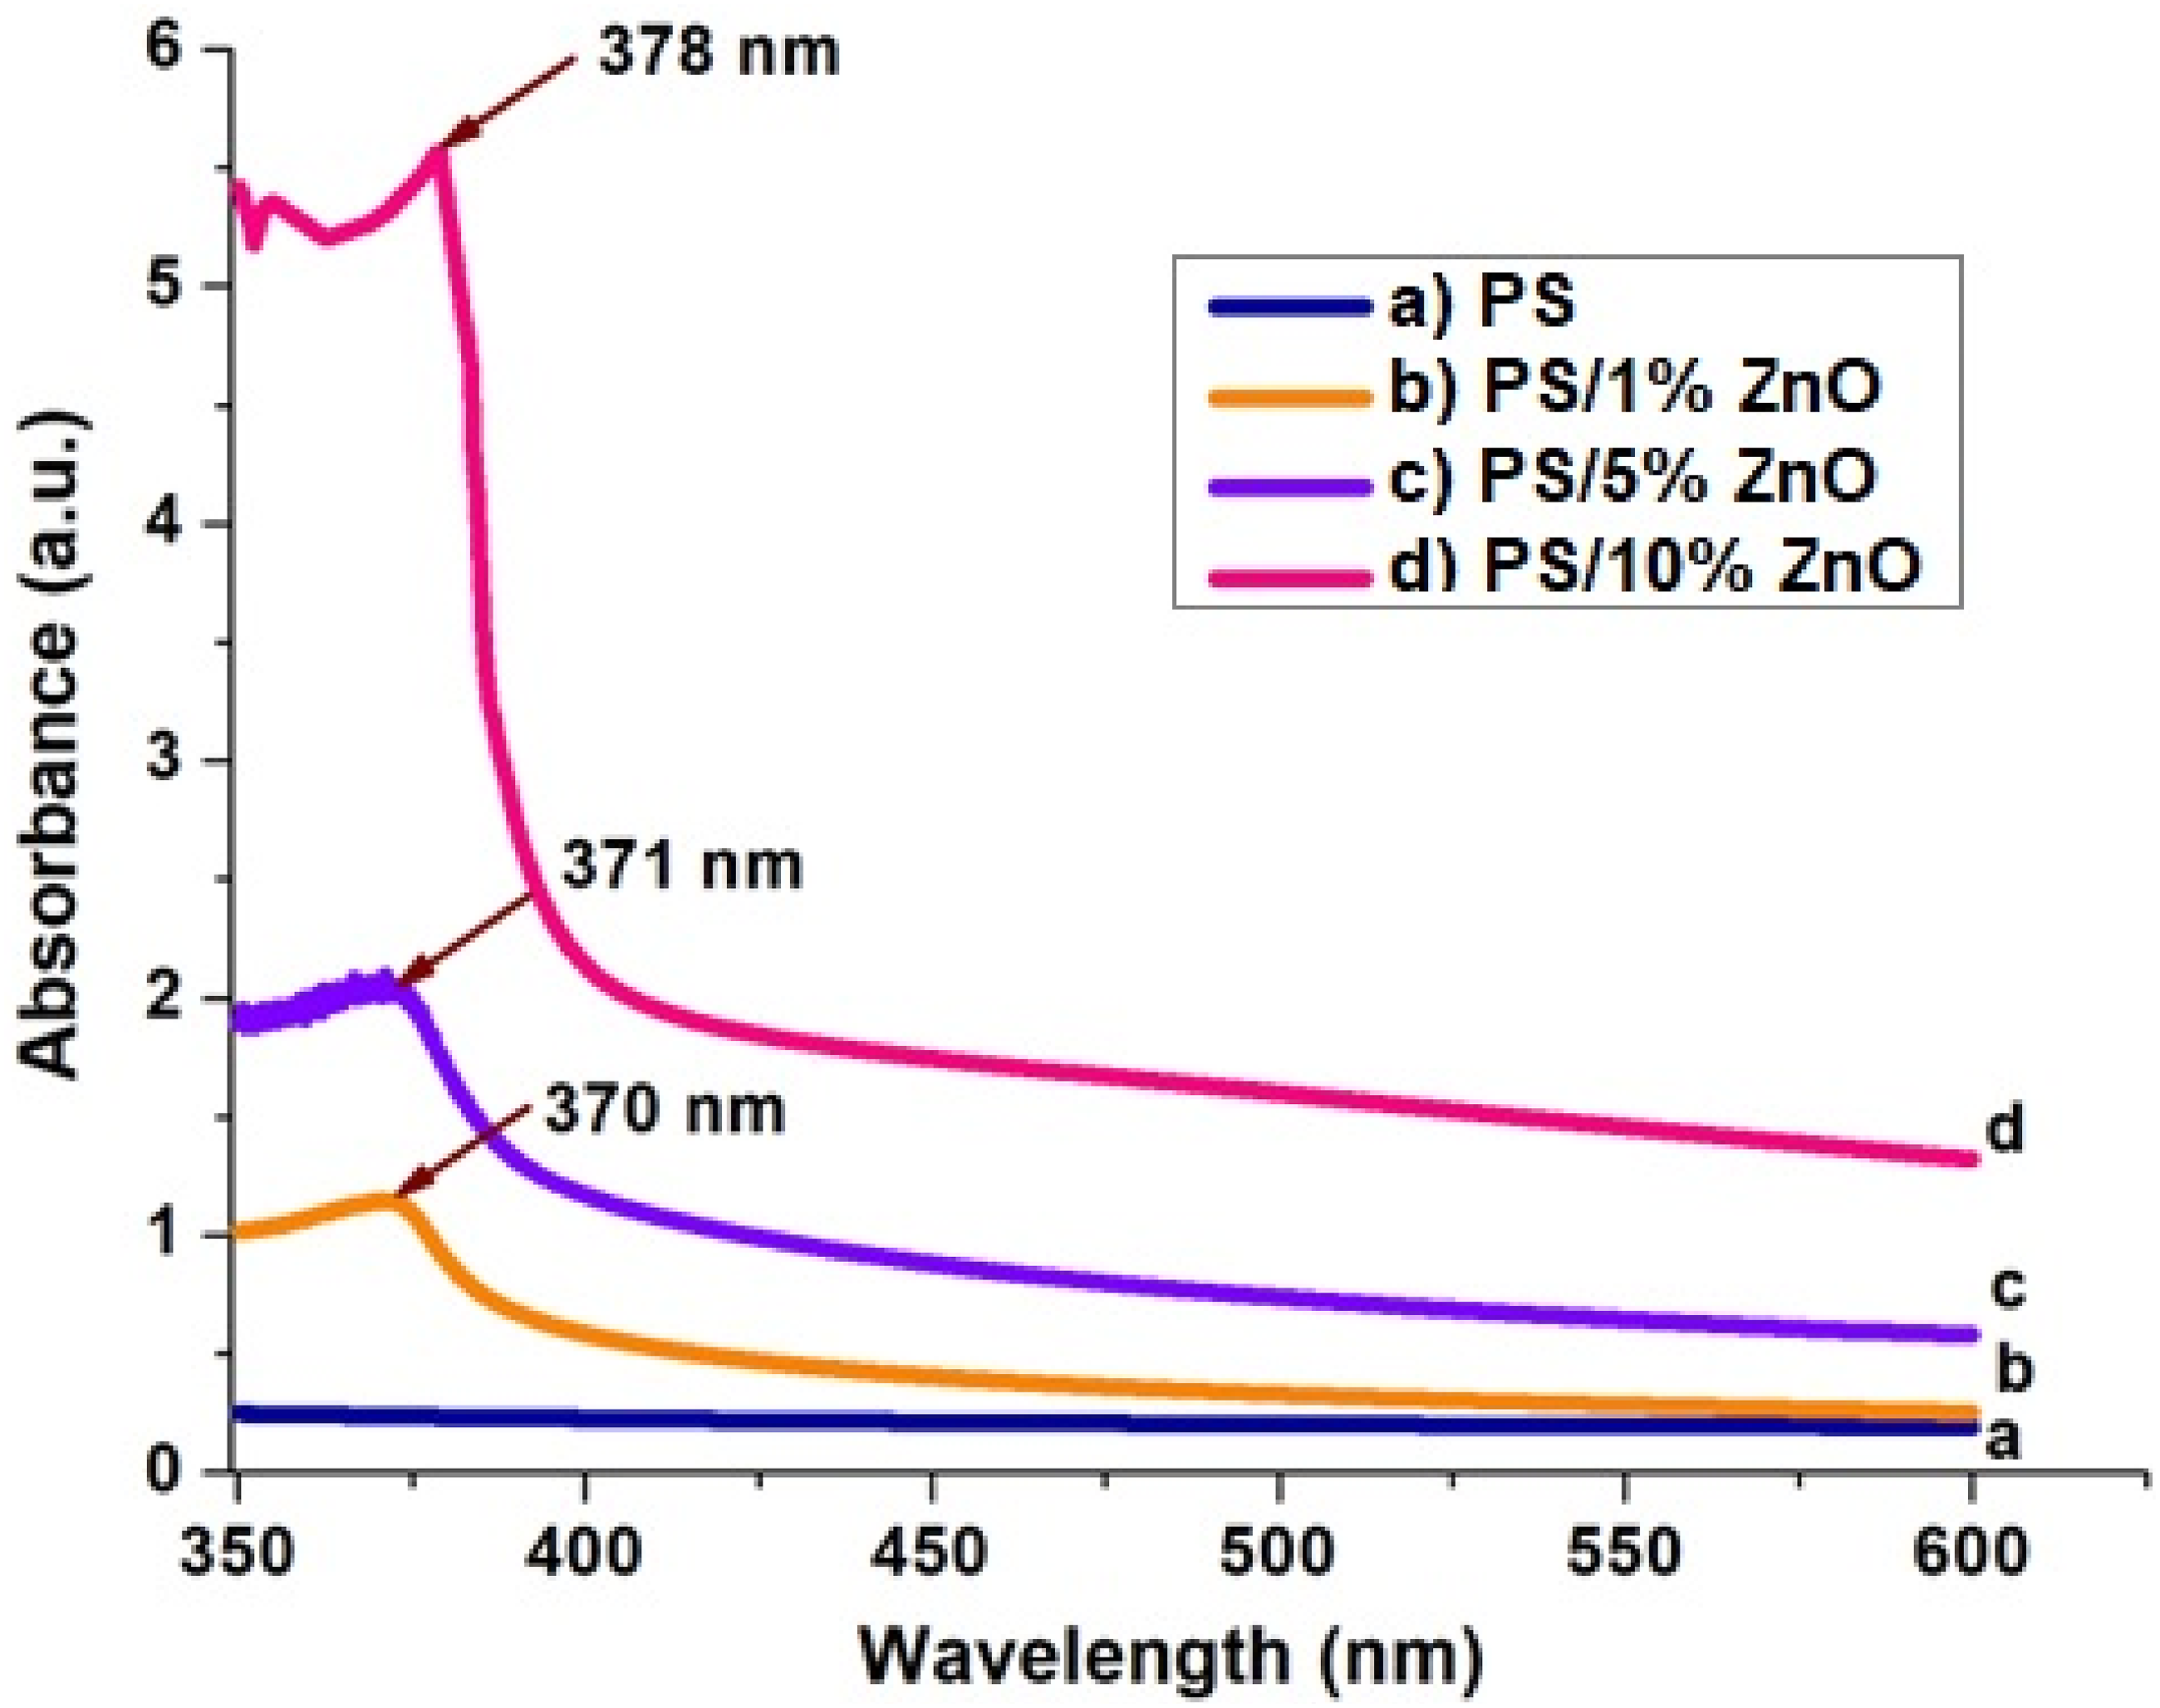
The presence of ZnO induces an absorption band at 370 nm, consistent with findings from previous studies.24,25 As the filler content increased, this peak expanded and moved to a longer wavelength (red-shifted) (Figure 6). This change clearly shows that nanoparticles agglomerate as their content increases. The spectra reveal that the absorbance of the polymer increases with rising concentrations of ZnO nanoparticles, likely attributed to the increased number of charge carriers within the nanocomposite. 26
The absorption coefficient (αhν)2 versus the wavelength (nm) for PS/ZnO nanocomposites is shown in Figure 7. Tauc’s plot between Energy (hν) and (αhν)2 of: (a) Pure PS; (b) PS/1%ZnO (c) PS/5%ZnO (d) PS/10%ZnO nanocomposite films for estimating optical energy band gap.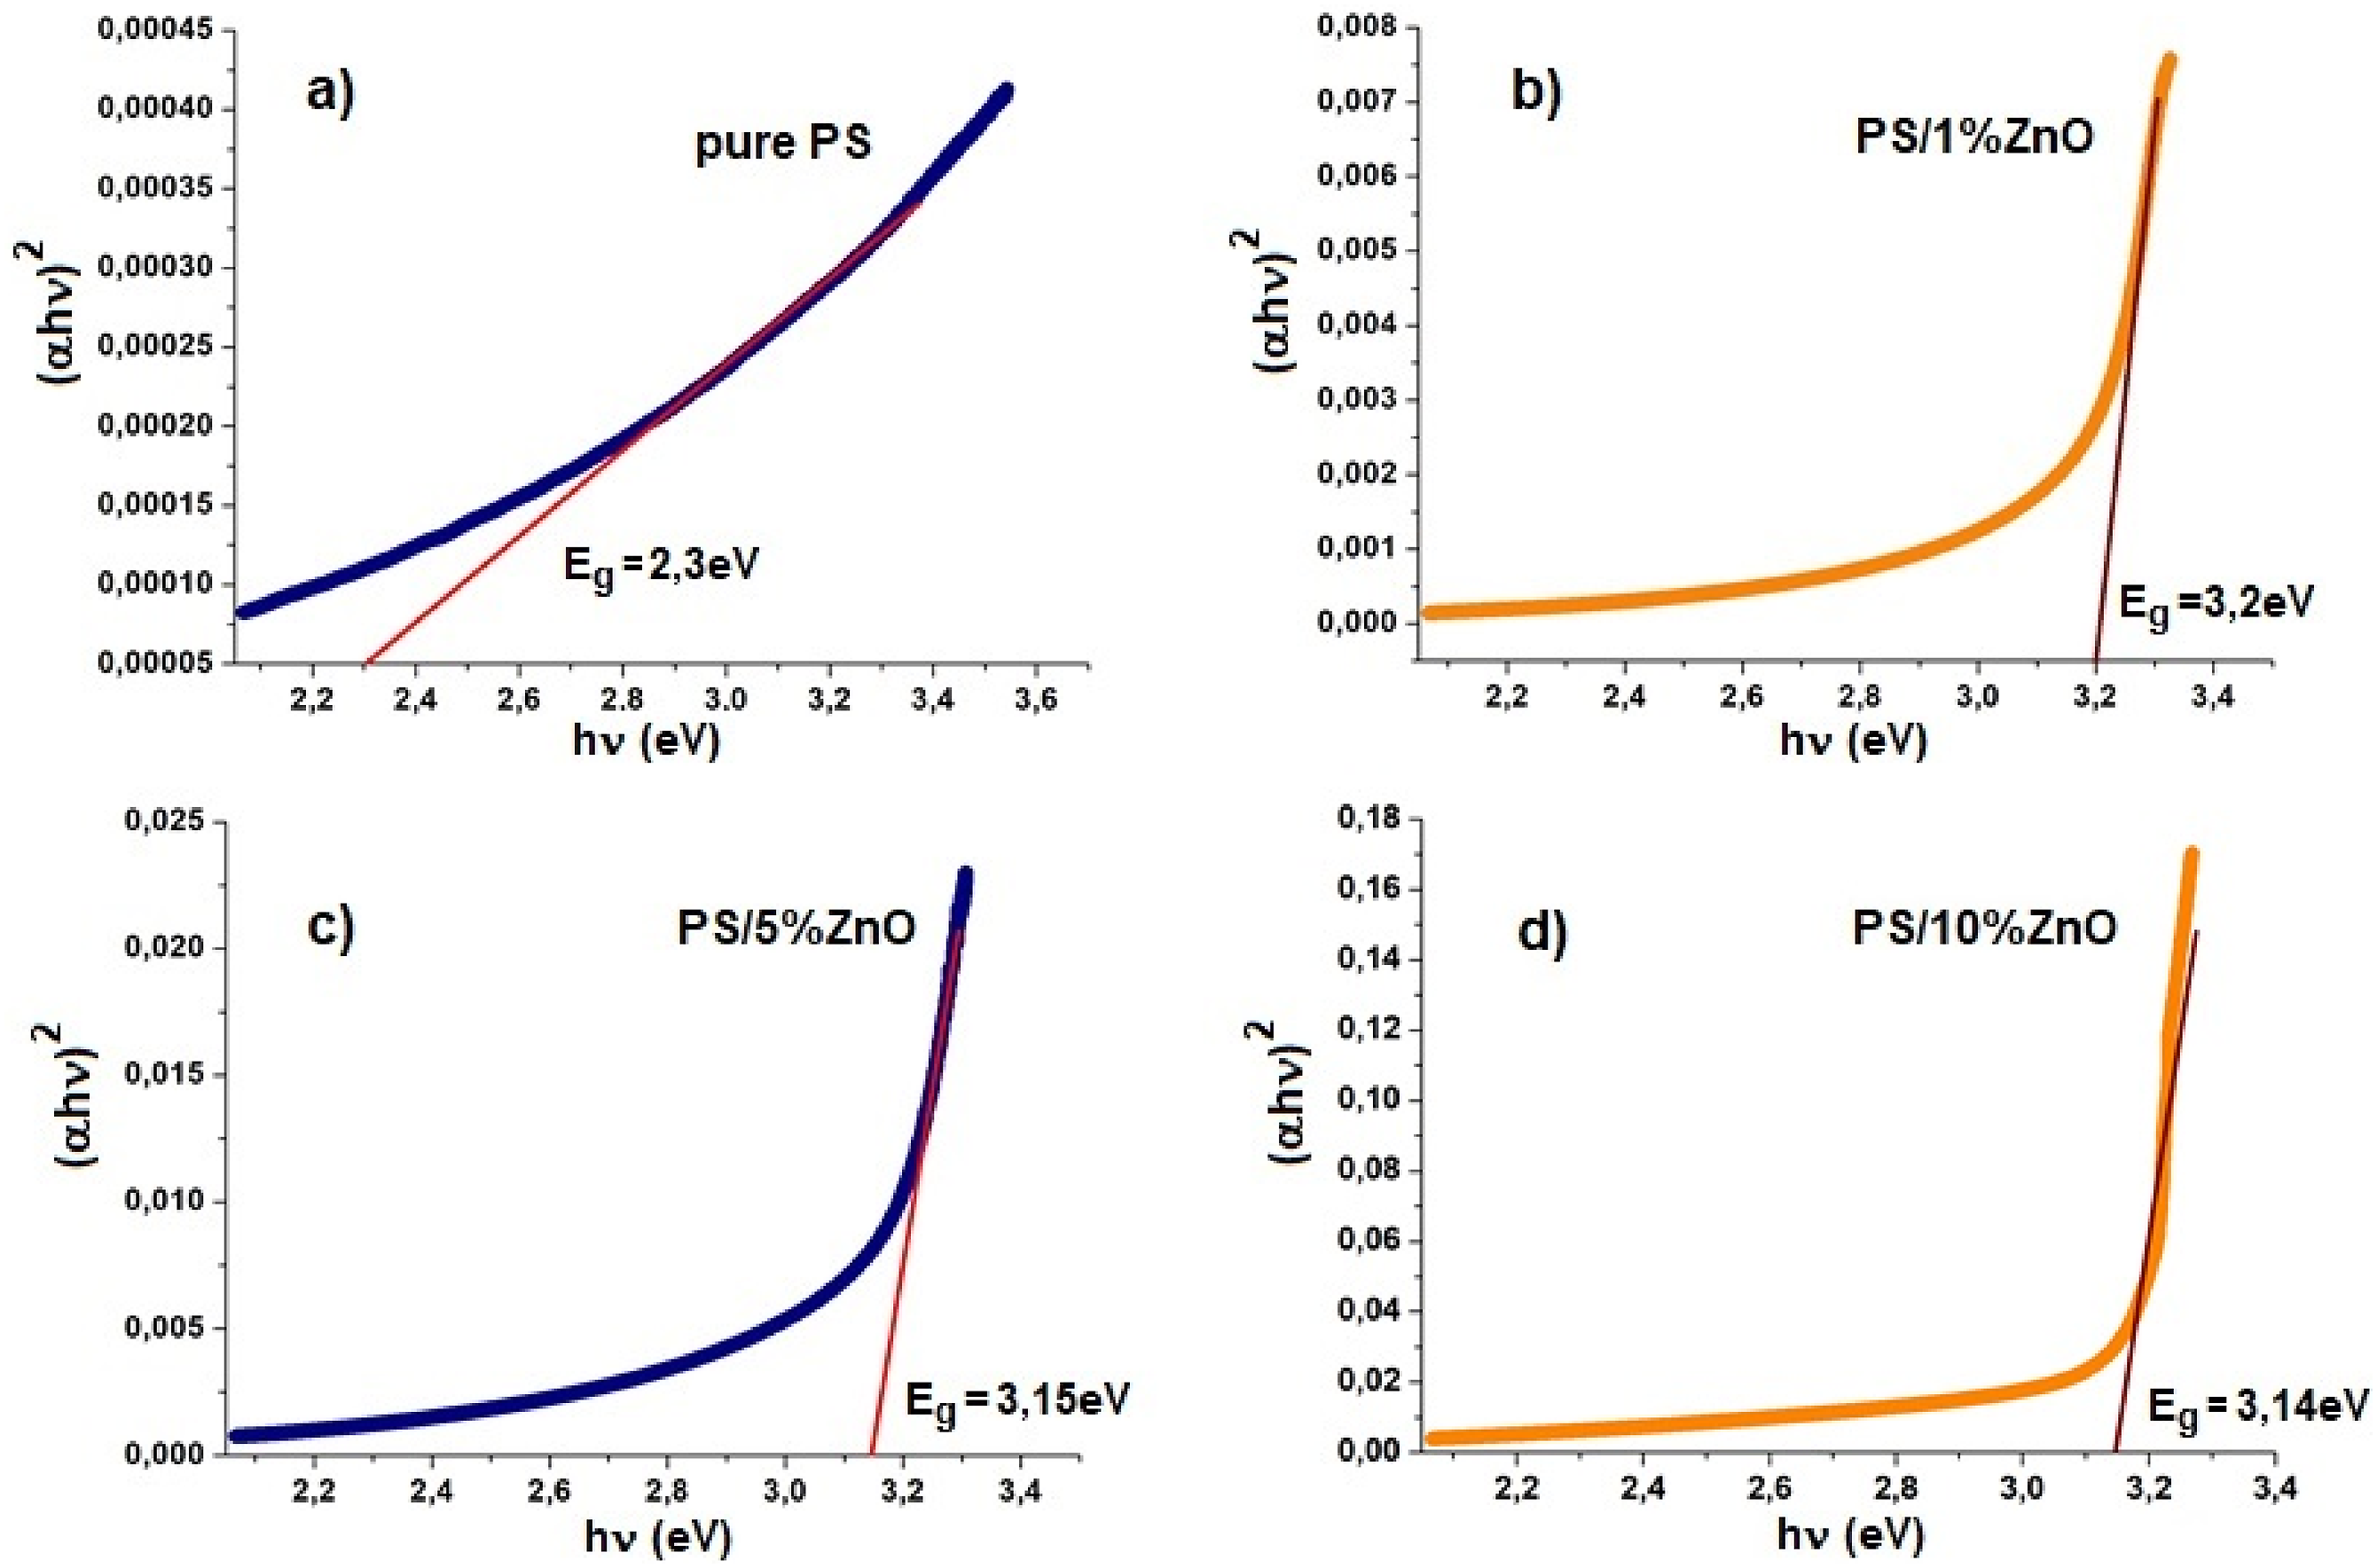
Band gap (e.g.) values for pure polystyrene (PS) and PS/ZnO nanocomposites.
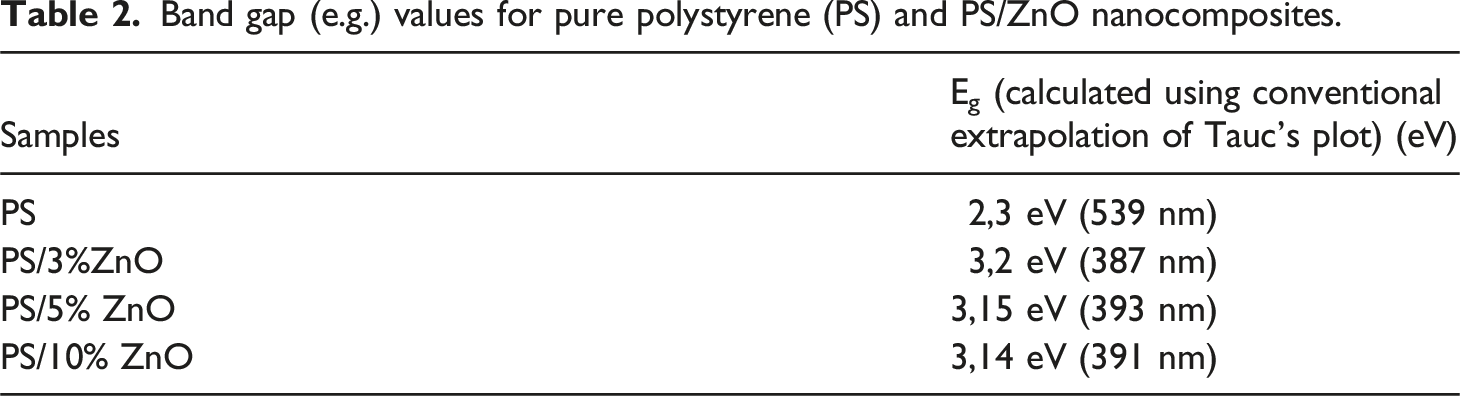
The table shows that as the concentration of nanoparticles grew, the band gap Eg of the nanocomposites decreases (i.e., red-shifted), which is caused by the growing particle size. 36 In other words, as the nanoparticle content in the matrix increases, nanoparticle agglomeration occurs, leading to the formation of larger clusters and consequently a decrease in the optical band gap. The band gap reduction is consistent with the findings from PL investigations.
Photoluminescence (PL) spectroscopy
Photoluminescence (PL) is a significant property that provides insights into the optically active defects and relaxation pathways for excited states. This study is essential for identifying the source of sub-band-gap luminescence. Figure 8 illustrates the photoluminescence (PL) spectra of PS/ZnO-based nanocomposites, depending on the volume content of ZnO nanoparticles. The presence of wide emission bands in the violet and blue regions suggests transitions from excitonic levels and/or zinc interstitials (Zni) to the conduction band, as well as contributions from defects such as zinc interstitials (Zni) and natural zinc vacancies (Znv).37,38 It is suggested that the origin of the violet emission at λ ∼ 420 nm (2.95 eV) is due to the transitions from conduction band (CB) to the holes localized at defect level associated with zinc vacancy (V Zn ).
39
The blue luminescence bands situated in (430–480) nm (2.8eV–2.68 eV) domain are due to transitions from extended donor Zni states and the holes in the valence band.
39
The blue-green emissions (480 nm–510 nm) may be due to the transition from the oxygen inertial (Oi) and zinc antisites (OZn) to the valence band.
40
Photoluminescence spectra of: (a) PS and (b) PS/ZnO based nanocomposites.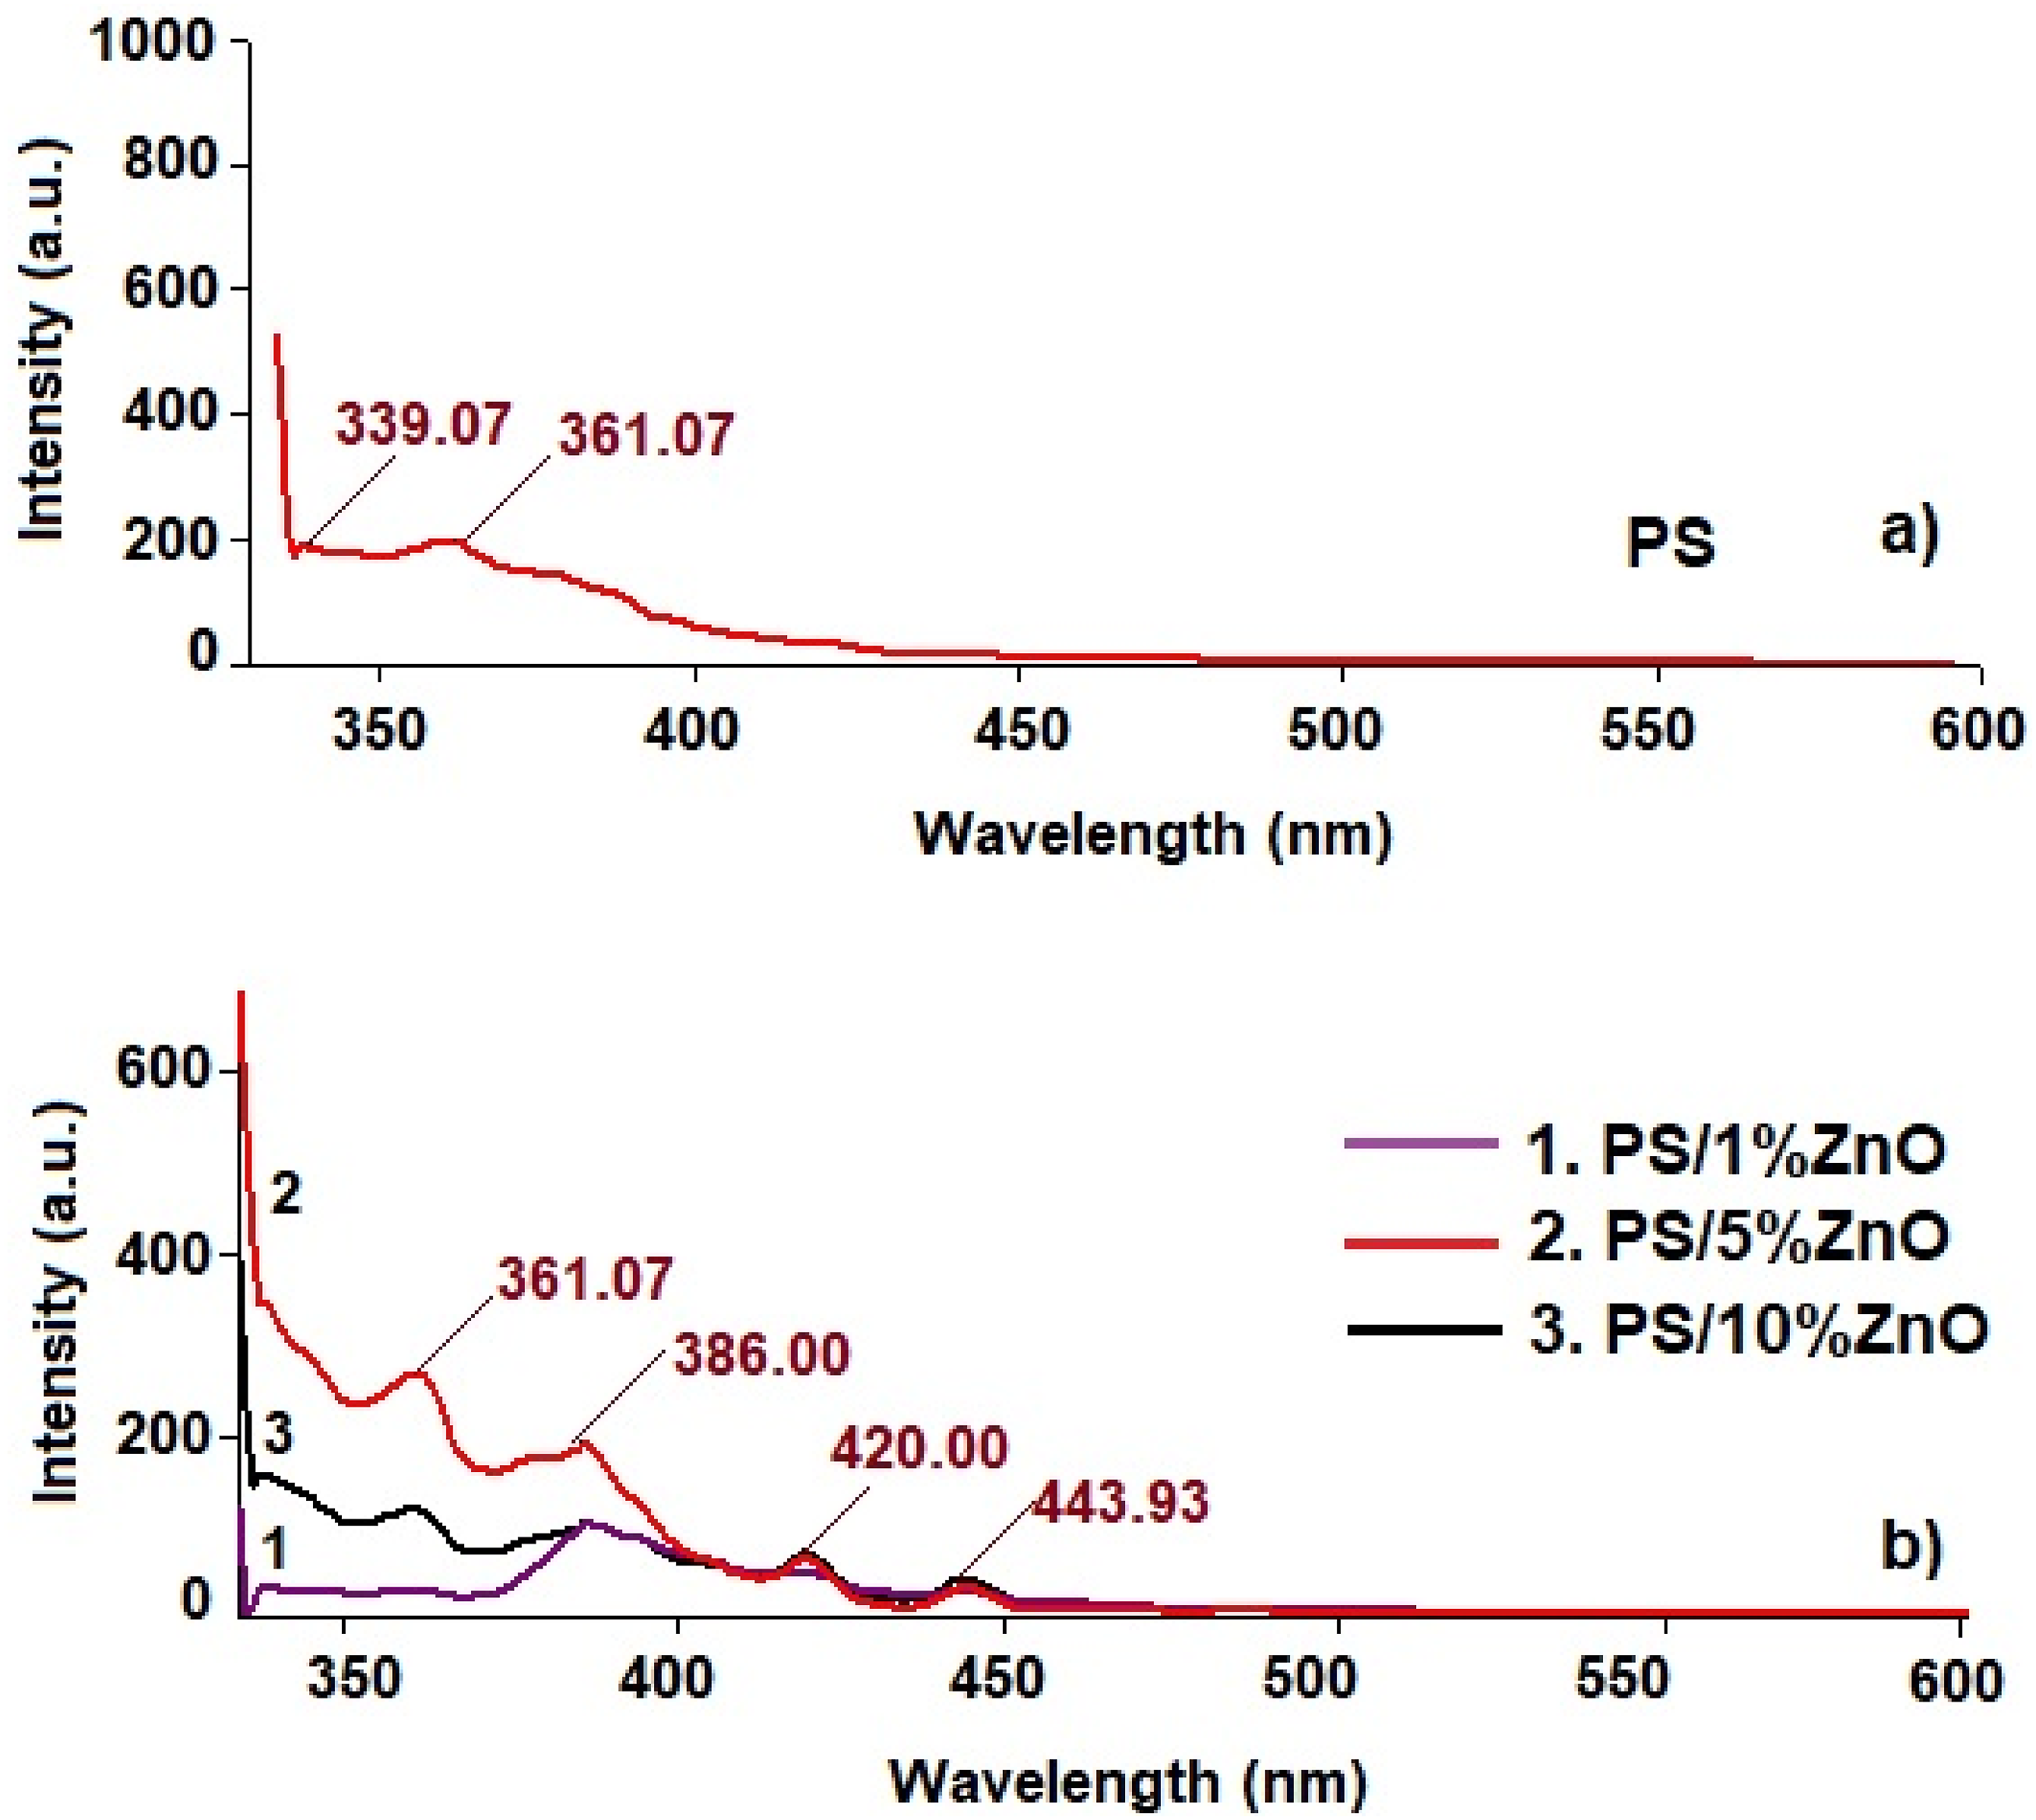
As can be seen from the PL spectra, the luminescence intensity increases depending on the concentration. At a certain volume content of the filler, it stops increasing and saturation occurs. This tendency is due to the increase in the size of the luminescent centers. The decrease in the luminescence intensity at a high amount of filler is explained by the fact that as the nanoparticle content increases, the probability of their agglomeration increases, which in turn significantly reduces the number of crystallization centers.
Conclusion
This study explores the incorporation of zinc oxide (ZnO) nanoparticles into polystyrene (PS) to develop nanocomposites with tailored structural and optical properties. SEM analysis revealed a uniform dispersion of ZnO nanoparticles within the PS matrix indicating effective integration without significant agglomeration. XRD results indicated the successful integration of ZnO, with clear diffraction peaks and a decrease in average crystallite size as ZnO content increased. This suggests ZnO nanoparticles act as nucleation sites, promoting the growth of crystalline domains. The investigation also revealed a reduction in the energy band gap of the nanocomposite films from 3.2 eV to 3.14 eV with increasing ZnO nanoparticle content. This decrease indicates a narrowing of the optical band gap due to the coagulation of nanoparticles as their concentration in the matrix rises. PL spectra exhibited strong emissions in the violet and blue regions linked to defect states and excitonic transitions with intensity increasing with ZnO concentration until saturation at higher filler levels. The interaction mechanism between PS and ZnO likely involves physical entanglement and chemical bonding at the interface enhancing the compatibility and stability of the nanocomposite. FT-IR spectroscopy supports this by showing characteristic shifts in the PS peaks indicating changes in molecular vibrations due to the incorporation of ZnO. These findings underscore the intricate relationship between ZnO concentration and the resultant properties of PS/ZnO nanocomposites highlighting their potential applications in optoelectronic devices sensors antimicrobial coatings and flexible electronic applications such as wearable devices and flexible displays.
Footnotes
Declaration of conflicting interests
The author(s) declared no potential conflicts of interest with respect to the research, authorship, and/or publication of this article.
Funding
The author(s) received no financial support for the research, authorship, and/or publication of this article.