
Abstract
Laser texturing is an effective method to enhance the fusion joining of aluminum alloy (Al) to carbon fiber reinforced thermoplastics composite (CFRTP). The enhancement effect is related to the morphology and spacing of the microstructures on Al surface. However, because of the correlation between the morphology and the spacing of the microstructures, excessive dense microstructures change the morphology, leading to a reduction in the enhancement effect, while sparse microstructures are also difficult to significantly enhance the joint. To this end, this paper proposes an improved laser texturing process to enhance fusion joints, through the investigation of the recast layer formation process during laser texturing on the Al surface, which comprehensively reveals the synergistic effects of microstructural morphology and spacing on joint properties. The results indicated that the increase of the number of laser processes and the microstructure spacing increased the height of the recast layer, with the difference that the microstructure spacing had less effect after increasing to a certain value. With the increase of microstructure spacing, the morphology of the microstructure on the Al surface transformed from the serrated microstructure to the double-scale microstructure, and finally to the independent microstructure, affected by the recast layer on sides of the microstructure. Once the dual-scale microstructures were formed on the Al surface, the shear strength of the Al/CFRTP fusion joint was the highest with a value of 25.05 MPa. The findings could provide a basis for laser texturing pretreatment for fusion joining.
Keywords
Introduction
Carbon fiber reinforced thermoplastic composites (CFRTP) have outstanding advantages such as lightweight and high strength, melt-joinable, recyclable and environmentally friendly, etc.1,2 Stacked structures consisting of metal and CFRTP are light in weight and high in performance, so they are widely used in automotive, high-speed rail and aerospace applications. 3 For instance, the roof frame and rear frame of the BMW iX electric car use CFRTP, and the body frame uses high-strength steel and aluminum alloy (Al). Additionally, the engine fairing of the Boeing 757 and the ceiling of the Boeing 787 also use CFRTP/titanium and CFRTP/Al stacked structures, which effectively reduces the weight of the fuselage.4,5 Common joining processes include mechanical fastening, adhesive bonding, fusion joining, etc. 6 Mechanical fastening can withstand concentrated load, but faces the problems such as stress concentrations near the joints and the increased weight of the structure. 7 Adhesive bonding has the advantages of surface integrity, favorable fatigue resistance and sealing performance, but faces performance degradation in harsh environment.8–11 The fusion joining relies on the molten CFRTP matrix to join metal and CFRTP, and it has better environmental adaptability and stress distribution, simple pre-treatment, high joining efficiency, which makes it suitable for joining of metal and CFRTP.12,13
Affected by the material differences between the metal and CFRTP, the shear strength of fused joints is weak. 13 To improve the joining performance, scholars have studied the bonding principles, and found that the physical adsorption, chemical bonding, and mechanical interlocking were the interfacial bonding effect between metal and CFRTP. Among them, physical adsorption is related to hydrogen bonding and van der Waals forces, chemical bonding is the chemical reaction of reactive groups in CFRTP with metal atoms, and mechanical interlocking is determined by the anchoring structure formed between the polymer and the metal, which is related the metal surface morphology and structure. Enhancing the interfacial bonding effects can improve the joining performance between metal and CFRTP. Hino et al. found that the maximum shear strength of Al alloy and polypropylene resin joints was only 4.49 MPa, only through the enhancement of interfacial physical bonding. 14 Tan et al. investigated the effect of chromium plating on the steel surface on the strength of the steel/CFRTP joining, and the chromium coating could react chemically with polymer matrix, thus the shear strength was increased from 9.32 MPa to 22.14 MPa. 15 Sheng et al. increased the strength of stainless-steel to CFRTP joints from 14.6 MPa to 20.6 MPa by laser texturing microstructures on the stainless-steel surface. 16 By analyzing the elemental distribution of Al and polyamide joints, Adarsh et al. found that mechanical interlocking and chemical bonding were the mechanisms by which they formed connections. 17 The above results indicate that the benefit of improved physical bonding on joint performance enhancement is weak, while the mechanical interlocking and chemical bonding are more beneficial to obtain the high strength joint. Compared to enhancing the chemical bonding effect, enhancing the mechanical interlocking has the advantages of favorable reinforcement, simple process, and no chemicals required. 18 The common processes include sandblasting, grinding, machining, laser texturing, and they are currently receiving attention from both scholars and industry.
The laser texturing process, which allows the preparation of specific microstructures at the micrometer to millimeter scale on metal surfaces, is being widely used because of its simplicity of operation, structural applicability, enhancement effects.19–22 The lasers currently used for laser texturing are divided into two categories: short pulse (ns, ps, fs) lasers and long pulse (μs, ms) lasers. Scholars have found that short-pulse laser produces smoother surfaces, but long-pulse lasers have non-negligible advantage in terms of efficiency, even though the resulting recast layer affects the surface topography.
23
In the area of long-pulse laser texturing, researchers have conducted comprehensive study of laser power, processing speed, repetition frequency, parameters such as thermal conductivity and specific heat capacity of the substrate and have explored their effects on the characteristics of the microstructures, such as depth, width, and arrangement. However, during the laser texturing of metal, accompanied by material melting, decomposition and vaporization, thermo-mechanically driven flow in the melt pool, as well as spurt and re-solidification of the molten material, the metal surface produces recast layers of different heights. The metal in the center of the laser spot is heated and the heat is transferred to the surrounding material as shown in Figure 1(a). As the temperature in the area gradually increases, the metal liquefies and eventually vaporizes to form vapor particles. The vapor particles condense back to the metal surface, due to the temperature difference and the formation of recoil pressure, the recoil pressure to promote the flow of molten metal to the sides of the microstructure, the molten metal cooled and solidified to form a recast layer, as shown in Figure 1(b).24,25 Because of the size difference between the laser spot and microgroove width, the laser must be micro-offset or repeated in the microstructure processing area to obtain the desired width and depth, this leads to fluctuations in the depth and width of the microstructure, as shown in Figure 1(c) and (d). Schematic diagram of molten pool force-heat behavior and recast layer formation of laser processed Al alloy.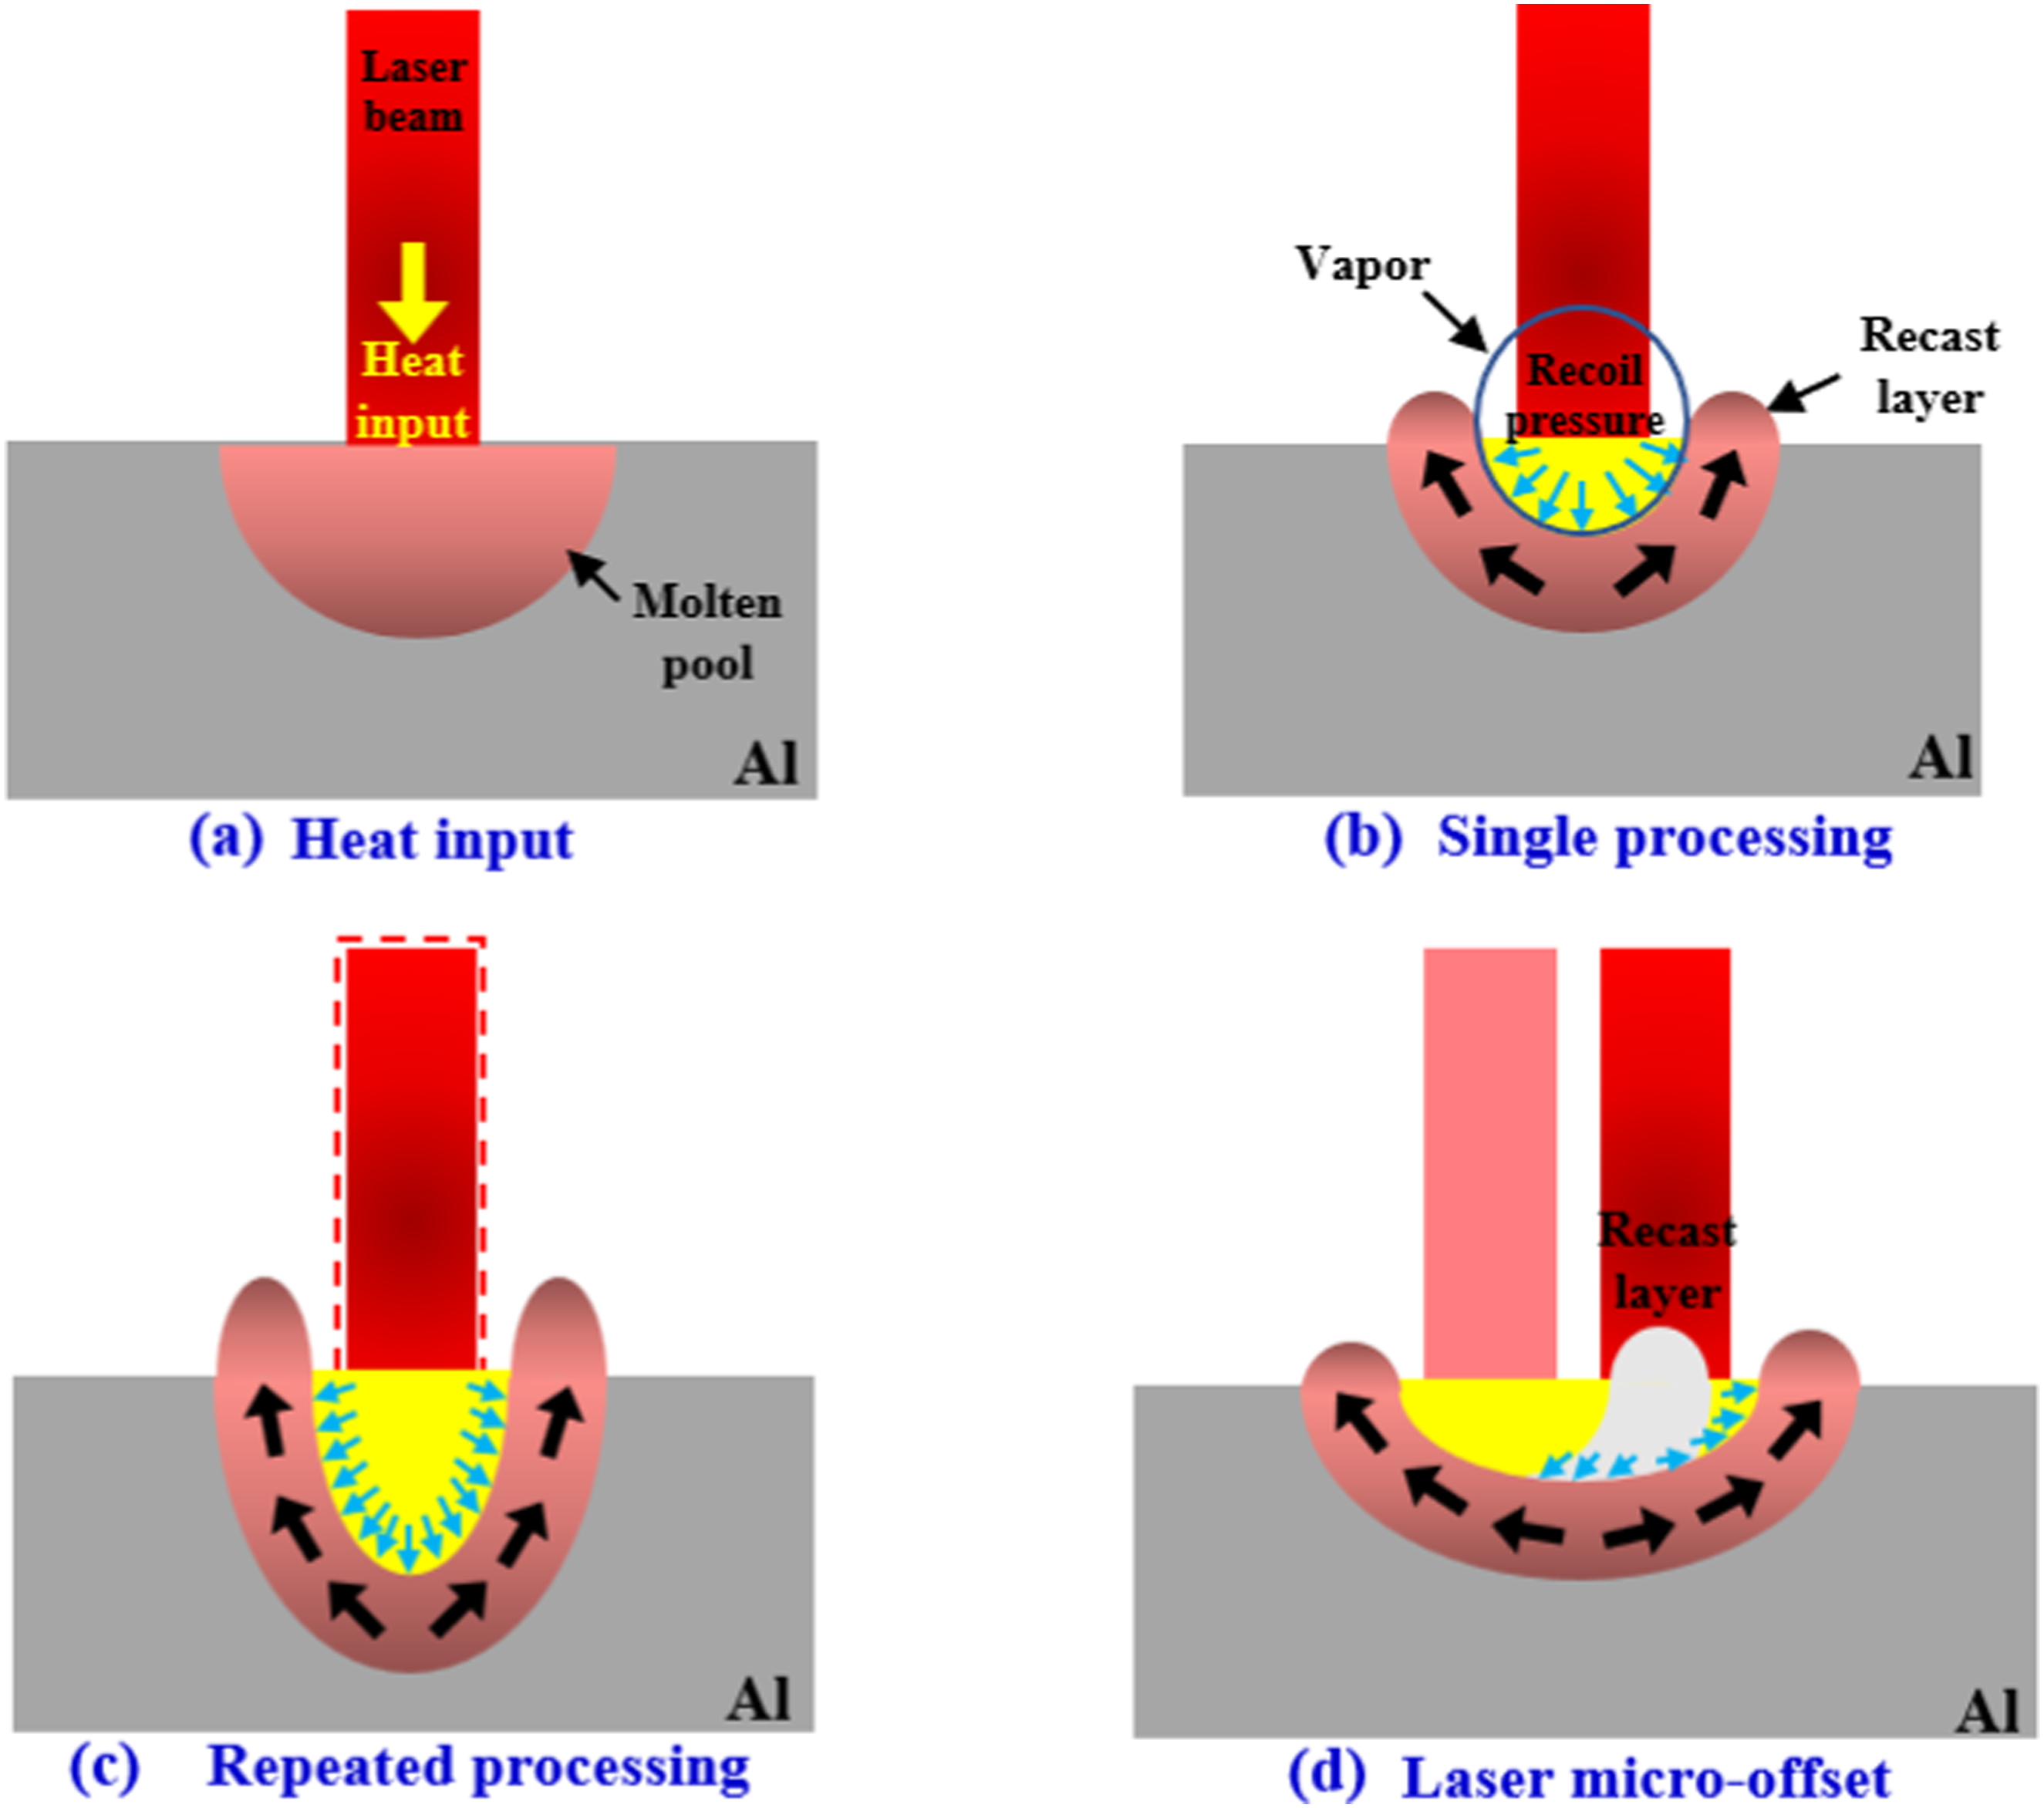
In terms of the effect of microstructures on joint performance, scholars have extensively explored parameters such as microstructure morphology, arrangement, depth and width. A variety of microstructural morphologies such as conical bumps, 26 grooves,27,28 lattice grooves,6,29 dimples3,30 etc. can be obtained by using different laser texturing strategies, and it has been found that the microstructural morphology has relatively small effect on the strength of the joint. For example, Amend et al. found that the shear strength of stainless steel and thermoplastic joints with different microstructural depths and morphologies was about 20 MPa. 21 Most of the current studies have focused on the effects of groove angle, 31 depth, 27 width, 29 and spacing, 28 as well as the depth, 31 diameter, 30 and spacing 3 of dimples on the shear properties of the joints. It has been shown that increasing the depth-to-width ratio of the microstructures helps to increase the joint shear strength until the shear strength reaches the maximum, and the most important factor affecting the joint shear strength is the number of microstructures arranged.27,30 For example, E. Rodríguez-Vidal et al. found that the joint strength is inversely proportional to the spacing of the microstructures, and the shear strength of joint with a microstructure spacing of 200 μm is four times higher than that of a joint with a spacing of 600 μm. 31 Although increasing the number of microstructures can greatly improve the joint shear strength, the microstructure morphology changes with the gradual increase of the number of microstructures, which leads to changes in the shear strength of the joints. For example, Wang et al. have found that reducing the spacing of the microstructures leads to the formation of double-scale structures between the recast layer and the microstructures, surfaces with higher adhesion properties compared to single microstructure metal surfaces. 32 However, there is a lack of appropriate laser texturing processes to obtain double-scale microstructures with favorable enhancement effects, as the formation conditions of double-scale structures and their effects on performance are still unclear.
Although the microstructural arrangement is critical factor in the fusion performance of metal/CFRTP, due to the presence of recast layers, as the arrangement of the microstructures is gradually denser, the accumulation of recast layers on top of each other can lead to pore defects at the bonding interface, resulting in difficulties in obtaining double-scale microstructure with favorable lifting effects. The generation of recast layers is related to both laser and substrate parameters, which have been extensively studied in the literature. 32 This paper focuses on the laser texturing strategy to analyze the effect on the height and morphology of the recast layer, where the laser texturing strategy includes the number of pulsed laser processes, the pulsed laser texturing width and the microstructure spacing. The mechanism of the influence of the double-scale microstructure generated by the recast layer modulation on the interfacial bond strength is illustrated through the interfacial fracture mode and mechanical properties of the joints. Finally, the optimized laser texturing process is obtained, which can improve the melt-joining shear properties of CFRTP and metal.
Experimental conditions and methods
Experimental materials and laser texturing process
The process of millisecond pulsed laser texturing of Al alloy is shown in Figure 2(a). We used alcohol to wipe the surface of the Al alloy before laser texturing, and used a high-pressure air gun to clean the Al alloy powder remaining inside the microstructure after the process was completed. The actual microstructure width will be larger than the theoretical microstructure width due to the presence of heat affected zone in the laser texturing, and the presence of the recast layer will also result in the actual microstructure spacing being smaller than the theoretical microstructure spacing. The definitions of the symbols are shown in Figure 2(b). (a) The microstructure machining system; (b) defining symbols for microstructure parameters.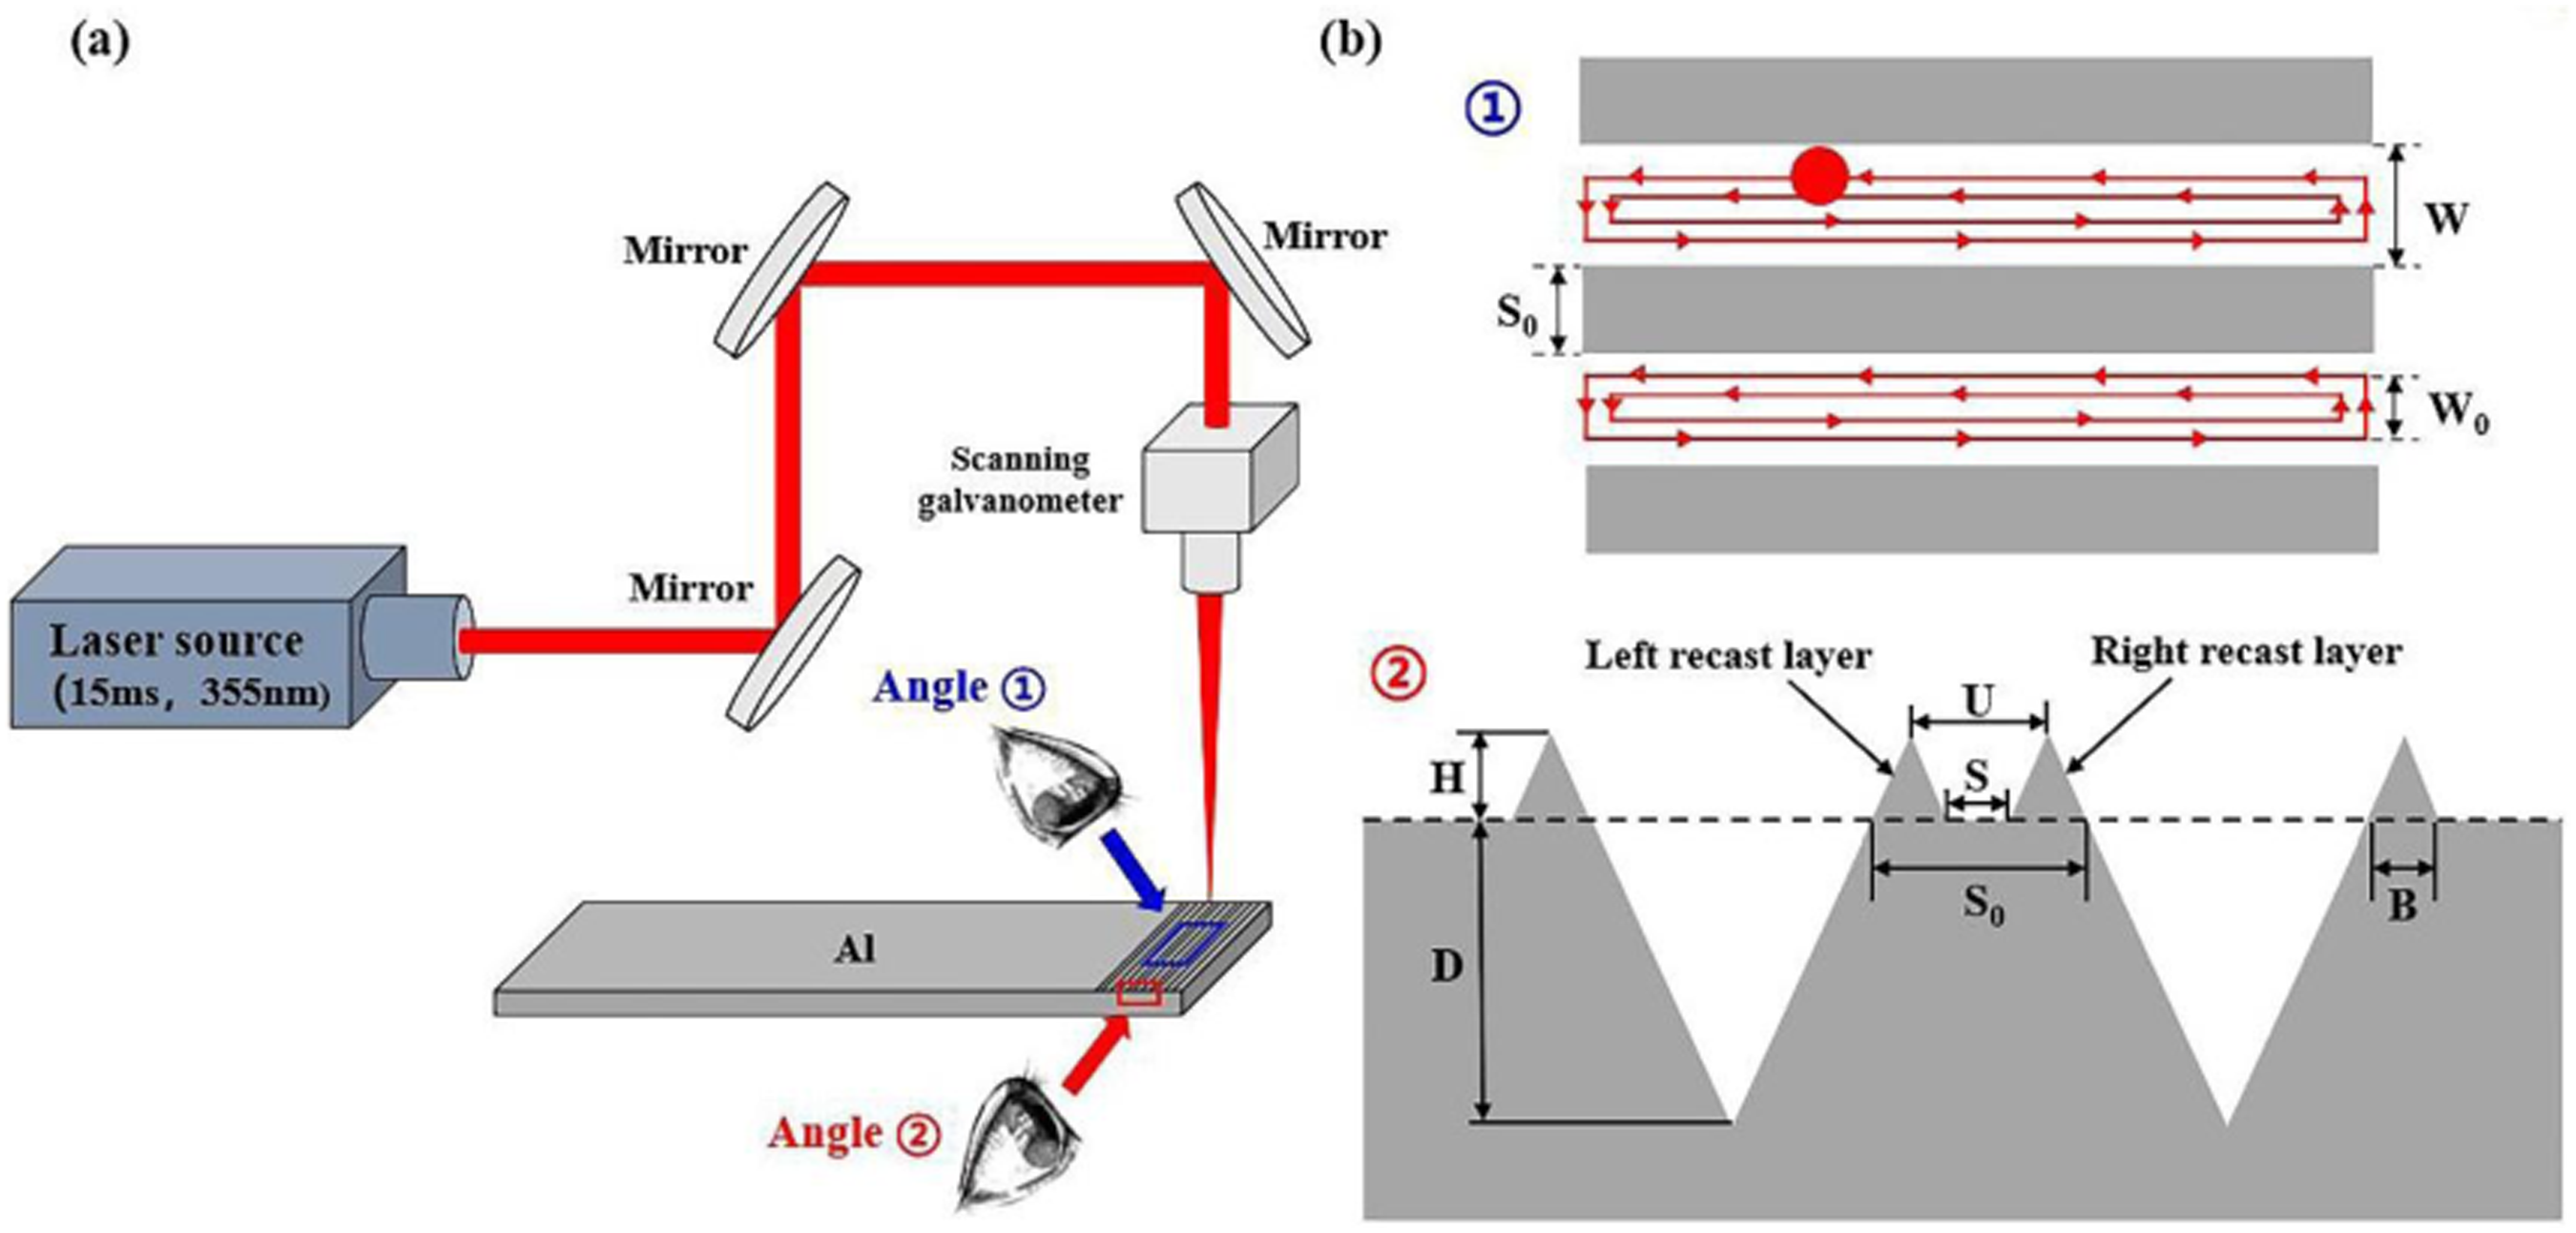
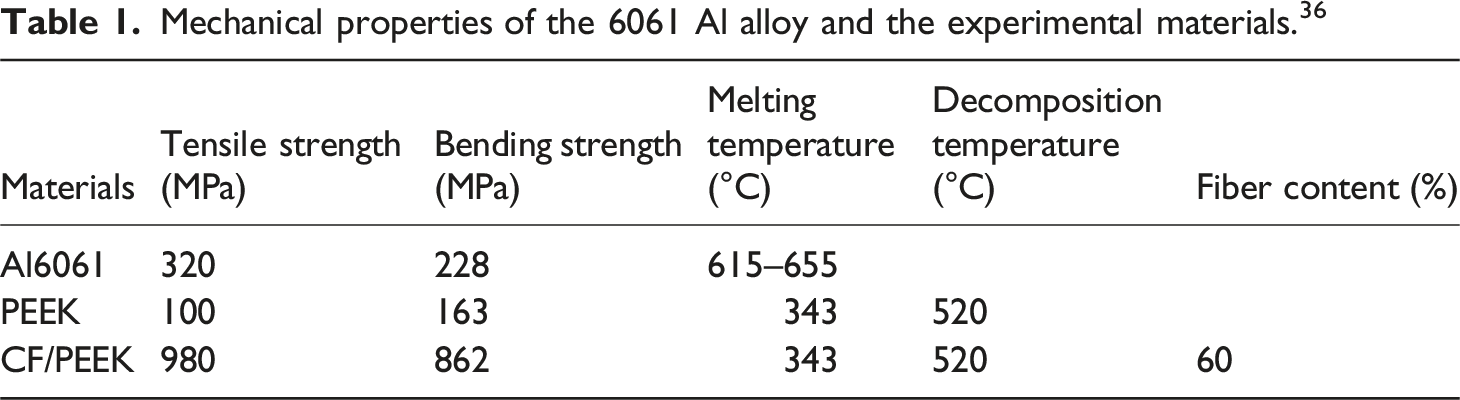
Mechanical properties of the 6061 Al alloy and the experimental materials. 36
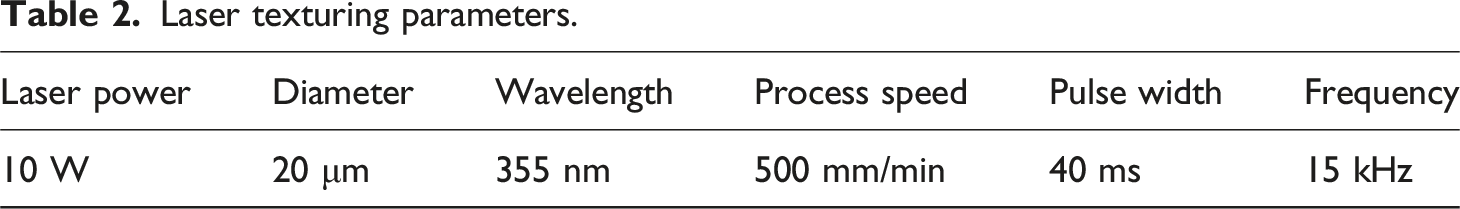
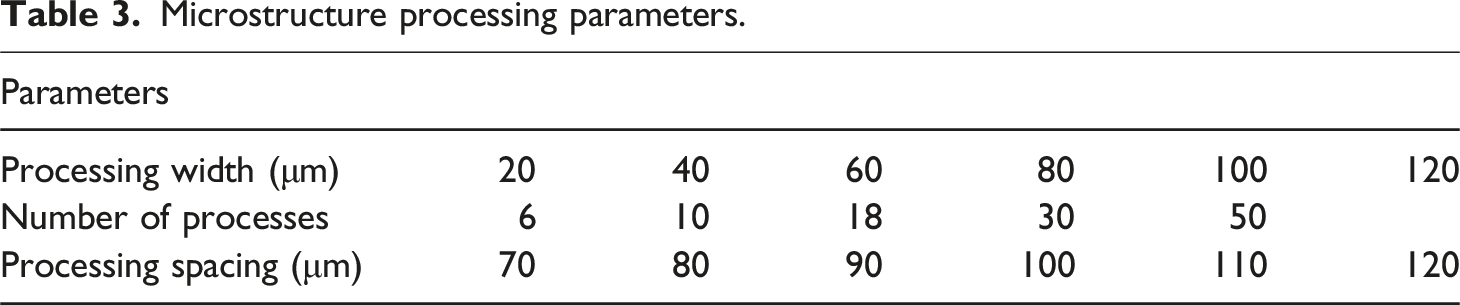
To investigate the influence of laser texturing depth, width and microstructure spacing on the height of the recast layer, the millisecond pulsed laser was used to process the Al alloy. The area of the laser texturing is 12.7 × 25 mm2, as shown in Figure 3(a). The processing parameters are shown in Table 2. The microstructural texture dimensions are shown in Table 3, where the processing spacing were chosen based on Wang’s study to correspond to the formation of two microstructural morphologies: double-scale microstructure and serrated microstructure.
32
(a)Al alloy surface microstructure curve extraction and (b) normalization process for multiple curves. Laser texturing parameters. Microstructure processing parameters.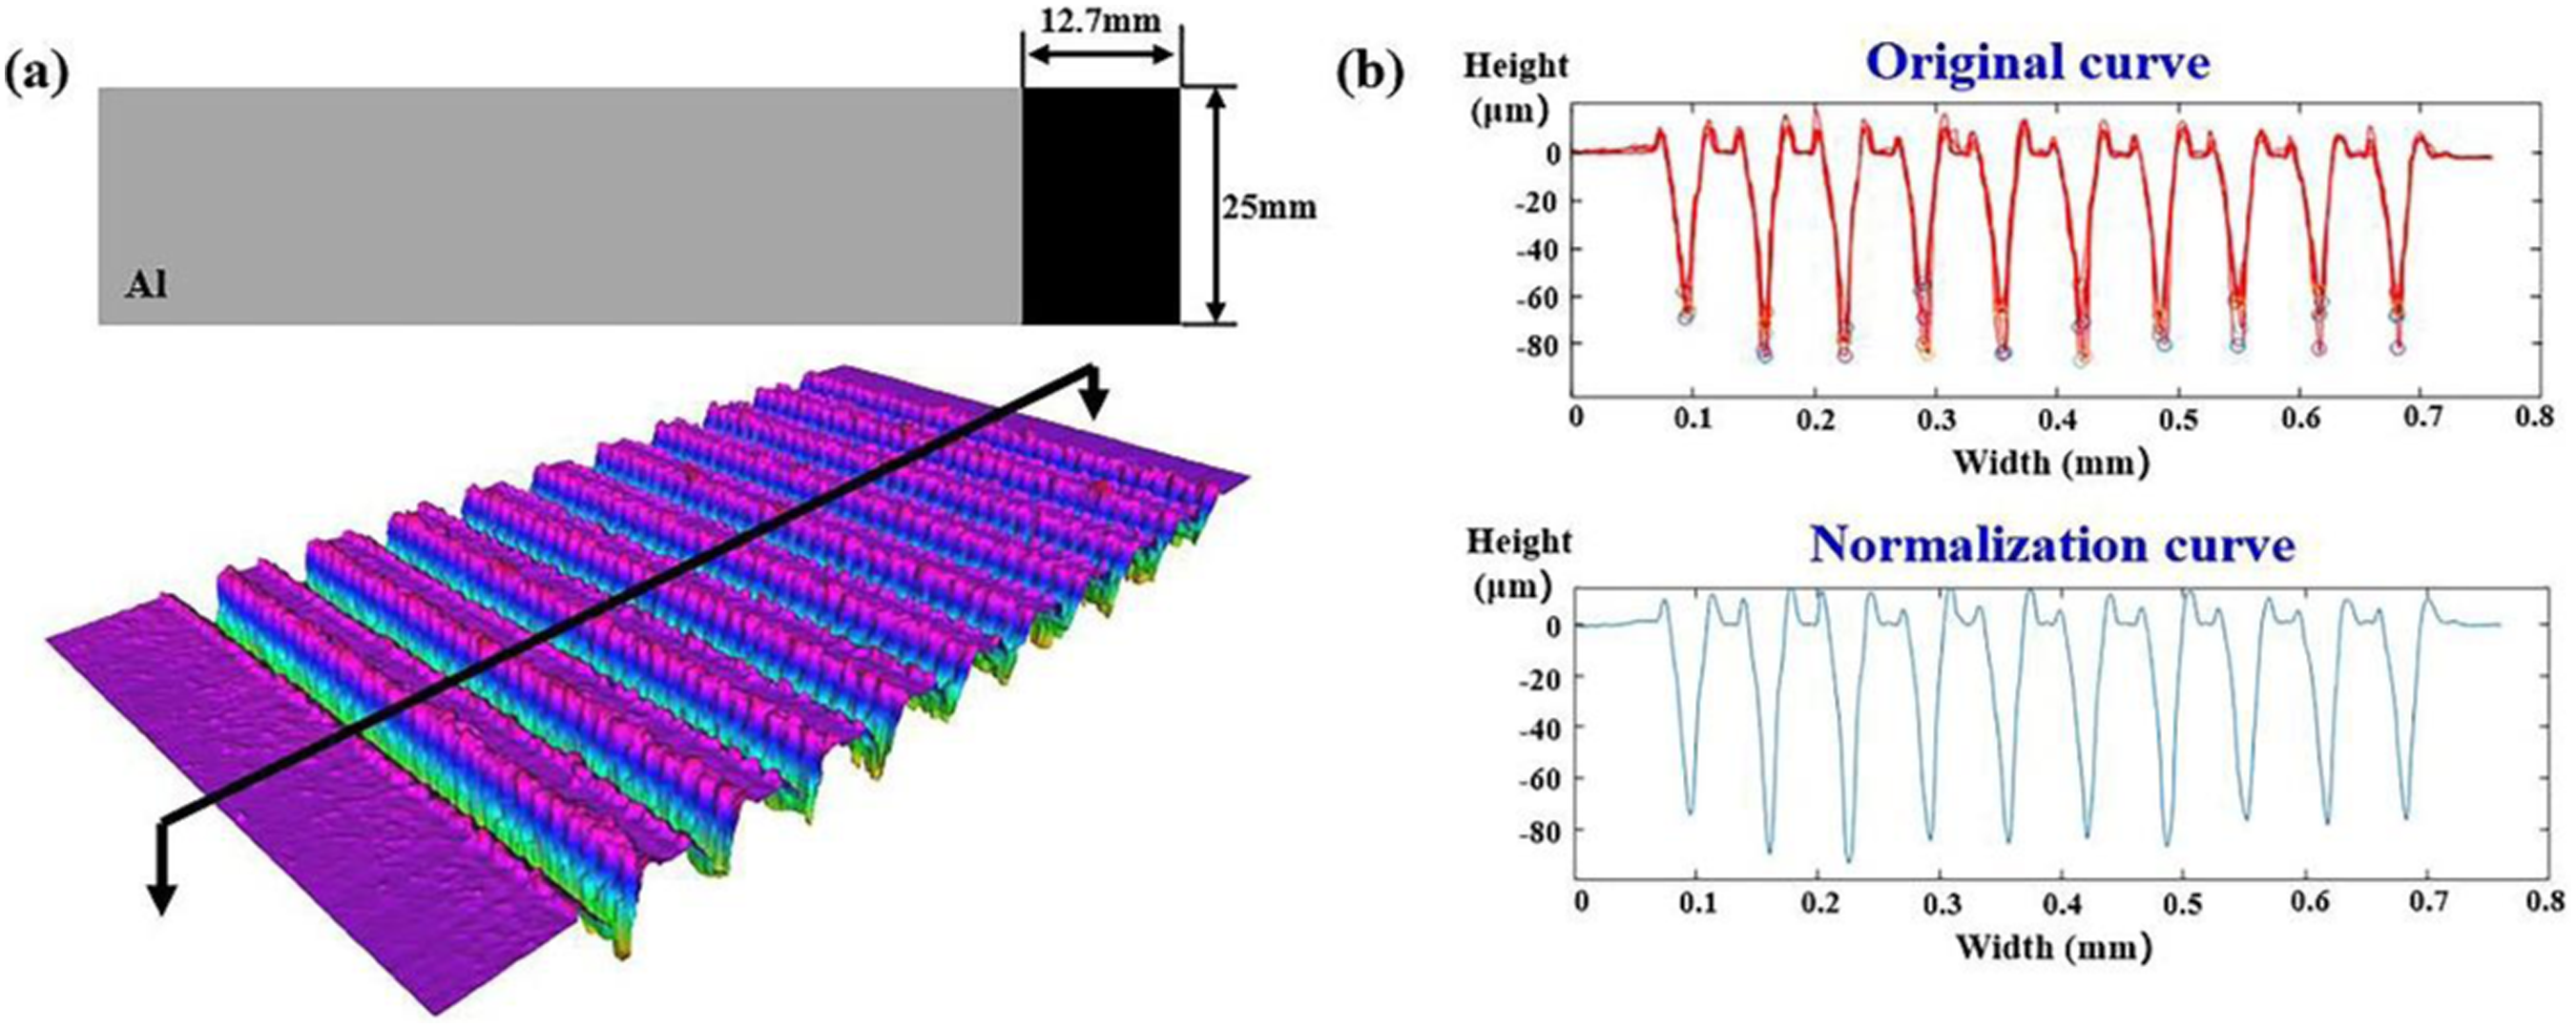
To assess the depth and width of the microstructure and recast layer structure on the surface of the Al alloy, three-dimensional processing confocal microscope (Infinite Focus G5, Bruker Alicona, Austria) was used to observe the surface morphology. Because it is not possible to ensure that the surface of the Al alloy is completely flush with the observation platform during the observation process, resulting in the deviation of the two-dimensional contours of the microstructures in the selected cross sections from the actual contours. It is necessary to rotate the two-dimensional contours of the microstructures in multiple cross-sections to eliminate the influence of the microstructures in the observation process, as shown in Figure 3. Firstly, using the coordinates of the top and bottom of the microstructure of the 2D contours of multiple cross sections, the angular deviation between the theoretical and actual 3D coordinate system was calculated. Then, the 2D contour curves are rotationally corrected by averaging and normalizing the 2D curves of multiple cross sections. Finally, the dimensions of the microstructure and the recast layer are obtained.
Hot-pressing process
The lap area of CFRTP and Al alloy is 12.7 × 25 mm2 as shown in Figure 4(a). To ensure that the bonding effect of molten polymer and metal is consistent throughout the interface and the polymer is fully filling the microstructure on the metal surface, the Al alloy and CFRTP are joined by hot-pressing process. The experimental setup includes briquette, positioning fixture and insulating mica sheet as shown in Figure 4(b). The briquette can provide pressure of about 0.1 MPa. The heating platform transfers heat to the intermediate layer of polymer through Al alloy. Under the pressure, the molten polymer penetrates into the microstructure. The hot-press joining consists of heating, holding and cooling stages. After reaching the set temperature, the holding stage starts, gradual cooling after the end of the holding stage, the joint is obtained when the platform temperature decreases to the room temperature. To determine the optimal hot parameters, the effects of heating temperature and holding time on the joint performance were investigated respectively, the heating temperatures were selected to be 400, 420 and 440°C, the holding times were selected to be 1, 2 and 3 min. (a) Schematic of the lap-joint specimen and (b) the hot-pressing joining.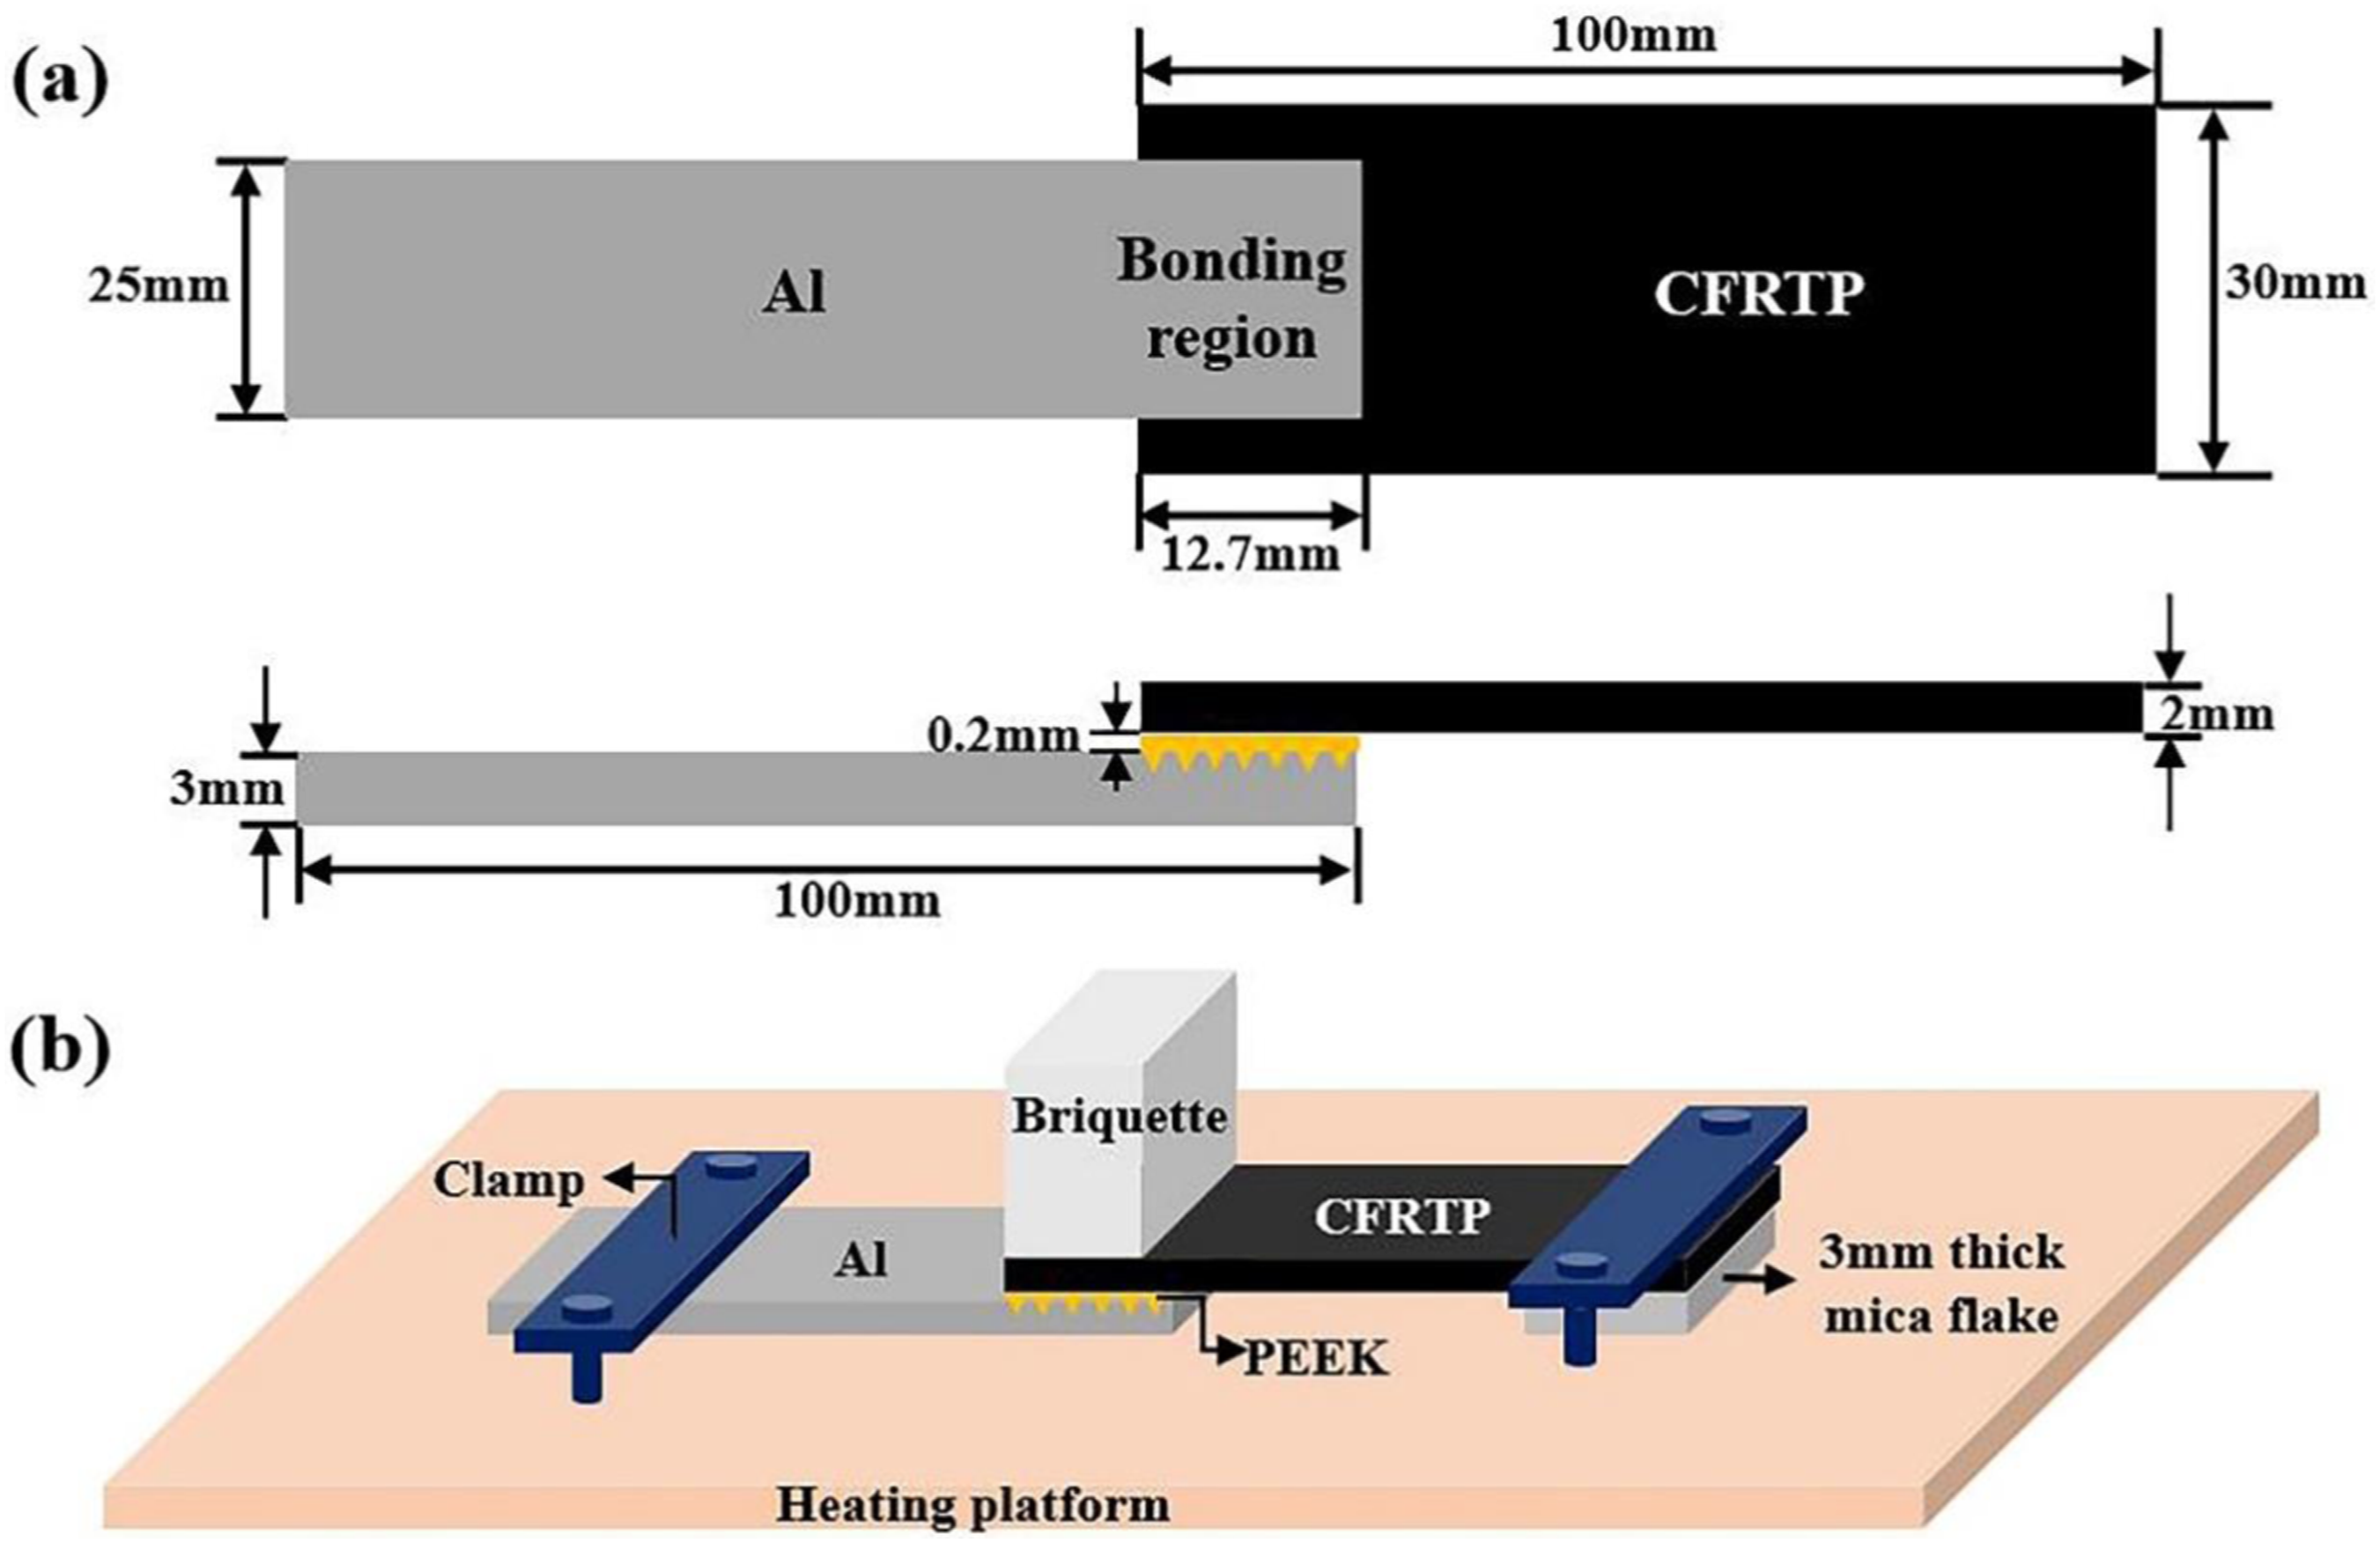
Mechanical properties test methods for joints
WDW-100E universal testing machine was used to carry out single lap shear test on CFRTP/Al alloy lap joint according to ASTM D1002-10 standard, as shown in Figure 5, the tensile speed of the clamps is 2 mm/min. After eliminating the maximum and minimum shear forces, the remaining three groups of shear forces were used to calculate the average value of the shear strength of the joint. Each set of experiments was repeated three times. The lap joints were cut using wire cutting machine, polished using polishing machine, and the fracture surface and cross-section morphology of the joints were observed using processing electron microscope (Phenom XL, Phenom-World B.V, Netherland), and the fracture surface element distribution was analyzed. Tensile test device and schematic diagram.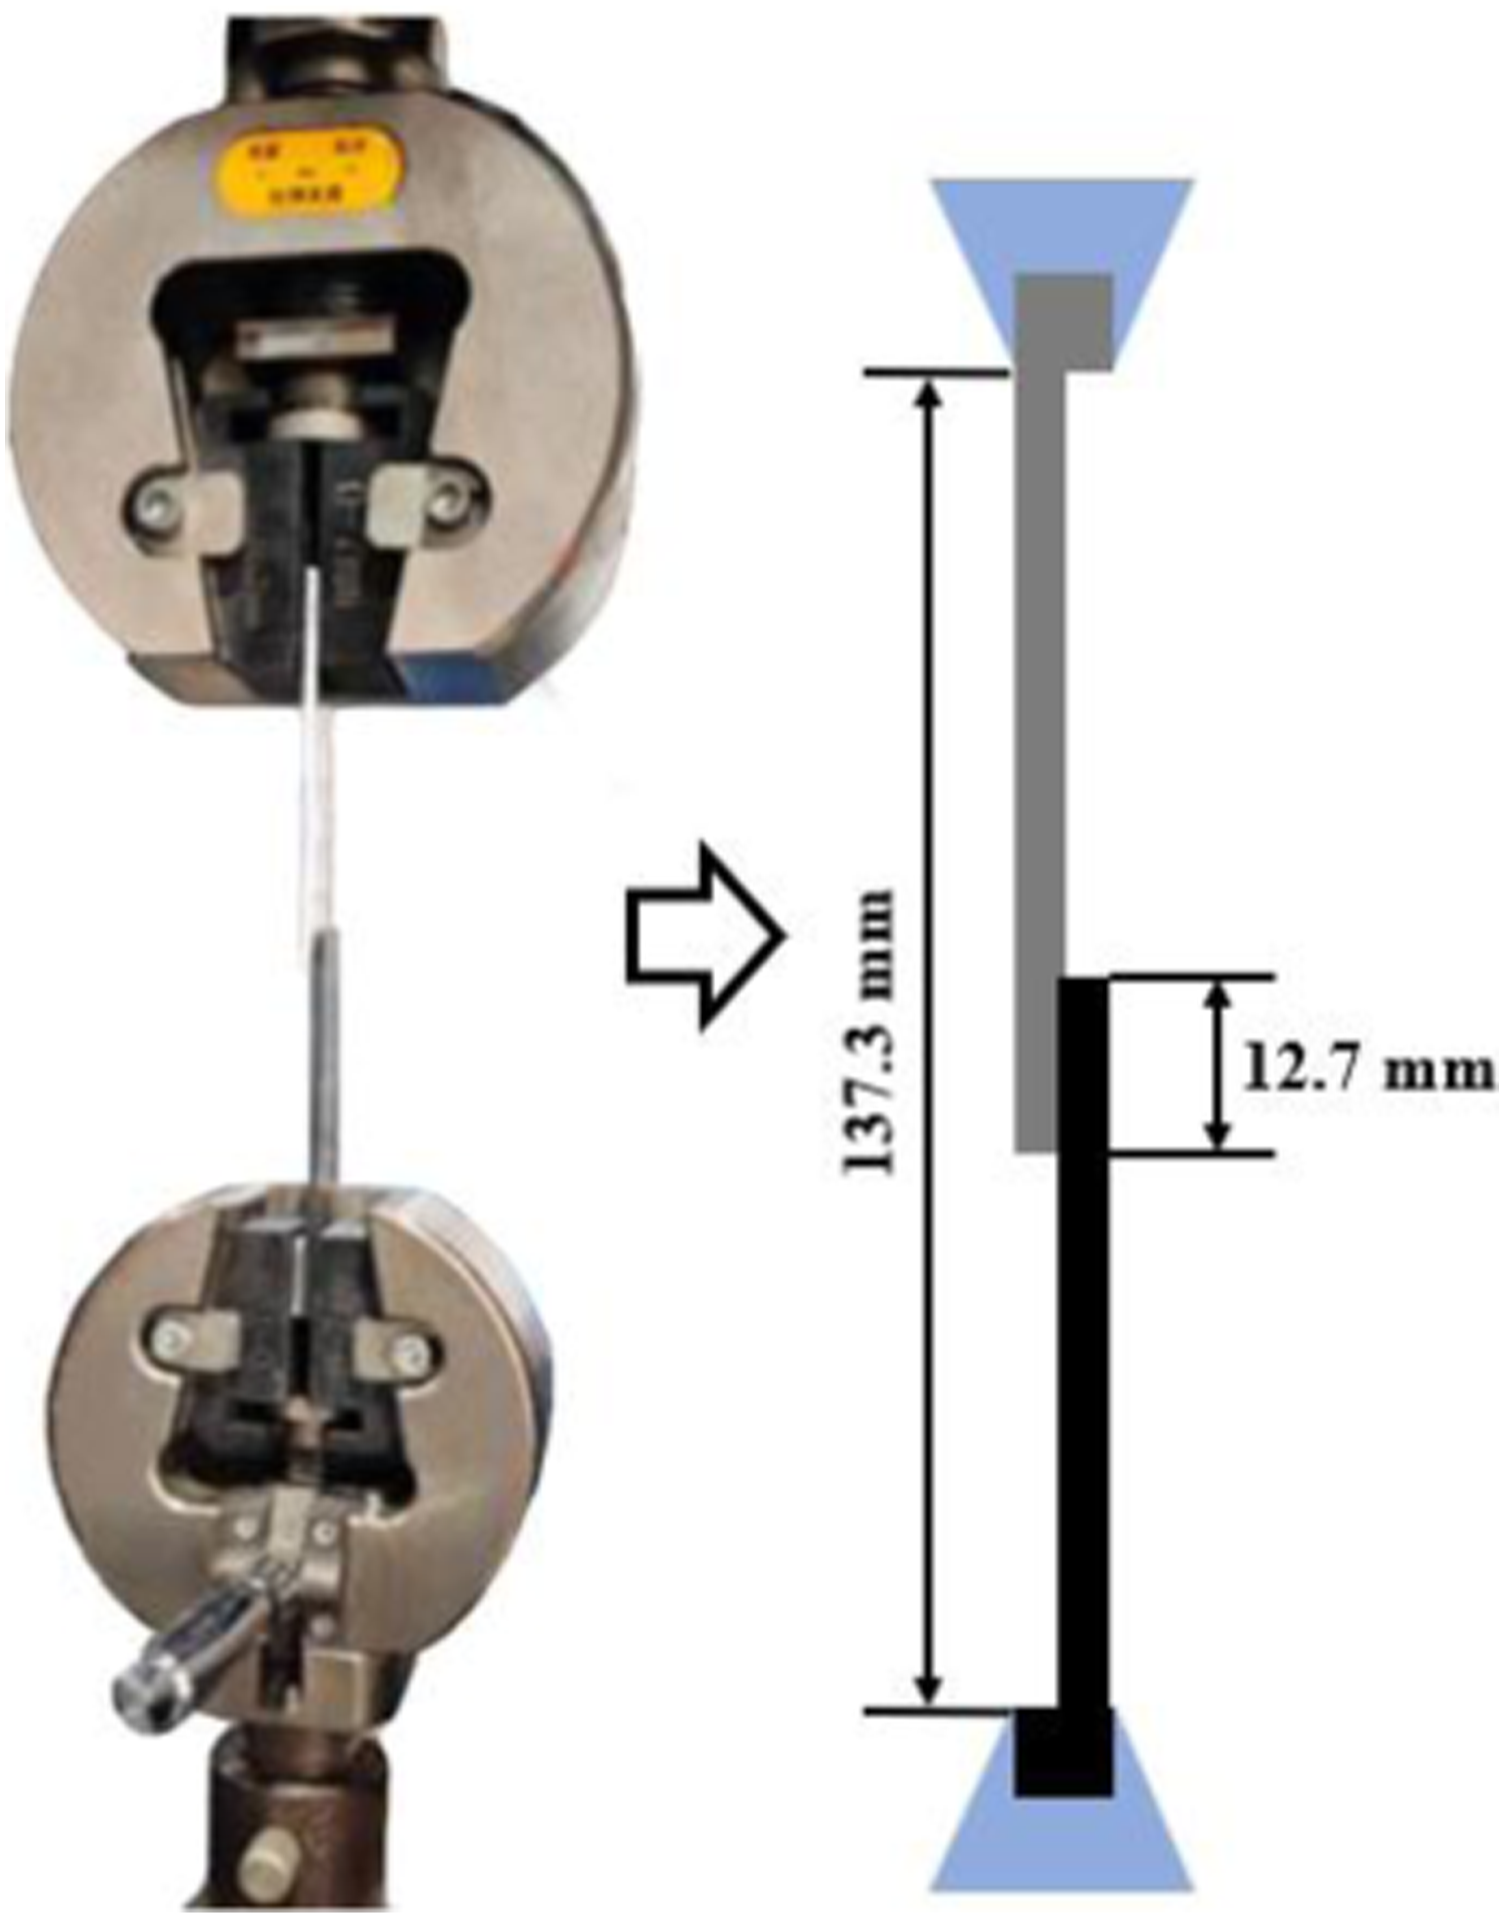
Results and discussions
Influence of laser parameters on microstructure morphology
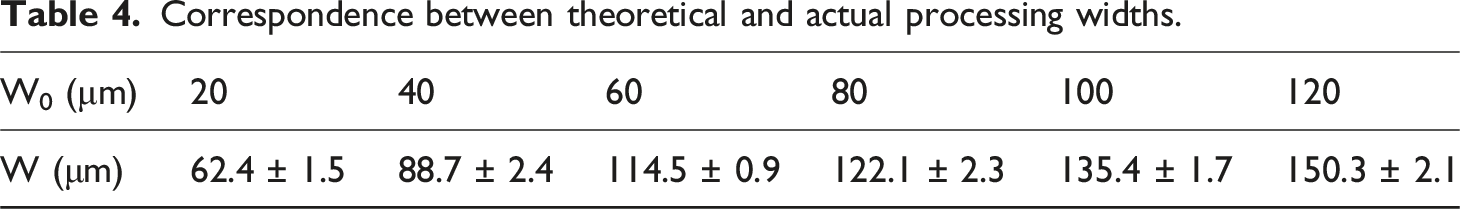
Correspondence between theoretical and actual processing widths.
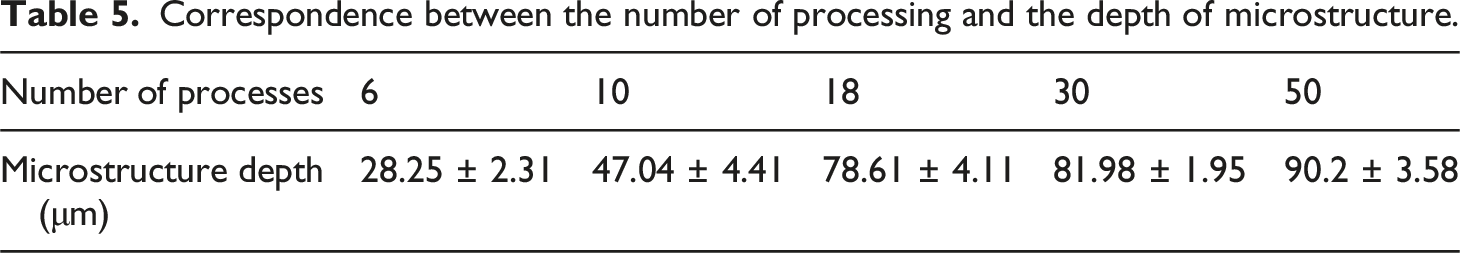
Correspondence between the number of processing and the depth of microstructure.
The three-dimensional morphology of the Al alloy surface microstructure under different processing widths is observed as shown in Figure 6(a)–(f). The curve of the height of the recast layer versus the machining width is shown in Figure 6(g). Although there is randomness in the height of the recast layer, in general, the variations in the machining width do not affect the height of the recast layer. Based on the previous analyses of recast layer, during laser texturing of a microstructure, the recast layer produced in the intermediate region is melted, vaporized or disintegrated, only the molten material close to the sidewalls of the microstructure flows out along the sidewalls, resulting in the formation of a recast layer that builds up on both sides of the microstructure. It has been verified that the laser transverse micro-offset only increases the width of the microstructure and has small effect on the height of the recast layer. The difference in the height of the recast layer between the two sides of the microstructure is about 5 μm, which may be the accumulation of a small amount of metal particles on one side of the microstructure blown by the cooling gas during the laser texturing. 3D morphology of Al alloy surface microstructure with different theoretical processing width W0: (a) 20 μm; (b) 40 μm; (c) 60 μm; (d) 80 μm; (e) 100 μm; (f) 120 μm, (g) height of recast layer at different theoretical processing width W0.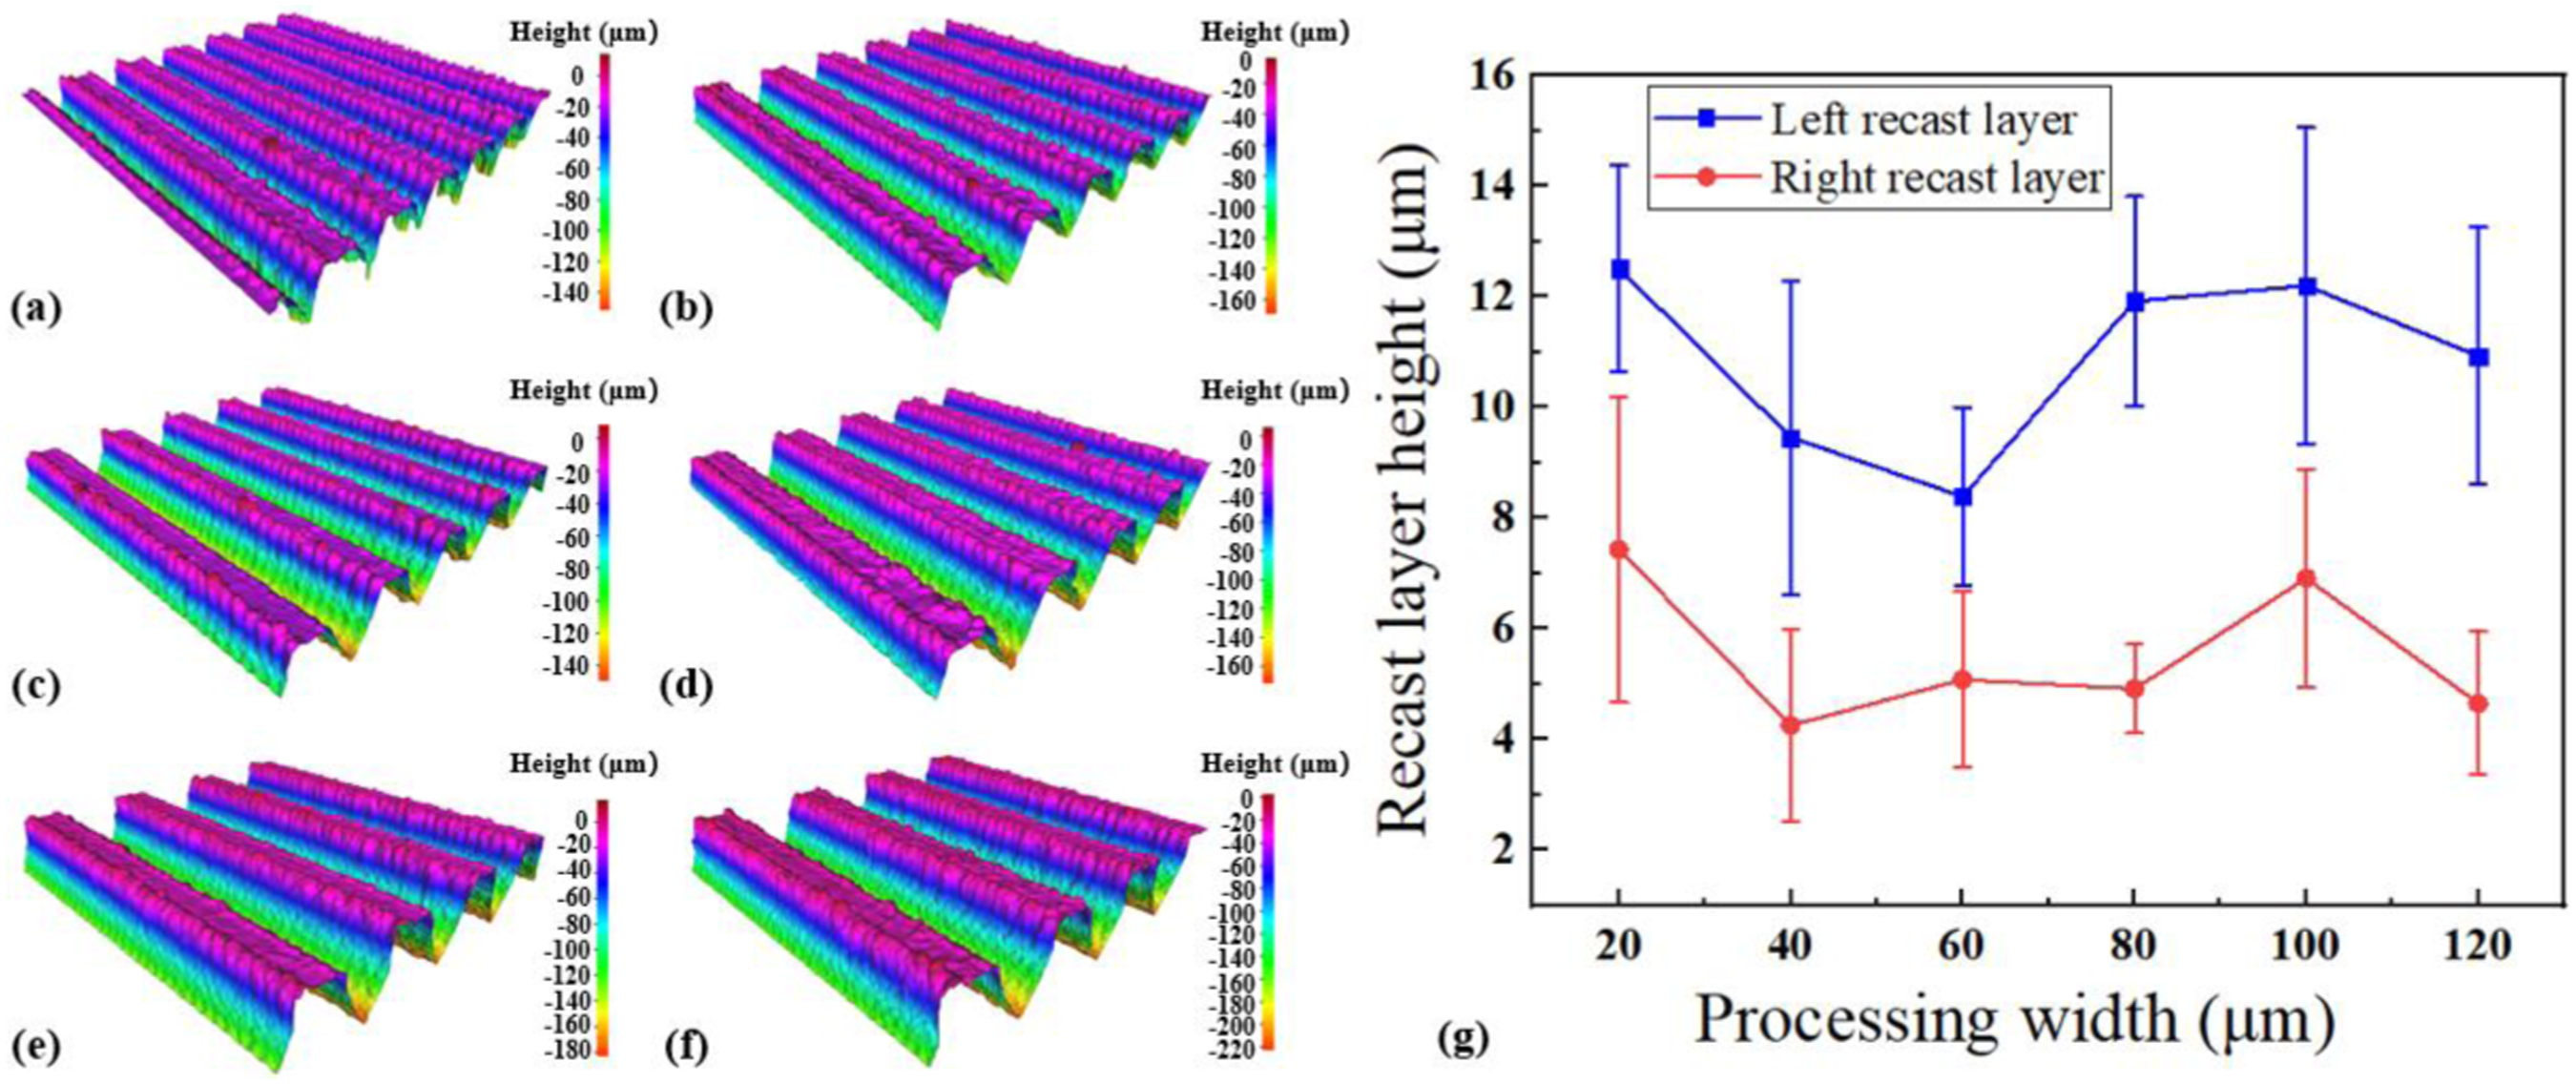
The microstructure morphology of Al alloy surface under different processing numbers is shown in Figure 7(a)–(d). When the number of processing is below 10, the average height of the recast layer on both sides is only 7 μm, and with the gradual increase of the number of processing, the height of the recast layer also increases, as shown in Figure 7(e). It is caused by the gradual increase of the molten material at the center of the laser, the vaporized metal particles push more molten material to accumulate and solidify on both sides of the microstructure. This coincides with the previous analysis, where the number of laser texturing is the most direct cause of the height of the recast layer. 3D morphology of Al alloy surface microstructure with different number of processing: (a) 6; (b) 10; (c) 18; (d) 30, (e) height of recast layer at different number of processing.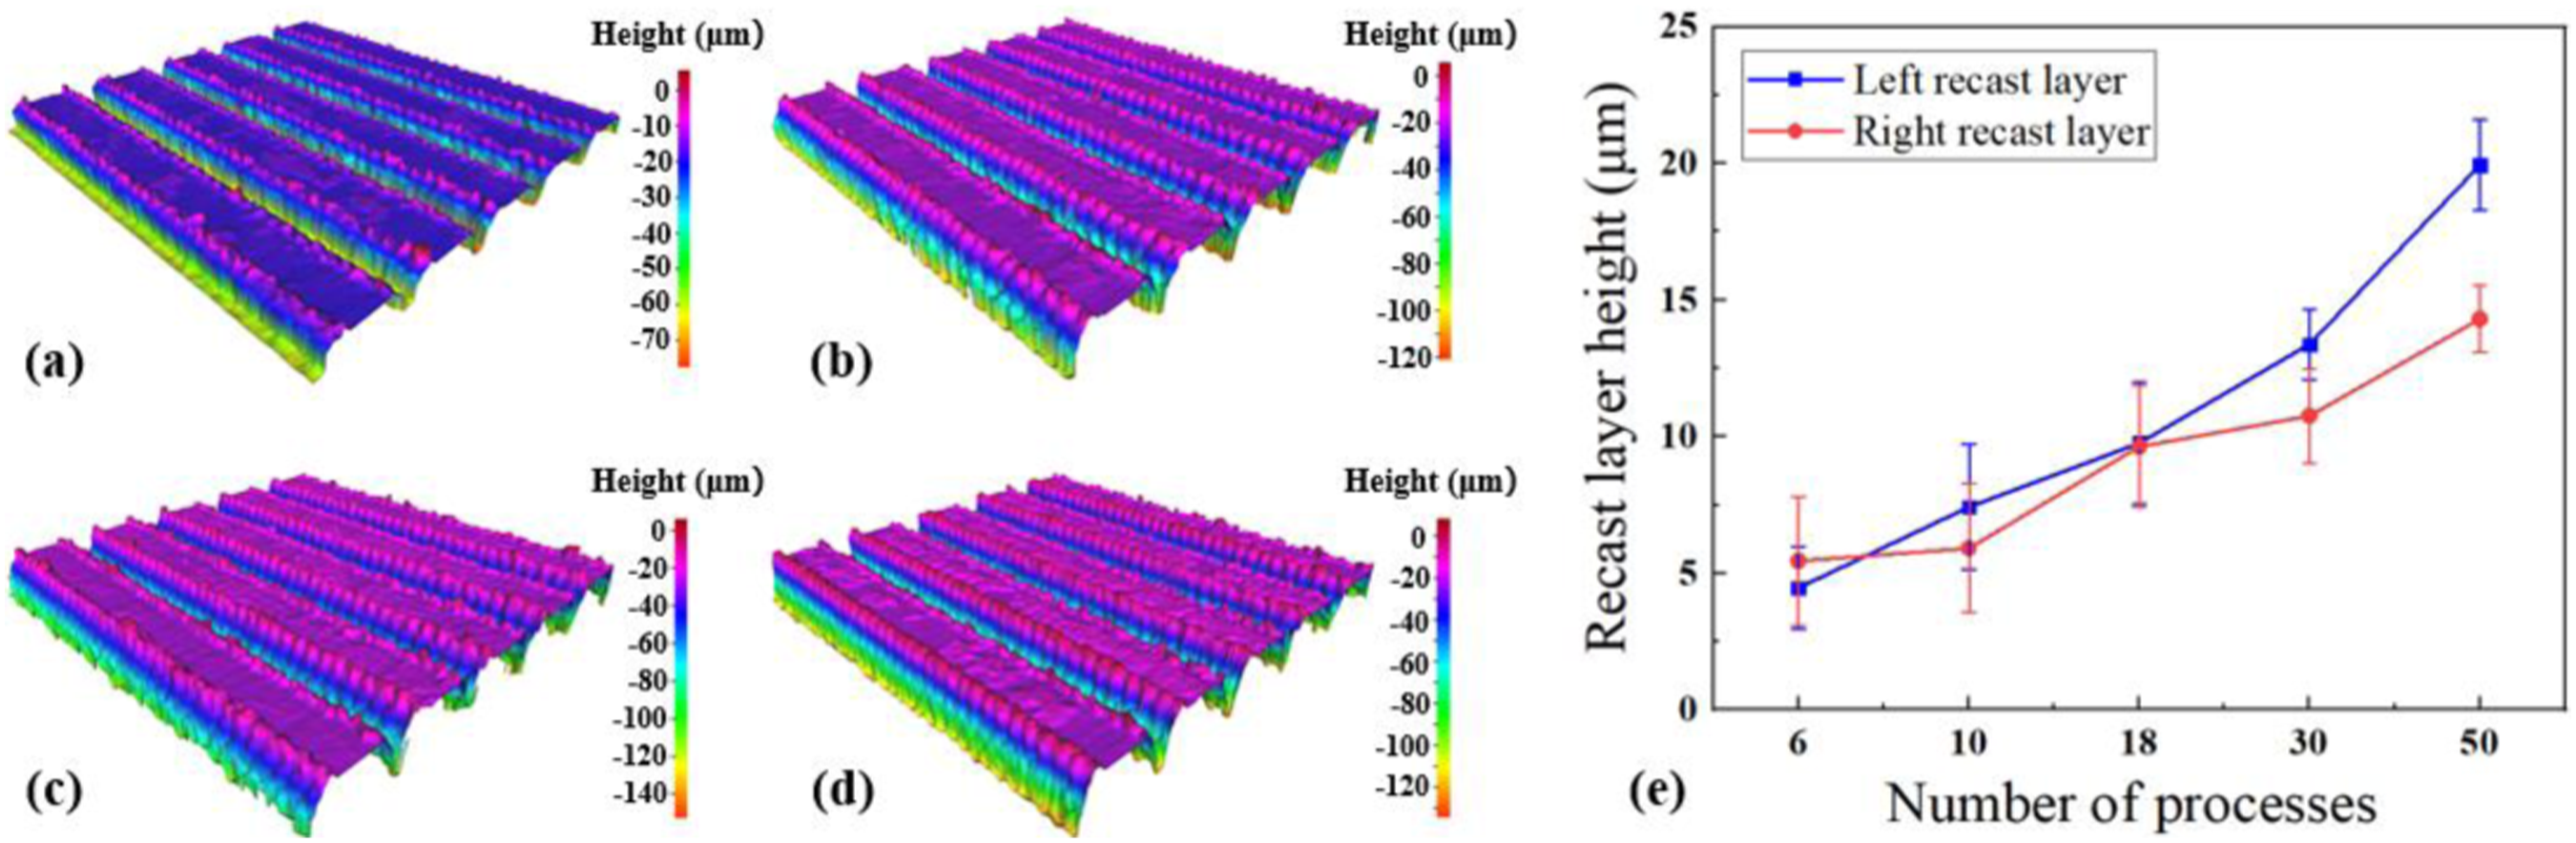
The microstructure morphology of Al alloy surface under different microstructure spacing S0 is shown in Figure 8(a)–(f), the curve of recast layer height versus microstructure spacing is shown in Figure 8(g). With the same number of processing, the height of the recast layer on both sides gradually increases as the microstructure spacing increases. This is because the height of the recast layer is mainly affected by the number of processing, and the smaller processing spacing is to make the two sides of the recast layer piled on top of each other, making the height of the recast layer smaller, therefore the height of the recast layer gradually increases and then stabilizes. When S0 = 70 μm, the recast layer buildup on the Al alloy surface disappears, the Al alloy surface microstructure becomes sawtooth shape, as shown in Figure 8(a). When S0 = 80 μm, the recast layer gradually appears on the surface of Al alloy, but a large amount of molten metal build-up covers it, leading to the formation of haphazard “groove” between the recast layers, as shown in Figure 8(b). Thus, the height of the recast layer on both sides of the height is only about 5 μm. When S0 = 90 μm, “groove” structure is formed between the recast layers, and only part of the molten metal covers the bottom of the “groove,” resulting in an increased height of the recast layer, as shown in Figure 8(g). When S0 ≥100 μm, there are more unprocessed areas in the middle of the “groove,” as shown in Figure 8(d)–(f). The height of the recast layer gradually tends to stabilize as shown in Figure 8(g), and the maximum height can reach 13 μm. 3D morphology of Al alloy surface with different theoretical microstructure spacing S0: (a) 70 μm; (b) 80 μm; (c) 90 μm; (d) 100 μm; (e) 110 μm; (f) 120 μm, (g) height of recast layer for different theoretical microstructure spacing S0.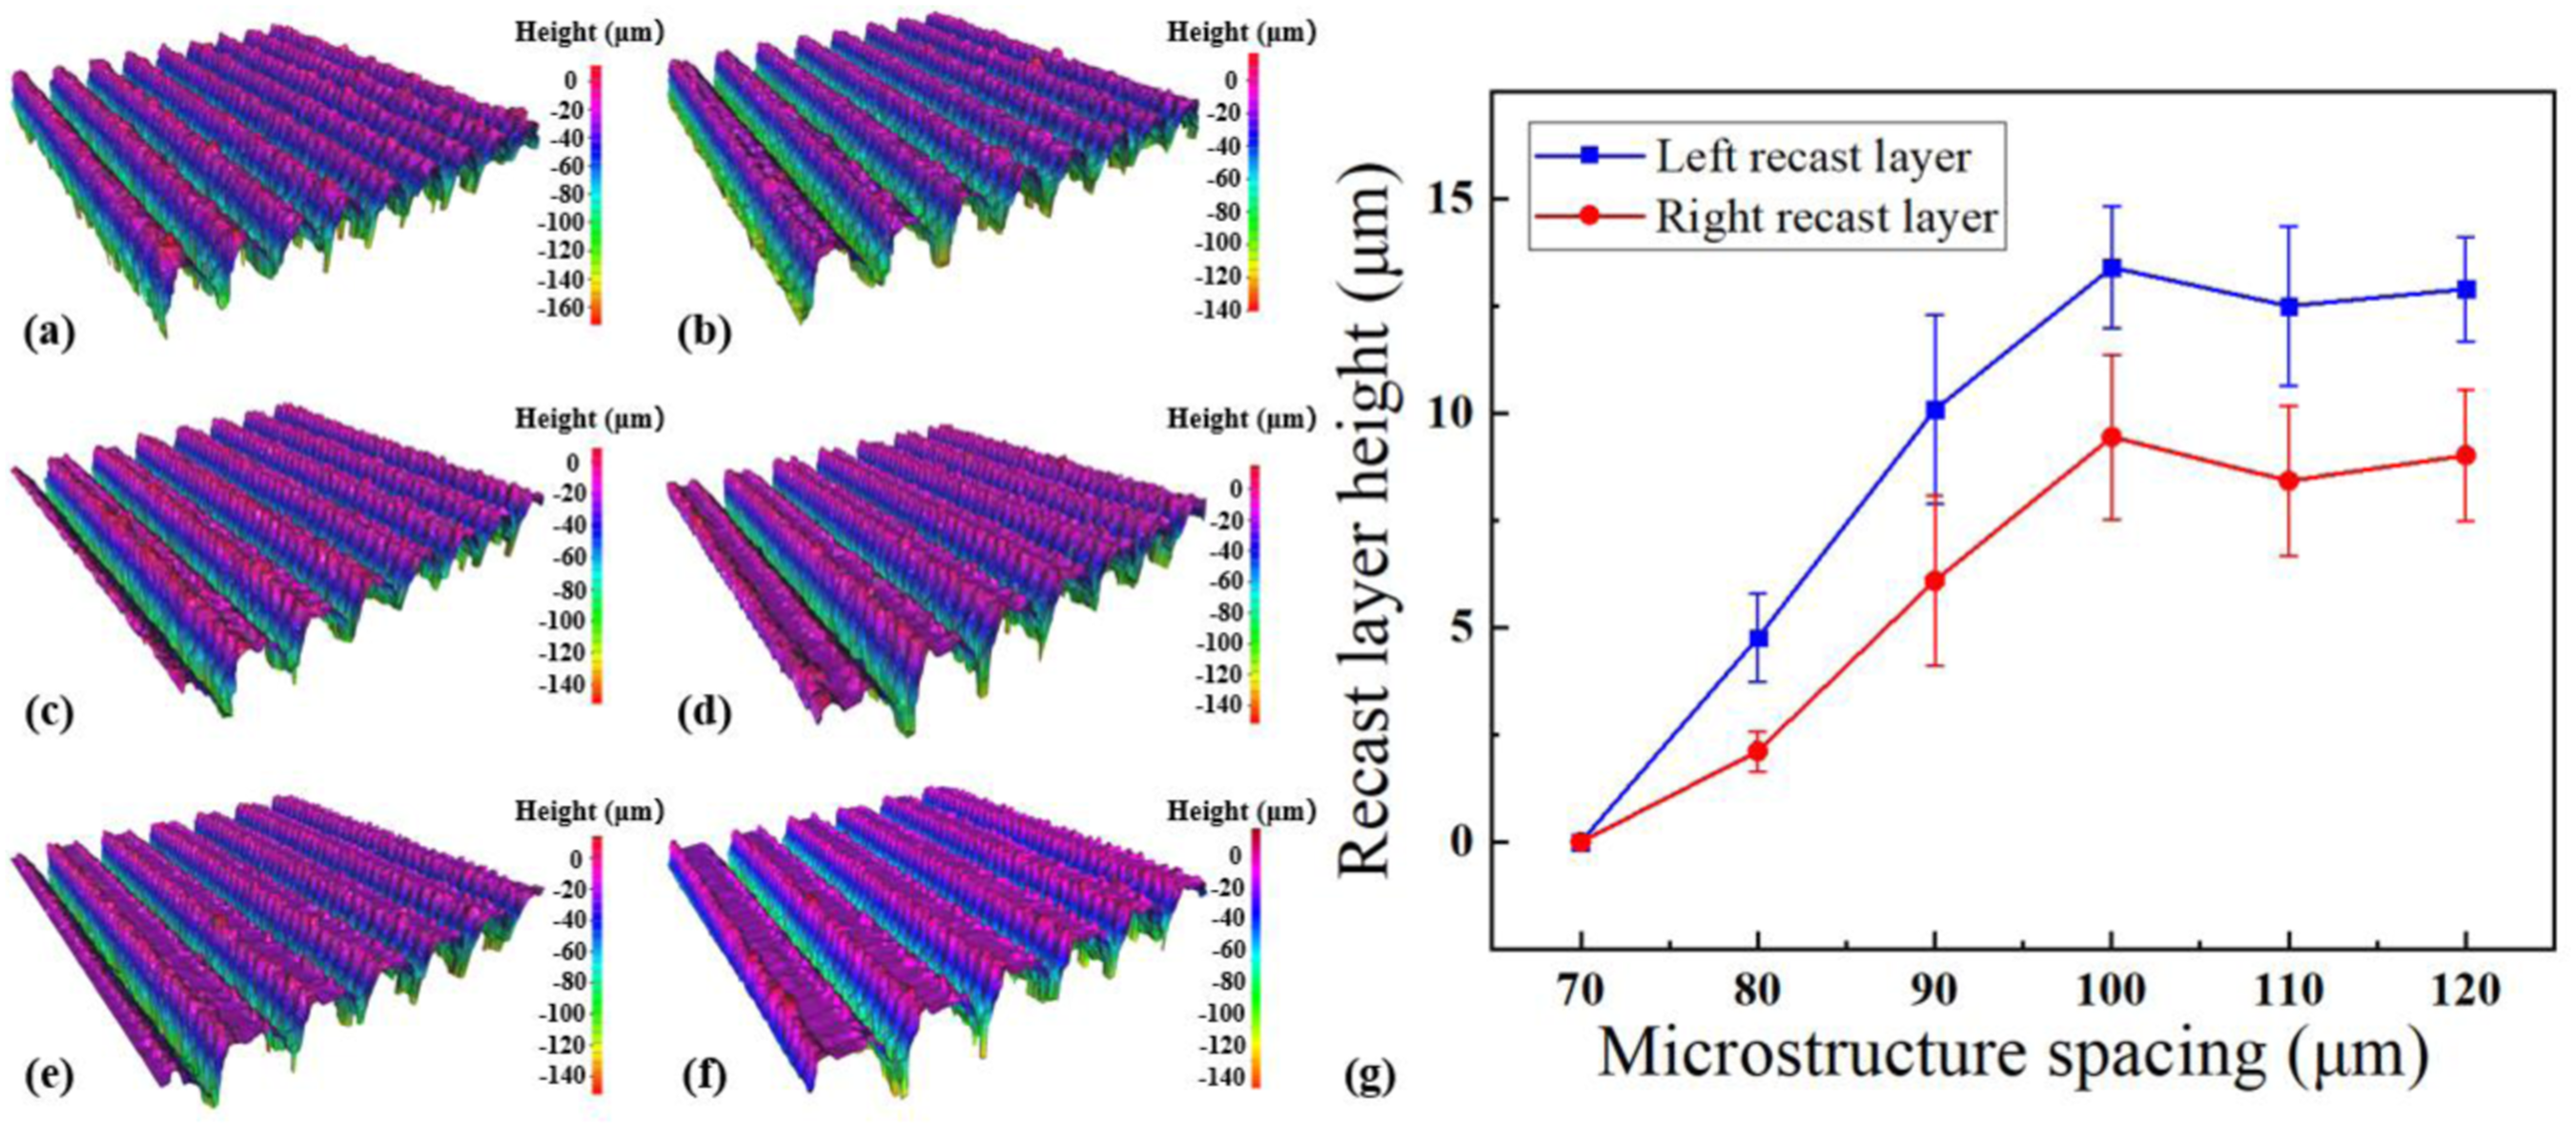
Effect of temperature on joint morphology and properties
The macroscopic morphology of CFRTP/Al alloy hot-pressing joints is shown in Figure 9(c), under interfacial pressure, molten polymer flows out of the interface at the joint, and there are no defects or damage is evident on the outer surfaces of the joint. Sagar et al. showed that the most important process parameter in the bonding of polymers to metals is temperature, as temperature decreases the viscosity of the polymer and increases the penetration of the polymer into the metal.
33
Therefore, in this paper, the effect of interface temperature on joint properties was investigated, in which the correlation of joint shear strength with temperature and holding time is shown in Figure 9. With the increase of temperature and holding time, the shear strength also increases gradually. The temperature increases so that the polymer on the surface of the CFRTP and the filler material reach molten state and bonding occurs, the increase in holding time allows the molten filler layer polymer to fully infiltrate the microstructure under external pressure, which increases the bonding strength between the CFRTP and the metal. However, with further increase in temperature, more fiber residues appeared on the fracture surface and the fracture location gradually occurred between the CFRTP, as shown in Figure 9(d). According to the literature,
34
the best temperature for CF/PEEK laminates is 400–420°C. When the temperature reaches 440°C, the interlaminar shear strength decreases due to thermal degradation of the polymer, and the fiber residue in the joint section gradually increases. Thus, the heating temperature of 420°C and the holding time of 3 min were taken as the optimal parameters, and the subsequent joining experiments were carried out. (a) and (b) Effect of temperature and time on the joining strength, (c) macroscopic morphology of the joint, (d) transformation of fracture surfaces at different temperature.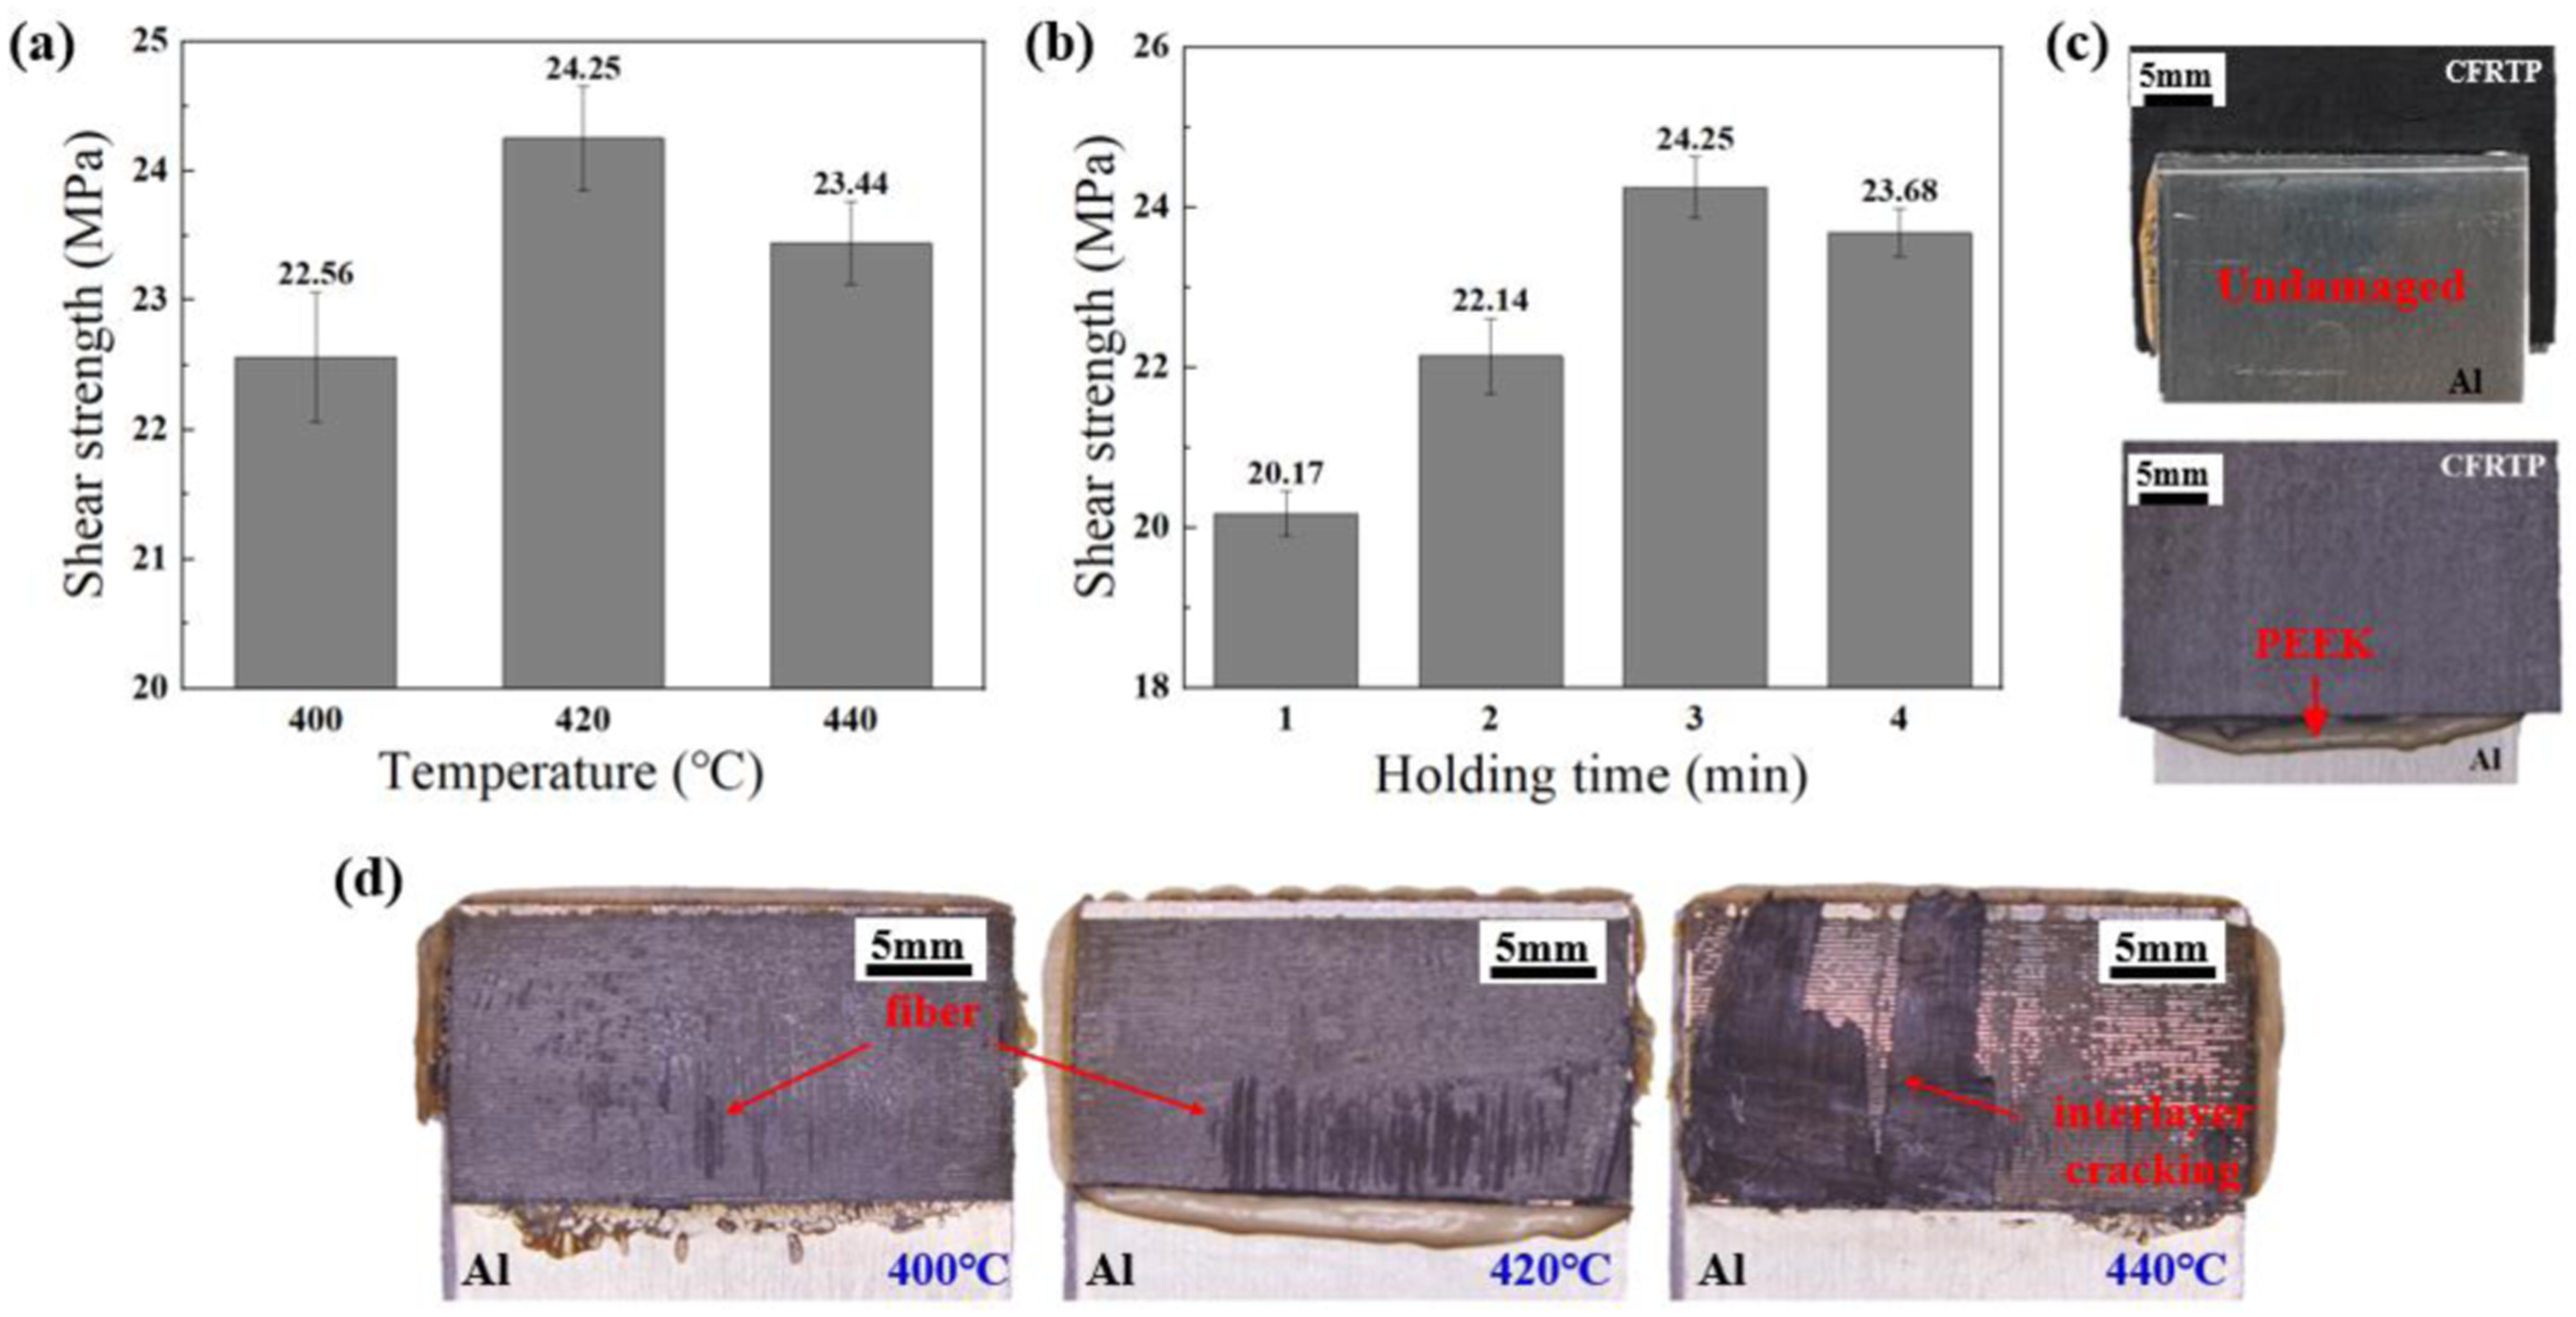
Microscopic morphology and mechanical analysis of joints
To analyze whether the microstructure can be fully infiltrated by polymer under the above parameters, the cross-sectional morphology of the Al/CFRTP joint is shown in Figure 10(a). Under external pressure, the molten polymer completely infiltrates the interior of the microstructure as well as the “groove” between the recast layers. The joint shear strength of the untreated smooth Al alloy connected with the CFRTP by hot-pressing is only 13.37 MPa, whereas the strength of the joint connection after laser texturing is greatly enhanced up to 25.05 MPa. The joint shear strengths corresponding to the different microstructure spacings S0 are shown in Figure 10(b). (a) The cross-sectional morphology of the CFRTP/Al alloy joint, (b) joint shear strength at different microstructure spacing S0.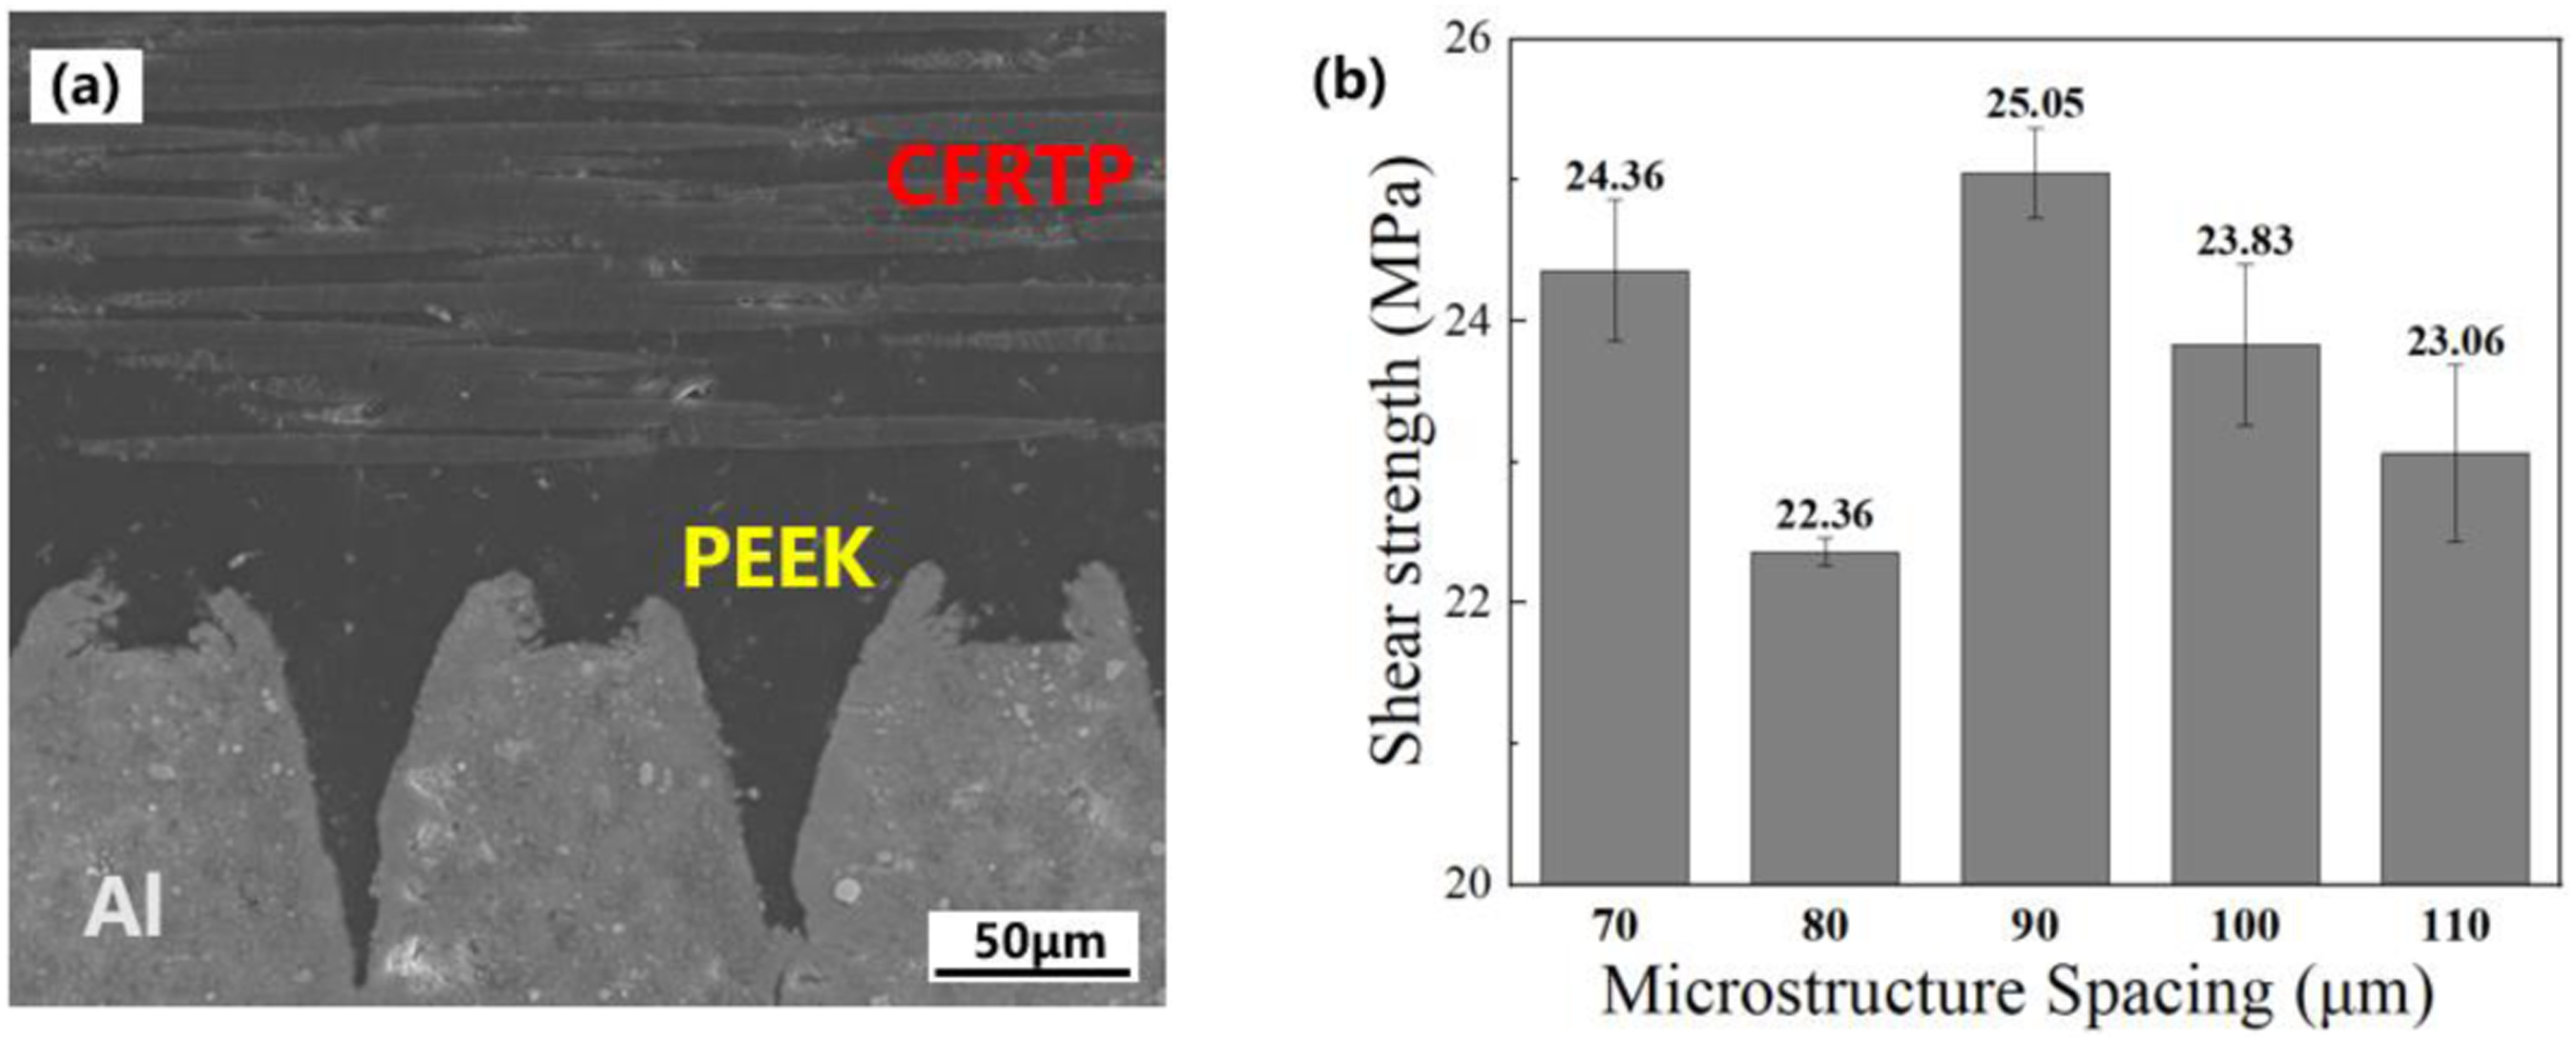
To analyze the load-bearing mode of polymer between recast layers at different microstructure spacing, the cross-sectional morphology of the joints with different microstructure spacing S0 is shown in Figure 11. When S0 = 70 μm, the microstructure on the Al alloy surface shows serrated shape, and polymer only infiltrates inside the microstructure to form mechanical interlocking, as shown in Figure 11(a). When S0 = 80 μm, the recast layer gradually appears on the surface of the Al alloy, the polymer bonding state between the recast layers presents three kinds: firstly, the recast layer is completely clogged inside, resulting in the inability of polymer to infiltrate; secondly, the recast layer forms small “V-groove,” which allows polymer to completely infiltrate between the recast layers; thirdly, cavity formed by the buildup of recast layers, which causes the polymer inside the recast layer to be isolated from the polymer outside, although the polymer has been infiltrated in the recast layer, but still can’t withstand the shear loads, as shown in Figure 11(b). At this point, only the second fully infiltrated state of polymer can withstand the shear load; the rest are considered as pores, which leads to a decrease in the joint shear strength compared to that of the joint at 70 μm microstructure spacing. When S0 = 90 μm, clear “groove” structure is formed between the recast layers, polymer completely infiltrates the microstructure and the recast layer, as shown in Figure 11(c). The polymer between the recast layers forms a whole with the external polymer layer, and the polymer between the recast layers can also withstand some of the shear load, and at this time the shear strength also reaches maximum 25.05 MPa. When S0 = 100 μm, the width of the “groove” between the recast layers becomes larger, but the large spacing results in more unprocessed areas between the two microstructures, as shown in Figure 11(d). According to the previous section, the shear strength of the joints increases with decreasing microstructure spacing, although double-scale microstructures are also formed at S0 = 100 μm, there is a larger unprocessed region compared to the joints at S0 = 90 μm, which leads to a decrease in the load-bearing capacity of the joints. Therefore, when S0 ≥90 μm, the strength of the joint gradually decreases with the further increase of the microstructure spacing. Cross-sectional morphology of joints with different microstructure spacing S0: (a) 70 μm; (b) 80 μm; (c) 90 μm; (d) 100 μm.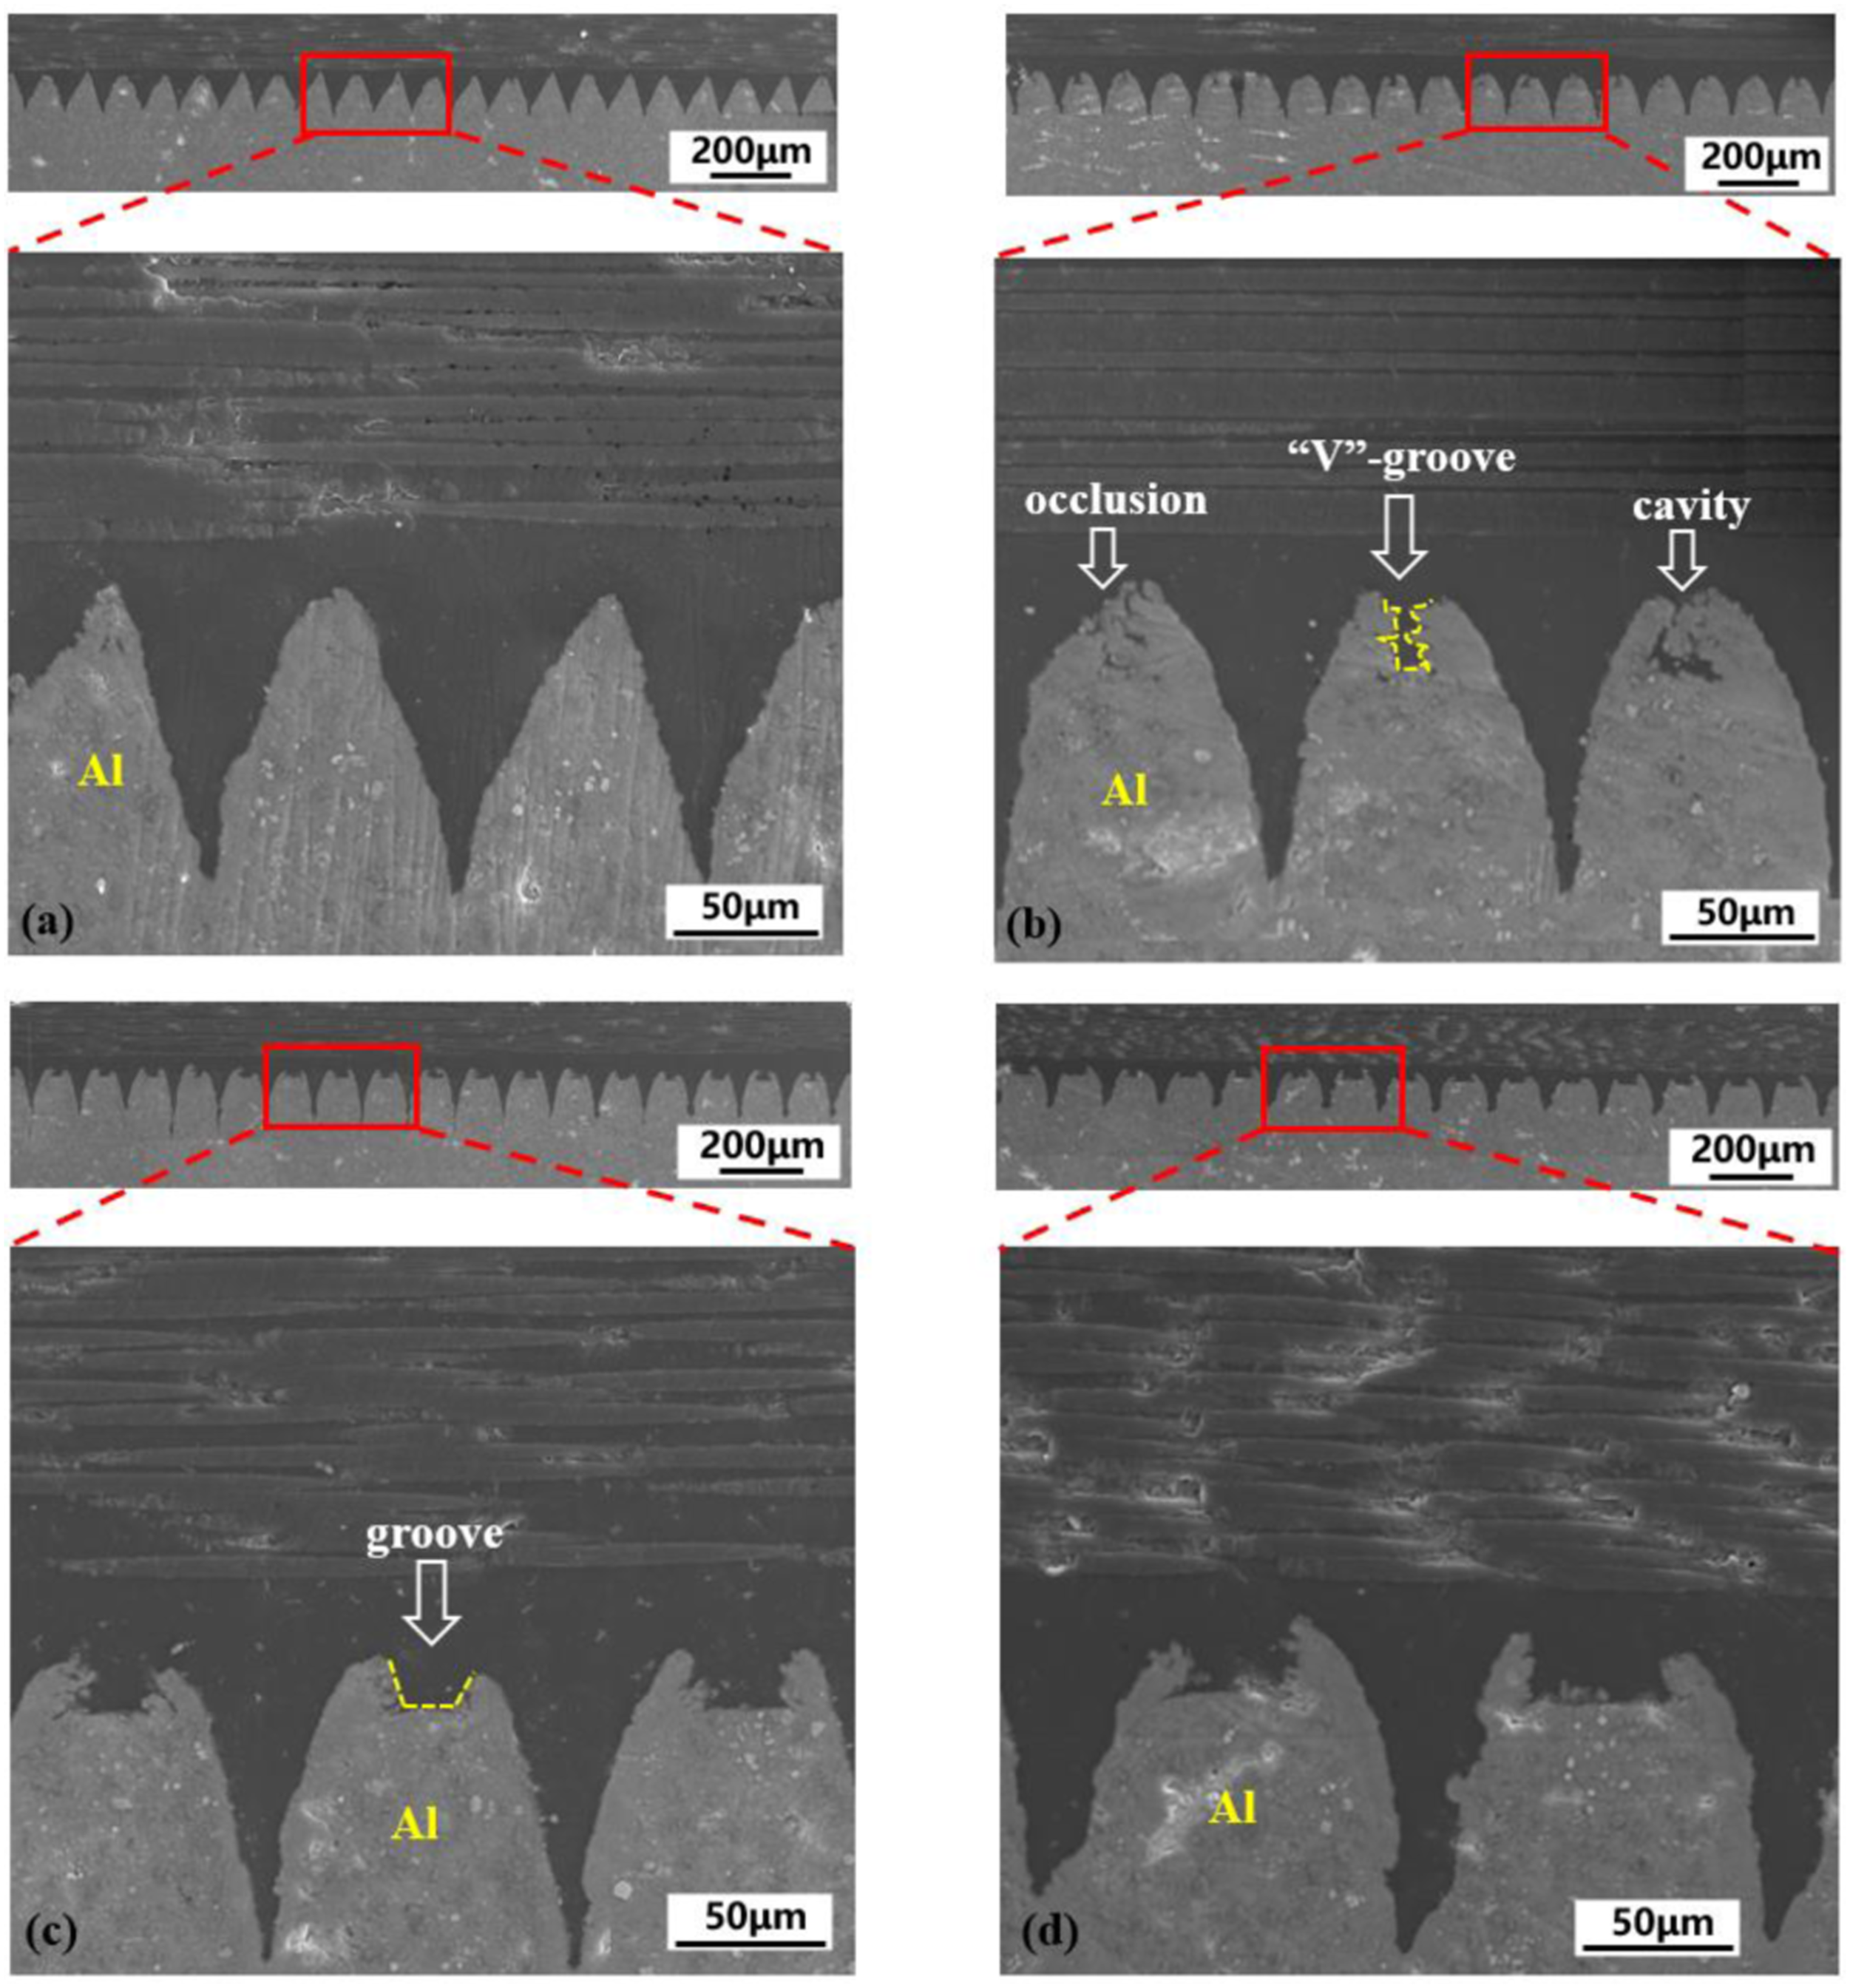
The effect of microstructure spacing on the surface morphology of Al alloys is summarized by the analysis of the cross-section morphology as shown in Figure 12. When the actual microstructure spacing S >0, a “groove” structure is formed between the recast layers on the surface of Al alloy as shown in Figure 12(a) and (b). When S = 0, a “V-groove” structure is gradually formed between the recast layers as shown in Figure 12(c). When polymer infiltrates these grooves, mechanical interlock will be formed, at which time, the “groove” and the processed microstructure form double-scale microstructure. When S <0 (U = 0), the “groove” structure disappears, the recast layer is piled up with each other to cover the metal surface, thus forming regular serrated microstructure as shown in Figure 12(d). Two types of morphology can be formed by controlling the microstructure spacing: double-scale microstructure and serrated microstructure. Schematic surface morphology of Al alloy with different microstructure spacing: (a)–(c) double-scale microstructure and (d) serrated microstructure.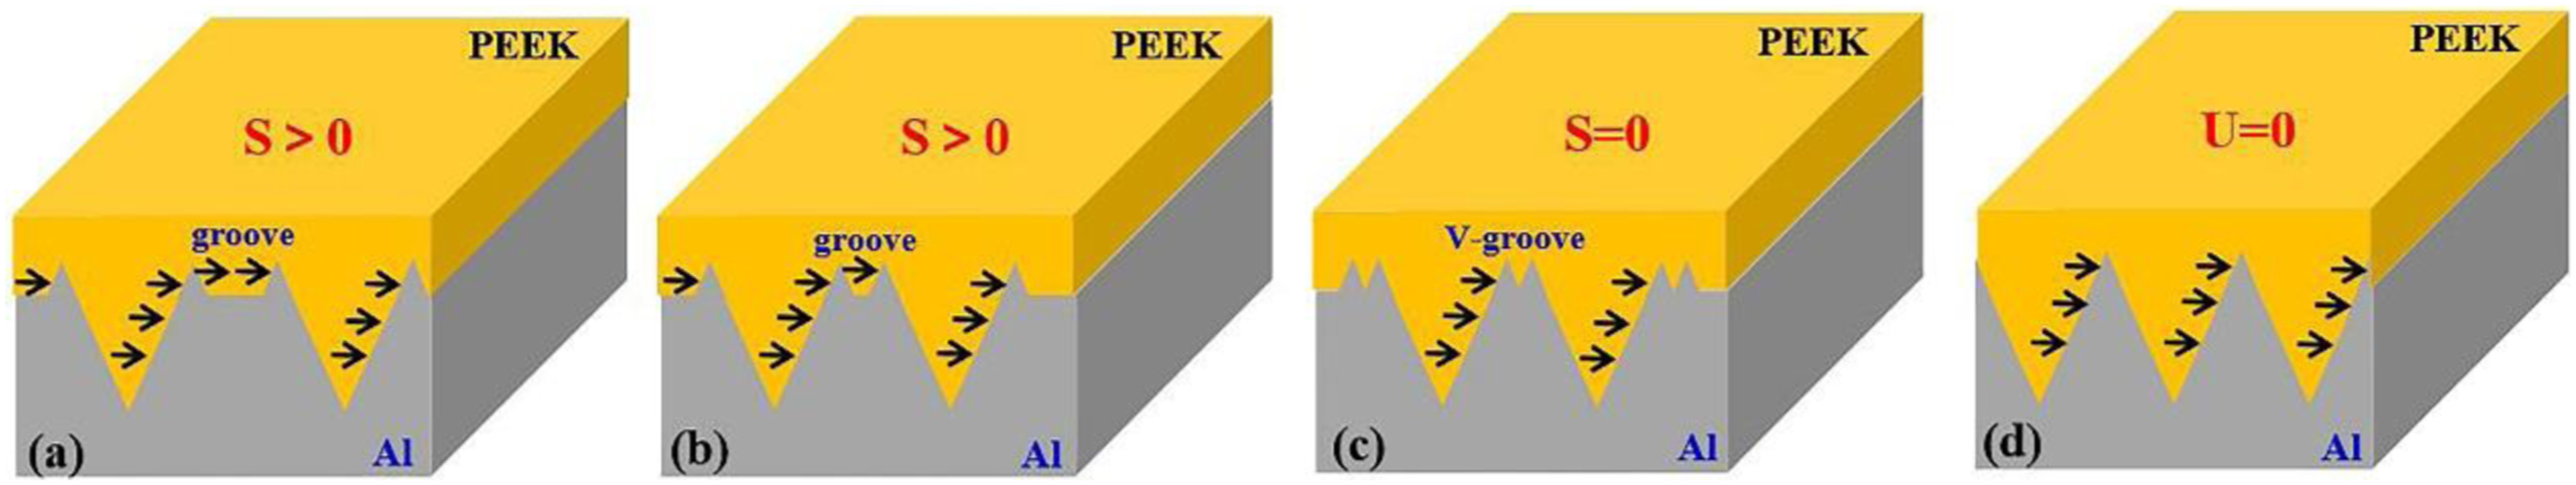
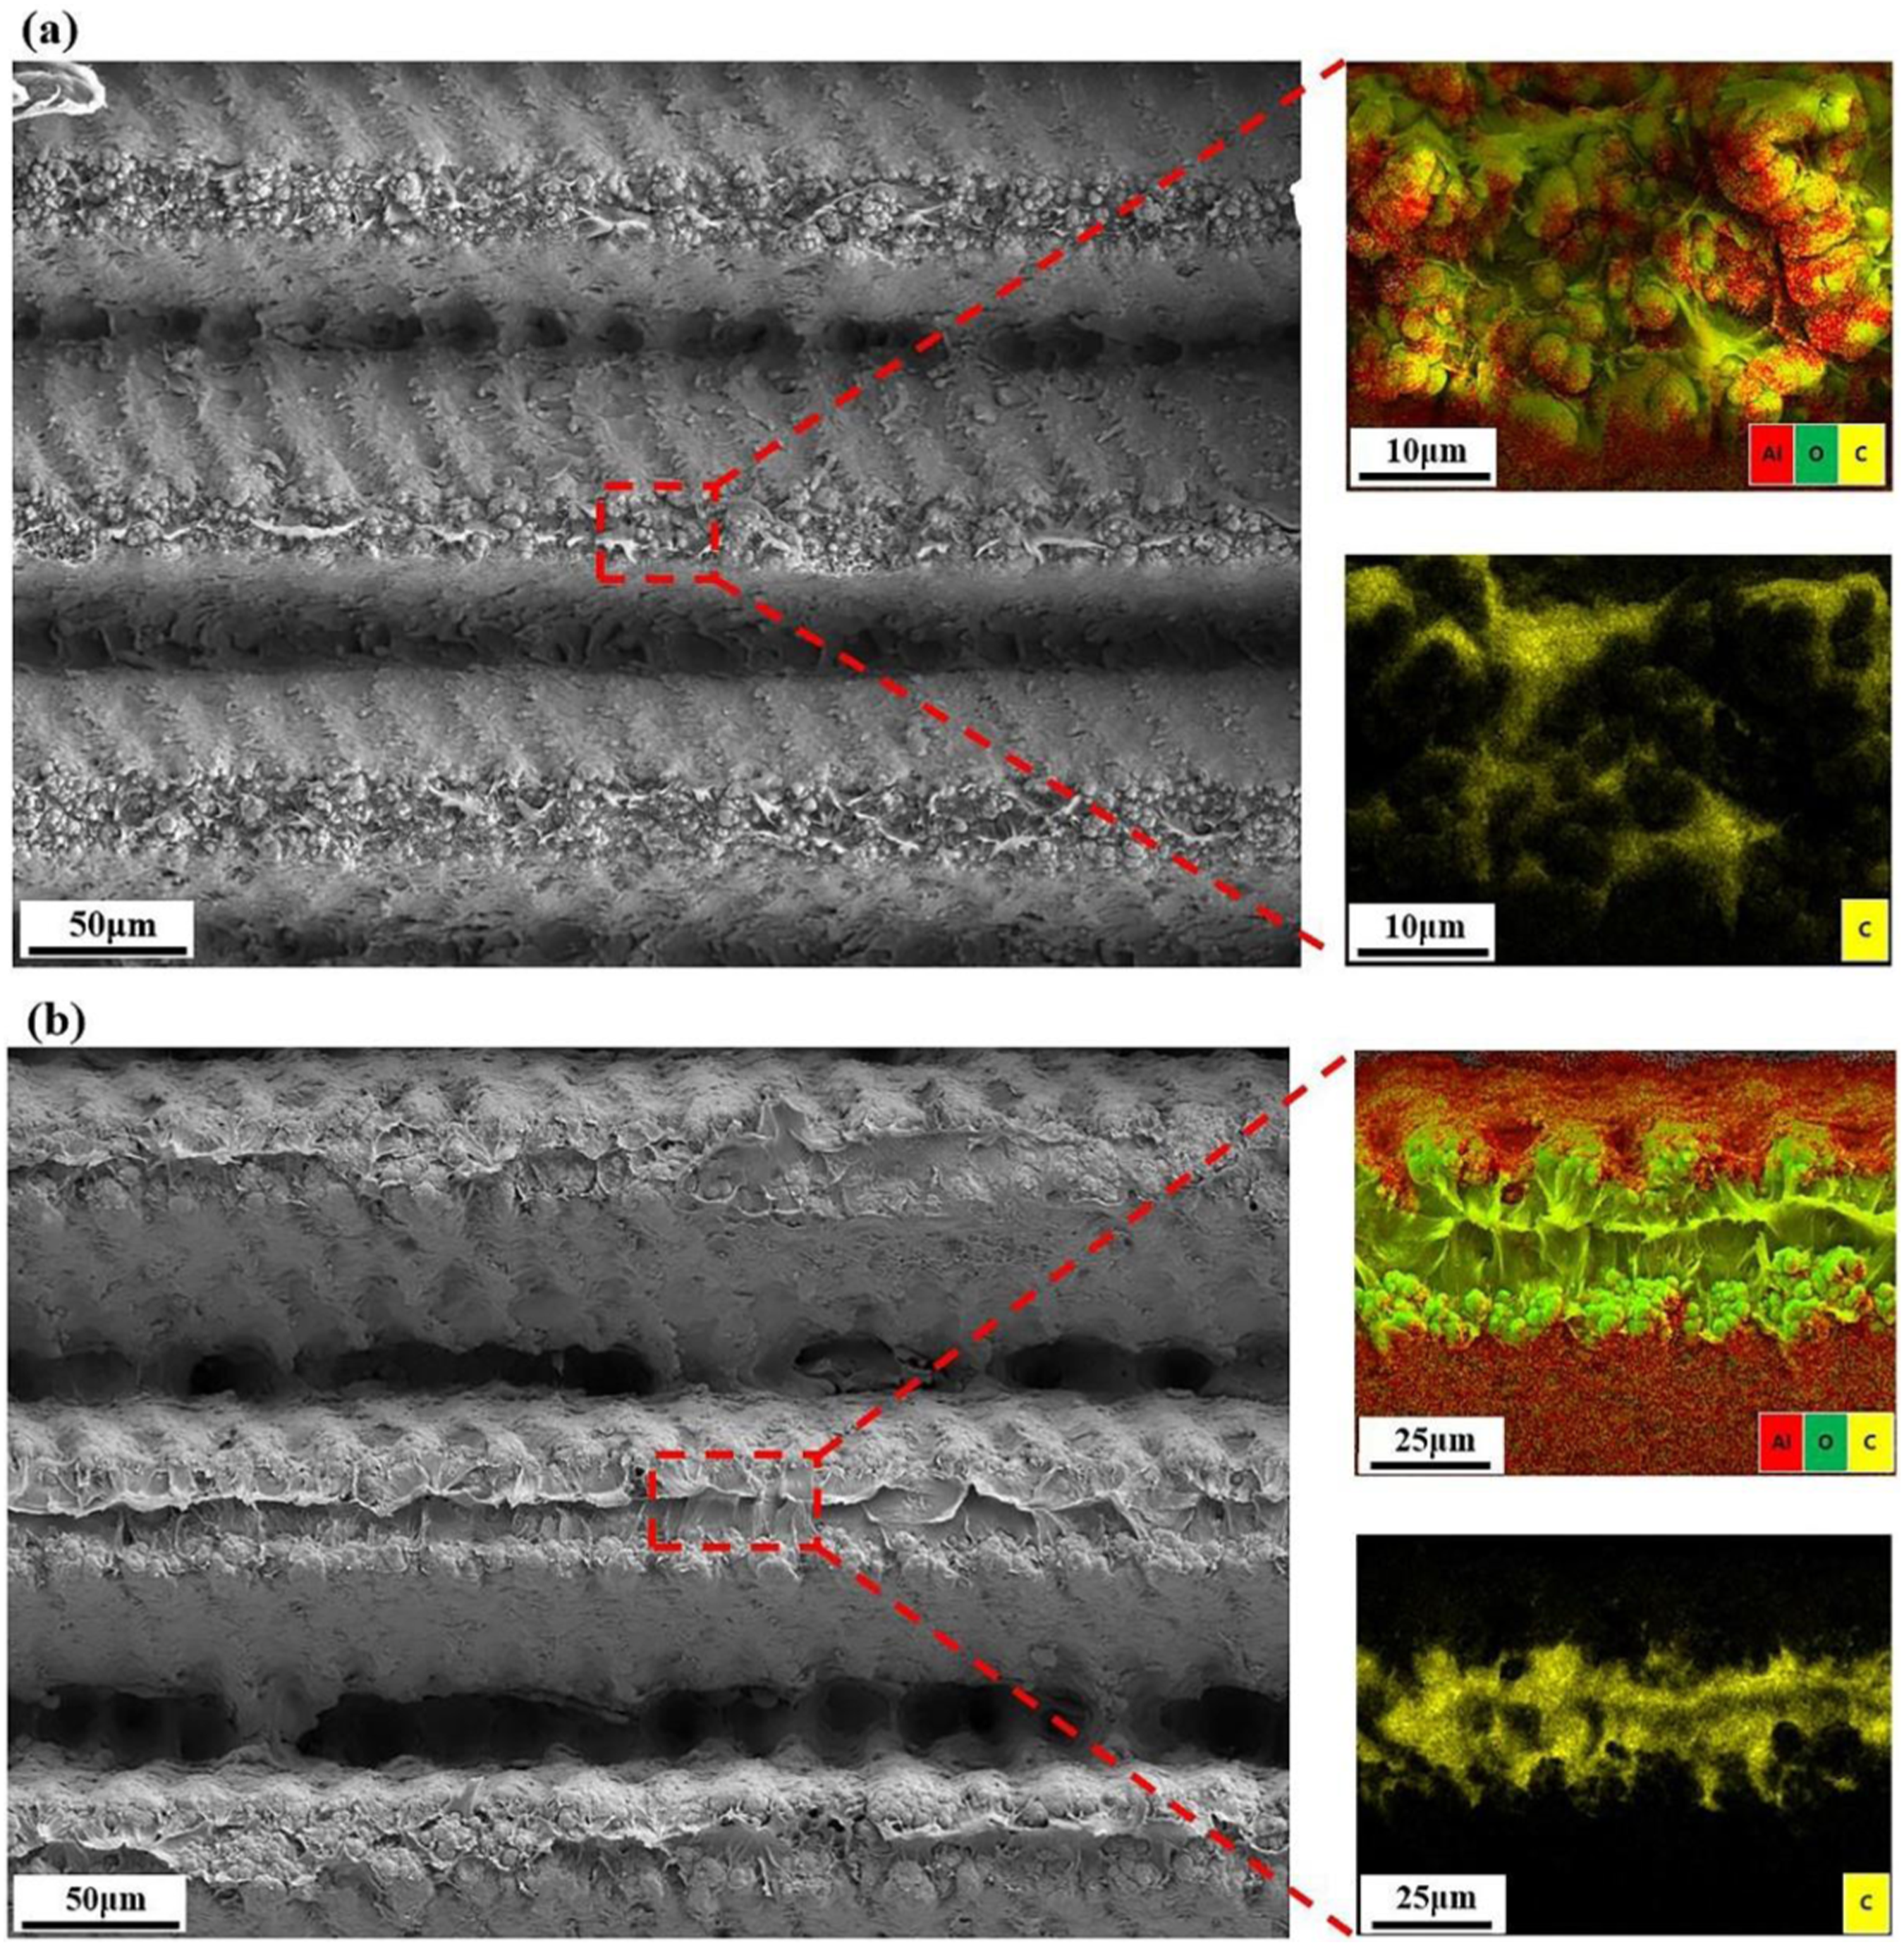
The change of joint failure mode is an important reason for the significant difference in shear strength. To prove that the “groove” between the recast layers improve the load-bearing performance of the joints, the failure modes of joint fracture surfaces with different microstructure spacings were further analyzed, and the results are shown in Figure 13. There is no polymer residue in the microstructure on the surface of the Al alloy (area ①), while the polymer fracture modes in the “groove” (area ②) vary with the change of the microstructure spacing S0. When S0 = 70 μm, because the recast layers don’t form “groove” structure, only part of the polymer bond remains at the top of the microstructure, and adhesive failure occurs in most areas of the fracture surfaces. When S0 = 80 μm, the fracture surfaces shows the gradual formation of disordered microstructure between the recast layers (area ②), from the SEM elemental analysis, it can be seen that part of polymer (yellow represents carbon) appears in area ②, as shown in Figure 14(a). Wang’s study also analyzed the infiltrated state of the polymer on microstructures, and similar conclusions were obtained.
32
At this time, it can be inferred that the polymer in area ② did not form a stable mechanical interlock with the polymer in the middle layer, and the cohesive failure occurred in area ②. When S0 = 90 μm, the fracture surface shows that the recast layer forms an obvious “groove” structure, and the SEM elemental analysis shows that there is a large amount of polymer residue in area ②, as shown in Figure 14(b). Thus cohesive failure occurs in area ②, and the failure location is located in the inside of polymer. When S0 = 100 μm, the “groove” structure formed in the recast layer of the fracture surfaces is more obvious, and there is no polymer residue in area ②, so it is the same with the polymer failure in area ①, which is the adhesive failure. Fracture surface morphology and its failure mode with different microstructure spacing S0: (a) 70 μm, (b) 80 μm, (c) 90 μm, (d) 100 μm. SEM mapping results for microstructure spacing of (a) 80 μm and (b) 90 μm.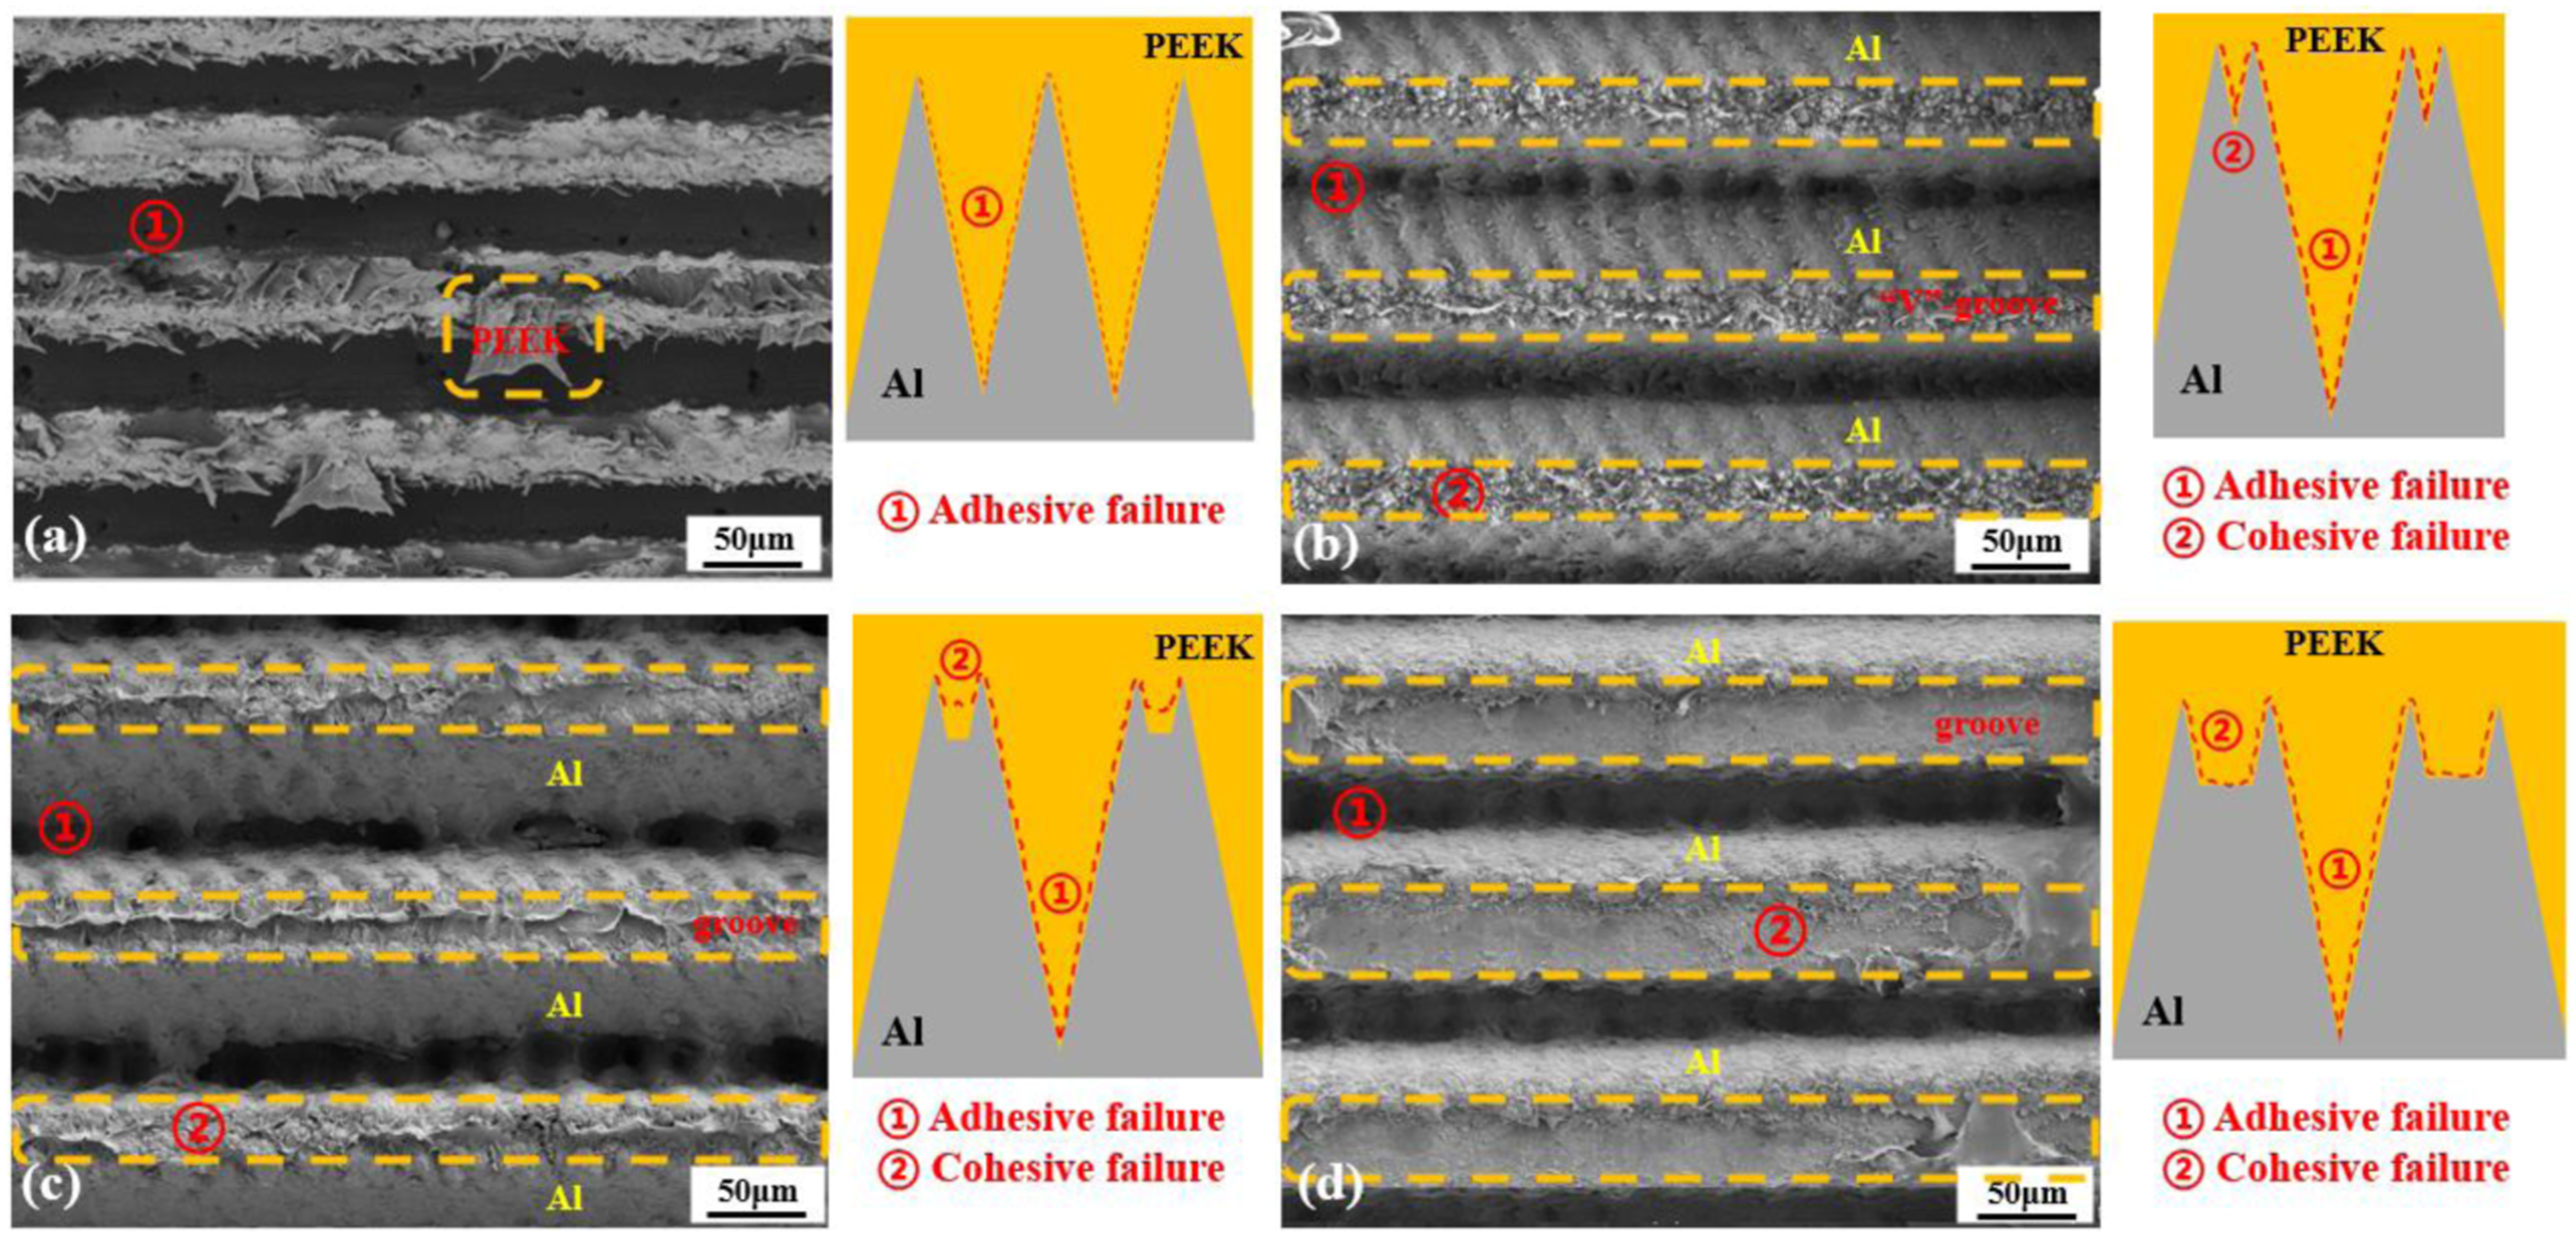
Based on the above analyses and the literature,
35
two different modes of polymer fracture in the “grooves” can be summarized, as shown in Figure 15. From Figure 13(b) and (c), when S0 is small, the polymer between the recast layers is fractured with the joint action of bending moment and shear force. The fracture location is the polymer root or the middle position of the polymer, so there is a polymer residue in area ② and the polymer undergoes cohesive damage, the force model is shown in Figure 15(a). From Figure 13(d), when S0 is too large, all the parts of the polymer can withstand sufficient concentrated stress, the polymer is dislodged from the recast layers, and there is only a very small amount of polymer adhering to area ②. The force model is shown in Figure 15(b), where the adhesive failure occurs in the recast layers. Fracture position of polymer in the “groove”: (a) root or middle of polymer, (b) polymer dislodge.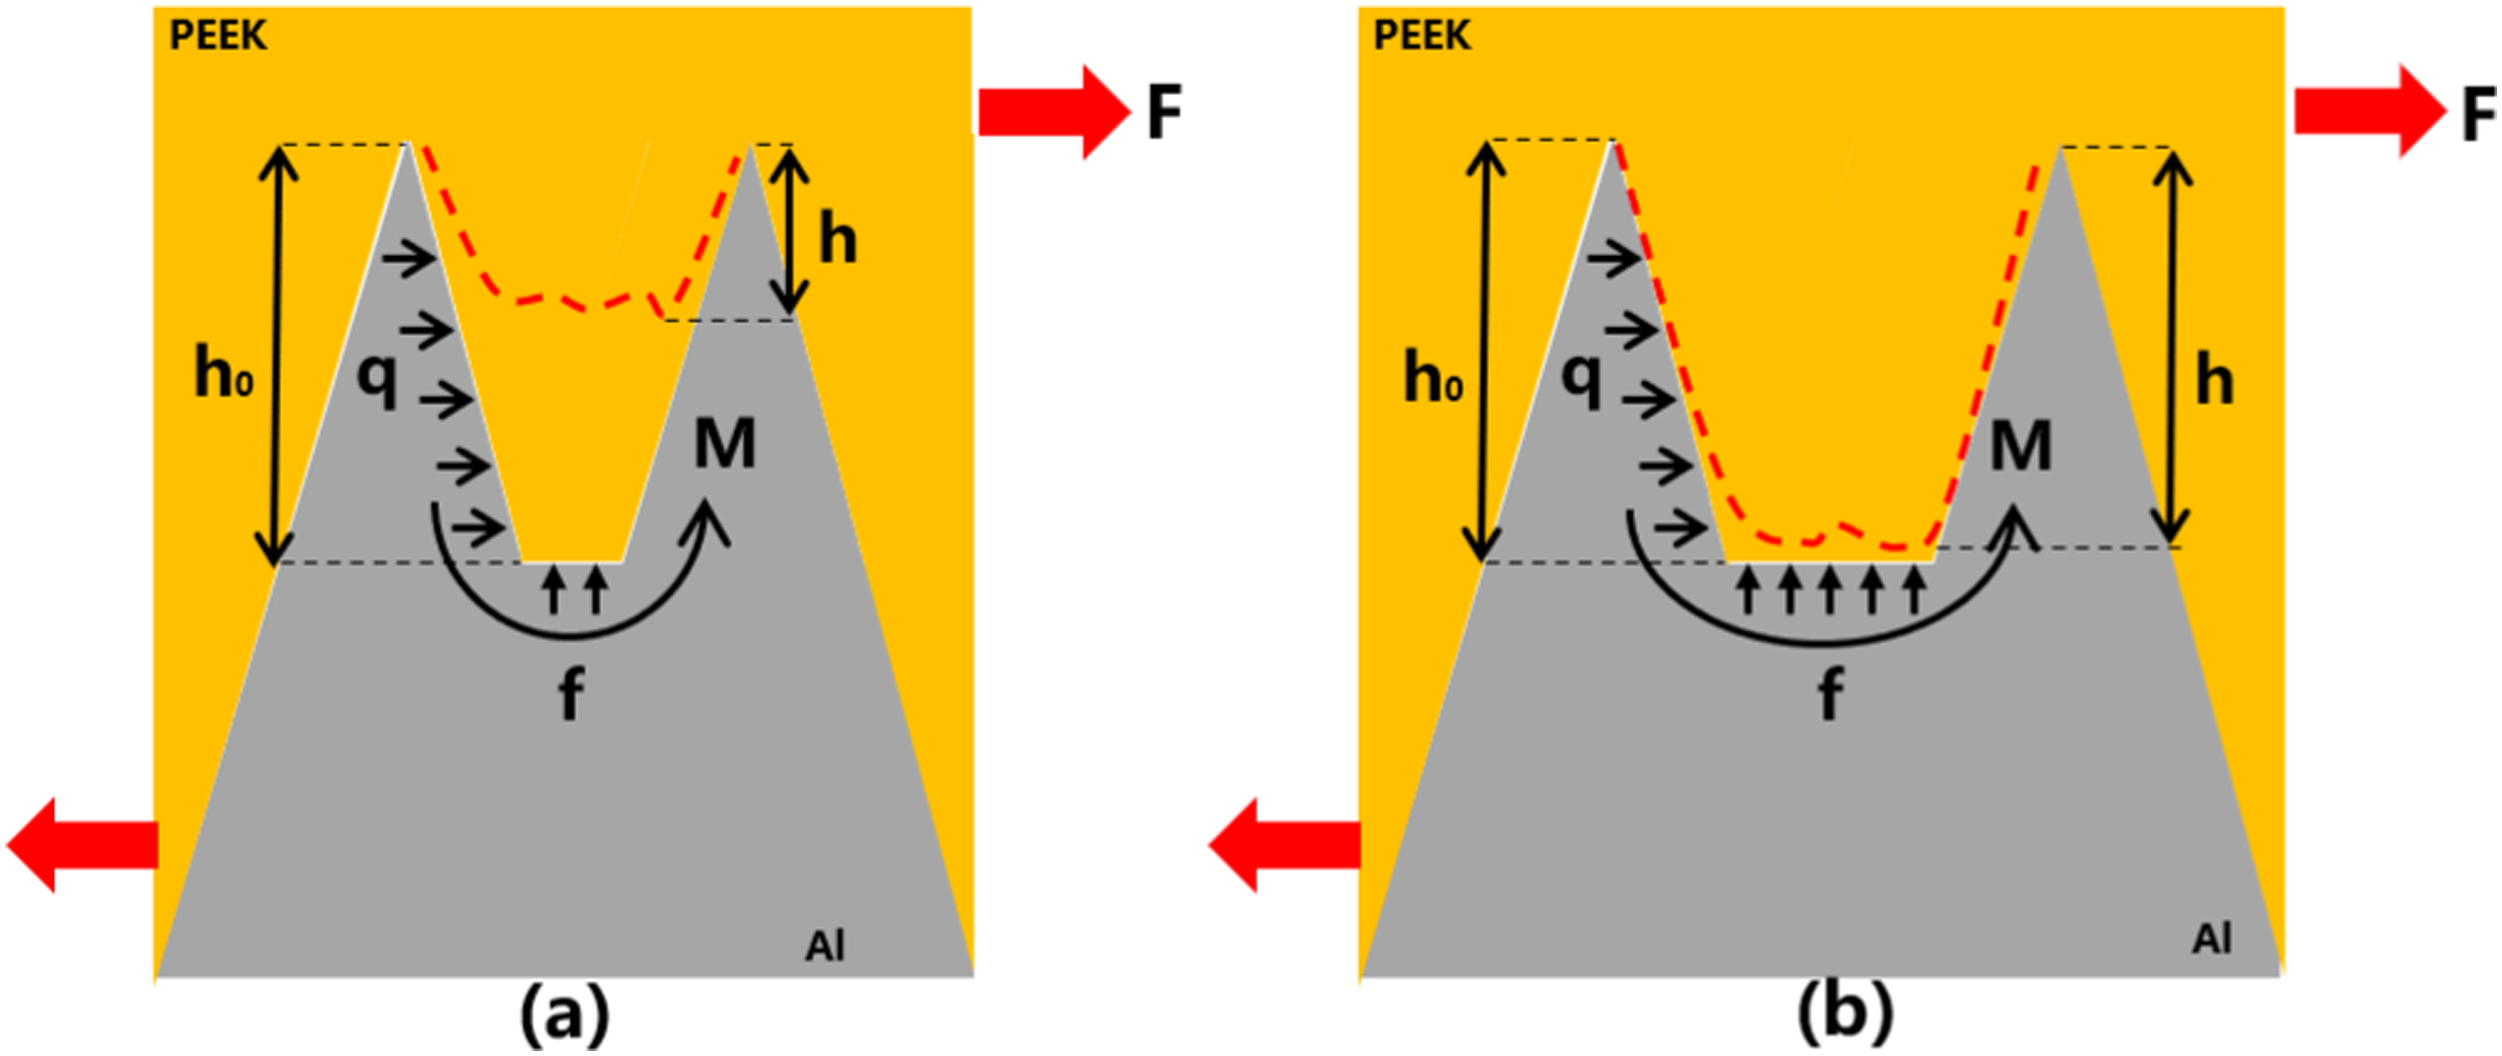
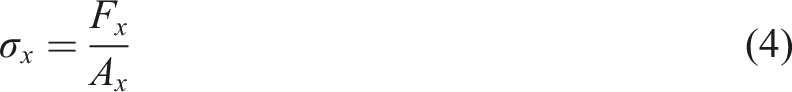
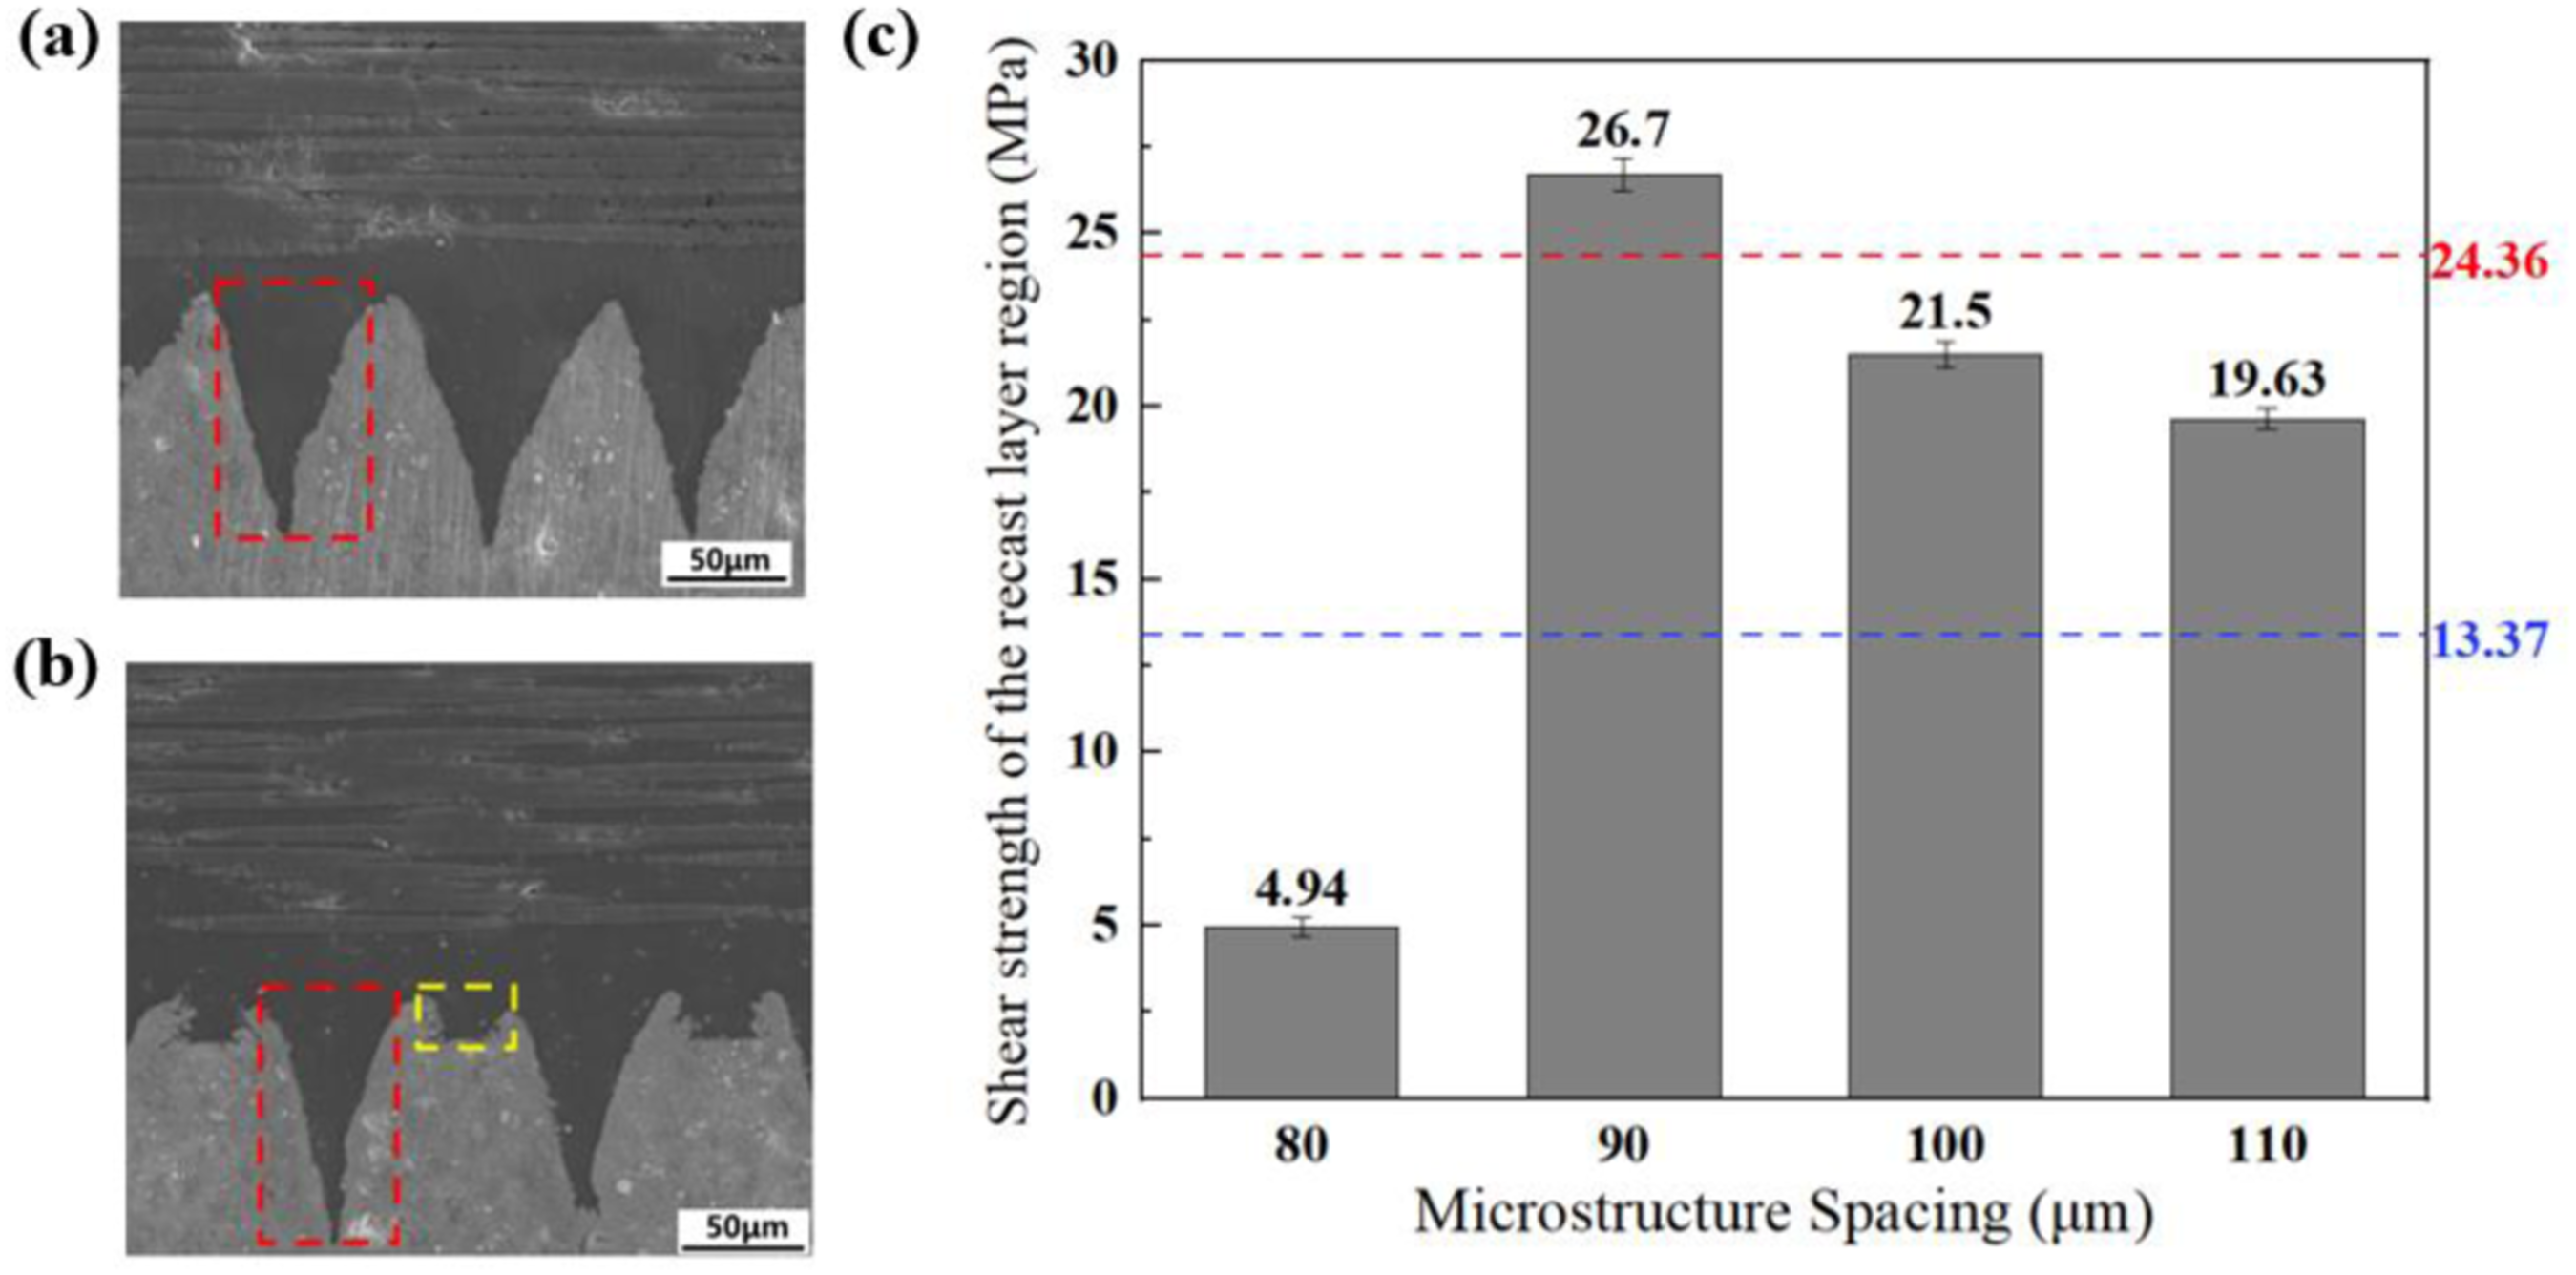
In order to measure the effects of the recast layer and the microstructure on the shear strength of the joints separately, the whole region is divided into the microstructure region and the recast layer region, as shown in Figure 16(a) and (b). Since there is no recast layer structure at the joint at S0 = 70 μm, the load carrying capacity f
0
of a microstructure can be obtained by dividing the fracture force of the joint at S0 = 70 μm by the number of microstructures, as shown in equation (1). The shear force in the microstructure region of the other joints as well as in the recast layer region can then be obtained sequentially as shown in equation (2). Based on the width and number of microstructures, the area of the microstructure region as well as the recast layer region can be calculated as shown in equation (3). Finally, the shear strength σx of the recast layer area can be calculated as shown in equation (4). Cross sections at different microstructure spacing: (a) 70 μm and (b) 80 μm, (c) the shear strength of the recast layer region with different microstructure spacing.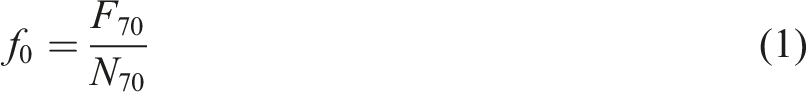


The long-pulse laser texturing is rapid, and the resulting recast layer will form a dual-scale microstructure that can further enhance the strength of the fusion joint between the CFRTP and the metal, so this laser texturing process can advance the industrial application of the fusion joint technology between the metal and the CFRTP.
Conclusions
The effects of recast layer formation mechanism and microstructure spacing on the shear properties of Al alloy/CFRTP joints were investigated. The main conclusions are as follows: 1. The relationship between laser texturing parameters and microstructure morphology was obtained. The laser texturing depth is the most direct cause of the recast layer height. The laser transverse micro-offset only leads to an increase in the width of the microstructure and does not affect the height of the recast layer on both sides. 2. The relationship between the microstructure spacing S0 and the surface morphology of Al alloy was obtained. When S0 = 70 μm, there is no recast layer structure, the surface microstructure of Al alloys is regularly serrated; when S0 = 80 μm, the recast layers pile up with each other to form messy “groove” structure; when S0 ≥90 μm, clear “groove” structure is formed between the recast layers, and the Al alloy surface appears double-scale microstructure structure. 3. When the microstructure spacing S0 = 90 μm, polymer can completely infiltrate the “groove” structure between the recast layers, and the cohesive failure of polymer in this region, at this time, the joint connection strength of the highest 25.05 MPa. When S0 = 80 μm, the polymer inside the recast layer is isolated from the outer polymer layer, resulting in the inner polymer not being able to withstand the load, currently the joint strength is the lowest at 22.36 MPa. 4. The shear strength in the microstructure region is 24.36 MPa, and at S0 = 90 μm, the polymer in the “groove” undergoes cohesive failure and the shear strength in the region of the recast layer reaches maximum value of 26.7 MPa. When S0 ≥100 μm, the polymer in the “groove” changes from cohesive failure to adhesive failure, and the shear strength of the recast layer region gradually decreases. Cohesive failure occurs between only some of the recast layers at S0 = 80 μm when the shear strength in the region of the recast layer is the lowest at 4.94 MPa.
Footnotes
Declaration of conflicting interests
The author(s) declared no potential conflicts of interest with respect to the research, authorship, and/or publication of this article.
Funding
The author(s) disclosed receipt of the following financial support for the research, authorship, and/or publication of this article: This work was supported by National Natural Science Foundation of China [grant number 52090053]; Science and Technology Innovation Foundation of Dalian [grant number 2021RD08, 2022JJ12GX027].