
Abstract
In this study, zinc oxide nanoparticles (ZnO) were successfully incorporated into polystyrene (PS) using a combination of solution mixing and hot-pressing methods, yielding a range of PS/ZnO nanocomposites. Characterization using X-ray diffraction (XRD) techniques, scanning electron microscopy (SEM), impedance spectroscopy (IS), Raman spectroscopy (RS), thermogravimetric analysis (TG) and differential scanning calorimetry (DSC) revealed distinct features. XRD analysis of nanocomposites showed both weak and high-intensity peaks at different scattering angles (2θ = 8°–11° and 20°–22°), indicating amorphous phases PS phases with varying sizes of nanoparticles. It has been proved that the addition of higher amounts of ZnO leads to the disappearance of the maximum of weak intensity in the studied substance (PS/10%ZnO), which is due to the formation of microcrystalline regions that lead to the formation of sharp maxima with high intensity. It was determined that the increase in the concentration of ZnO up tp 5 % volume content enhances the dielectric permeability (ε) and polarization capacity of polystyrene. It is believed that, depending on the ZnO concentration, the increased dielectric permeability and polarizability are attributed to phases with different charge densities at the boundaries between the ZnO nanoparticles and the matrix, which promotes additional polarization and contributes to the overall enhanced permittivity. This formation of interfacial boundaries is evident from the stepwise shape of the thermogravimetric (TG) curve with increasing ZnO content. The introduction of ZnO nanoparticles into PS results in the formation of new phases, altering the intensity and position of peaks observed at frequencies of 376 cm⁻1 and 485 cm⁻1 in the Raman scattering spectrum, partially shifting towards higher frequencies.
Introduction
The pursuit of enhancing the properties of both organic and inorganic constituents highlights the growing demand across numerous technological areas.1–3 Tailoring the properties of polymers through the careful selection and incorporation of nanoparticles has become a focal point, aiming for optimized performance in specific applications.4–7 In particular, the addition of inorganic nanomaterials, such as ZnO nanoparticles, into organic polymer matrices has yielded nanocomposites with remarkable mechanical, magnetic, and thermal stability.8–10 Known for their broad band gap, hexagonal wurtzite crystal structure, and outstanding thermal conductivity, ZnO nanoparticles are ideal for enhancing material functionalities.11,12 Polystyrene, a widely utilized polymer known for its versatility, lightweight nature, and excellent processability, 13 emerges as a promising candidate for incorporating ZnO nanoparticles. This combination creates polystyrene/zinc oxide (PS/ZnO) nanocomposites, offering novel material properties advantageous across diverse fields such as optoelectronics, sensors, and biomedical engineering.13–15 In recent years, considerable research efforts have been directed towards the synthesis, characterization, and application of PS/ZnO nanocomposites.15–17 Studies have demonstrated the successful fabrication of PS/ZnO nanocomposites with tailored properties through various synthesis techniques such as in situ polymerization, 15 electrospinning 16 and solution blending. 17 These efforts have led to advancements in understanding the morphological, structural, and mechanical properties of the nanocomposites, paving the way for their widespread utilization in diverse technological applications. For instance, Chen et al. demonstrated that melt-blending PS with nanoscale ZnO enhances antistatic properties and flexural characteristics, thereby broadening application potential. 18 Another investigation synthesized transparent ZnO/PS nanocomposite films exhibiting optical limiting behavior due to nonlinear absorption, highlighting their potential for sensor protection applications. 19 Moreover, spin-coated PS/ZnO nanocomposite films have been shown to possess high transparency and UV-shielding properties, with improved thermal stability attributed to the PS matrix’s surface modification of ZnO nanoparticles. 20 Furthermore, the synergistic effect of ZnO nanoparticles and organonanoclay (ONC) as a biodegradable promoter has been explored, resulting in enhanced photo- and biodegradation efficiency of PS films. 21 Collectively, these studies highlight the multifaceted properties and applications afforded by PS/ZnO nanocomposites, from optoelectronics to sustainability initiatives. Furthermore, investigations into the dielectric properties of PS/ZnO nanocomposites have garnered significant interest. Analysis of dielectric constants and loss tangents as functions of temperature and frequency is crucial for optimizing the design and functionality of electronic devices employing PS/ZnO nanocomposites. While earlier research has focused on individual elements such as thermal stability, optical qualities, and antistatic behavior, our study combines several evaluations to provide a comprehensive knowledge of the nanocomposites’ behavior. The aim of the present work is to synthesize PS/ZnO nanocomposites with varying ZnO nanoparticle volume contents and explore their impact on the dielectric and thermal properties of the resulting composite. Impedance spectroscopy (IS) and thermogravimetric analysis (TGA) and differential scanning calorimetry (DSC) methods, respectively, were used to examine the influence of ZnO nanoparticles on the dielectric and thermal characteristics, while energy-dispersive X-ray spectroscopy (EDX), Raman spectroscopy (RS) and X-ray diffraction (XRD) were used to confirm the composition of the synthesized nanomaterials.
Materials and methods
Materials
All chemicals were utilized as received without undergoing purification. Polystyrene (PS) with CAS number 9002-86-2 is characterized by a density of 1.04 g/cm3, a melting temperature range of 150°C–220°C, a flash point of 625°C, an ignition temperature of 500°C, and an auto-ignition temperature exceeding 1100°C. Tetrahydrofuran (THF) with product code 143,537 was also used as received. Zinc oxide nanoparticles with a particle size ranging from 10 to 30 nm were procured from SkySpring Nanomaterials, Inc.
Synthesis of polymer nanocomposites
The polymer nanocomposite materials were synthesized via combination of two methods, namely solution-mixing and hot-pressing process. Initially, polystyrene was dissolved in tetrahydrofuran (THF), its organic solvent. Zinc oxide nanoparticles, with varying volume contents of 1%, 5%, and 10%, were accurately weighed and added to the polystyrene-THF solution. The mixture underwent vigorous stirring for 2 h to ensure the thorough dispersion of ZnO nanoparticles within the PS-THF solution. Subsequently, the resulting mixture was poured into a Petri dish and left to air-dry for the entire day. To completely remove the solvent from the polymeric matrix, the nanocomposites underwent further drying in a vacuum oven at room temperature for an hour. Thin films of the nanocomposites were then obtained by employing the hot pressing method at the melting temperature of PS (453 K) and a pressure of 10 MPa. Cooling of the films post-hot pressing was achieved by immersion in water.
Instrumentation
X-ray diffraction analysis was conducted using a Rigaku Mini Flex 600 XRD diffractometer at ambient temperature. For all experiments, Cu Kα radiation operating at 15 mA and 30 kV was employed. The samples were scanned within the 10–90° range of the Bragg angle 2θ.
The morphology of the surface of the nanocomposites was examined by scanning electron microscope (SEM; JEOL JSM-6610 LV), to study the dispersion and size of nanoscale zinc oxide powder in the polymer. Scanning was conducted at an accelerating voltage of 30 kV.
The dielectric permittivity of the nanocomposites was measured using an immittance meter, specifically the MNIPI E7-20, which applies a broadband meter to measure the frequency dependence of capacitance and dielectric loss. These measurements were conducted at a temperature of T = 293 K within the frequency range f = 25 Hz—1 MHz.
Differential scanning calorimetry (DSC) and thermogravimetric analysis (TG) experiments were performed in the temperature range T = 20÷500°C with a STA3000 Synchronous Thermal Analyzer device at a heating rate of 298 K/min. During the experiment, ceramic (Ce) cuvettes were used. The experiment was performed in nitrogen (N2) environment.
The Raman spectrum of the samples was obtained using an EnSpectr R532 Raman device (Enhanced Spectrometry Inc., USA). Green laser line at 532 nm wavelength was used for excitation of the samples.
Results and discussions
X-ray diffraction technique
X-ray diffraction (XRD) is a valuable technique for studying the structure of polymeric materials, providing insights into parameters such as crystallite size, degree of crystallinity, dislocation density, and microstrain. In this study, XRD analysis was conducted to investigate the influence of ZnO nanoparticles on the structure of the PS polymer matrix. Figure 1 presents the diffraction pattern of pristine PS and PS/ZnO nanocomposites. XRD spectra of (a) PS/ZnO nanocomposites: 1) Pure PS; 2) PS/1%ZnO; 3) PS/5%ZnO; 4) PS/10%ZnO and (b) ZnO nanoparticles.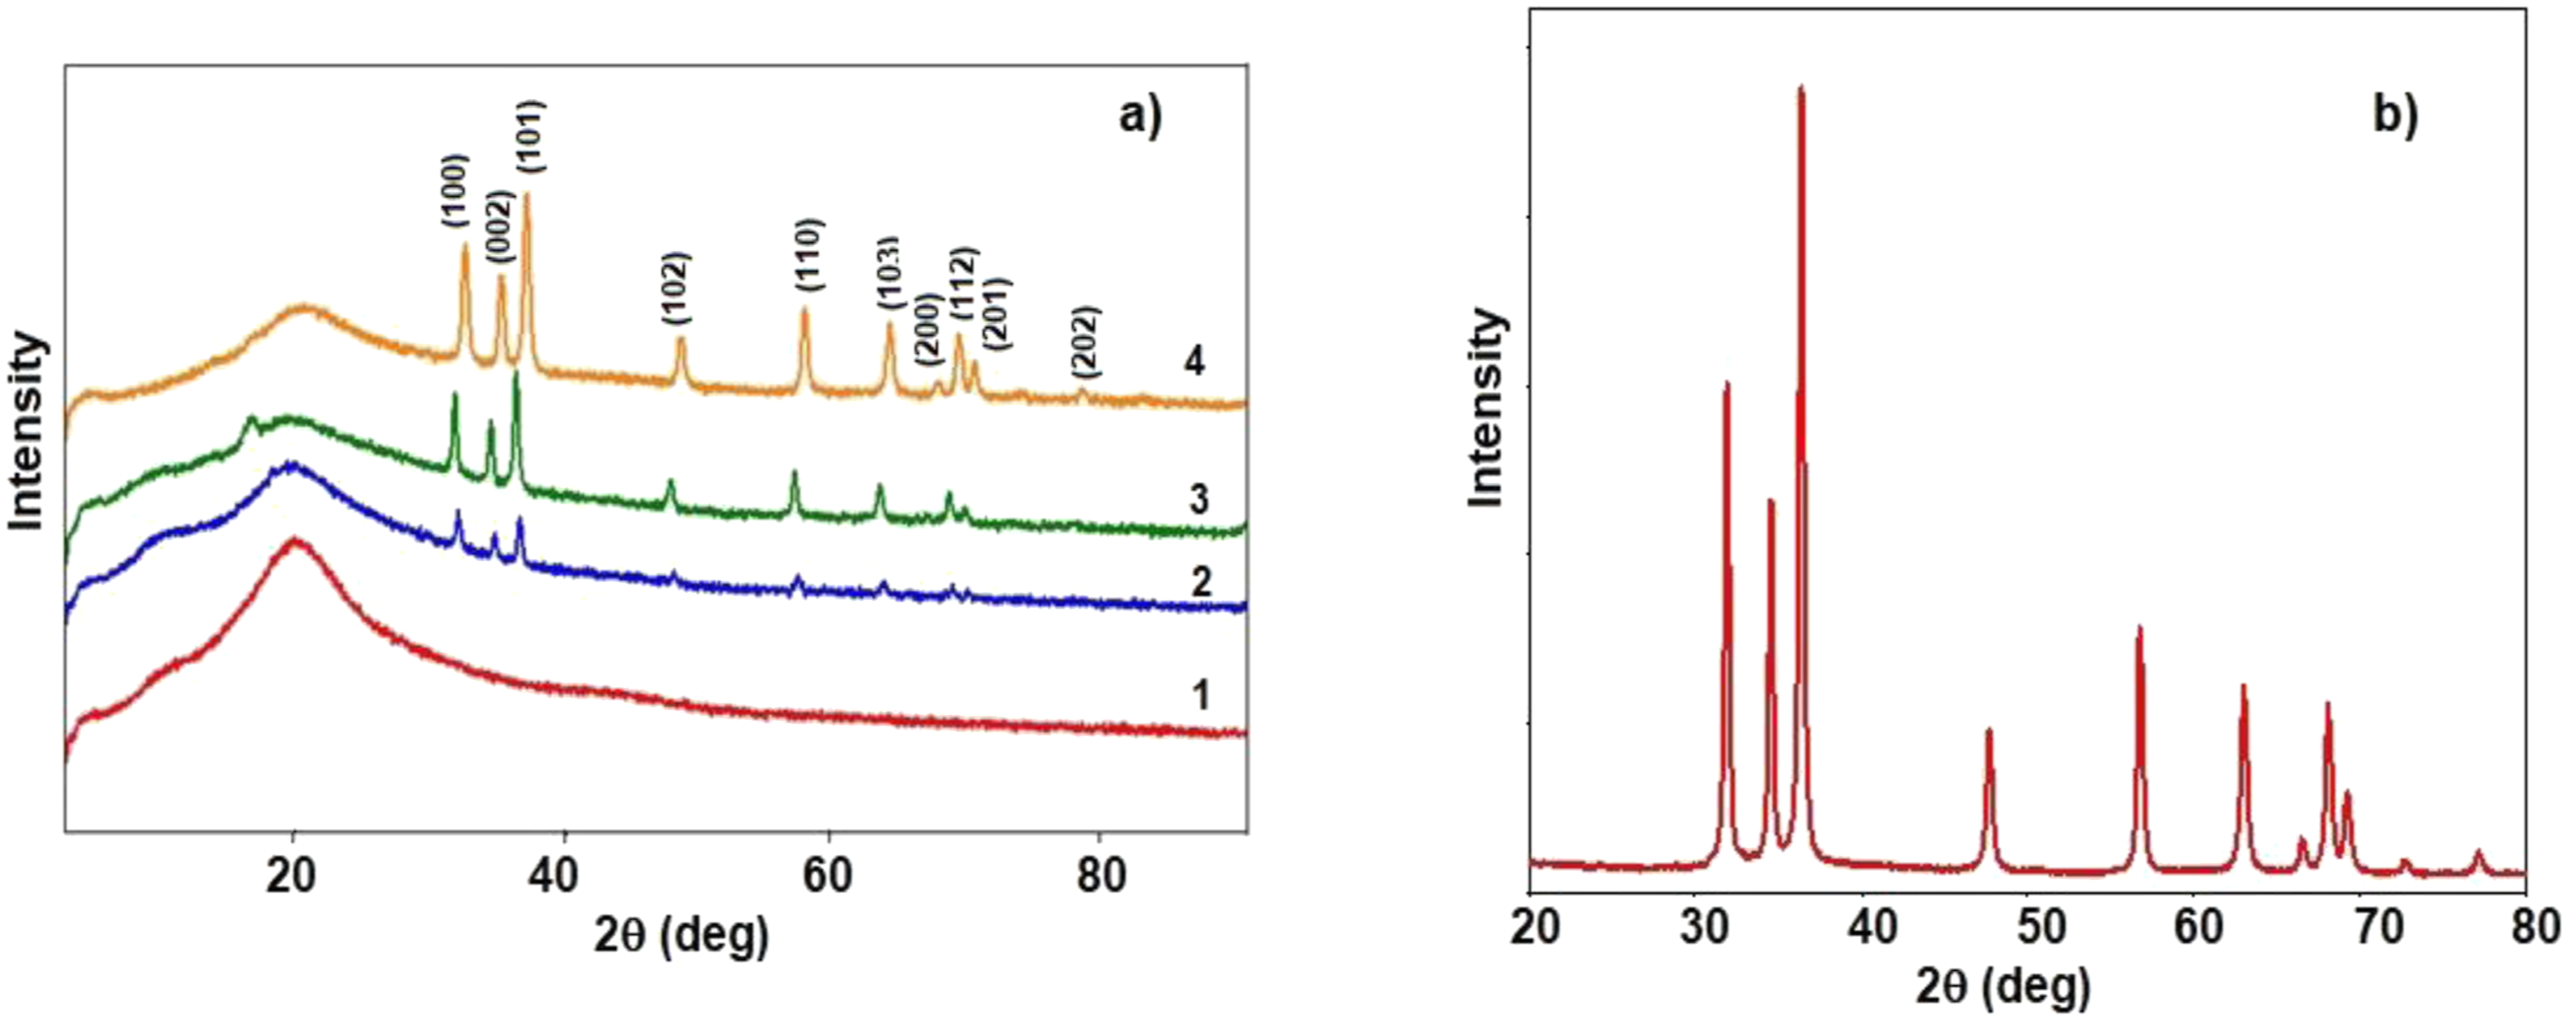
The results of X-ray diffraction analysis show that the diffraction scattering curves of studied majority compositions exhibit relatively expanded maxima with weak and high intensity in the ranges of 8°–11° and 20°–22° scattering angles (2θ).16,22 This result proves the presence of amorphous phases with different nanosizes in the investigated substances. With increasing ZnO content from 1 to 10 wt.%, new, sharp and intense peaks emerge at 31.71°, 34.53°, 36.26°, 48°, 56.67°, 62.85°, 66°, and 68.07°, as depicted in the spectra of the nanocomposite films. These peaks correspond to the presence of ZnO within the PS polymer matrix, aligned with the Miller indices (100), (002), (101), (102), (110), (103), (200), (112), and (201), respectively. They become more prominent with increasing ZnO wt.%. Comparison of these peaks with the XRD peaks of ZnO nanopowder and JCPDS (No. 36-1451) file confirms the presence of ZnO. The disappearance of the weak intensity scattering peak (in the ranges of 2θ = 8°–11°) in the diffraction scattering curve of the sample with a high content of ZnO-nanoparticles (PS/10%ZnO) is related to the presence of crystalline regions, which proves that sharp intensity maxima are formed due to the addition of ZnO into the matrix (Figure 1(d)).
SEM Analysis
Figure 2 displays the SEM images and EDX spectra of ZnO (Figure 2(a)) and PS (Figure 2(b)). The two elements depicted are zinc and oxygen (which represents the presence of ZnO) and carbon and oxygen (which represents the presence of the PS structure). SEM image and corresponding EDX spectra of: (a) ZnO nanoparticles and (b) PS polymer.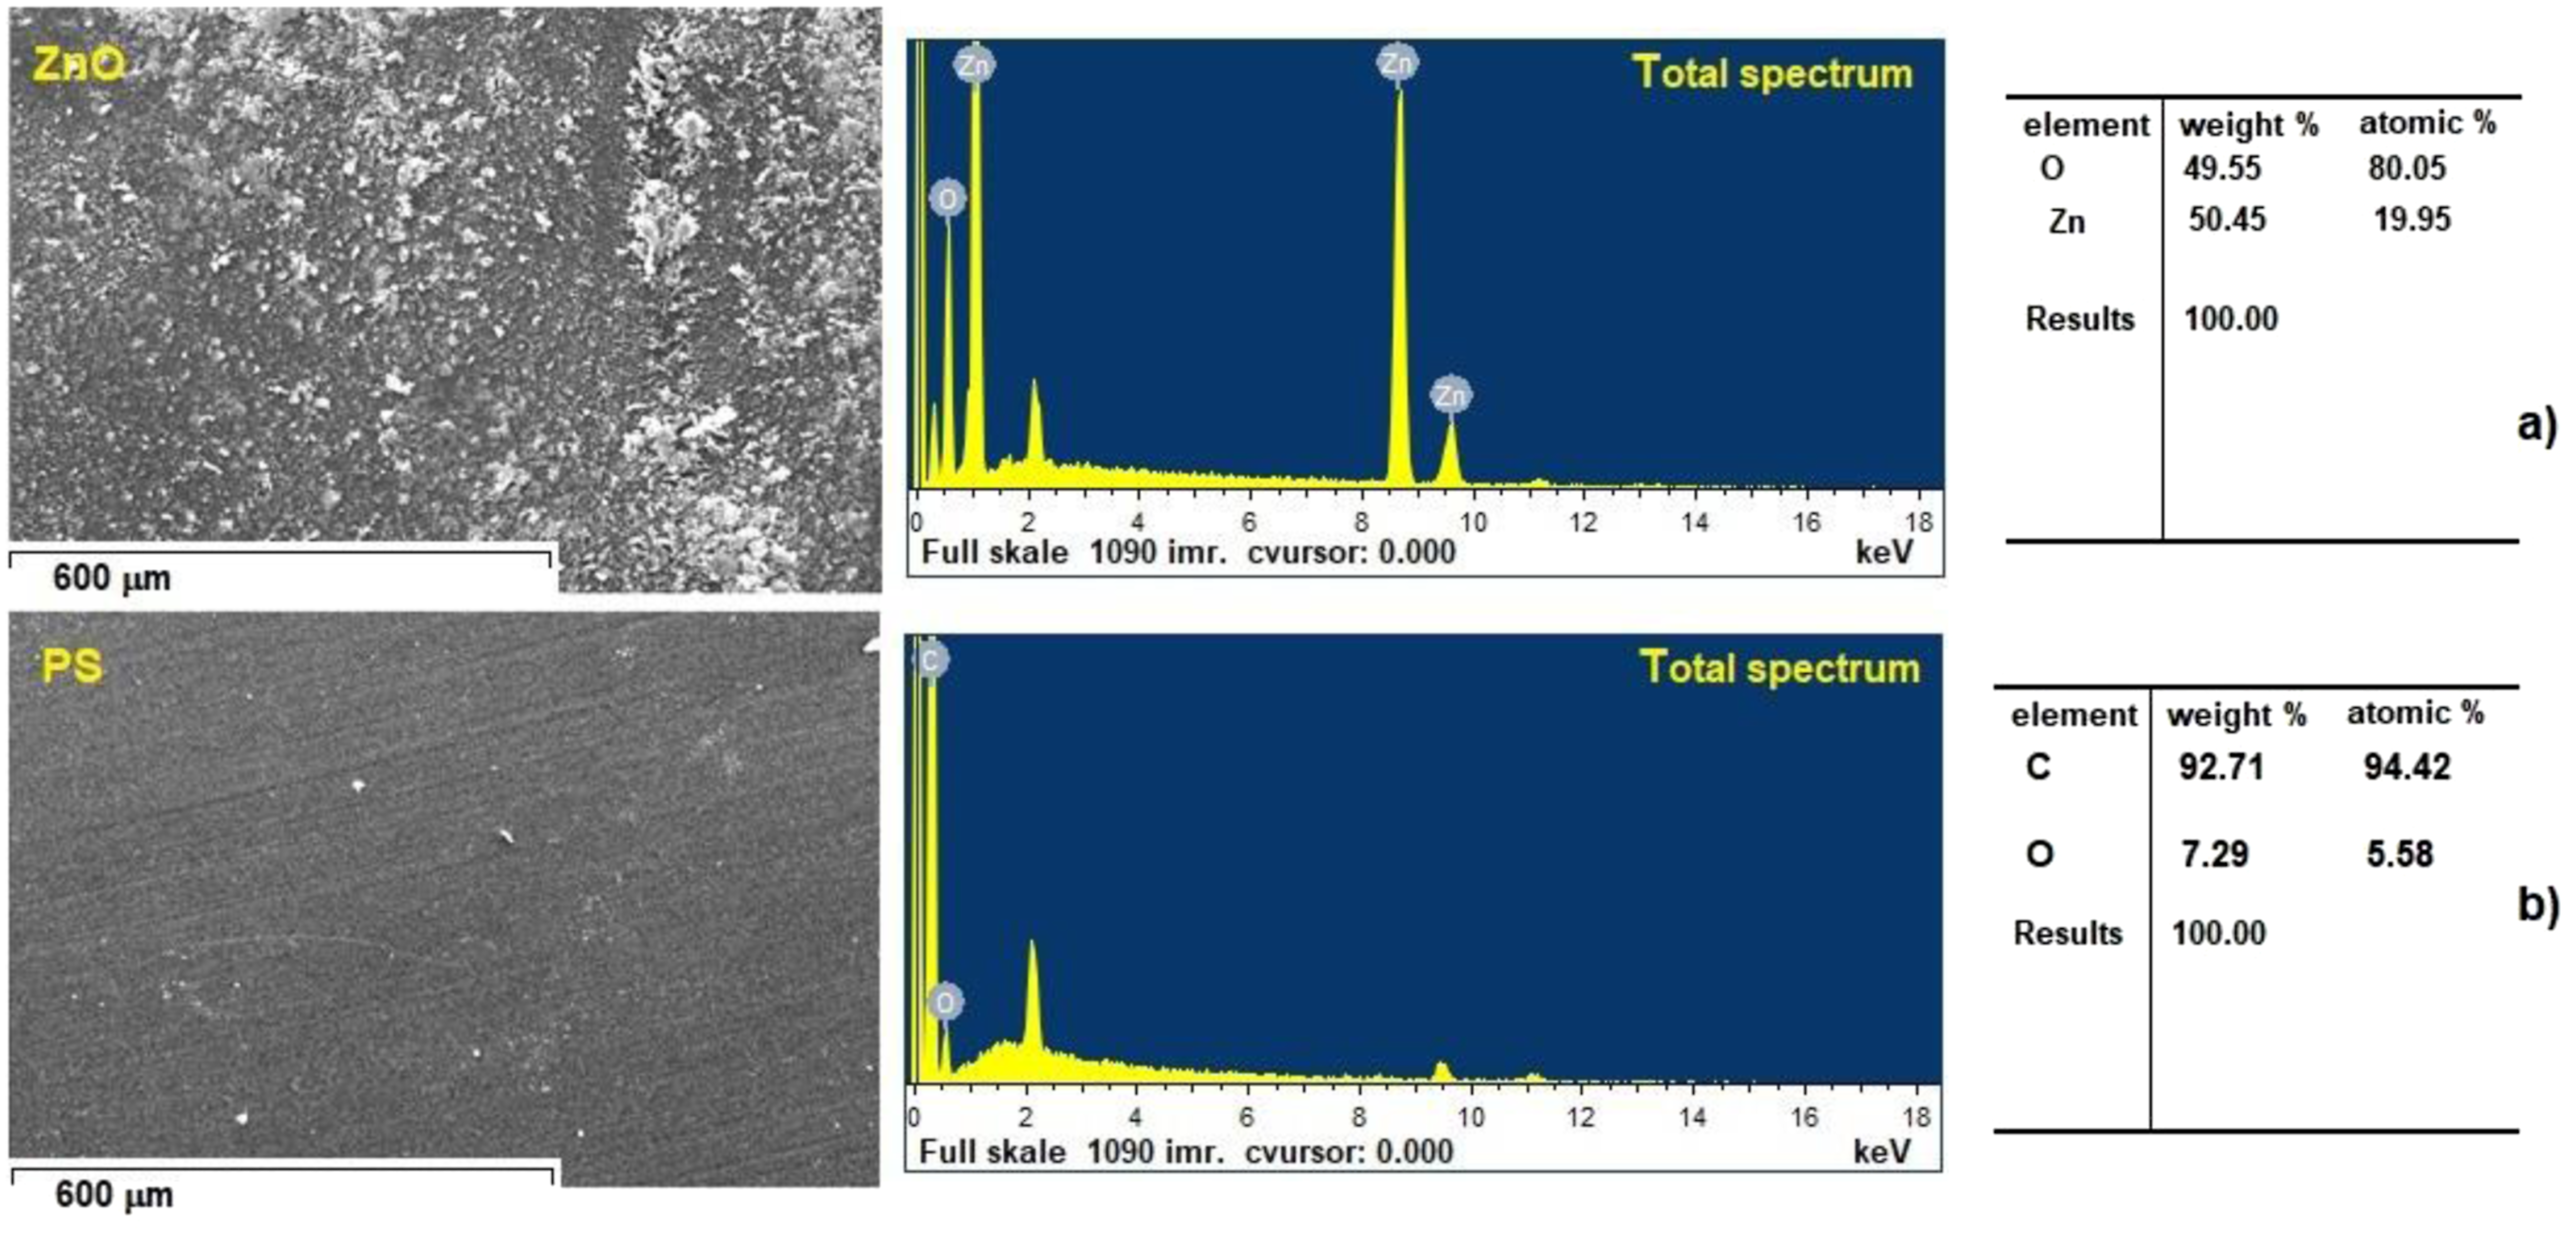
Zinc (Zn), Carbon (C) and Oxygen (O) elements were found in the ZnO/PS nanocomposite, as illustrated in Figure 3. The atomic percentages (Zn-1.51 %, C-95.19 % and O-3.30 %) also supported the formation of ZnO/PS nanocomposite. This result also shows that the as-prepared samples were of excellent purity. SEM image and corresponding EDX spectra of PS/ZnO nanocomposites.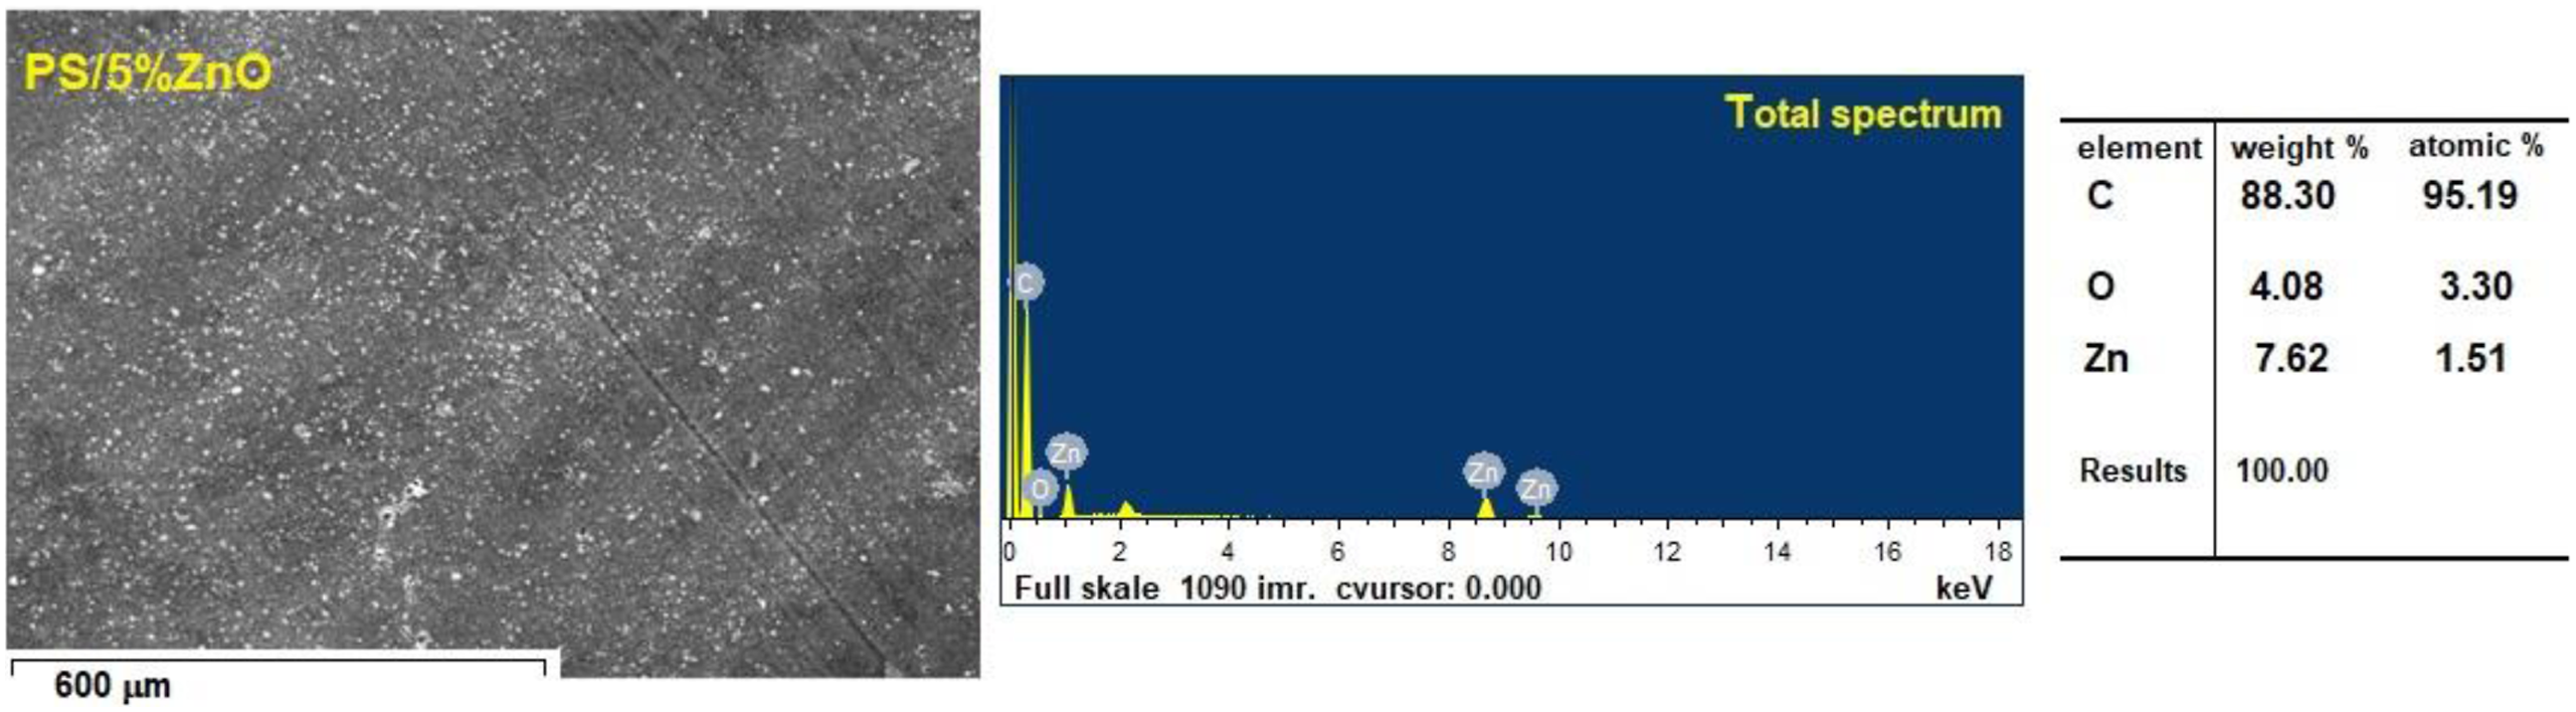
Dielectric constant
Dielectric properties of PS/ZnO nanocomposites coated with Al2O3 electrode were studied depending on the varying volume content of nanoparticles (Figure 4). The width of the Al2O3 electrode is 0.9 mm. The thickness of nanocomposites is 96.6 μm. The frequency dependence of the dielectric conductivity of the specified type of nanocomposites was studied at room temperature (293K) 25Hz-1 MHz (Figure 4(a)), and its dependence on temperature was studied in the interval 293 K ÷ 410 K (Figure 4(b)). Figure 4(a) shows the frequency dependence graph of dielectric permittivity (ε) of PS/ZnO based nanocomposite samples with different concentrations. The regularity of variation of the value of dielectric permittivity as a function of frequency is the same for all concentrated composites. Thus, for all samples, ε increases at lower frequencies, then decreases slowly depending on the frequency at first and sharply decreases at higher values of the frequency (Figure 4(a)). The consistent trend observed across all concentrations underscores the robustness of the electrical response within the nanocomposite system, suggesting a common underlying mechanism governing the dielectric behavior.
23
At lower frequencies, the applied electric field induces the alignment of dipoles or charge carriers within the nanocomposite, leading to an increase in ε (Figure 4(a)). This initial increase in ε is a noteworthy observation, indicating enhanced polarization processes, especially space charge polarization and interfacial polarization, within the material. Charge polarization, where charges migrate and accumulate with similar polarities under the electric field, significantly contributes to this phenomenon, amplifying the dielectric response.
24
Interfacial polarization, driven by the interaction between PS polymer and ZnO nanoparticles, enhances the charge storage capacity and dielectric constant. Such polarization processes are typically prevalent in materials with intrinsic or induced dipole moments, contributing to the overall dielectric response. As the frequency of the applied electric field escalates, the gradual decrease in ε reflects the diminishing contribution of polarization mechanisms (Figure 4(a)). At higher frequencies, the time available for charge carriers to respond to the alternating electric field becomes limited, resulting in a reduction in polarization effects and, consequently, a decline in dielectric permittivity. This trend aligns with the classical behavior observed in dielectric materials, where ε tends to decrease with increasing frequency due to the reduced ability of the material to respond to rapid changes in the electric field.25,26 Frequency (a) and temperature (b) dependence of dielectric constant for pure PS and PS/ZnO nanocomposite films.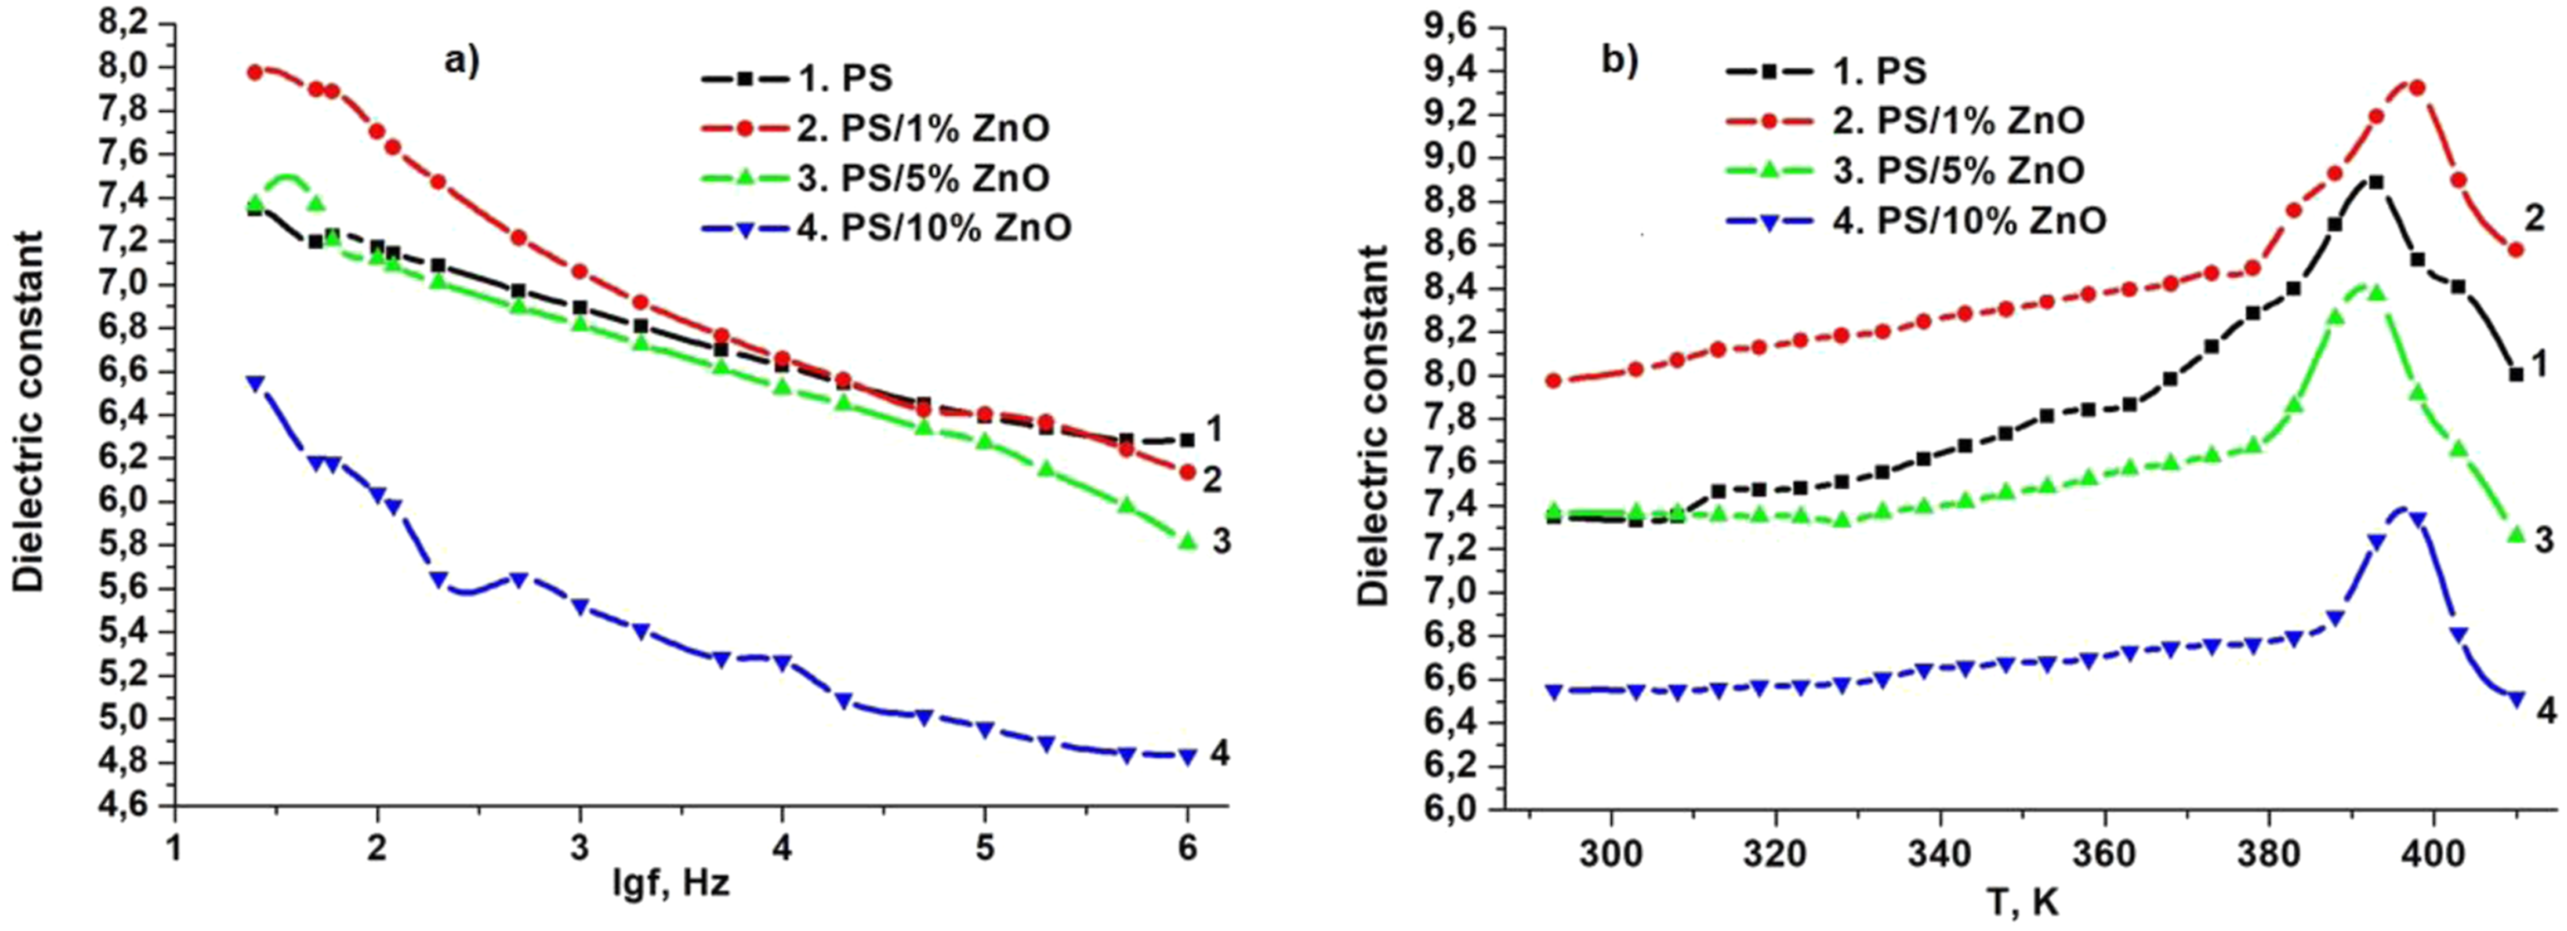
The way dielectric permittivity (ε) changes with temperature in PS/ZnO nanocomposites, shown in Figure 4(b), reveals interesting patterns that reflect how the material behaves. These patterns show how temperature affects the electrical properties of the nanocomposite, highlighting the relationship between temperature and how well the material conducts electricity. Initially, as the temperature increases, there is a notable decrease in the dielectric constant up to 320 K, which may coincide with the glass transition temperature (Tg) of the material. Below Tg, the material behaves more like a rigid glass, with limited molecular motion and dielectric response. This decline in ε suggests that temperature-induced effects, such as decreased molecular mobility or structural rearrangements, lead to a reduction in polarization and dielectric response. This phenomenon aligns with the typical behavior observed in many dielectric materials, where rising temperatures diminish their dielectric constants.23,25,27 However, as the temperature increases further, reaching the range of 320–370 K, the material stabilizes, and its dielectric constant remains relatively constant. This stabilization suggests a balance between temperature-induced disorder and any potential temperature-dependent polarization mechanisms within the nanocomposite. At this point, the material may enter a glassy state, where structural relaxation processes are suppressed due to limited molecular mobility. 28 In this glassy state, the material exhibits a relatively constant dielectric response, reflecting the equilibrium between thermal disorder and the constraints imposed by the glassy structure. Beyond Tg, as temperature rises further, the onset of melting or softening transitions may contribute to the observed increase in dielectric constant. Melting transitions involve the conversion of the material from a solid to a liquid phase, accompanied by increased molecular mobility and dielectric response. The emergence of new polarization processes beyond Tg may also be influenced by alpha (α) and beta (β) relaxations within the material. 26 Alpha relaxations typically correspond to the cooperative motion of molecular groups or segments within the material and may contribute to dielectric polarization at lower temperatures and frequencies. Beta relaxations, on the other hand, involve slower molecular rearrangements or phase transitions and may contribute to dielectric responses at higher temperatures or frequencies. At 400 K, the dielectric constant reaches its maximum value before sharply decreasing once again (Figure 4(b)). This abrupt decline may signal the onset of thermal degradation or phase transitions that disrupt the material’s dielectric response, underscoring the sensitivity of dielectric properties to temperature-induced changes in material structure and dynamics.
In summary, the temperature-dependent behavior of ε in PS/ZnO nanocomposites reflects a complex interplay between temperature, glass transition dynamics, and relaxation processes, offering insights for material optimization and application development. The dielectric constant dependency on temperature in PS/ZnO nanocomposites, offers valuable insights into the material’s behavior and its relationship with temperature-induced changes in structure and dynamics. This interrelation can be further understood by considering the corresponding Differential Scanning Calorimetry (DSC) and Thermal Gravimetric Analysis (TG) measurements.
Thermal analysis
Thermogravimetric analysis
The thermogravimetric (TG) analysis was employed to assess the thermal stability of the PS/ZnO samples. Figure 5 illustrates the TG curves for pure PS and PS/ZnO nanocomposites. The analysis of research on the thermal degradation of nanocomposites indicates that when ZnO nanoparticles with concentrations ranging from 1 to 5 wt. % are used as nanofillers in polystyrene (PS), the activation energy for decomposition increases, resulting in enhanced homogeneity and heat resistance of the nanocomposite compared to pure polystyrene (PS). The increase in thermal stability of polystyrene with ZnO addition was confirmed by TG, DSC results. TG curves for pure PS and PS/ZnO nanocomposites done at 298 K min−1 heating rate under N2 atmosphere.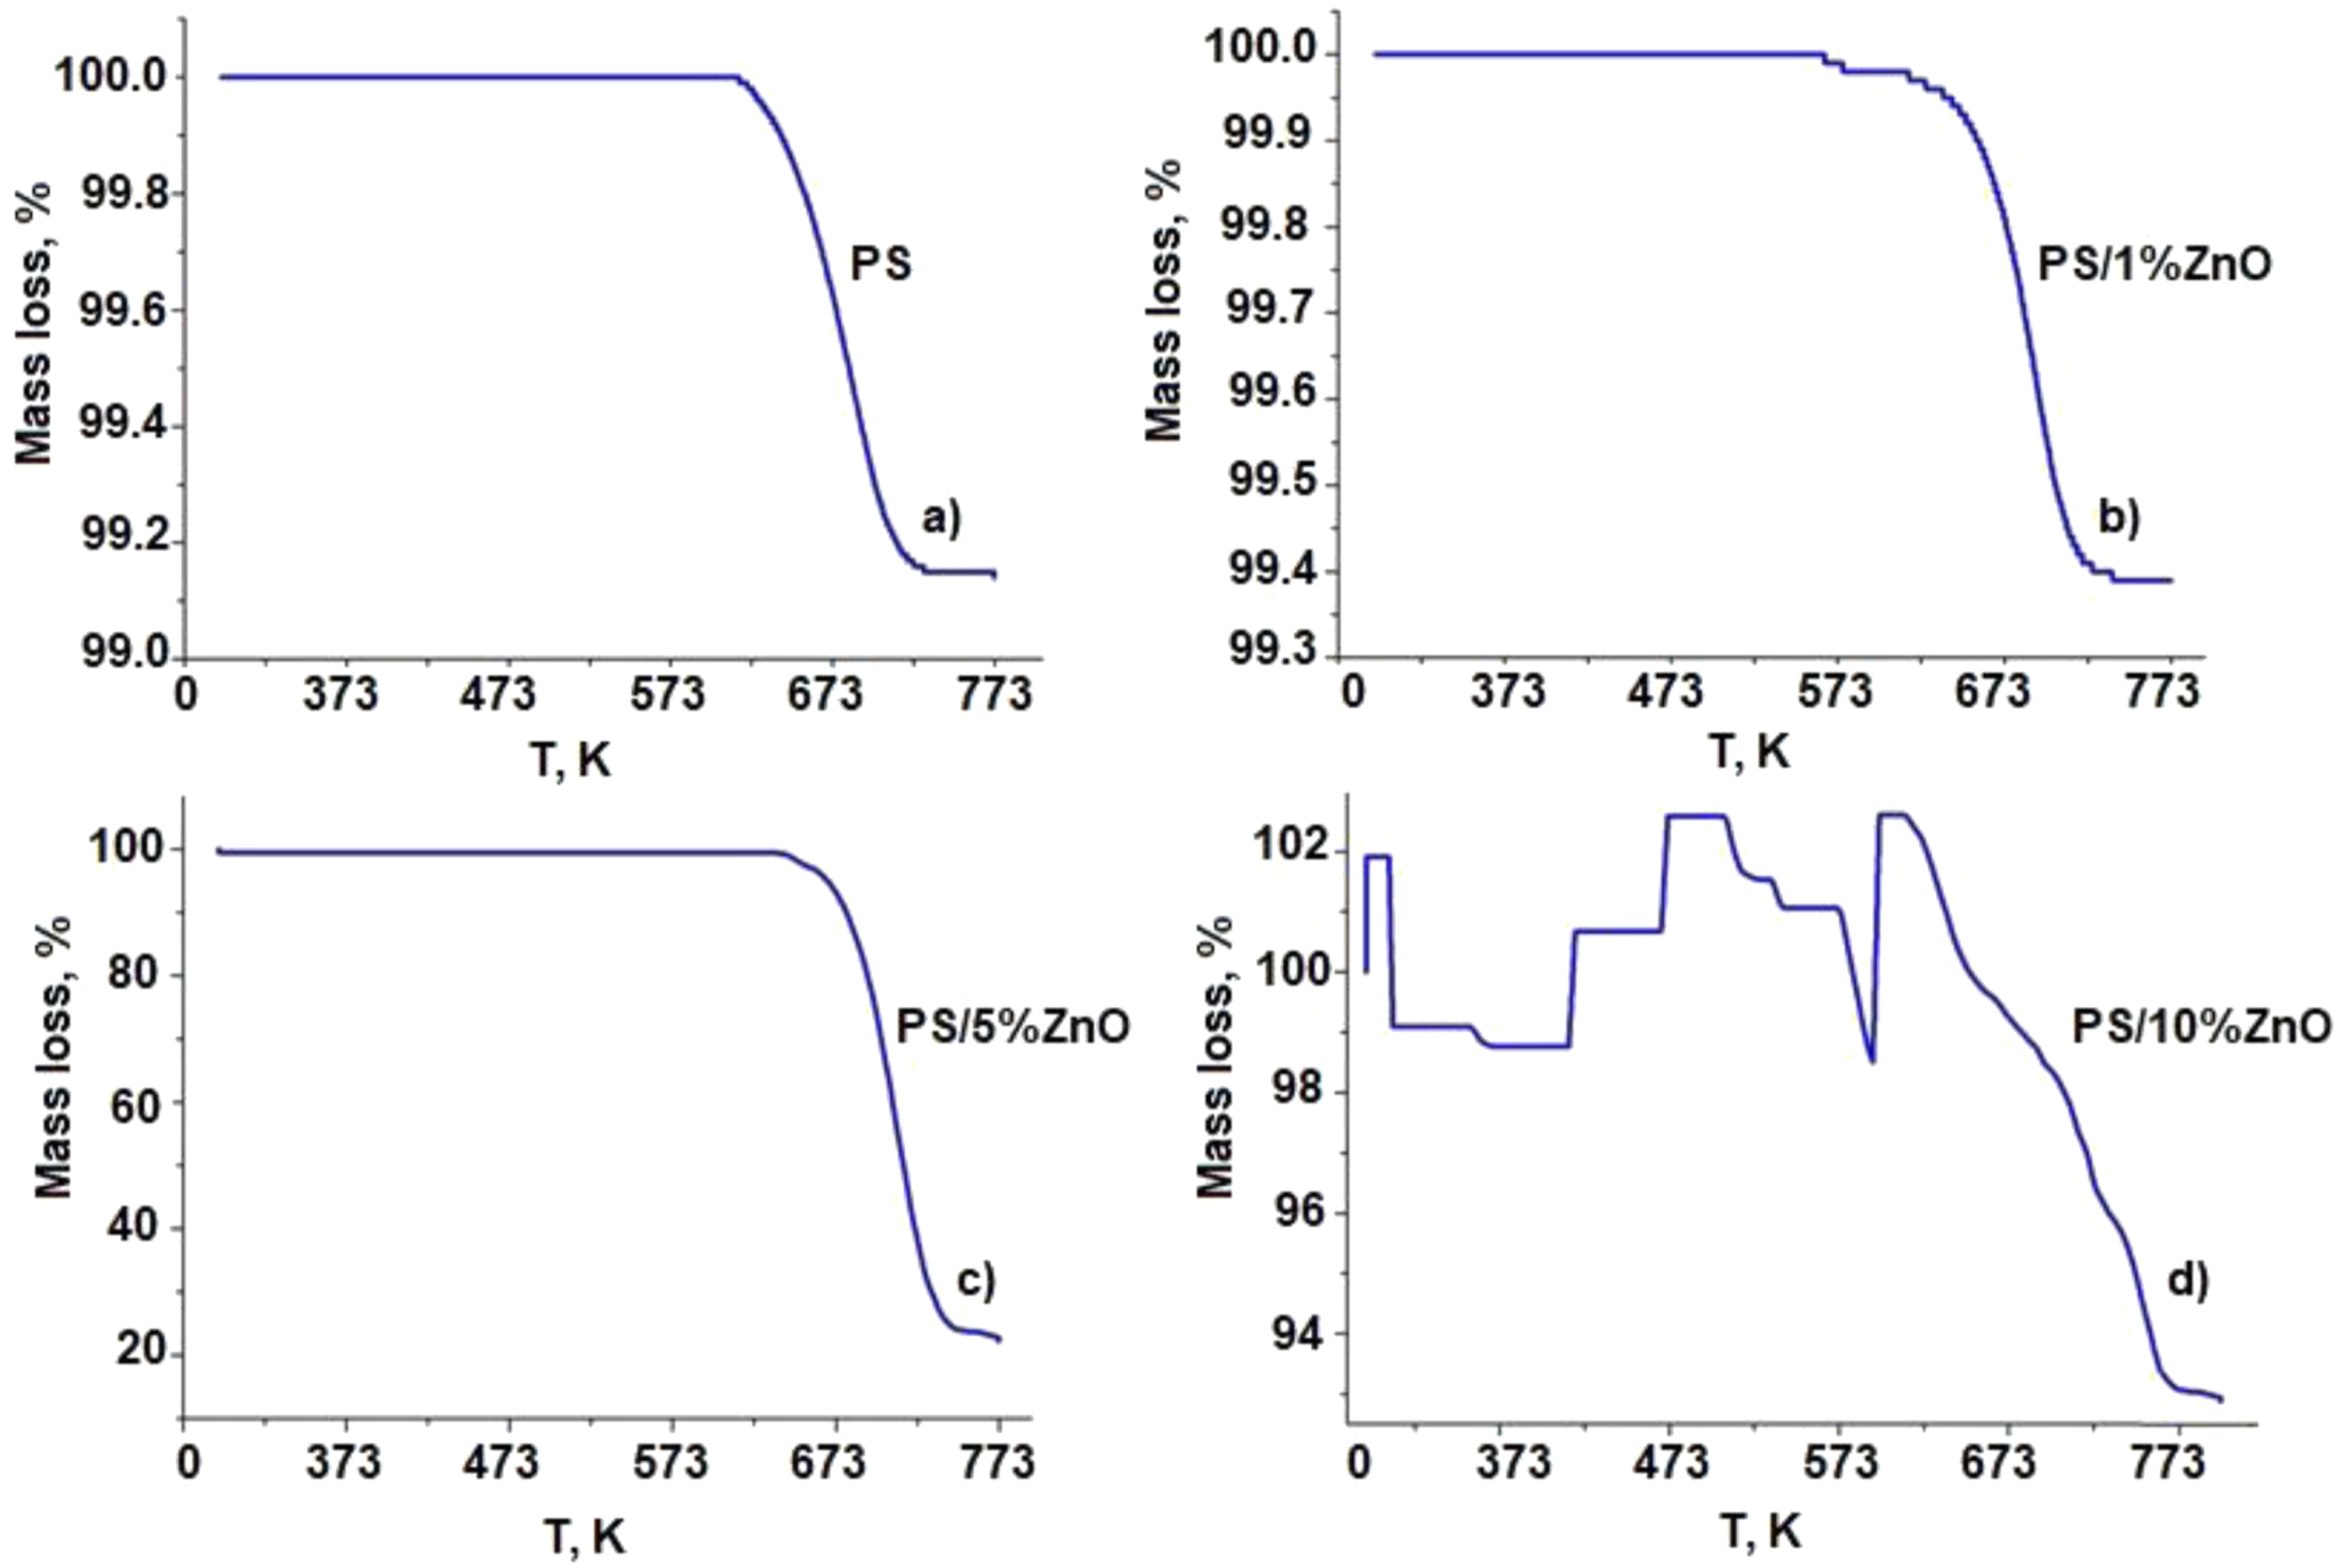
In Figure 5, the thermogravimetric analysis (TGA) results for pure polystyrene and PS/ZnO-based polymer nanocomposites are presented. As depicted in Figure 5(a), pure polystyrene undergoes continuous thermal oxidation from 614.5 K to 725.6 K, with a mass loss of 99.1% at 752.6 K, followed by a plateau phase. When 1% zinc nanoparticles are added to the polystyrene matrix, the onset temperature of thermal oxidation shifts slightly lower to 563.6 K for the PS/1%ZnO-based polymer nanocomposite (Figure 5(b)). The mass loss for the PS/1%ZnO nanocomposite continues smoothly up to 737.8 K, followed by a plateau, while for the PS/5%ZnO nanocomposite (Figure 5(c)), thermal oxidation extends up to 637 K, with mass loss continuing to 740.7 K. Additionally, the incorporation of 5% ZnO nanoparticles into the polystyrene matrix increases the polymer’s thermal stability, resulting in a more compact and ordered structure compared to pure polystyrene. ZnO is an inorganic material that exhibits heat-resistance, and so the presence of ZnO can retard thermal degradation or delay the onset of the thermal degradation of the polystyrene. 29 Furthermore, the subsequent increase in ZnO nanoparticles within the PS matrix slightly decreases the onset temperature of thermal oxidation for the polymer nanocomposites. Notably, the addition of 10% ZnO nanoparticles to pure polystyrene partially compromises homogeneity (Figure 5(d)). This result is attributed to the formation of larger-sized nanocrystallites within the primary matrix of pure polystyrene due to the high concentration of ZnO nanoparticles. This fact is corroborated by the results of TGA analysis, specifically the occurrence of multiple steps in the degradation process, indicating dependence on OH groups, carbon monoxide, and defects causing non-homogeneity within the matrix. 30 Overall, the results of thermal investigations presented in this article indicate that increasing the concentration range of ZnO additives (0-5 wt. %) optimally enhances the thermal stability of polystyrene.
Differential scanning calorimetry analysis
The differential scanning calorimetry (DSC) analysis presented in Figure 6 offers valuable insights into the melting behavior of polymer nanocomposites based on PS/ZnO. DSC curves for pure PS and PS/ZnO nanocomposites done at 298 K min−1 heating rate under N2 atmosphere.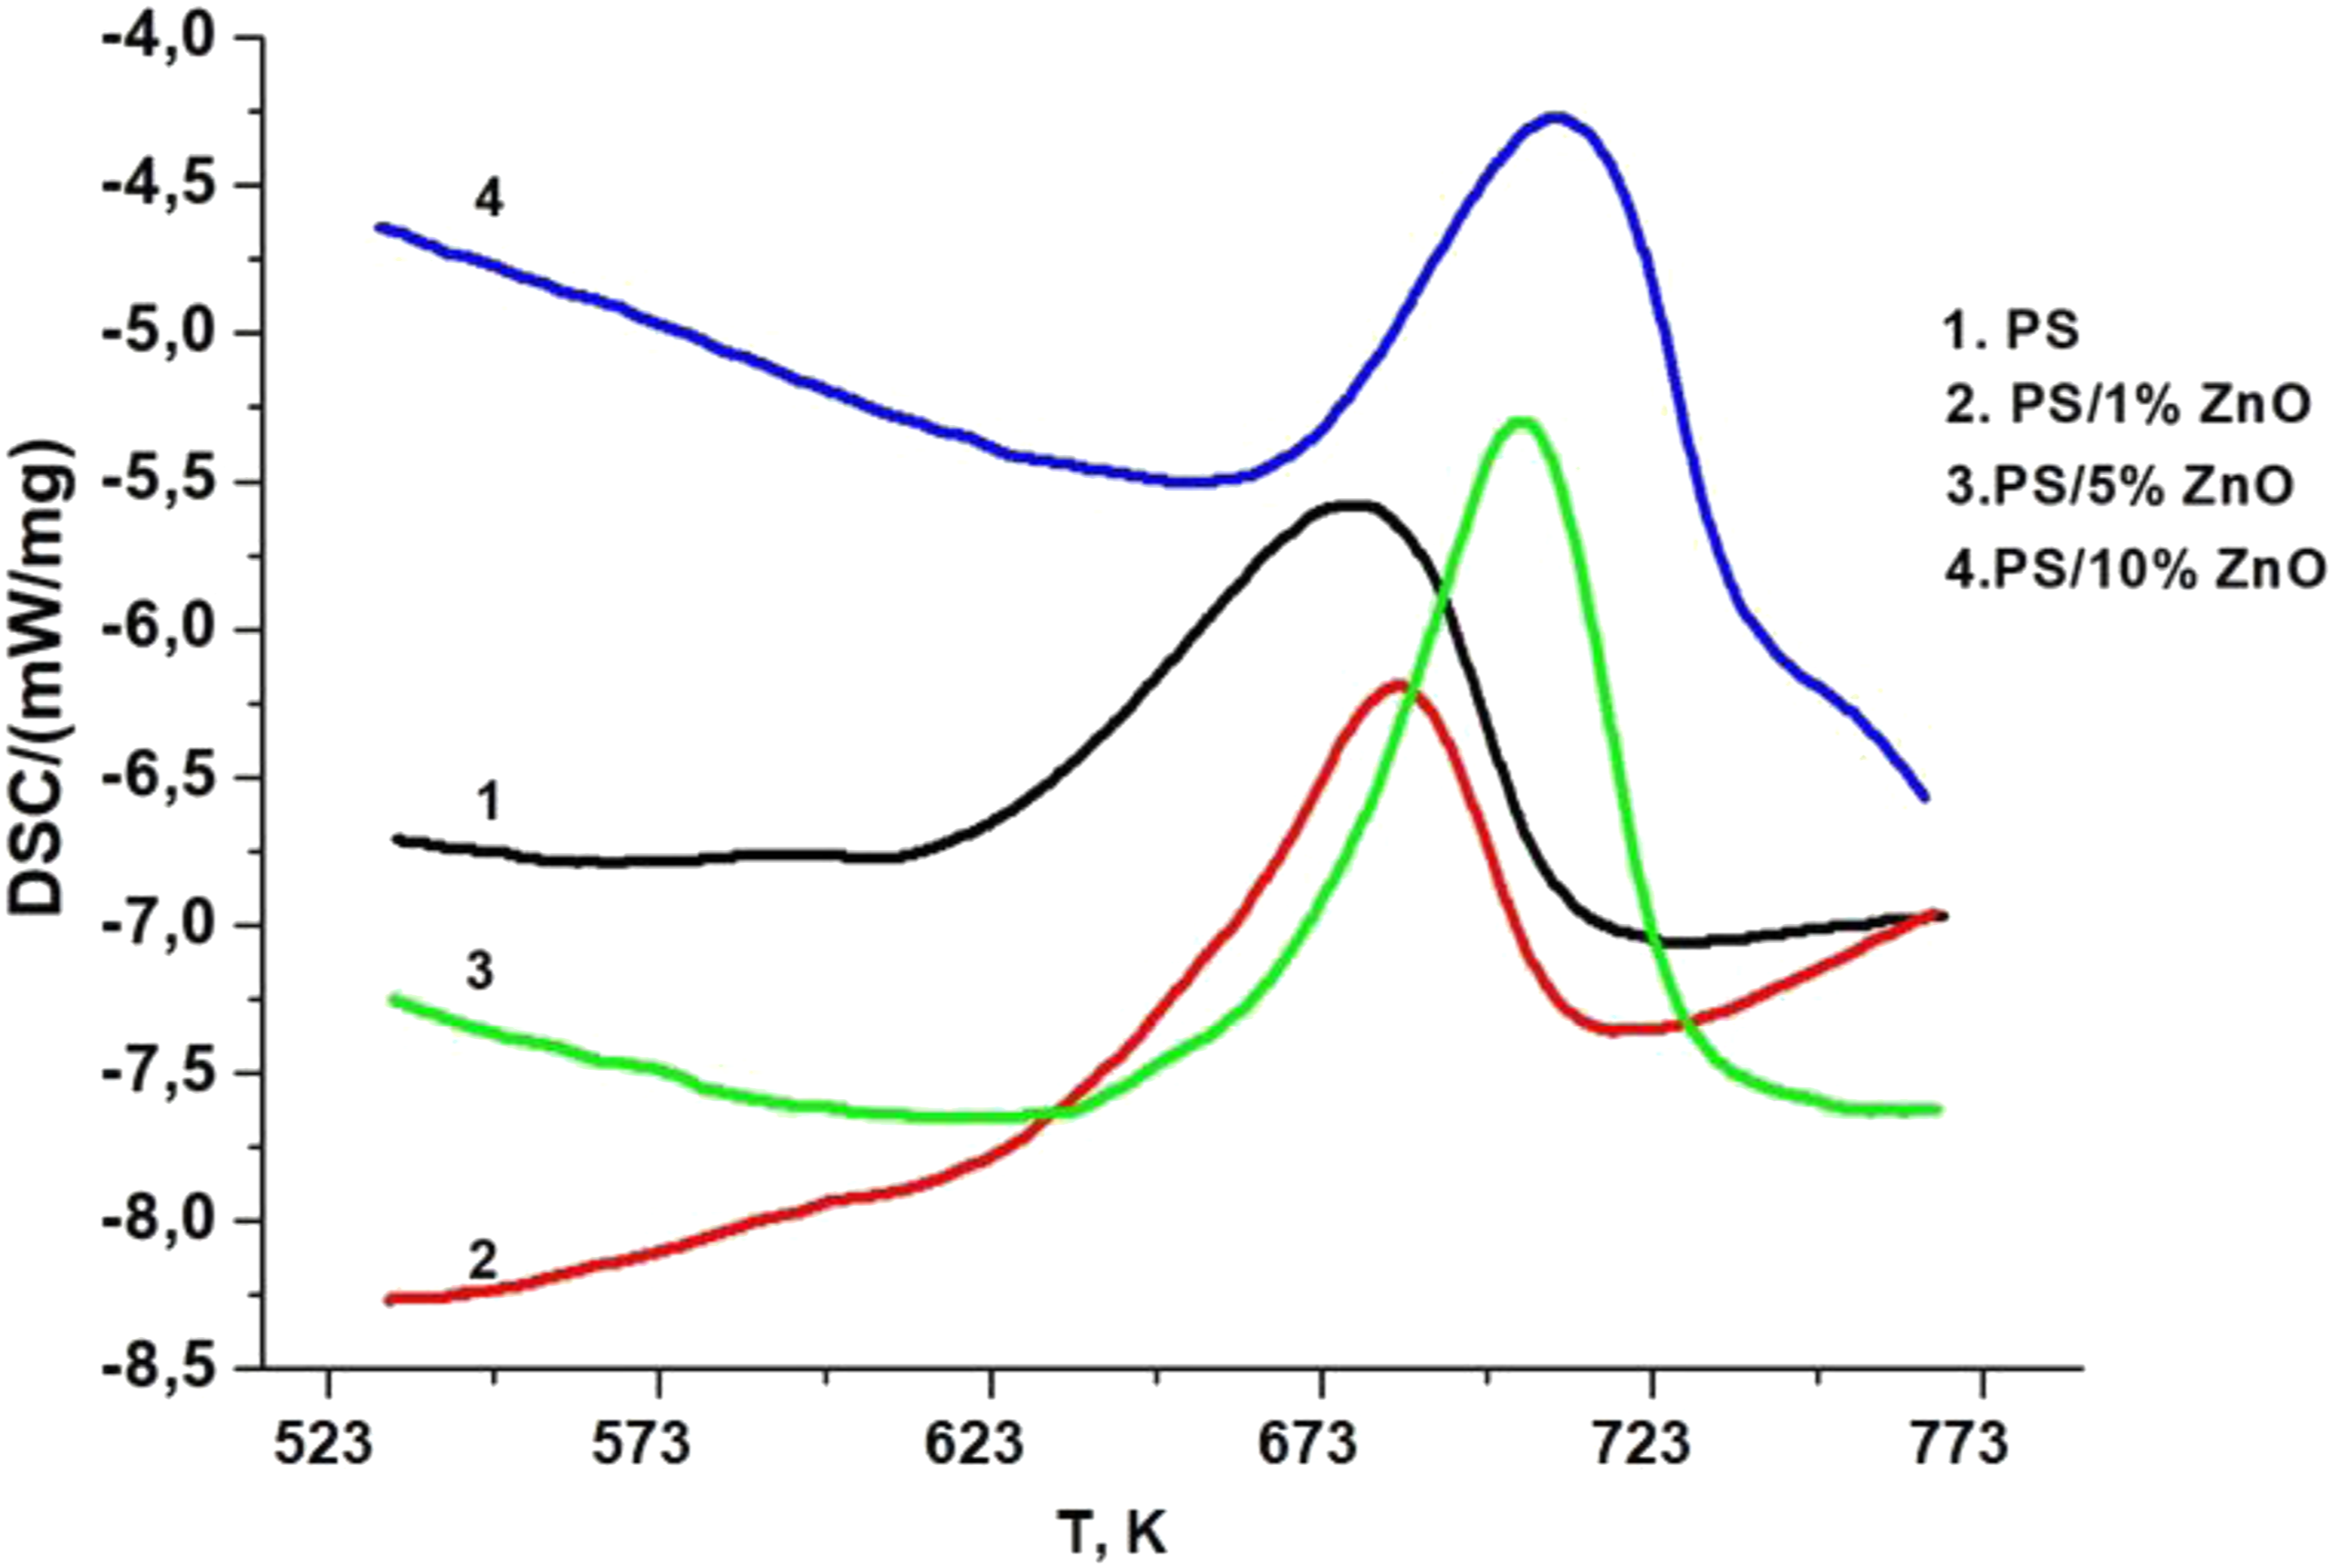
When 1% ZnO nanoparticles are incorporated into the PS matrix, there is a noticeable decrease in the melting temperature of the nanocomposite compared to pure PS (Figure 6). This decrease can be attributed to the presence of ZnO nanoparticles, which may disrupt the crystalline structure of the polymer matrix, leading to a lower energy requirement for melting. Conversely, when ZnO nanoparticles are added to the matrix in concentrations of 5% to 10%, the melting temperatures of the nanocomposites increase. This phenomenon suggests that higher concentrations of ZnO nanoparticles play a significant role in enhancing the structural integrity and organization of the PS matrix. The nanoparticles act as nucleating agents, promoting the formation of well-defined crystalline regions within the polymer matrix. As a result, the nanocomposites exhibit higher melting temperatures, indicating improved thermal stability and structural integrity. ZnO presence enhanced the glass transition temperature of zinc oxide/polystyrene nanocomposites because it can restrict the segmental motion of polystyrene molecules and lower the free volume of polymer chain folding. These results agree well with the data reported by Chen-Chi et al. 29 The mechanism of polymer-nanofiller interactions causing the enhancement of polymer based nanocomposite’s thermal stability is discussed in ref.30–32
Overall, the DSC results indicate that the concentration of ZnO nanoparticles has a significant impact on the melting behavior of PS/ZnO-based polymer nanocomposites. Lower concentrations may lead to a reduction in melting temperature due to potential disruptions in the polymer matrix, while higher concentrations contribute to the formation of a more organized and stable structure, resulting in increased melting temperatures.
Raman spectroscopy
Raman spectroscopy is an interesting technique to know about composition, crystallization, molecular disorderness and vibrations of nanocomposite films. This technique is dedicated to analyze the effect of ZnO nanoparticles on PS polymer by varying its content. Figure 7 shows the Raman spectrum of ZnO nanoparticles, measured under 532 nm excitation. The Raman spectra analysis of PS/ZnO nanocomposites provides valuable insights into the molecular interactions and structural characteristics of the materials. Raman spectra for pure PS and PS/ZnO nanocomposites.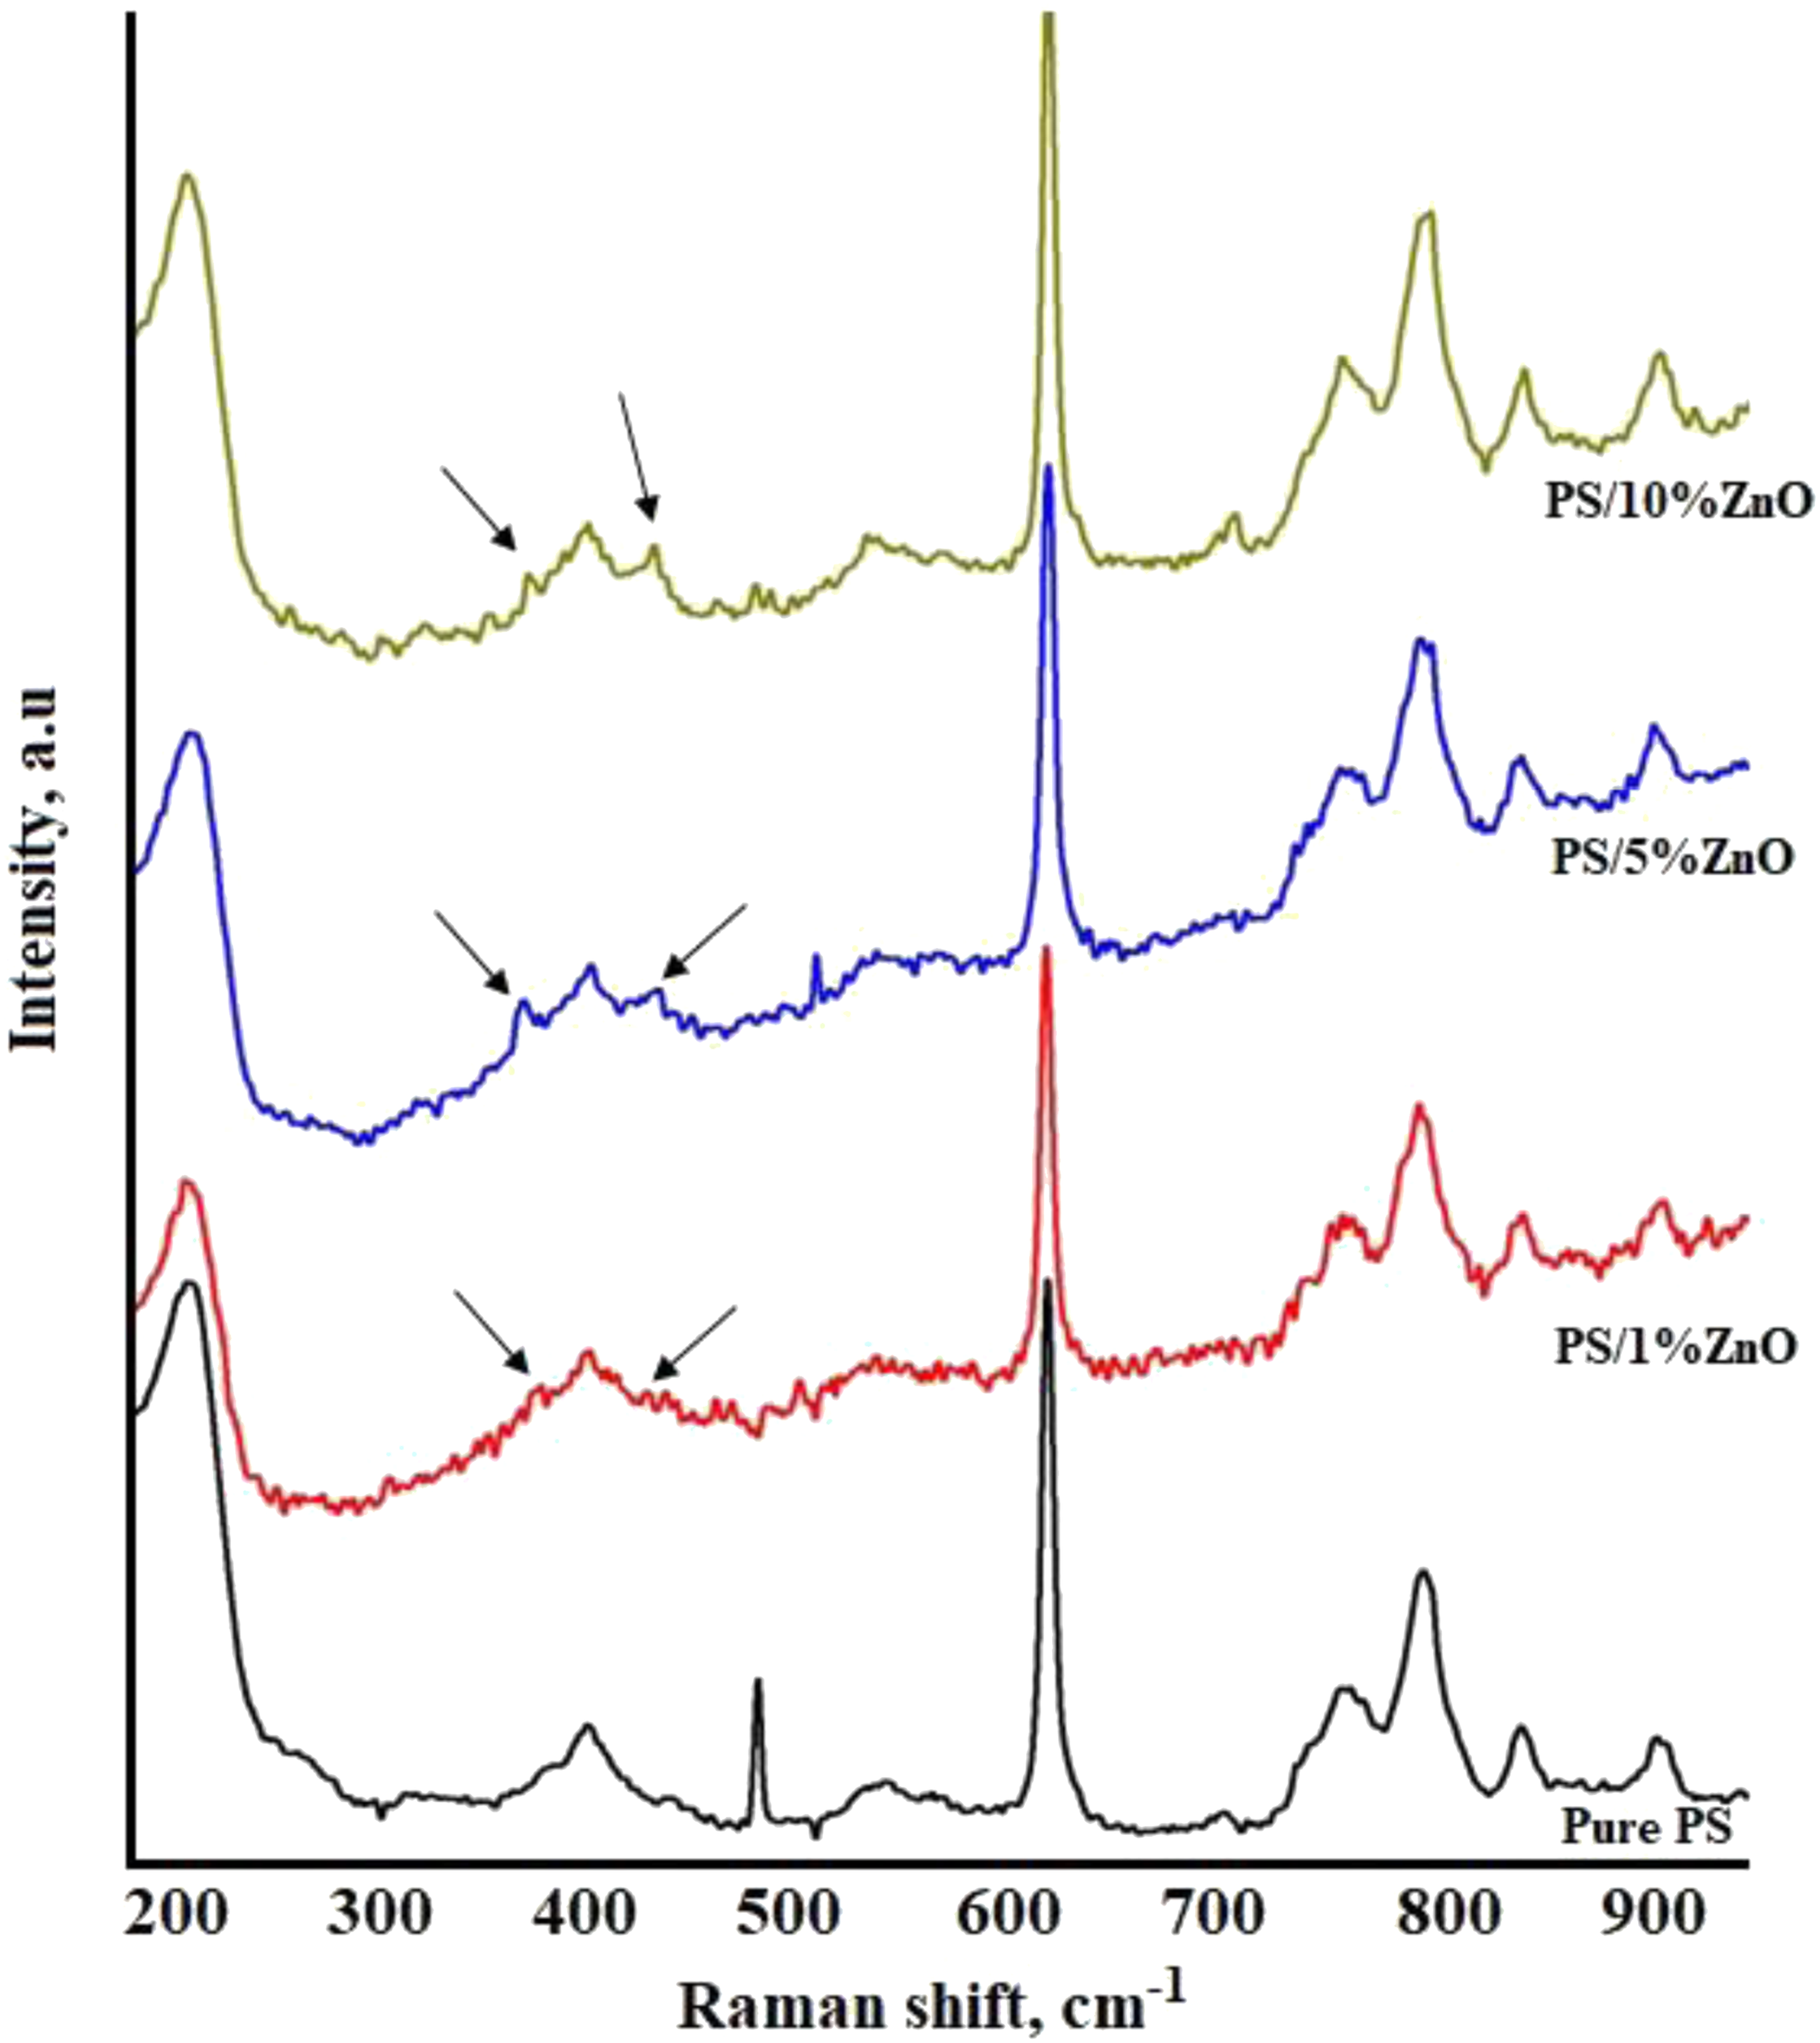
Notably, the presence of characteristic ZnO phonon frequencies is observed, consistent with previous studies.33–35 These frequencies include 376 cm−1 which can be assigned to the A1(TO), 437 cm−1 associated with E2(high) mode, typical of hexagonal wurtzite ZnO. These peaks are assigned to second-order Raman (E2H) mode, further confirming the presence of hexagonal wurtzite ZnO within the nanocomposite structure. In addition to these characteristic ZnO phonon frequencies, the Raman spectra of PS/ZnO nanocomposites exhibit distinct peaks at 493 and 707 cm−1 are observed in the PS/ZnO Raman spectrum, attributed to surface optical (SO) phonon modes. 36 The consistent presence of these peaks across all PS/ZnO nanocomposites suggests a uniform distribution of ZnO nanoparticles and a strong interaction between ZnO and the PS polymer matrix. In the PS/ZnO nanocomposite, the intensity of the peak at 485 cm−1 decreases drastically compared to pure PS, indicating a change in the molecular environment due to the presence of ZnO nanoparticles. However, despite this decrease, the peak at 493 cm−1 remains visible, suggesting distinct molecular interactions induced by the incorporation of ZnO nanoparticles. These modes provide additional evidence of the presence and surface characteristics of ZnO nanoparticles within the nanocomposite material. The observation of these modes further supports the notion of well-defined structural features and interactions between the ZnO nanoparticles and the surrounding polymer matrix.
The comprehensive analysis of Raman spectra not only confirms the presence of ZnO nanoparticles within the PS/ZnO nanocomposites but also provides insights into their structural characteristics and interactions. These findings enhance our understanding of the behavior and properties of nanocomposite materials, with potential applications in various fields such as optoelectronics, sensing, and materials science.
Conclusion
In conclusion, the study on PS/ZnO nanocomposites has provided valuable insights into their structural, electrical, and thermal properties. X-ray diffraction (XRD) analysis demonstrated the formation of crystalline phases with increasing ZnO content, as evidenced by sharp peaks corresponding to ZnO crystal planes. SEM and EDX analysis confirmed the uniform dispersion of ZnO nanoparticles within the PS matrix, supporting the formation of PS/ZnO nanocomposites with elemental percentages showing distinct composition. Dielectric constant measurements revealed frequency-dependent behavior, indicating enhanced polarization mechanisms likely attributed to the strong molecular interactions observed through Raman spectroscopy. These interactions were further supported by the presence of characteristic ZnO phonon frequencies and PS-specific peaks, suggesting uniform distribution and effective bonding between ZnO nanoparticles and the PS matrix. Moreover, thermogravimetric analysis (TGA) indicated improved thermal stability of PS/ZnO nanocomposites, with lower onset temperatures for thermal oxidation as ZnO content increased. This finding suggests that ZnO nanoparticles play a crucial role in retarding thermal degradation processes, thereby enhancing the material’s thermal stability.
Footnotes
Author contributions
Each author contributed to the conception, design, and/or interpretation of data, drafted the article or revised it critically for important intellectual content, and approved the final version for publication.
Declaration of conflicting interests
The author(s) declared no potential conflicts of interest with respect to the research, authorship, and/or publication of this article.
Funding
The author(s) received no financial support for the research, authorship, and/or publication of this article.
Data availability statement
The datasets generated and/or analyzed during the current study are available from the corresponding author on reasonable request.