
Abstract
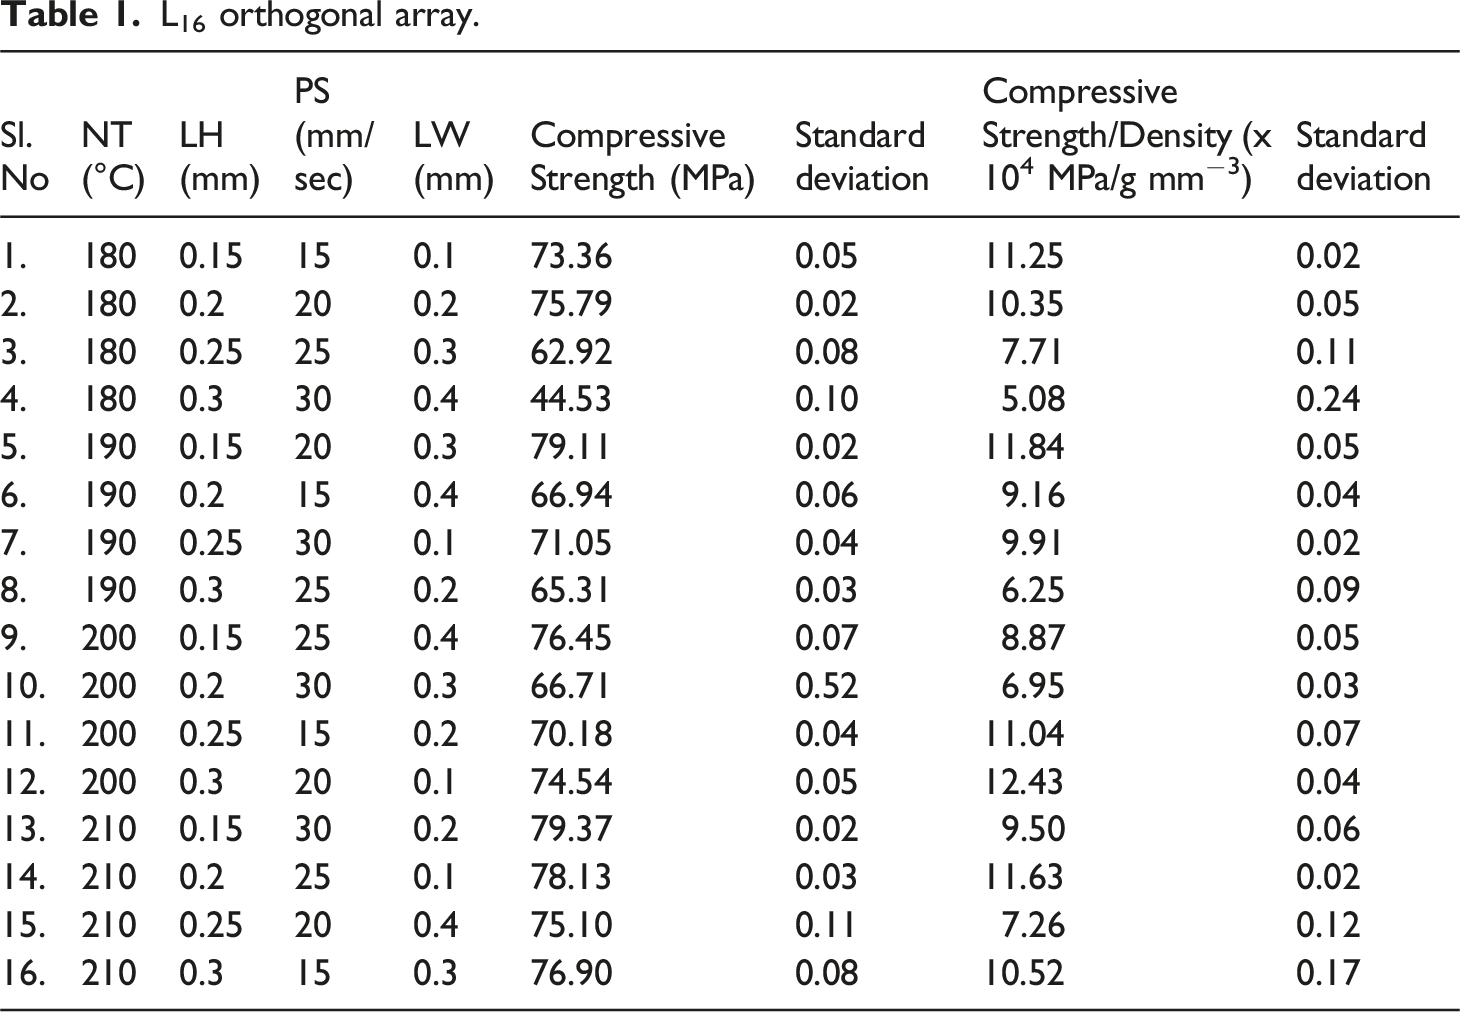
The utilization of Fused Filament Fabrication (FFF) technology for developing sandwich structures proves to be an effective approach, enabling the rapid construction of intricate profiles and gaining widespread recognition for diverse structural applications. In this study, hexagon lattice-cored sandwich structures are created by situating the lattice core at the center of the PLA polymeric specimens. The performance is assessed by varying 3D-Printing Factors (3D-PFs), including Nozzle Temperature (NT), Layer Height (LH), Printing Speed (PS), and Line Width (LW). The levels of 3D-PFs are manipulated as follows: NT (180, 190, 200, 210°C), LH (0.15, 0.2, 0.25, 0.3 mm), PS (15, 20, 25, 30 mm/sec), and LW (0.1, 0.2, 0.3, 0.4 mm). By employing a FFF 3D printer, the sandwich specimens are 3D-printed and their compression properties are assessed using a Universal Testing Machine (UTM). In this research, various Machine Learning (ML) models namely Bayesian Ridge regression (BRid), Elastic Net linear regression (EN), Quantile Regression (QR), and Support Vector Machine (SVM) are utilized to predict the compressive strength/density property of the developed sandwich structure. This aids in determining the optimal levels of 3D-PFs to achieve enhanced compressive strength/density. The results reveal that the QR model, particularly when employed in the boosting ensemble technique, exhibits superior accuracy with a Root Mean Square Error (RMSE) of 0.26 × 10⁴, Mean Absolute Error (MAE) of 0.21 × 10⁴, and Median Absolute Error (MedAE) of 0.16 × 10⁴. Utilizing the QR model within the boosting ensemble technique, the influence of 3D-PFs on resulting compressive strength/density is analyzed, facilitating the identification of optimized 3D-PF levels for improved compressive strength/density. Sandwich structures fabricated at these optimized levels demonstrate enhanced compressive properties, making them suitable for a variety of structural applications.
Introduction
Sandwich structures offer distinct advantages, including a high stiffness-to-weight ratio, excellent energy absorption, and a strong strength-to-weight ratio. 1 Typically, they consist of three key components: two face panels with high bending stiffness and strength, separated by a lightweight cellular core. This core enhances resistance to bending, buckling, shear stiffness, and energy absorption. 2 Consequently, sandwich structures find applications across aerospace, 3 automotive, 4 biomedical, 5 defense, 6 insulation, 7 and construction. 8 Their mechanical properties are influenced by constituent materials, geometric design, and core topology. In this setup, face panels bear in-plane loads and flexure, while the cellular core manages transverse shear and compression loading. 9 Traditional foam cores are widely used and tested under bending load conditions. 10
In recent decades, extensive research has been dedicated to advancing lattice-cored sandwich structures. Unlike conventional foam cores, a lattice core is positioned between the face plates. 11 Latticed cores come in various topologies, including Honeycomb, Beam, TPMS, and Voronoi. 12 Researchers are drawn to these cores for their lightweight properties, high specific strength, and substantial densification strain. 13 Due to the intricate morphology of lattice-cored sandwich structures, the “Additive Manufacturing” (AM) technique is commonly employed for fabricating the latticed materials. 14 This technique involves depositing polymeric material layer by layer according to a specified design contour. 15 Among the various AM techniques, the Fused Filament Fabrication (FFF) is employed for fabricating lattice-cored sandwich structures. 16 Numerous studies have focused on developing these structures, with some notable examples outlined below.
Singh et al. investigated the impact of unit cell morphology and volume fraction on the vibrational and mechanical characteristics of the 3D printed lattice materials with design topologies like Diamond, Kelvin, and Octa. They reported that the diamond latticed materials with medium density reported the highest compressive strength among different topologies. 17 Singh et al. evaluated the tensile characteristics of the 3D printed PLA lattice materials both experimentally and theoretically. They reported that the resistance exhibited by the 3D printed material increased due to the repeated cell framework. 18
Polylactic acid (PLA) is a biodegradable and bio-based thermoplastic polymer derived from renewable sources such as corn starch or sugarcane. 19 Its inherent characteristics, including lightweight nature (lower density), high strength, and stiffness, make it an ideal material for producing lightweight sandwich structures. 20 Numerous studies have investigated the use of 3D printing for creating PLA lattice-cored sandwich structures and exploring their potential applications.
Gunasegeran et al. assessed the energy absorption and damage characteristics of a bio-inspired sandwich structure subjected to quasi-static indentation. The sample comprised of PLA bio-inspired core and glass fiber reinforced polymeric face plates. They concluded that the performance of this sandwich structure is influenced by the lattice core topology. 21 Ji et al. examined the mechanical properties of U and V shaped 3D printed PLA sandwich structures under compression loading conditions. They found that the elastic modulus of a V-shaped sandwich tends to increase with higher layer counts. 22
In the manufacturing process of lattice-cored sandwich structures via the FFF AM technique, the 3D-Printing Factors (3D-PFs) play a vital role in determining the bonding and surface morphology of the deposited material layers. 23 The exceptional mechanical and energy absorption properties of these structures rely heavily on these 3D-PFs. 24 To achieve improved mechanical properties, it is essential to effectively optimize and investigate these factors. Typically, various conventional optimization techniques such as Taguchi, Response Surface Methodology (RSM), Grey Wolf Optimization (GWO), etc., are employed for optimizing 3D-PFs. 25 Several studies have explored the optimization of 3D-PFs using these conventional techniques, and some noteworthy examples are outlined below.
Samykano et al. investigated the effects of 3D printing factors (3D-PFs) such as layer thickness, raster angle, and infill density on the mechanical strength of 3D printed ABS specimens using Response Surface Methodology (RSM). They found that specimens fabricated with higher infill densities exhibited higher tensile strength. 26 Nabipour et al. developed Copper (Cu) reinforced ABS (Cu/ABS) composite filaments and analyzed the impact of 3D-PFs including nozzle diameter, layer thickness, raster angle, and extrusion temperature on the tensile characteristics of the 3D printed composites using Taguchi optimization. They concluded that higher tensile strength was observed with lower layer thickness. 27
In recent years, the adoption of Machine Learning (ML) has become crucial for efficiently optimizing 3D-Printing Factors (3D-PFs). This approach is significant due to its ability to manage complex relationships, extract insights from data, adaptability, self-learning capabilities, and handling nonlinearities. 28 Jayasudha et al. conducted a study to predict the tensile strength of 3D printed parts using various ML models including Linear regression, Random Forest regression (RF), AdaBoost regression, Gradient boosting regression, and XGBoost regression. They found that the XGBoost ML model predicts tensile strength with higher accuracy. 29 Charalampous et al. optimized 3D-PFs of the FFF process using ML techniques such as Support Vector Regression (SVR), K-Nearest Neighbors (KNN), and RF for predicting the tensile strength of 3D printed PLA specimens. They concluded that the KNN ML model resulted in higher precision in predicting tensile strength. 30
The current study focuses on 3D printing hexagon lattice-cored specimens using neat polymeric PLA filament. Various 3D printing factors (3D-PFs) such as Nozzle Temperature (NT), Layer Height (LH), Printing Speed (PS), and Line Width (LW) are systematically adjusted to investigate their impact on the compressive strength/density of 3D-printed sandwich specimens using Machine Learning (ML). Different ML models including Bayesian Ridge regression (BRid), Elastic net linear regression (EN), Quantile regression (QR), and Support Vector Machine (SVM) are applied with ensemble learning techniques such as bagging, boosting, and stacking to predict compressive strength/density. The ML model’s performance is improved through hyperparameter tuning, and the optimal model is determined based on the Coefficient of Fit (R2) value. Furthermore, the optimal ML model allows analysis of the influence of 3D-PFs on compressive strength/density using visualization tools like Box-whisker plot, Pair plot, and Partial Dependency Plot (PDP). The significant 3D-PFs and their respective contributions are identified using the optimal ML model. The study also includes assessment of train and test data through scatter and residual plots, and error metrics such as Root Mean Square Error (RMSE), Mean Absolute Error (MAE), and Median Absolute Error (MedAE) are computed for all ML models under various ensemble learning techniques. This ML approach effectively optimizes 3D-PFs for hexagon lattice-cored sandwich specimens, aiming for higher compressive strength/density.
Materials and method
Materials
The current study utilizes neat PLA filament as the printing material for FFF 3D printer (Make: Creatbot, India). The key properties of the PLA filament are a density of 1.24 – 1.26 g/cm3, a glass transition temperature of 55°C – 60°C, and a poisson’s ratio of 0.33s. The PLA filament was sourced from Dream shapes, India and it is depicted in Figure 1. The hexagon lattice-cored sandwich specimens are fabricated using this respective filament. (a) Polylactic acid filament (b) Fused filament fabrication printer.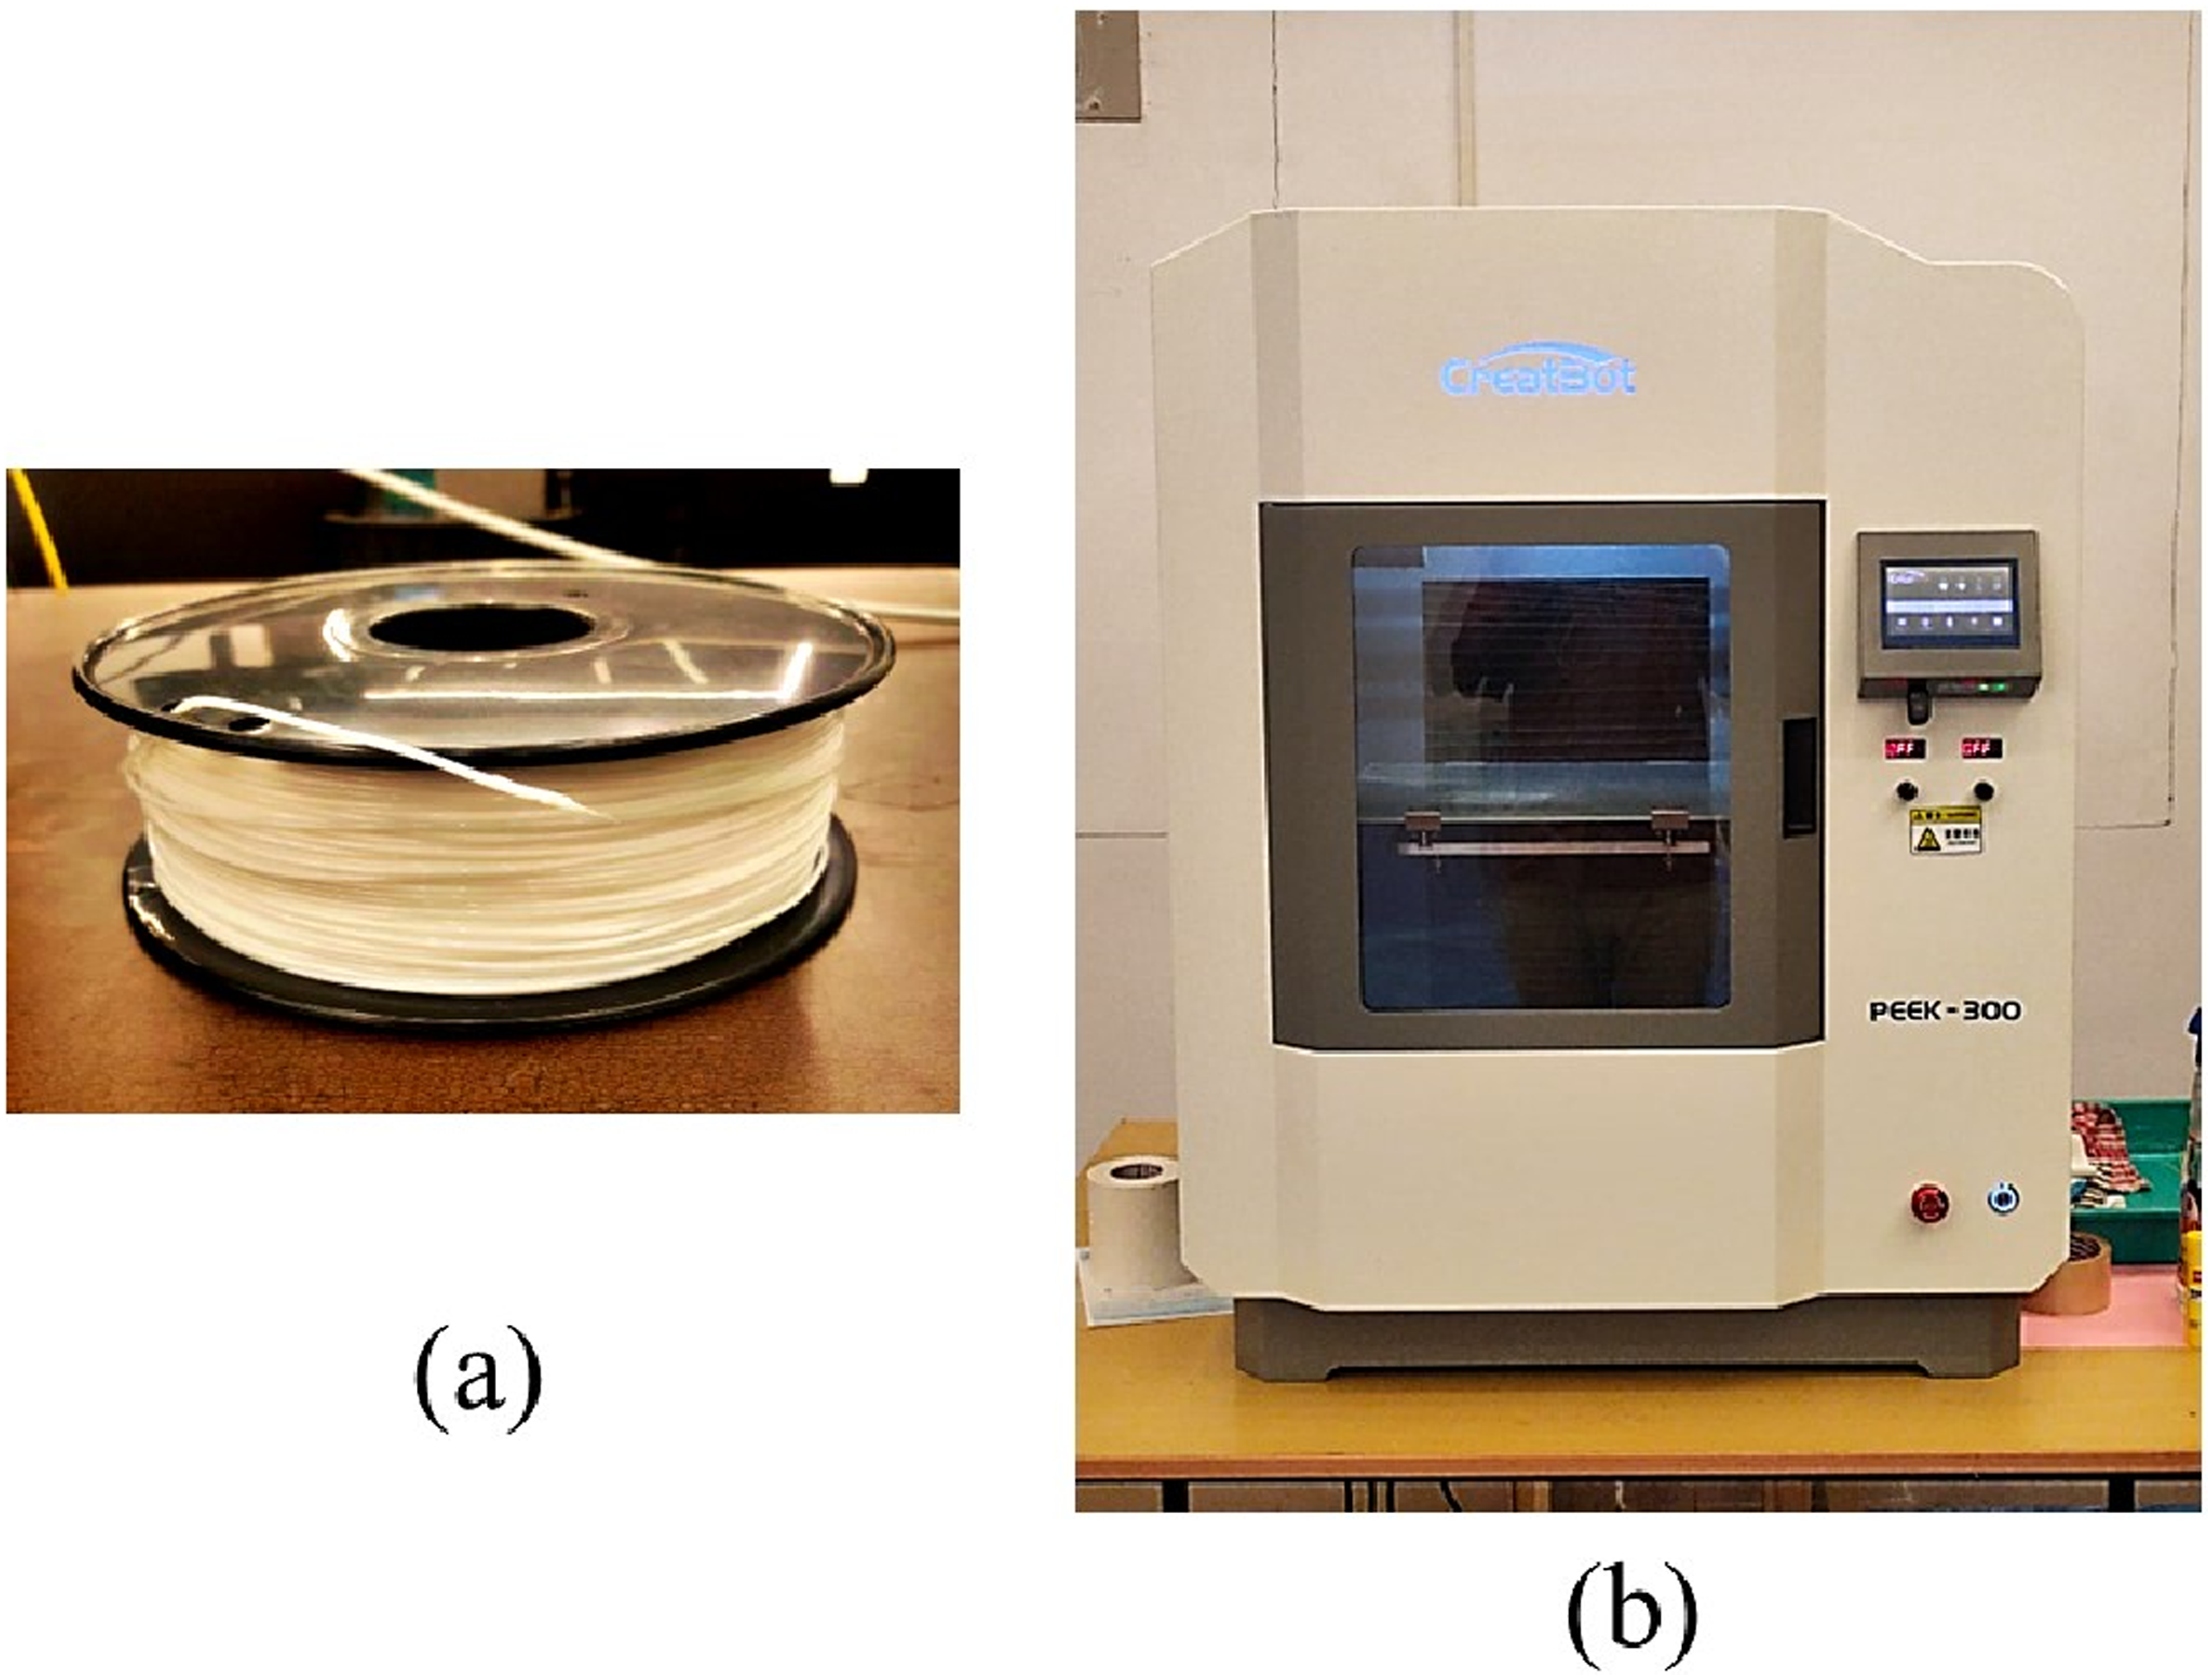
Design and fabrication of sandwich samples
The procedure for designing hexagon lattice-cored sandwich structures encompasses several steps. Initially, the dimensions of the hexagon lattice-cored sandwich specimens are determined in accordance with ASTM D695 standards. These compression specimens are composed of three sections: Top, Middle, and Bottom. The Top and Bottom sections feature a solid cylindrical plate with a thickness of 1 mm, while the Middle section incorporates a hexagon-latticed cylindrical core with a thickness of 23.4 mm. The dimensions of the cylindrical specimen are a height of 25.4 mm and a diameter of 12.7 mm. The integrated hexagon structure has an edge length of 0.92 mm and a wall thickness of 0.5 mm. the hexagon lattice-cored cylindrical sandwich specimens are manufactured with consistent level of 3D-PFs including a rectilinear infill pattern, 100% infill density, raft-type bed adhesion, a 100% infill flow rate, and a bed temperature of 60°C. Figure 2 illustrates the schematic design workflow for the hexagon lattice-cored compression specimens. (a) Microscopic view of the sandwich core, (b) Top view, (c) Front view, (d) Section view of lattice core zone, and (e) Fabricated specimen.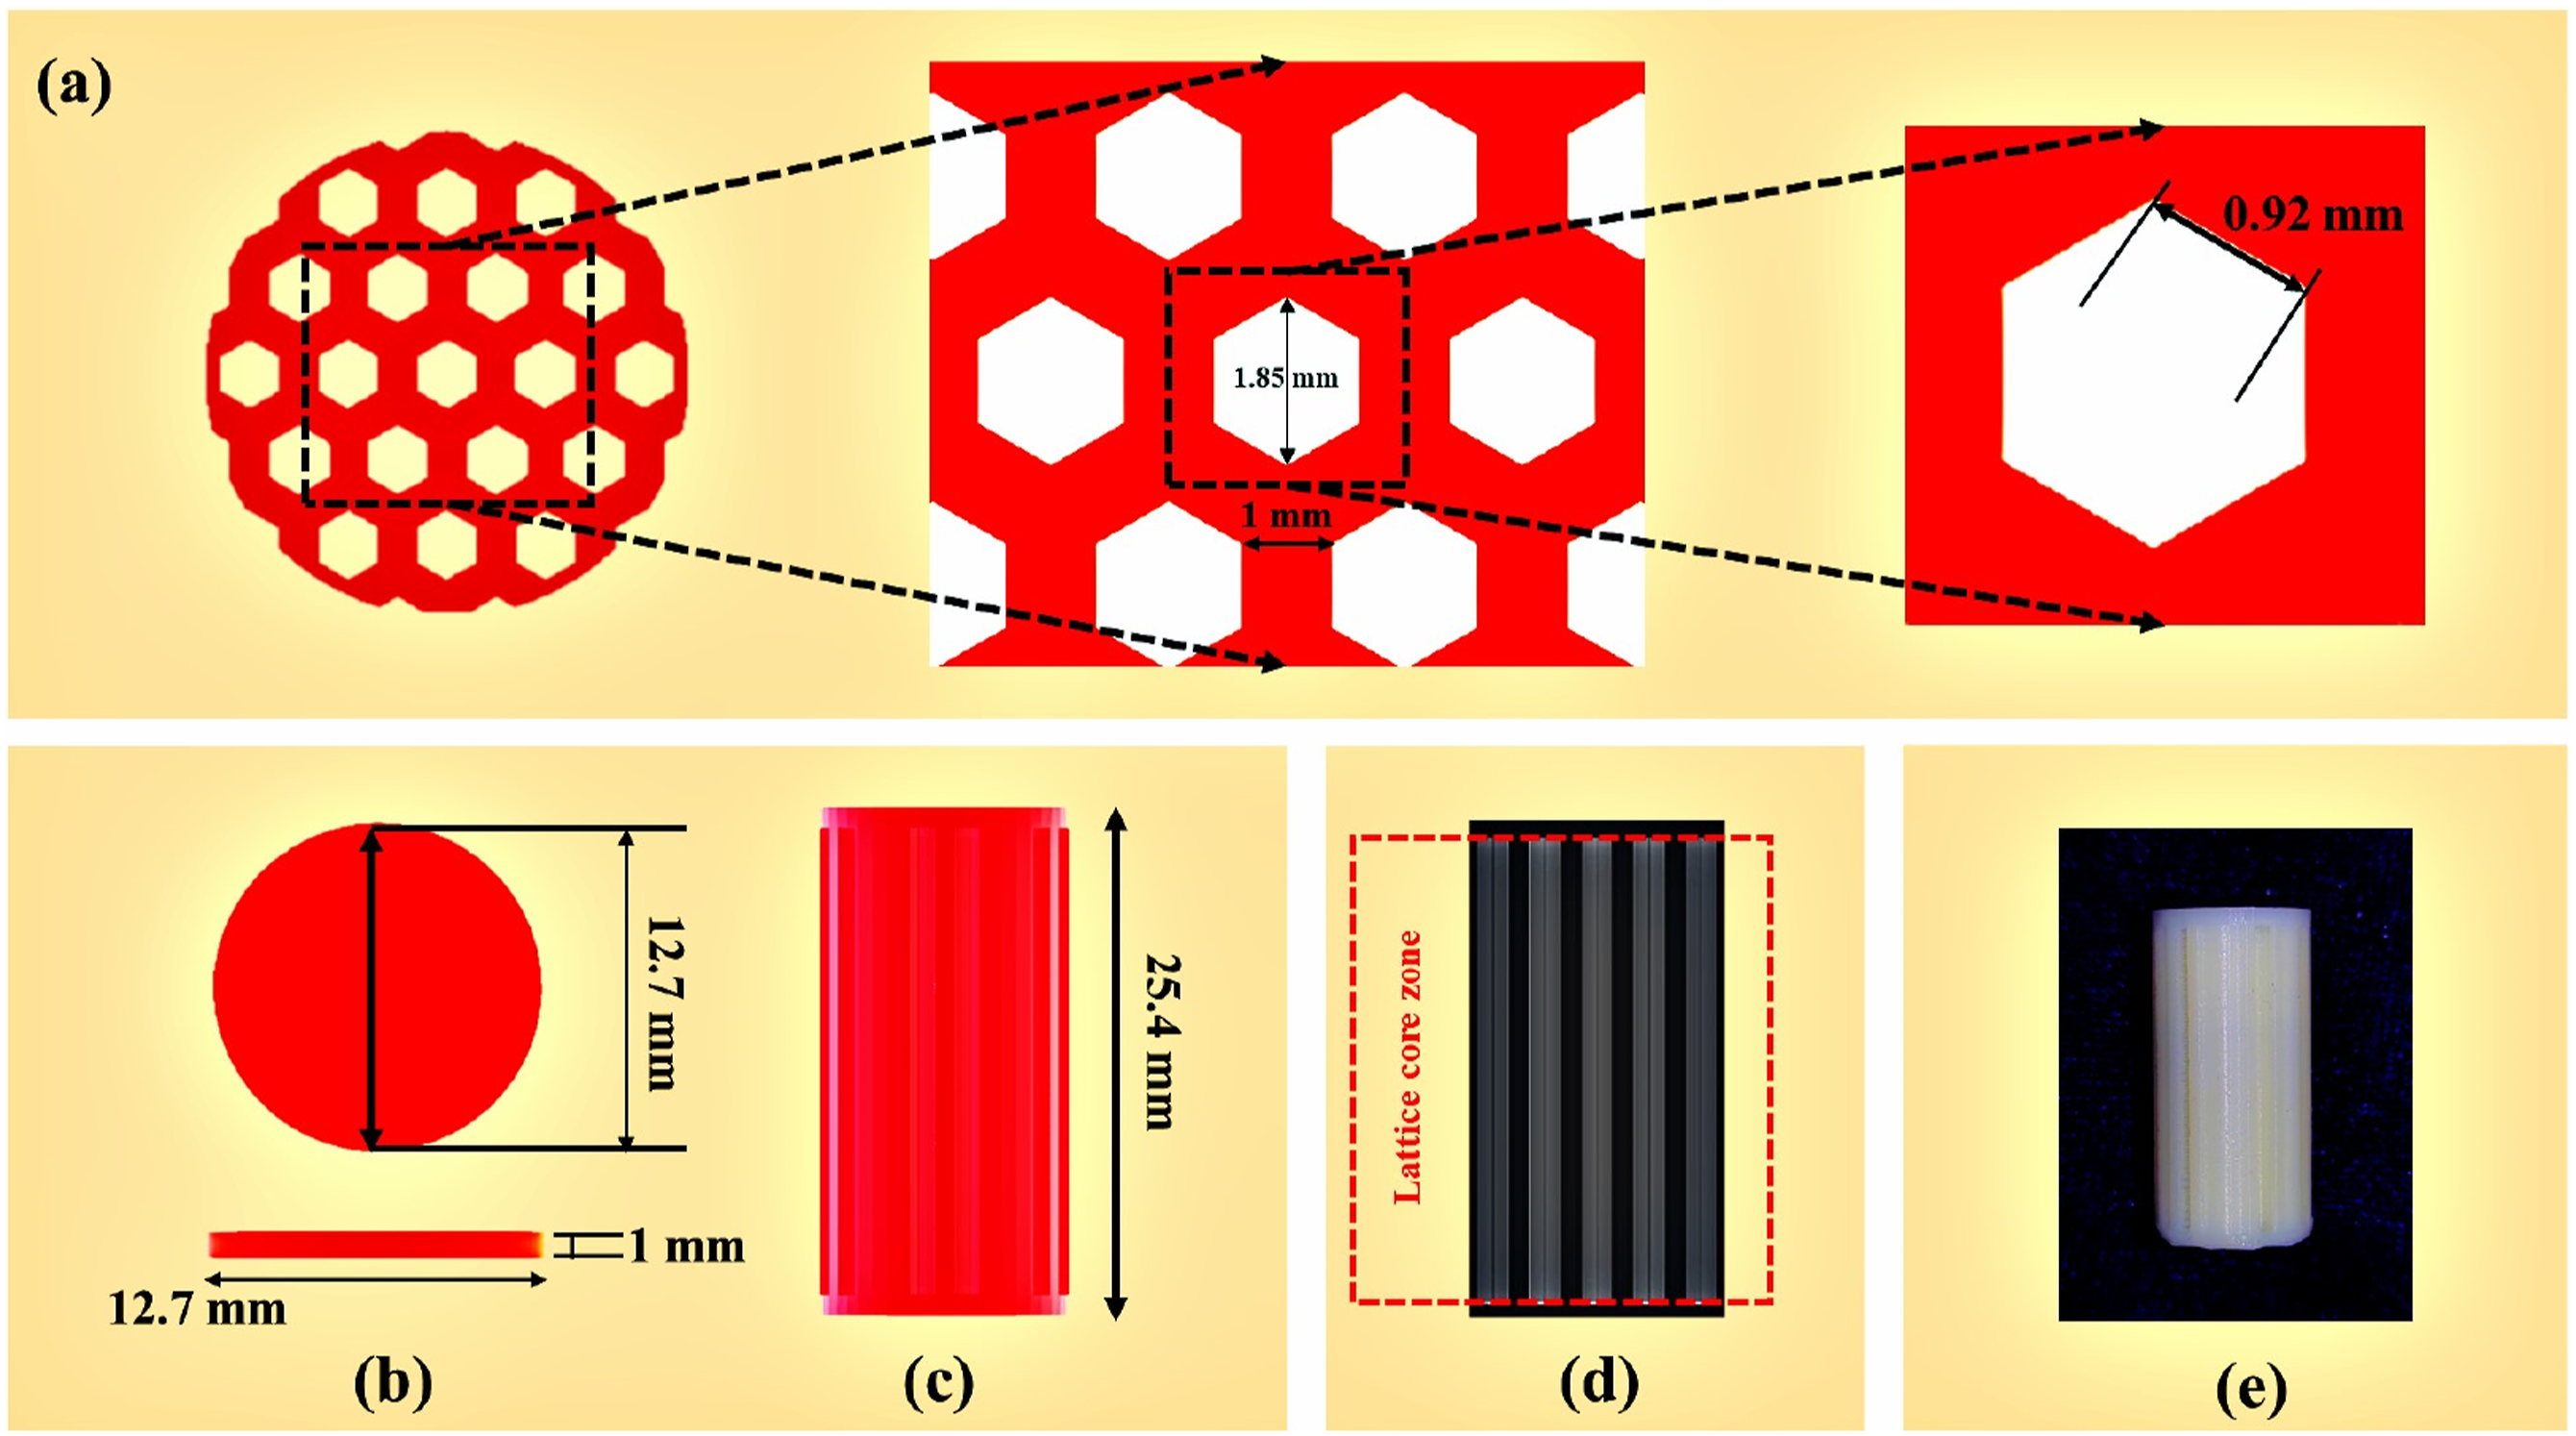
Selection of input material-printing factors
L16 orthogonal array.
Characterizations of fabricated sandwich specimens
The mechanical assessment of the hexagon lattice-cored sandwich specimen is carried out utilizing a Universal Testing Machine (UTM, Instron) featuring a maximum load capacity of 50 kN. Following the guidelines set by ASTM D695 standards, a compression test is executed at a controlled rate of 1 mm/min. In this procedure, each specimen is individually placed between the loading plates of the UTM and subjected to compressive loads. Six specimens are tested for each unique test condition, and the mean compressive strengths are utilized as input data for evaluating the compressive strength/density property.
Before the mechanical testing of the hexagon lattice-cored sandwich specimen, their weights are measured using a Pioneer Semi Micro (PX125D) weighing scale (Make: Australia). For each trial, the mass of five identical specimens is recorded and averaged. Using this average mass, the density of the specimen is calculated according to the formula represented in equation (1). Additionally, the volume of lattice-structured specimen is measured using CAD software.
The evaluated density of the lattice-structured composites is used to determine the compressive strength/density property. These evaluated responses are then utilized in the optimization process using ML algorithms.
Machine learning models
The current study employs several ML models, including Bayesian Ridge regression (BRid), Elastic Net regression (EN), Quantile regression (QR), and Support Vector Machine (SVM), to assess the influence of various 3D-PFs on the compressive strength/density of additively manufactured lattice-cored sandwich specimens. The detailed descriptions of each ML model are provided in the following sections. Figure 3 depicts the pictorial illustrations of the various ML models employed in the present study. Machine Learning models employed in the present study (a) Bayesian Ridge regression, (b) Elastic net regression, (c) Quantile regression, and (d) Support Vector Machine.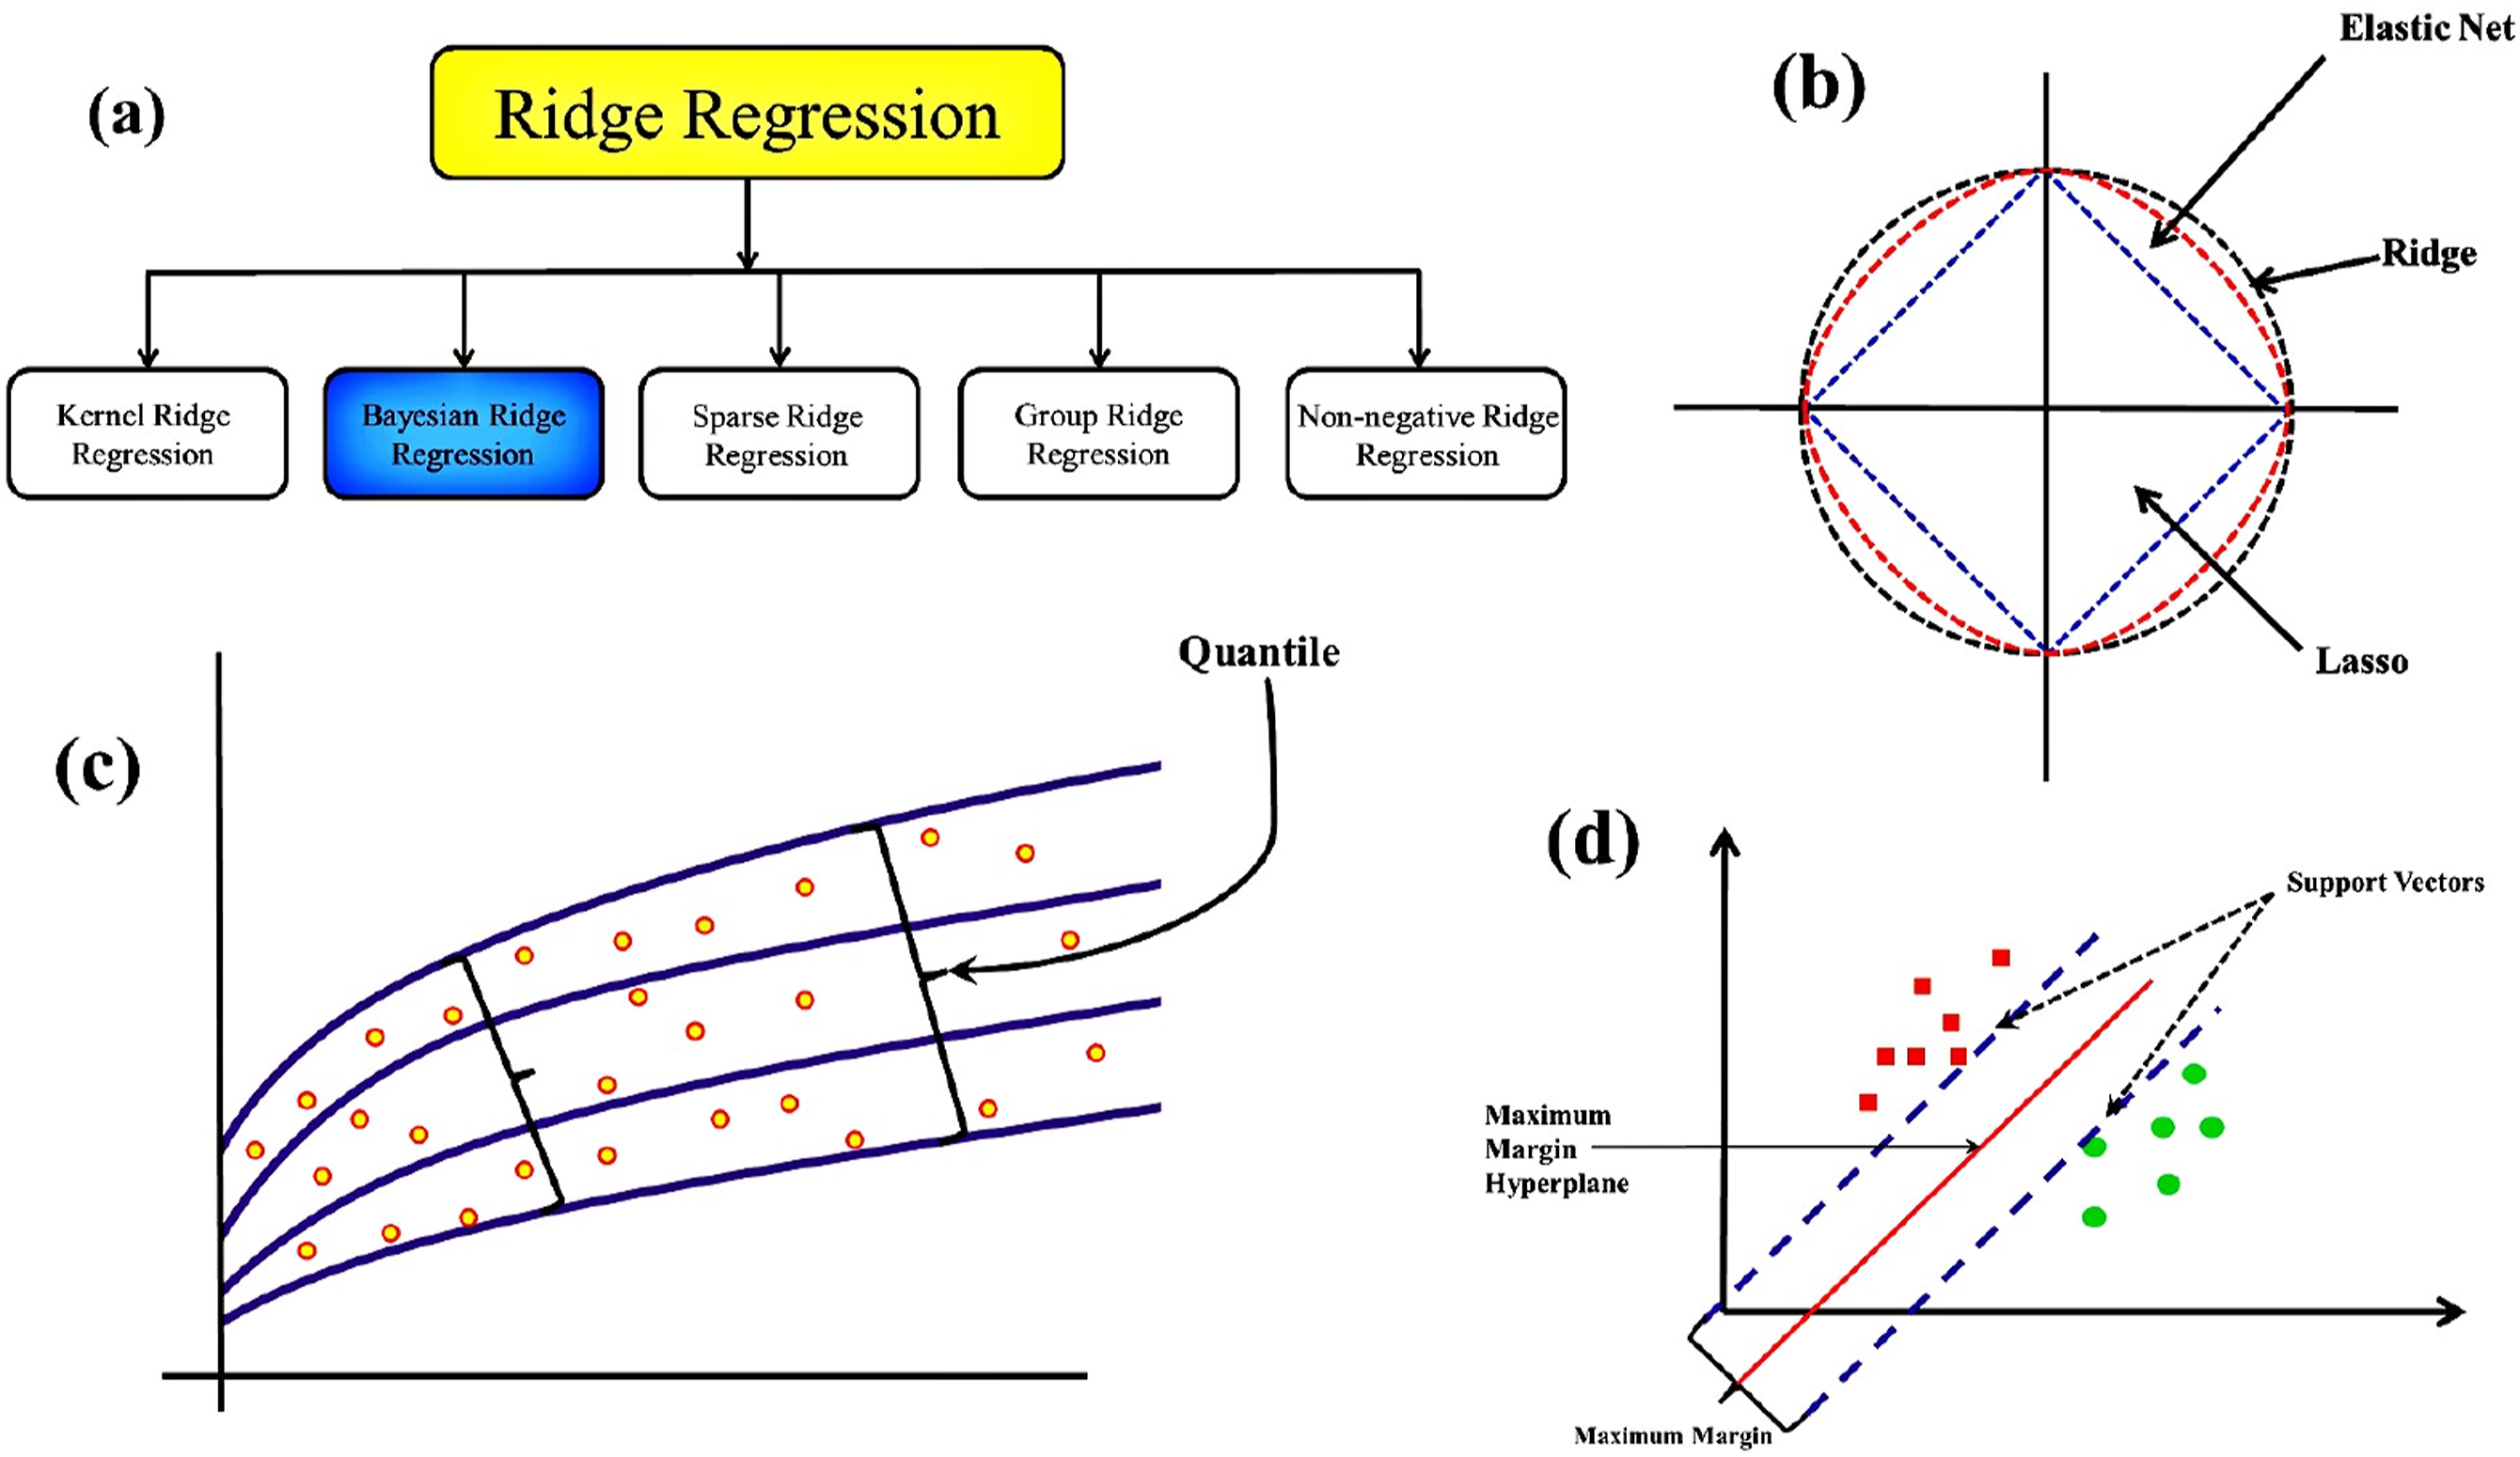
Bayesian Ridge regression (BRid)
Bayesian Ridge regression (BRid) is a type of Bayesian regression that offers a probabilistic approach to estimate a regression model. It combines the use of Bayesian inference with ridge regression to examine the issue of multicollinearity, which is common in linear regression. One of the advantages of BRid is its ability to incorporate hyperparameters that control the shape and variability of the prior distributions. These hyperparameters can be adjusted to control the level of regularization and maintain the balance between model complexity and fit of the data. Additionally, BRid is particularly useful in handling multicollinearity, which arises when predictor variables are highly correlated with each other. The mathematical formulation for predicting the target variable by employing BRid regression model is illustrated in equation (2).
Elastic net regression (EN)
The Elastic Net regression (EN) combines both lasso (L1) and ridge (L2) penalties to establish a balance between model sparsity and coefficient shrinkage. A hyperparameter (alpha) is employed for controlling the relative strength of each penalty. EN model is particularly useful when dealing with high-dimensional datasets that have many features, and in addition when these features are highly correlated. In these situations, EN model is preferred due to its capability in combining the significance of both ridge and lasso regressions to achieve a balance between these two methods by developing a model which has both sparse and lower coefficients. The empirical formula for predicting the target variable by employing EN model is depicted in equation (3).
Quantile regression (QR)
Quantile regression (QR) is a statistical technique that extends traditional linear regression by estimating conditional quantiles of the dependent variable. This model helps to investigate the relationship between the independent variables and the varying quantiles of the dependent variable throughout the distribution. This regression is more valuable when working with unevenly distributed or heavy-tailed data. This model provides a more flexible and versatile approach for analyzing data in comparison to traditional linear regression. It does not heavily rely on assumptions such as linearity, homogeneity of variances, independence. Additionally, this model delivers an adaptive approach that can handle non-linear relationships, unequal variance and deviations from normality in the residuals. Equation (4) illustrates the mathematical formula used in predicting the target variable by employing the QR model.
Support vector machine (SVM)
Support Vector Machine (SVM) is proficient in both classification and regression. In regression tasks, Support Vector Regression (SVR) identifies the optimal hyperplane to predict numerical values. SVR aims to minimize the error between predicted and observed values incorporating a tolerance margin for flexibility. SVR handles both linear and nonlinear regression through kernel functions providing versatility. It can be applied to large datasets but computational complexity scales with size. The hyperplane in SVR represents the optimal fit which is influenced by key data points. These key data points are known as support vectors. Equation (5) depicts the mathematical formula employed for target variable prediction by SVR model.
Ensemble learning techniques
Ensemble learning is a ML technique that aggregates the predictions of multiple individual models to improve the prediction accuracy, stability and generalization of a base model. Ensemble learning is deployed to minimize the variance and bias by combining the prediction of sub-models. Ensemble learning is broadly categorized into two types: homogeneous ensembles and heterogeneous ensembles. Homogeneous ensembles, such as bagging and boosting, utilize repetitive data from multiple instances to train a single base model. In contrast, heterogeneous ensembles illustrated by Stacking, incorporate diverse models employing various learning techniques.
Bagging
Bagging is a popular ensemble learning technique that is employed to reduce variance and improve the generalization and stability of model predictions. Bagging involves independently training the multiple base models of random subsets of the training data. Once the base models are trained Each base model provides its own set of predictions based on its learning methods. By employing voting or averaging methods, the final prediction of base models is aggregated to mitigate the influence of outlier and noisy data points.
Boosting
Boosting is a well-known ensemble learning method unlike bagging or stacking, which is mainly focused on to reduce the variance and bias. It involves aggregating the several weak learners to improve model efficiency. In each iteration the model learns from previous misclassified algorithms by assigning more weight to weak learners. The boosting technique is mainly employed for developing a model with perfect fit. The widely used boosting algorithms such as AdaBoost, Gradient boosting, and XGBoost boosting are extremely effective in dealing with complex datasets to increase the value of prediction outcomes.
Adaboost, also known as adaptive boosting, is a frequently used ensemble learning algorithm. In the training process. It assigns a weight to each weak classifier depending on its level of accuracy. It increases the weights of the incorrectly classified training data with each iteration. The process is continued until the lower error is achieved. It is able to handle complex datasets, handle noise, and mitigate overfitting. It primarily focuses on tuning the misclassified sample and increasing the accuracy of the model.
Stacking
Stacking is also known as stacked generalization and it is an ensemble learning method employed to enhance the accuracy and generalization of the final model by aggregating the predictions of multiple base models along with meta-model. The objective of stacking is to enhance the effectiveness of overall prediction and reduce the error. The process of stacking is commonly divided into three stages. Initially, the training data is divided into several subsets and multiple base models are trained on each individual subset. Secondly, the predictions of each individual base model are utilized as an input for a meta-model. Finally, the results are generated by combining the base model’s predictions in order to generate improved final outcomes.
Hyperparameter tuning
Hyperparameter tuning stands as a crucial phase in ML, it is the systematic adjustment of a model’s performance by fine-tuning a set of parameters tailored to a specific dataset. The objective of this optimization is to improve the model’s effectiveness by minimizing errors in predicting continuous outcome variables. The key parameters that significantly influence the model’s performance are regularization, learning rate, the number of estimators, and the number of features. Various strategies, such as grid search, random search, and bayesian optimization, can be employed to fine-tune regression models. Grid search, a widely adopted technique, thoroughly explores all potential combinations of hyperparameters within a defined grid to determine the optimal performance for a given dataset.
Data interpretation plots
Partial Dependency Plot (PDP)
The Partial Dependence Plots (PDP) is used to analyze the behavior of the best performing ML models. PDP illustrates the correlation between the target variable and the dependent variable. PDP provides a visual representation of how these features influenced the model’s predictions. The use of PDP enhances the interpretability of the best ML models, facilitating a deeper understanding of their performance and behavior.
Box whisker plots
Box whisker plots provide a convenient means of visually representing the distribution of data by showcasing quartiles. These plots feature whiskers that depict the variability beyond the upper and lower quartiles of the dataset. They can be presented either vertically or horizontally. These plots are valuable for assessing the impact of various features on the outcome and identifying outliers associated with specific features. They prove particularly effective in detecting potential skewness, outliers, and variations in the dataset’s spread.
Pair plots
Pair plots serve as a graphical tool to illustrate the correlation between input factors and output response. Each data point is represented as a dot on a cartesian system, with the X-axis dedicated to plotting input factors and the Y-axis dedicated to the output response. By employing this visualization technique, pair plots play a crucial role in the identification and understanding of outliers, making substantial contributions to processes such as data cleaning, preprocessing, and anomaly detection.
Residual plots
Residual plots are employed to assess the effectiveness of a regression model. These plots facilitate the examination of the relationship between the predicted values (X-axis) and their corresponding residuals (Y-axis). The primary objective of residual plots is to distinguish any patterns, trends, or outliers within the residuals. This analysis is vital for evaluating the goodness of fit and overall quality of the predictive model.
Scatter plots
Scatter plots are utilized to visually represent data points on a two-dimensional graph, aiding in the analysis of relationships between two variables and the identification of patterns or trends. In these plots, a greater distance between data points and predicted values signifies higher model error and less precision. Conversely, a smaller distance indicates lower error and a more effective predictive model. Scatter plots are helpful in assessing the performance of a model and its ability to make accurate predictions.
Error metrics
The performance of different ML models is determined by using a variety of error metrics. The common metrics such as Root Mean Squared Error (RMSE), Mean Absolute Error (MAE), and Median Absolute Error (MedAE). These metrics are proved to quantitatively measure the accuracy and effectiveness of the models. The results provide insights into the strengths and limitations of each model, aiding in the selection and optimization of ML algorithms for specific tasks.
Root Mean Square Error (RMSE)
The Root Mean Square Error (RMSE) is an evaluation metric which is used to assess ML model’s performance on a given input dataset. RMSE quantifies the average magnitude of differences between predicted and actual values, representing the model’s prediction accuracy. By calculating and analyzing the RMSE, the quality of model fit and accuracy in predicting the output variable were assessed. This evaluation metric facilitated model comparison and selection based on the lowest RMSE, indicating superior performance in minimizing overall prediction errors on the given input data. Equation (6) illustrates the mathematical formulation of the RMSE.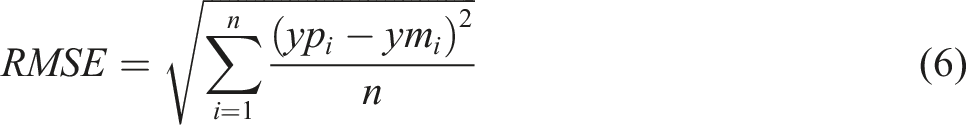
Mean Absolute Error (MAE)
The Mean Absolute Error (MAE) is used as an evaluation metric to assess ML model’s performance on a given input dataset. The MAE measures the average absolute difference between the predicted and actual values of the output variable. It quantifies the model’s average prediction error. By calculating and analyzing the MAE, the accuracy of the models in predicting the output variable was determined. Equation (7) depicts the mathematical formulation of MAE.
Median Absolute Error (MedAE)
The Median Absolute Error (MedAE) serves as a metric for evaluating the performance of a regression model. It quantifies the median absolute difference between the observed values (true values) and the model’s predictions. This metric is especially beneficial in scenarios where outliers may have a pronounced effect on the model’s performance. A lower MedAE value suggests enhanced predictive accuracy. Equation (8) illustrates the mathematical formulation of MedAE.
Results and discussion
Determination of the best ML model
To identify the optimal ML model for data analysis, we employed the Coefficient of Fit (CoF, R2) as a metric for comparing various models under different ensemble techniques. The ML models like QR, SVM, EN, and BRid were evaluated using bagging, boosting, and stacking ensembles. The R2 value ranges between 0 and 1, and assesses how well a model fits the data, with higher values indicating better fit. As Figure 4 shows, the boosting ensemble achieved the highest overall R2 values. Moreover, Figure 4 demonstrates the CoF range for different models within each ensemble technique, between 0.831 and 0.962. Within the boosting ensemble, QR emerged as the frontrunner with an R2 value of 0.962. Based on its superior fit, the QR model within the boosting ensemble was chosen for further data analysis and interpretation, detailed in the following sections. CoF for various ML models under different ensemble techniques.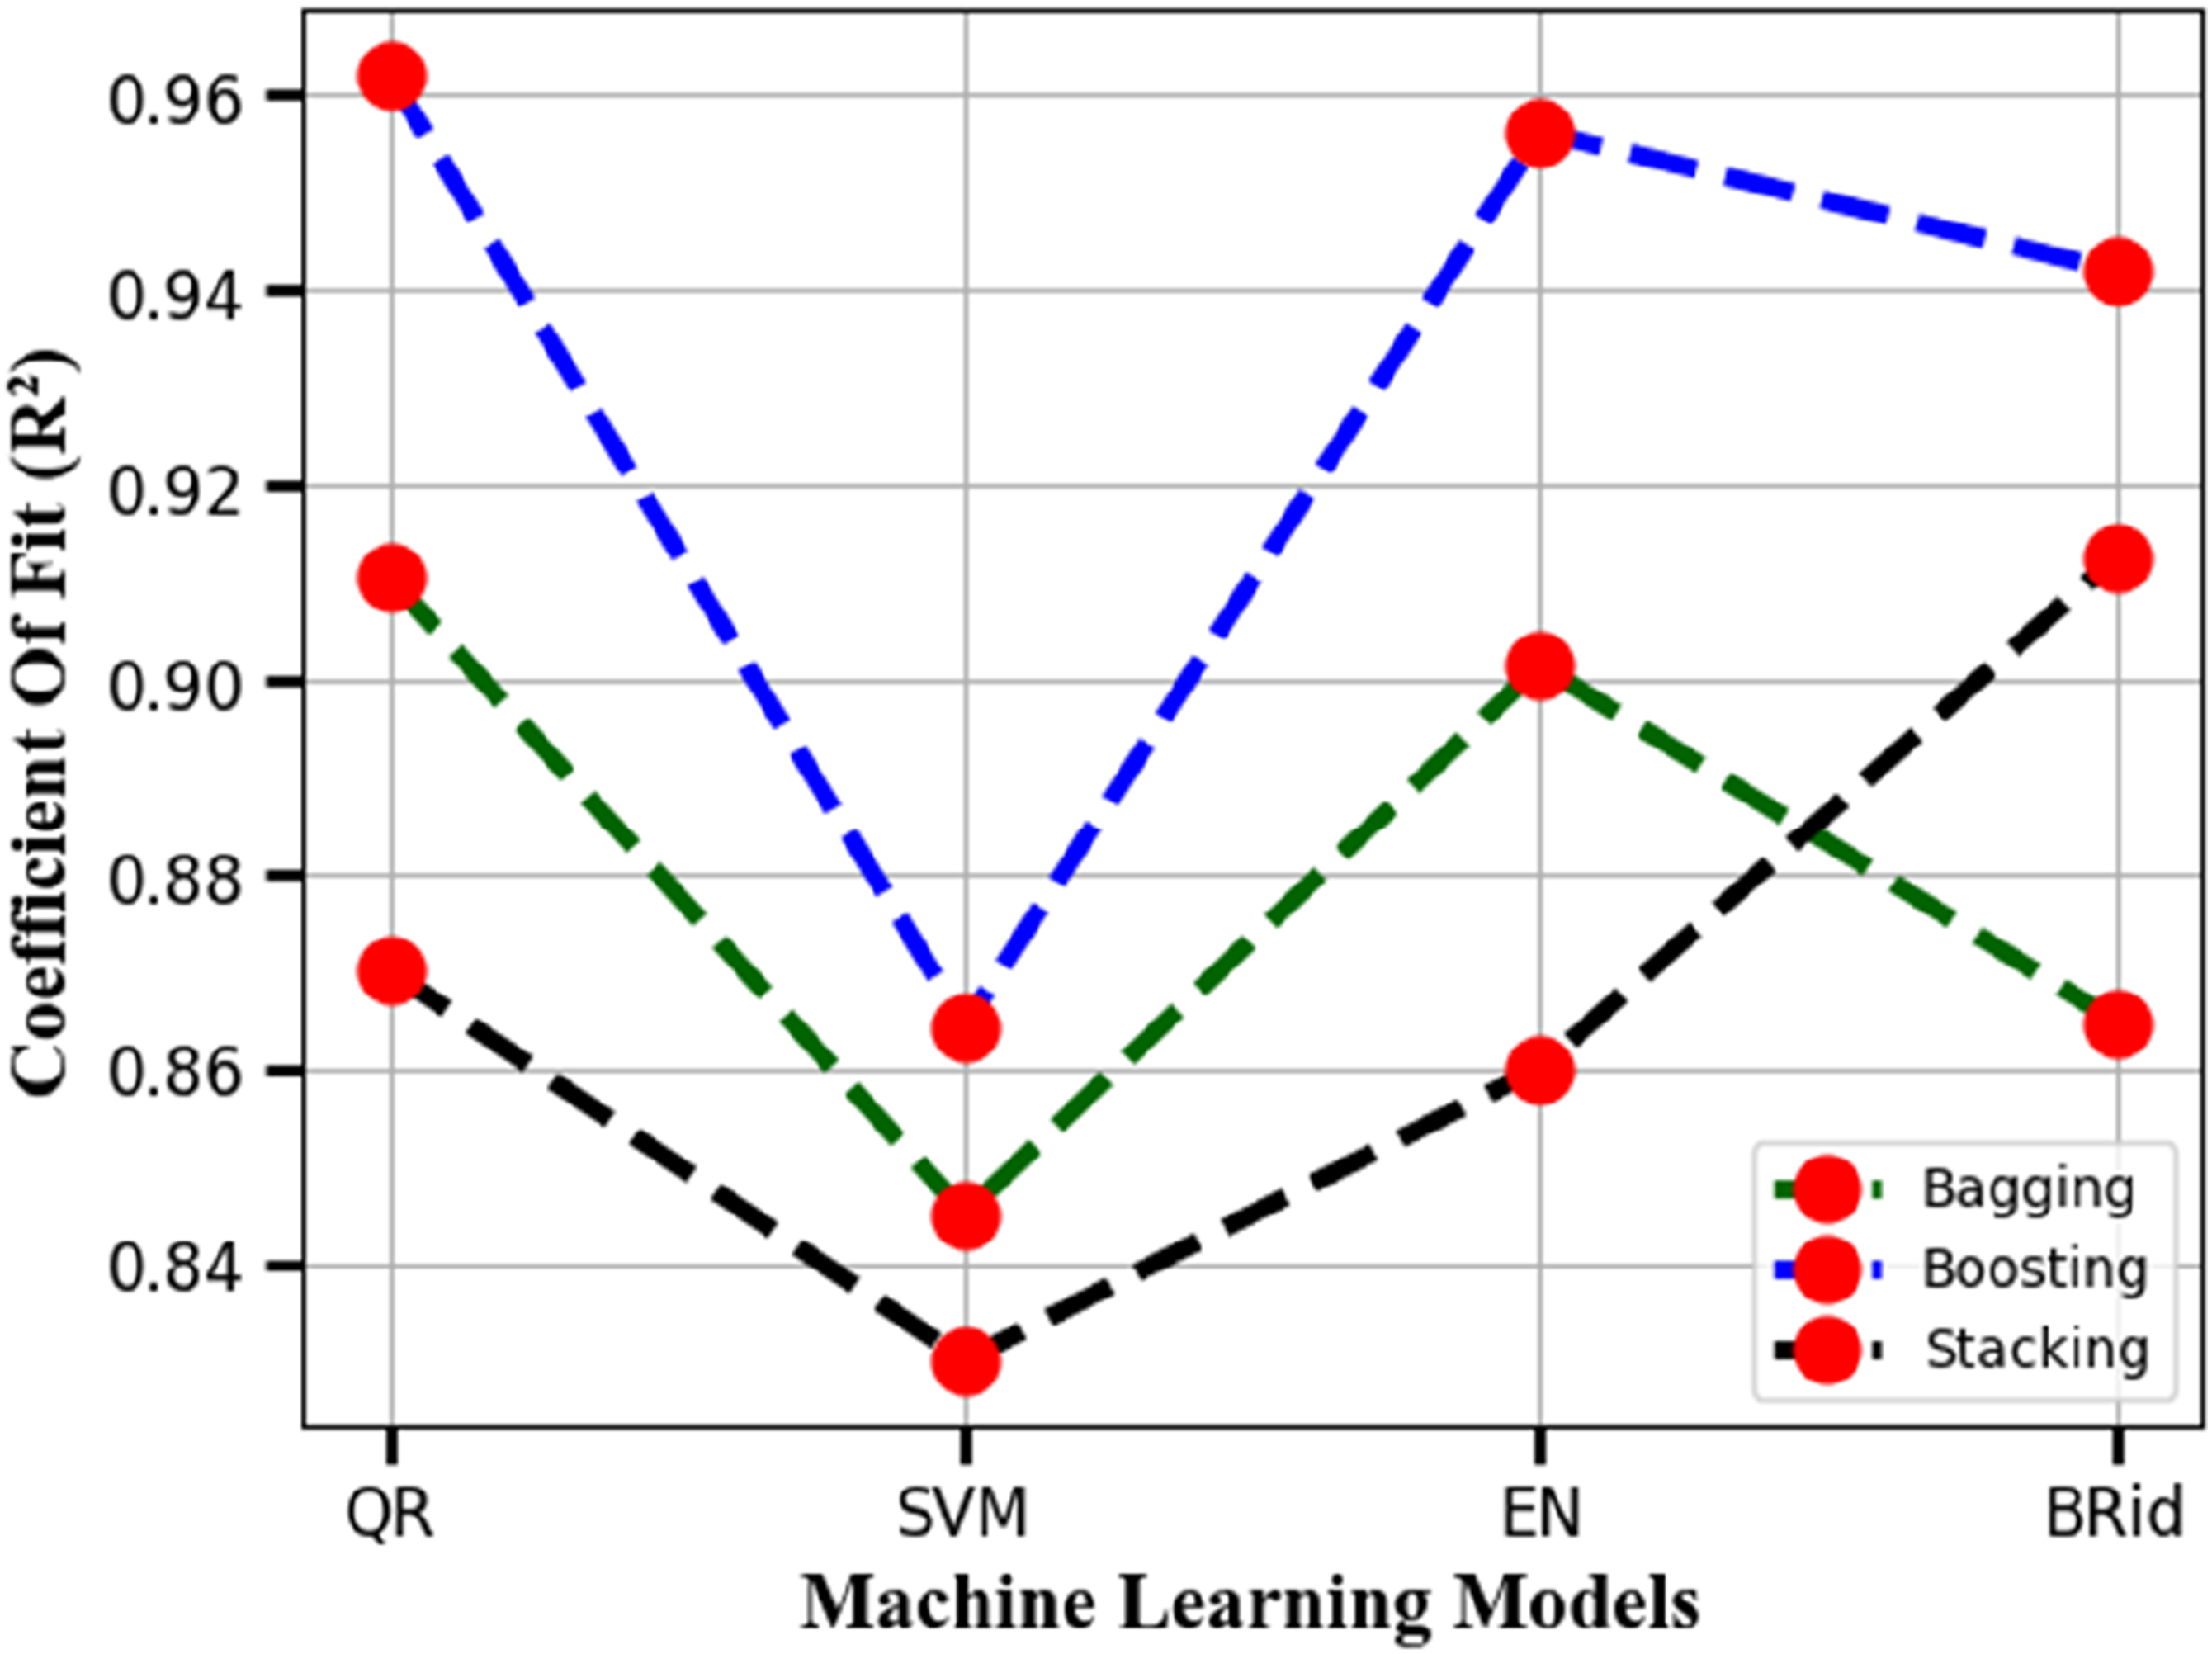
Data analysis and interpretation
The QR model, implemented within the boosting ensemble learning technique, stands out as the most optimized machine learning model for the current study. The outcomes obtained from the QR model are interpreted using various techniques, including Partial Dependence Plots (PDP), Box Whisker Plots, and Pair Plots. The objective of the PDP is to elucidate the influence of 3D-PF, specifically NT (°C), LH (mm), PS (mm/sec), and LW (mm), on the compressive strength/density of hexagon lattice-cored sandwiched specimens. In Figure 5, the PDP illustrates the effects of these various aspects of 3D-PF on the compressive strength/density of the hexagon lattice-cored sandwiched specimens. Furthermore, Figure 6 presents the box whisker plots that aid in determining the median compressive strength/density. Additionally, the pair plots in Figure 7 illustrates the correlation between input factors and the output response associated with a specific input factor. Partial Dependency Plot (PDP) of input 3D-PFs. Box-whisker plot of 3D-PFs on the compressive strength/density of hexagon lattice-cored sandwich specimens. Pair-plot of (a) Layer height, (b) Nozzle temperature, and (c) Printing speed.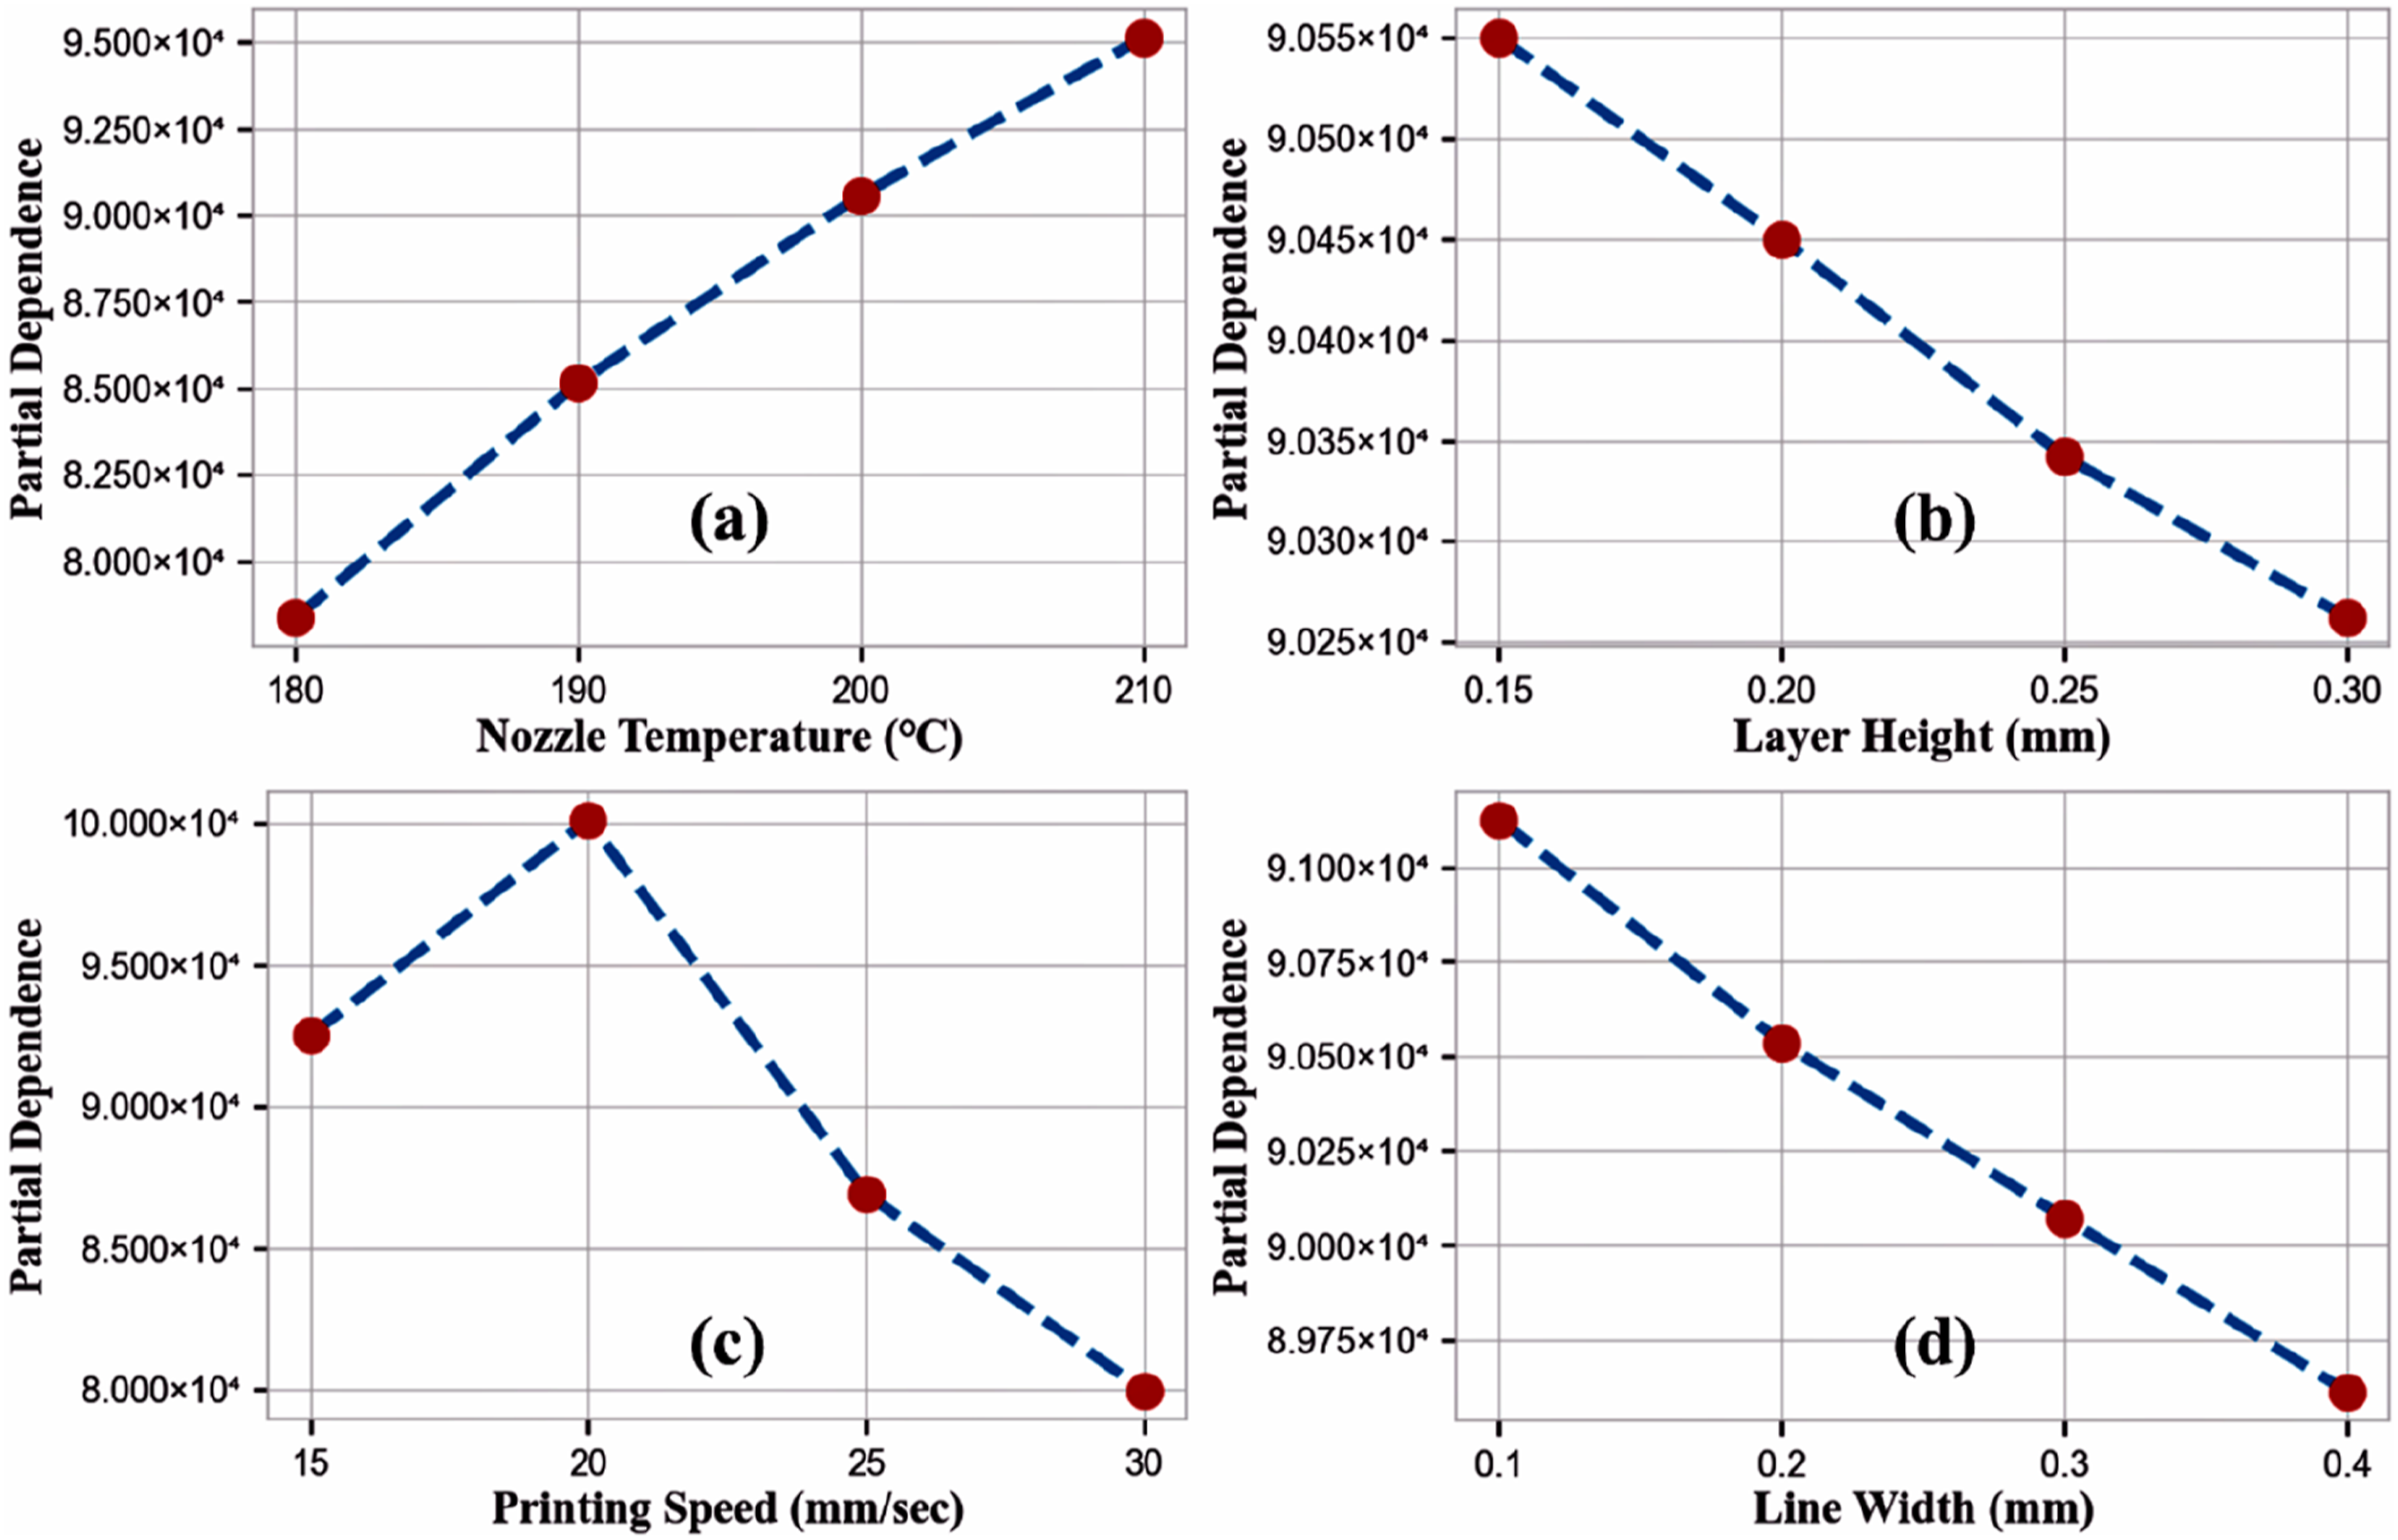
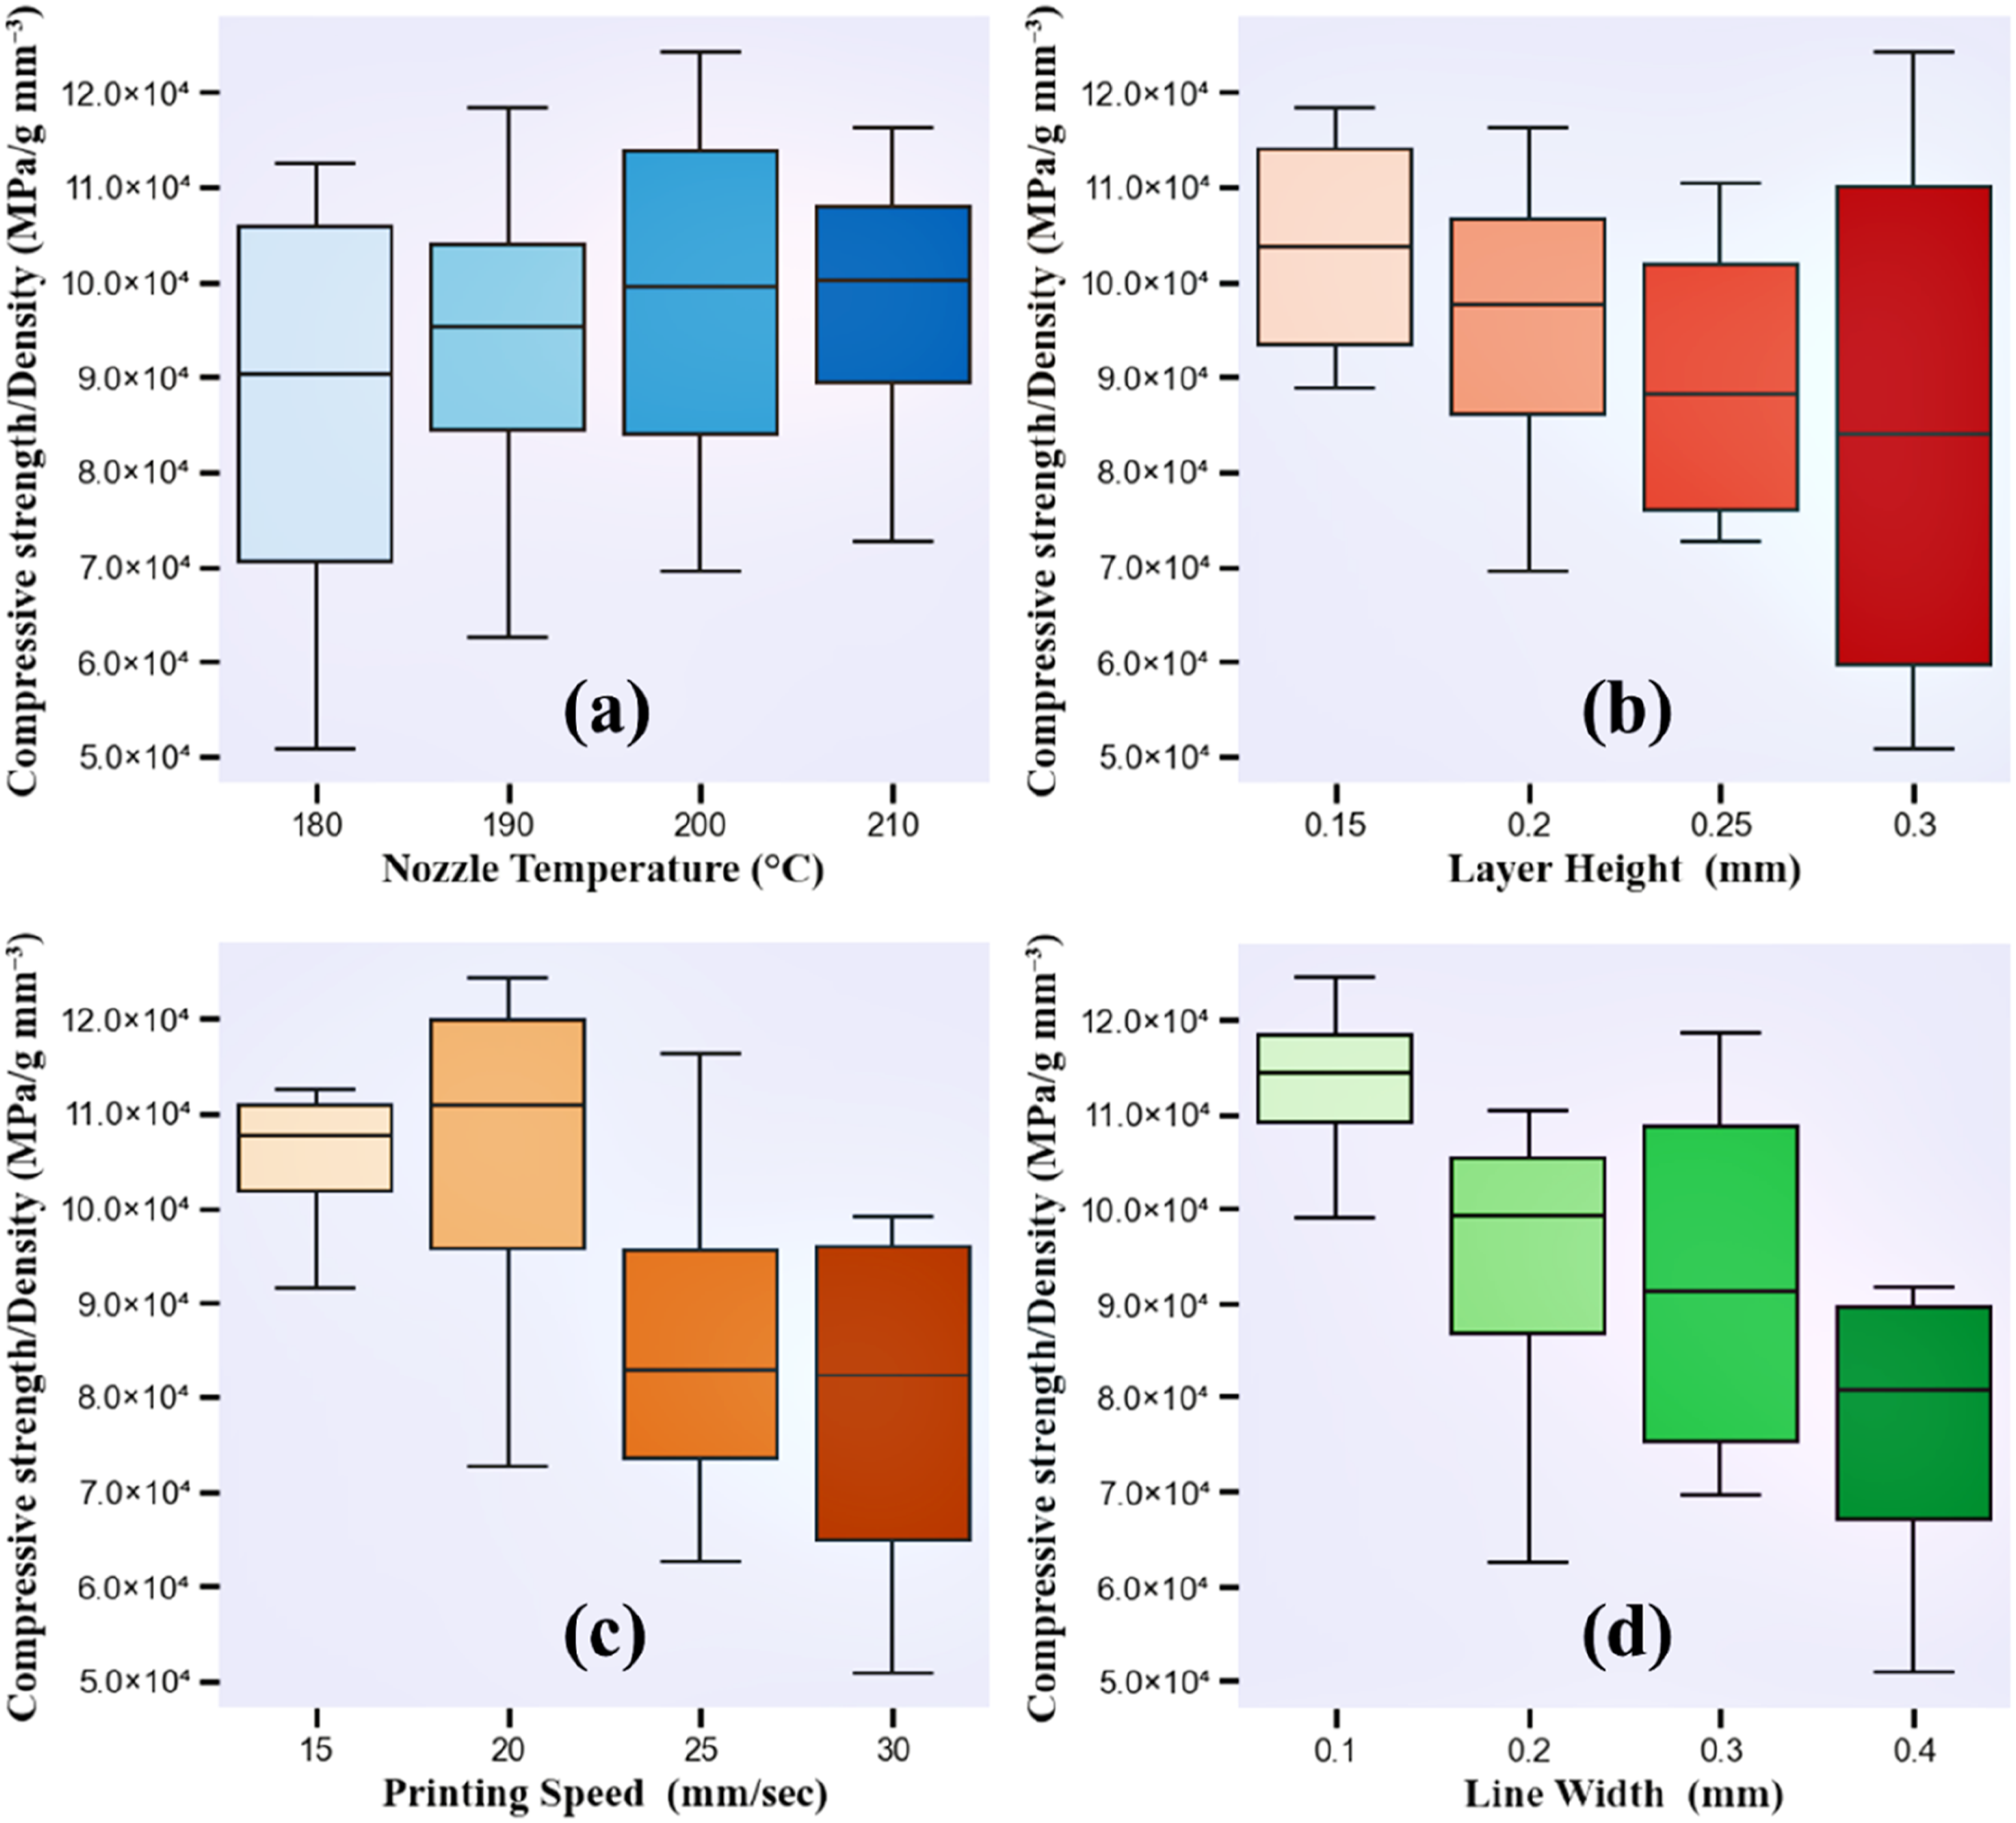
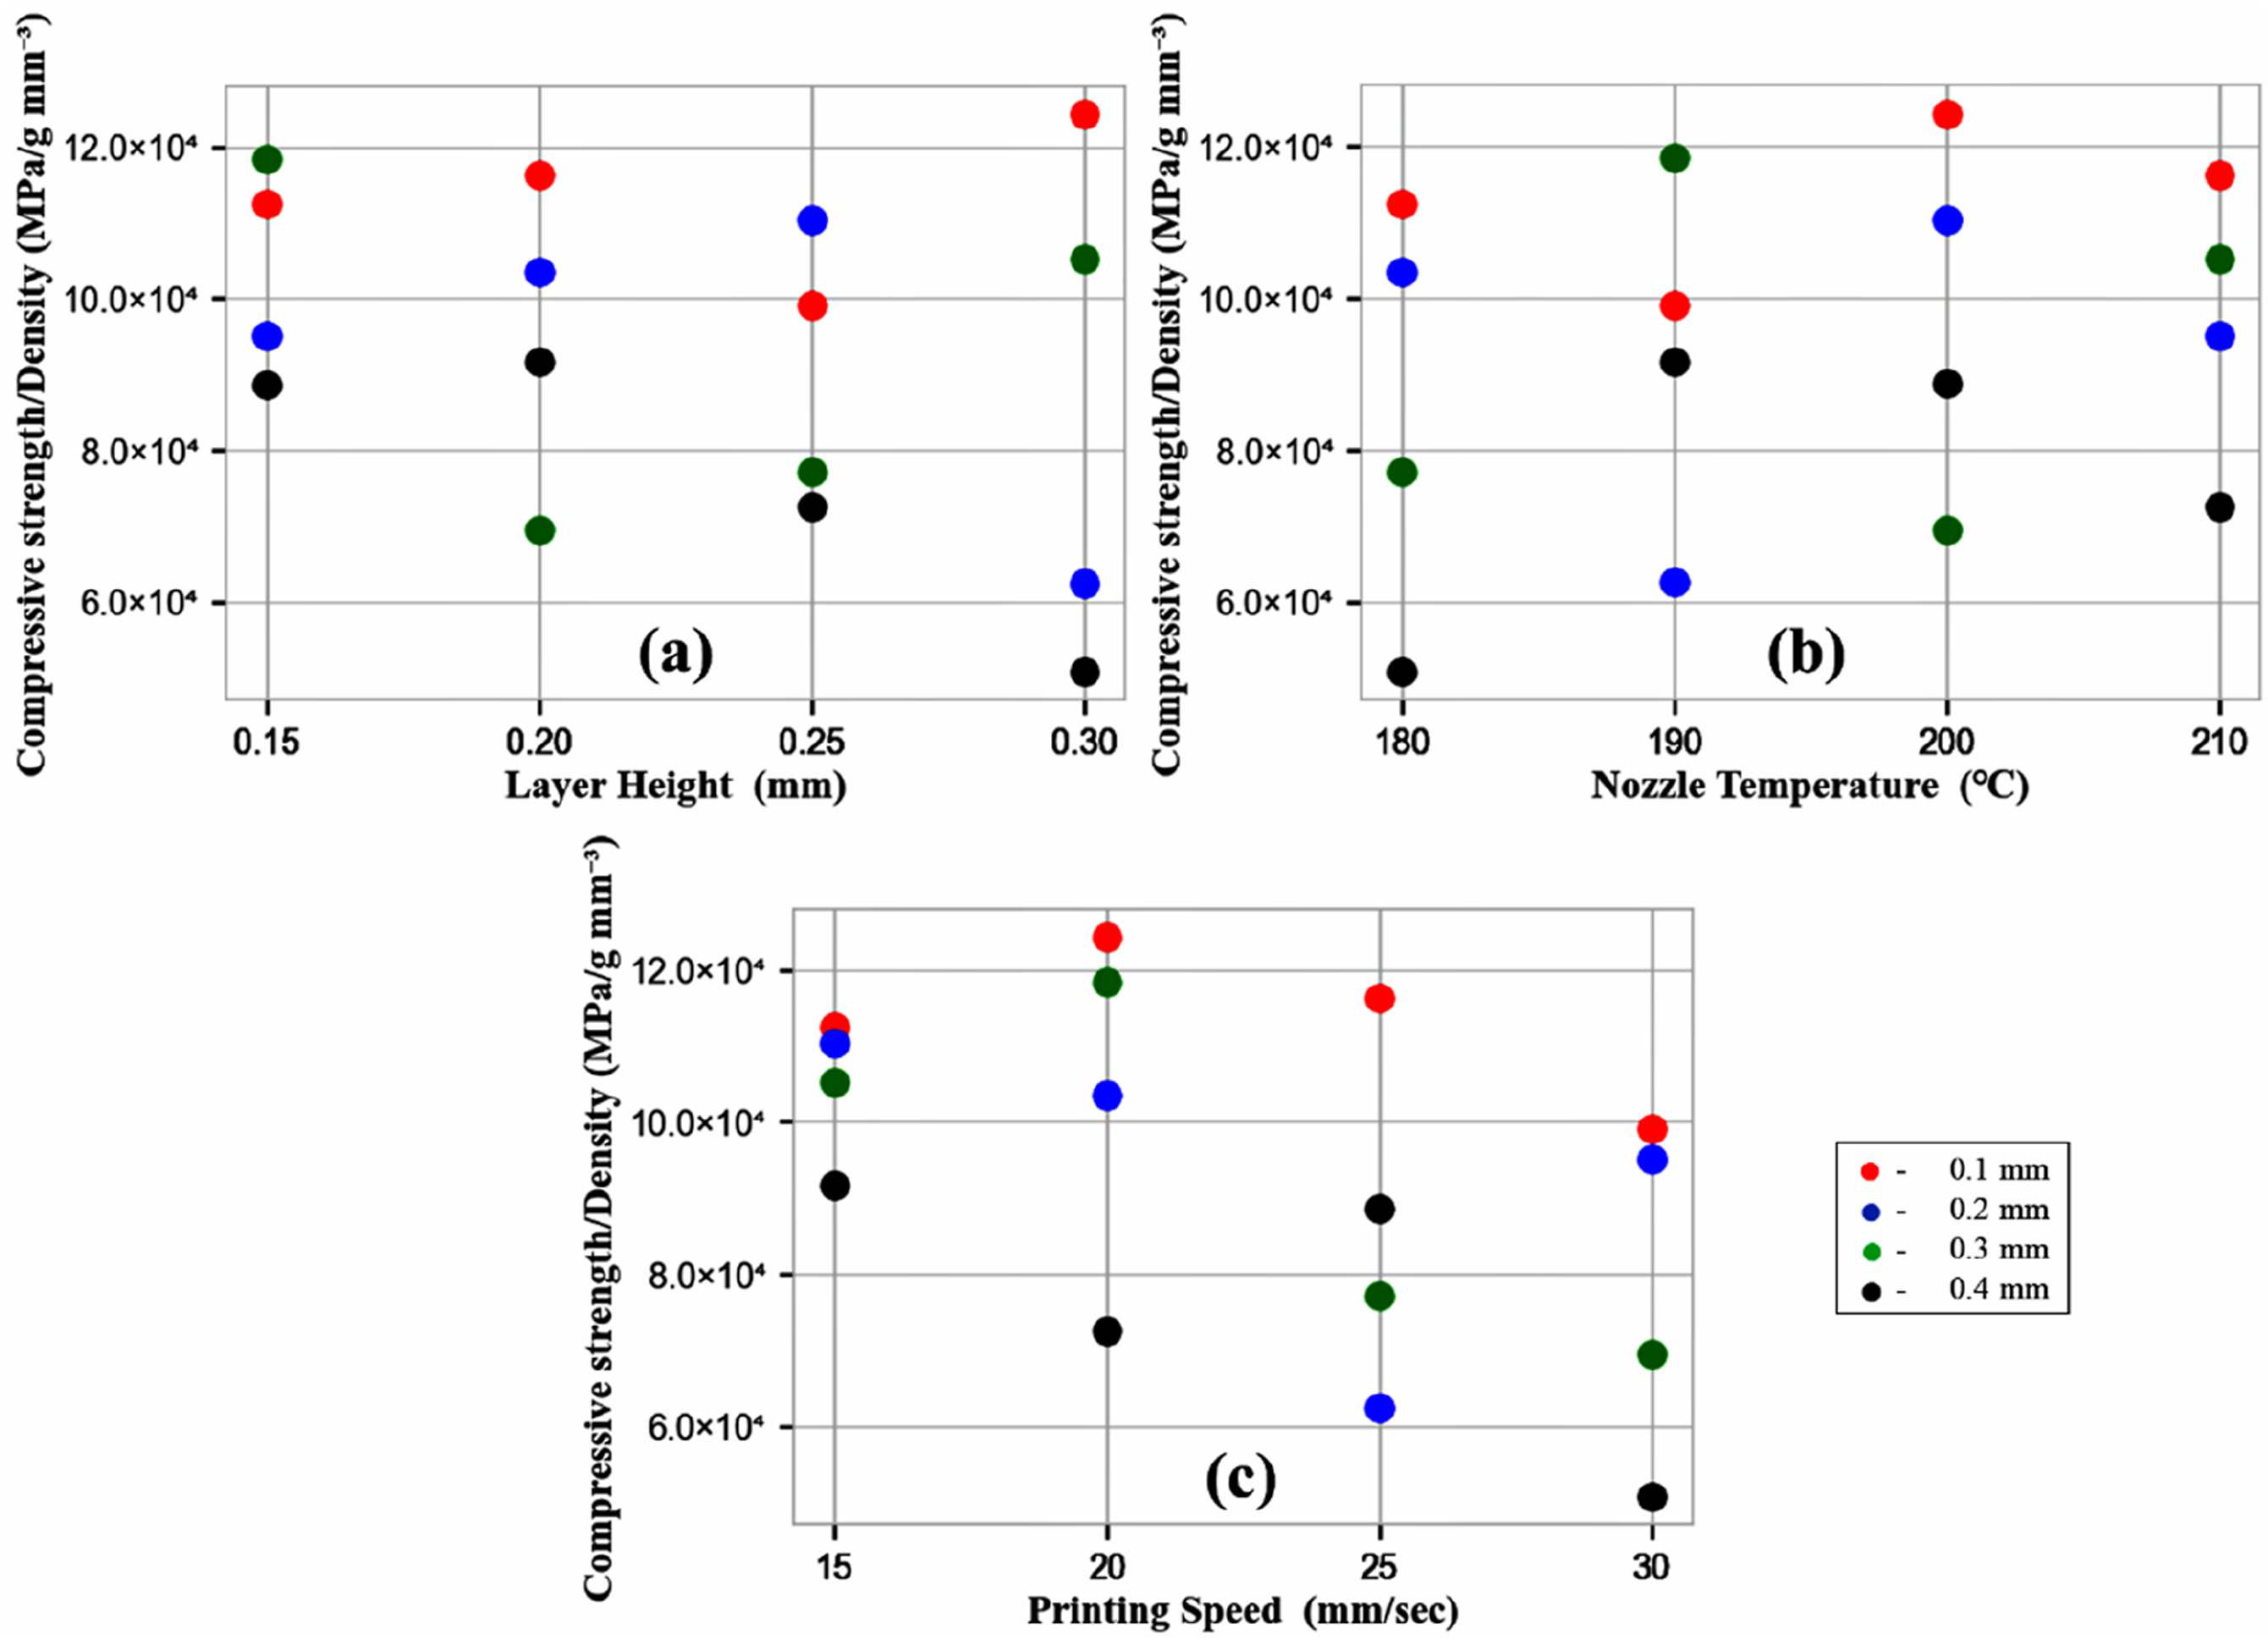
Figure 5(a) depicts the correlation between NT and compressive strength/density in terms of Partial Dependence value (PDV). The figure clearly shows that the highest PDV of 9.512 × 10⁴ is observed when hexagon lattice-cored sandwich specimens are manufactured at 210°C. At this temperature, there is proper melting and consistent deposition of the polymeric material, leading to enhanced inter-layer bonding and resulting in higher compressive strength. Additionally, the adequate melting of the material prevents layer breakage between the lateral plates and the central sandwich core. And moreover, the higher NT results in effective material deposition within the infilling zones of the sandwich structured topology and evidently results in higher compressive strength/density. In contrast, lower PDVs of 9.057 × 10⁴, 8.515 × 10⁴, and 7.837 × 10⁴ are attained at lower NTs, specifically 200°C, 190°C, and 180°C. At these lower temperatures, the rapid decrease in the degree of melting and cooling of the polymeric material results in weak inter-layer bonding, ultimately leading to a lower load-bearing capacity. Additionally, the lower NTs result in improper material deposition in the infilling topologies and consequences in lower compressive strength/density responses. A parallel remark was illustrated by Palaniyappan et al. in the instance of hexagon latticed PLA specimens. 31 Figure 6(a) presents the compressive strength/density range concerning NT using box whisker plots. It can be inferred from Figure 6(a) that an NT of 210°C yields a median compressive strength/density of 10.01 × 10⁴ MPa/g mm−3, while NTs like 200°C, 190°C, and 180°C produce lower median compressive strength/density of 9.95 × 10⁴, 9.53 × 10⁴, and 9.02 × 10⁴ MPa/g mm−3, respectively.
Figure 5(b) illustrates the PDV correlation between LH and compressive strength/density. In this figure, it is evident that the higher PDV of 9.055 × 10⁴ is observed when hexagon lattice-cored sandwich specimens are fabricated with a LH of 0.15 mm. This is attributed to the deposition of thin material layers within the specimen contour, and under lower LH conditions, a higher number of material layers are deposited. With an increased presence of deposited material layers, the specimen’s ability to withstand loads also rises, resulting in higher compressive strength. Moreover, lower LH results in depositing thinner layers even in the intricate infilling topology and effectively contributes to higher compressive strength/density. Conversely, as the LH increases to 0.2 mm, 0.25 mm, and 0.3 mm, the respective lower PDVs like 9.045 × 10⁴, 9.034 × 10⁴, and 9.026 × 10⁴ are observed. It is evident that as the LH increases, the compressive strength/density gradually decreases. This is because, with an increased LH, the rate of layer delamination becomes higher, leading to a reduction in compressive strength. In addition, as the LH increases, the degree of depositing material in the intricate contours of the structured topology decreases and effectively results in lower compressive strength/density responses. Sivakumar et al. described a similar observation in the case of triangular honeycomb latticed ONYX specimens. 32 Additionally, Figure 6(b) indicates that a LH of 0.15 mm resulted in a higher median compressive strength/density of 10.37 × 10⁴ MPa/g mm−3, while higher LHs such as 0.2 mm, 0.25 mm, and 0.3 mm resulted in lower median compressive strength/density of 9.75 × 10⁴, 8.80 × 10⁴, and 8.38 × 10⁴ MPa/g mm−3, respectively.
Figure 5(c) depicts the relationship between PS and compressive strength/density in terms of PDVs. In this figure, it is evident that the higher PDV of 10.009 × 10⁴ is observed when hexagon lattice-cored sandwich specimens are fabricated at a PS of 20 mm/sec. At this PS level, the deposition of the polymeric material occurs at a consistent rate, enhancing inter-layer adhesion and effectively contributing to a higher load-bearing capacity. Moreover, this PS level results in more controlled and consistent extrusion of material along the constrained topology and resulting in higher compressive strength/density responses. Conversely, at a lower PS of 15 mm/sec, the polymeric material deposition occurs at a slower rate, resulting in increased cooling time for the deposited layer. This prolonged cooling duration leads to weak inter-layer bonding and a lower load-bearing capacity. Additionally, as the PS increases to 25 mm/sec and 30 mm/sec, lower PDVs like 8.690 × 10⁴ and 7.995 × 10⁴ are observed. With an increased PS, the rate of material deposition rises, leading to the development of crests and valleys in the deposited layers. These layer irregularities increase the degree of layer delamination and reduce the ability to withstand loads. Furthermore, as PS level rises, the material extrudes more rapidly, leading to improper deposition and ultimately resulting in lower compressive strength/density responses. Emir et al. made a similar remark in the case of functionally graded TPMS lattices . 33 Figure 6(c) indicates that a PS of 20 mm/sec resulted in a higher median compressive strength/density of 11.09 × 10⁴ MPa/g mm−3, while PSs like 15 mm/sec, 25 mm/sec, and 30 mm/sec produced respective median compressive strength/density of 10.78 × 10⁴, 8.28 × 10⁴, and 8.22 × 10⁴ MPa/g mm−3.
Figure 5(d) reveals the PDV correlation between LW and compressive strength/density. The figure highlights a higher PDV for 9.112 × 10⁴ when hexagon lattice-cored sandwich specimens are manufactured with a LW of 0.1 mm. This lower LW leads to an increased number of printed lines within the specimen contour, resulting in a higher material density per unit area. The heightened material density, in turn, contributes to improved inter-layer bonding, leading to higher compressive strength and compressive strength/density responses. On the contrary, as the LW increases to 0.2 mm, 0.3 mm, and 0.4 mm, lower PDVs such as 9.053 × 10⁴, 9.007 × 10⁴, and 8.961 × 10⁴ are observed. These lower PDVs are a consequence of lower densities, attributed to the presence of fewer printing line instances. And these lower LW levels effectively results in lower material deposition within the constrained infill topology and consequences in lower compressive strength/density responses. Mathiazhagan et al. reported a parallel remark in the instance of hydroxyapatite/PLA composite tubular structure. 34 Figure 6(d) suggests that the LW of 0.1 mm yields a higher median compressive strength/density of 11.43 × 10⁴ MPa/g mm−3, while higher LWs result in lower median compressive strength/density, such as 9.92 × 10⁴ MPa/g mm−3 (0.2 mm), 9.11 × 10⁴ MPa/g mm−3 (0.3 mm), and 8.06 × 10⁴ MPa/g mm−3 (0.4 mm). Therefore, from the PDP analysis, it can be inferred that the higher PDVs are observed in the instance of hexagon lattice-cored sandwich structures fabricated at a NT of 210°C, a LH of 0.15 mm, a PS of 20 mm/sec, and a LW of 0.1 mm.
Utilizing the QR model involves arranging the input 3D-PFs in a sequential order based on their influence on the developed compressive strength/density. Subsequently, their respective percentile contributions are assessed. The hierarchy of 3D-PFs affecting compressive strength/density is as follows: LW > PS > LH > NT. Notably, among the diverse input 3D-PFs, the LW demonstrates a noteworthy impact, making a contribution of 36.76 %. Following this, the PS contributes 27.99 %, followed by the LH with an impact of 21.75 %. Finally, the 3D-PF such as NT have the least impact contributing 13.5 % respectively.
Figure 7 depicts the pair-plot representation of independent 3D-PF like LH, NT and PS on the output response of the 3D printed hexagon lattice-cored sandwich (compressive strength/density) with respect to LW at different levels like 0.1 mm, 0.2 mm, 0.3 mm, and 0.4 mm. The pair-plot develops a pairwise relationship between the 3D-PFs and compressive strength/density. From Figure 7, it can be inferred that both LH and NT have distinct correlations with compressive strength/density. LH exhibits a negative correlation with compressive strength/density, while NT shows a positive correlation. Additionally, it is evident that LW has a significant positive impact on the compressive strength/density of the hexagon lattice-cored sandwich specimens.
Analysis of training and testing data
The accuracy of both the training and testing data is evaluated using scatter plots, as depicted in Figures 8 and 9. These visual representations showcase the relationship between the actual training data and the predicted values produced by each model. Assessing the ML model’s accuracy involves examining the proximity of each specific actual and predicted training point on the scatter plots. Figure 8 distinctly shows that the QR model demonstrates superior accuracy in forecasting the target variable. This superiority is evident in the greater closeness observed between the actual and predicted values of the training data when compared to alternative ML models. Actual and predicted values of train data (a) Quantile regression, (b) Support vector machine, (c) Elastic Net linear regression, and (d) Bayesian ridge regression. Actual and predicted values of test data (a) Quantile regression, (b) Support vector machine, (c) Elastic Net linear regression, and (d) Bayesian ridge regression.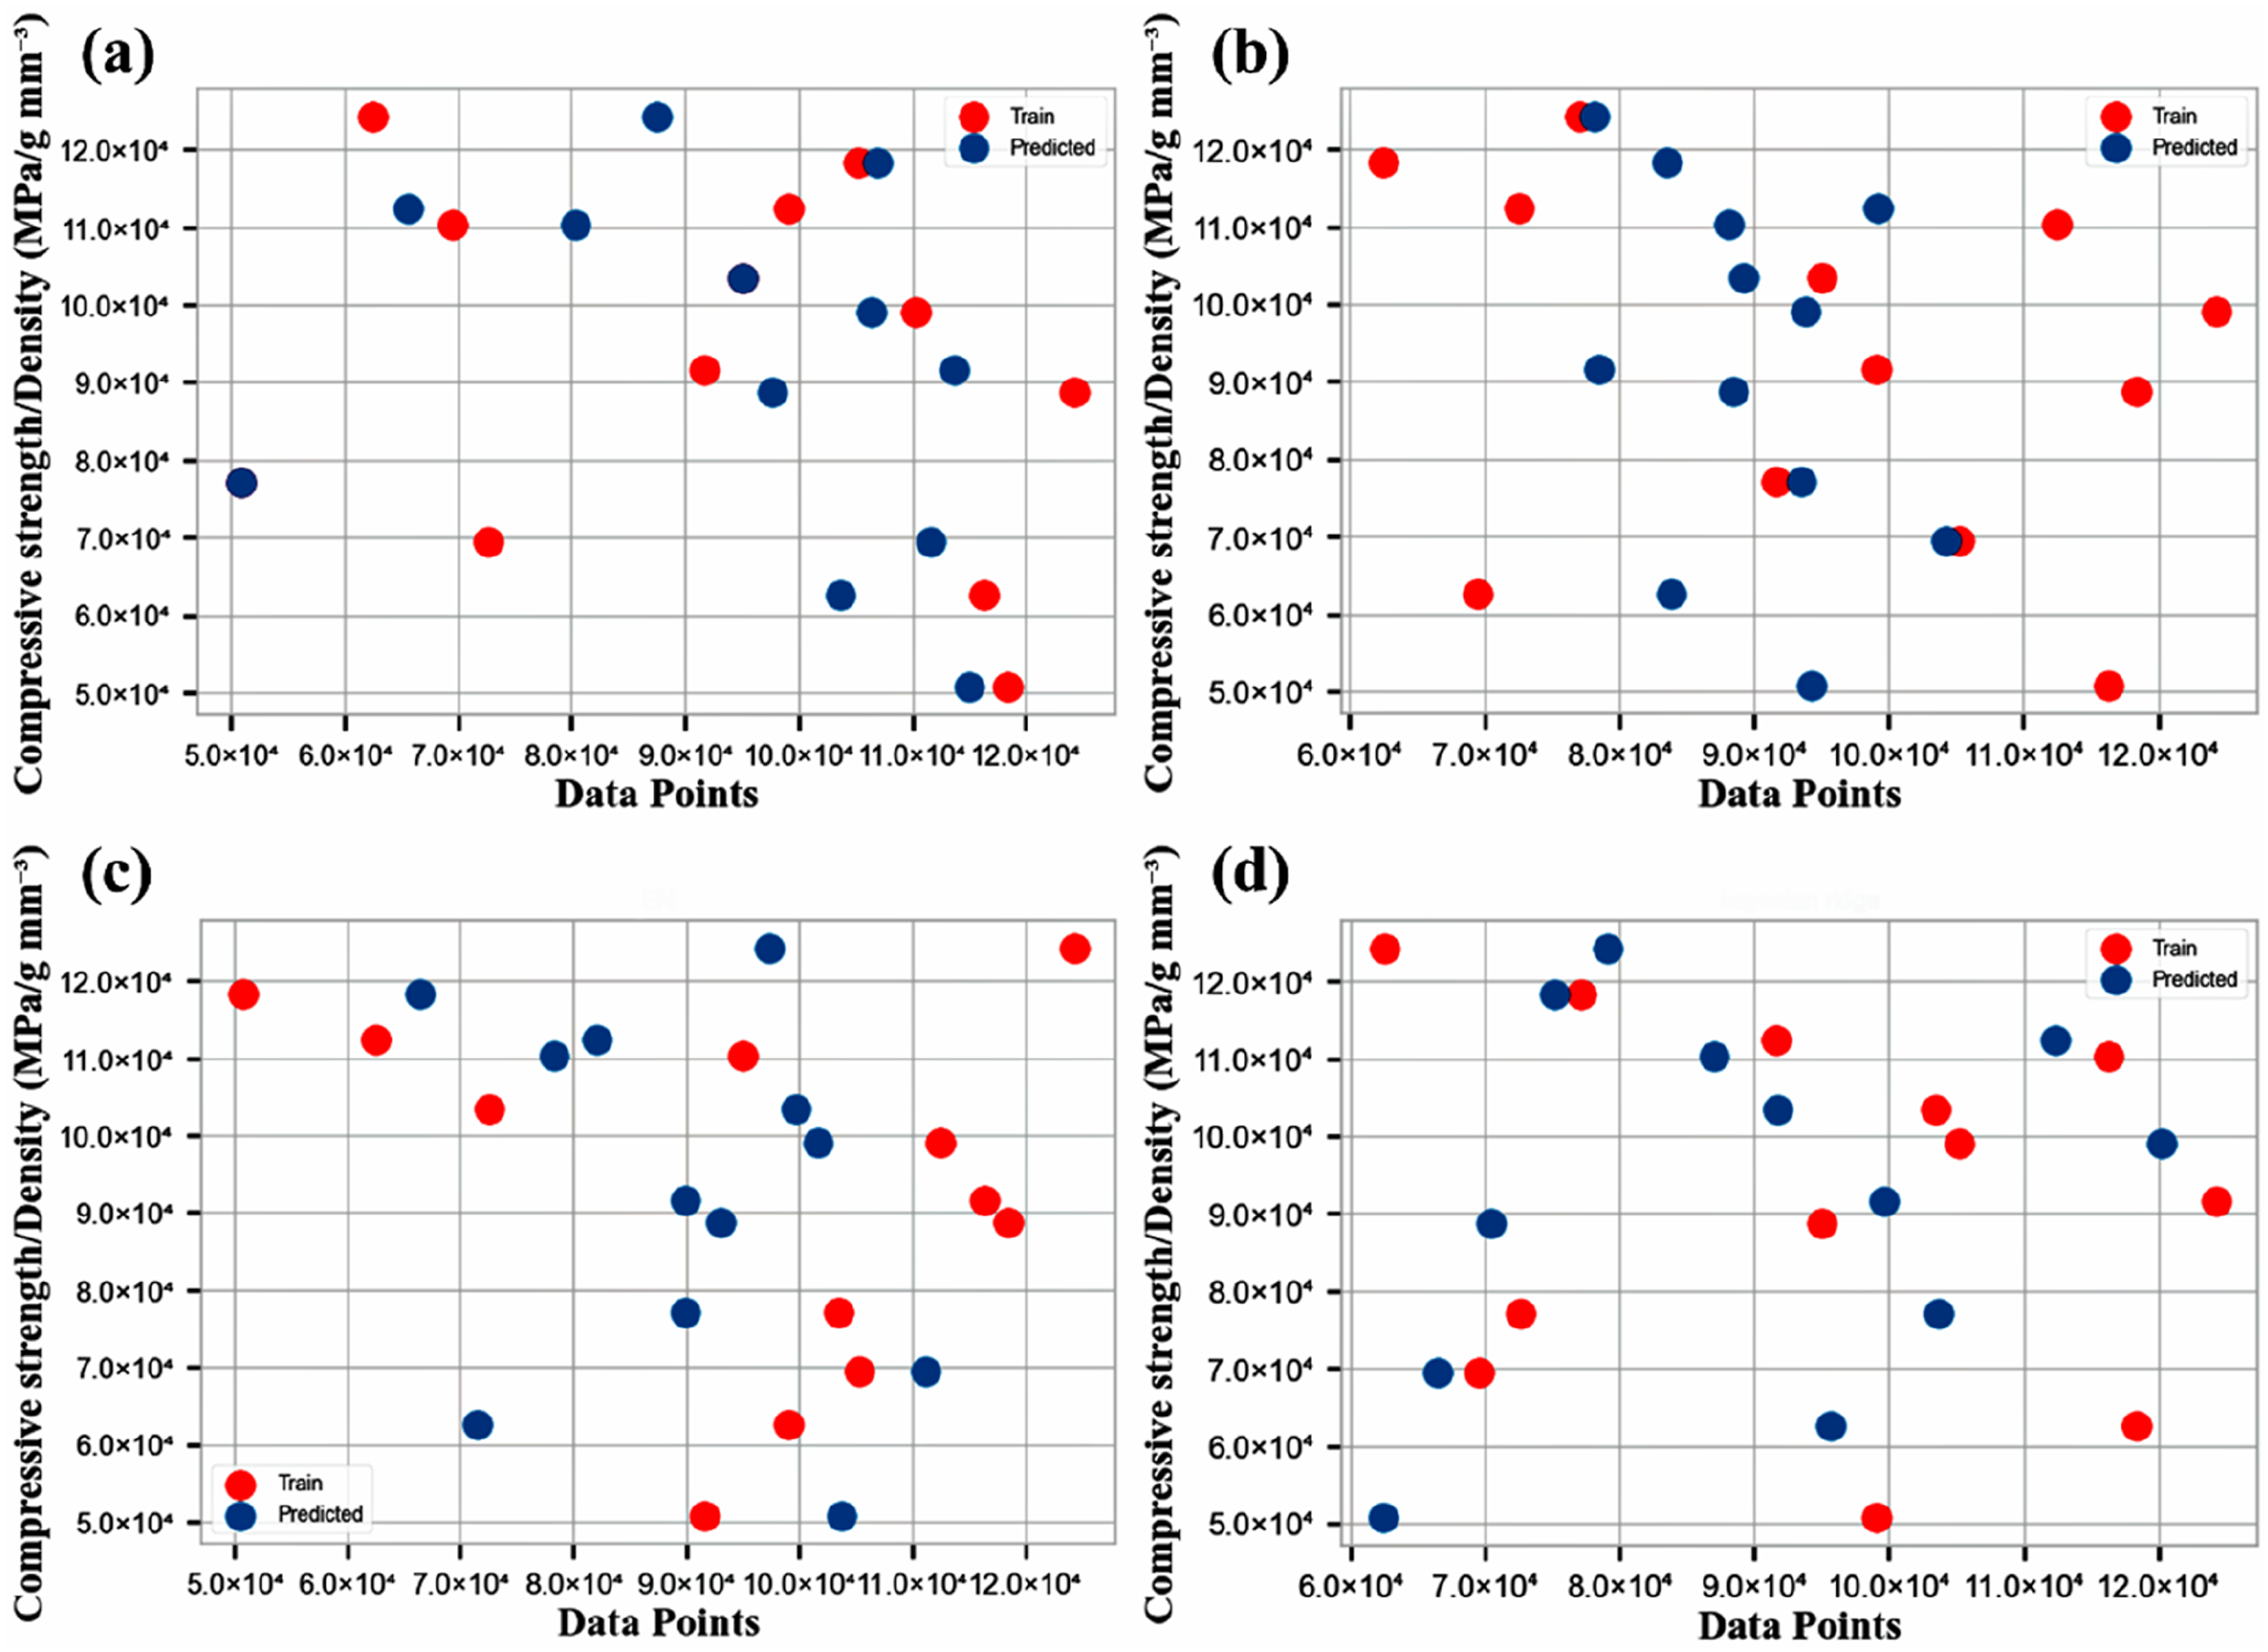
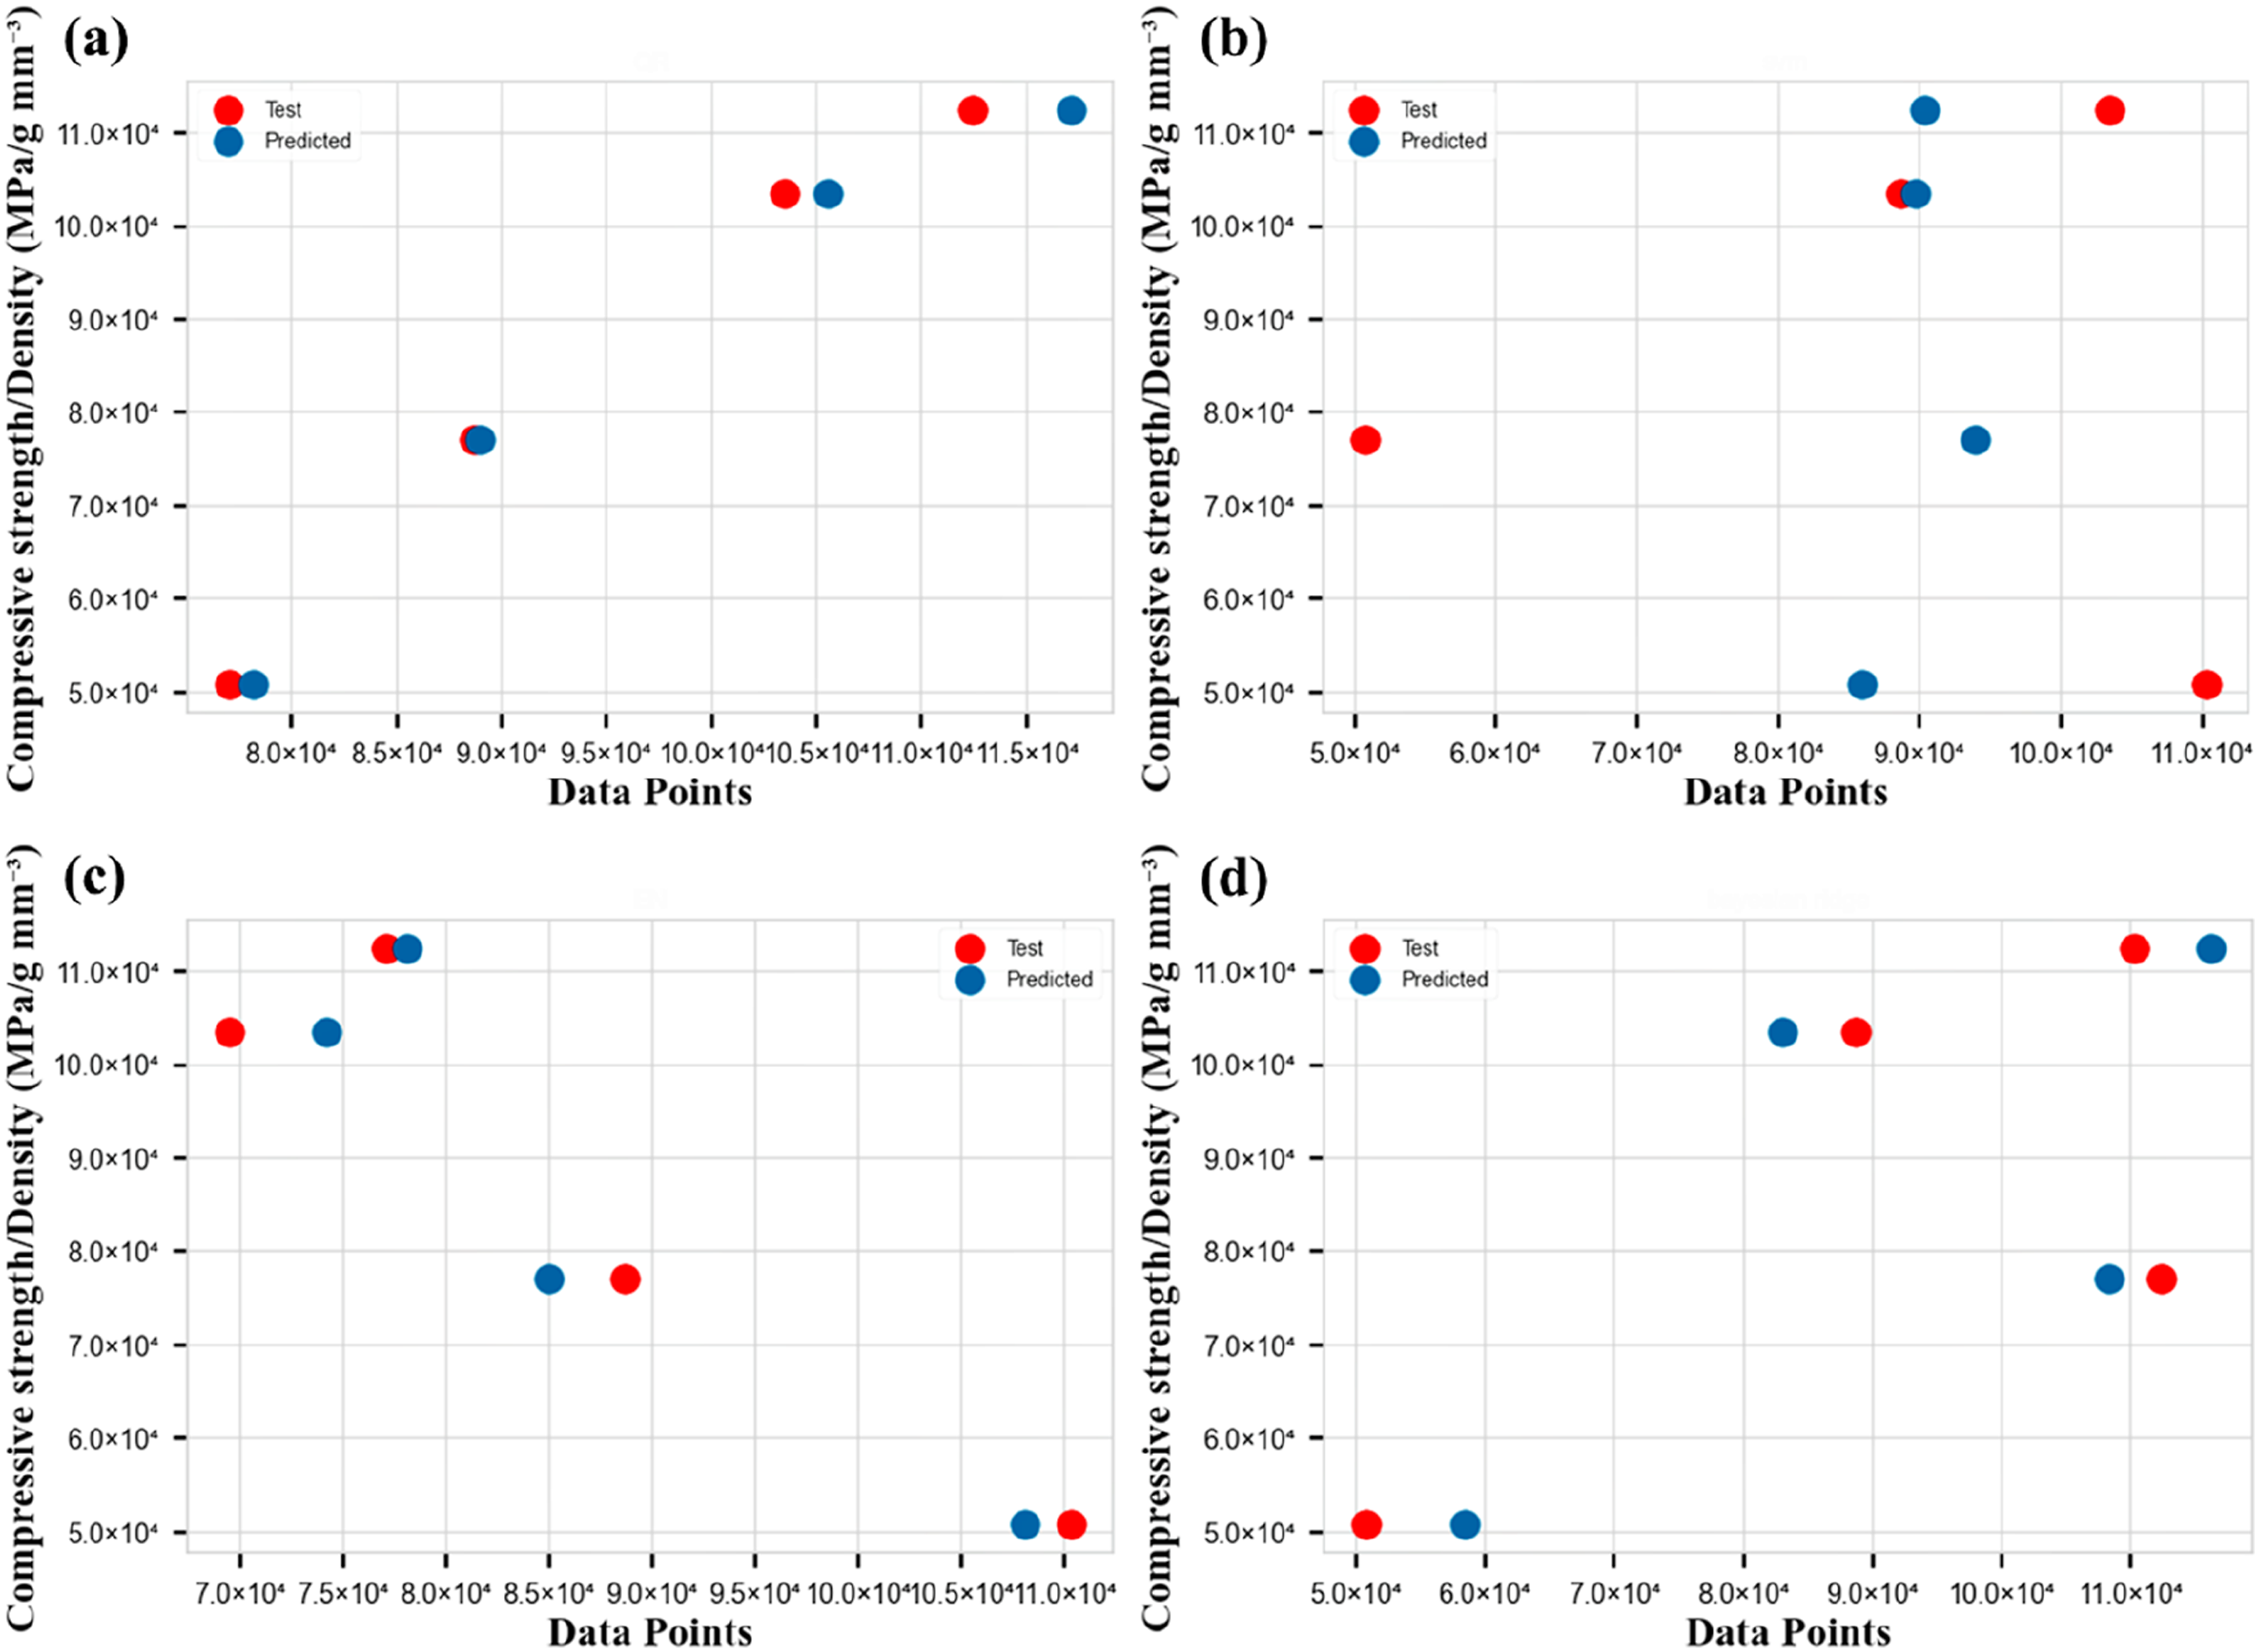
Figure 9 illustrates the accuracy between the actual and predicted test data points through scatter plots. The convergence of the actual and predicted test data points signifies higher accuracy for the corresponding ML model. Figure 9 clearly highlights that the QR model has achieved superior prediction accuracy compared to other ML models. Furthermore, in the case of the QR model, the proximity between the actual test and predicted data points is notably smaller when contrasted with alternative ML models.
Figure 10 displays the residual plots of various ML models, contributing to the evaluation of the performance of both the training and testing datasets for 3D printed hexagon lattice-cored sandwich specimens. These residual plots visually portray the association between residuals and predicted values, providing insights into the correlation between two interconnected variables within the same range. The y-axis represents the corresponding residuals, while the x-axis depicts the predicted values. Residual plot of various ML models (a) Quantile regression, (b) Support vector machine, (c) Elastic Net linear regression, and (d) Bayesian ridge regression.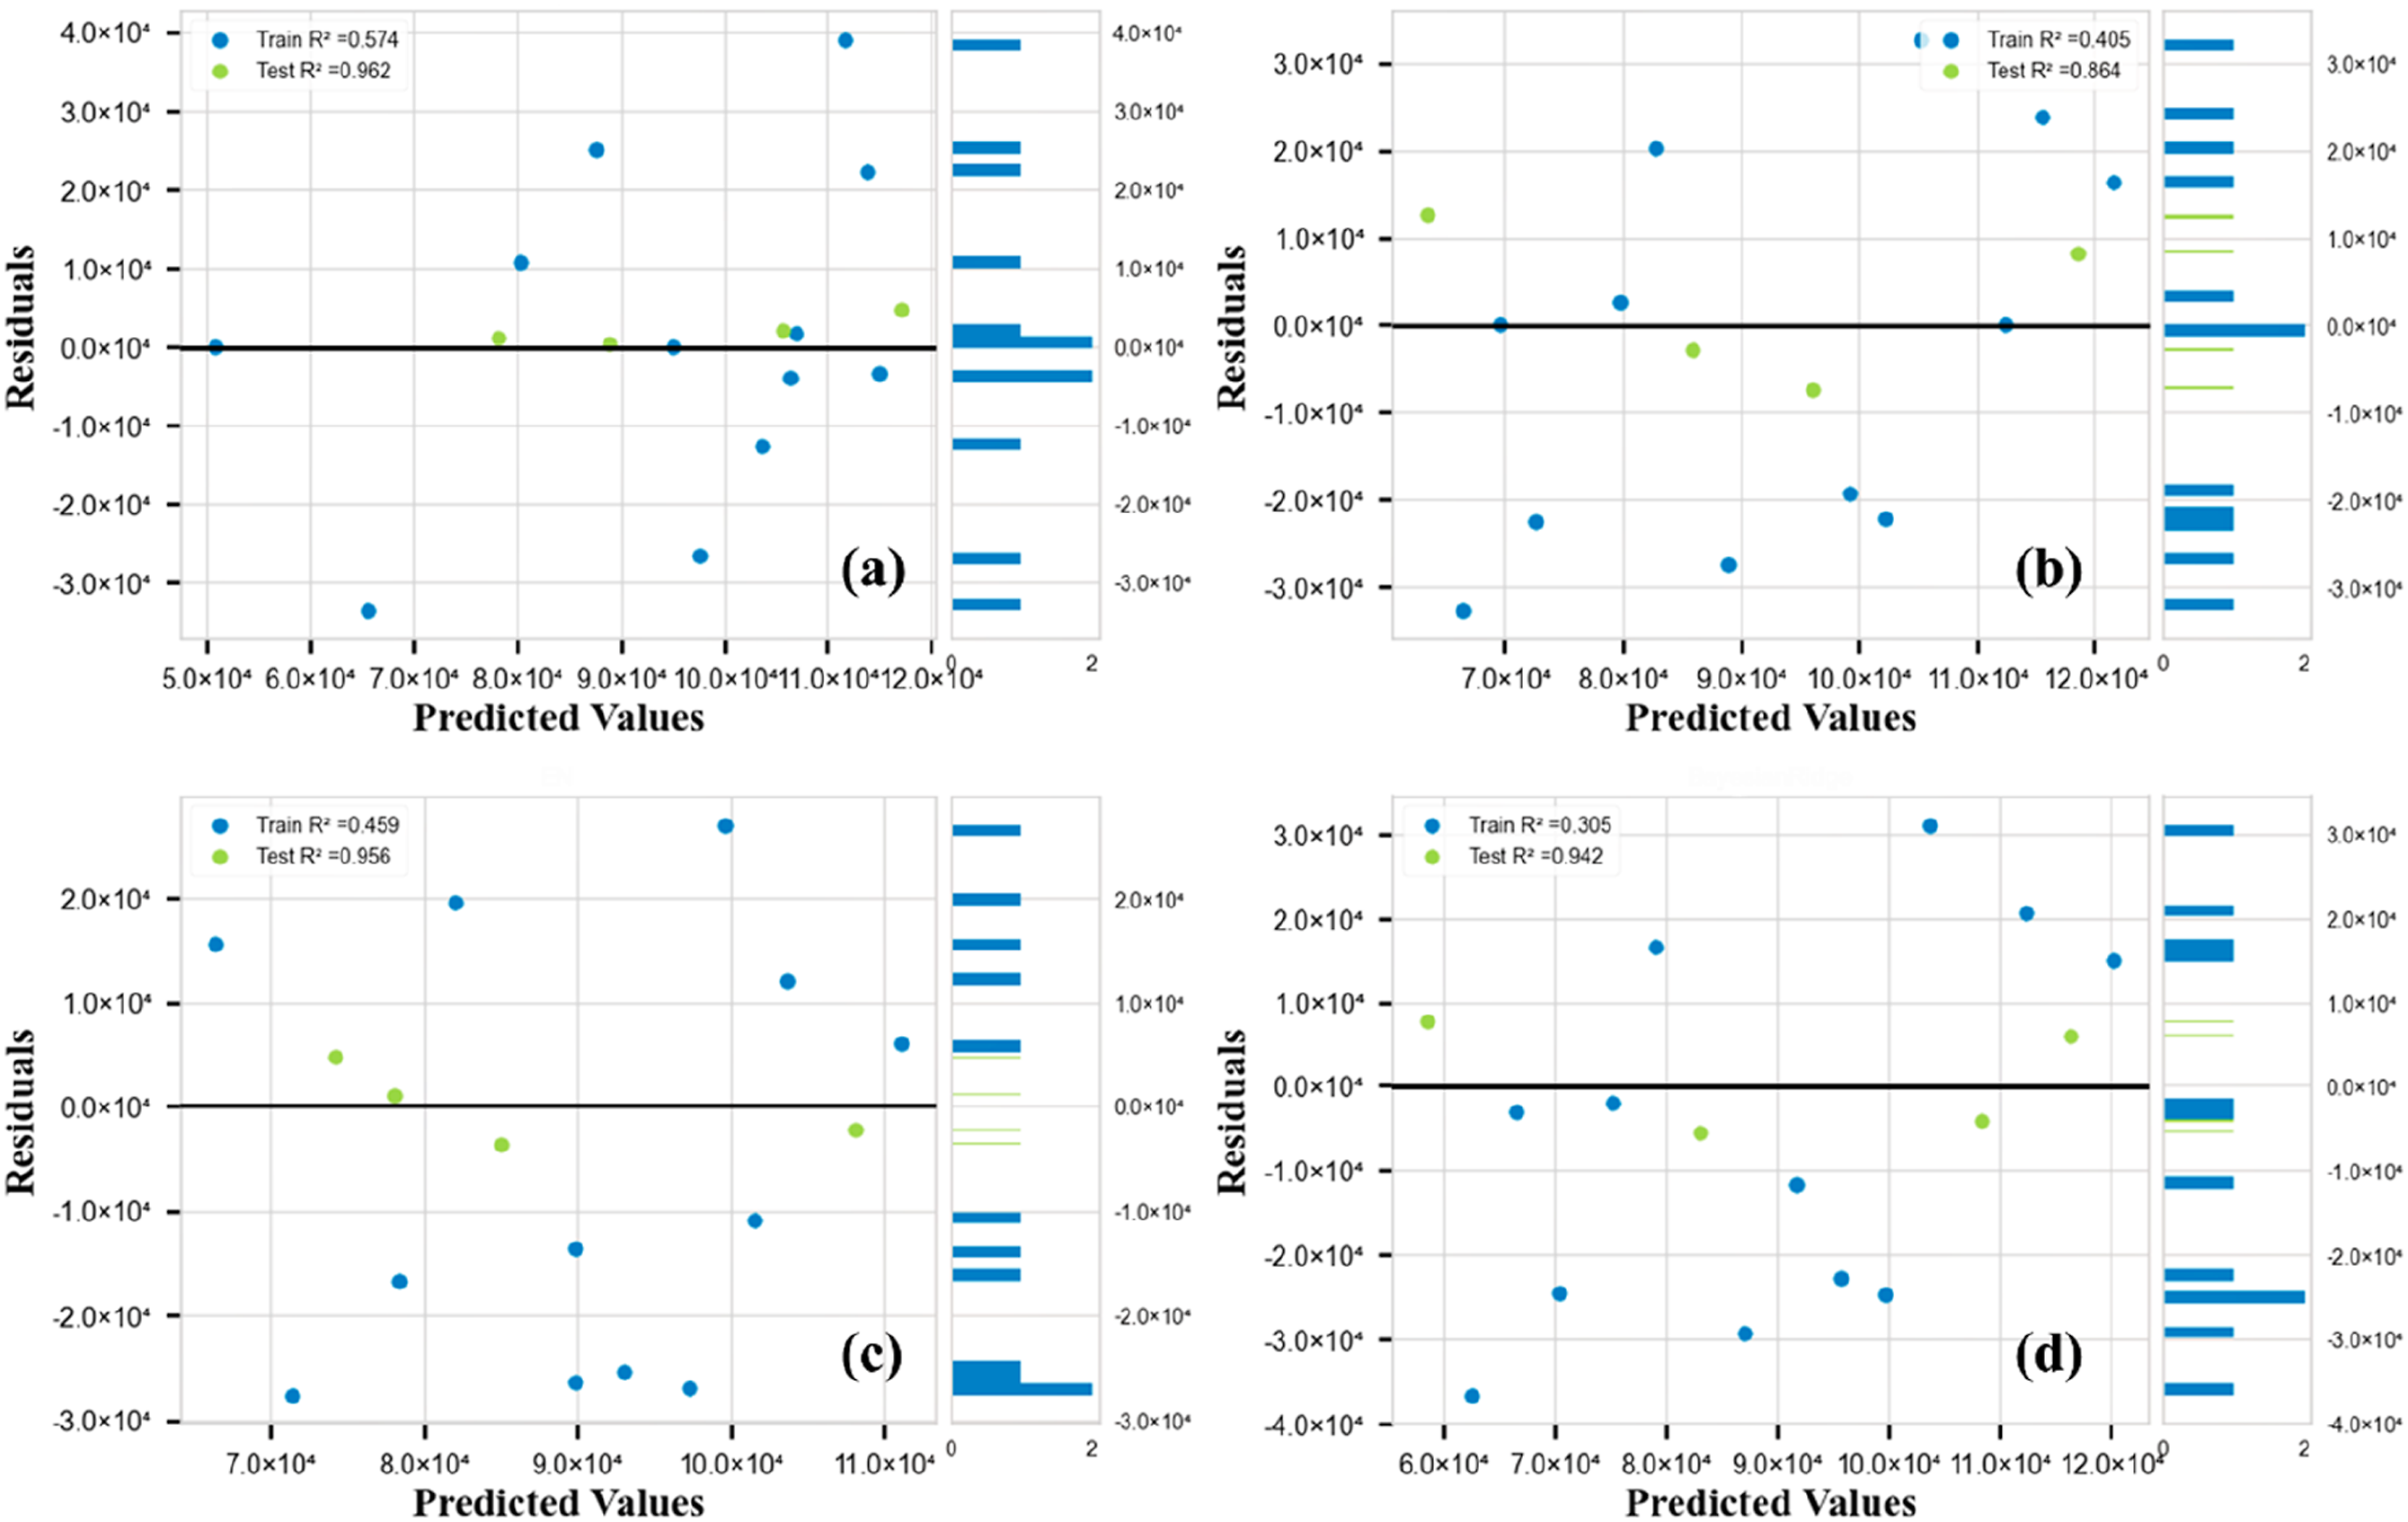
Examining Figure 10, it can be deduced that, in the case of the QR model’s residual plot, the test datapoints fall within a reliable range of −0.02 × 10⁴ to 0.4 × 10⁴. Additionally, these test datapoints have achieved a fit of 0.962, closely aligning with the fit line. Following the QR model, the EN model secured a fit of 0.956 with the test datapoints, while the SVM model exhibited the lowest fit of 0.864 in the context of test datapoints.
Evaluation metrics
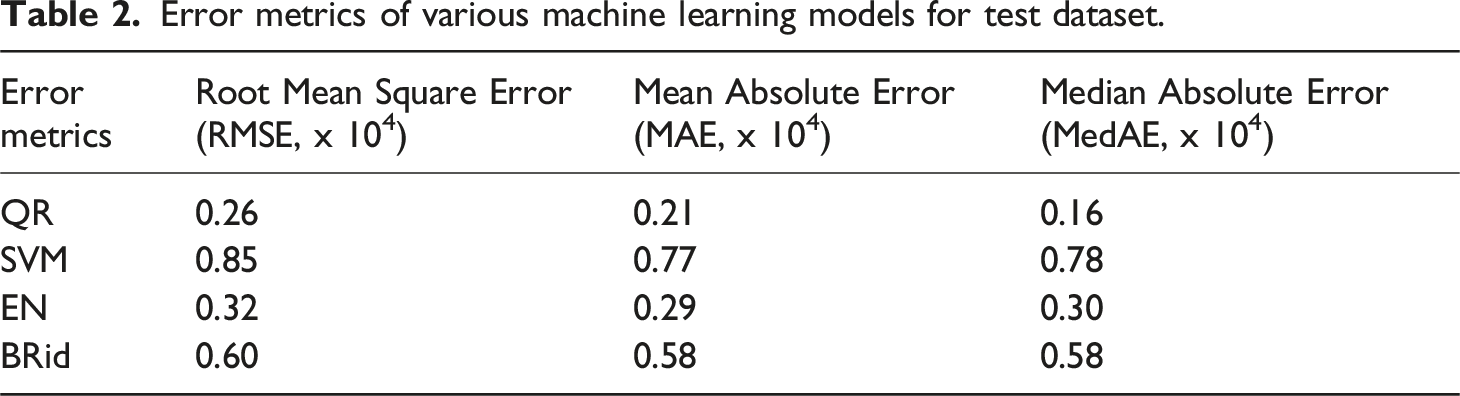
Error metrics of various machine learning models for test dataset.
Characterization of optimized 3D printed sandwich samples
Utilizing boosting ensemble learning with PDP analysis for the SVM ML model aids in identifying the optimal parameters for 3D-PFs. These include a NT of 210°C, a LH of 0.15 mm, a PS of 20 mm/sec, and a LW of 0.1 mm, aimed at achieving enhanced compressive strength. The hexagon lattice-cored sandwich specimen, produced with these optimized 3D-PFs, demonstrated an elevated compressive strength of 80.21 MPa. Figure 11 illustrates the stress-strain curve of the hexagon lattice-cored sandwich specimen fabricated at the optimized levels of 3D-PFs. The illustration clearly shows that the optimized specimen effectively withstands compressive loads, leading to the achievement of a higher stress level of 80.21 MPa. Stress-strain curve of optimized hexagon lattice-cored sandwich specimen.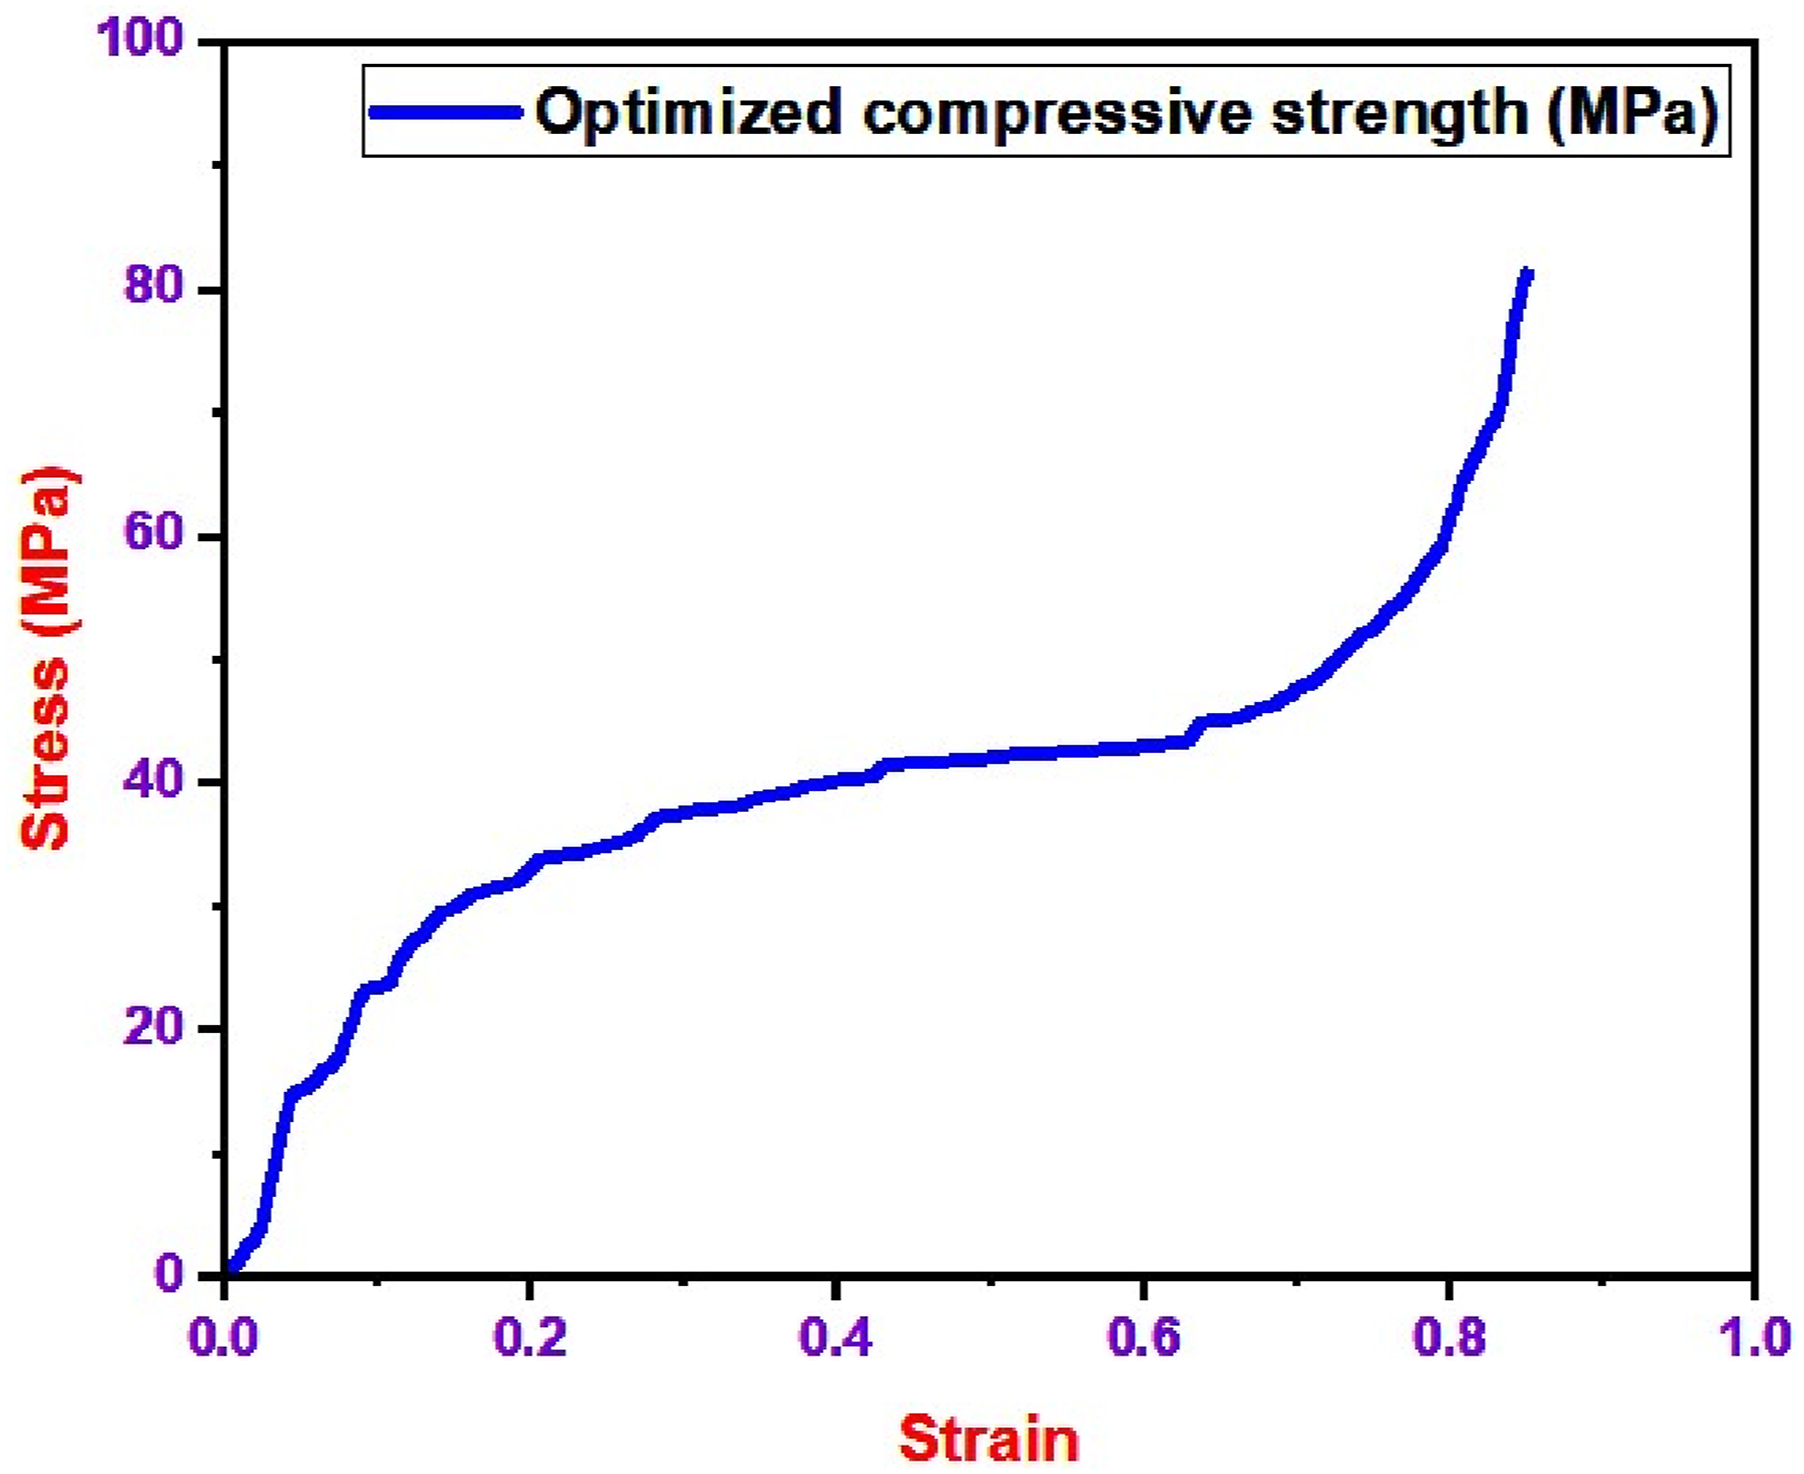
Conclusion
The current research explores the influence of 3D-PFs such as NT, LH, PS, and LW, on the compressive strength/density characteristics of the hexagon lattice-cored sandwich specimen. The ML models are utilized to enhance both the printing quality and mechanical attributes of the structures. The accuracy and suitability of the developed ML model under specific conditions align with the anticipated outcomes.
Based on the results obtained from the current experiments, the following outcomes have been determined and are outlined below. 1. It can be deduced that elevated PDV is evident in the case of hexagon lattice-cored sandwich structures manufactured with a maximum NT of 210°C, a minimum LH of 0.15 mm, an optimal PS of 20 mm/sec, and a lower LW of 0.1 mm. 2. The impact of 3D-PFs on the compressive strength/density property follows the sequence of LW > PS > LH > NT. Notably, among the diverse input 3D-PFs, the LW demonstrates a noteworthy impact, making a contribution of 36.76 %. 3. Considering the error metrics among the selected models, the Quantile Regression (QR) algorithm under boosting ensemble exhibited the lowest levels of error metrics, including a RMSE of 0.26 × 10⁴, MAE of 0.21 × 10⁴, and MedAE of 0.16 × 10⁴. 4. Quantile Regression (QR) employed under the boosting ensemble technique, stands out as the most accurate predictive model for estimating the compressive strength/density property of 3D printed hexagon lattice-cored sandwich specimens. 5. The hexagon lattice-cored sandwich specimen, fabricated with these optimized 3D-PFs, demonstrated an elevated compressive strength of 80.21 MPa.
Footnotes
Declaration of conflicting interests
The author(s) declared no potential conflicts of interest with respect to the research, authorship, and/or publication of this article.
Funding
The author(s) disclosed receipt of the following financial support for the research, authorship, and/or publication of this article: The authors extend their appreciation to the Researchers Supporting Project no. RSPD2024R680, King Saud University, Riyadh, Saudi Arabia, for funding this study.