
Abstract
In this work, we investigated the effect of plain woven carbon fiber tape embedded in each layer of an additively manufactured part on the coefficient of thermal expansion (CTE) and compared it to conventionally printed parts. Current advancements in Additive Manufacturing enable cost-efficient 3D printing of composite tools. However, these tools do not yet offer a low CTE comparable to Invar, necessary for producing aerospace-quality composite parts. Using the novel Advanced Tape Layer Additive Manufacturing process, the tape is placed on top of the bead immediately after extruding the short fiber-reinforced material. The samples are compared to Material Extrusion specimens from a Large Format Additive Manufacturing System. A lower CTE was achieved within the printing plane. Micro-computed tomography images correlate the preferential orientation of short fibers with measured CTE values. The CTE modification can match the part CTE to the tool CTE and therefore optimize the quality of manufactured parts.
Introduction
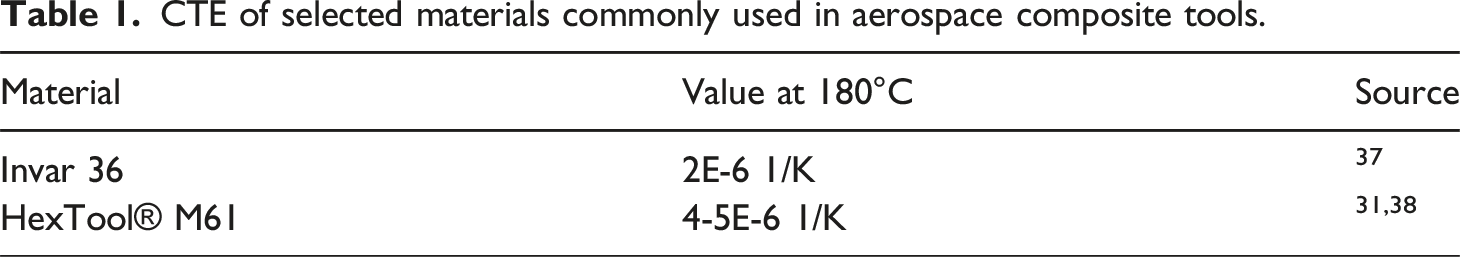
The aerospace industry mainly uses autoclave curing to produce composite parts consisting of carbon fibers (CF) in a thermoset matrix. 1 Tool-part interactions must be considered to achieve the necessary geometric tolerances in this sector. 2 One interaction is the difference in the coefficient of thermal expansion (CTE) between the part and tool, which can cause the final part to warp, as it cures in the tool while the process temperature expands it.3–7 Considering the use of tools for automated fiber placement (AFP) processes, there is an interest in lightweight yet stiff design of the tools for, for example, rotation during lay-up. 2 Manufacturing composite tools out of Invar alloy can make up to 20% of the total part manufacturing cost. 2 An overview of the CTE of currently used, non-thermoplastic materials is given in 2. Large Format Additive Manufacturing (LFAM) of polymer material extrusion (MEX) for the manufacturing of composite tools has been used in several projects.8–16
The LFAM process works as molten, possibly short fiber-reinforced (SFR) material is fed by an extruder screw through a nozzle and deposited layer by layer on a build plate. The tool path is determined by G-Code, usually generated by a slicing software. The software uses the part geometry to generate the path, which is then processed by the robot or gantry control to move the extruder along.17,18 Tooling applications require a high surface quality. Therefore, the printed part has to be surface finished, usually by milling. By adding fillers, for example, CF, to the feedstock, material properties can be improved and warping reduced.19–21 The process offers an economic advantage compared to traditional Invar tools and is therefore promising for more cost-efficient production of aerospace parts. 21 By Additive Manufacturing (AM), tools can be produced near-net-shape, reducing waste and milling times. The technology for metal 3D printing Invar composite tools also exists but has the disadvantages of high weight and cost. 9 However, for fiber-reinforced thermoplastic (TP) material, the challenge of achieving an even and low CTE in the tooling remains, amplified by the anisotropic behavior implied by the 3D printing process.22,23 A review by Yong Li et al. 2 states that there is still a need for research on the CTE of thermoplastic composites.
CTE of selected materials commonly used in aerospace composite tools.
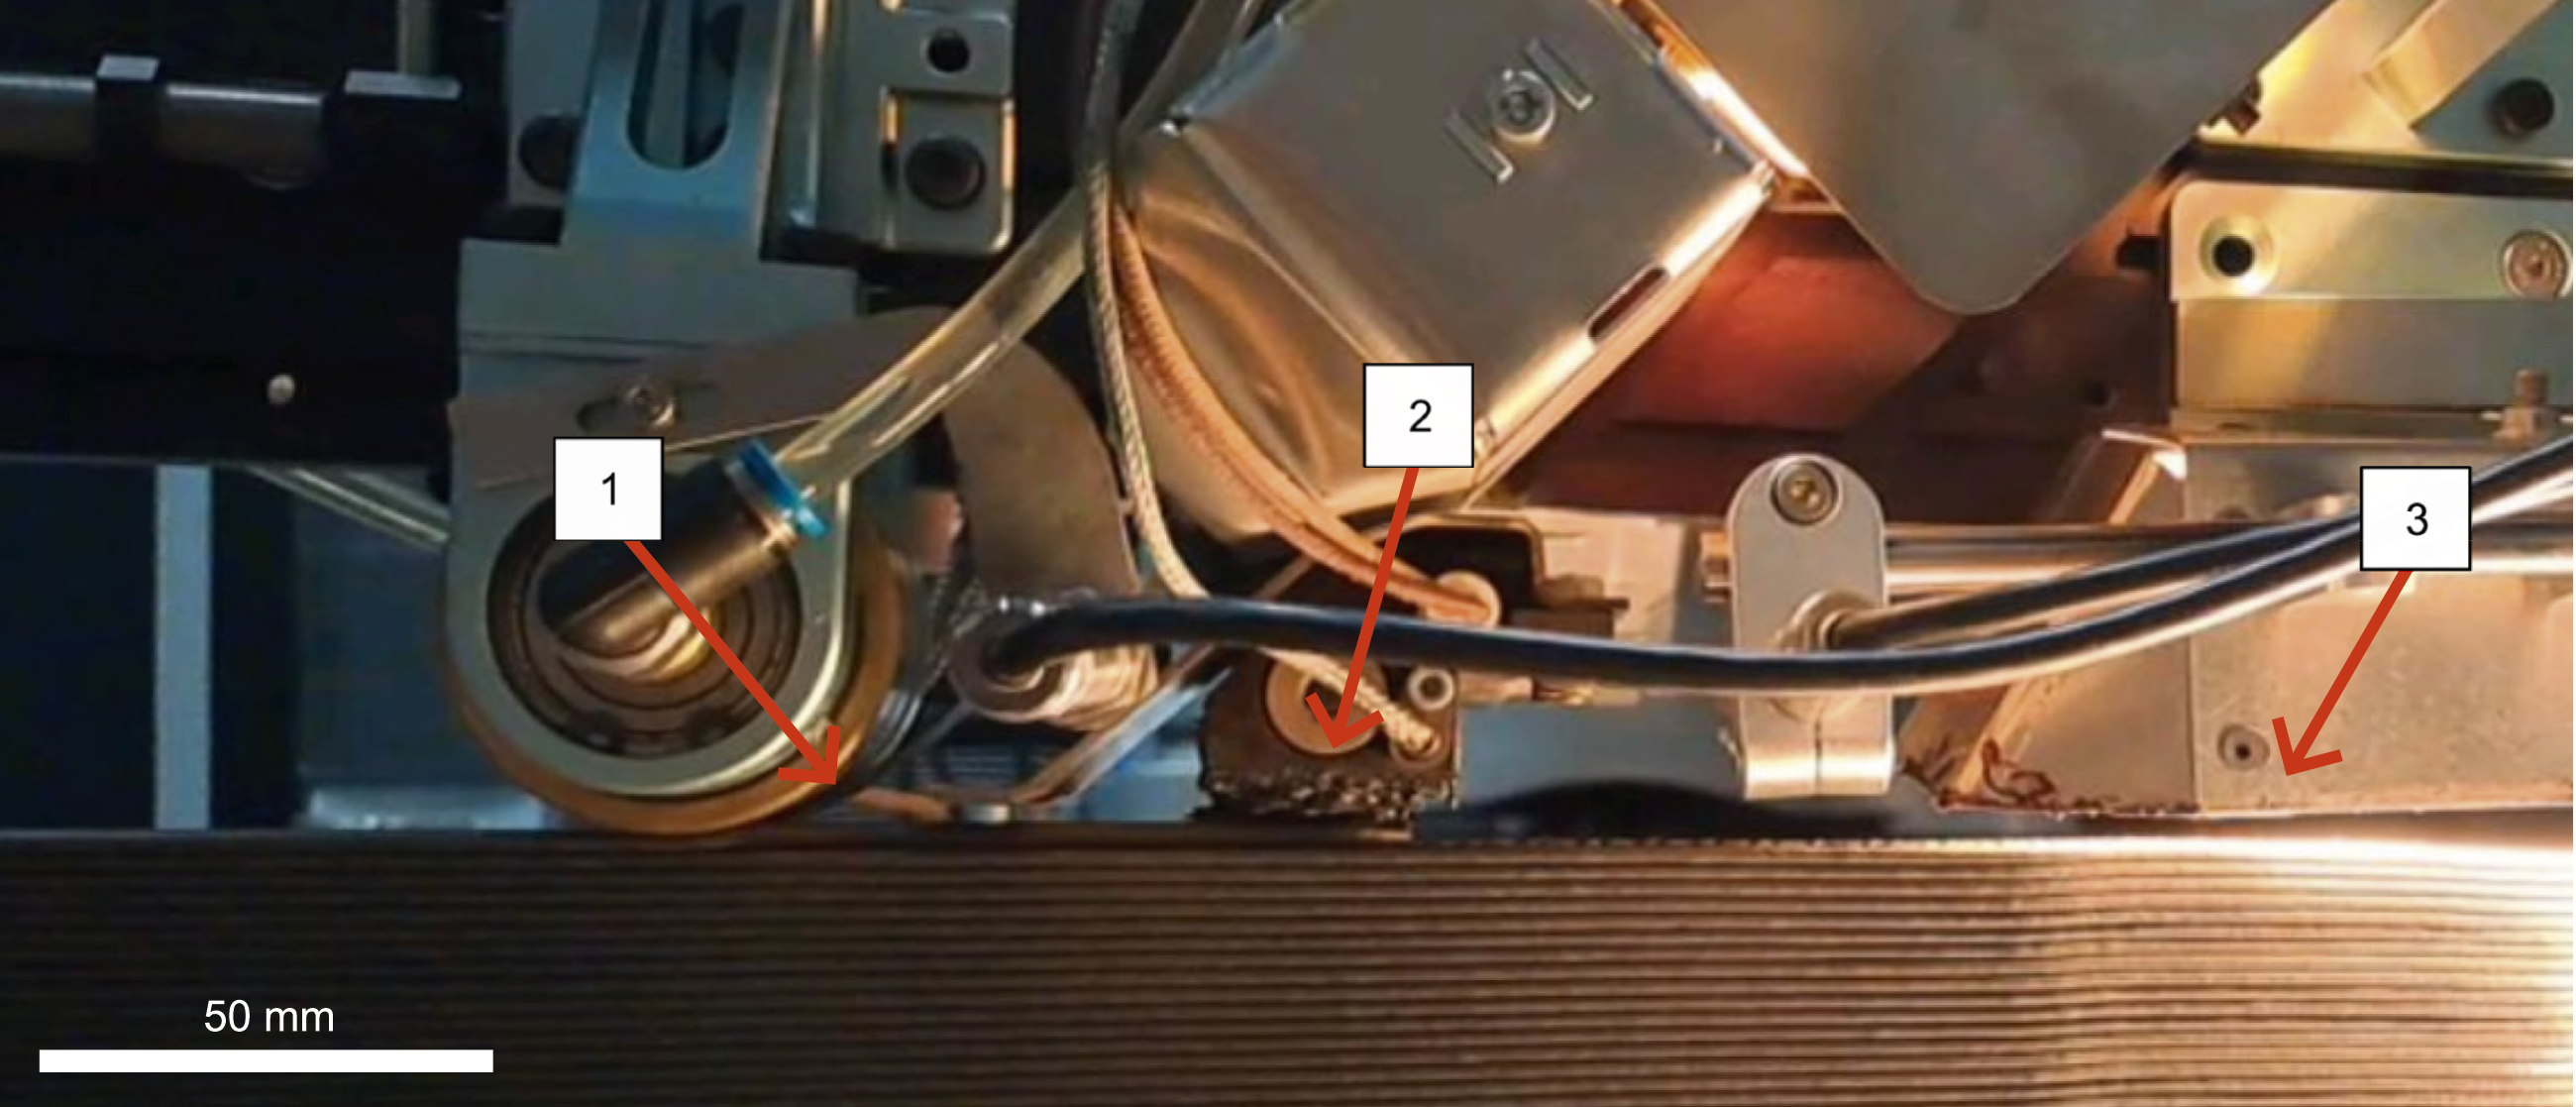
Close up of the ATLAM toolhead during operation with roller for tape compaction (1), nozzle (2), and infrared heater (3).
Experimental methodology
The ATLAM samples were manufactured at CEAD B.V. (Delft, Netherlands), while the MEX LFAM were printed at the Chair of Carbon Composites of the Technical University of Munich (Taufkirchen, Germany) with a CEAD G25 Extruder. The samples were then processed and tested at the chair facilities, except for the micro-CT scans performed at the Australian National University (ANU) (Canberra, Australia).
Materials and equipment
Preparation of samples
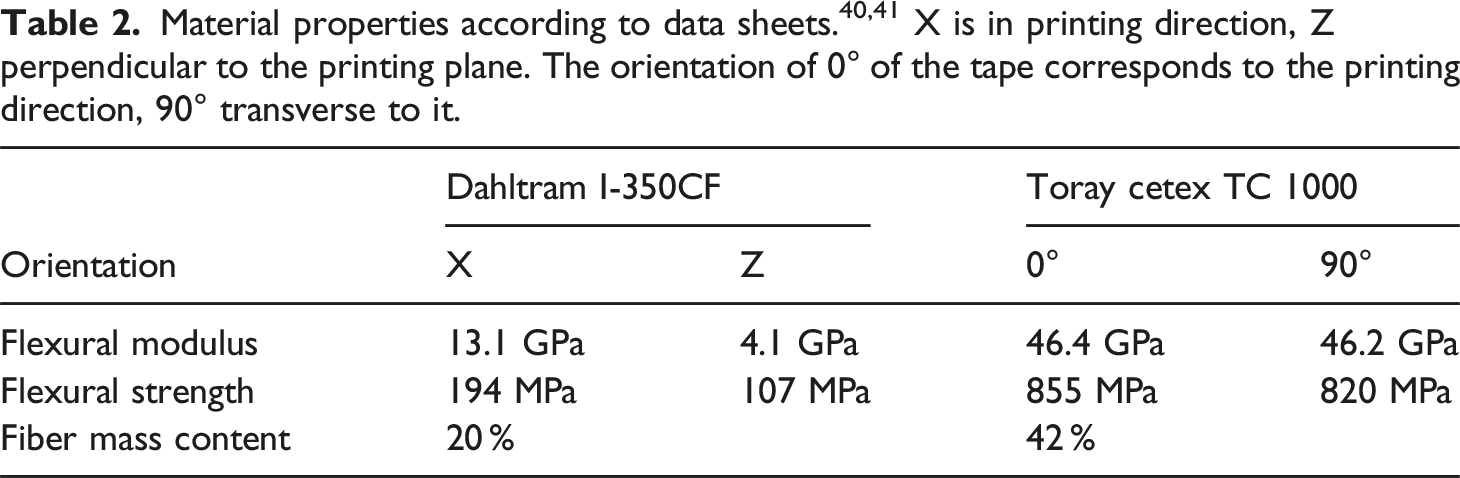
The samples were produced with the processes described before. The ATLAM samples were printed with a layertime of 120 s and a nozzle temperature of 380°C on a printbed heated to 110°C. For the MEX samples, the layertime was set to 90 s, the nozzle temperature to 410°C and the printbed to 100°C. For each sample, two layer heights were produced, in each case with a difference of 1 mm. For the ATLAM process, this transfers to a bead height of 1.0 mm and 2.0 mm including the tape height of 0.4 mm, while for the MEX samples, the bead height was 1.4 mm and 2.4 mm, due to manufacturability. The extrusion width was set to 15 mm. Two geometries were printed, vertical samples, comparable to a single-layer wall, and horizontal samples, comparable to a plate. For the ATLAM process, the deposition of the bead and the tape happened always in one direction. After finishing one layer, the robot moved the printhead back to the start of the print and continued with the next layer. Therefore, the layers were always stacked in the same direction. The MEX samples were printed in a closed loop per layer, resulting in the same stacking sequence. The horizontal samples were manufactured with an offset of half a beadwidth perpendicular to the printing direction for each subsequent layer to achieve a more robust sample structure. The printed specimen was then machined with a 3-axis-milling-machine to the thickness required for CTE/3-Point-Bending and cut by a circular diamond blade to size (CTE samples are 20 x 10 x 3 mm while the 3-Point-Bending samples were cut to 60 x 15 x 3 mm and the micro-CT samples to 7 x 7 x 7 mm). Figure 2 shows the position of the samples inside the printed parts. The samples were taken from the center of the printed parts. The x-direction defines the direction in which the nozzle follows the given path. The y-direction is transverse to the path, and the z-direction is perpendicular to the printed plane. For the three-point-bending experiments, two different orientations for the specimen with tape in the x-direction are considered, one (X1) placed vertically within the geometry, the other (X2) placed horizontally. For the CTE measurements in x-direction, the X1 samples were used. Position of samples in the printed parts. The length (l), width (w) and thickness (t) is given exemplary for a z sample. The small lines in the parts mark the position of the tape at every layerheight.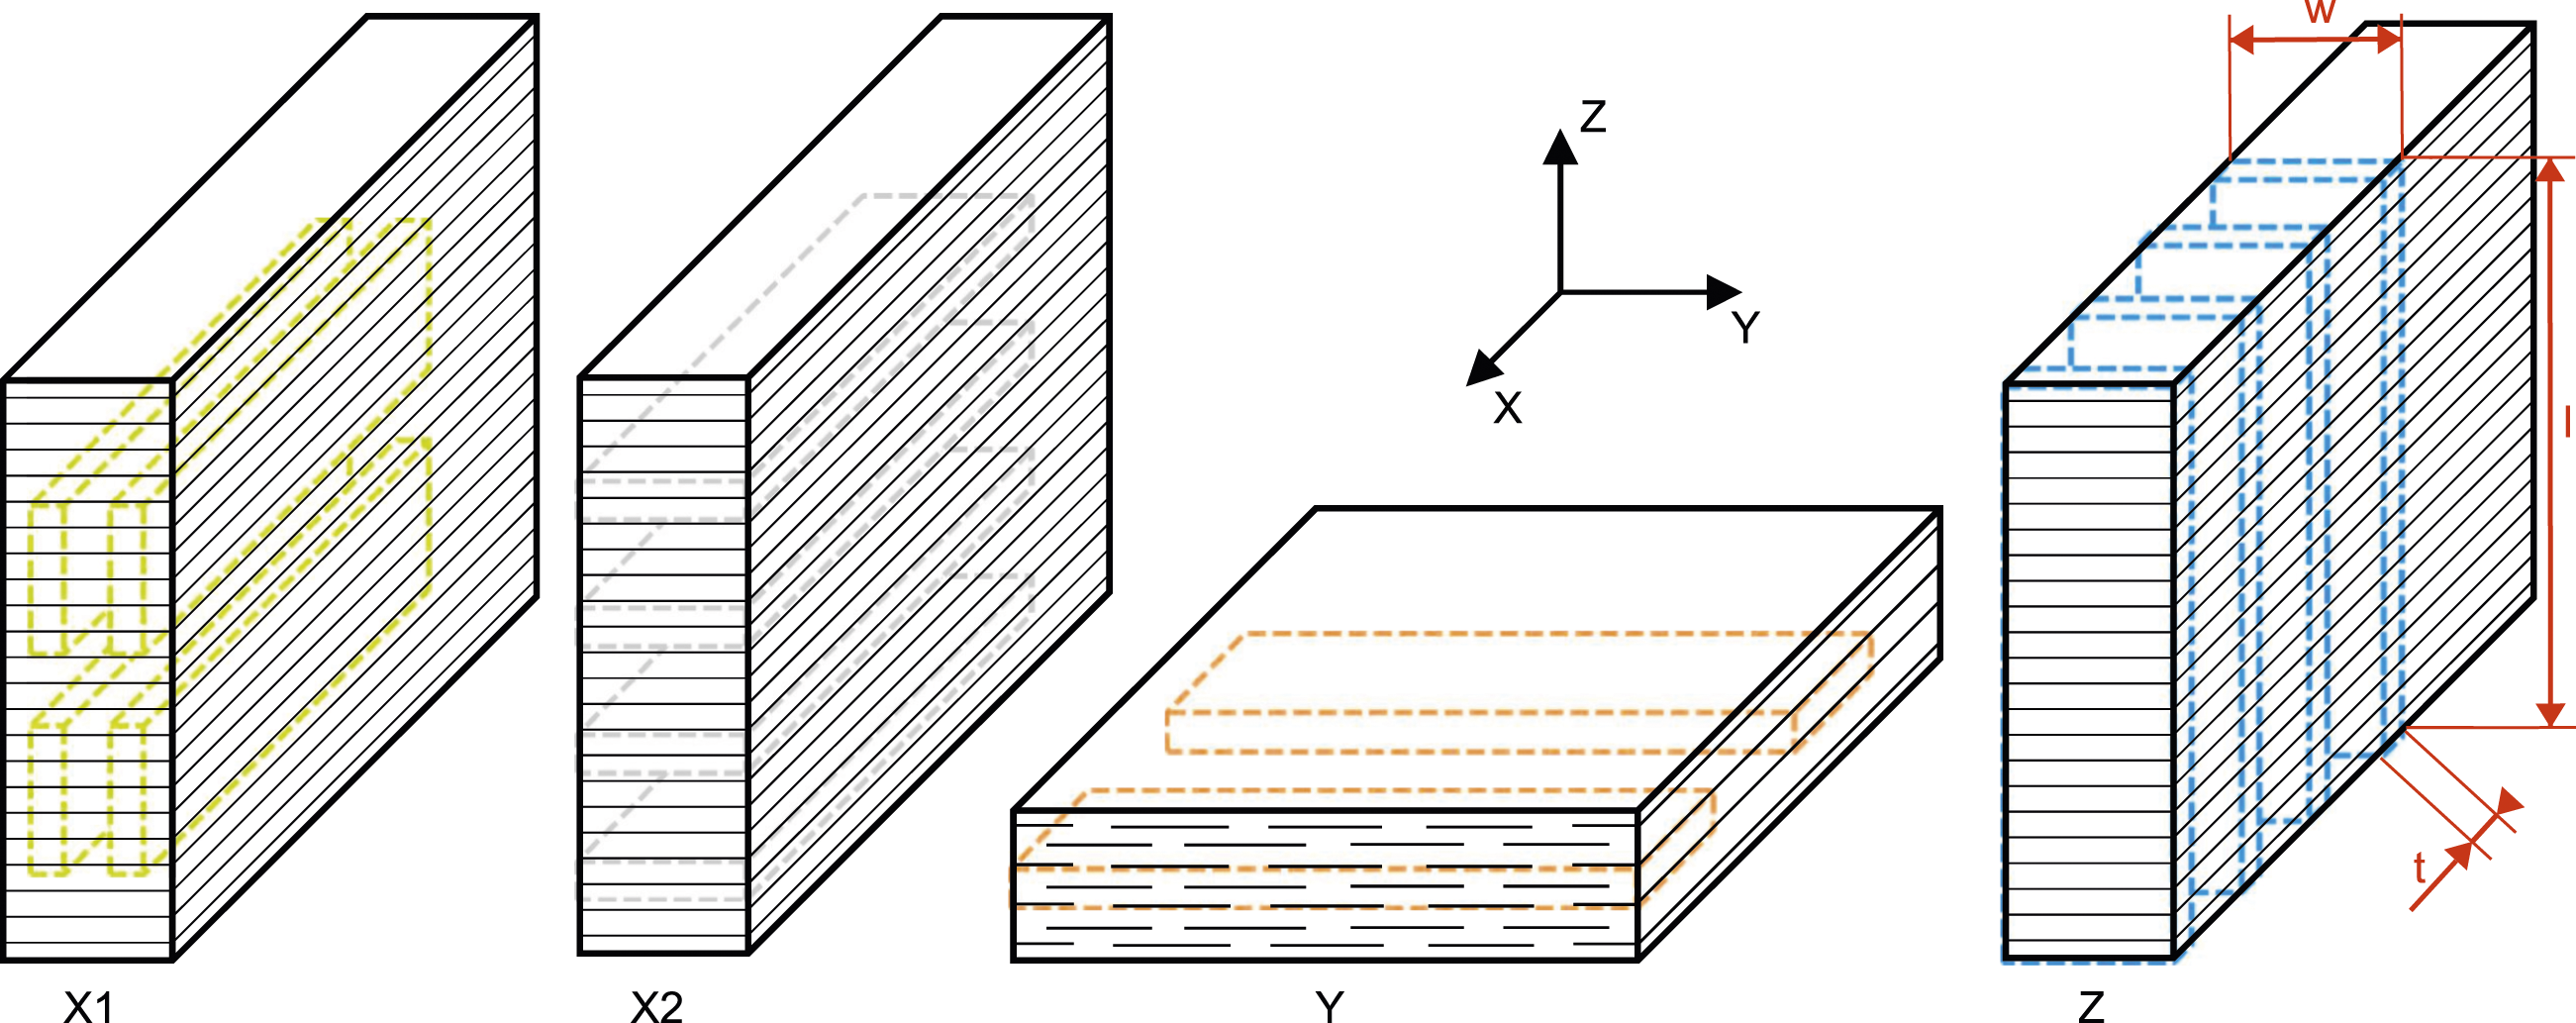
In total, the sample preparation resulted in 12 configurations for the CTE measurements, six for micro-CT imaging, and 16 for three-point bending.
CTE measurements
For measuring the CTE, a TA DMA Q200 was used. An Invar sample was prepared to compensate for the system’s expansion. The measured values and the Invar CTE of 2 × 10⁻⁶ K−1 were used to offset the measurements. The samples were held for 5 minutes at 30°C, heated with 1 K/min to 180°C, held again for 5 min, and then the measurement was stopped. During the measurements, a force of 1 N was applied. Preliminary tests showed that a heating rate this slow is necessary to eliminate the effects of thermal inertia on the measurement system and the sample itself. Every configuration was measured three times to account for outliers. Until testing, the samples were stored at room temperature. The obtained measurement values were exported with the software TA Universal Analysis.
Micro-CT
Micro-CT imaging was carried out at the ANU, where the specimens were imaged on a HeliscanTM instrument hosted at the ANU CTLab. Each sample was scanned for about 3.5 h at the scanning resolution (i.e., voxel size) of 4.18 µm. One sample per configuration was scanned. The software Dragonfly by ORS 42 was used to process and analyze the scans, which, for each sample, included: segmenting voids and fibers, calculating void content and visualizing in 3D void and fiber distribution.
For the fiber orientation analysis, the structure tensor was determined similarly to 35 and calculated in Python, then processed further and visualized in Dragonfly. The structure tensor approach finds the image intensity gradient from the micro-CT image around a point. The vector corresponding to the direction of the minor change in gradient provides the fiber orientation. Two main parameters are used in the structure tensor calculation. Rho, the neighborhood size over which the orientation is calculated, and Sigma, the smoothing parameter, a Gaussian kernel, which smooths out imaging noise. The previous research of 35 has indicated optimal values based on the fiber diameter, and in this study, Sigma of 0.18 and Rho of four were used. The images were preprocessed using the unsharp filter with the Dragonfly settings 3D kernel size of 5, standard deviation at 10, and an unsharp factor of two to improve the fiber contrast. Then, the structure tensor was calculated, and the values were imported back into Dragonfly. The segmented voids were dilated twice with a 3D cube setting and a kernel size of three and then subtracted from the segmented fibers. This avoids taking values from the voids into account. The structure tensor was mapped in the micro-CT images by converting the now obtained data set to binary values.
3-Point-Bending
The 3-Point-Bending according to DIN EN ISO 14125 was carried out on an inspekt250 with a 2.5 kN load cell by Hegewald & Peschke Mess-und Prüftechnik GmbH. The setup included the extensometer DK830SLR by Magnescale Co., Ltd. For each configuration, five tests were performed. The samples were conditioned according to the DIN EN ISO 291 norm in the MKF 56 climate chamber of Binder GmbH. Subsequent interlaminar shear strength tests according to DIN EN ISO 14130 delivered no admissible failure modes.
Results
CTE Values
The obtained CTE values over temperature are depicted in Figure 3. The solid lines give the measured alpha values per temperature for the samples without the tape, while the dashed lines represent the samples with tape. The values were calculated using the formula Effect on the CTE by the addition of tape.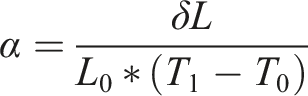
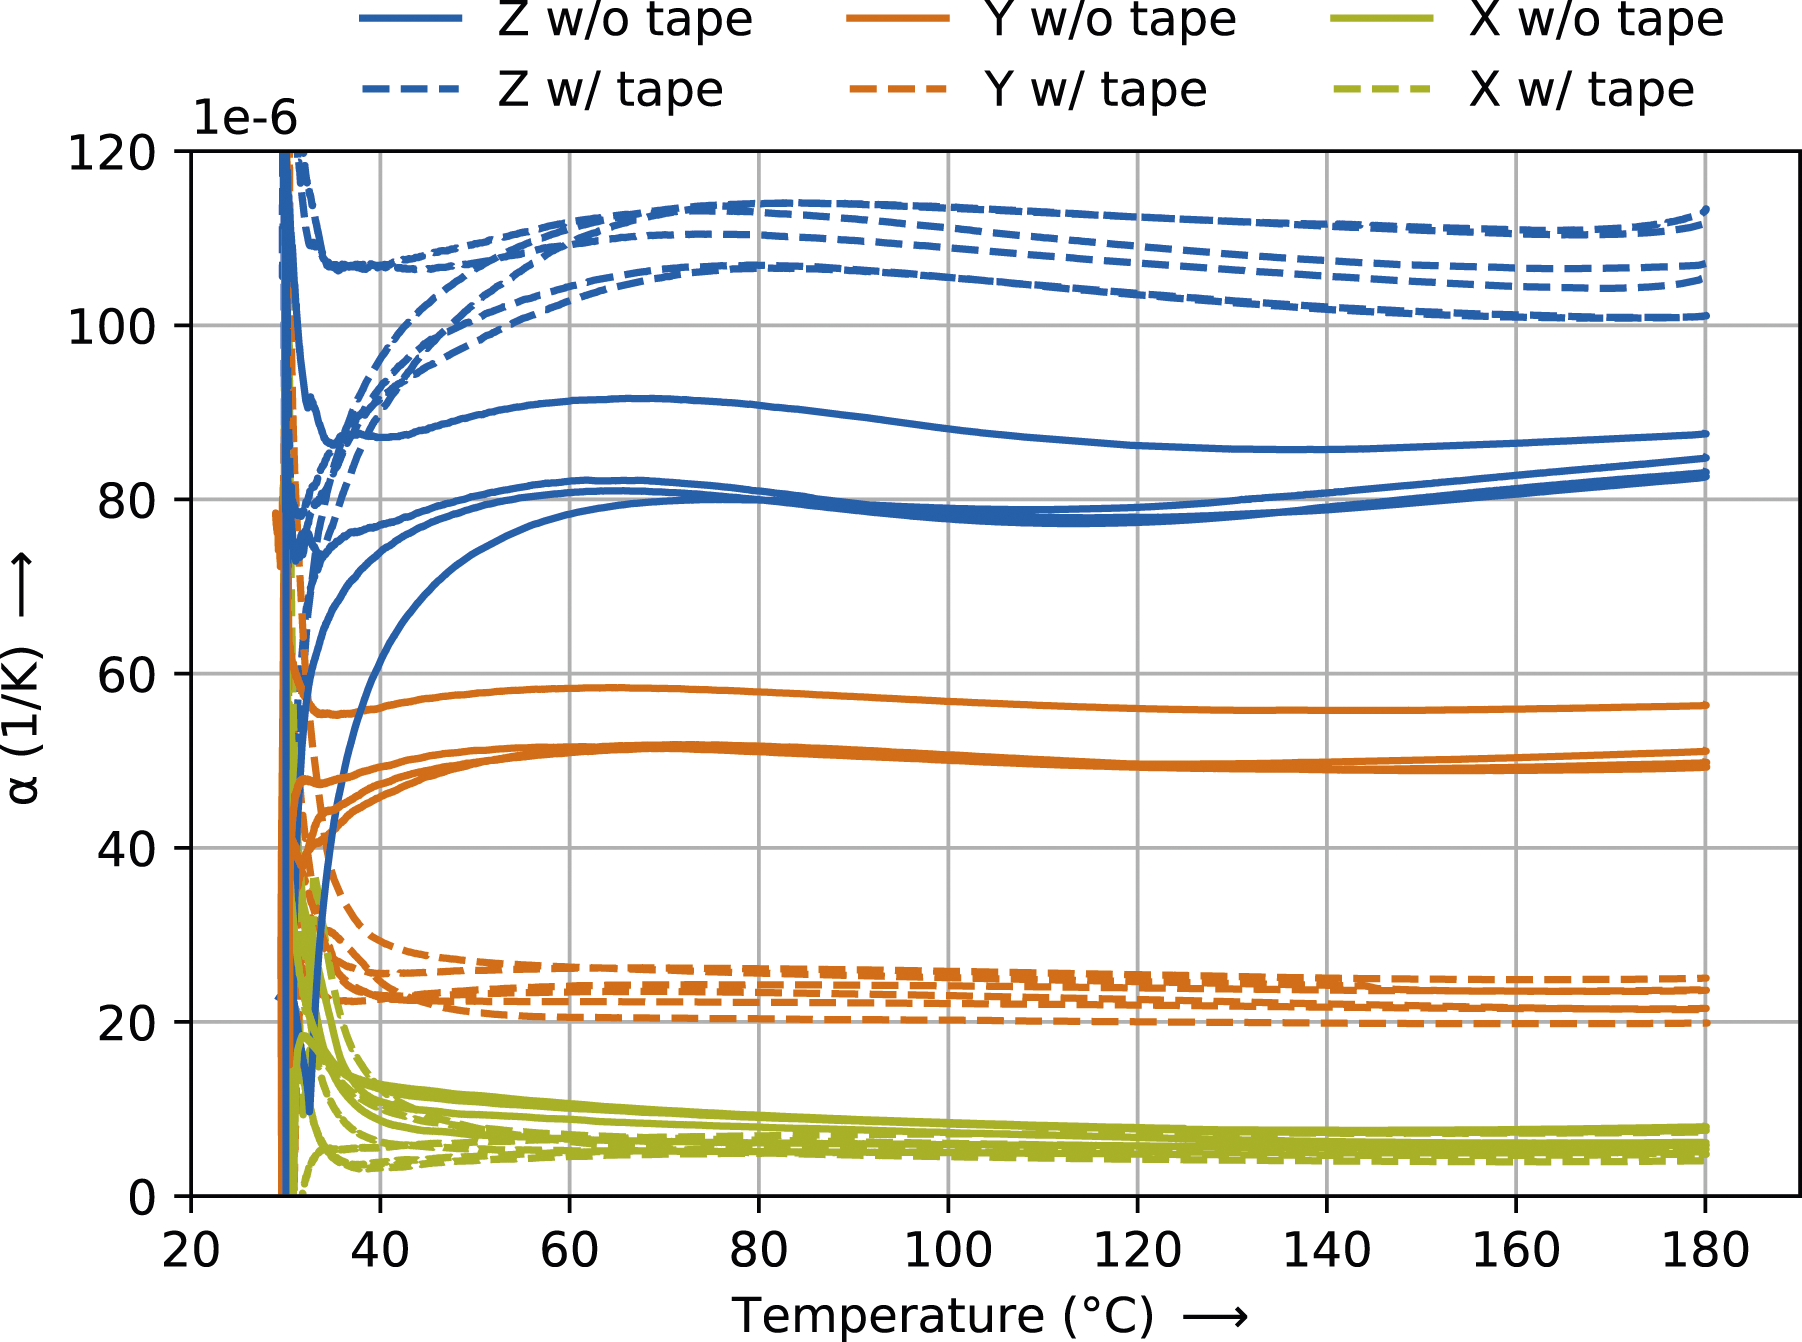
where δL is the measured change in length, L0 is the free clamped length of the sample at starting temperature, T1 is the sample temperature, and T0 the starting temperature of 30°C.
The samples in the x-direction show CTE values in the same order independent of the layer height and the presence of tape. The CTE value in the y-direction decreases when the samples have tape incorporated, while the values in the z-direction increase. The samples with tape show a more linear expansion behavior than the ones without tape. In Figure 4, the alpha-values for the samples at 180°C are given. The material with tape has, for the 2.0 mm configurations, a 41% lower CTE value in x-direction, while the 1.0 mm ones show almost no improvement. This might be caused by the higher standard deviation of mean fiber alignment in the SFR area of the 1.0 mm sample. The Y specimen display a reduction of up to 60%, again with the lower CTE value belonging to the sample with the lower short fiber misalignment. In the z-direction, the CTE increased by up to 32%. Looking at the different layer heights, it is visible that the z-direction CTE values for the 1.0 mm samples with tape show a higher CTE value than the 2.0 mm samples. This is likely due to the tape restricting expansion in the other directions, forcing expansion in z-direction. The Y samples display an opposite behavior, as more tape is present in the samples with a layer height of 1.0 mm. The CTE of a pressed sheet made from the tape is −1.1 × 10⁻⁶ K−1 with a standard deviation of 0.6 × 10⁻⁶ K−1. Barplot showing the CTE values including their standard deviation at 180°C for each configuration.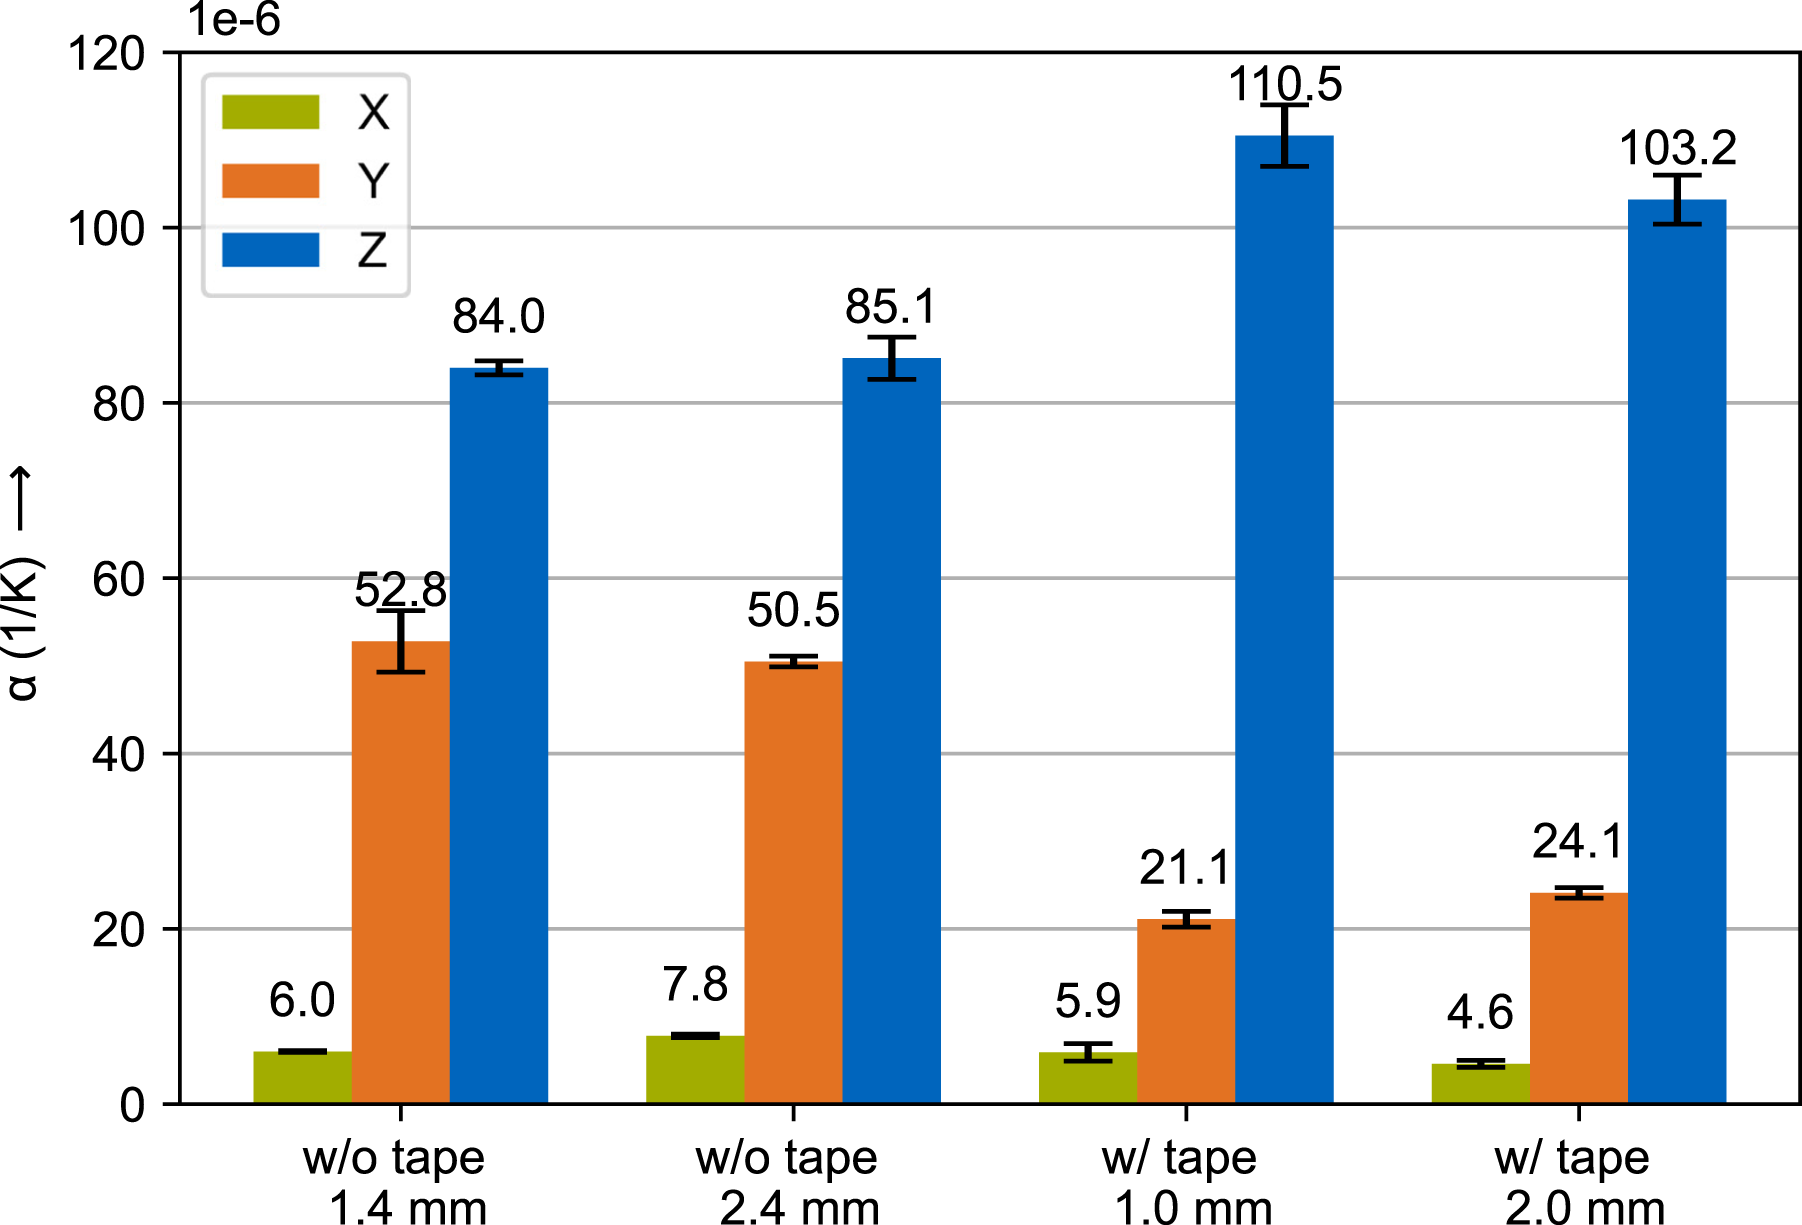
Micro-CT
The structure tensor was acquired for every sample with the method described in the previous section. In Figure 5, the visualization of one result obtained on the horizontal geometry with tape and 1.0 mm layer height is given. The bottom image in Figure 5 shows that, while the continuous tape is picked up clearly by the method (dashed lines), the orientation in the short fiber-reinforced (SFR) section can only be approximated, due to the relatively low image resolution and limited phase contrast between fibers and polymer. Overall, the structure tensor method does not precisely depict the alignment of individual fibers, but gives an acceptable estimation of their average direction and distribution. top: cropped micro-CT image of the horizontal sample with tape and 1.0 mm layerheight; bottom: absolute value of fiber orientation obtained by the structure tensor method for the image above with 0° perpendicular to the image plane.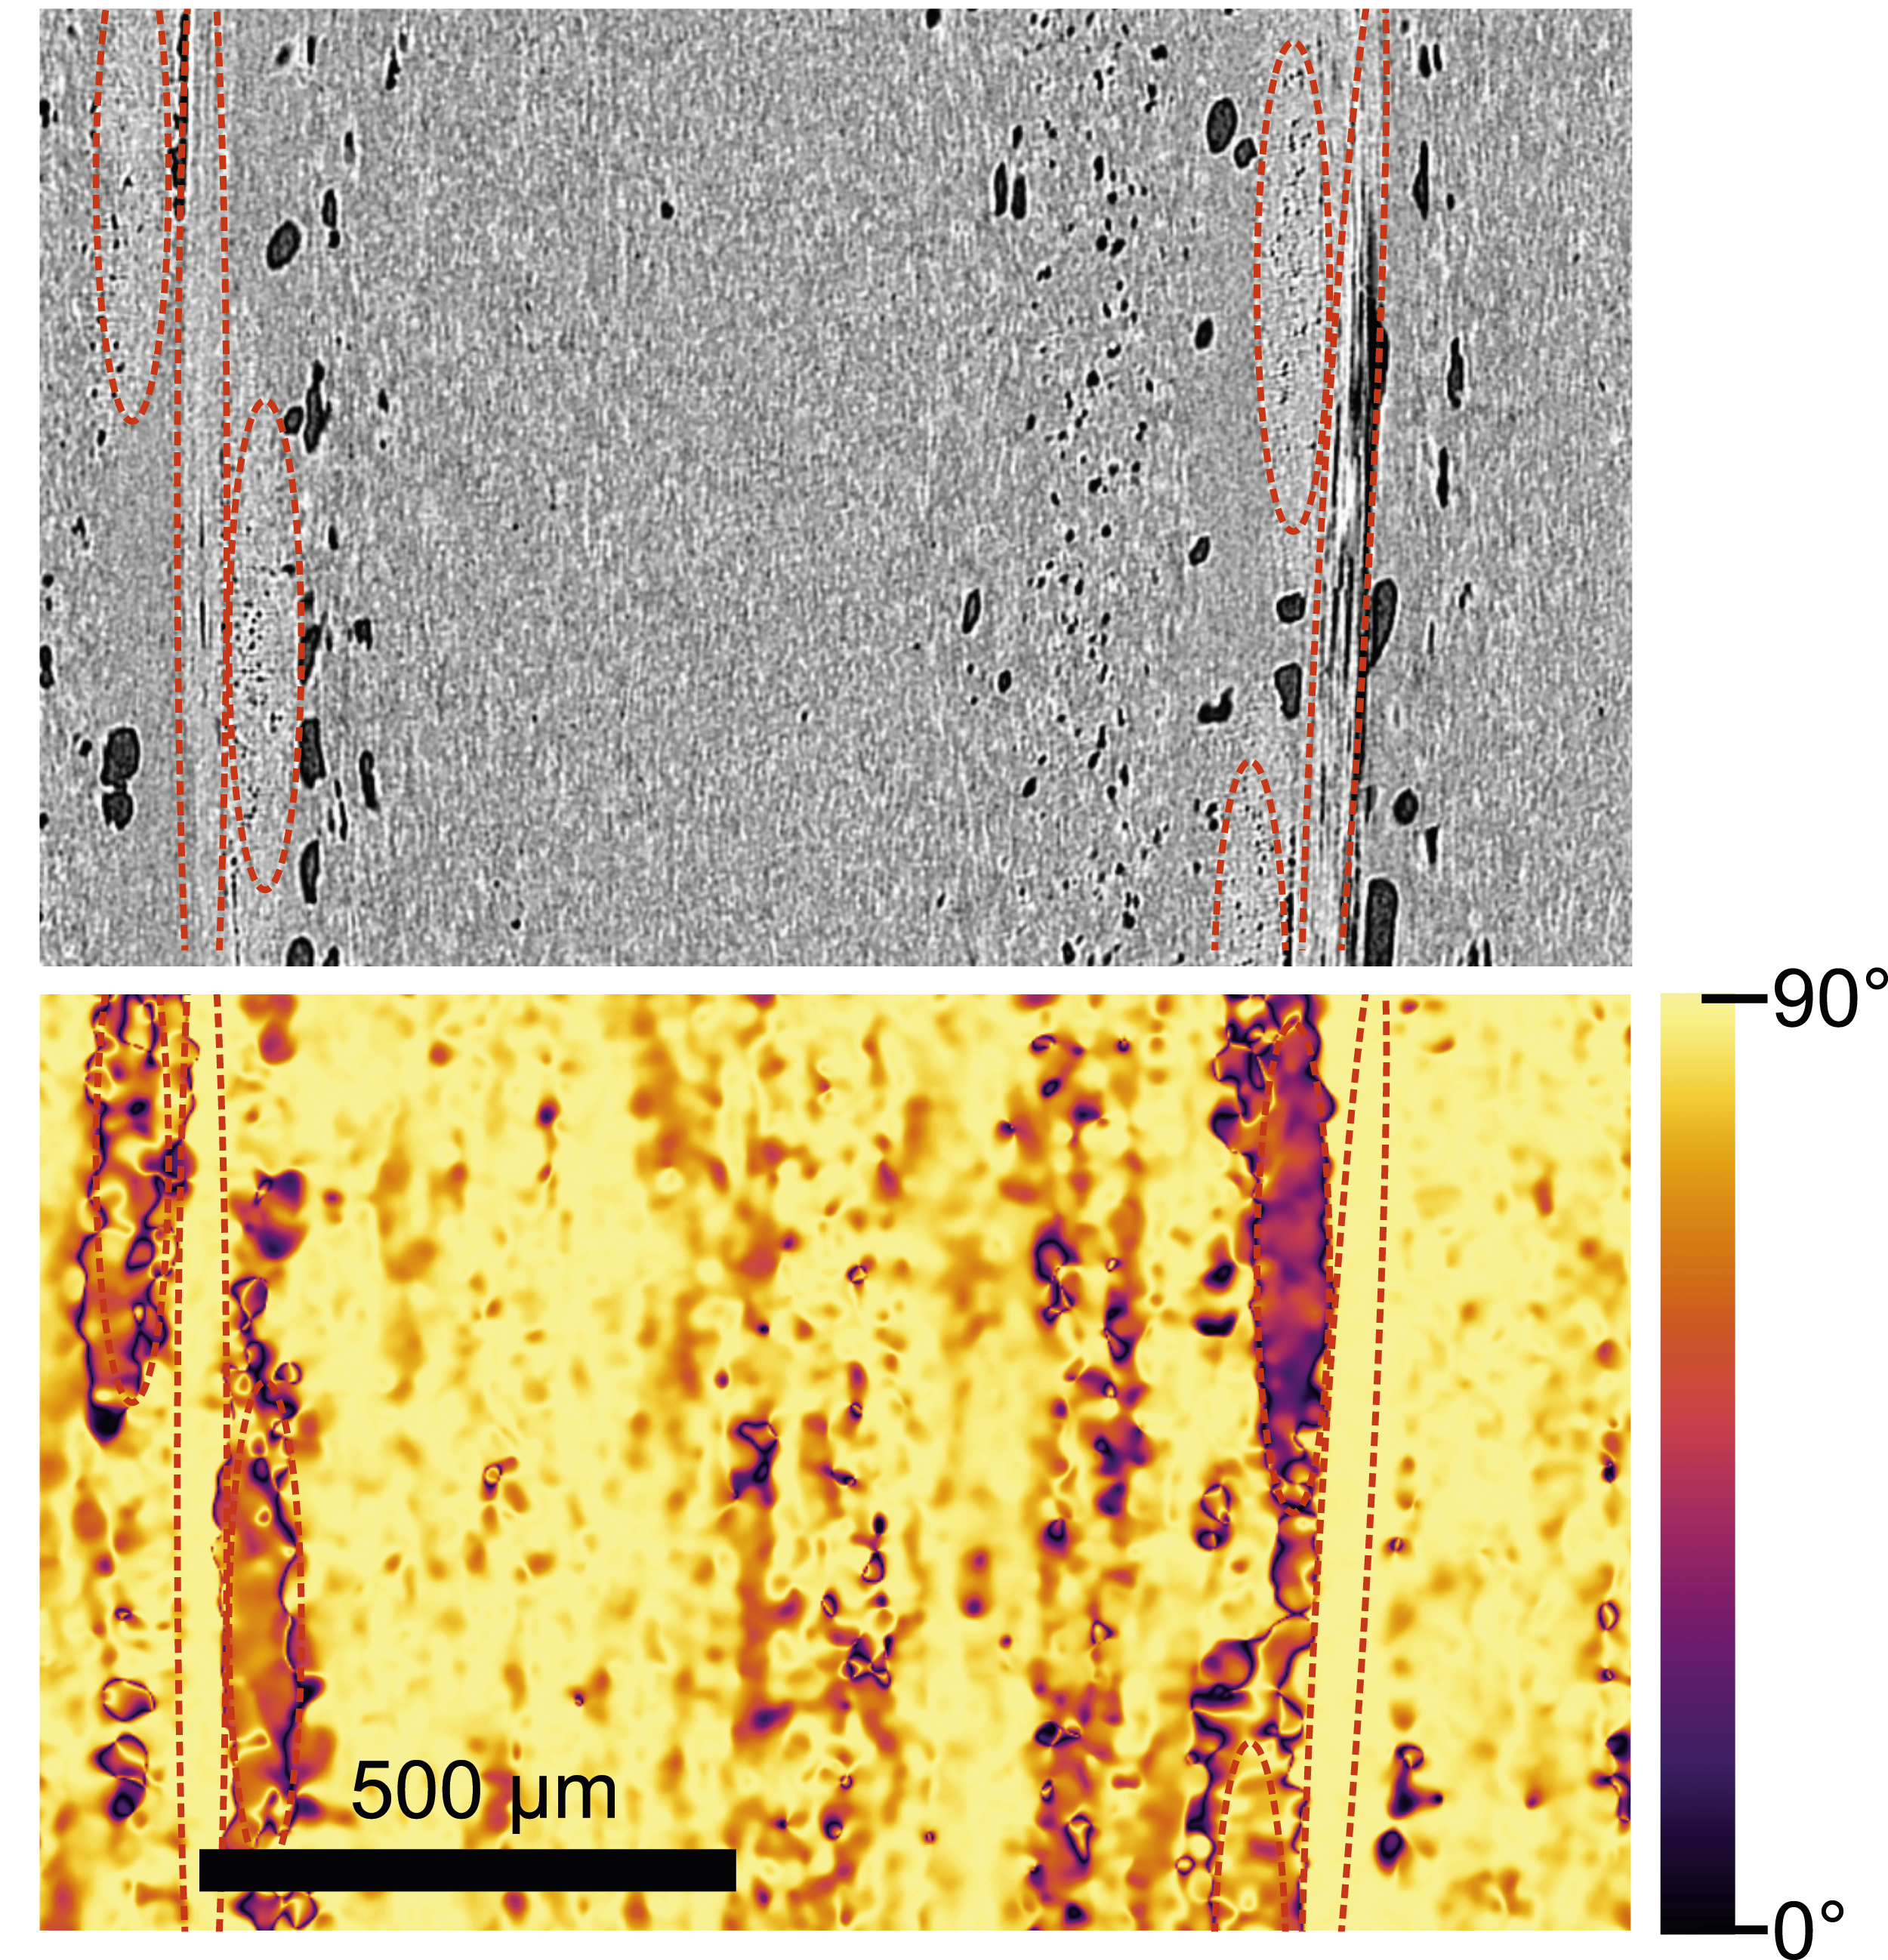
In Figure 6, columns a) and c) show 3D visualizations of similar volume subsets digitally extracted from the samples’ tomogram images with their respective standard deviation of the mean fiber alignment per slice in the x-direction (0°) obtained by the structure tensor method. The standard deviation plots clearly show where short fibers are well-aligned or more randomly oriented within the samples’ microstructure. The 2.4 mm sample without tape has a less cluttered fiber alignment in the bead than its 1.4 mm counterpart. This is probably due to the relative wider extrusion width in the 1.4 mm sample, as observed by Yan et al.
43
and Pibulchinda et al.
44
For the configuration with 2.4 mm layer height and no tape, the fiber alignment is on average higher in the top half. A possible explanation is that the material in the upper area of the bead might get pulled or stretched by the nozzle in the printing direction, therefore aligning the fibers. In contrast, the fibers get pushed more to the sides for the lower layers due to the nozzle being closer and enforcing flow in every direction, showing a higher standard deviation. (a) and (c): micro-CT images with the corresponding standard deviation of mean fiber alignment in 0° (x-direction) per slice; (b) and (d): visualization of segmented voids and their area percentage per slice.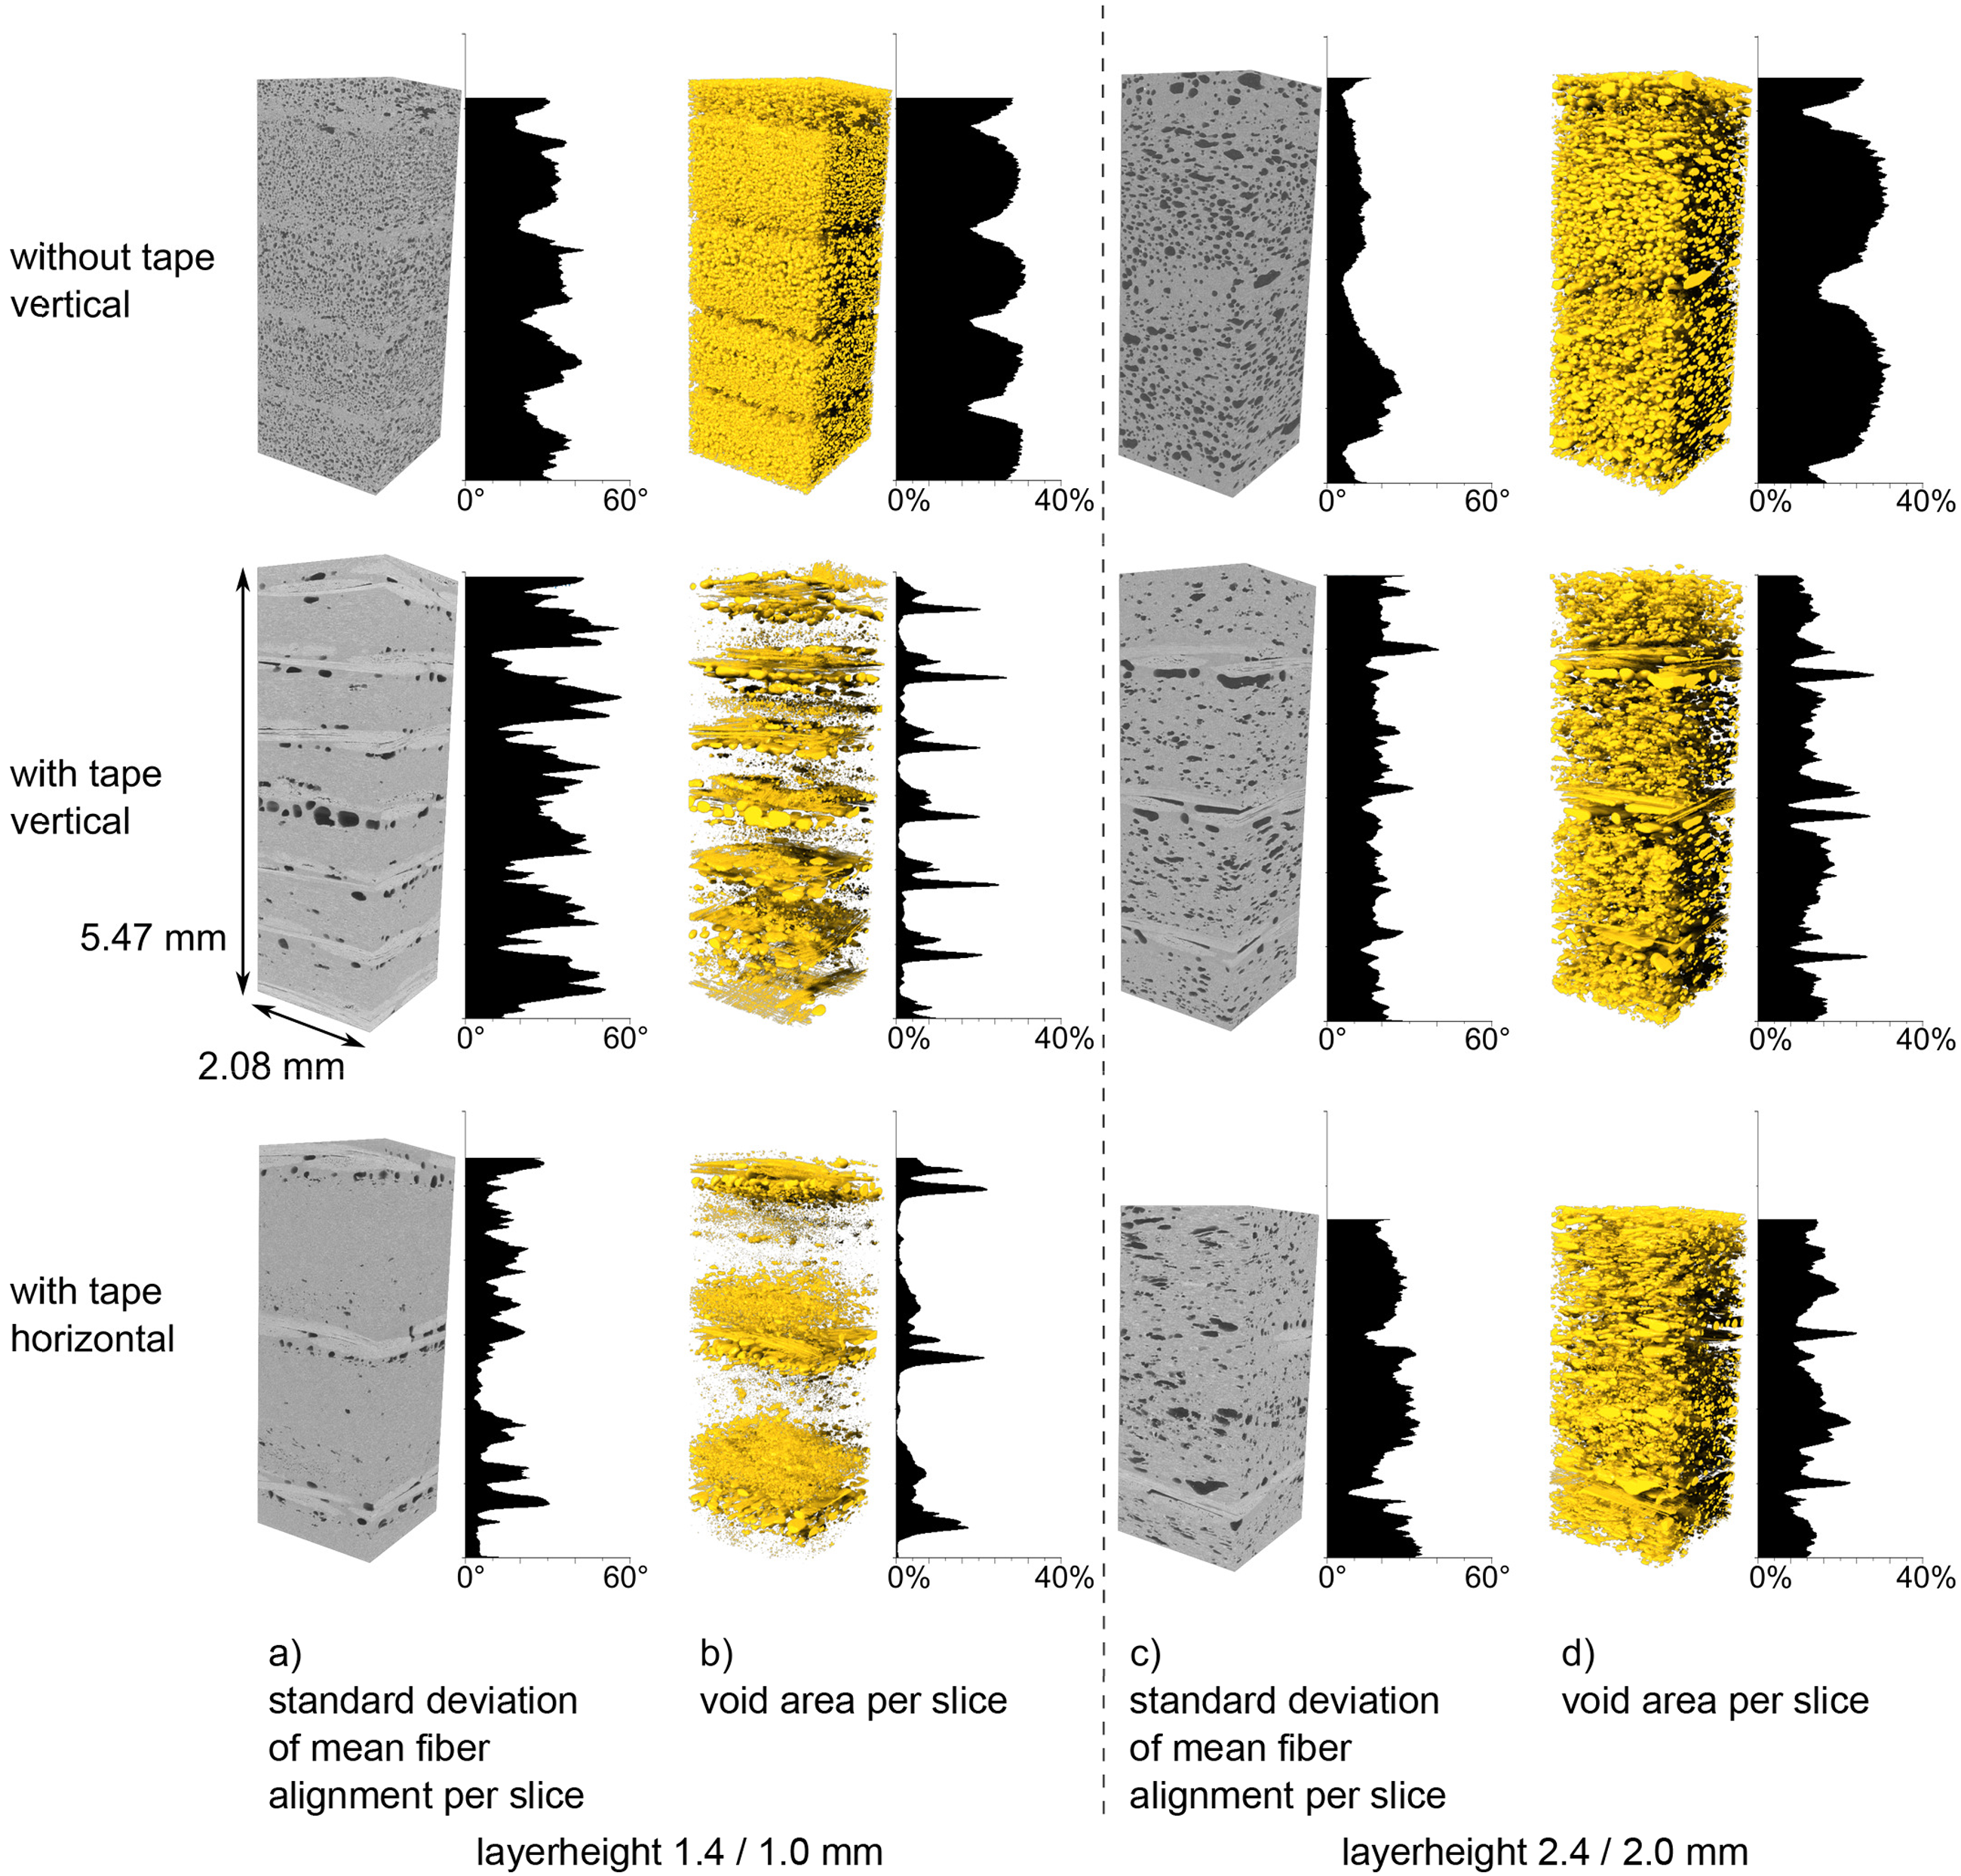
This alignment effect is observed for the specimen cut out off the vertical geometry and manufactured by the ATLAM process as well. The specimen cut out the horizontal geometry with 1.0 mm layer height shows a higher alignment than the ATLAM specimen from the vertical geometry. The previous layer next to the current layer might act as a guide rail, forcing the fibers to align more in the x-direction. This is not the case for the 2.0 mm configuration, and the observation is not expected. For all the ATLAM specimens, the fibers show a strong preferential alignment within the areas with tape, where the fibers in the fabric are oriented in 0° and 90°, by displaying a very low standard deviation in mean fiber alignment values.
Total void content and average connected porosity of the scanned specimen configurations.
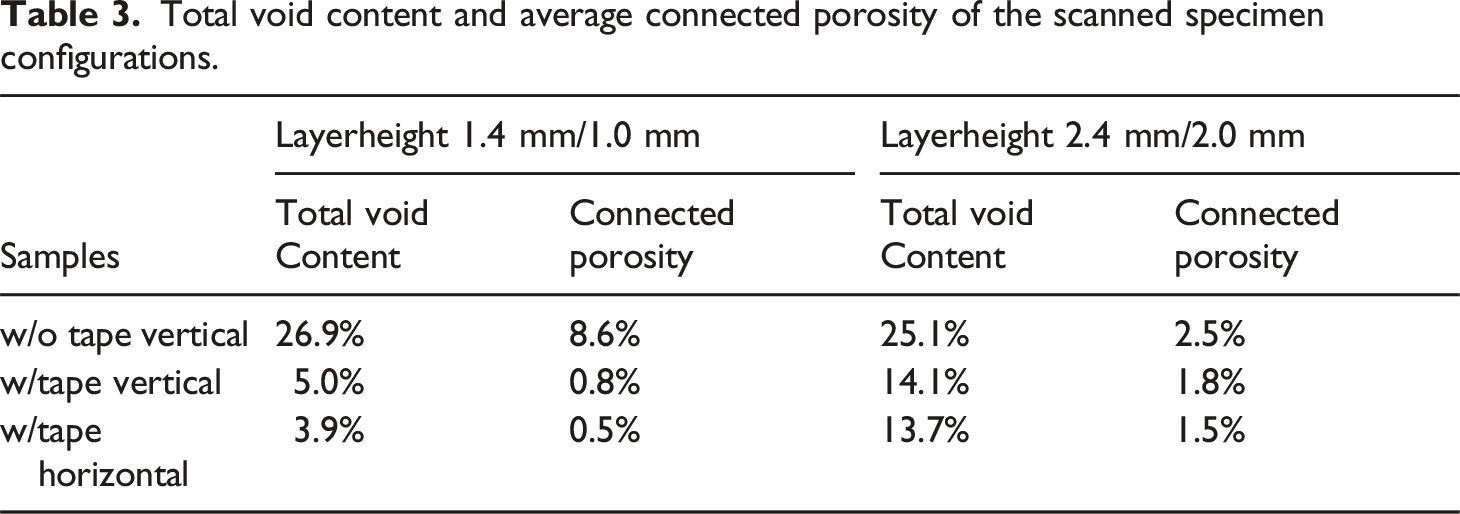
The lowest overall void content is achieved by the ATLAM process with 1.0 mm layer height at 5% for the vertical and 3.9% for the horizontal geometry. The 2.0 mm specimens with tape both have around 14% voids. The specimens printed without tape contain the most voids, with 26.9% for the 1.4 mm layers and 25.1% for the other configuration. The roller lowers the void content by compressing the individual layers. Visual inspection of the segmented images reveals that the average individual void size in the 2.4 mm sample without tape is clearly bigger than the 2.4 mm counterpart. The melt pump in the extruder might affect the void amount in those samples. As there is connected porosity to the surface, coating might be necessary to avoid resin of the prepreg flowing into the voids during a curing cycle, resulting in a form lock and bonding part and tool together. Connected pores form a link between opposing vertical in every specimen except the 2.4 mm sample without tape. There are no pores connecting the top and bottom of the specimens. The pores follow for specimens with tape the fiber rovings, while many of the pores in the 1.4 mm sample without tape are connected to each other. This could lead to vacuum leakage in the printed composite tool, making coating essential.
The highest void density in the samples with tape is located below the tape for every configuration. Some air is likely to be enclosed when the tape is placed on the bead, as the rigid structure of the tape does not adapt to the SFR material below, which might explain this observation. There are also more voids present on top of the tape, but as shown in Figure 7 to a much lesser extent. Possibly, the SFR bead, which gets placed on top of the tape also encloses air, but to a lesser extent, as the molten material adapts better to the tape’s rigid surface. Micro-CT images (top) and corresponding segmented voids and fibers of the tape (bottom) in the 1.0 mm sample with tape cut from the horizontal geometry.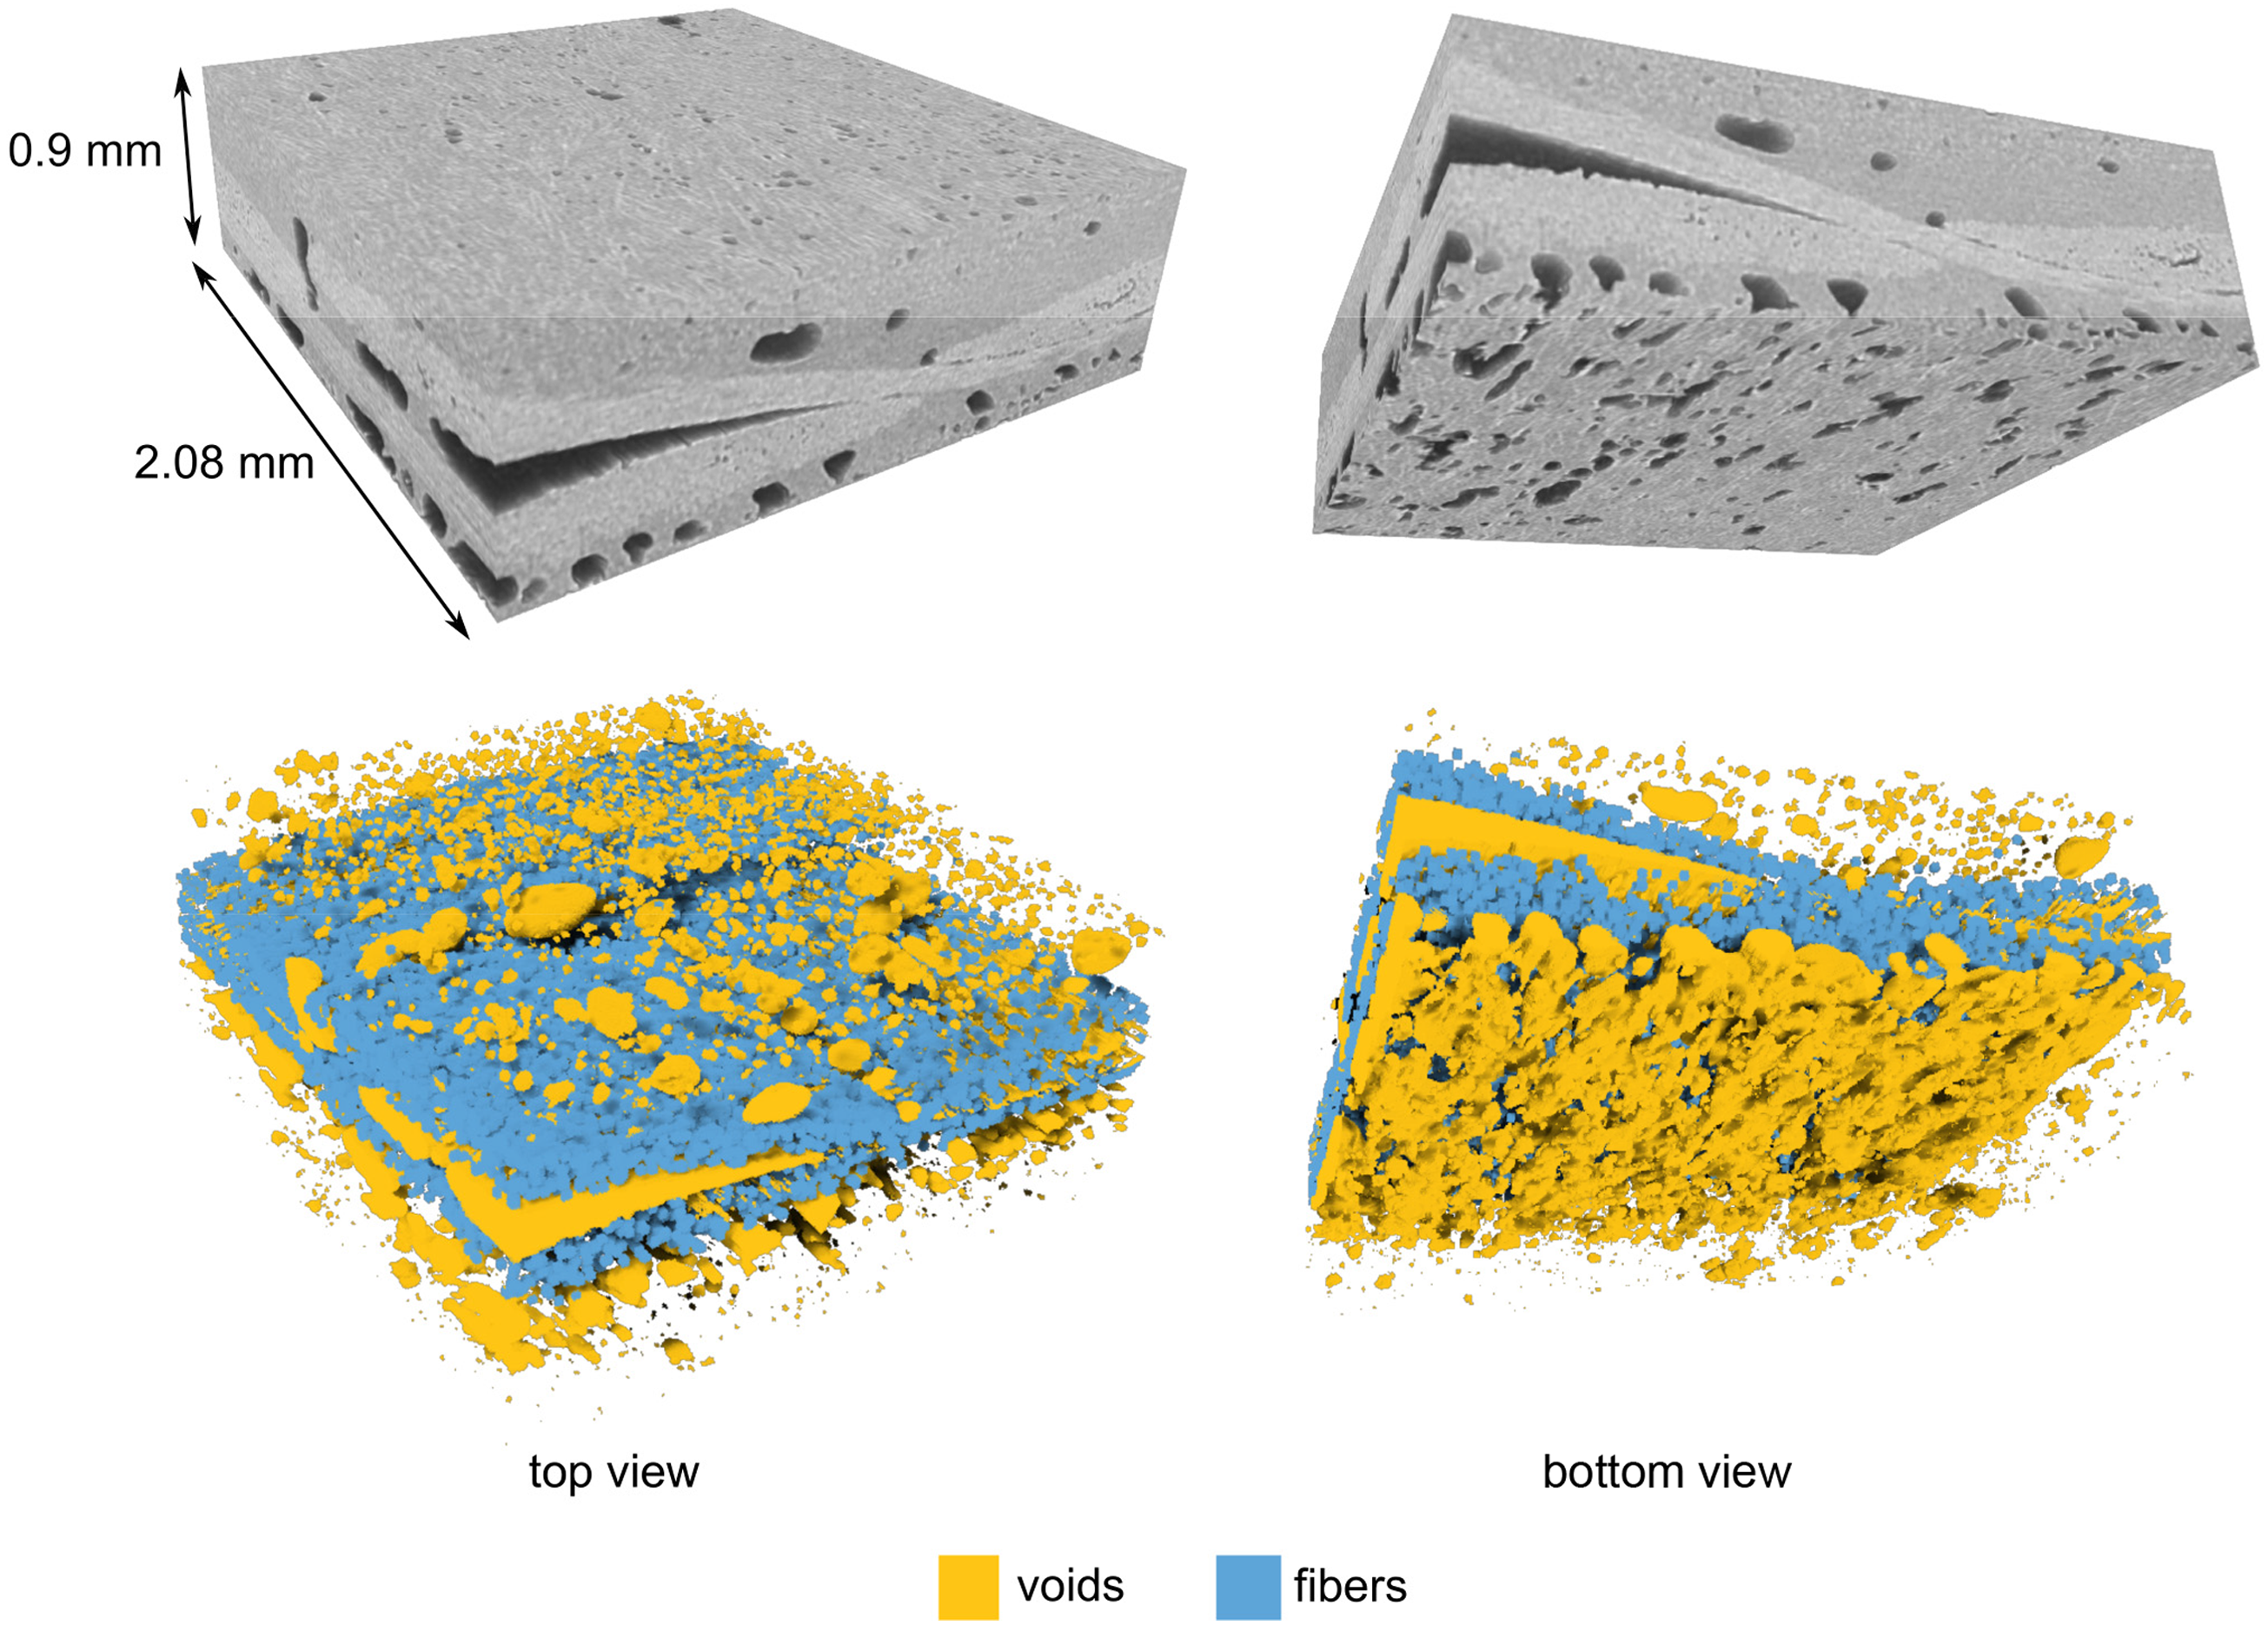
3-Point-Bending
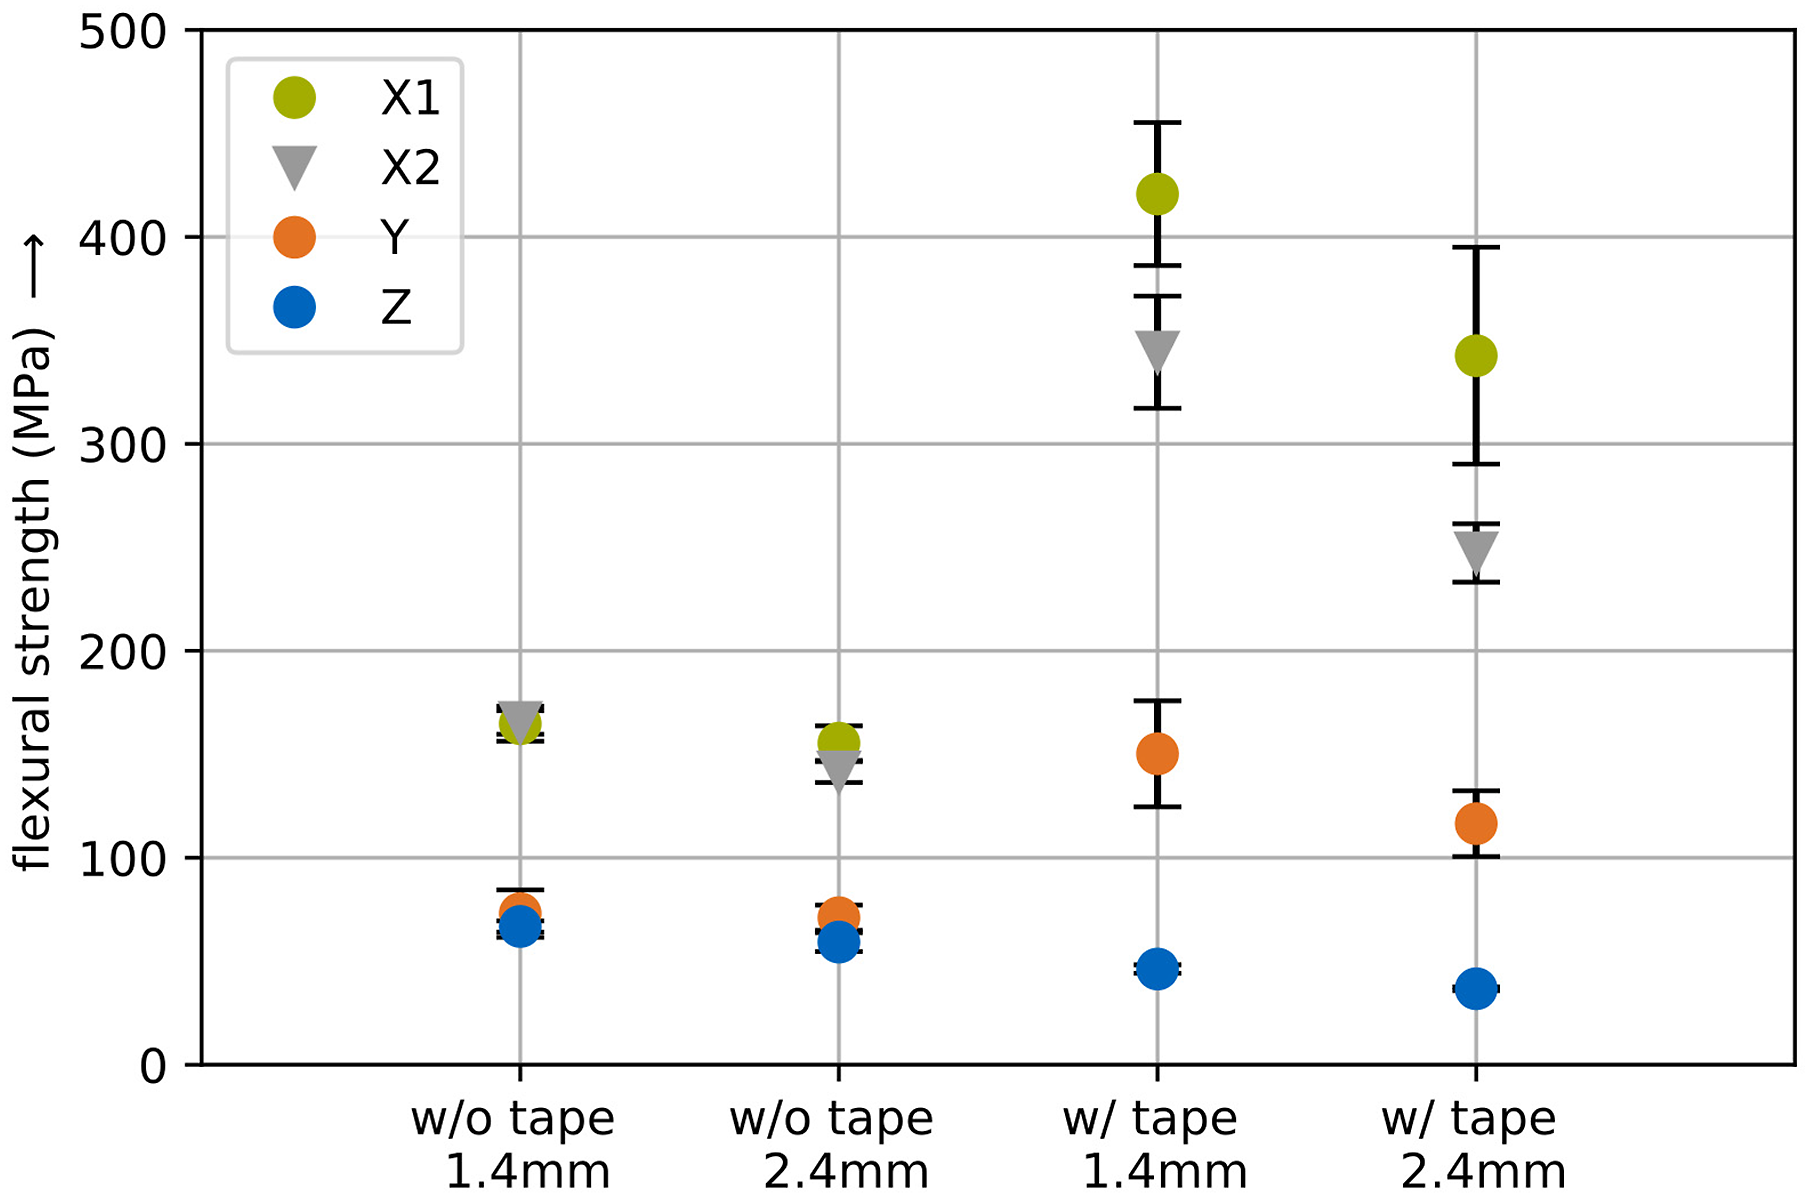
An offset curve of the bending line was acquired by checking the deformation of the test bench setup to calculate the flexural modulus. The results for flexural modulus and strength are given in the Figures 8 and 9. The short fiber-reinforced and tape-reinforced materials show a pronounced directional dependence on the flexural modulus. The flexural modulus for each sample configuration is the highest in the x-direction and similar for X1 and X2. The Y samples outperform the Z samples slightly. Flexural modulus of the configurations including the standard deviation. Flexural strength of the configurations including the standard deviation.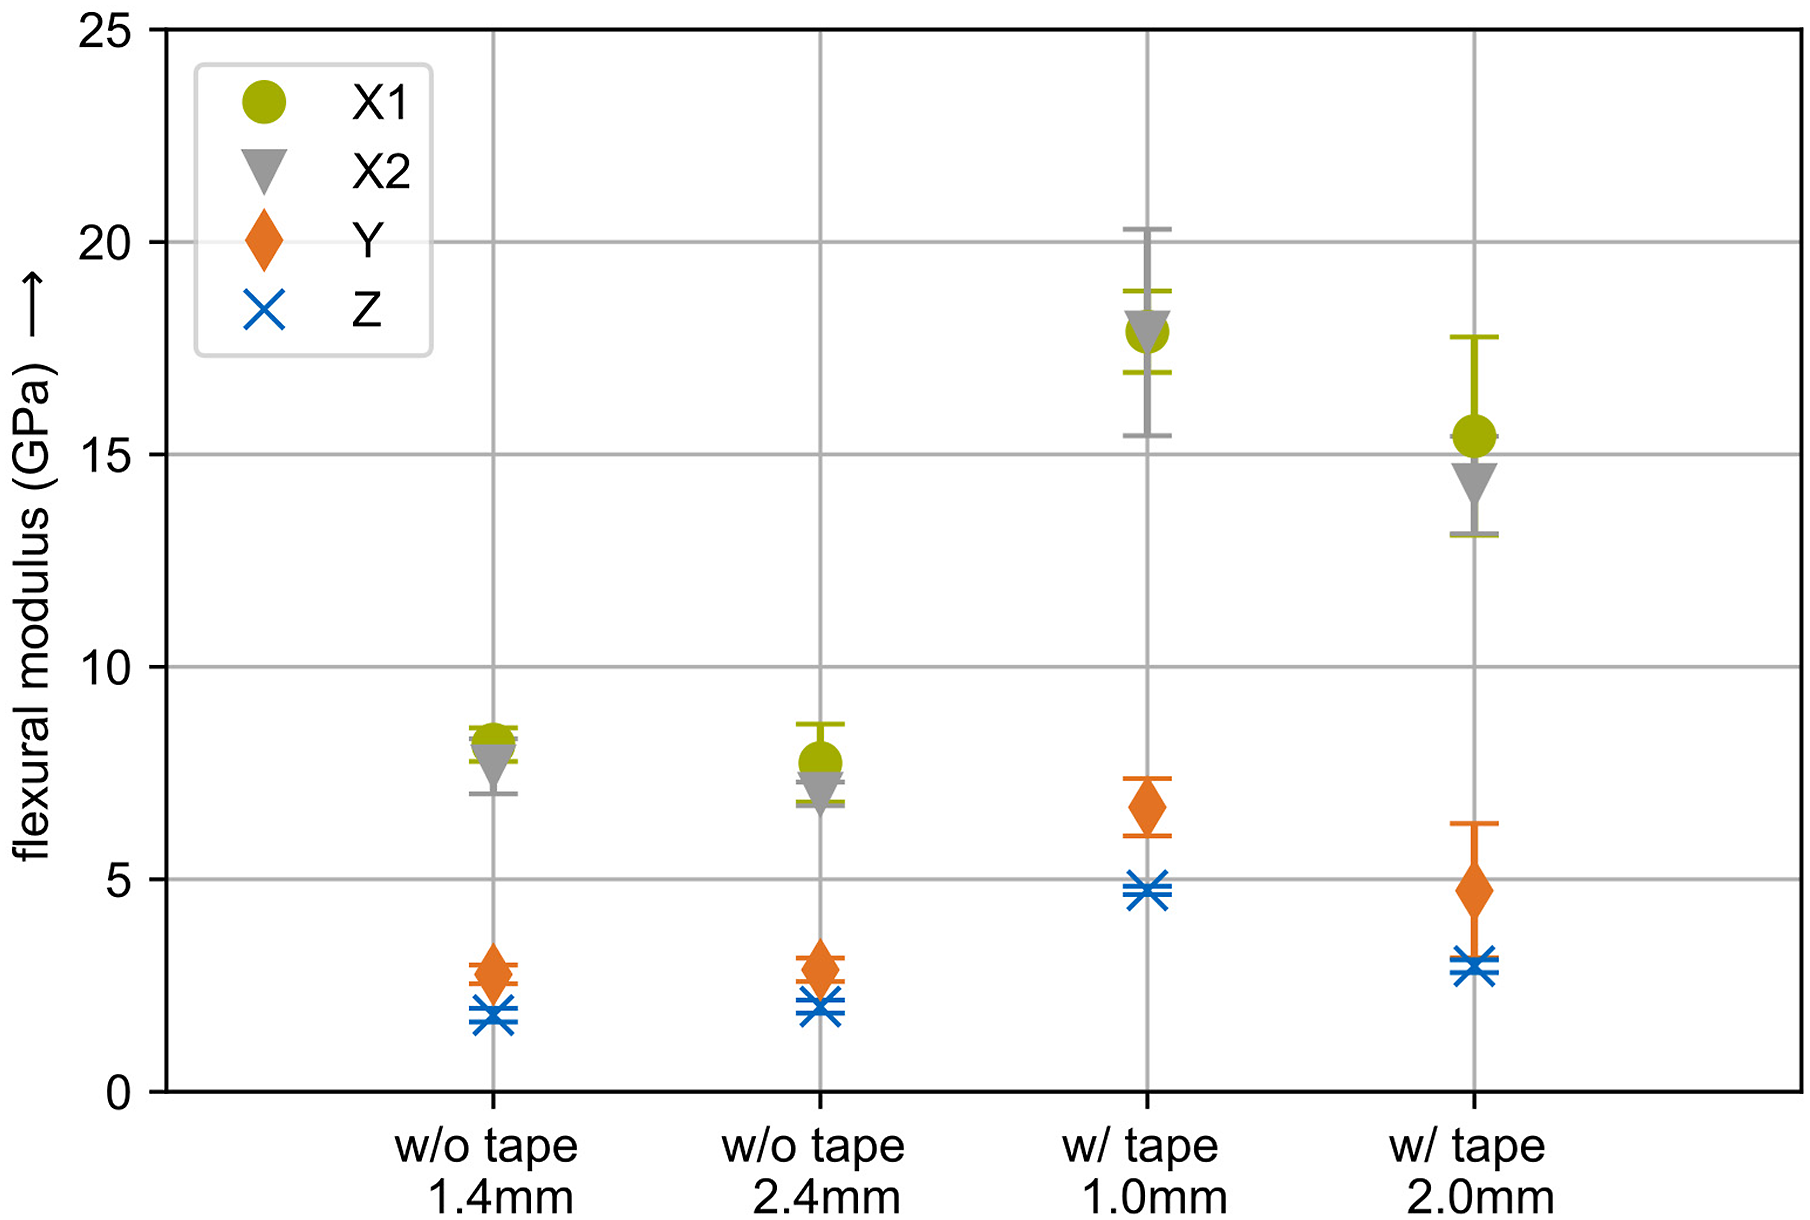
The higher flexural modulus in the x-direction compared to the y- and z-directions in the short-fiber-reinforced material is explained by the higher amount of short fibers oriented along the x-direction. The x-direction is dominated by the high mechanical properties of the fibers, while the y- and z-directions are dominated by the lower mechanical properties of the thermoplastic matrix. This can be explained due to the fibers being mostly perpendicular to the y- and z-directions, leading to relatively similar values. The higher flexural modulus in the y-than in the z-direction of the SFR samples is induced by the more substantial alignment of fibers in the x-y plane than in the other planes.
The significant increase in the flexural modulus in the x-direction for the specimen with tape is caused by the continuous fiber reinforcement in that direction. In addition, the fiber volume content increases since the fiber volume content of the fabric is higher than that of the short fiber reinforced material. The generally higher scatter of the values for the X1 specimens compared to the X2 specimens does not meet expectations. The flexural moduli of the X2 test specimens should show a lower scatter due to the more constant fabric proportion and the more homogeneous tape distribution. The fracture surfaces of the samples are similar and the tape location within the samples shows no relation to the measured values. A possible explanation is that in the X2 specimens, individual fabric layers or parts of them are not oriented perpendicular to the x-y plane. Thus, the mechanical properties are reduced as the continuous fibers of the fabric do not follow the stress flow. The flexural moduli of the Y and Z specimen with tape increase as well compared to the ones without tape. The Y samples with tape now have long fibers incorporated in their structure, which explains the observation. The stiffening of the Z samples with tape compared to the ones without might be caused by the roller compacting the material and reducing the void content, as well as the fabric being stiffer than the SFR material, reducing the bending strain. The specimens with tape and 2.0 mm layer height increase their moduli less than those with 1.0 mm. This effect is caused by less tape being present in the samples and relatively higher void content.
The higher flexural strength of the short fiber reinforced material in the x-direction compared to the y- and z-direction results from the preferred orientation of the short fibers and the absence of layer-to-layer interfaces along this direction. Similar flexural strengths between the y- and z-directions of the SFR material support these findings. The fabric-reinforced material displays higher flexural strength in every direction except z. The flexural strength correlates with the moduli besides for the Z samples. The X1 and X2 samples possess continuous fiber reinforcement, resulting in the highest flexural strength. The long-fiber reinforcement can explain the substantial increase in flexural strength in the y-direction. The compaction by the roller increases the bonding between the beads, which can almost double the y-direction tensile strength. 21 The specimens’ failure behavior shows the fiber length’s significant influence on flexural strength. While the X1 and X2 specimens fail by tearing the high-strength fabric, the Y specimens fail in the thermoplastic region between the fabric. The decrease of flexural strength in the Z samples is explained by the higher void content in the tape area and pure resin areas between the short fiber reinforced material and the tape, causing a weaker bond compared to the SFR specimen. All Z samples with tape fractured at the interface between the tape and short fiber-reinforced material. However, all X samples failed due to a crack in thickness direction without a sign of delamination, demonstrating adequate adhesion between the layers. Comparable strength and stiffness values of common composite materials given by Li et al. 2 indicate sufficient structural properties for tooling applications.
Conclusion
In this study, we compare a novel 3D printed material combination of SFR TP and tape to the same SFR material produced by LFAM. We measure the CTE values and the flexural properties, and explain the results with an analysis of the micro structure obtained by micro-CT. The ATLAM process has the potential to improve and tailor the in-plane CTE in composite toolings through a combination of short fiber 3D printing and tape placement. This process generates a material combination that displays enhanced in-plane thermal expansion behavior and mechanical properties compared to the standard LFAM process. Additionally, micro-CT based analysis revealed that the samples with tape have a lower void content in the samples with the tape. These findings support the application of the process for manufacturing composite tooling, as a low thermal expansion of such tools is preferred, especially in the aerospace industry. Both materials (with and without tape) show a distinct anisotropic behavior due to the nature of the additive manufacturing process. The short fibers align towards the printing direction, resulting in directional in-plane material properties. The addition of the tape increases the anisotropic behaviour. The specimens with tape possess a CTE of up to 60% lower in y-direction than those without tape. In the x-direction, the tape decreased the expansion behavior for 2.0 mm layer height, while it increased the CTE in the z-direction by 21%–32%. The CTE of Invar was not achieved with the novel material combination, tough it improved compared to the conventional SFR material. The flexural modulus and flexural strength of the samples with tape were, in all cases, higher than those for the ones without, with one exception. The strength of the samples in z-direction with tape decreased due to a weaker bond between the layers. The standard deviation of the mean fiber alignment, obtained by the structure tensor method, supports the results obtained in this work. Especially the influence of the short fibers on the CTE of the samples with tape was discussed. Notably, a different sample preparation approach (see X1 and X2 specimens) might affect the outcome of mechanical characterization.
This work opens up a number of possibilities for future investigations. It is possible to use the anisotropic expansion behavior for tailoring the composite tool’s CTE to the part’s specifications. Using unidirectional tape might offer lower CTE values in x-direction, but it is expected that the CTE value in y-direction would increase. Also, the plain woven tapes’ major effect on the CTE was in y-direction while the value in printing direction was not affected as much. Therefore, using SFR material with a higher fiber content could decrease the CTE values. Enforcing a higher short fiber alignment could improve the CTE in printing direction further but would decrease it transverse to it. Changes to the ATLAM process, enabling printing a tool with 0°/90 layer directions, could result in a more isotropic in-plane CTE. The comparatively high matrix amount prevents this material from matching the CTE of Invar. Printing times of such composite tools may be reduced by choosing greater layer heights with minor effects on the material properties. As carbon fibers are electrically conducting, the material can be used for out-of-autoclave tools, as the tape can be heated by resistance heating. Future investigations will include numerical modeling of the material based on the acquired CT images to better understand the material behavior. Further studies should consider the quality of the feedstock material regarding its void content and assess the effect on void generation during manufacturing and final void content in the part.
Footnotes
Acknowledgements
The authors wish to thank the personnel in the ANU X-ray Computed Tomography laboratory (CTLab) for technical support, and the ANU Supercomputer Facility and National Computational Infrastructure (NCI) for their allocation of computing time.
Declaration of conflicting interests
The author(s) declared the following potential conflicts of interest with respect to the research, authorship, and/or publication of this article: Co-Author Jasper Weghorst of CEAD B.V. has patent #Fibre interlayers - EP4108422A1/US20230079104A1 (as cited in the paper) pending to GKN Aerospace Deutschland GmbH and CEAD B.V. Co-Author Frank Strachauer of GKN Aerospace Deutschland GmbH has patent #Fibre interlayers - EP4108422A1/US20230079104A1 (as cited in the paper) pending to GKN Aerospace Deutschland GmbH and CEAD B.V.
Funding
The author(s) disclosed receipt of the following financial support for the research, authorship, and/or publication of this article: This work was supported by the Bavarian Ministry of Economic Affairs, Regional Development and Energy’s ”Bayerisches Verbundforschungsprogramm - Neue Materialien” under MW-2007-0004.