
Abstract
Laser technology plays an important role in today’s industrial environment. Laser marking is typically used at the end of the production chain to personalize products and make them traceable to the point of sale. One of the challenges of laser marking is the difficulty of creating contrasts whose reflectivity can cause readability problems for electronic decoding devices on production lines, known as scanners. This problem is related to the wrong choice of marking parameters, which results in waste for companies in terms of production stoppages due to rejection, scrap, and customer complaints. Although these problems are common, this process is increasingly used in the industry. Therefore, there is a gap in studies in this field to optimize the marking parameters in many materials, such as PBT (polybutylene terephthalate). The present work was developed in a final assembly line of instrument clusters for motorcycles, where tests were carried out with different types of laser marking parameters, through the implementation of a factorial DoE, with a specific type of laser and material. The laser-marked codes were analyzed in a laboratory using a verifier to assess quality according to ISO/IEC 29158:2020. It was found that the lower the parameter values, the poorer the quality of the codes. The data were statistically processed, and it was possible to identify the marking parameters that ensured the best quality and process performance for DMC and QR codes.
Keywords
Introduction
The current international context in which industrial companies operate is characterized by intense competition, with new technologies playing an increasingly important role. 1 In this context, continuous improvement is emerging as a strategy that allows companies to maintain and improve their competitiveness by exploiting knowledge and involving employees. 2 Continuous improvement can be defined as small, incremental changes in production processes or work practices that do not require large investments and whose objectives can be to improve operational efficiency and productivity, quality, production times, and other outcomes, particularly in terms of production costs. 3
Traceability plays an increasingly important role in the industry, especially with Industry 4.0 and increasing digitalization. The high complexity of supply chains, the existence of counterfeits, and product recalls have made traceability increasingly important. 4 For traceability purposes, for example, 1D and 2D codes can be used with different information, such as part and serial number, batch, and manufacturing date, among others. 5 These codes can be printed on labels and affixed to the parts, or marked directly on the parts with a laser, providing permanent, legible marking and effective traceability. 6
In a production scenario, by reading these codes along the supply chain, it is possible to analyze information about the material and manufacturing processes used, and the results of inspections carried out, among other things, allowing this information to be stored in a computer system. 6 Symbol marking technology, called Direct Part Marking (DPM), has attracted interest in recent years in the automotive, aerospace, medical, and decorative industries for its ability to permanently and directly mark parts with excellent reliability.4,7 DPM can be performed by various processes such as laser marking, dot peening, and chemical etching. Among these methods, laser marking is the one chosen for writing symbols on small parts, as it offers several advantages that make this marking technology one of the most advanced. Some of the advantages are that it is: (i) a non-contact process that can be automated; (ii) high speed, repeatability, and flexibility; and (iii) low chemical and thermal impact on the parts.7,8
An existing challenge in DPM, due to the difficulty of creating contrast, is the marking of symbols on metallic materials with high reflectivity and fiber-glass-reinforced composites, while ensuring resistance to aggressive environments, quality, repeatability, and legibility by electronic decoding devices on the production line, known as scanners.7,9 As these electronic devices are not as flexible as the human eye, the quality of the laser marking must be carefully controlled to ensure a consistent reading rate, especially in the electronics industry where accurate, highly visible, and permanent marking is critical. 5
According to Qiu, Bao, and Lu, 10 laser marking (LM) is essentially a thermal process that uses a focused beam of high-intensity light to create a contrasting mark on the surface of a given substrate. This marking can be achieved either by removing material or by changing the color of the surface layer of the material through localized heating. 11 The content to be marked can vary from a simple alphanumeric code, a Data Matrix Code (DMC) to indicate technical data, serial numbers, date of manufacture, expiry date, etc., to functional symbols, certifications, and company logos. 12
Researchers have applied the laser marking process to the surfaces of stainless steel,13,14 carbon steel, 9 aluminum alloys, 7 and ceramic materials 15 and studied their interaction with these material surfaces. In these works, they studied the influence of laser parameters such as pulse frequency and scan speed on the marking quality by analyzing the width, depth (penetration), material evaporation, surface roughness, and contrast of the marking using a Nd: YAG laser. They found that the laser parameters had a significant effect on the marking quality, influenced by the changes in contrast caused by lower material evaporation and the minimum surface roughness at maximum pulse frequency and scan speed, promoted by the greater interaction of the laser beam with the material per unit time.
Qi, Wang, and Zhu, 13 in an LM work carried out on stainless steel, found that the marking depth increases with increasing pulse frequency, reaching a maximum at a pulse frequency of around 3 kHz. On the other hand, the marking depth decreases with increasing pulse frequency to values above 3 kHz, a phenomenon that the authors explain as being caused by the change in peak power and average laser power with the change in pulse frequency. Peak power decreases and average power increases with increasing pulse frequency. This means that the volume of material vaporized increases and so does the depth of marking. However, when the pulse frequency is high, the material is not completely vaporized and some of it remains in a molten state because the peak power is not high enough to vaporize it, so the marking depth decreases for this reason. These authors also verified that the marking contrast improves as the pulse frequency increases, with a maximum of 8 kHz, because as it increases there is less material evaporation and more oxidation.
Patel et al 14 concluded that the average roughness (Ra) is lower as the pulse frequency increases, with a minimum of 80 kHz and a maximum of 20 kHz. In the same study, the average roughness (Ra) is maximum for a scanning speed of 100 mm/s and decreases sharply with increasing scanning speed up to 300 mm/s and then remains stable up to 500 mm/s. Also in this study, the average roughness (Ra) is maximum for 10 passes, decreases sharply up to 15 passes, and then increases slightly up to 20 passes.
The experiments carried out by Leone et al 16 on stainless steel were performed at room temperature with a range of current intensities between 35 and 45 A, scanning speeds of 50, 100, and 200 mm/s, and varying pulse frequencies in the range of 1 to 30 kHz. In each experiment, a 50 mm straight line was marked in a single pass. It was found that surface roughness and oxidation increased as a function of pulse frequency, resulting in improved contrast up to a characteristic value (between 4 and 6 kHz) and then decreased. For these reasons, the visibility of the marking on stainless steel depends on the laser system used; if the aim is to obtain good visibility of the marking, relatively low pulse frequencies (between 4 and 6 kHz) and average powers should be used.
Polymeric materials and their nanocomposites are an important material in the industrial sector, they have been widely used in food packaging, medical devices, cables, clothing, construction, aerospace, and automotive parts due to their lightweight, high modulus, chemical resistance, and excellent wear resistance. 17 As these materials should also be traceable within the production sector, researchers have studied laser marking techniques using polymeric materials or their nanocomposites to understand the influence of laser parameters on the surfaces of these materials.
Typically, Nd: YAG lasers are the most used for the modification of plastics. Some of the polymers susceptible to laser light of this wavelength produce carbonized dark marks on their surface, such as polycarbonate, polystyrene, and polyethylene terephthalate produce carbonized dark marks on their surface. 18 Still, others, such as PP, 18 PU, 19 ABS,20,21PA, 22 and PS 23 have received additives to facilitate laser marking and improve the quality of the codes.
Liu et al 17 investigated laser marking on the surface of polystyrene-grafted antimony trioxide (Sb2O3-g-PS). The antimony trioxide acts as an additive to change color during laser marking to promote high contrast marking patterns of Quick Response (QR) codes. They used Fourier transform infrared spectroscopy, scanning electron microscopy, and transmission electron microscopy to characterize the modified surface.
Cao et al 24 used X-ray photoelectron spectroscopy (XPS), X-ray diffraction (XRD), and Raman spectroscopy to characterize the QR codes produced by laser marking on TPU/BiOCl composite surfaces. The samples showed high-contrast black markings on the surface, depending on the weight percentage of BiOCl and the laser fluence, in terms of visual and microscopic analysis. Yang et al 25 investigated the influence of carbon nanotubes/polycarbonate to improve laser marking properties on polypropylene surfaces. They used Raman spectroscopy and scanning electron microscopy (SEM) techniques to observe changes in the surface morphology and structure of the composites. From these observations, they proposed a mechanism for the enhanced local laser marking of the polypropylene-doped carbon.
PBT composite has excellent short-term mechanical properties, including high strength, toughness, and stiffness as well as good practical impact. It also offers good creep resistance, dimensional stability, low moisture absorption, stain resistance, and processability characteristics. Due to its many uses in the automotive, electrical electronics, and medical industries, PBT, or polybutylene terephthalate, has attracted commercial interest. Among engineering polymers appropriate for automotive applications, polybutylene terephthalate reinforced with 30% glass fiber (PBT/30%GF) has emerged as a reference material in recent years. It offers excellent mechanical properties, and good thermal insulation, is reasonably priced, and permits high production rates in geometrically complex parts. 26
To comprehend the mechanical properties of poly (butylene terephthalate) (PBT)/glass fiber (GF) composites, morphological, mechanical, and rheological properties were examined. The findings imply that altering the processing parameters, such as the matrix polymer’s molecular weight, the fiber’s surface treatment, and the fiber’s feeder location, can yield the best mechanical properties for the fiber-reinforced polymer composite. 27
Besides that, the addition of carbon fiber or synthetic graphite to polymer composites has been researched to increase their thermal conductivity for industrial uses. Researchers have examined the thermal conductivity of PBT composites loaded with carbon fiber and synthetic graphite. The thermal conductivity of the graphite and/or its composites has significant importance considering the demands for thermal conductance in heat exchangers, circuit boards, machinery, and electronic appliances. 28 According to Yenier et al., 29 PBT’s tensile and flexural strengths are enhanced by carbon fiber up to a 30% weight percentage. However, the addition of synthetic graphite loading reduces PBT’s tensile and flexural strengths while increasing its thermal conductivity. The results showed that the percentage of carbon fiber in PBT was 3.41 W/mK for 40% carbon fiber reinforced composite and 9.24 for 40% synthetic graphite filled composite. It was found that carbon fiber outperformed synthetic graphite in terms of through-plane thermal. 29
In their studies, Savu et al 30 concluded that during the laser marking process, the high thermal conductivity of the polymer composite contributes to the development of the thermal field, influencing the change in the physical state of the polymer matrix, which rapidly changes from a rubbery state to a viscous fluid state, giving the marked code better properties and thus improving its quality.
Due to the properties of PBT composites, Ng and Yeo31,32 studied laser marking on anodized aluminum, stainless steel, polybutylene terephthalate (PBT), and phenol-formaldehyde surfaces using a Nd: YAG laser. The initial investigation 31 involved marking the sample surfaces at varying rates and observing them in three distinct lighting conditions: tungsten, fluorescent, and daylight. Stainless steel and anodized aluminum were the metallic materials that were subjected to lower operational laser scanning rates than PBT and phenol-formaldehyde, which are polymeric materials.
Anodized aluminum might be categorized as low, PBT and stainless steel as medium, and phenol formaldehyde as high in terms of maximum color difference values. Based on the measurements of the material surface’s spectral reflectance, the lightness ratio was examined in the second investigation. 32 For each of the materials under study, the approach revealed the ideal scanning speeds; the optimal speed for PBT was the greatest, and the lowest for stainless steel. Additionally, it demonstrated that the maximum and lowest visibility was found for markings on anodized metal and phenol-formaldehyde, respectively. These noted alterations were connected to the material’s reaction to the laser in both investigations.
The studies on laser marking on polymeric surfaces that have been published in the literature all concentrate on the outcomes of physicochemical analysis to watch how the laser interacts with the surface of the polymer and any possible chemical and/or physical alterations that may have taken place in the material. However, there is a clear gap in the literature in analyzing the quality of the printing process in hard-to-mark thermoplastic composite materials. Thus, the main motivation for developing this work was to employ a set of experiments to analyze the code printed quality on the PBT thermoplastic composite surface, contributing in this way to the advancement of knowledge in this field.
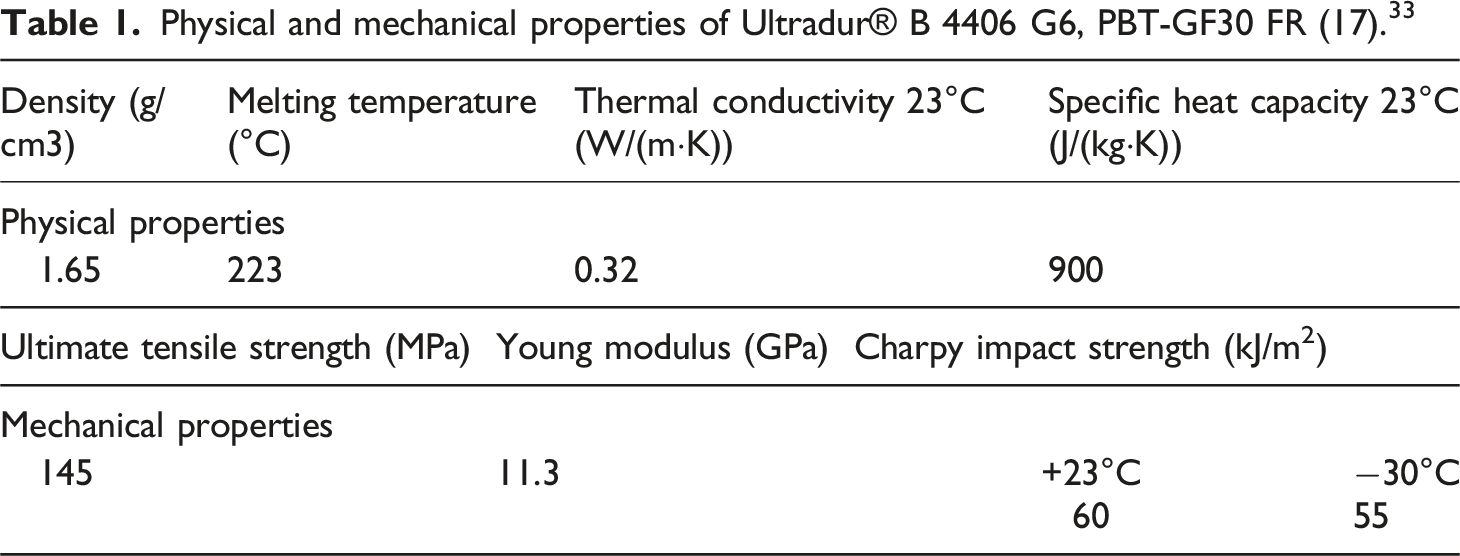
In this study, the effects of laser marking parameters on the surface quality of Ultradur® B 4406 G6, PBT-GF30 FR (17), a material with a 30% glass fiber (GF) and polybutylene terephthalate (PBT) content, are investigated. This thermoplastic composite is usually used in motorcycle instrument panel backs. Moreover, there are no previous studies involving this material. These are the reasons why this material was employed in the study to find out how the quality of the marked content is affected by laser marking parameters. According to the manufacturer, this material is not accepted for laser marking, but it does meet the product’s standards regarding the physical and mechanical properties that are considered to be the most influencing in mechanical design. For this item, research on the optimal parameters to mitigate the effects of the current problem is required.
Experimental procedure
The flowchart corresponding to the experimental sequence used to pursue the main goals of this work is shown in Figure 1. Ultradur® B 4406 G6, PBT-GF30 FR (17) (BASF)
33
was selected as the material since it was challenging to acquire a quality marking standard during the production process. Four parameters and three value levels were selected to create experiments using the DoE-Taguchi approach. Then, the laser marking procedure was carried out to obtain the codes. A verifier was used to assess the marked surface’s quality. The signal-to-noise ratio (S/N ratio) was examined to assess the outcomes, and the ANOVA tool was utilized to determine which levels and factors would be the most influencing the code surface quality. SEM analysis was performed to observe whether significant morphological changes occurred on the material surface with a direct relationship with the code quality. Finally, EDS analysis was performed to check whether there was chemical degradation on the sample’s surface. The results were compared, and conclusions were drawn. Flowchart representing the steps taken in the experimental methodology used in this investigation.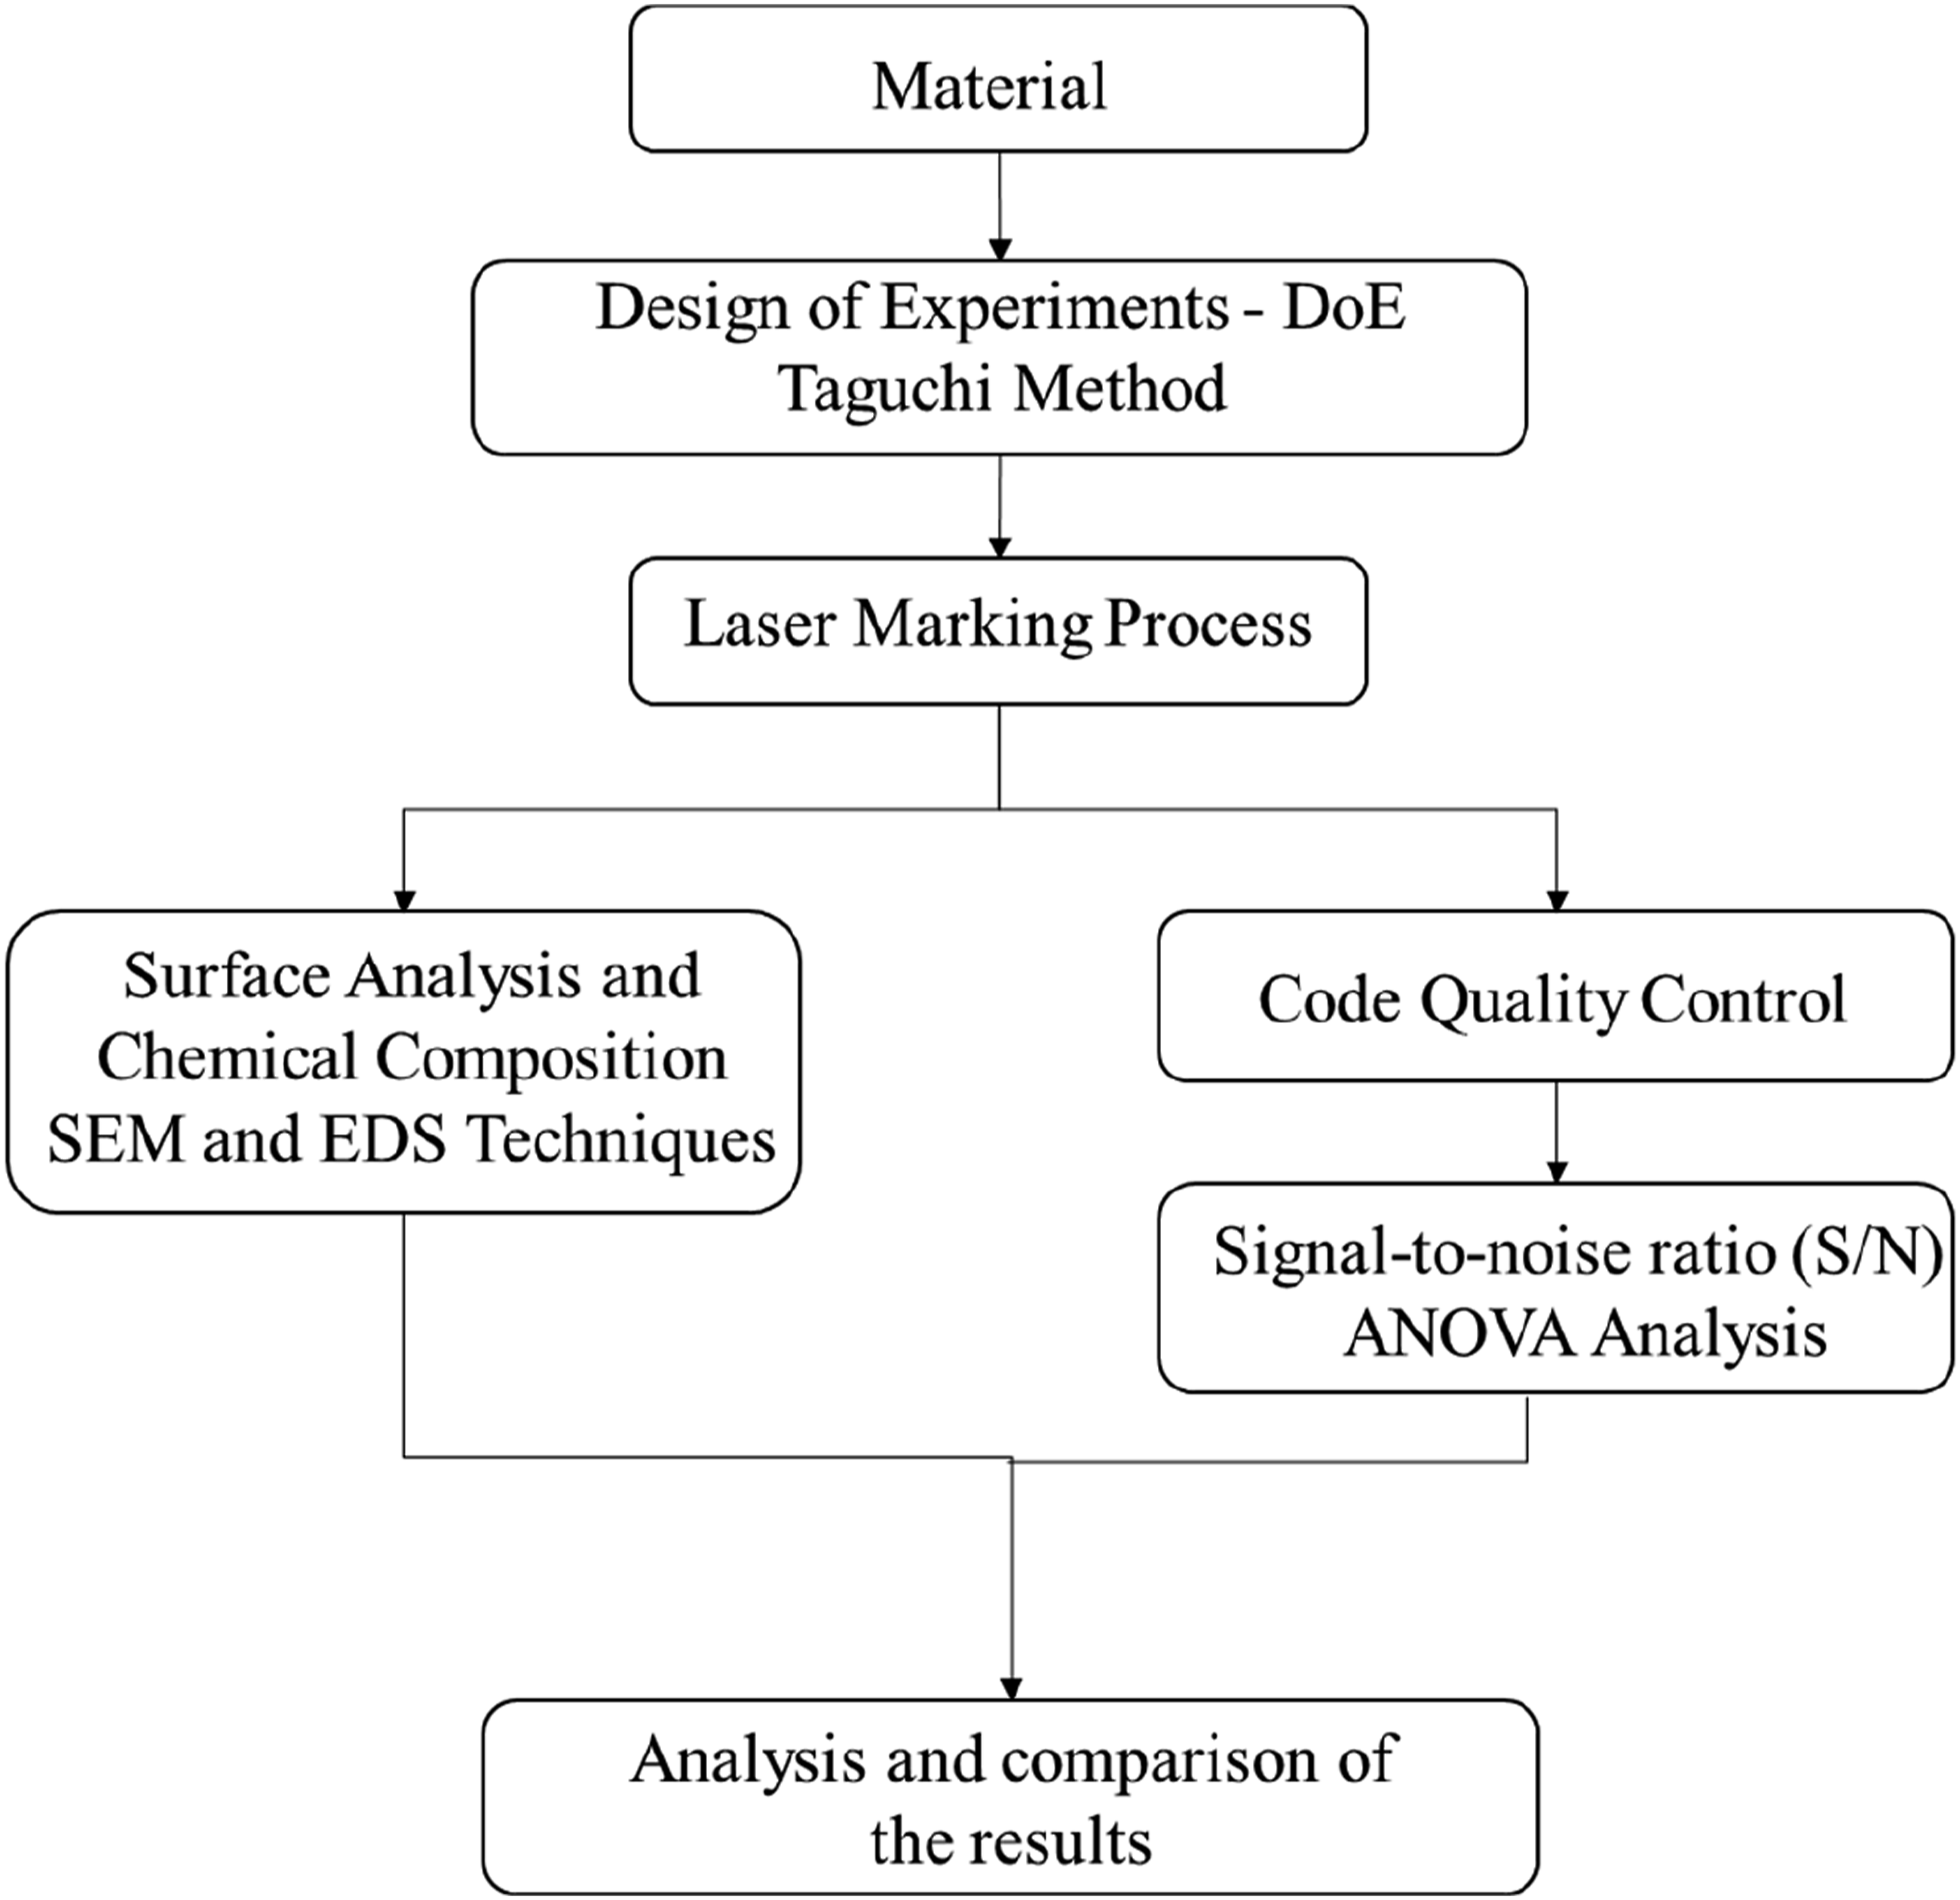
Materials
The target material was Ultradur® B 4406 G6, PBT-GF30 FR (17) (BASF),
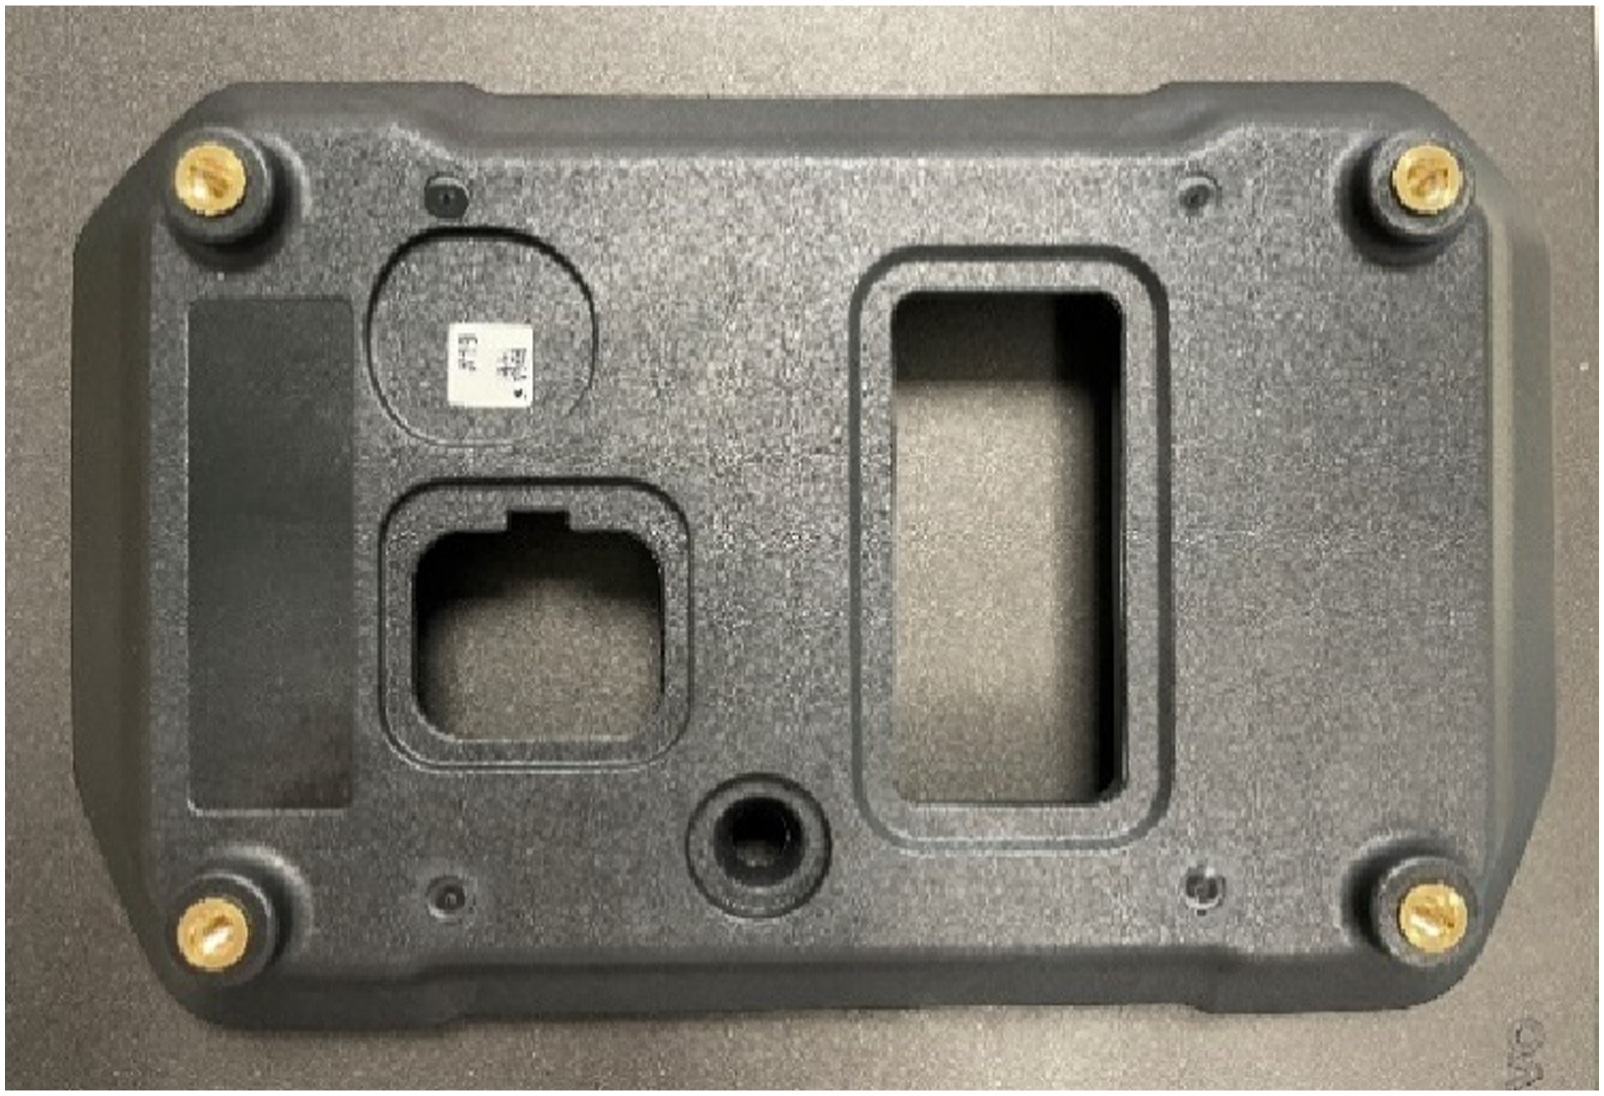
33
which is composed of 30% glass fiber (GF) and polybutylene terephthalate (PBT). This material was selected because it is challenging to laser mark for the following reasons: (i) it is not thought to be laser-markable, i.e., suitable for laser marking; (ii) it has unremovable superficial stains from the injection process; and (iii) it contains glass fibers, which reflect light when the marked content is read. Despite this, its mechanical and physical characteristics satisfy the requirements for mechanical resistance when used in an injection-molded motorbike instrument panel (Figure 2). Table 1 displays the material’s mechanical and physical attributes. Motorcycle instrument panel back housing. Physical and mechanical properties of Ultradur® B 4406 G6, PBT-GF30 FR (17).
33
Laser marking equipment
The samples were produced using a Rofin Coherent® laser marking apparatus equipped with Power Line F20 fiber optics. This diode laser has a power of 20 W and a wavelength of 1065 nm ± 5 nm, using ytterbium (Yb) as the source. Laser system specifications include pulsed operation, a working area of 120 × 120 [mm], a spot diameter of 20 μm, a pulse frequency (f) of 20 - 80 kHz, a scan speed (V) of 0 - 20,000 [mm/s], scan overlap (S) of 0 - 100%, pulse length (τ) of 4 - 200 ns and temperature range of 15 - 35°C. The laser marking parameters and central values specified by the manufacturer to be applied to Ultradur® B 4406 G6, PBT-GF30 FR (17) were: laser power of 17 W, pulse frequency of 25 Hz, scan speed of 2000 mm/s, and 15% overlap. 33
DoE and laser marking process
The experiments were designed using the DoE technique. This technique has become a useful method for obtaining highly reliable results in research, especially as it saves a lot of time and material costs.34,35 The target material was Ultradur® B 4406 G6, PBT-GF30 FR (17) was considered as the uncontrollable variable and the laser marking parameters as the controllable ones.
Laser marking parameters considered in the tests.
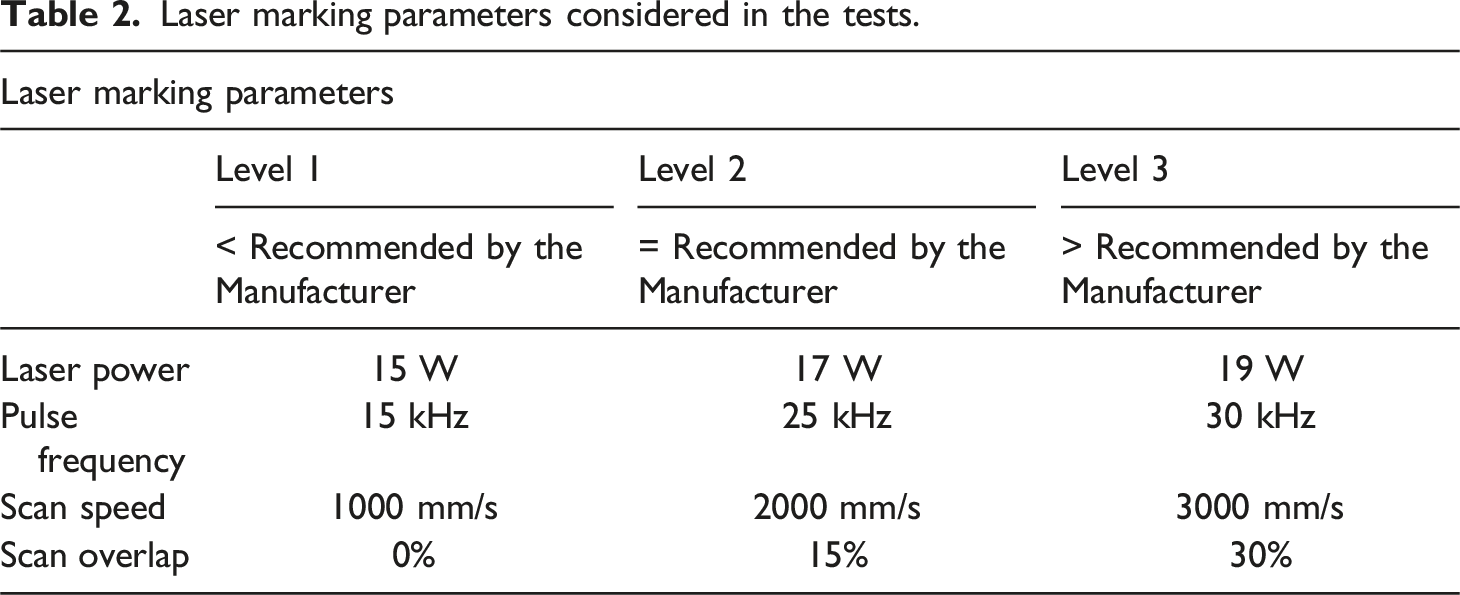
These parameters were chosen because they directly influence the percentage of overlap, which is an important factor in the quality of the marked code, as it has a significant effect on the roughness of the surface and the depth reached in the marking. Furthermore, the greater the overlap, the longer the laser interacts with the material and the greater the amount of energy absorbed by it, resulting in a more pronounced change in its appearance. 7
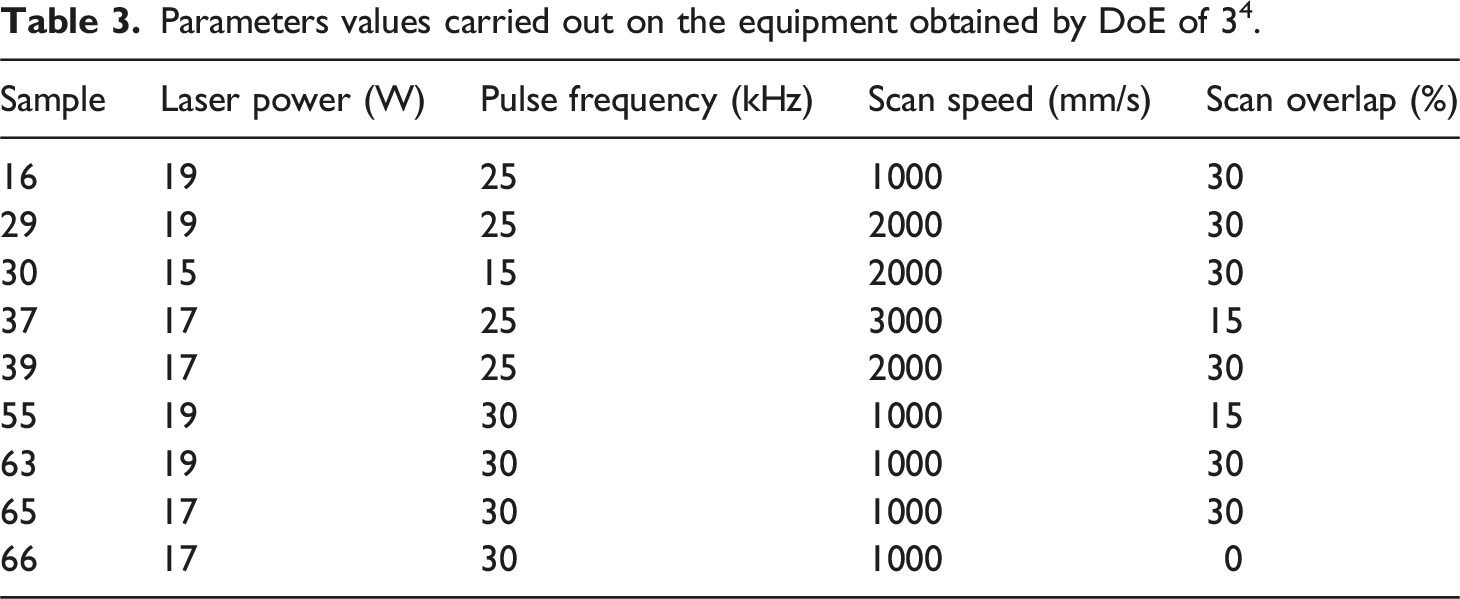
Parameters values carried out on the equipment obtained by DoE of 34.
Quality assurance of laser-marked codes
Once the station had been set up, the process of marking the samples according to the experimental plan began. Figure 3 shows the codes printed on the back of the panel. Each experiment corresponds to one sample and each sample contains three QR codes (QR1, QR2, QR3) and one DMC, all with the same marking parameters but in different positions on the polished surface. Motorcycle instrument panel back housing after laser marking.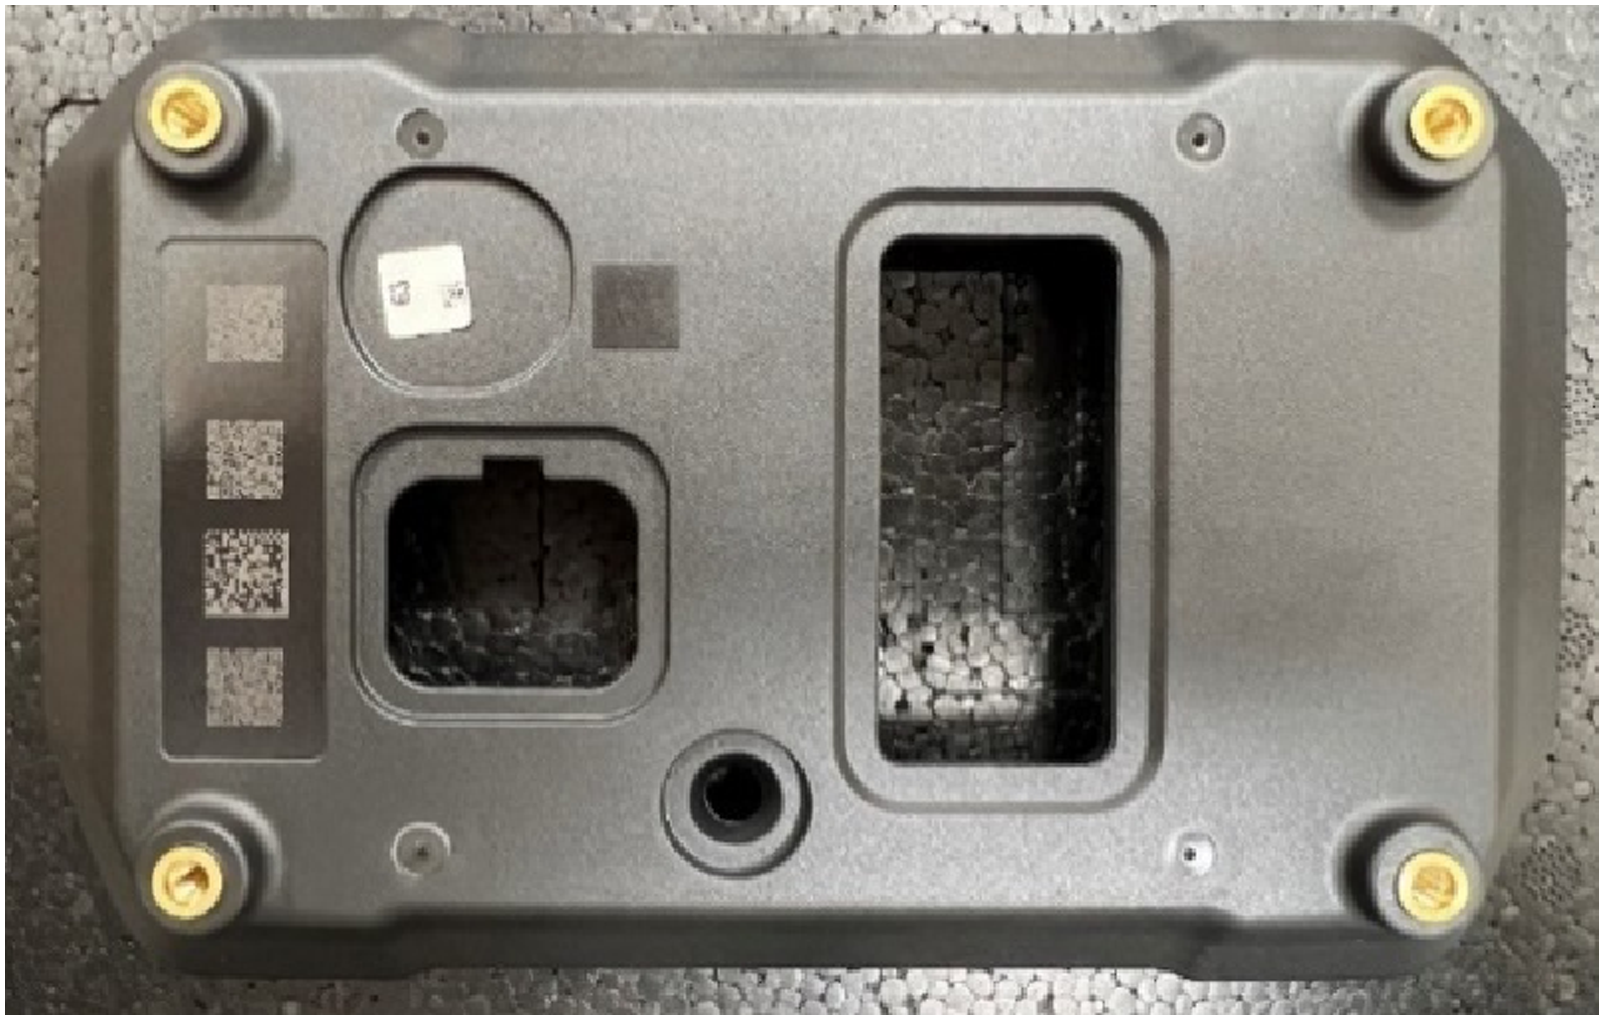
DMCs and QRs are examples of 2D codes whose structure consists of several elements (Figure 4), which allow the codes to be distinguished from each other and to distinguish a code from other elements on a surface.36,37 In laser marking, some elements tend to deviate.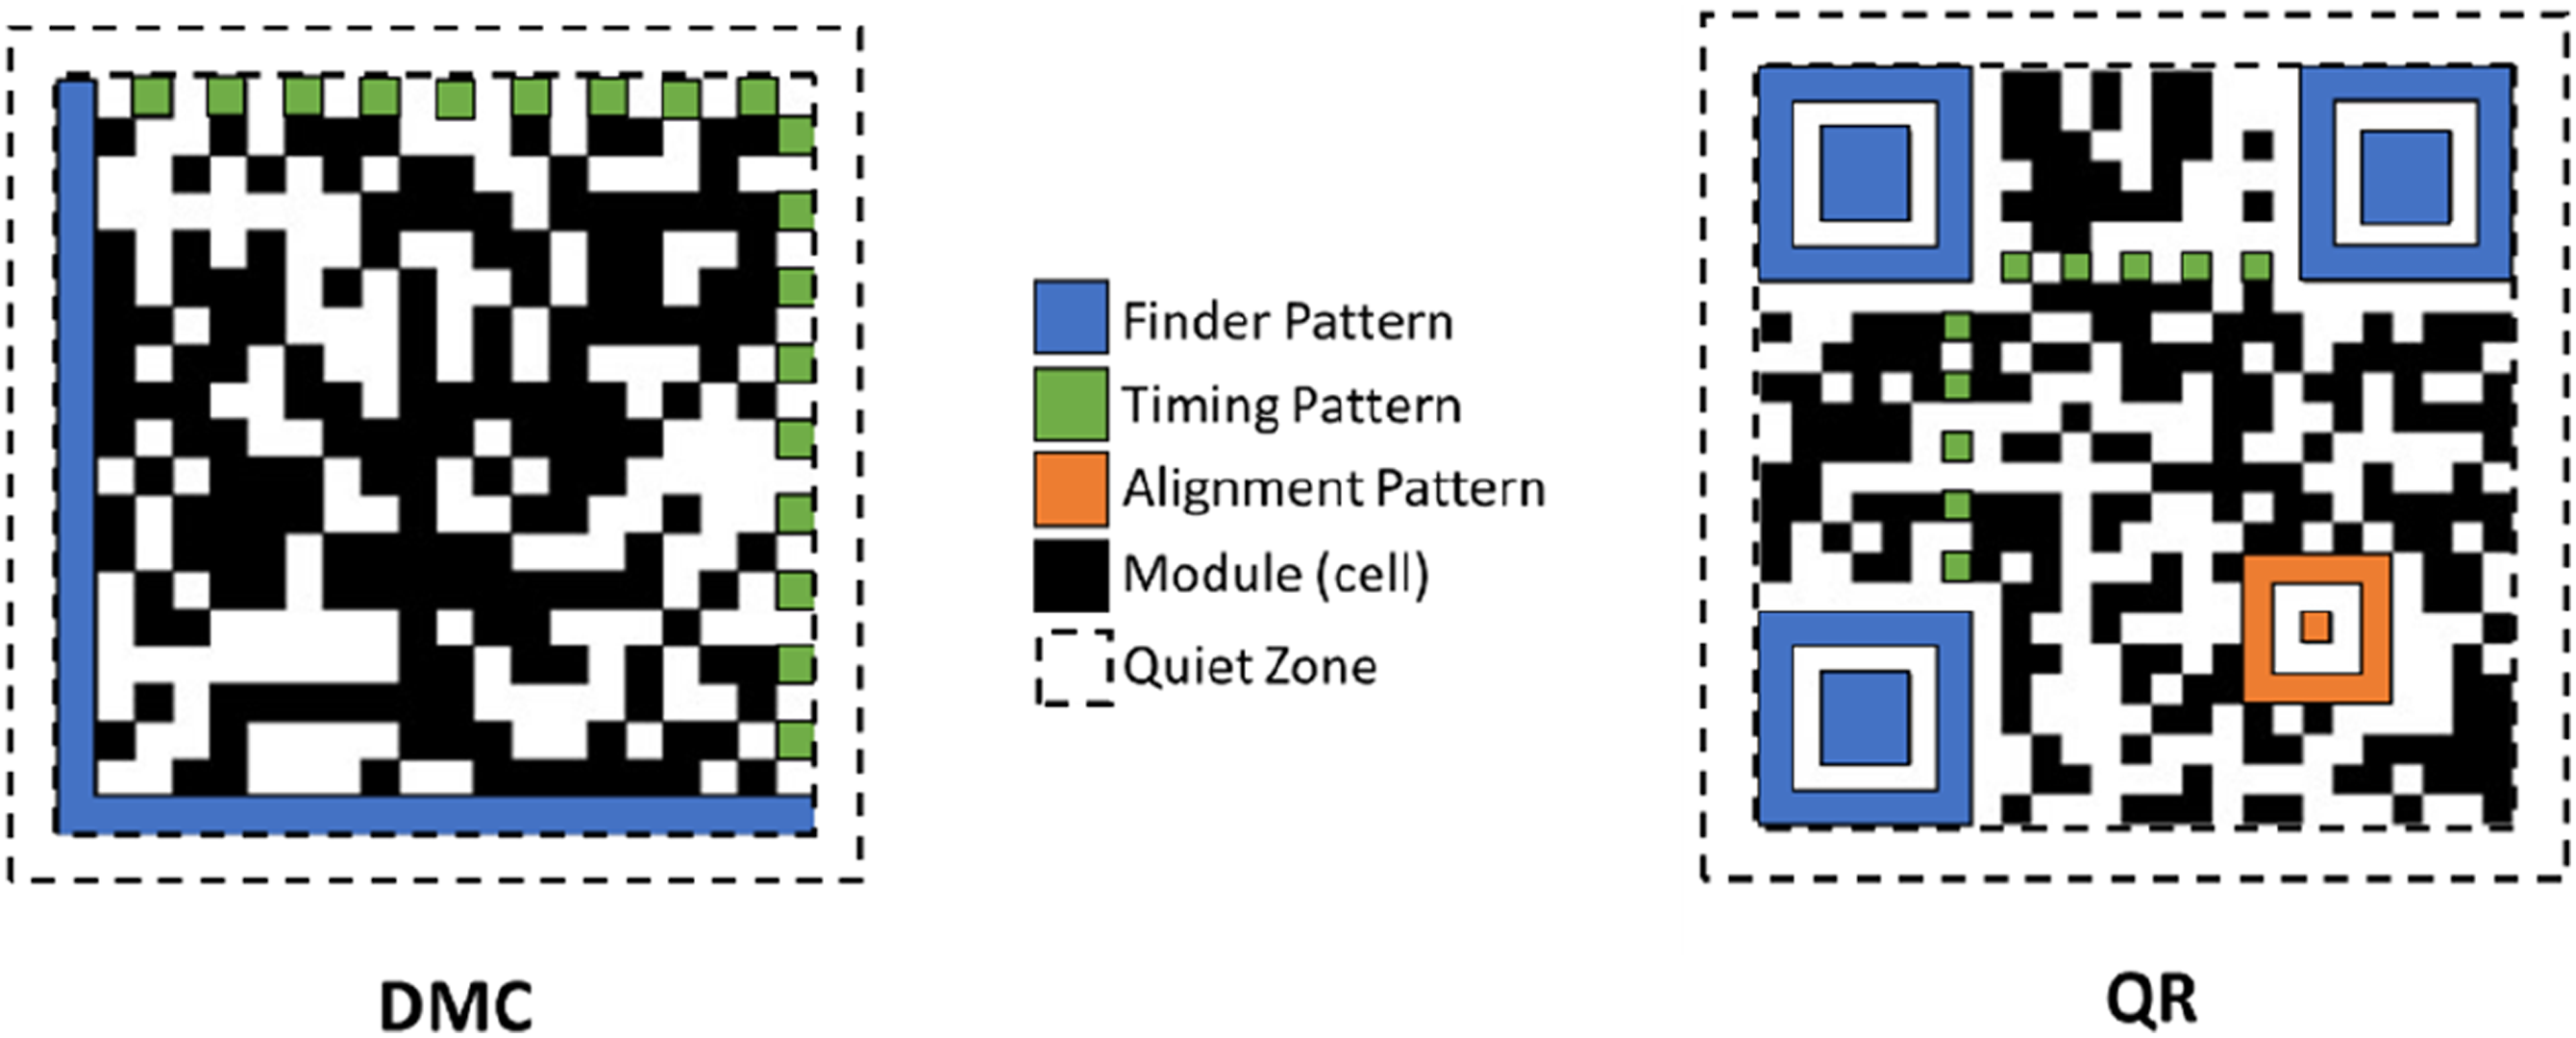
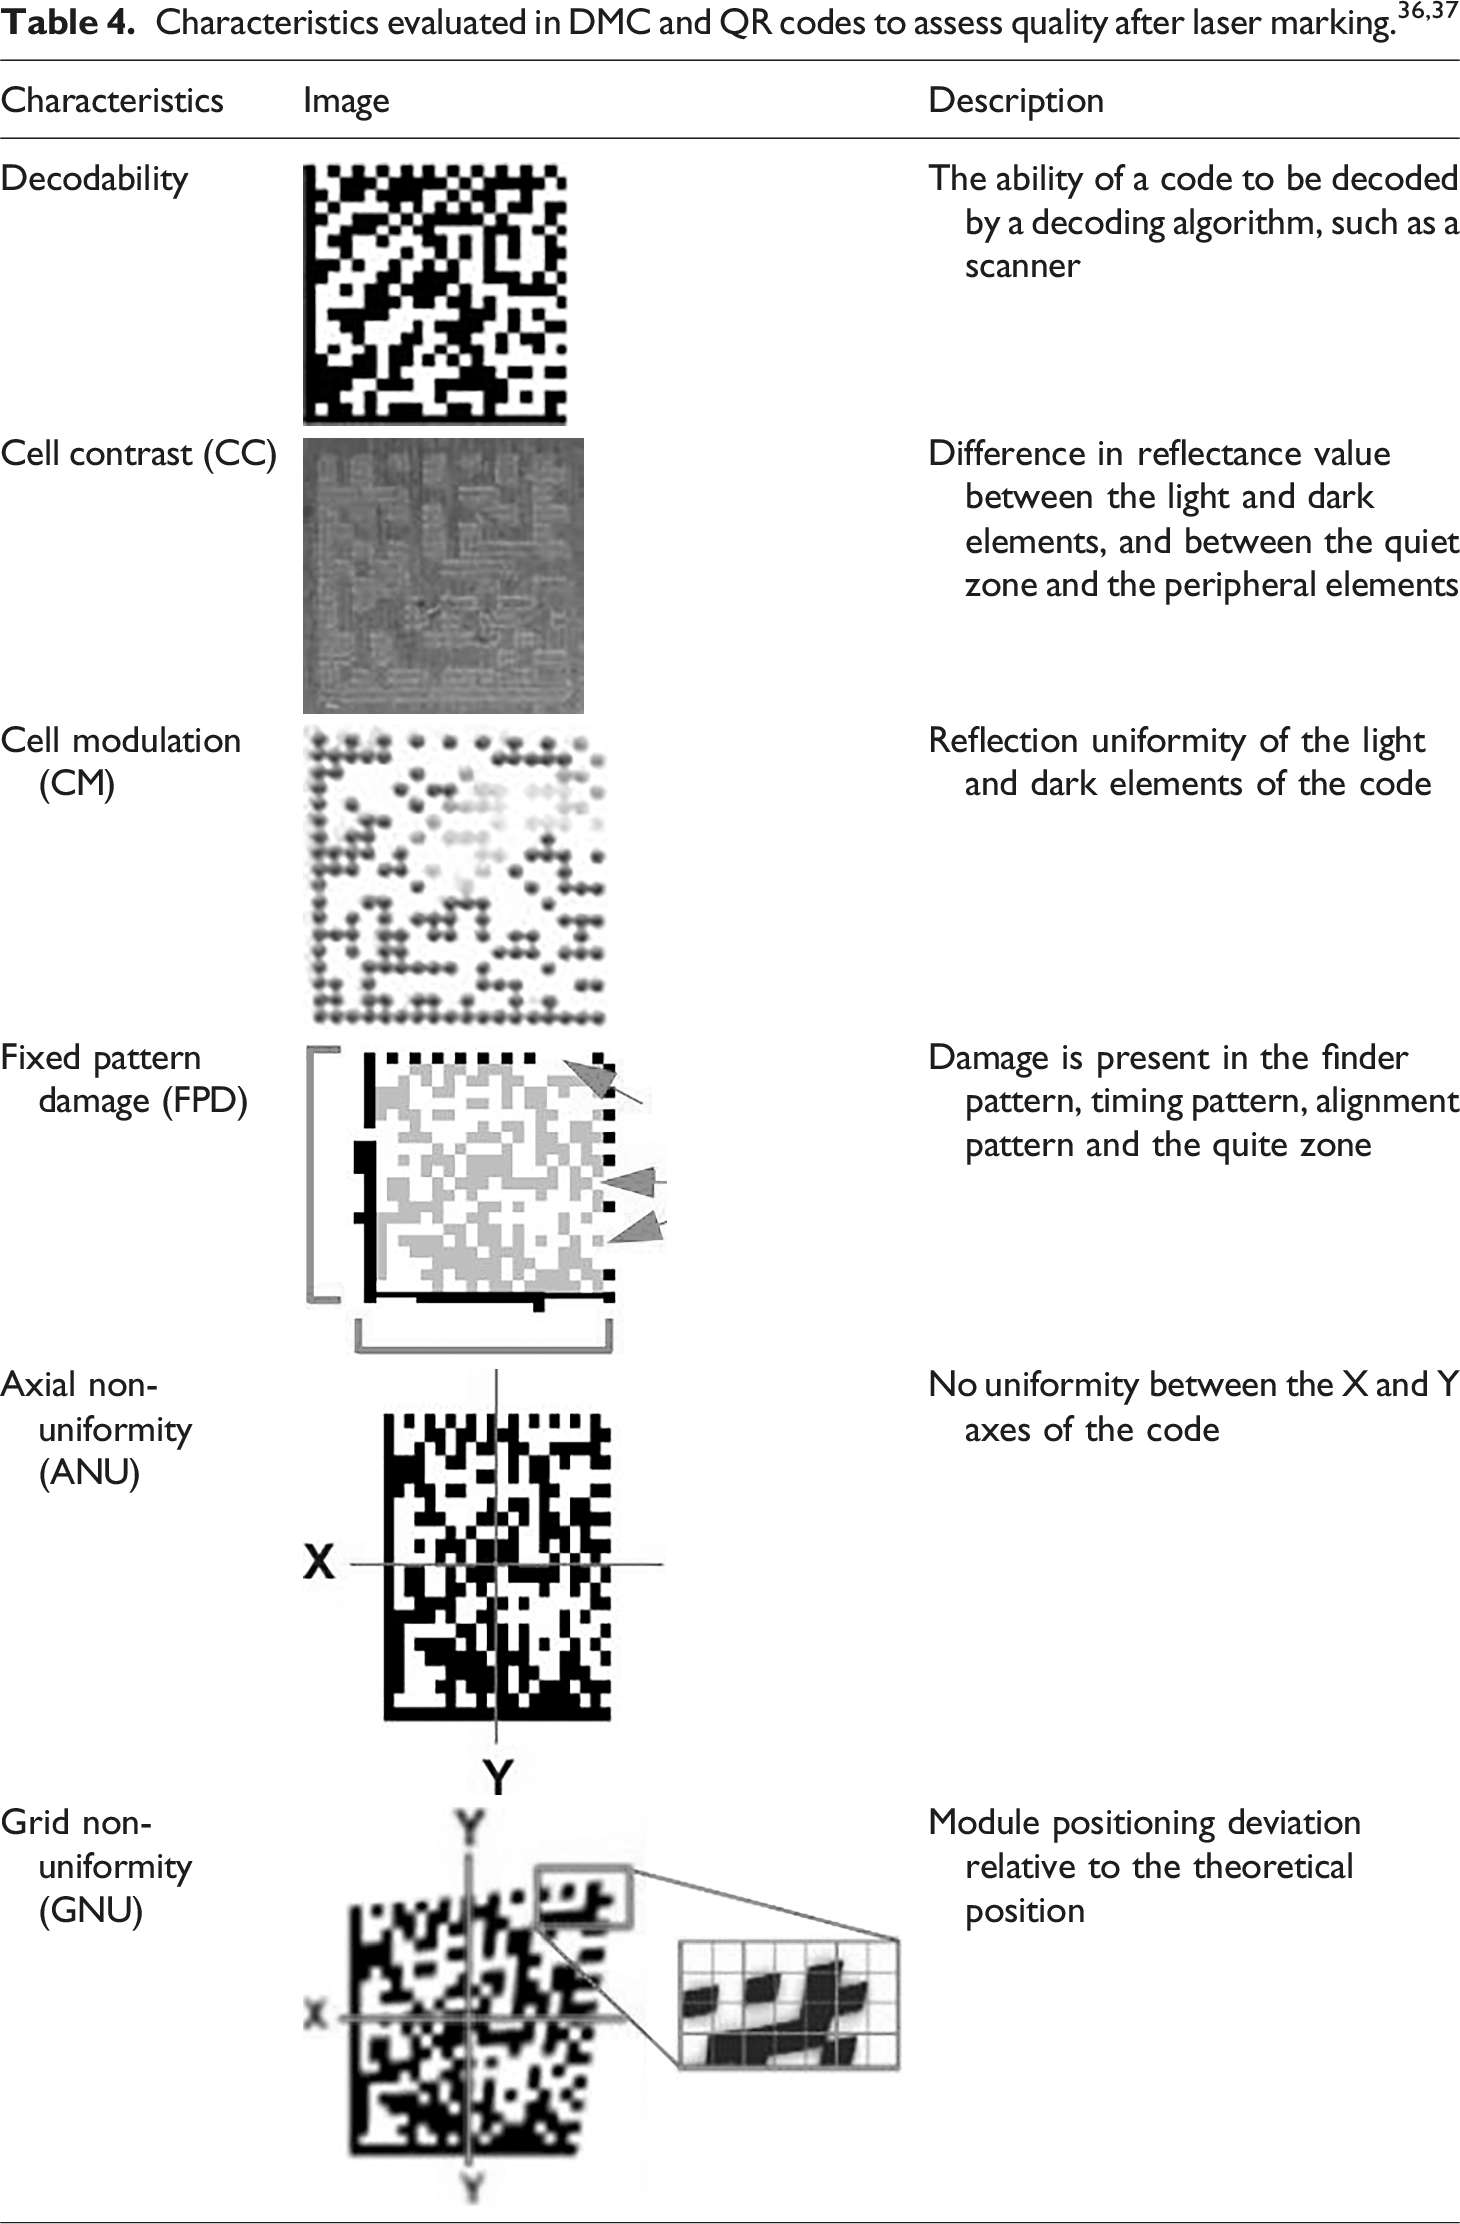
A REA® VeriCube Verifier was used to accurately classify the different characteristics of the codes. Each of the characteristics listed in Table 4 was assigned a class, which could be A (4.0), B (3.0), C (2.0), D (1.0) or F (0.0), according to the criteria of ISO/IEC 29158:2020 , 39 where “A” is the best and “F” is the worst. Intermediate levels are taken into account accordingly. The overall quality class assigned to the code corresponds to the minimum classification of all these evaluated characteristics. Once all the codes had been analyzed using the Verifier, the results were exported to Excel® and processed and correlated using Minitab® software.
Sample surface analyses by SEM
The S/N ratio was used to identify which of the parameters, shown in Table 4, can improve the code quality through its characteristics and minimize the noise effect on the response. Using the Taguchi method’s robust design idea, the S/N ratio is utilized to reduce noise and preserve product resilience. The ratio of the input signal magnitudes to the noise-affected signal is known as the S/N ratio. As a result, the value that optimizes each controlled factor’s S/N ratio becomes noise-resistant. Because the object’s function determines how the S/N relationship is defined, the function itself becomes a unique factor.
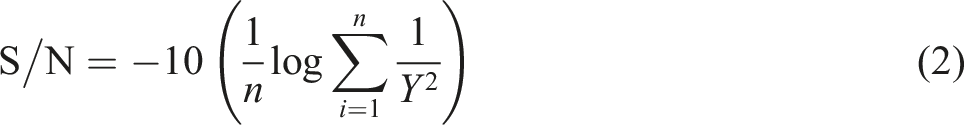
Once all the codes had been analyzed, the results were exported to Excel® and the S/N ratio for each combination of control factor levels in the experiment was processed and correlated using Minitab®. Two S/N ratios were used for the experiments: smaller-is-better (equation (1)) and larger-is-better (equation (2)).7,40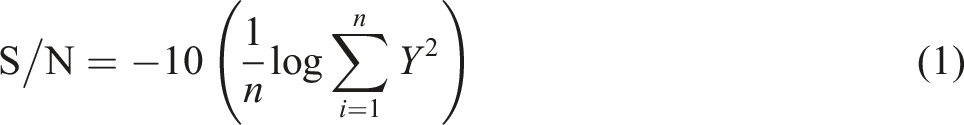
The ANOVA tool was used to indicate the percentage contribution of each parameter through the p-value or probability of significance. This analysis made it possible to determine the importance of each parameter for the results of the different DMC and QR characteristics and to check their dispersion.
Sample surface analyses by SEM
After the laser marking process, the samples were cut on the polished surface using a milling cutter coupled to an OPTIMUM® - model OPTI drill DX 15V bench-top drilling and milling machine.
For surface analysis by SEM, the samples were coated with a thin gold film to improve electrical conduction on the surface of the samples. The surface aspects were analyzed by SEM technique using a HITACHI® SEM - model FlexSEM 1000. Images were obtained using secondary electrons with an acceleration energy between 10 keV and a working distance of 10.6 mm. A Bruker® Quantax 80 EDS was used to chemically analyze a sample in an area with and without laser marking.
Results and discussions
Quality analysis of codes after printing
Figure 5 shows the polished area of the back housing where the laser marking process was carried out. Due to the injection molding process used to produce the backplane, the presence of defects in the polished area surface is inherent to the process used and usually occurs in the same locations and cannot be removed by mechanical or chemical surface treatments. These defects can reduce the quality of the code during the laser marking process. In a magnified image, the injection defects can be divided into four regions, with and without defects. In Figure 5, regions 1 and 4 show dark spots in the corner near the injection points. These defects are caused by the way the cavity is filled by the jet stream, known as secondary flow in the corners of the cavity. The melt flows from the narrow gate into the wide cavity as the pressure increases with injection time; the waves disappear but are still visible in the corners of the part.
37
Region 2 is therefore the most suitable position for marking the DMC as no defects are visible at this magnification. Region 3 shows a defect known as a weld mark, represented by a dark line. This line is formed by the confluence of two separate polymer melt flow fronts with relatively low front temperatures.
38
Polished surface area where the DMC and QR were marked during production. The enlarged image of the red circles shows the presence of injection marks on the polished surface. Region 1: Secondary flow marks. Region 2: No defects, Region 3: Weld marks, and Region 4: Secondary flow marks.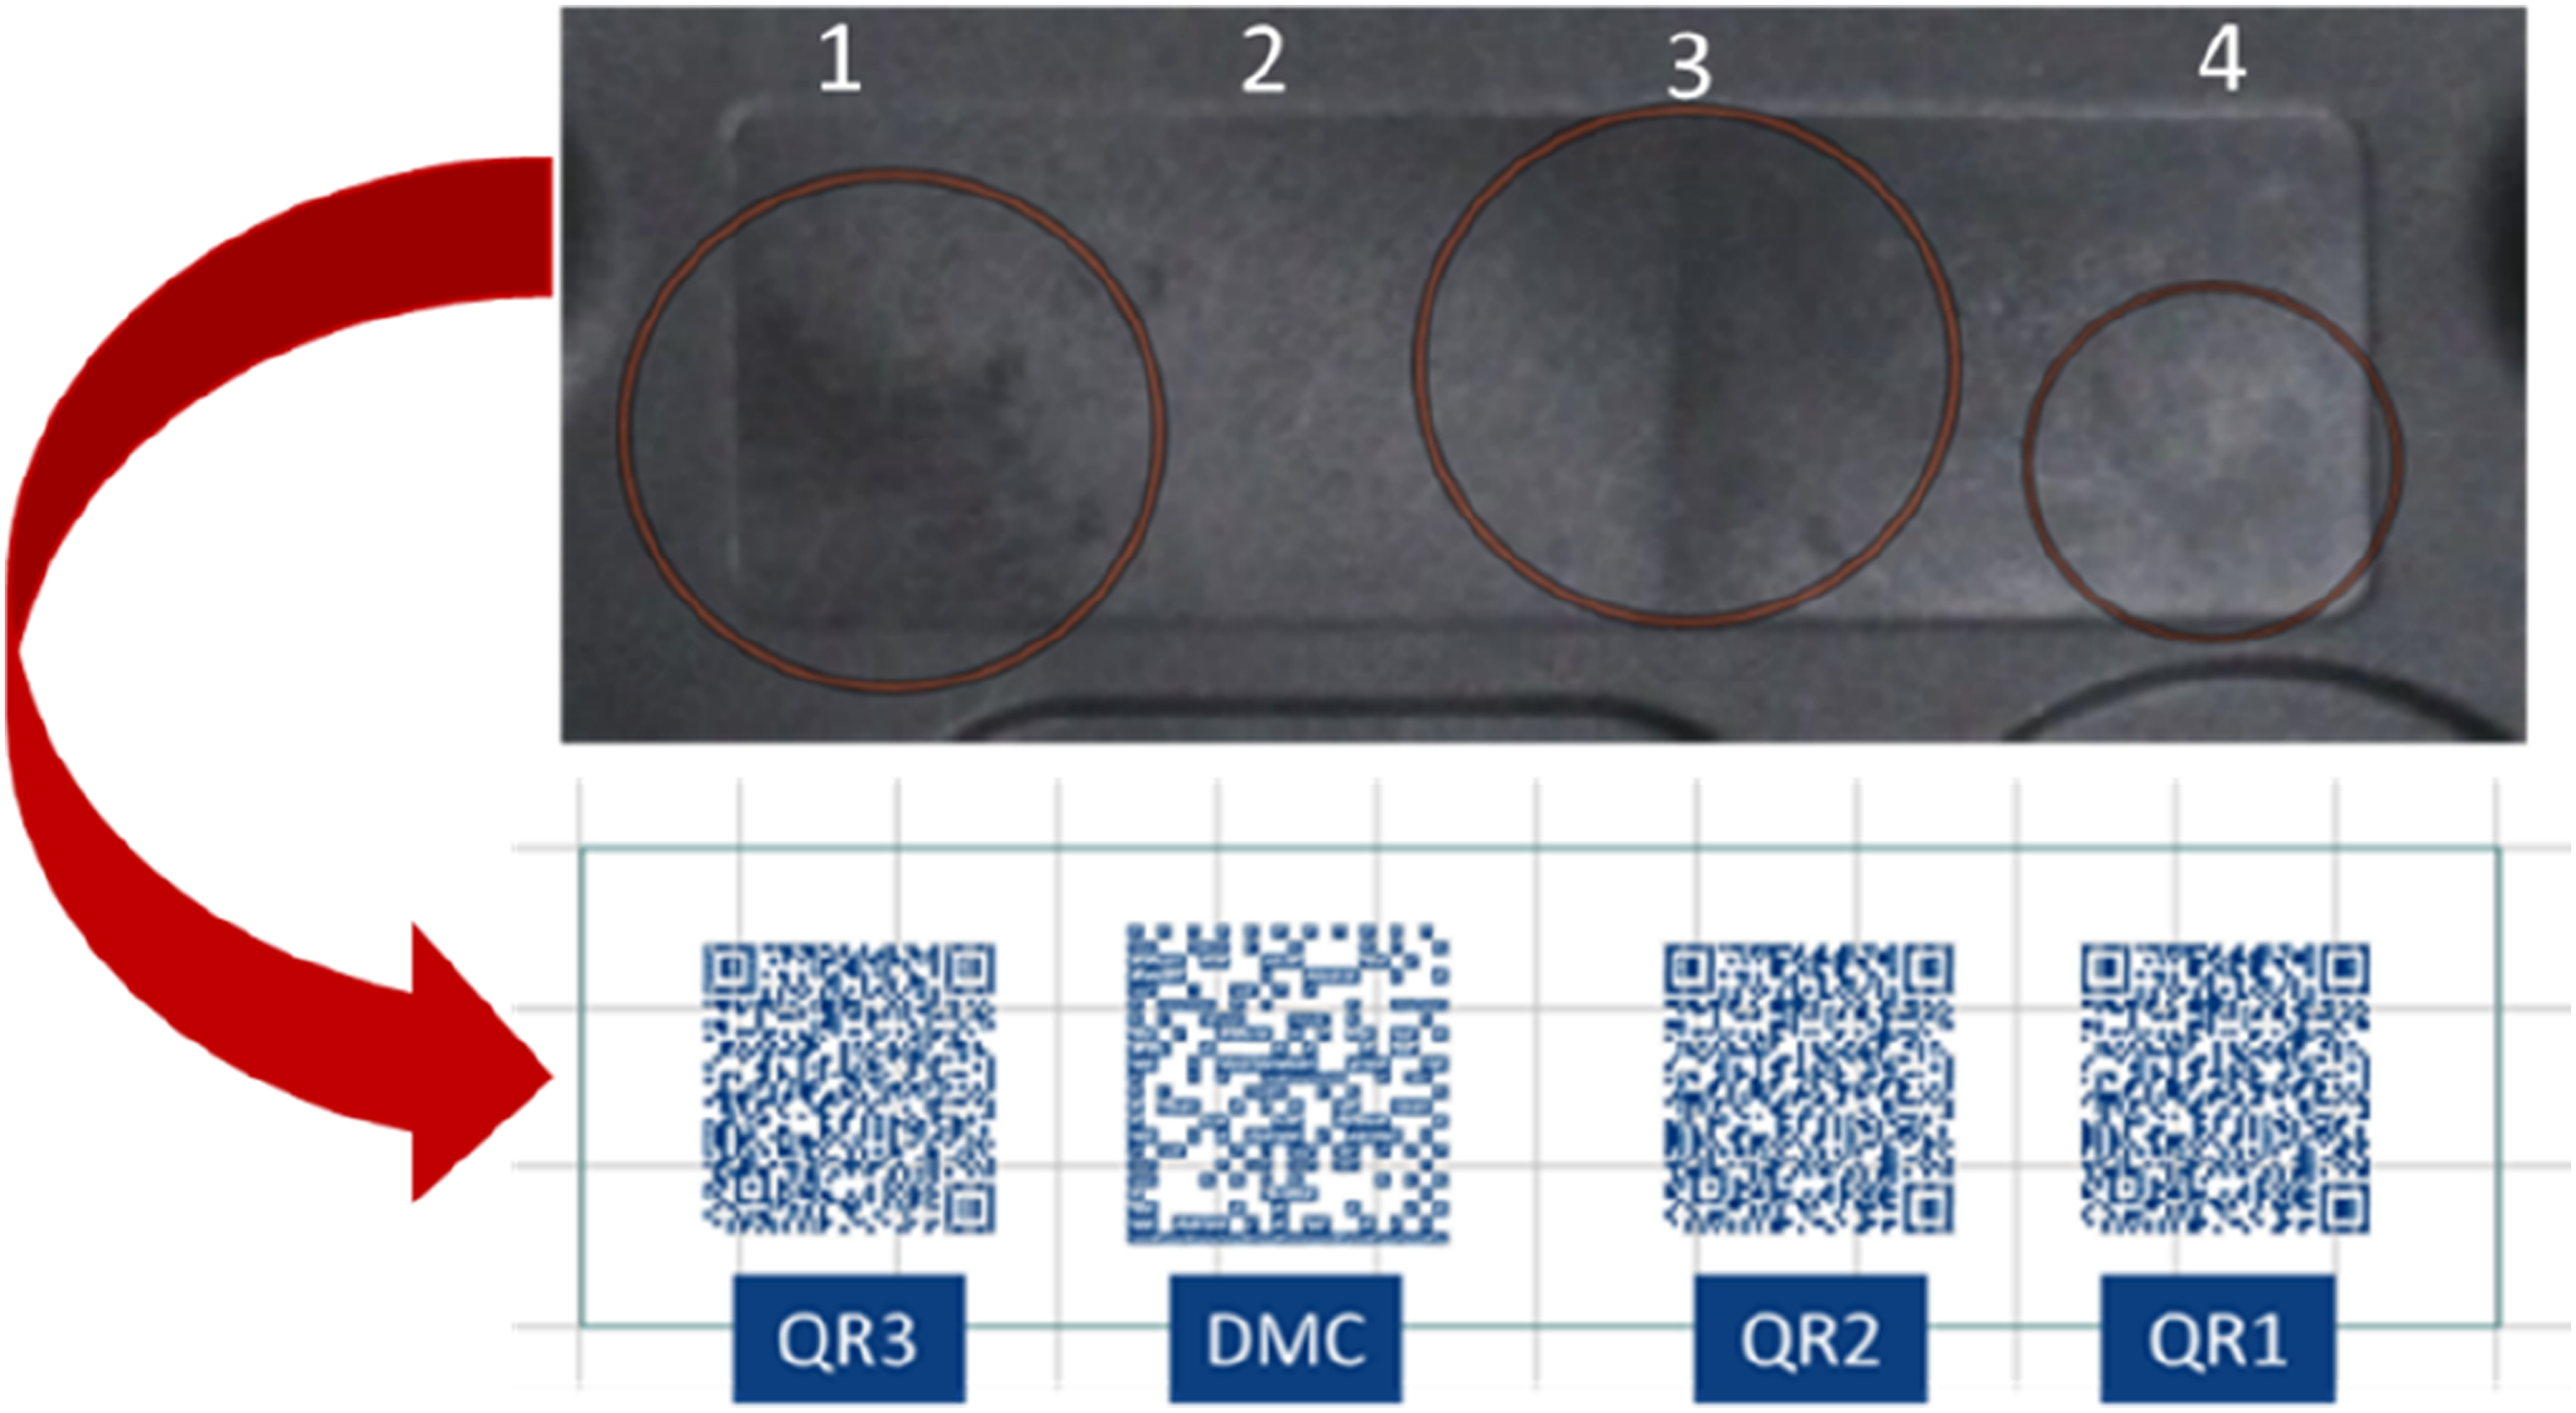
Therefore, the codes were positioned in different zones of the polished area and evaluated by the influence of the presence of defects on the surface. Three QR codes (QR1, QR2, QR3) and one DMC were considered. The QR codes were printed on defect regions 1, 3, and 4 (surrounded by a red circle in Figure 5) since the QR has a higher information density, which translates into a greater complexity of the process. The DMC code was printed on Region 2, without defect, as it is a simple code with low storage capacity36,41 and the defects present on the sample surface could affect the readability of the DMC.
Samples’ optical image quality after laser marking.
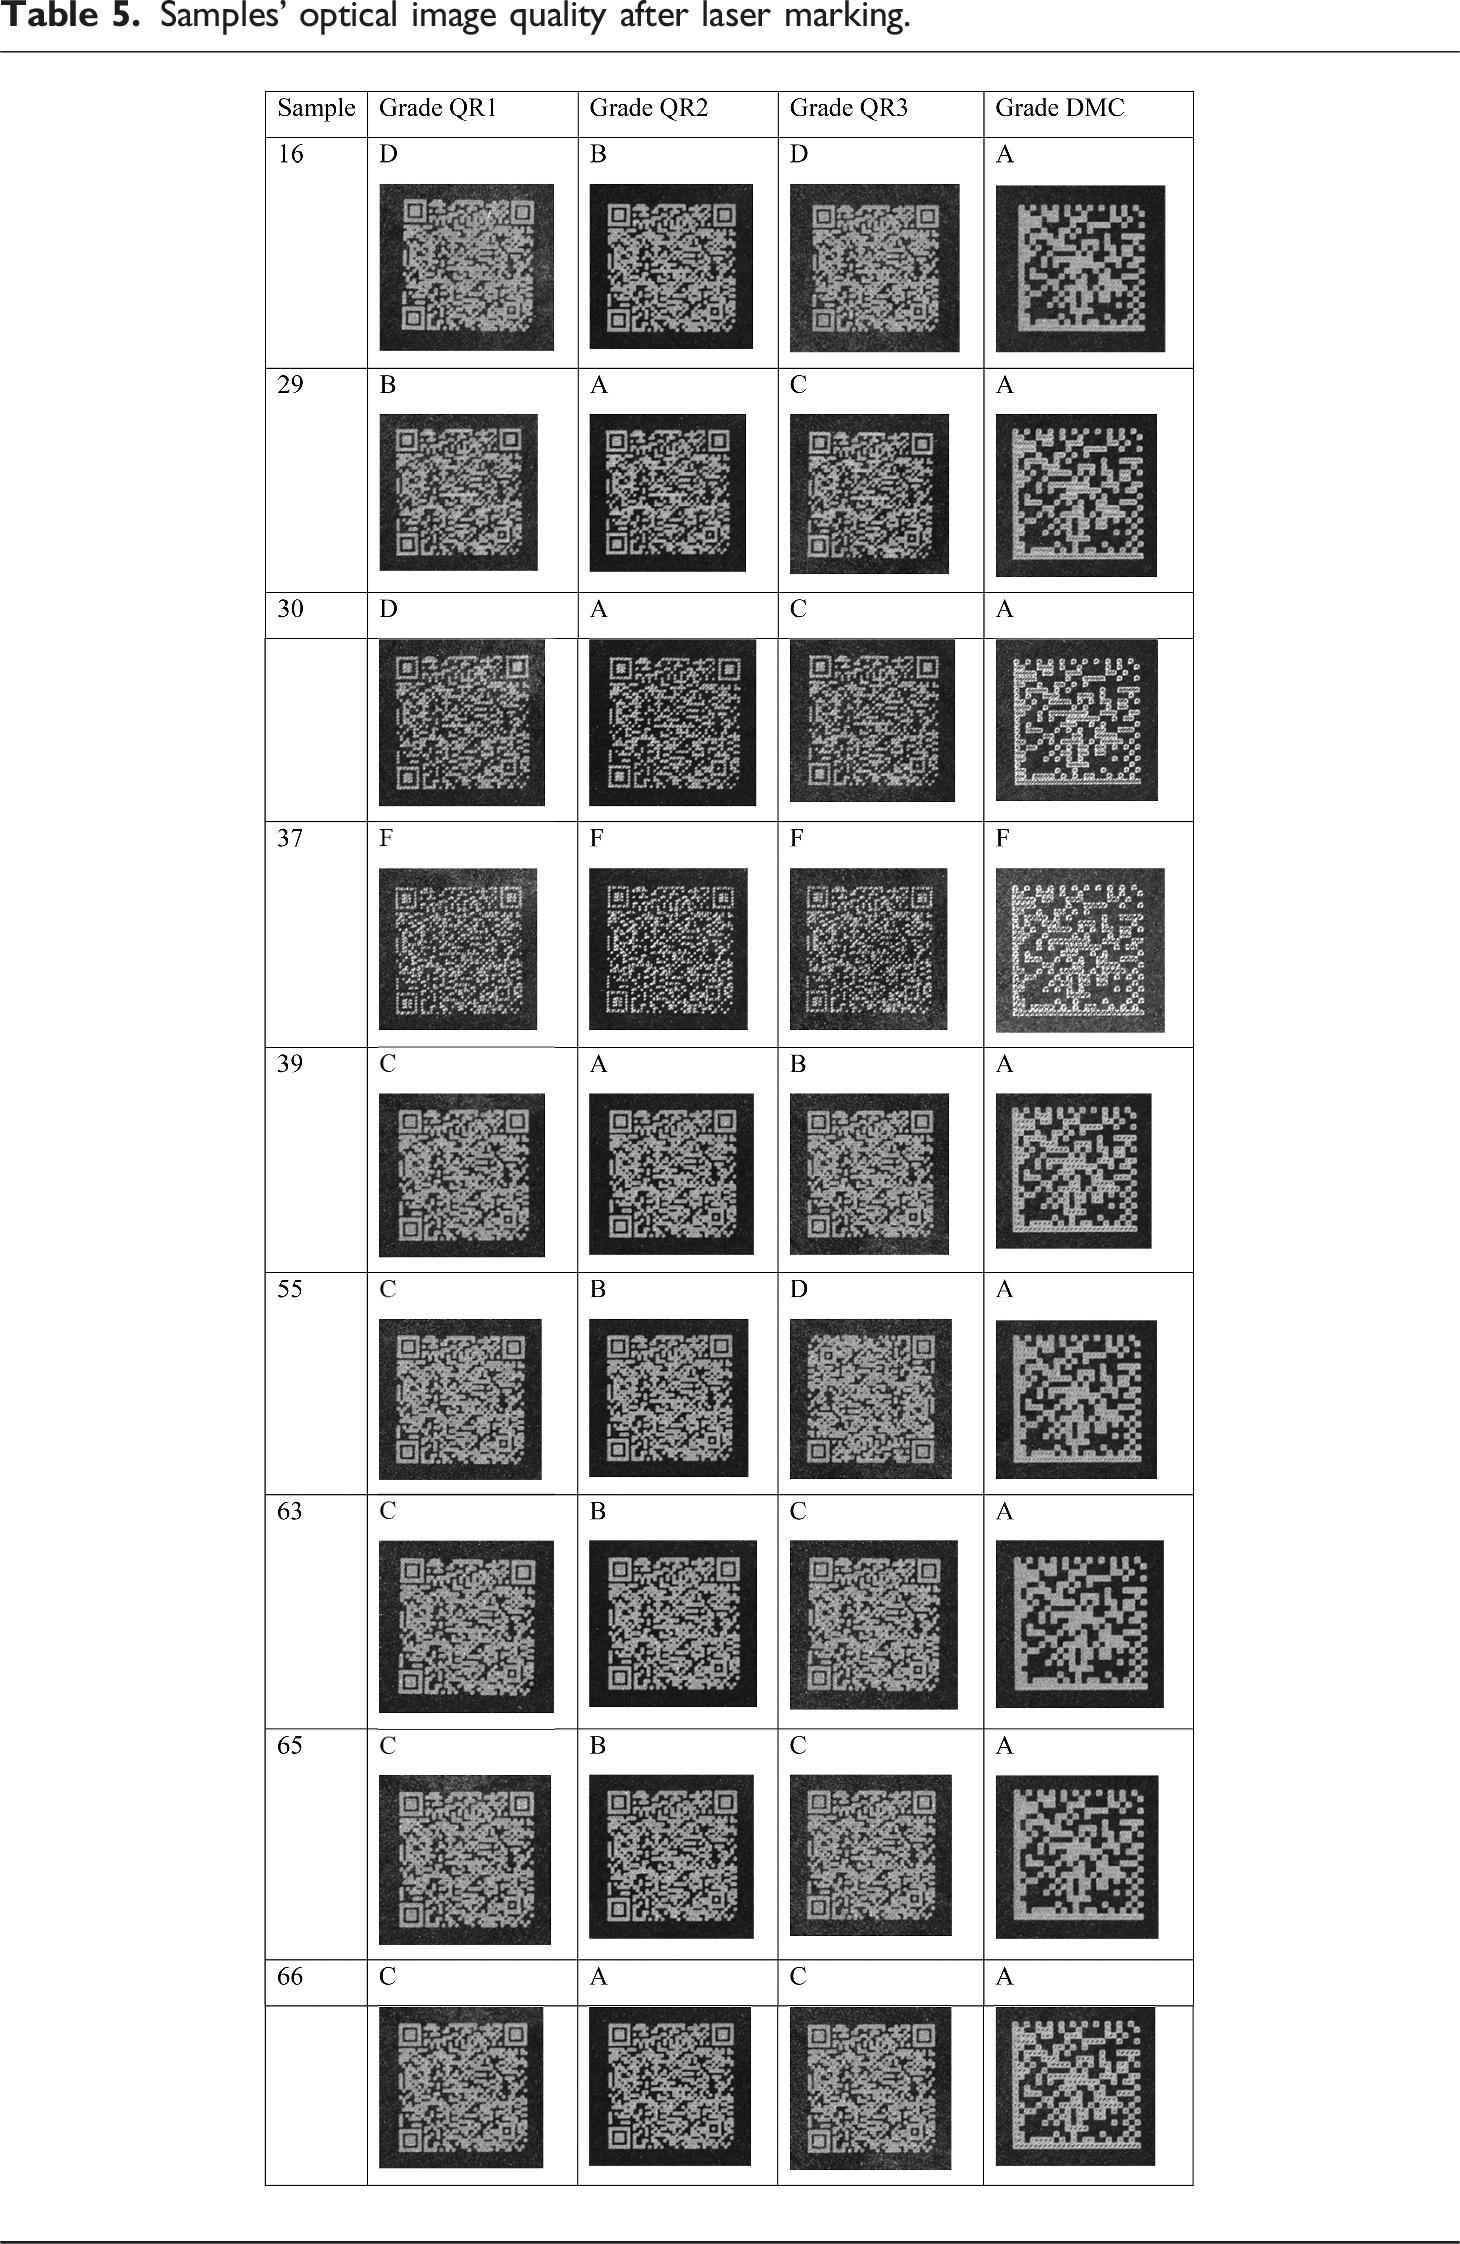
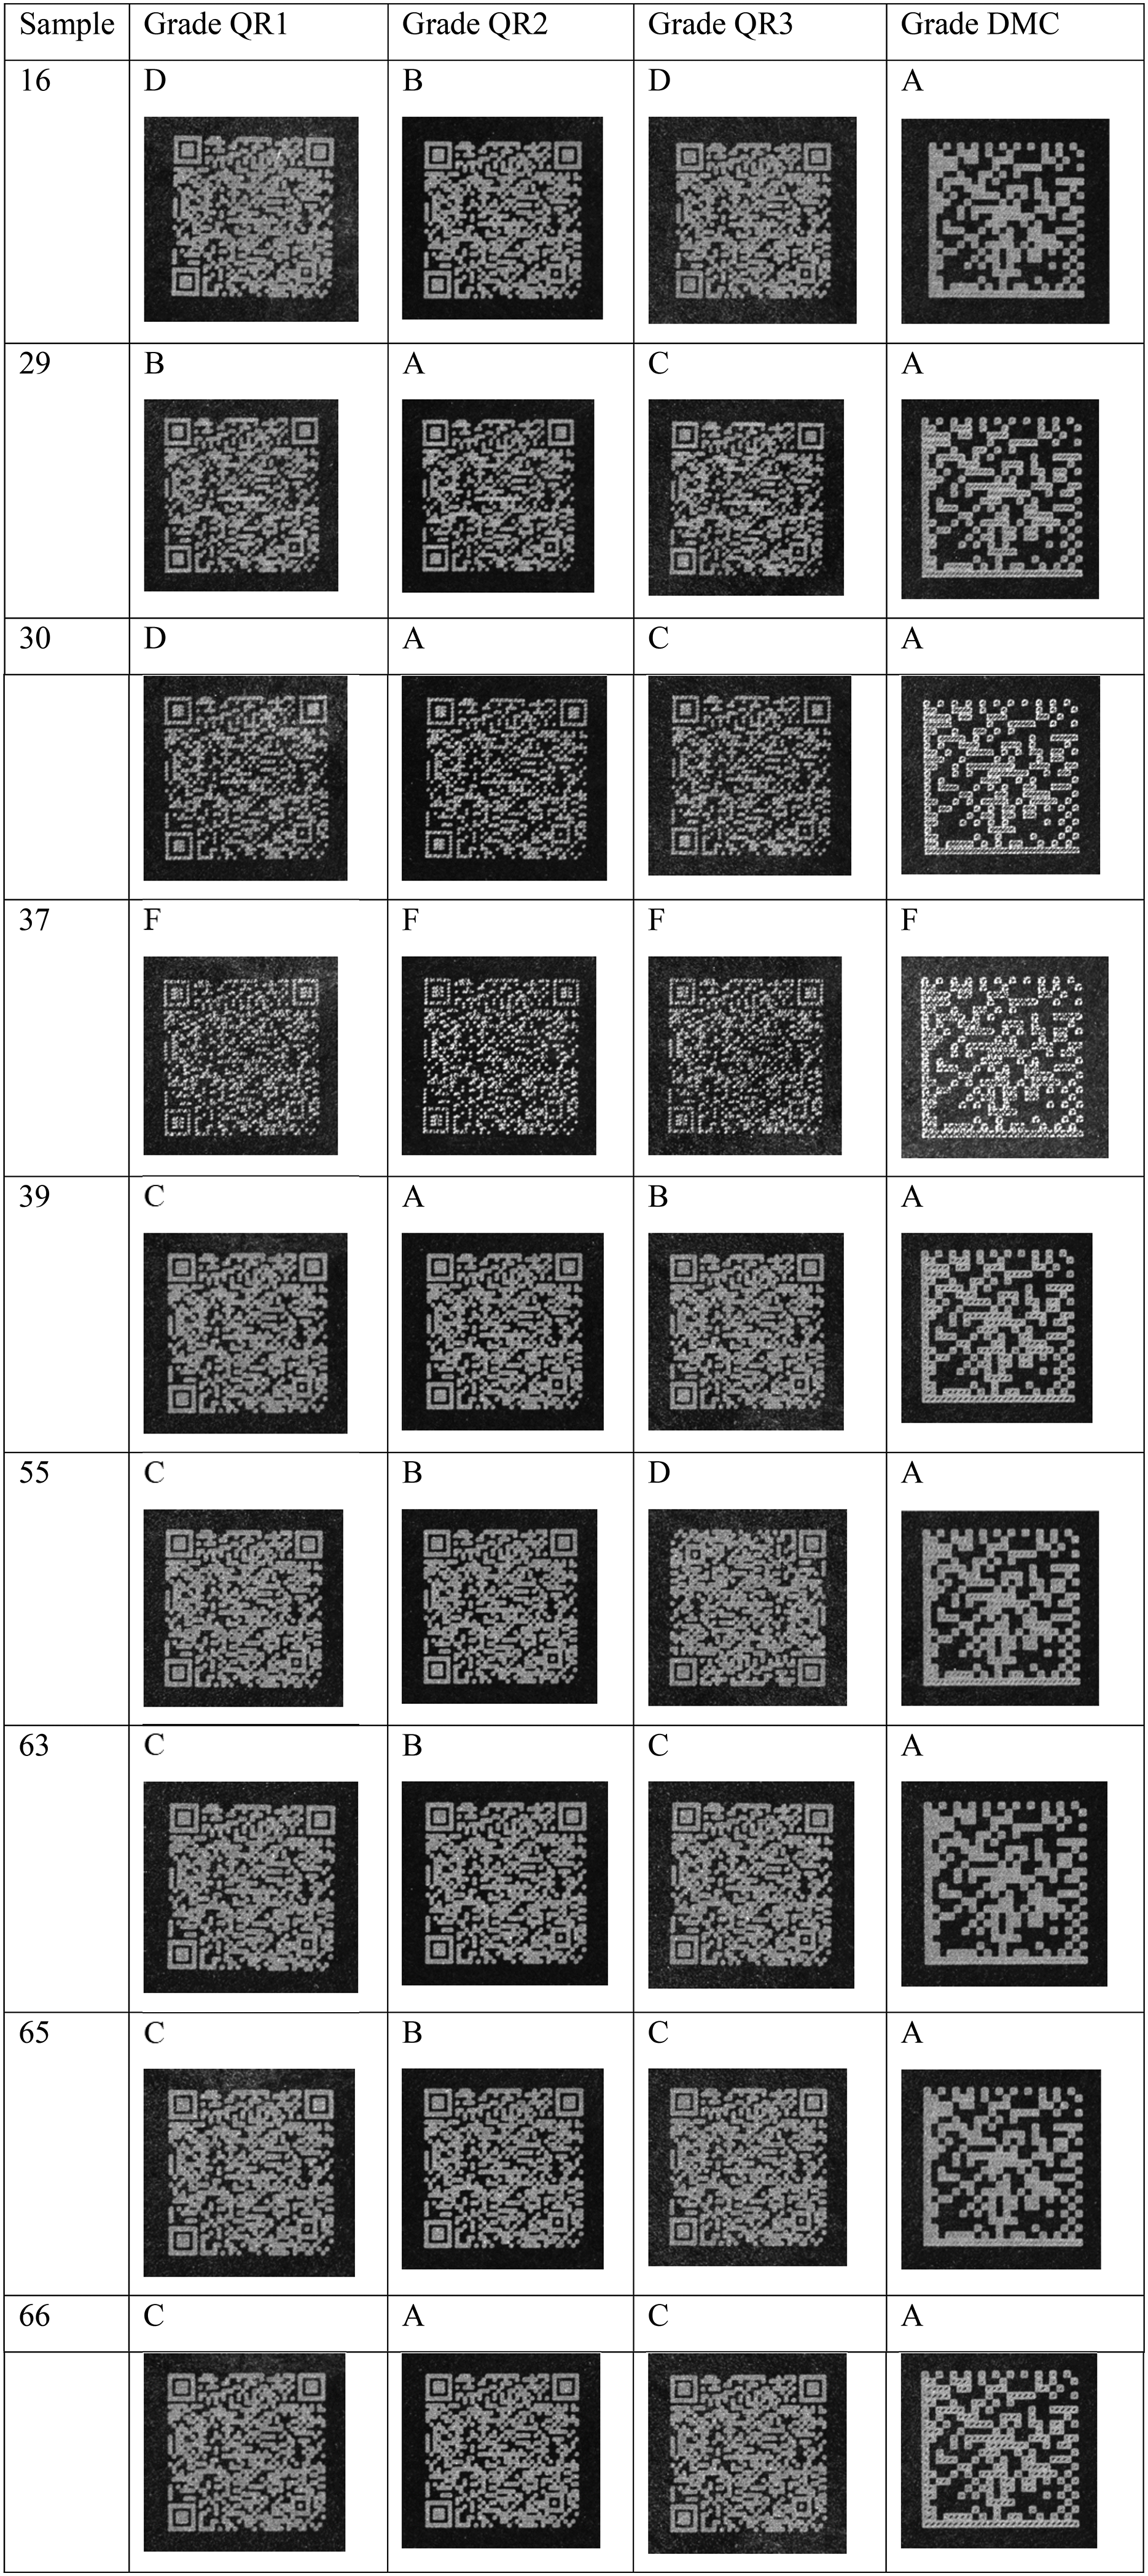
The overall quality class assigned to a code corresponds to the minimum of all the features evaluated according to the parameters shown in Table 4. A sample of 63 codes (in Table 5) was obtained using the laser marking parameters: laser power: 19 W, pulse frequency: 30 kHz, scan speed: 1000 mm/s, and scan overlap: 30%. It represents a DMC of quality A (4.0) in all its characteristics and therefore its global quality class is A (4.0).
On the contrary, the codes on sample 37 (Table 5) were obtained with the laser marking parameters: laser power: 17 W, pulse frequency: 25 kHz, scan speed: 3000 mm/s, and scan overlap: 15%. It represents a DMC with a global quality classification of F (0.0), as it has a reflectance value of 4% against a minimum requirement of 5% and is therefore rated F (0.0) for this characteristic. Although Cell Modulation (CM) is rated 2.0 (C), Fixed Pattern Damage (FPD) is rated 3.0 (B), and the remaining features are rated 4.0 (A), the overall quality score for this code is F (0.0) because it is limited to the lowest score of all the features rated.
The difference between the two results is due to the choice of laser marking parameters. The marking of sample 63 was obtained using values for laser power, pulse frequency, and scan overlap that were higher than the nominal values specified by the manufacturer. Only the scan speed was lower than the nominal value recommended by the manufacturer. At lower speeds, as in the case of sample 63, the laser interacts with the material for longer and modifies its aspect better. At higher speeds, as in the case of sample 37, the material is exposed for less time and changes less, producing a lower-quality code. The local temperature value approaches 223°C, once the PBT is melted in contact with the laser so that its surface changes and the code is marked. The duration of the laser in this process varies from 9 ns (at lower speed) to 3 ns (at higher speed). The temperature rises during the laser marking process to the glass transition temperature for amorphous polymers and the crystallite melting temperature for semi-crystalline polymers due to the thermal energy supplied by the laser. Stress-associated dislocations and surface topographical alterations are caused by the melted polymer matrix and increased molecular relaxation.42,43
For all the samples presented in this work, the QR code in position 3 (grade QR2) has been classified in the global quality class A (4.0) or B (3.0), which is considered a good quality class for codes obtained by laser marking in a polymer substrate. On the other hand, the quality of the QR code in position 1 (grade QR1) and the QR code in position 4 (grade QR3) (Table 5) has the worst global quality class C (2.0) or D (1.0) due to the position where the laser marking was performed. The QR codes were printed over the surface marks left by the injection molding process, which cannot be removed by mechanical abrasion as this could further damage the surface. All marked codes (QR1, QR2, QR3, and DMC) could be decoded, even those evaluated at F quality, giving a positive decodability result for all DMCs and QRs.
Based on the results obtained, the average contrast percentage of the QRs at each marked position in the polished area was determined. The results show that the presence of defects on the surface degrades the quality of the codes by reducing the contrast. Positions 1 (QR1) and 4 (QR3) are more susceptible to the presence of defects, with the average contrast of the codes at these positions being 68.4% and 66.6% respectively. In position 3 (QR2), the contrast obtained is higher because there are no defects in this area, with an average contrast of 76.9%.
Statistical analysis of the DMC and QR
The application of the full factorial DoE in the tests carried out using Minitab® software allows graphical and numerical analyses to be carried out on the best set of laser marking parameters with the results of the quality analysis carried out using the Code Verifier.
The first characteristic analyzed using the S/N ratio analysis was the quality of the DMC and QR codes. As explored in Section 3.1, code quality is an important factor in ensuring that the code is easily readable, i.e., that the marking of the code has sufficient surface roughness and contrast for the code to be easily decoded by a decoding algorithm such as a scanner.36–39
Figure 6 a is a main effect plot showing the parameters that produce the best DMC quality results. In descending order of importance, the parameters are scan speed, pulse frequency, and laser power. Scan overlap also contributes, although not significantly. It can be seen that the best set of laser marking parameters for quality to maximize the DMC code is: laser power - 19 W; pulse frequency - 30 kHz; scan speed - 1000 mm/s; scan overlap - 30% (Table 5, Example 63). The main effects are plotted in Figure 6 b shows that the most significant parameters or factors for the overall quality are the pulse frequency and the scan speed. Scan overlap and laser power also contribute, although not significantly. It is observed that the best set of laser marking parameters for the quality found to maximize the QR code is: laser power - 17 W; pulse frequency - 25 kHz; scan speed - 2000 mm/s; scan overlap - 30% (Table 5, Sample 39). Main effects plot for the Quality Grade of: (a) DMC and (b) QR.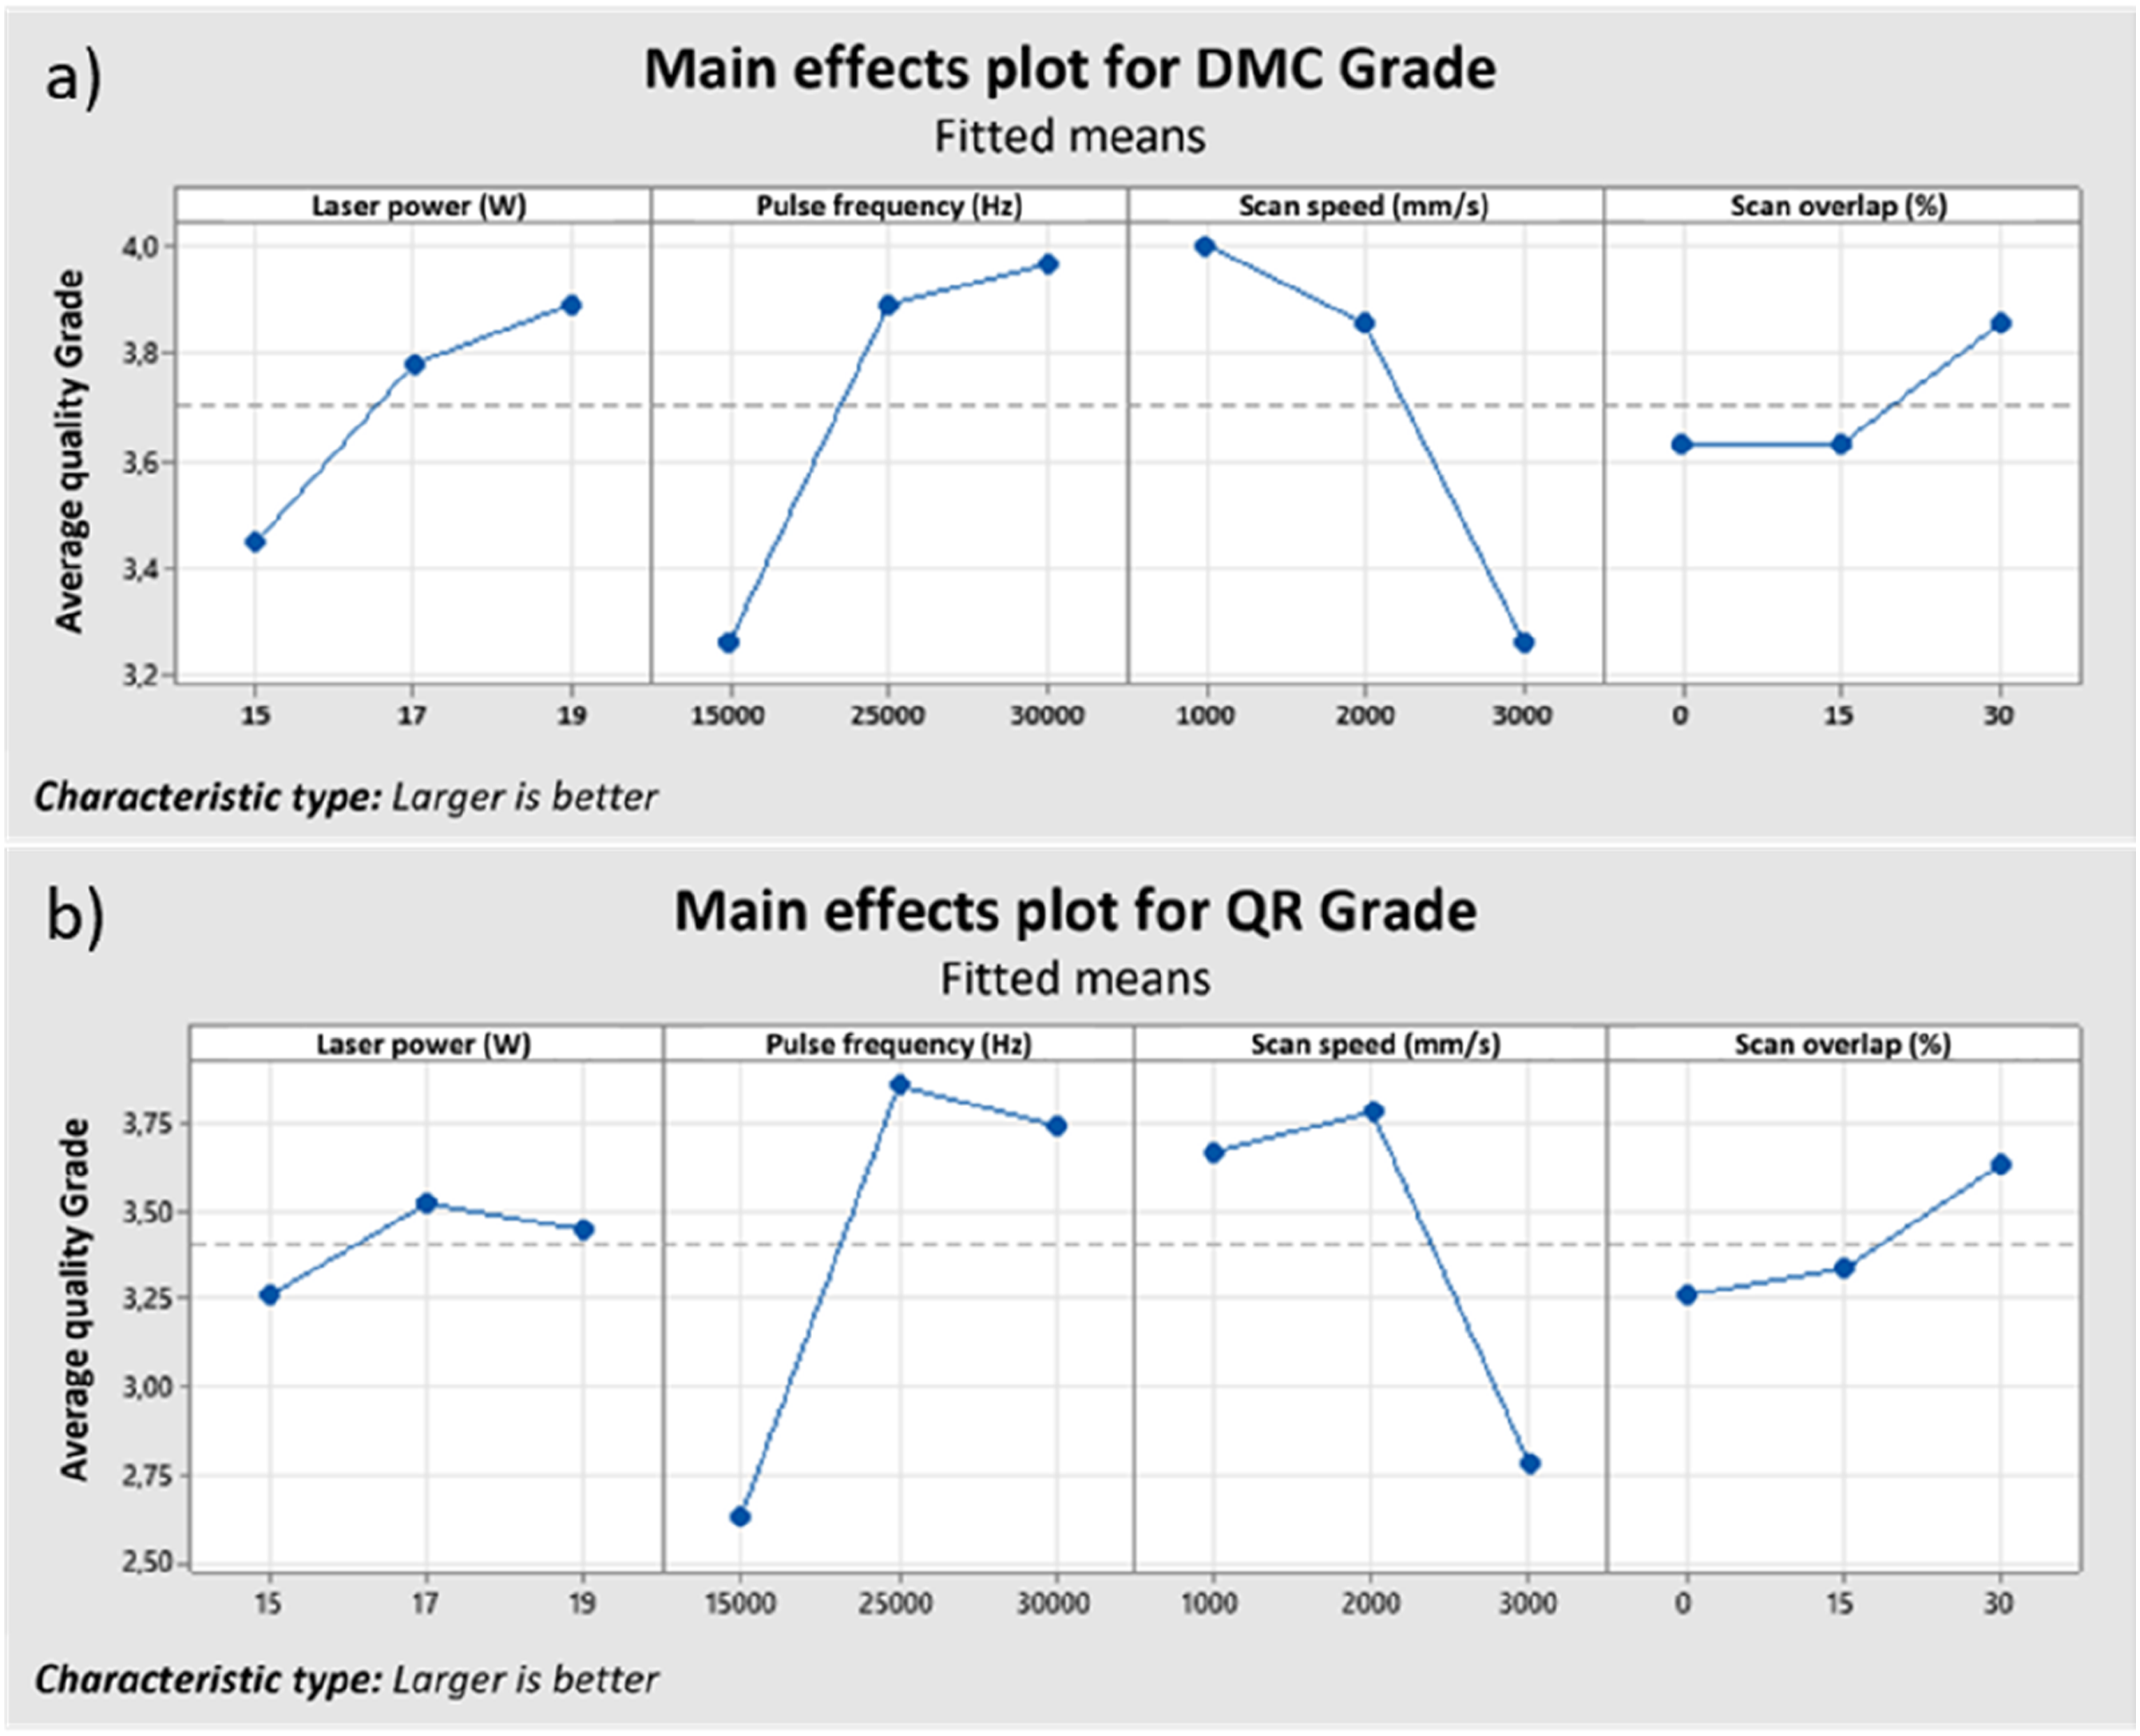
The second feature analyzed using S/N ratio analysis was the cell contrast (CC) of DMC and QR codes. The contrast of the codes is assessed by the difference in reflectance between the light and dark elements of the code and between the quiet zone and the peripheral elements (Figure 4). In other words, all pixels in the image captured for the code to be verified are first classified according to their reflectance values to select the 10% darkest and 10% brightest. The difference between the arithmetic means of these two groups defines the contrast of the code.36–38 Table 5 shows that the codes rated D and F have low contrast. The dark and light elements are very close to each other, which makes them difficult to read.
The graph in Figure 7 a shows that pulse frequency and scan speed are the parameters with the greatest influence on the CC result. It can be seen that the best set of laser marking parameters for the CC to maximize the DMC code is: Laser power - 19 W; Pulse frequency - 30 kHz; Scan speed - 1000 mm/s; Scan overlap - 30% (Table 5, Sample 63). Figure 7(b) shows the results of the CC for the QR for the different marking parameters studied and their levels. The scan speed, pulse frequency, and laser power are the parameters with the greatest influence on the CC result. The scan overlap has no significant effect on the CC result. It is found that the best set of laser marking parameters for CC to maximize the QR code is: laser power - 15 W; pulse frequency - 15 kHz; scan speed - 2000 mm/s; scan overlap - 30% (Table 5, Sample 30). Main effects plot for cell contrast of: (a) DMC and (b) QR.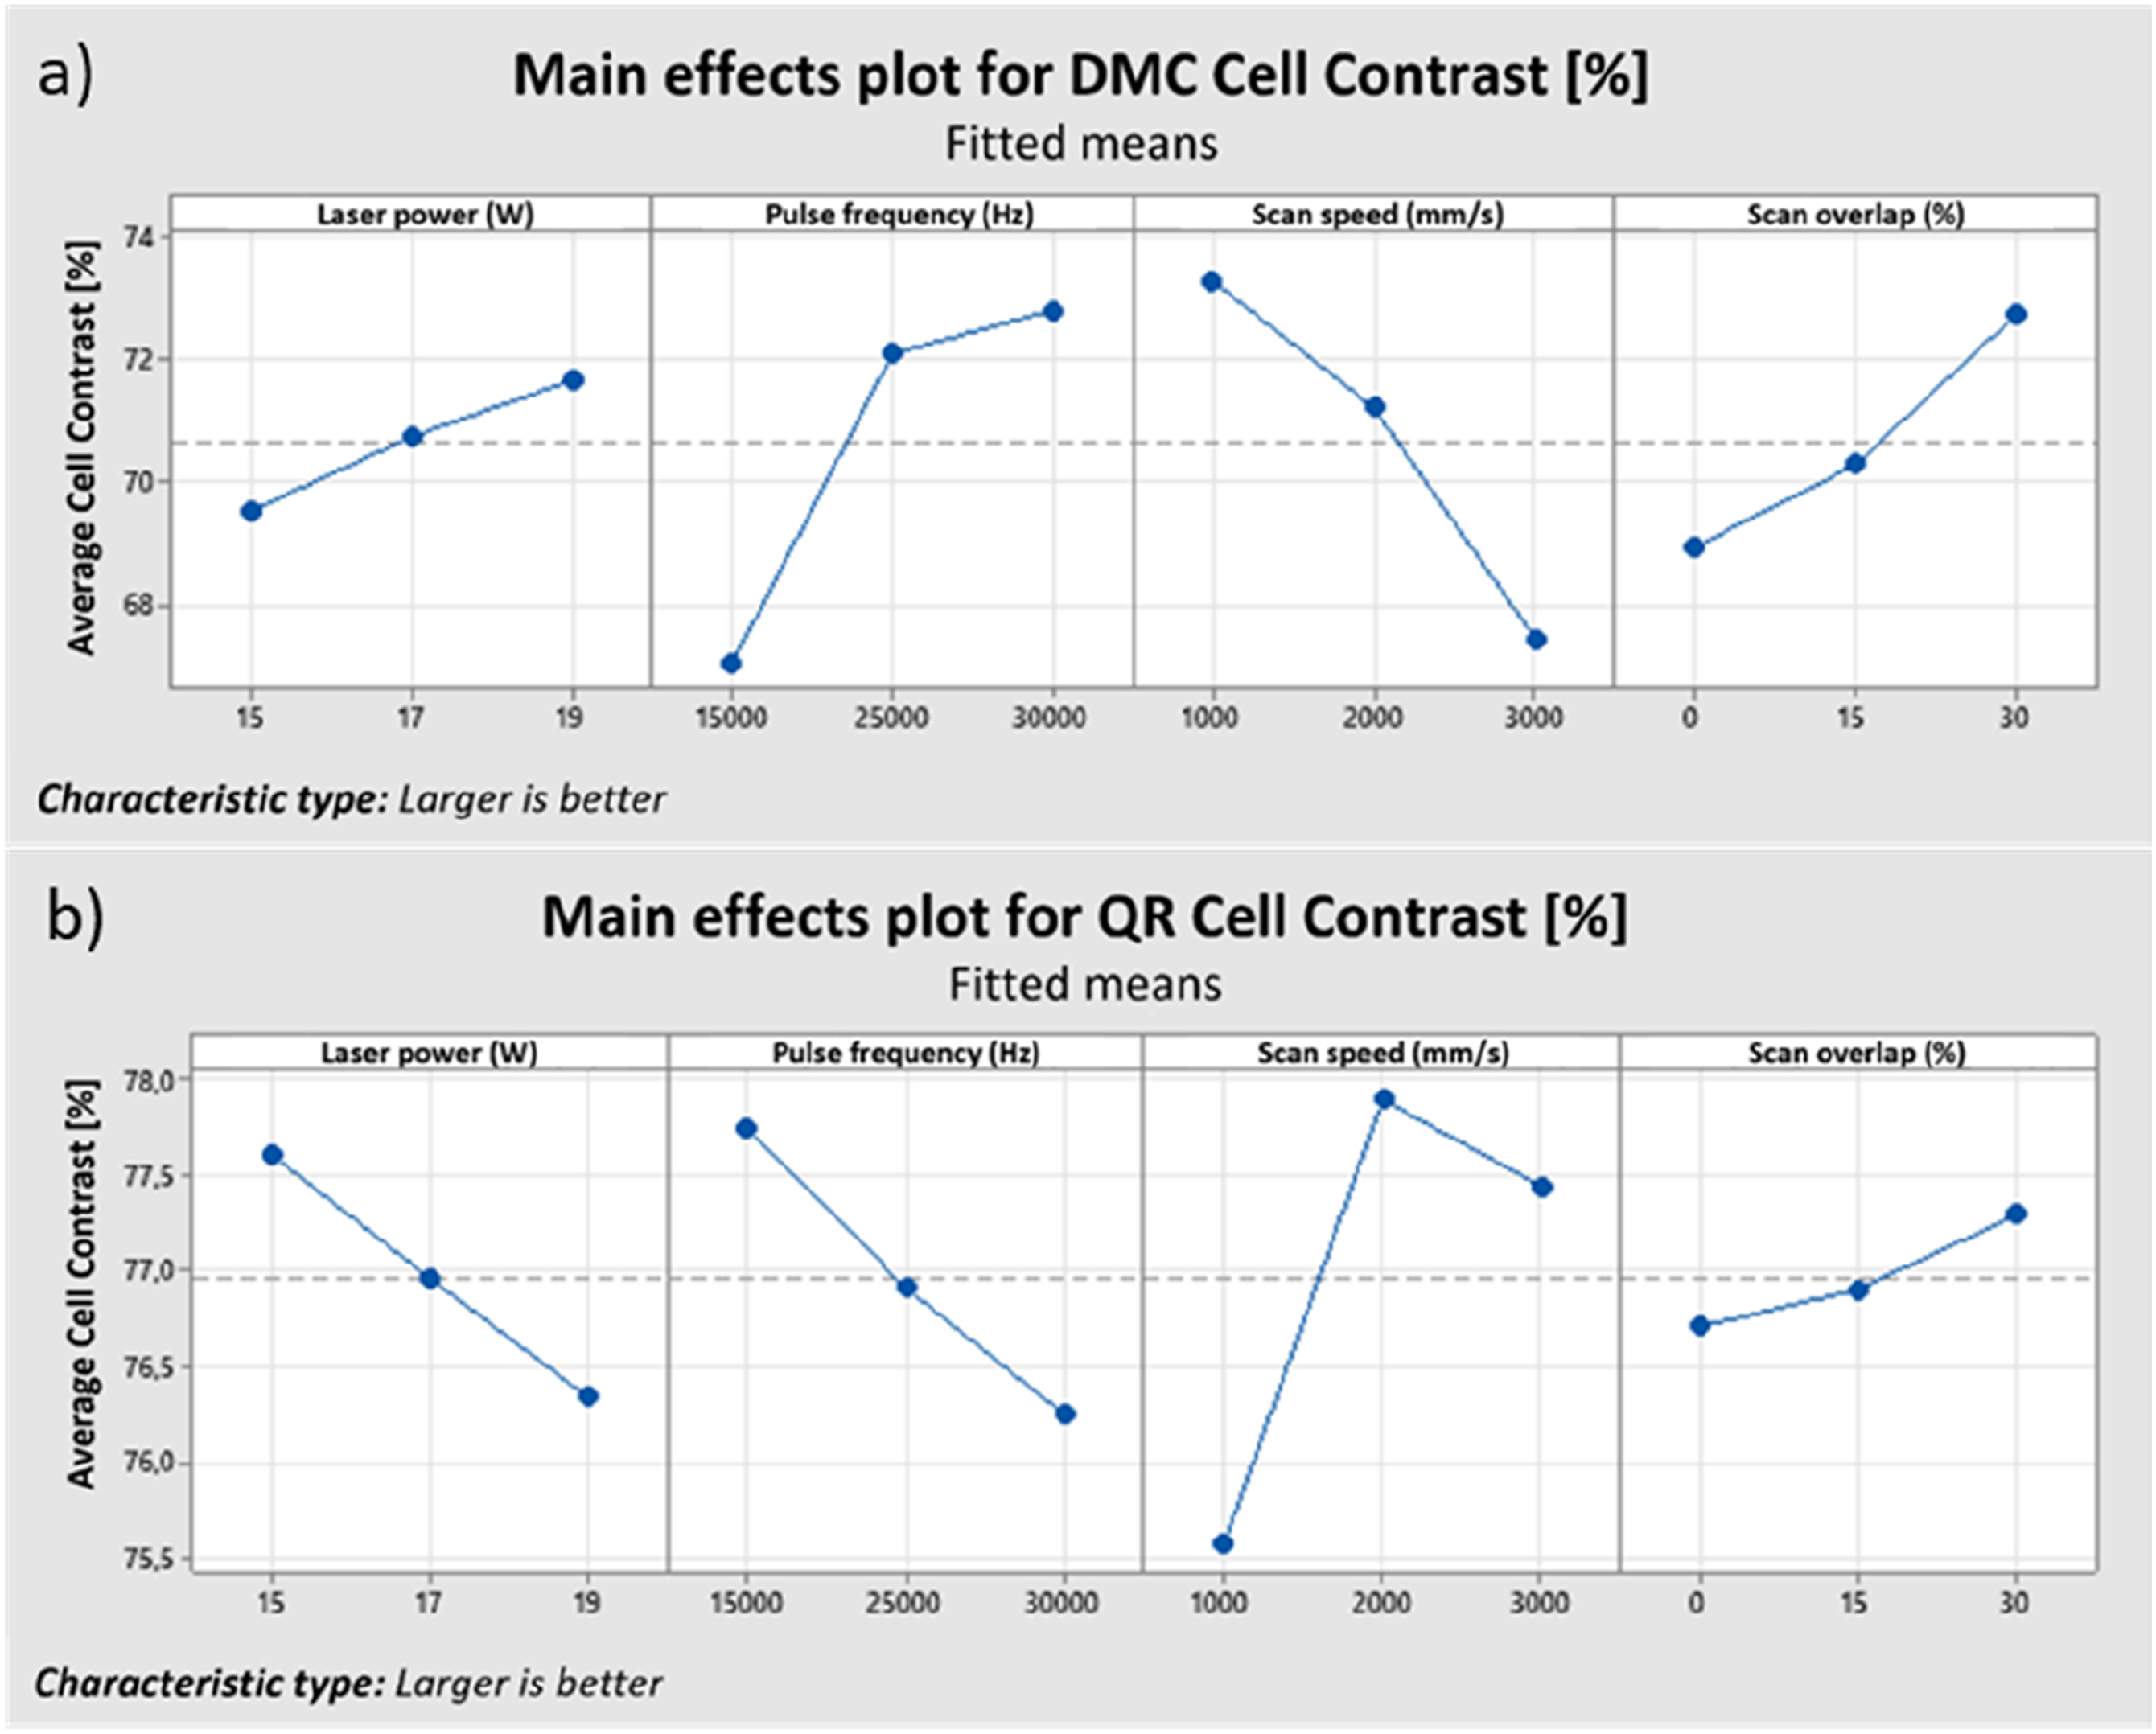
The third feature analyzed using the S/N ratio type of analysis was cell modulation (CM). This characteristic refers to the uniformity of the reflection of the light and dark elements of the code.36–39 Figure 8 shows the best parameters in terms of CM results for the DMC and QR codes. For both codes, the pulse frequency and the scan speed are the parameters with the greatest influence on obtaining uniform reflection results of the light and dark elements. It is found that the best set of laser marking parameters for CM to maximize the DMC code is: laser power - 19 W; pulse frequency - 30 kHz; scan speed - 1000 mm/s; scan overlap - 15% or 30% (Table 6, sample 55 or 63). In the graph in Figure 7(b), the best parameters for the CM to maximize the QR code are laser power - 17 W; pulse frequency - 25 kHz; scan speed - 2000 mm/s; scan overlap - 30% (Table 6, Sample 39). Main effects plot for the Cell Modulation of (a) DMC and (b) QR. Statistical results of CC values for DMC and QR.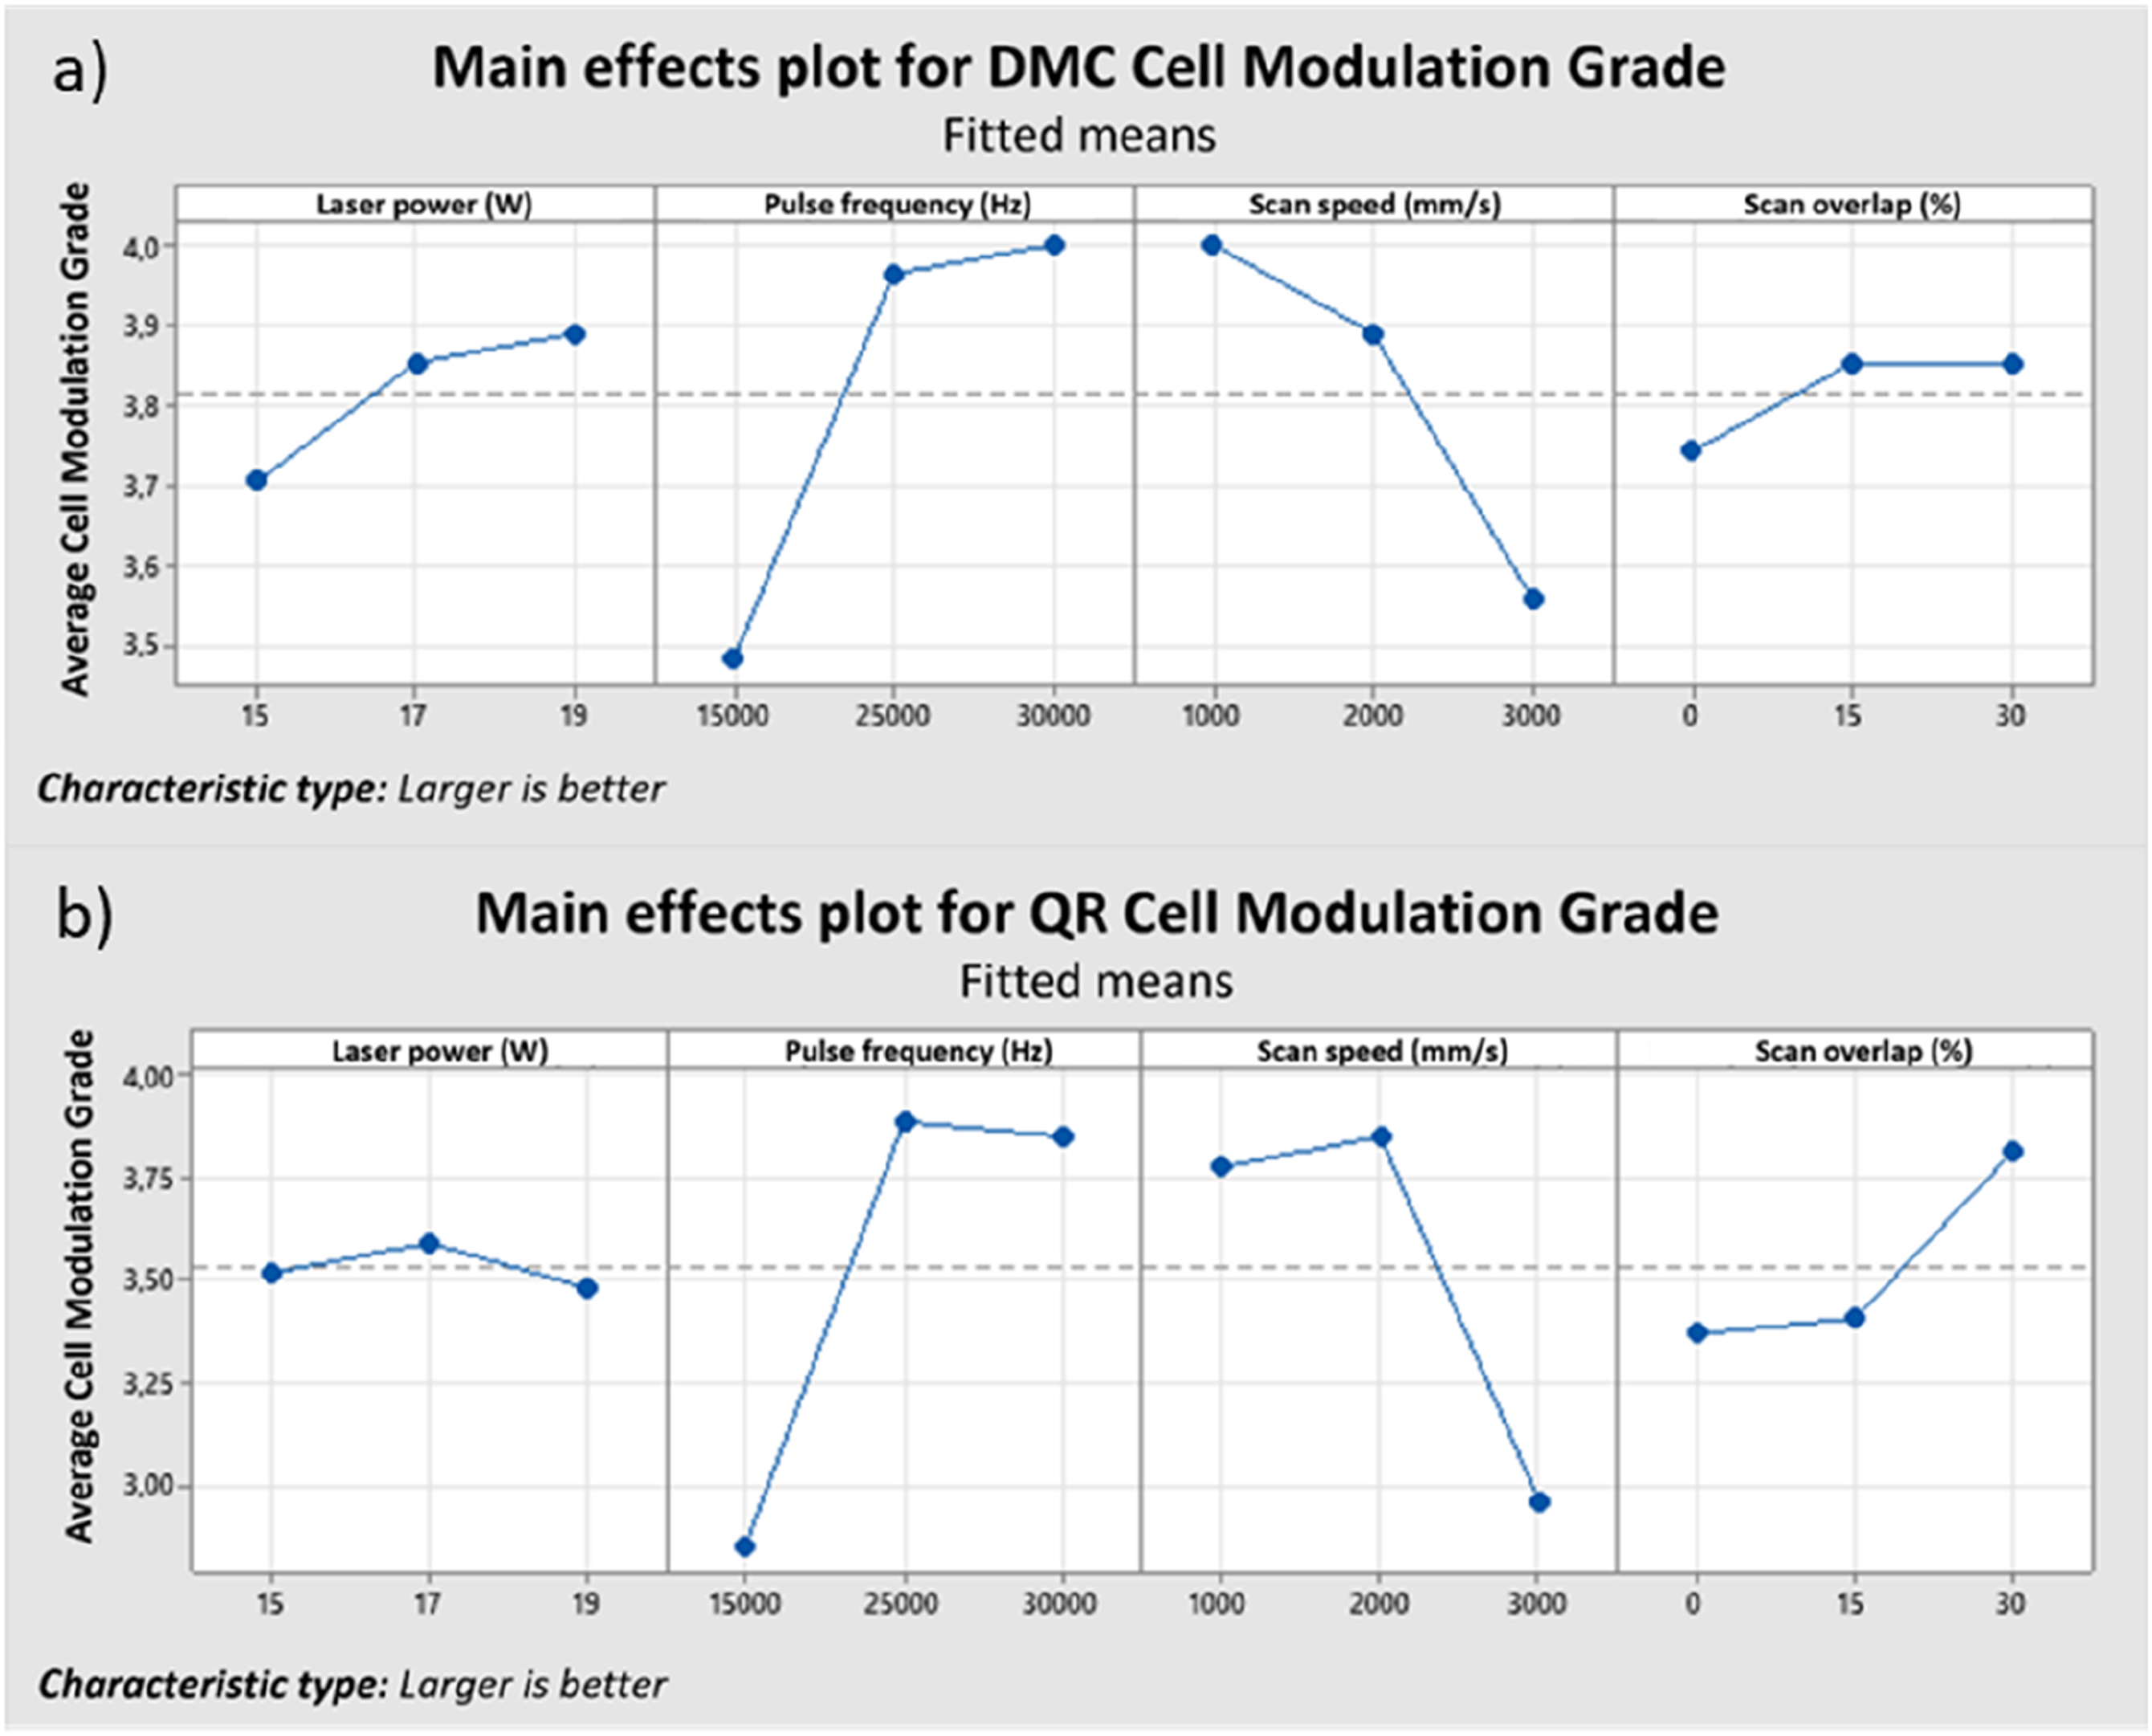
The final characteristic used in the S/N ratio analysis was fixed pattern damage (FPD). This parameter refers to the damage present in the Finder Pattern, Timing Pattern, Alignment Pattern, and Quiet Zone (Figure 4).
The Finder Pattern is used by scanners to determine the position of the code, indicated in the DMC by patterns on the left and bottom, and in the QR Code by squares on the top and left. The Timing Pattern is a sequence of alternating black and white, arranged horizontally and vertically, used to determine the size of a module, the number of rows and columns, and possible distortion of the code; in the DMC code, indicated by patterns on the top and right side, and in the QR code, positioned between the top 3 squares and the left side. The Alignment Pattern is represented by an element only present in QR Codes version 2 or higher, where the amount of information is greater and therefore additional elements are needed to correct distortion; it is represented by a smaller square element at the bottom right of the code. Finally, the Quiet Zone corresponds to the margin around the codes to reduce interference from surrounding elements in the reading performed by the scanner. In the case of DMC, the margin must be greater than or equal to 3 modules, and in the case of QR, it must be greater than or equal to 4 modules.36–39
The main effects plot in Figure 9(a) shows the best parameters in terms of FPD results for the DMC. The scan speed, pulse frequency, and laser power are, in decreasing order of importance, the parameters that contribute most to the code having no gaps. Scan overlap contributes, but not significantly. It is shown that the best set of laser marking parameters for the FPD to maximize the DMC code is: laser power - 19 W; pulse frequency - 30 kHz; scan speed - 1000 mm/s; scan overlap - 30% (Table 5, Sample 63). Figure 9(b) shows the main effects plot that shows that pulse frequency and scan speed are the parameters that contribute most to the code having no gaps. Scan overlap and laser power contribute, but not significantly. The best set of laser marking parameters for the FPD to maximize the QR code is laser power - 19 W; pulse frequency - 25 kHz; scan speed - 1000 or 2000 mm/s; scan overlap - 30% (Table 5, sample 16 or 29). Main effects plot for fixed pattern damage of (a) DMC and (b) QR.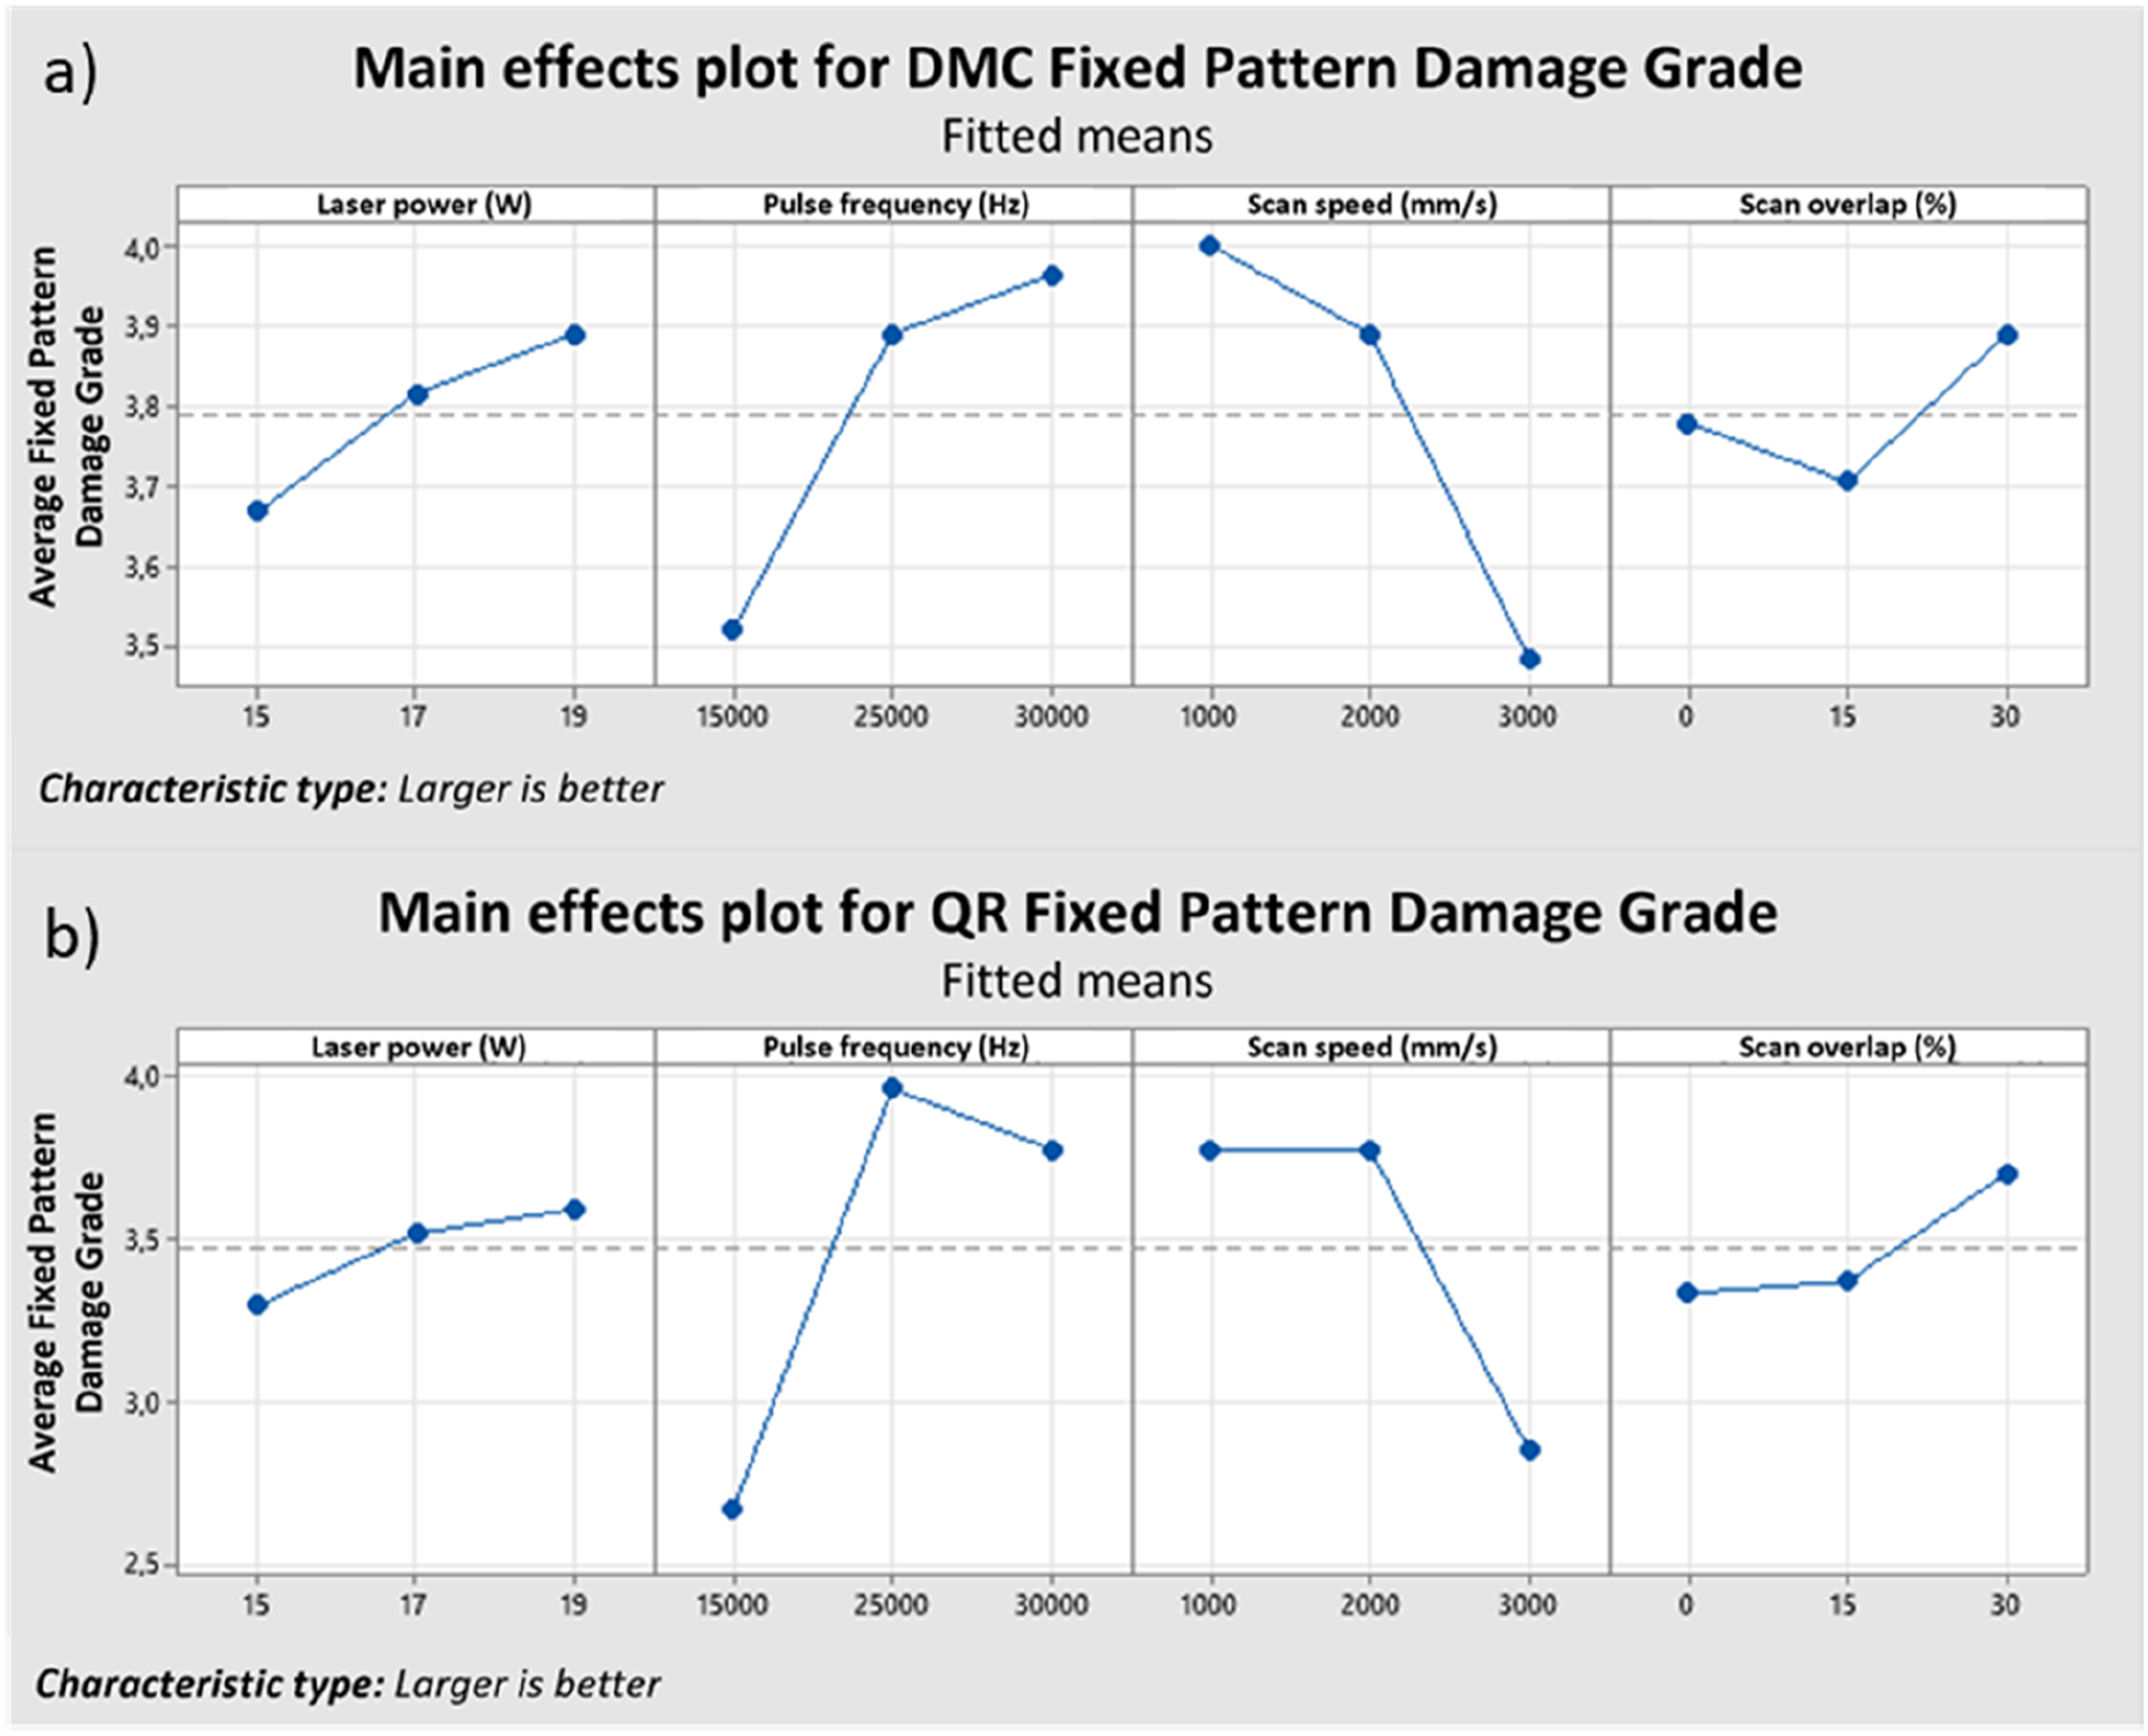
To investigate the influence of the laser marking parameters on the contrast characteristics of the CC, CM, FPD, and, consequently, the quality level of the DMC and QR codes. The S/N ratio type of analysis was used: the higher, the better (equation (2)). From the results, it can be concluded that high values of laser power, pulse frequency, and scan overlap, and a low value of scan speed are the best parameters to obtain good-quality codes. The energy density must be high enough to raise the surface temperature of the material well above the melting point, causing the material to melt or evaporate. 44 Indirectly, this suggests that higher values of laser marking parameters can produce good-quality codes with high roughness.
In ANU terms, this parameter indicates that there is no uniformity between the X- and Y-axes of the code. The dimension along the Y-axis may be larger than the dimension along the X-axis, indicating that the code resulting from the marking process has larger Y dimensions of individual modules than the dimensions along the X-axis. This inconsistency between the X and Y dimensions usually indicates that the object is moving during the marking process.36–39
DMC and QR codes are most affected by the fixation of the part during marking. If the manufacturing process ensures that the part is fixed and there is no movement during the process, the results will be homogeneous, indicating that the laser marking parameters are not interfering during the process. The Pareto plot in Figure 10 shows that the codes resulting from the marking process have dimensions along the X-axis of each module that are very similar to the dimensions along the Y-axis, indicating that there is no movement of the part during marking. Therefore, this characteristic parameter does not contribute significantly to the homogeneity of the code along both axes and it is not necessary to analyze the S/N ratio. Pareto chart of standardized effects for ANU of (a) DMC and (b) QR.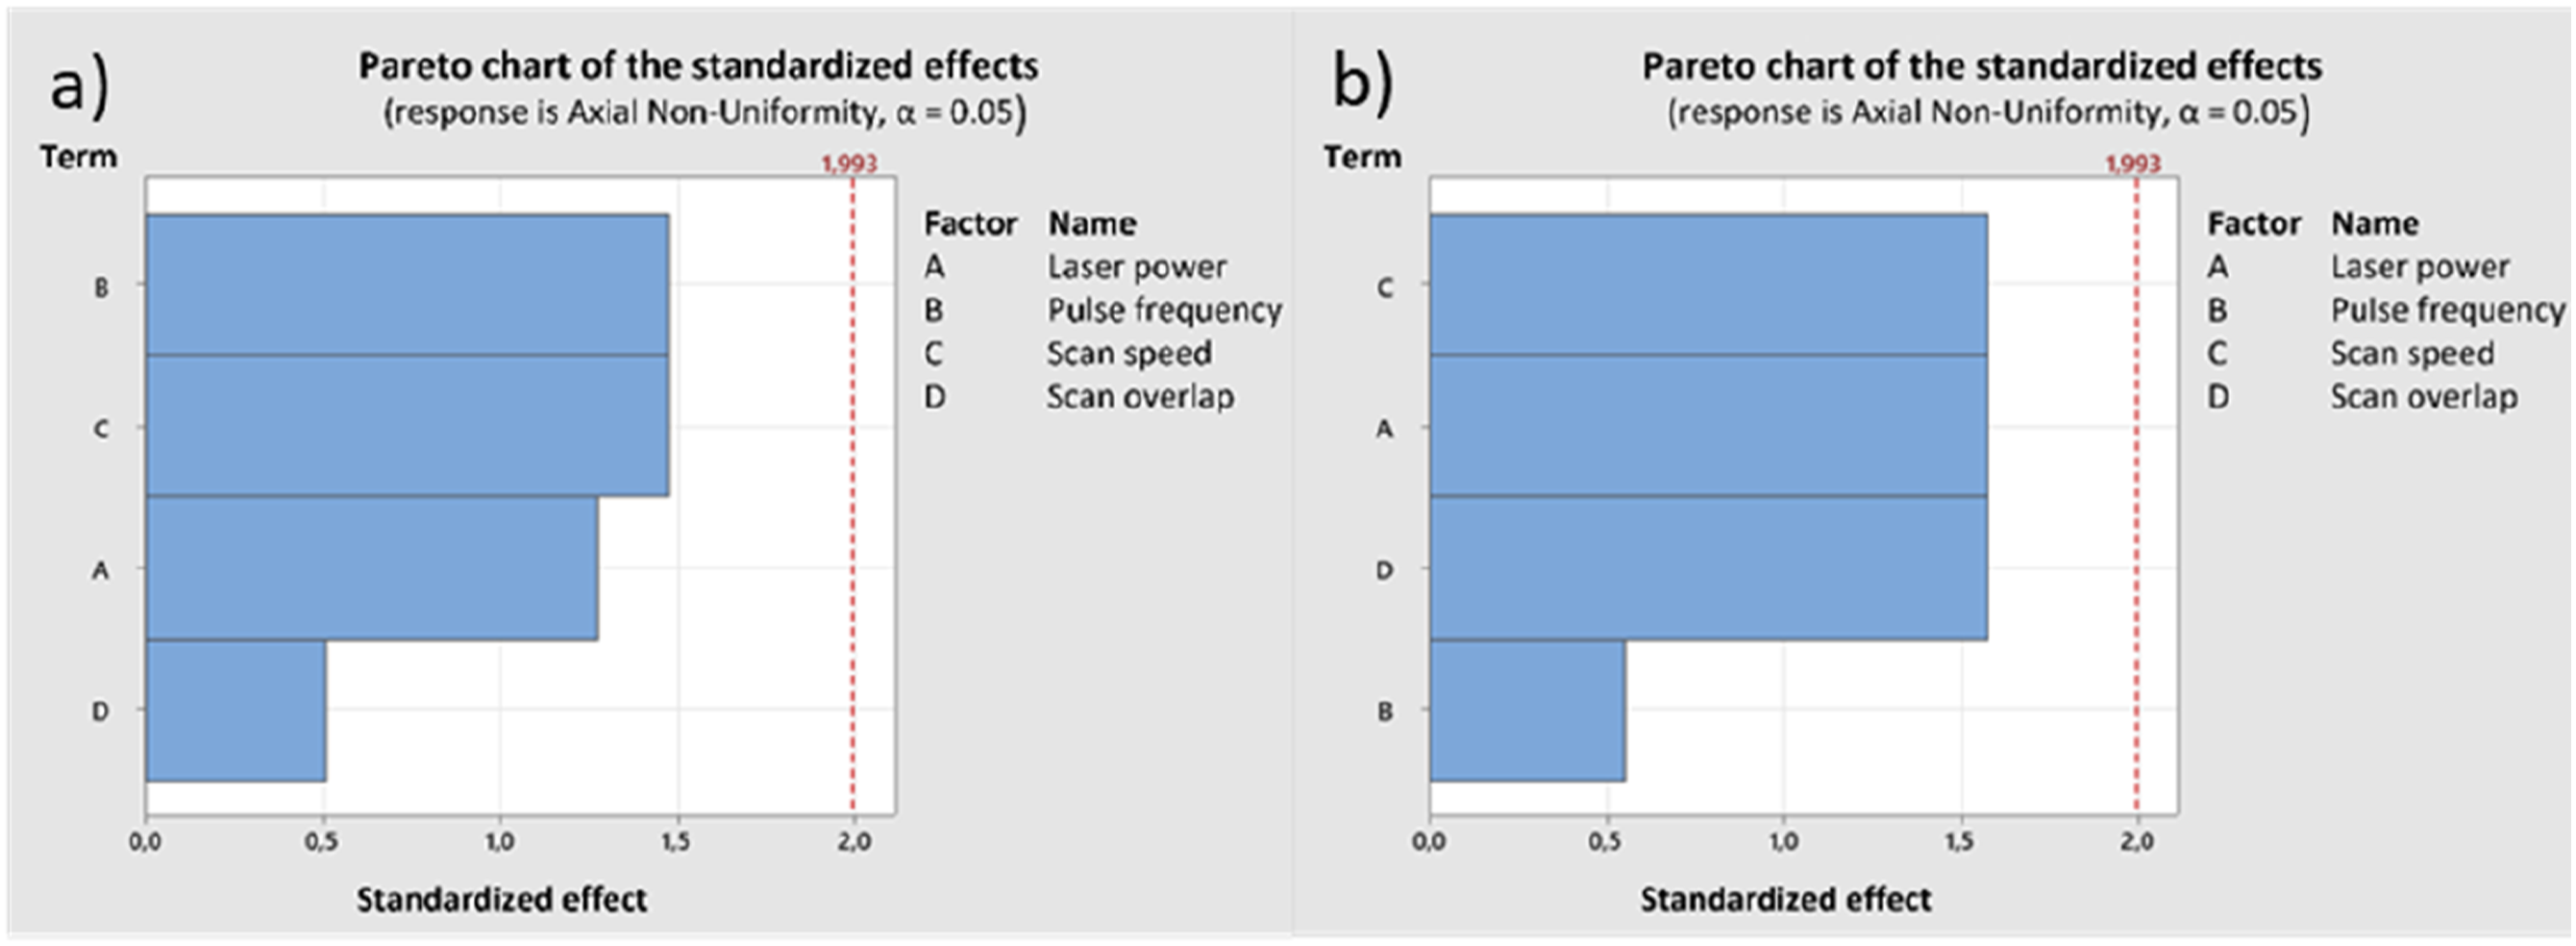
The GNU is a characteristic related to the deviation of the positioning of a module from the theoretical position, which is considered ideal. The class obtained in this parameter is the result of the calculation of the maximum positioning deviation detected in the actual modules concerning the positioning of the theoretical modules.36–39 The type of S/N ratio analysis used was smaller is better (equation (1)) for GNU. This indicates that lower values of the laser marking parameters are required to obtain the characteristics necessary to produce good-quality codes.
From the graph in Figure 11(a), it can be concluded that the pulse frequency and scan speed are the parameters that contribute most to the modules not being marked in the theoretical position. The best set of laser marking parameters for GNU to minimize the DMC code is laser power - 17 W; pulse frequency - 30 kHz; scan speed - 1000 mm/s; scan overlap - 0% (Table 6, Sample 66). Using the graph in Figure 11(b) for the QR, it can be seen that the scan overlap and the scan speed are the parameters that contribute the most to the modules not being marked at the theoretical position. The best set of laser scan parameters for GNU to minimize the DMC code is laser power - 17 W; pulse frequency - 30 kHz; scan speed - 1000 mm/s; scan overlap - 30% (Table 6, Sample 65). Main effects plot for the GNU of (a) DMC and (b) QR.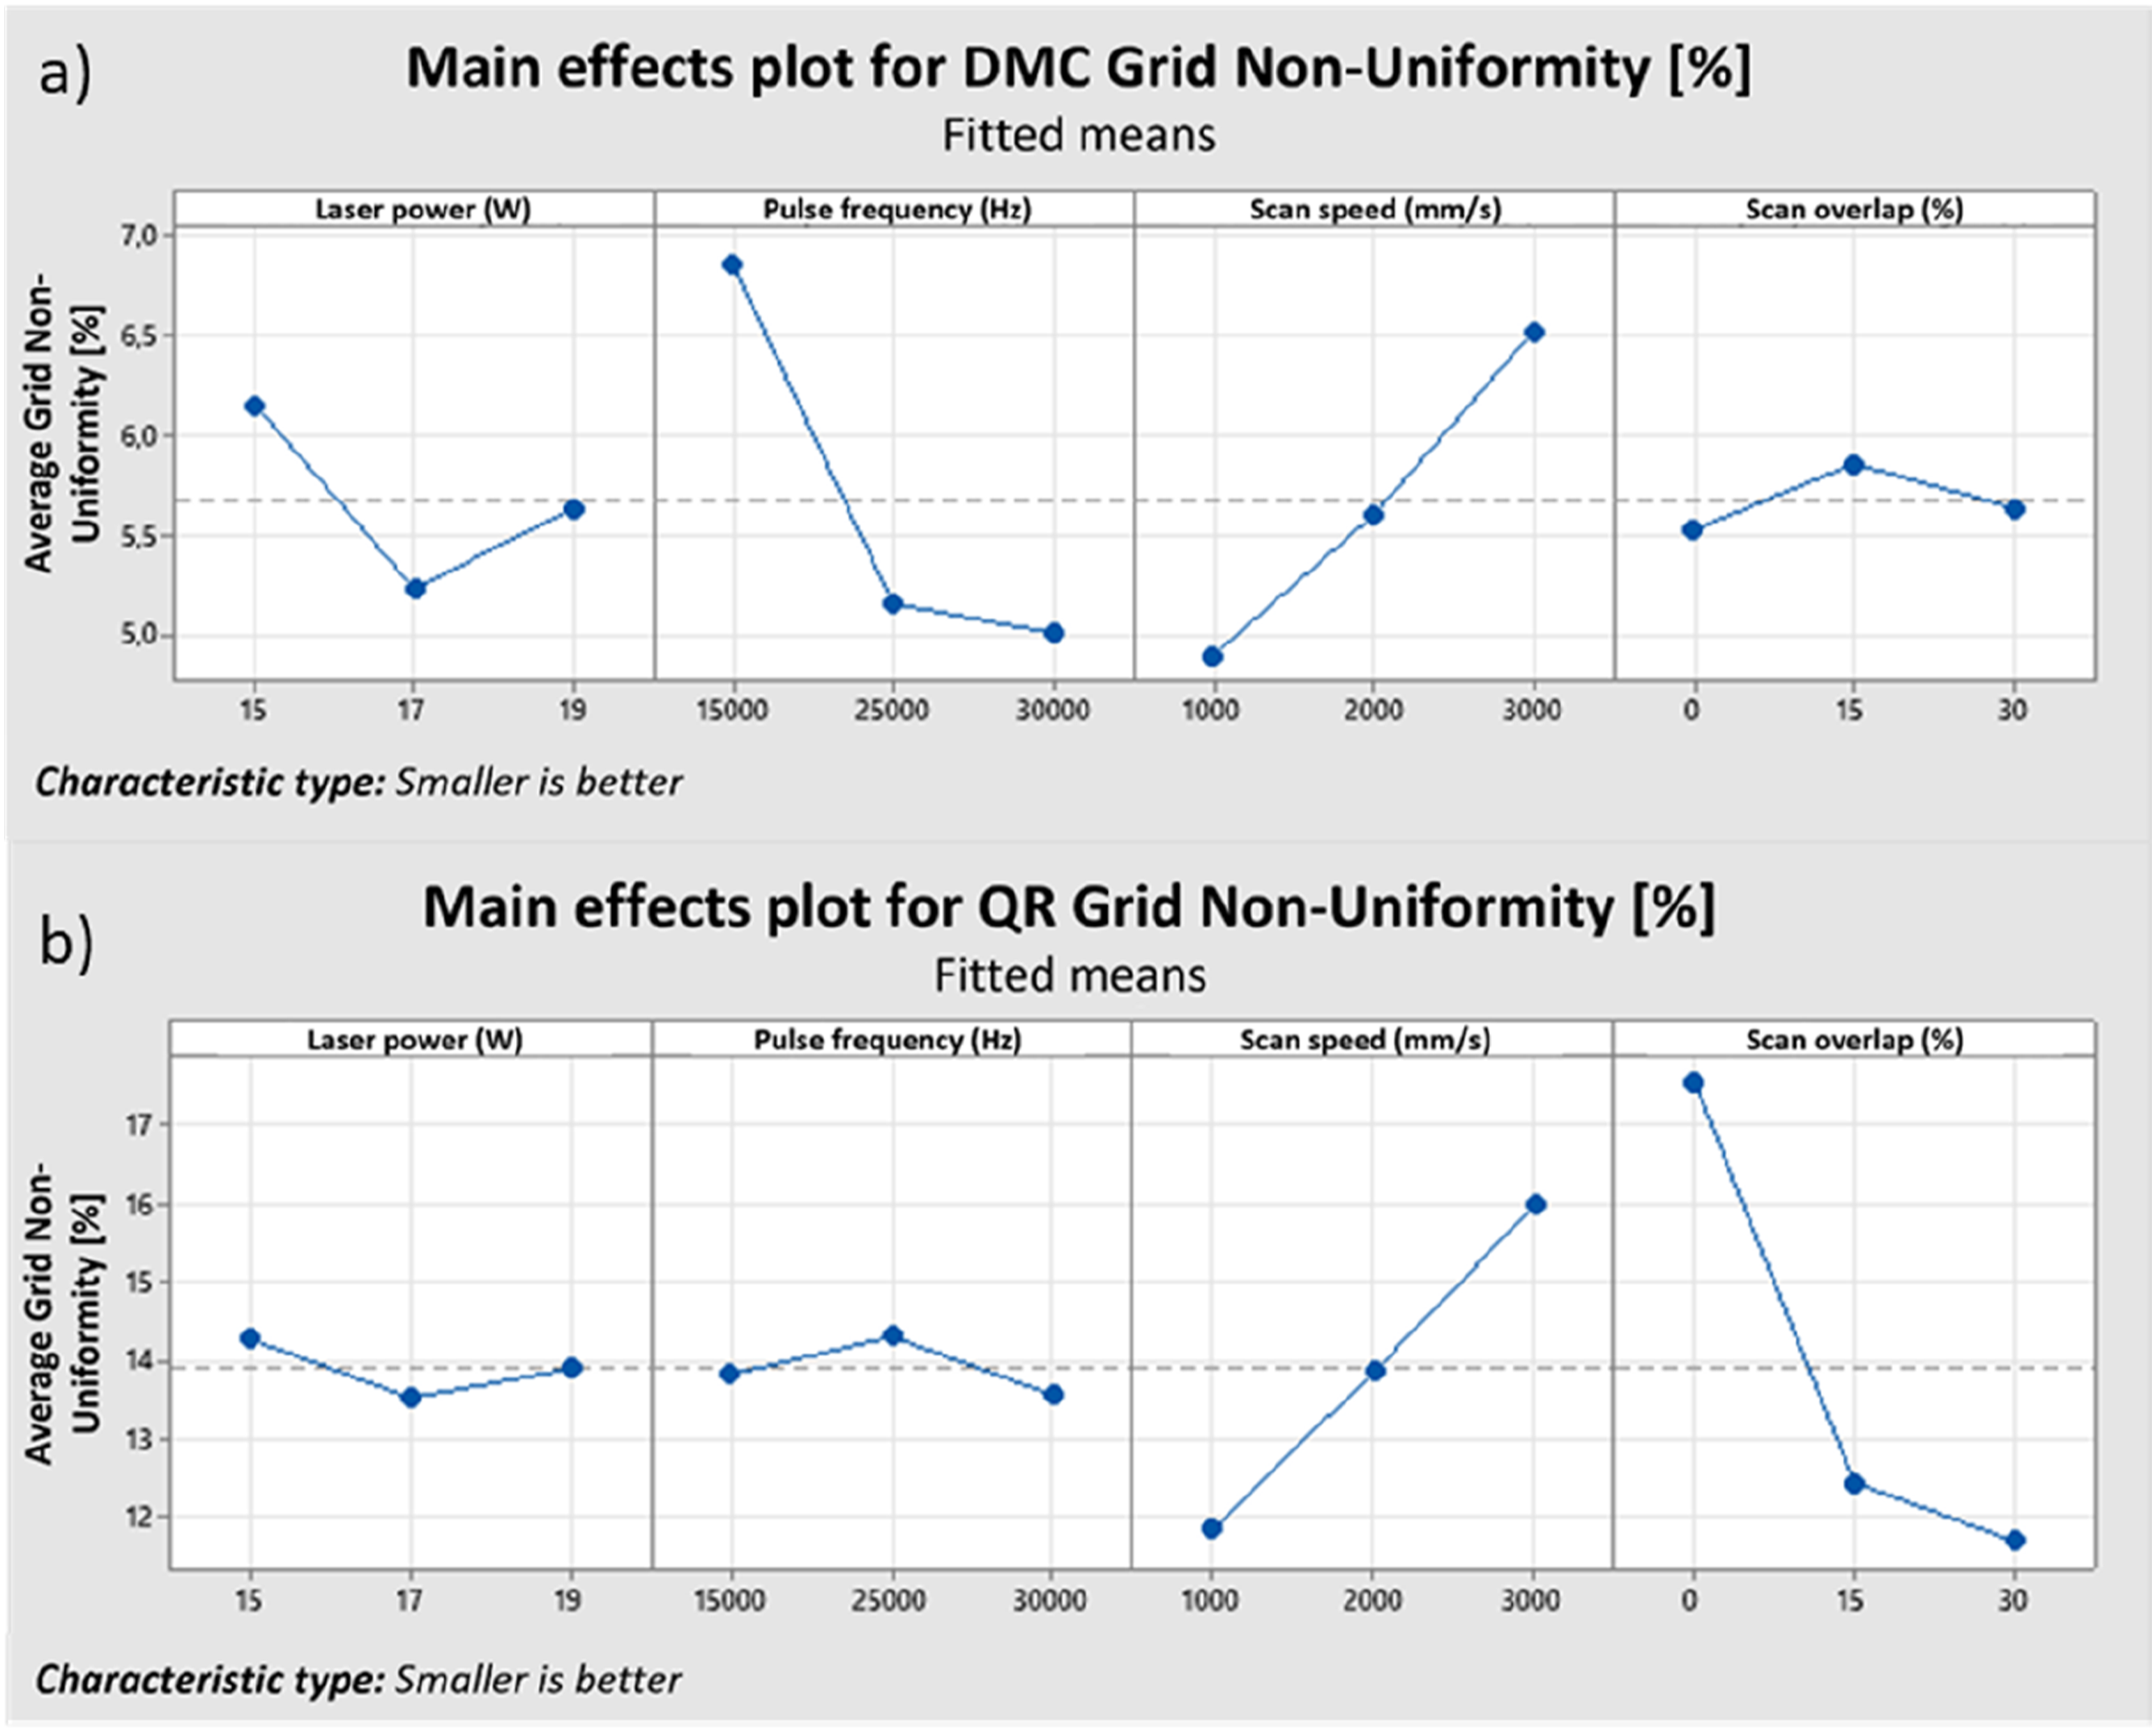
The results obtained in this work follow Hamadi et al 45 and Kasman’s observations. 46 Both studies observed that the higher laser marking parameter can improve the code quality. The research group 45 investigated the effect of laser marking parameters on the average surface roughness Ra based on the Taguchi design. They observed that the scanning speed has the most significant influence on the surface quality. It is observed that the surface roughness decreases as the scanning speed increases improving the quality of the code and that the lower the processing parameters, the lower the surface roughness, which worsens code quality. Kasman 46 observed that by increasing the values of the laser marking parameters, such as frequency and laser power, with an average value for the scanning speed, the final product will have a greater depth in the code marked on the surface of the final product, giving the code a better quality.
Analysis of variance (ANOVA)
Using Minitab® software, it is also possible to obtain an analysis of variance of the results. This analysis makes it possible to determine the importance of each parameter on the results of the different characteristics of the DMCs and QRs and to check their dispersion.
ANOVA indicates the percentage contribution of each parameter through the p-value or probability of significance. The smaller the p-value is to 0.05, the greater the contribution of that condition, in this case, the laser scan parameter. It is also possible to analyze the adequacy of the test model through the trend line with the correlation coefficient (R2). This value is between 0% and 100% and the closer it is to 100%, the more reliable the model is. The graph in Figure 12(a) a shows the trend line of the CC results for the DMC. It can be seen that some values are far from the mean line, which negatively affects the R2 value. Moreover, the analysis of variance keeps the same slope as in the previous study, about the trend line, accompanied by a p-value analysis that indicates the importance of each parameter for the different results. The graph in Figure 12(b) shows the trend line for the CC results for the QR. Some values are far from the mean line, which has a negative effect on the R2 value. Trend line of CC results for (a) DMC and (b) QR.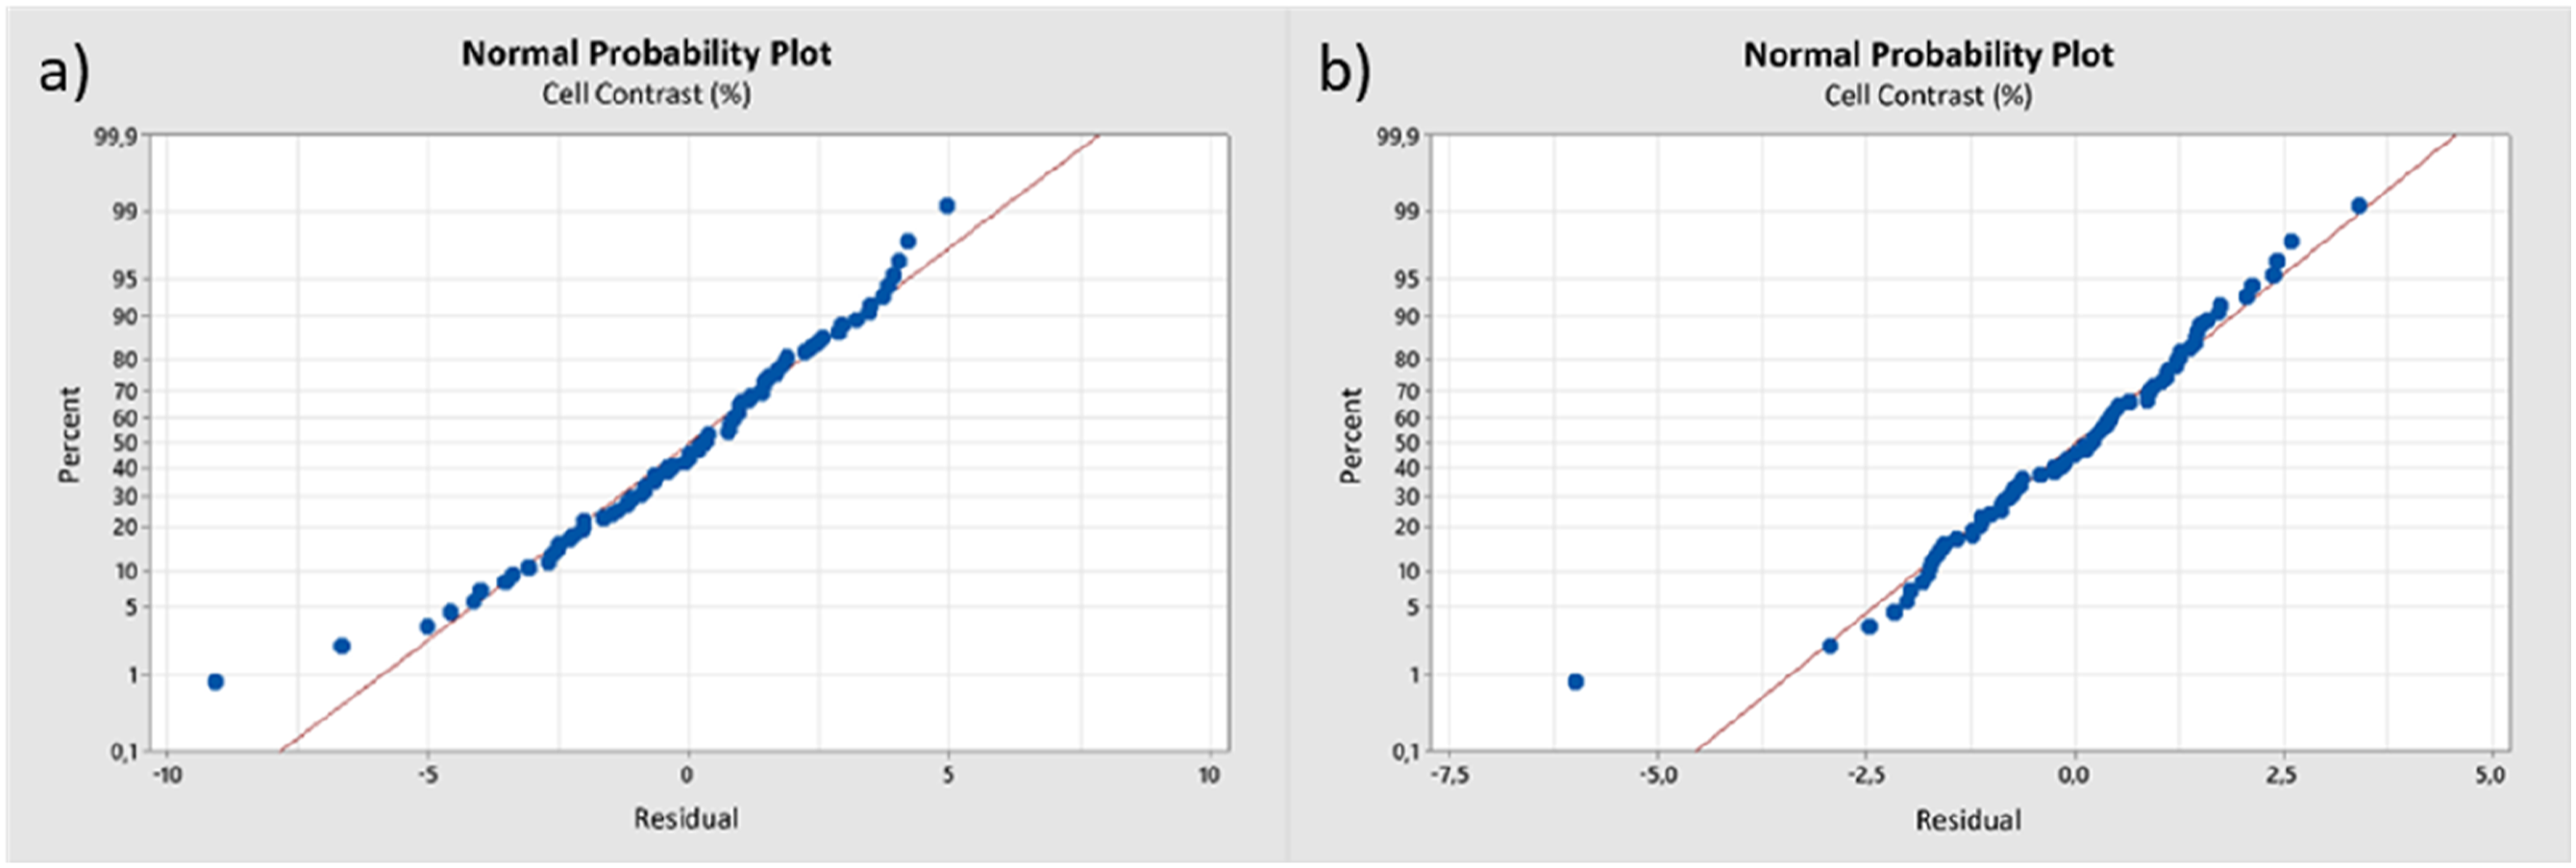
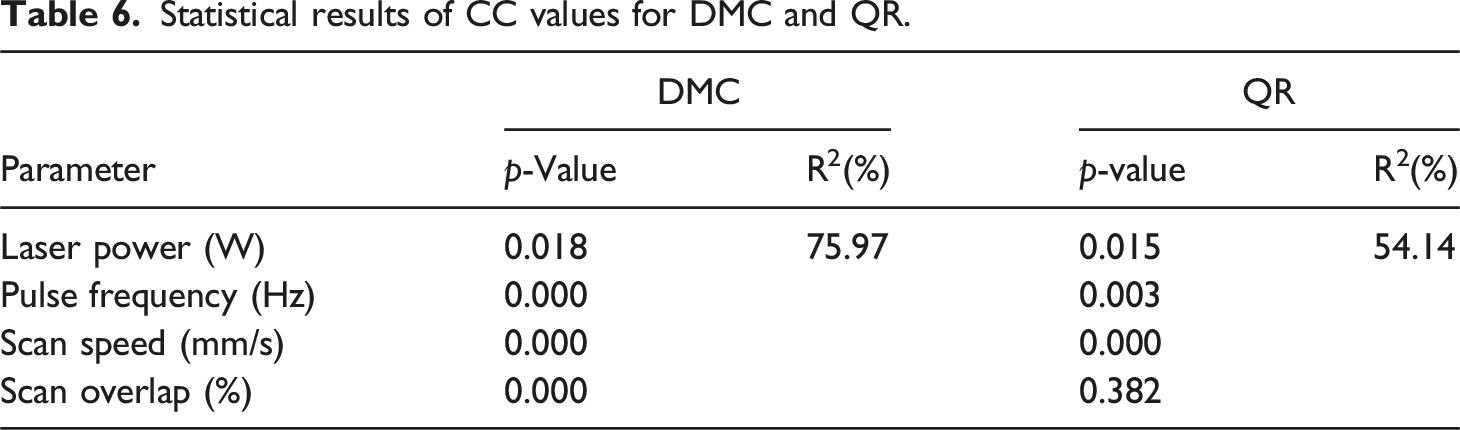
Table 6 shows that all parameters have a significant effect on the CC results for the DMC (p-values less than 0.05). Laser power is the least contributing parameter with the highest p-value of 0.018. In this table, the lowest p-value is 0.000 for pulse frequency, scan speed, and scan overlap, indicating that these parameters contribute more significantly to this characteristic. The R2 value is 75.97%, indicating that the model could be improved to be considered ideal. Furthermore, the scan overlap for the QR does not contribute significantly to the CC results, as it has a high p-value of 0.382. It can also be seen that in this table, the parameter that contributes most to the CC result is the scan speed, with the lowest p-value of 0.000, followed by the pulse frequency with a p-value equal to 0.003. The R2 value is 54.14%, indicating that it is possible to improve the model.
Figure 13(a) shows the CM trend line for the DMC. Some values are far from the mean line. This deviation affects the R2, which is 55.23% (Table 7), about half the value of the ideal model, which is 100%, indicating that the model can be improved. Such a low value of reliability may be related to the fact that many results are far from the mean line and very scattered among themselves. Figure 13(b) shows the CM trend line for QR. Some values are far from the mean line, which affects the R2, which is about 50.47%. As mentioned before, such a low-reliability value may be related to the fact that many results are far from the mean line and very scattered among each other. Trend line of CM results for (a) DMC and (b) QR. Statistical results of CM values for DMC and QR.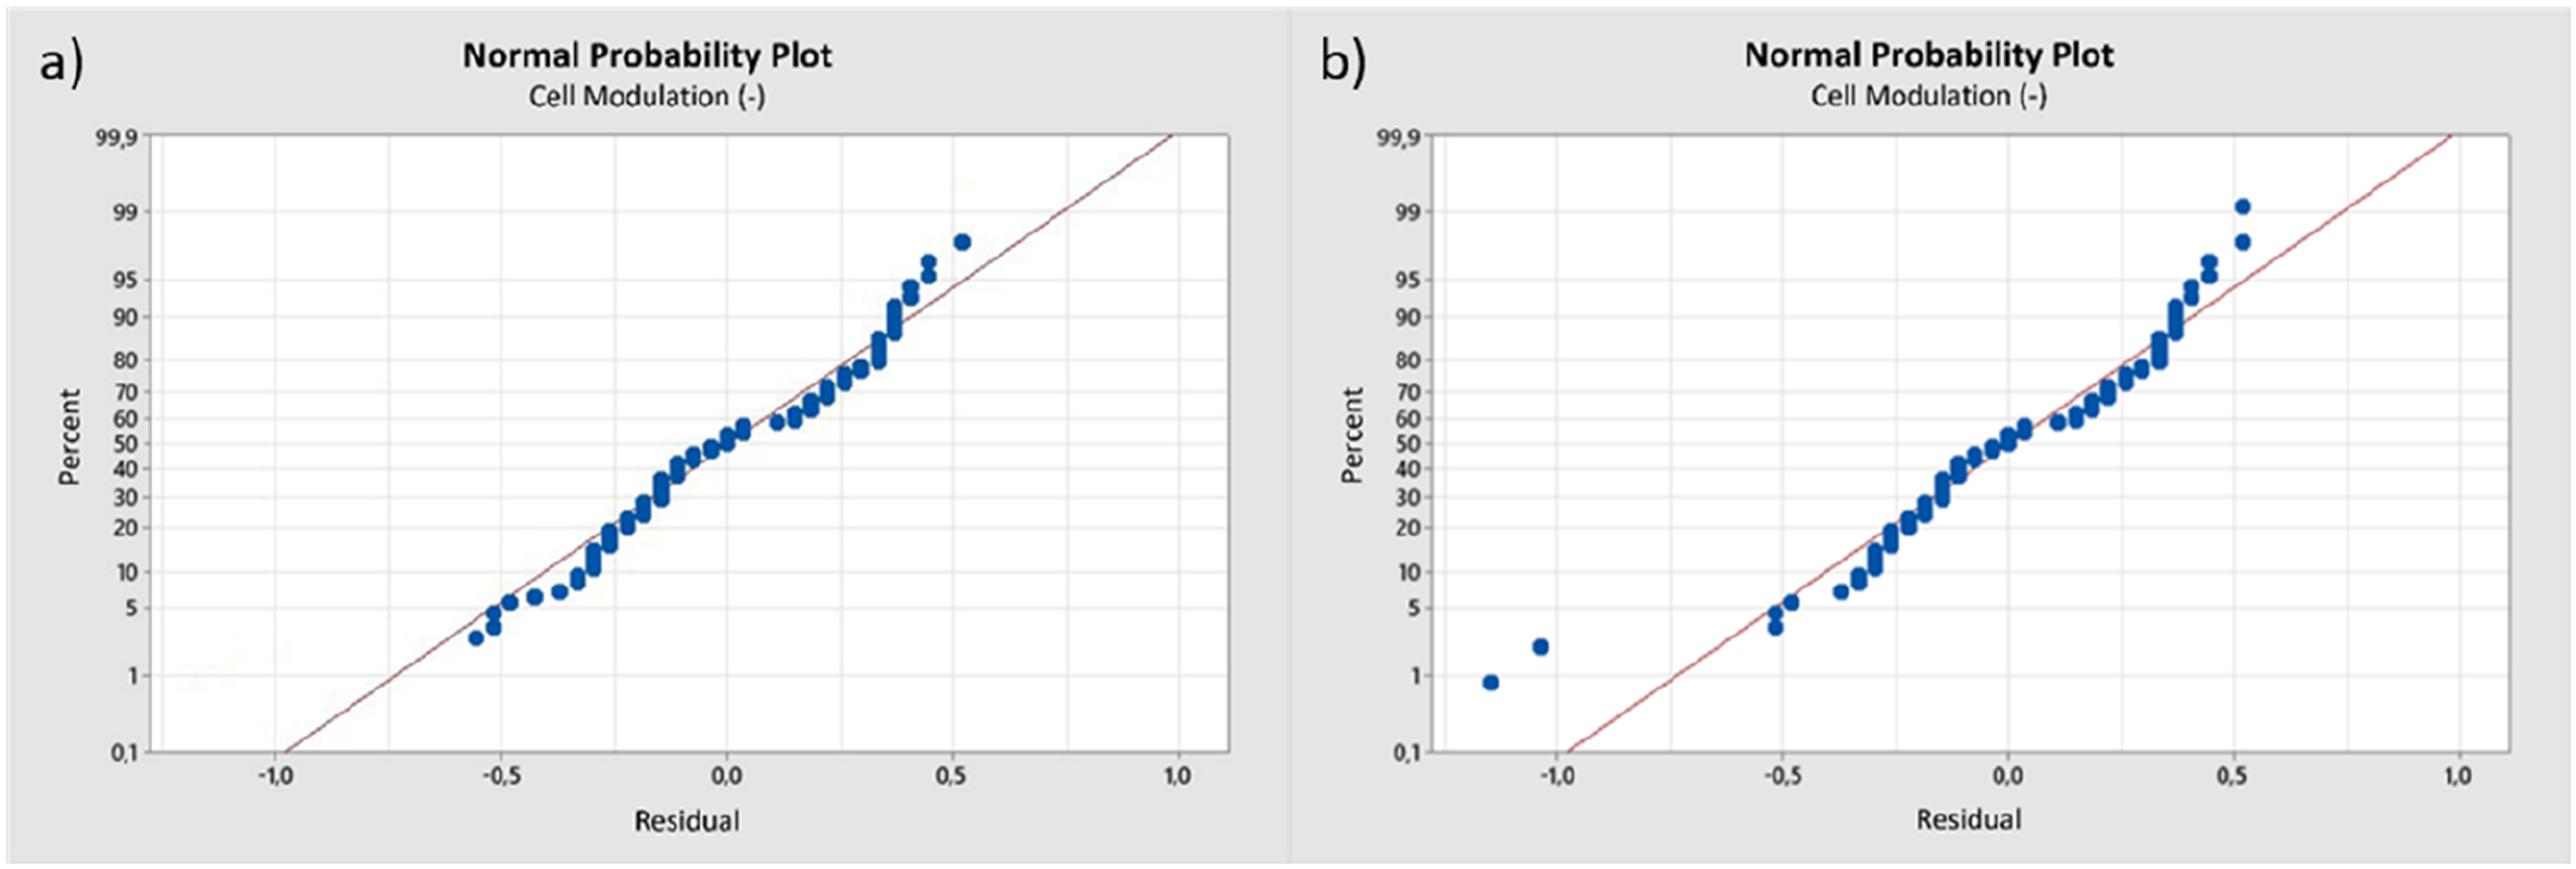

Table 7 shows that scan overlap and the laser power do not contribute significantly to the CM results for DMC, as they have high p-values of 0.376 and 0.106 respectively. It should also be noted that the lowest p-value in this table is 0.000 for pulse frequency and scan speed, indicating that these parameters contribute significantly to the DMC feature. It also shows that the laser power and the scan overlap are parameters that do not contribute to the CM results for the QR, since they have high p-values of 0.900 and 0.142 respectively. It is also observed in Table 7 that the lowest p-values are 0.000 and 0.001 for pulse frequency and scanning speed, respectively, showing that these parameters contribute more significantly to the QR code.
Figure 14(a) shows the FPD trend line for the DMC, where some values deviate from the mean line. This deviation causes R2 to decrease and lose reliability, reaching a value of 60.44%, indicating that there is an opportunity to improve the model. Figure 14(b) shows the FPD trend line for the QR. As with the CM, some values are far from the mean line, which affects the R2, which is around 49.86%. The reasons for such a low reliability value could be the same as those mentioned above. Trend line of FPD results for (a) DMC and (b) QR.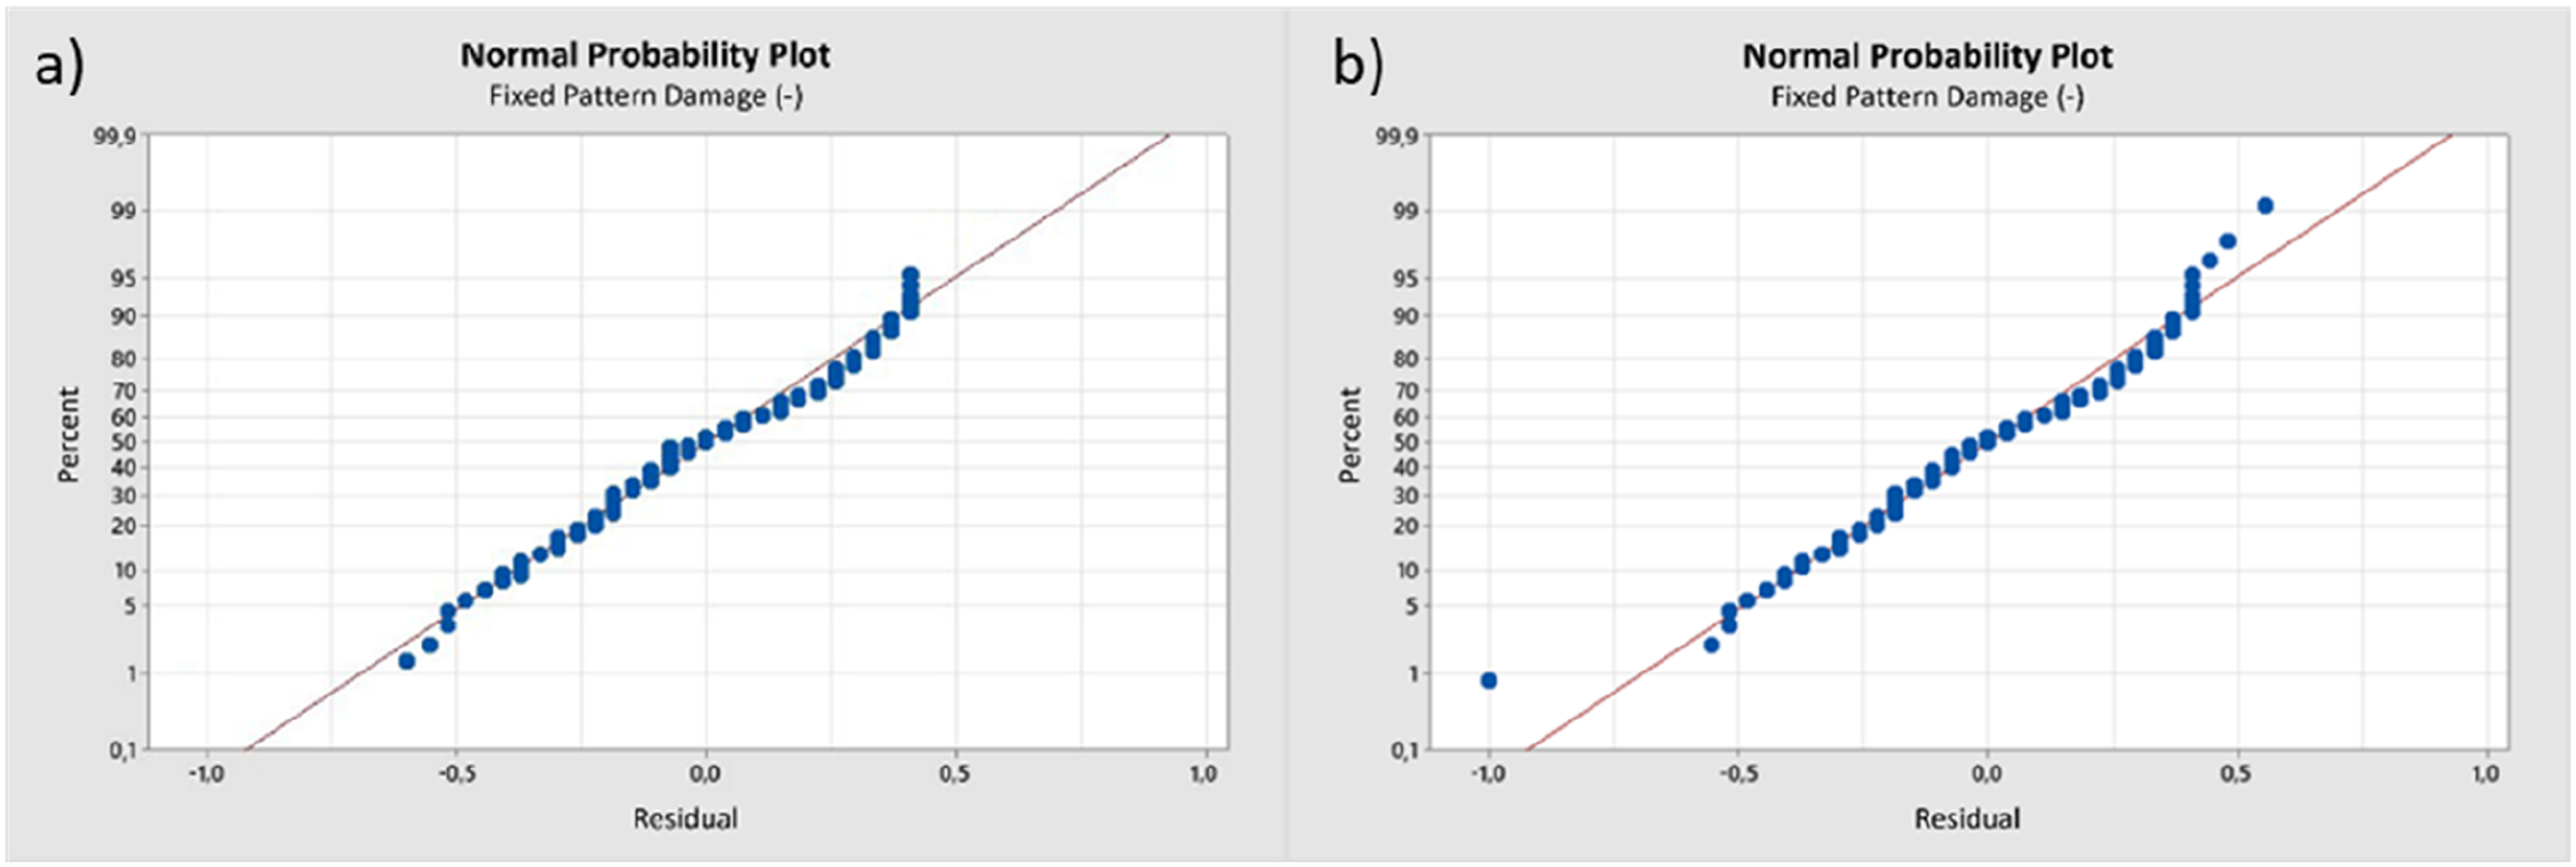
Statistical results of FPD values for DMC and QR.
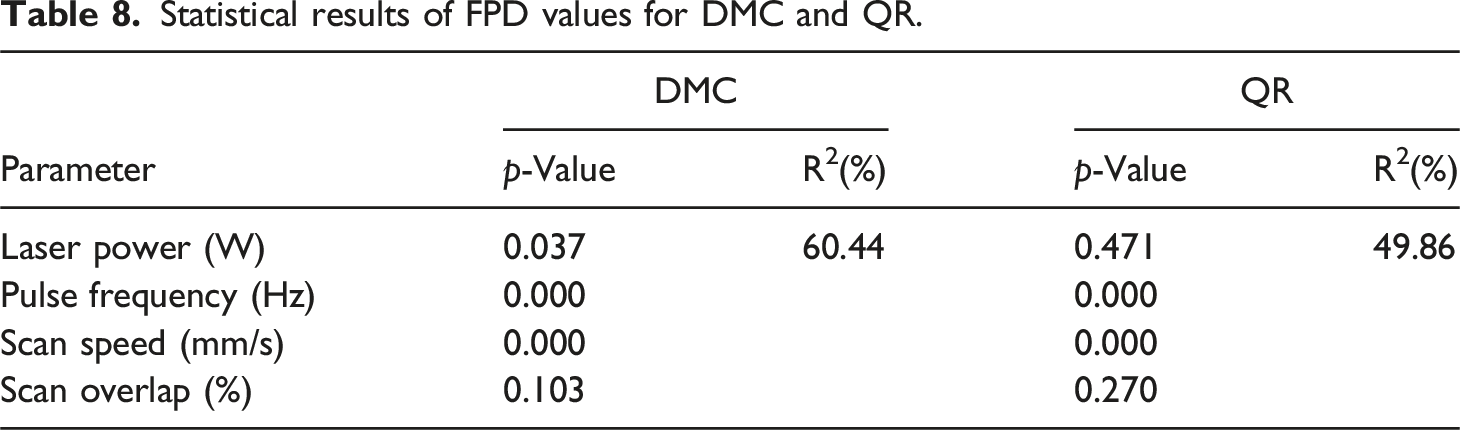
Figure 15(a) shows the ANU trend line for the DMC. Due to the high dispersion of the values and their distance from the mean, the R2 is very low, reaching only 14.41%. Figure 15(b) shows the ANU trend line for the QR. The high dispersion of the values and their distance from the mean makes the R2 very low, reaching a result of only 16.46%. As already mentioned, this proves that the ANU trend line for the QR is not directly related to the scan parameters, but rather to the fixation of the part during the scan, since none of the p-values is less than 0.05. Trend line of ANU results for (a) DMC and (b) QR.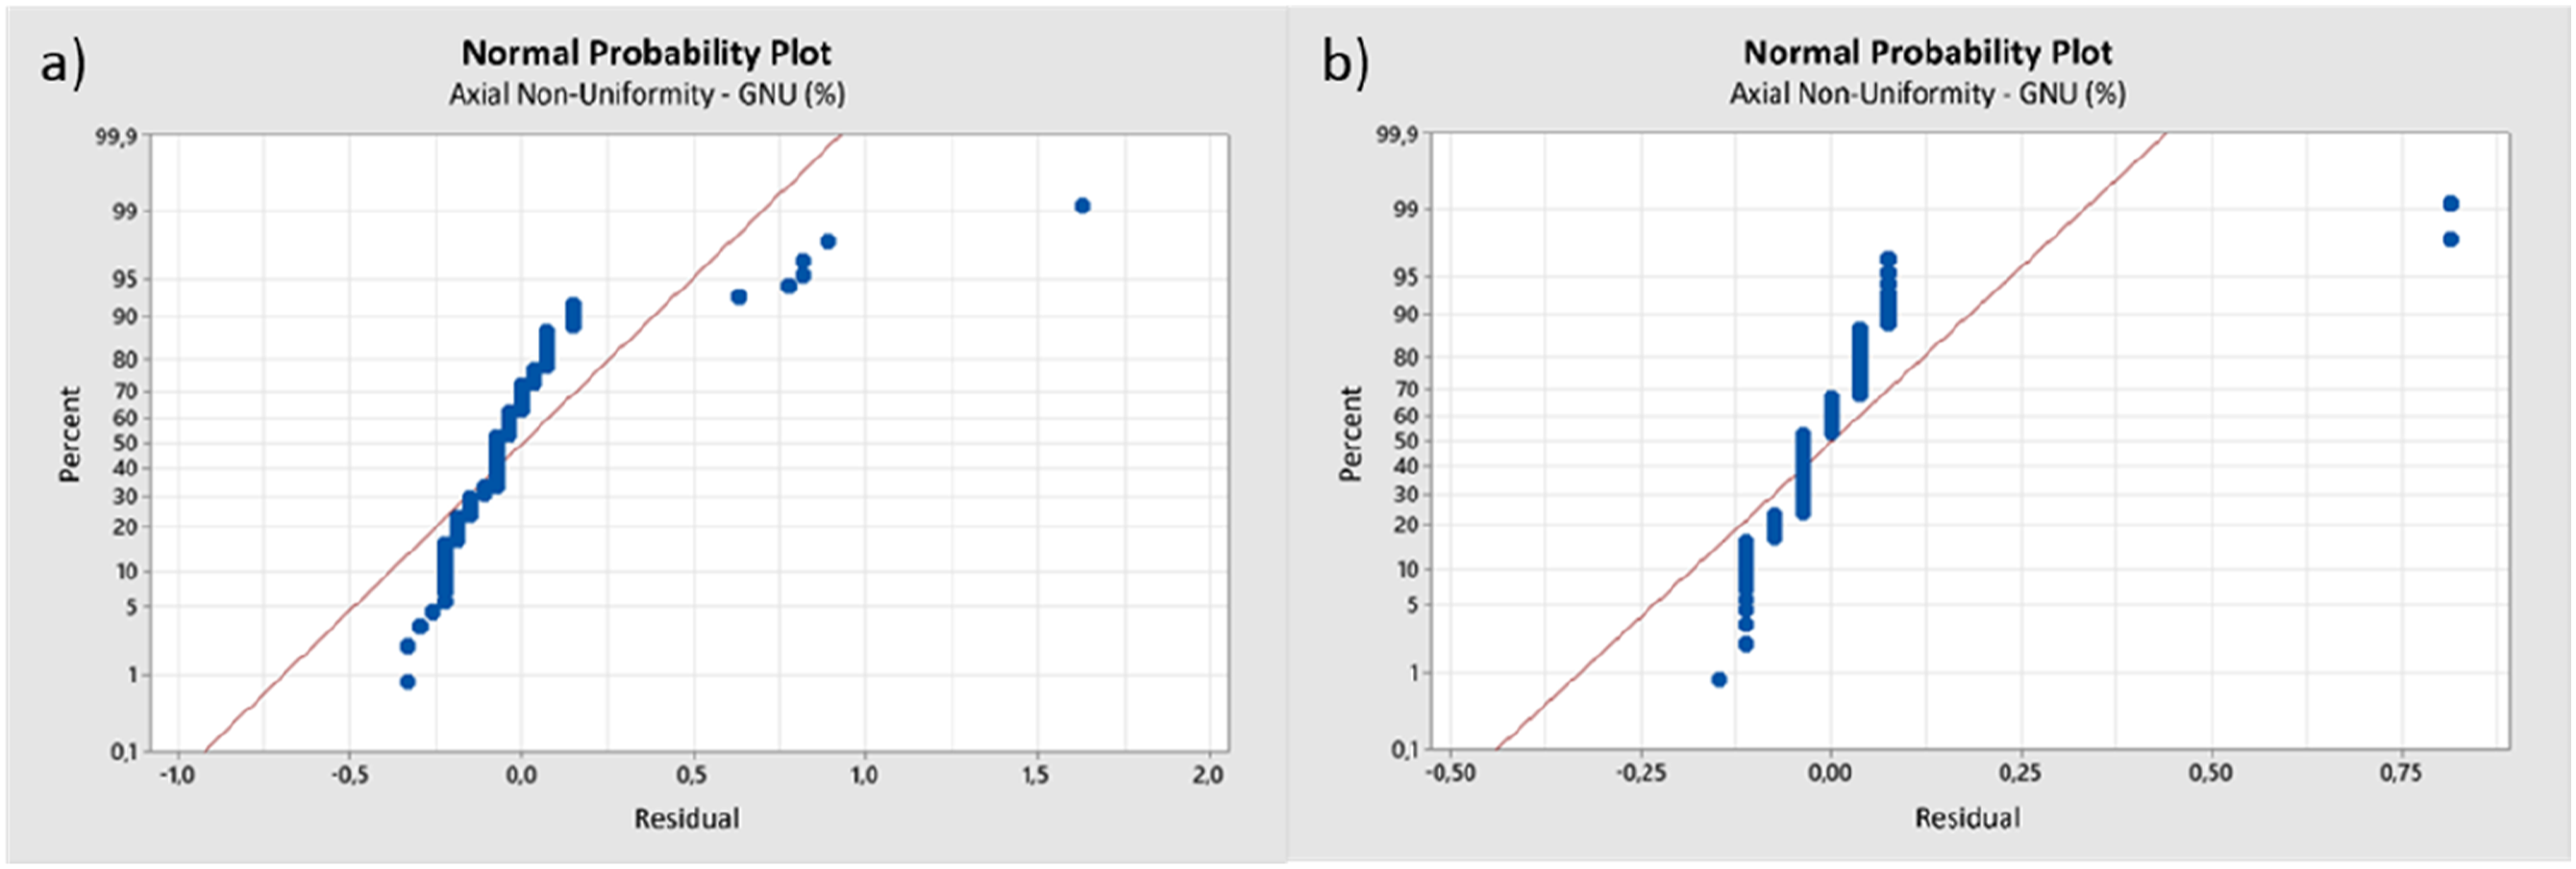
Statistical results of ANU values for DMC and QR
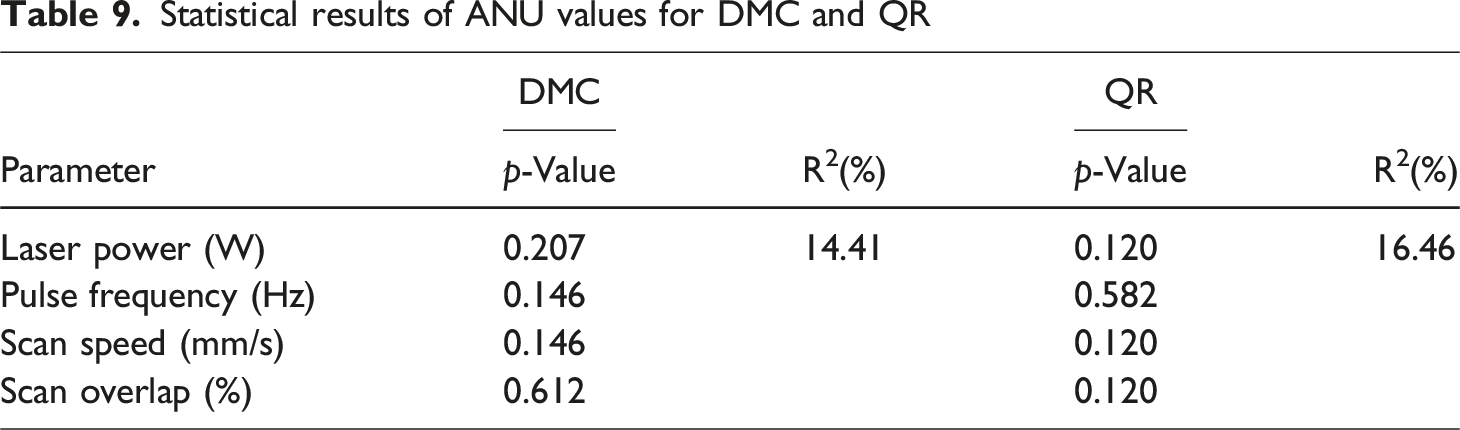
Figure 16(a) shows the GNU trend line for the DMC. According to Table 10, an R2 value of 60.75% is obtained, showing that there is room for improvement in the model. The GNU trend line for the QR is shown in Figure 16(b). As with the previous characteristics, some values are far from the mean line and very scattered, which affects the R2, which in this case is around 45.09%. Trend line of GNU results for (a) DMC and (b) QR. Statistical results of GNU values for DMC and QR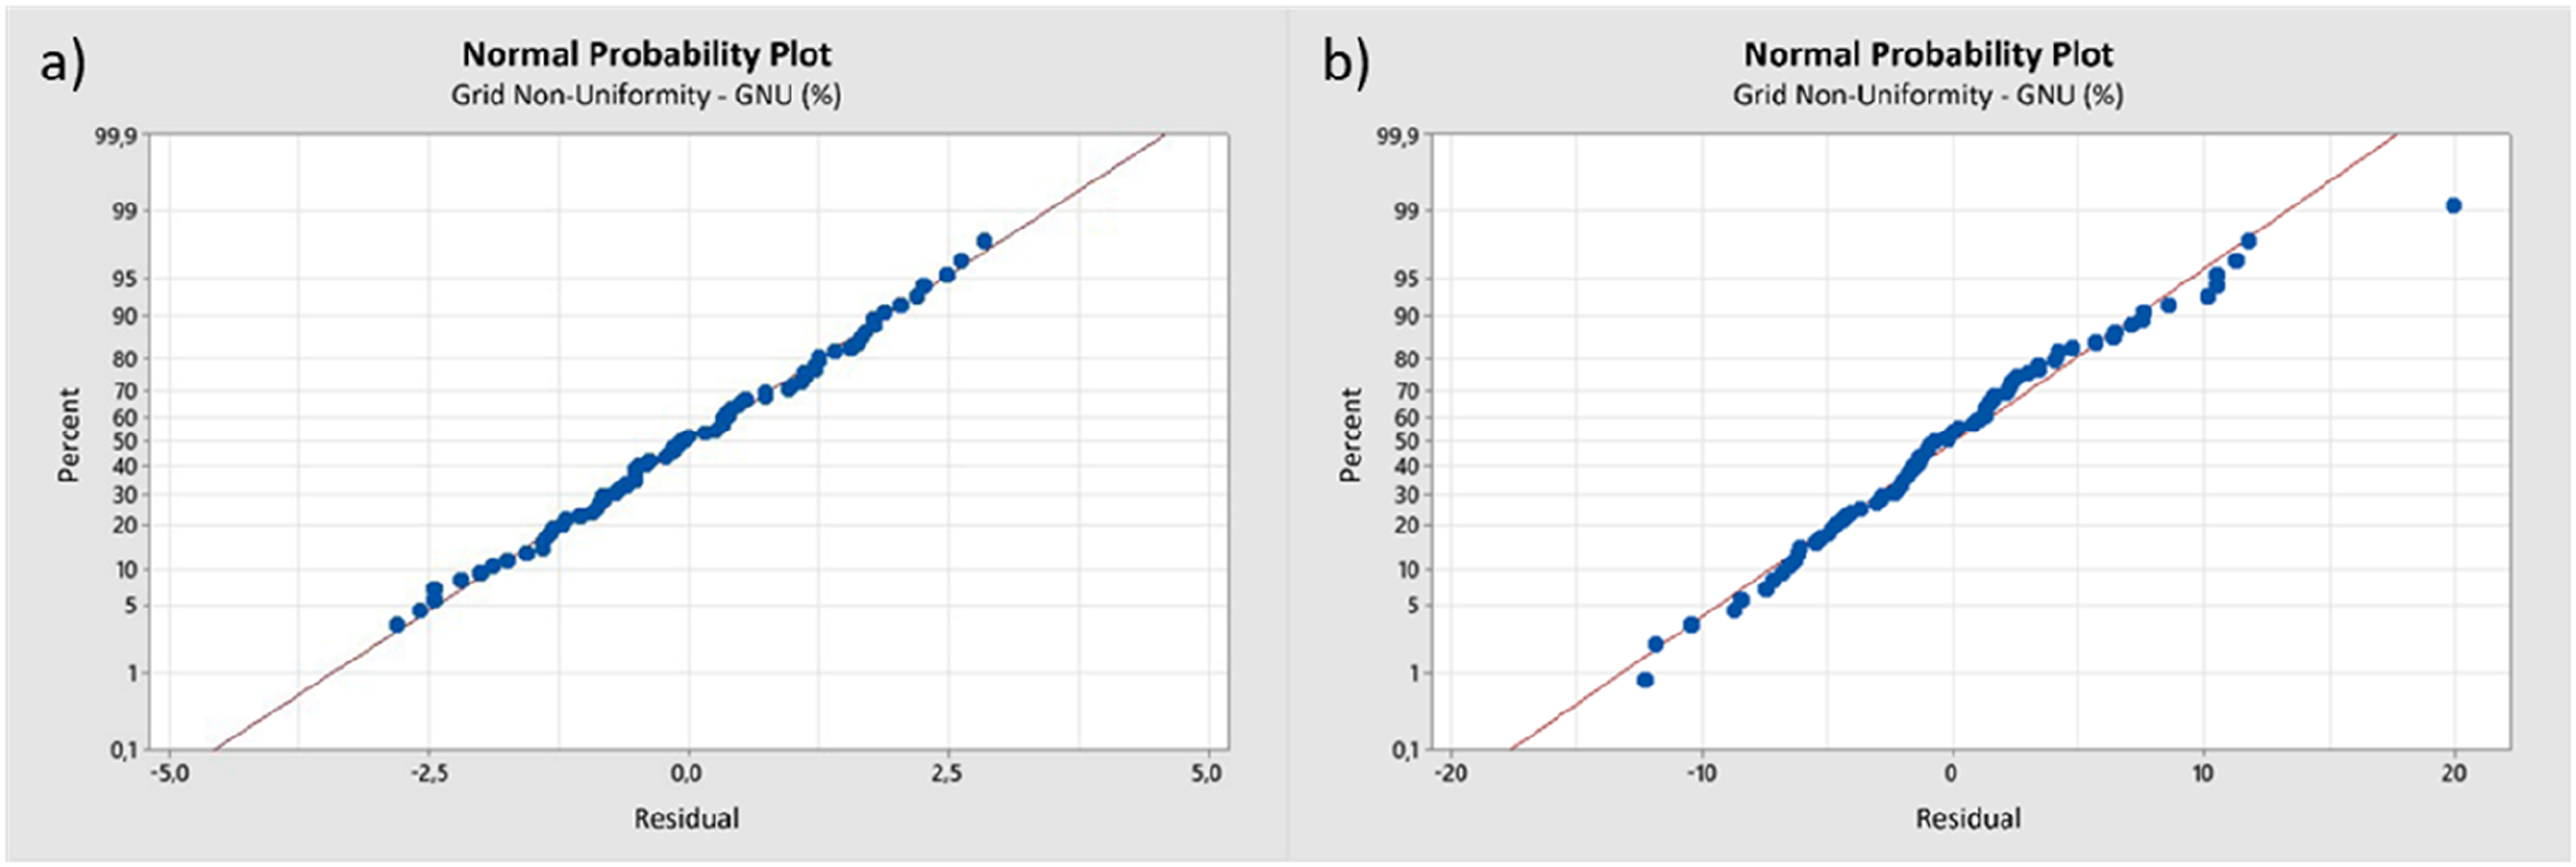
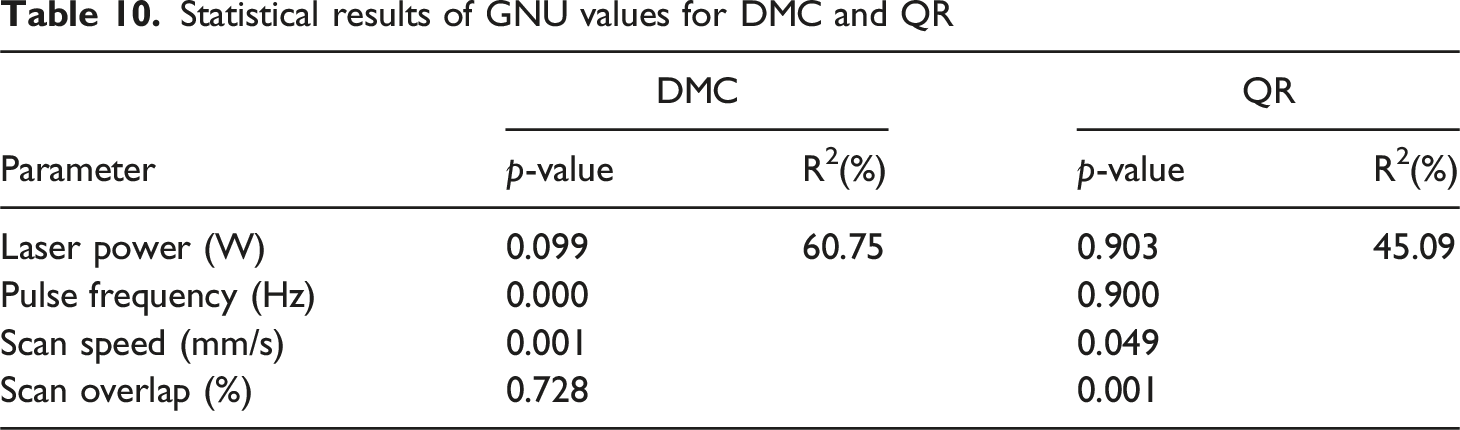
The scan overlap and the laser power do not contribute significantly to the GNU results, as they have high p-values of 0.728 and 0.099 respectively. It should also be noted that the lowest p-values in Table 10 are 0.000 and 0.001 for pulse frequency and scan speed respectively, indicating that these parameters contribute significantly to the DMC function.
In the QR code, the laser power and pulse frequency do not contribute significantly to the GNU results, with high p-values of 0.903 and 0.900 respectively. It should also be noted that the lowest p-values in Table 10 are 0.001 and 0.049 for scan overlap and scan speed has a greater impact on the results.
Regarding the quality of the DMCs, the optimal laser marking parameters are not close to the values recommended by the manufacturer. Through statistical analysis, it was possible to determine the set of parameters that gave the best result for each characteristic of the code. In the case of DMC, a set of parameters was found that gave the best results in almost all characteristics except GNU. On the other hand, in the case of QRs, only the scan overlap should be changed to values higher than those recommended by the manufacturer to obtain the optimal parameters. In the case of the DMCs, statistical analysis was used to determine the set of parameters that gave the best result for each feature of the QR. In the case of the QR, given the complexity of this type of code, due to the module number and the information contained, it was not possible to determine a set of parameters that would allow the best results to be obtained in almost all the characteristics. However, it is used as a reference for the parameters that allow maximizing the overall quality results, thus obtaining a relationship. It is also possible to work on the parameters to improve certain characteristics required by the QR codes.
Best conditions for laser marking according to the DoE factorial: (a) DMC and (b) QR.
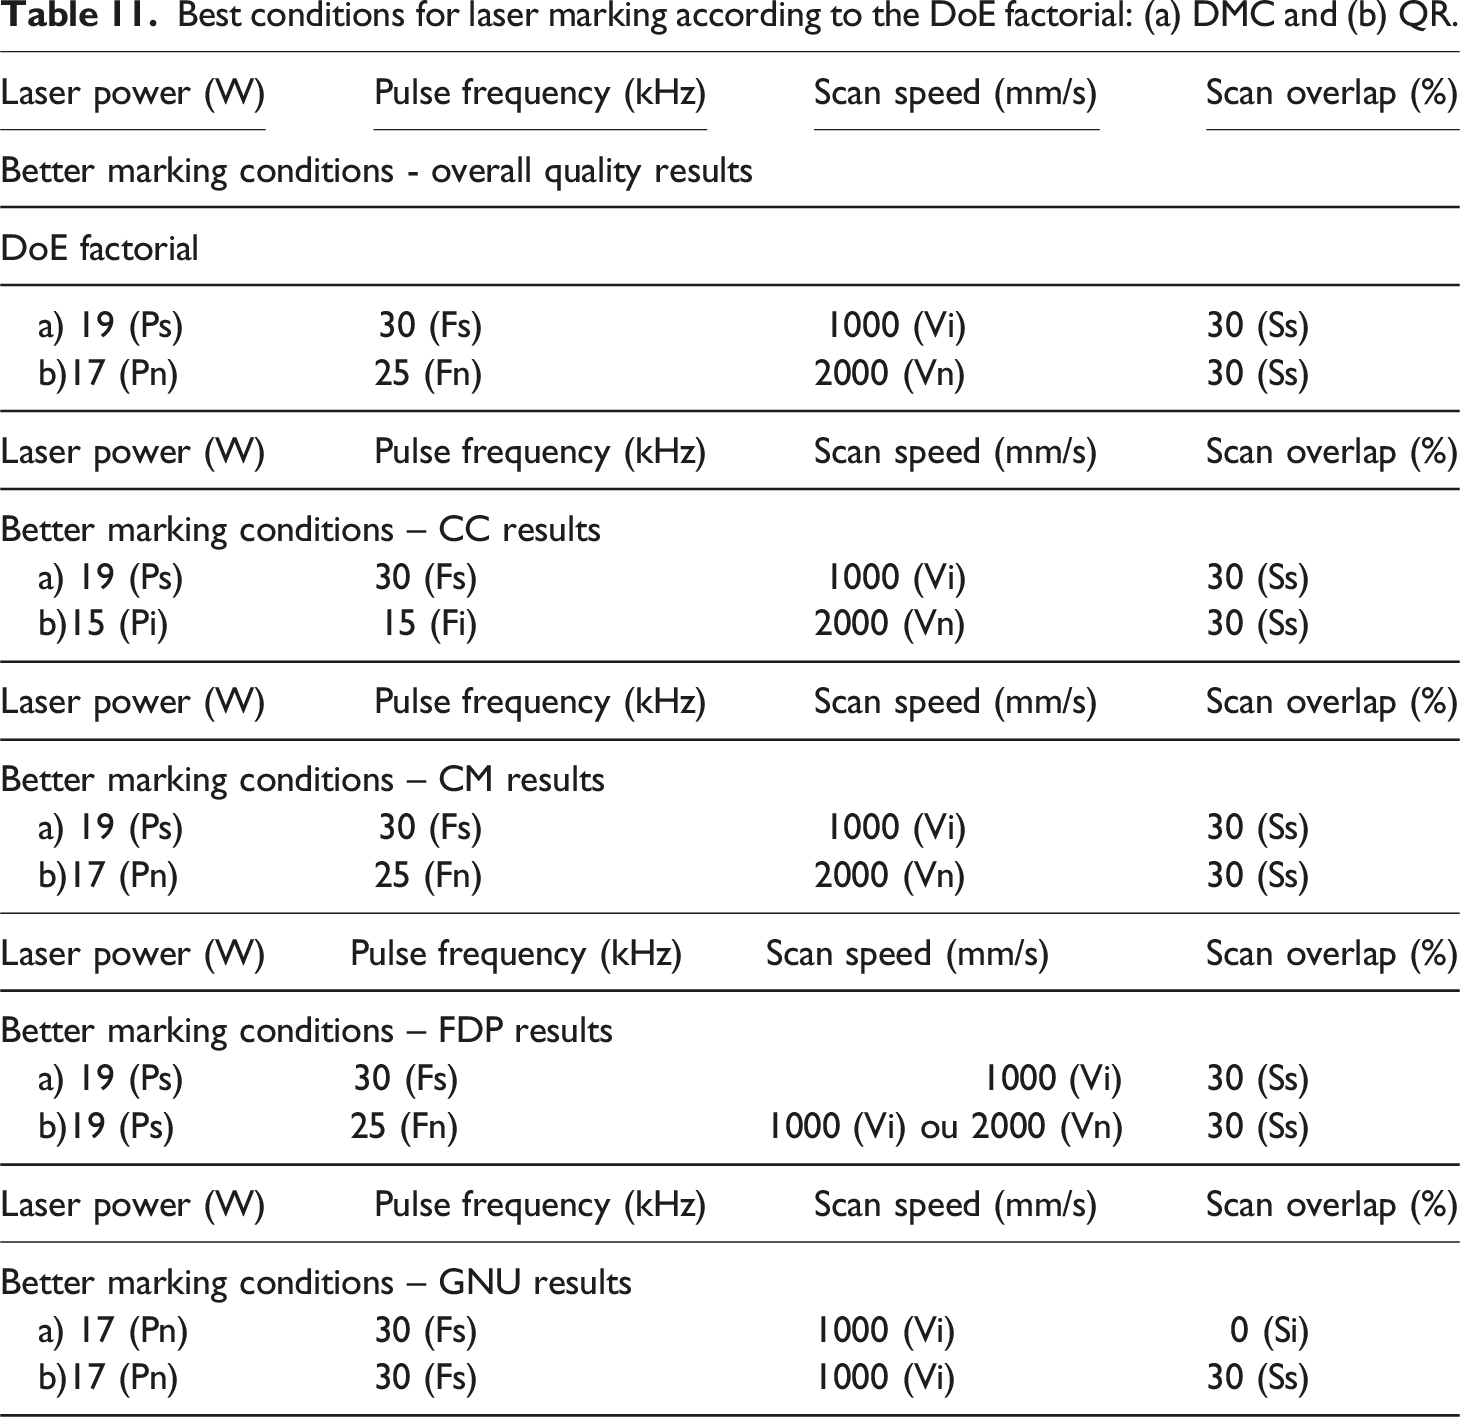
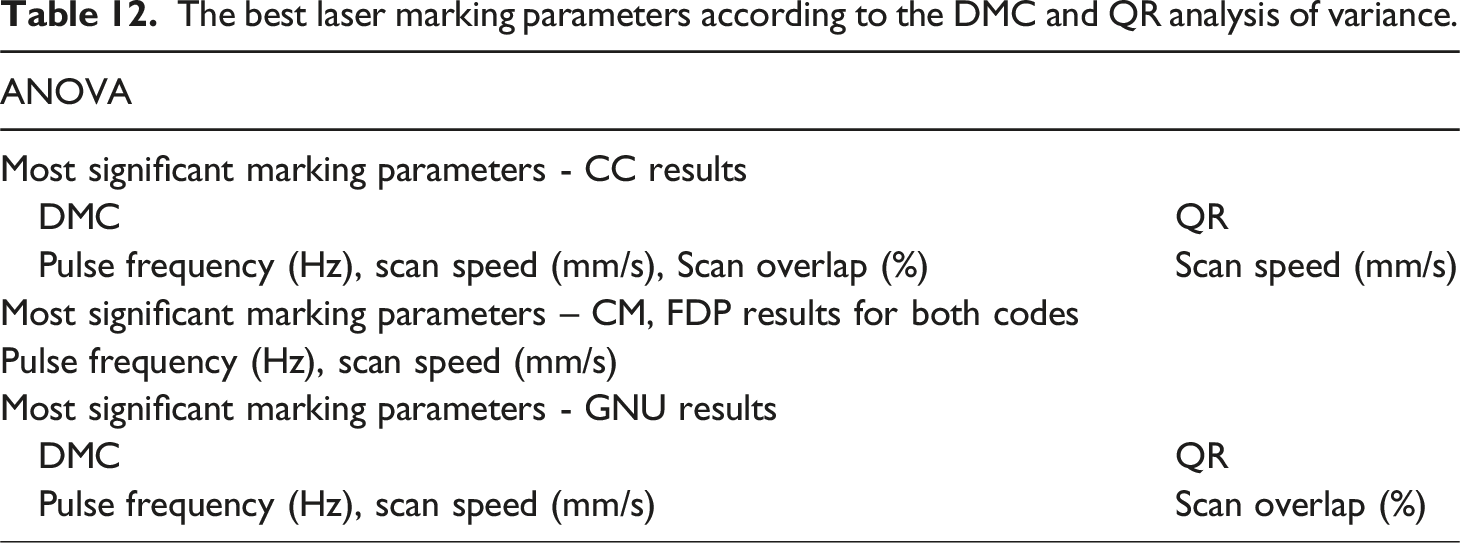
The best laser marking parameters according to the DMC and QR analysis of variance.
Analysis of the marked surface on samples using SEM and EDS techniques
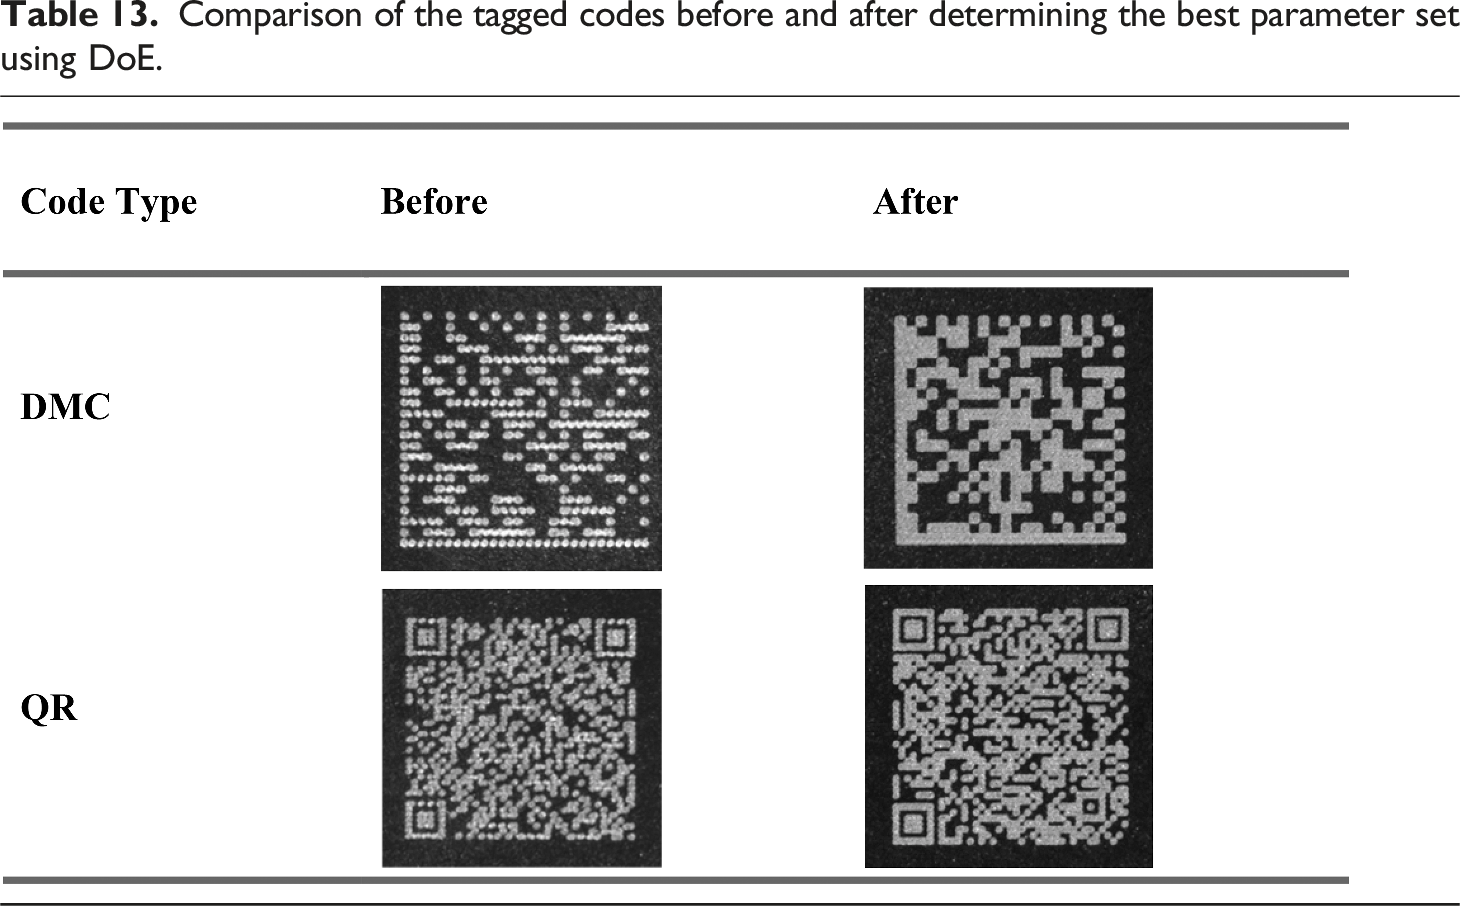
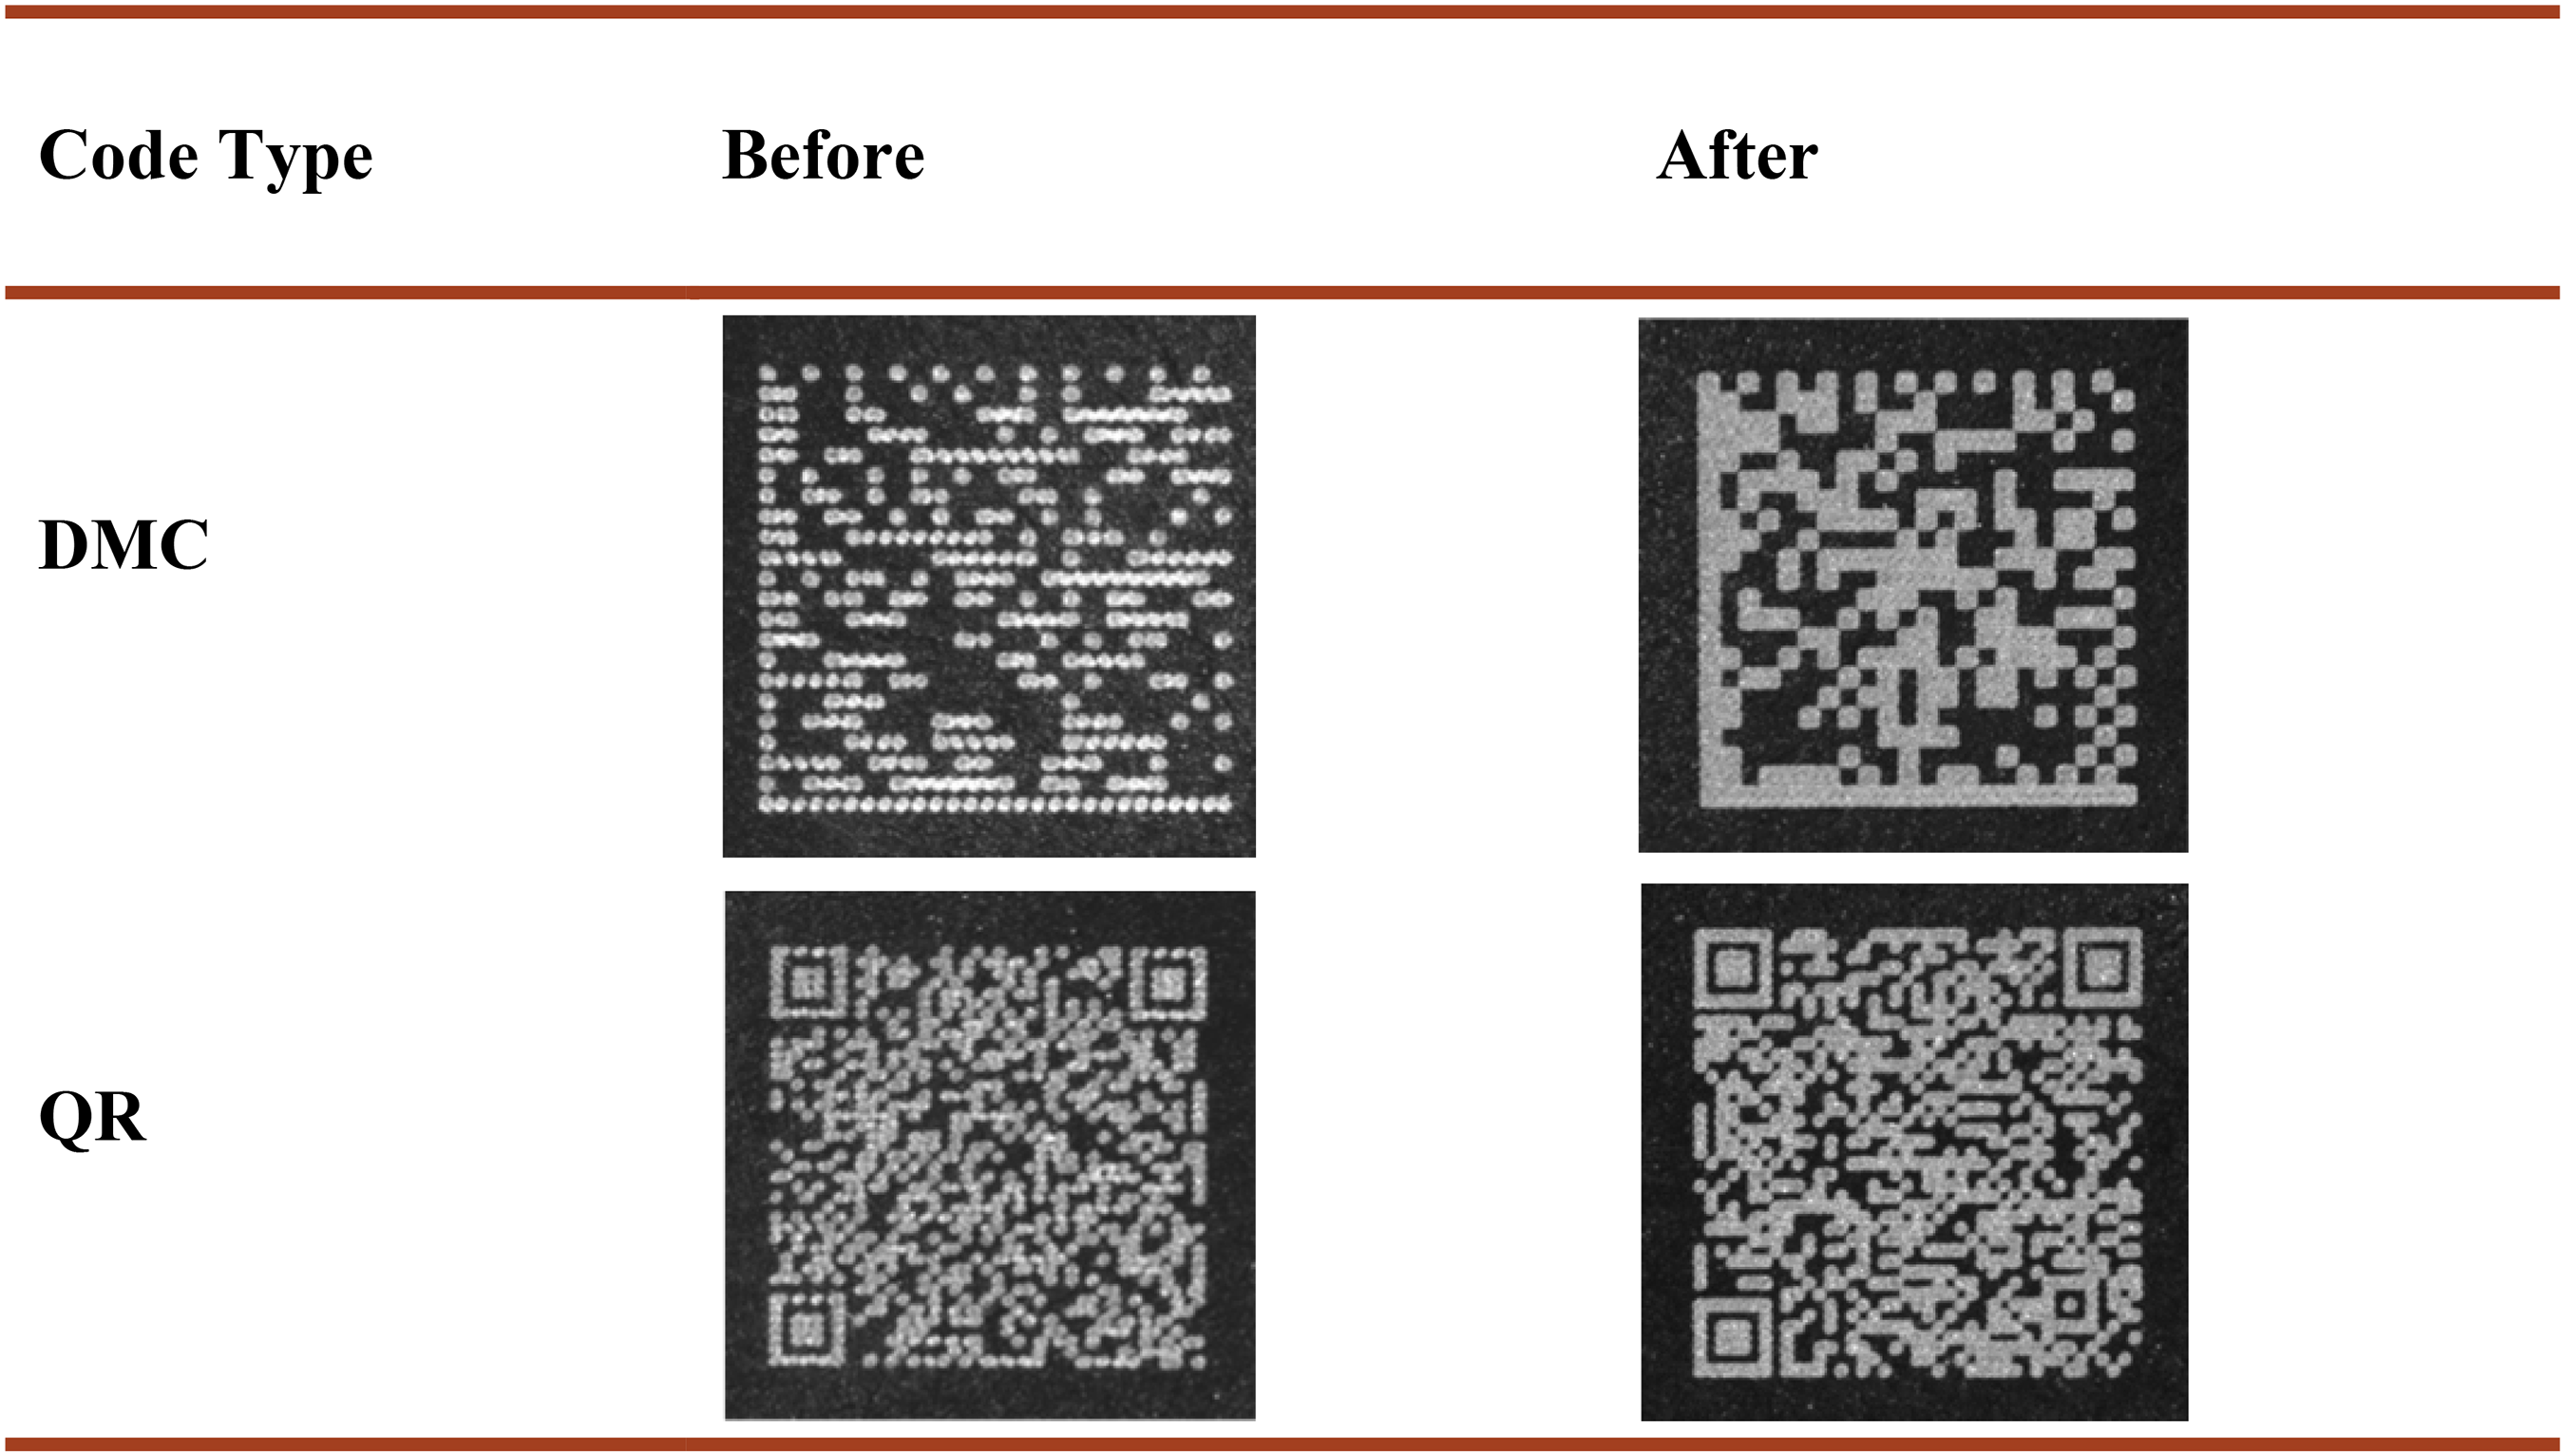
Comparison of the tagged codes before and after determining the best parameter set using DoE.
Following the laser marking quality tests, the marked surfaces of samples were analyzed in detail using SEM techniques. Only DMCs were chosen as references. Since scan overlap is not a parameter that significantly affects the quality of the marked codes, not all samples were submitted for analysis, but only the samples with the following characteristics: (i) the sample with the best or worst quality obtained by the code verifier; (ii) a sample without laser marking, and (iii) samples with nominal scan overlap, but with laser power, pulse frequency, and scan speed at minimum, nominal and maximum levels.
The material surface of a sample without laser marking (Figure 17(a) and (b) was analyzed in the first step and compared to a sample that had laser marking (Figure 17(c) and (d)). The marked sample (Figure 17(c)), which is uneven from the laser beam’s passage, has a more uneven surface than the unmarked sample (Figure 17(a)). Certain gaps in the polymeric matrix are apparent when the image of the unmarked sample’s surface is magnified 1kx (Figure 17(b)). These gaps are caused by the pellets expanding during the injection process. Two prevalent occurrences in high-speed injection molding could make these faults worse: particles on filled polymer materials and/or mold temperature. In this process, the reinforcing fibers and particles obstruct the flow of the matrix polymer material during the filling and packing processes. Inadequate contact between the matrix polymer component and the mold surface causes uneven, white marks .
50
During filling, the polymer melt rapidly cools and hardens and loses a significant amount of fluidity when it comes into contact with the cold cavity surface .
51
As a result, the polymer matrix becomes porous (see white circles in Figure 17(b)) and the glass fibers become visible (see yellow arrows in Figure 17(d)). SEM analysis of PBT/glass fiber composite surface, comparison between a sample without laser marking (a), (b) and with laser marking (c, d).
49
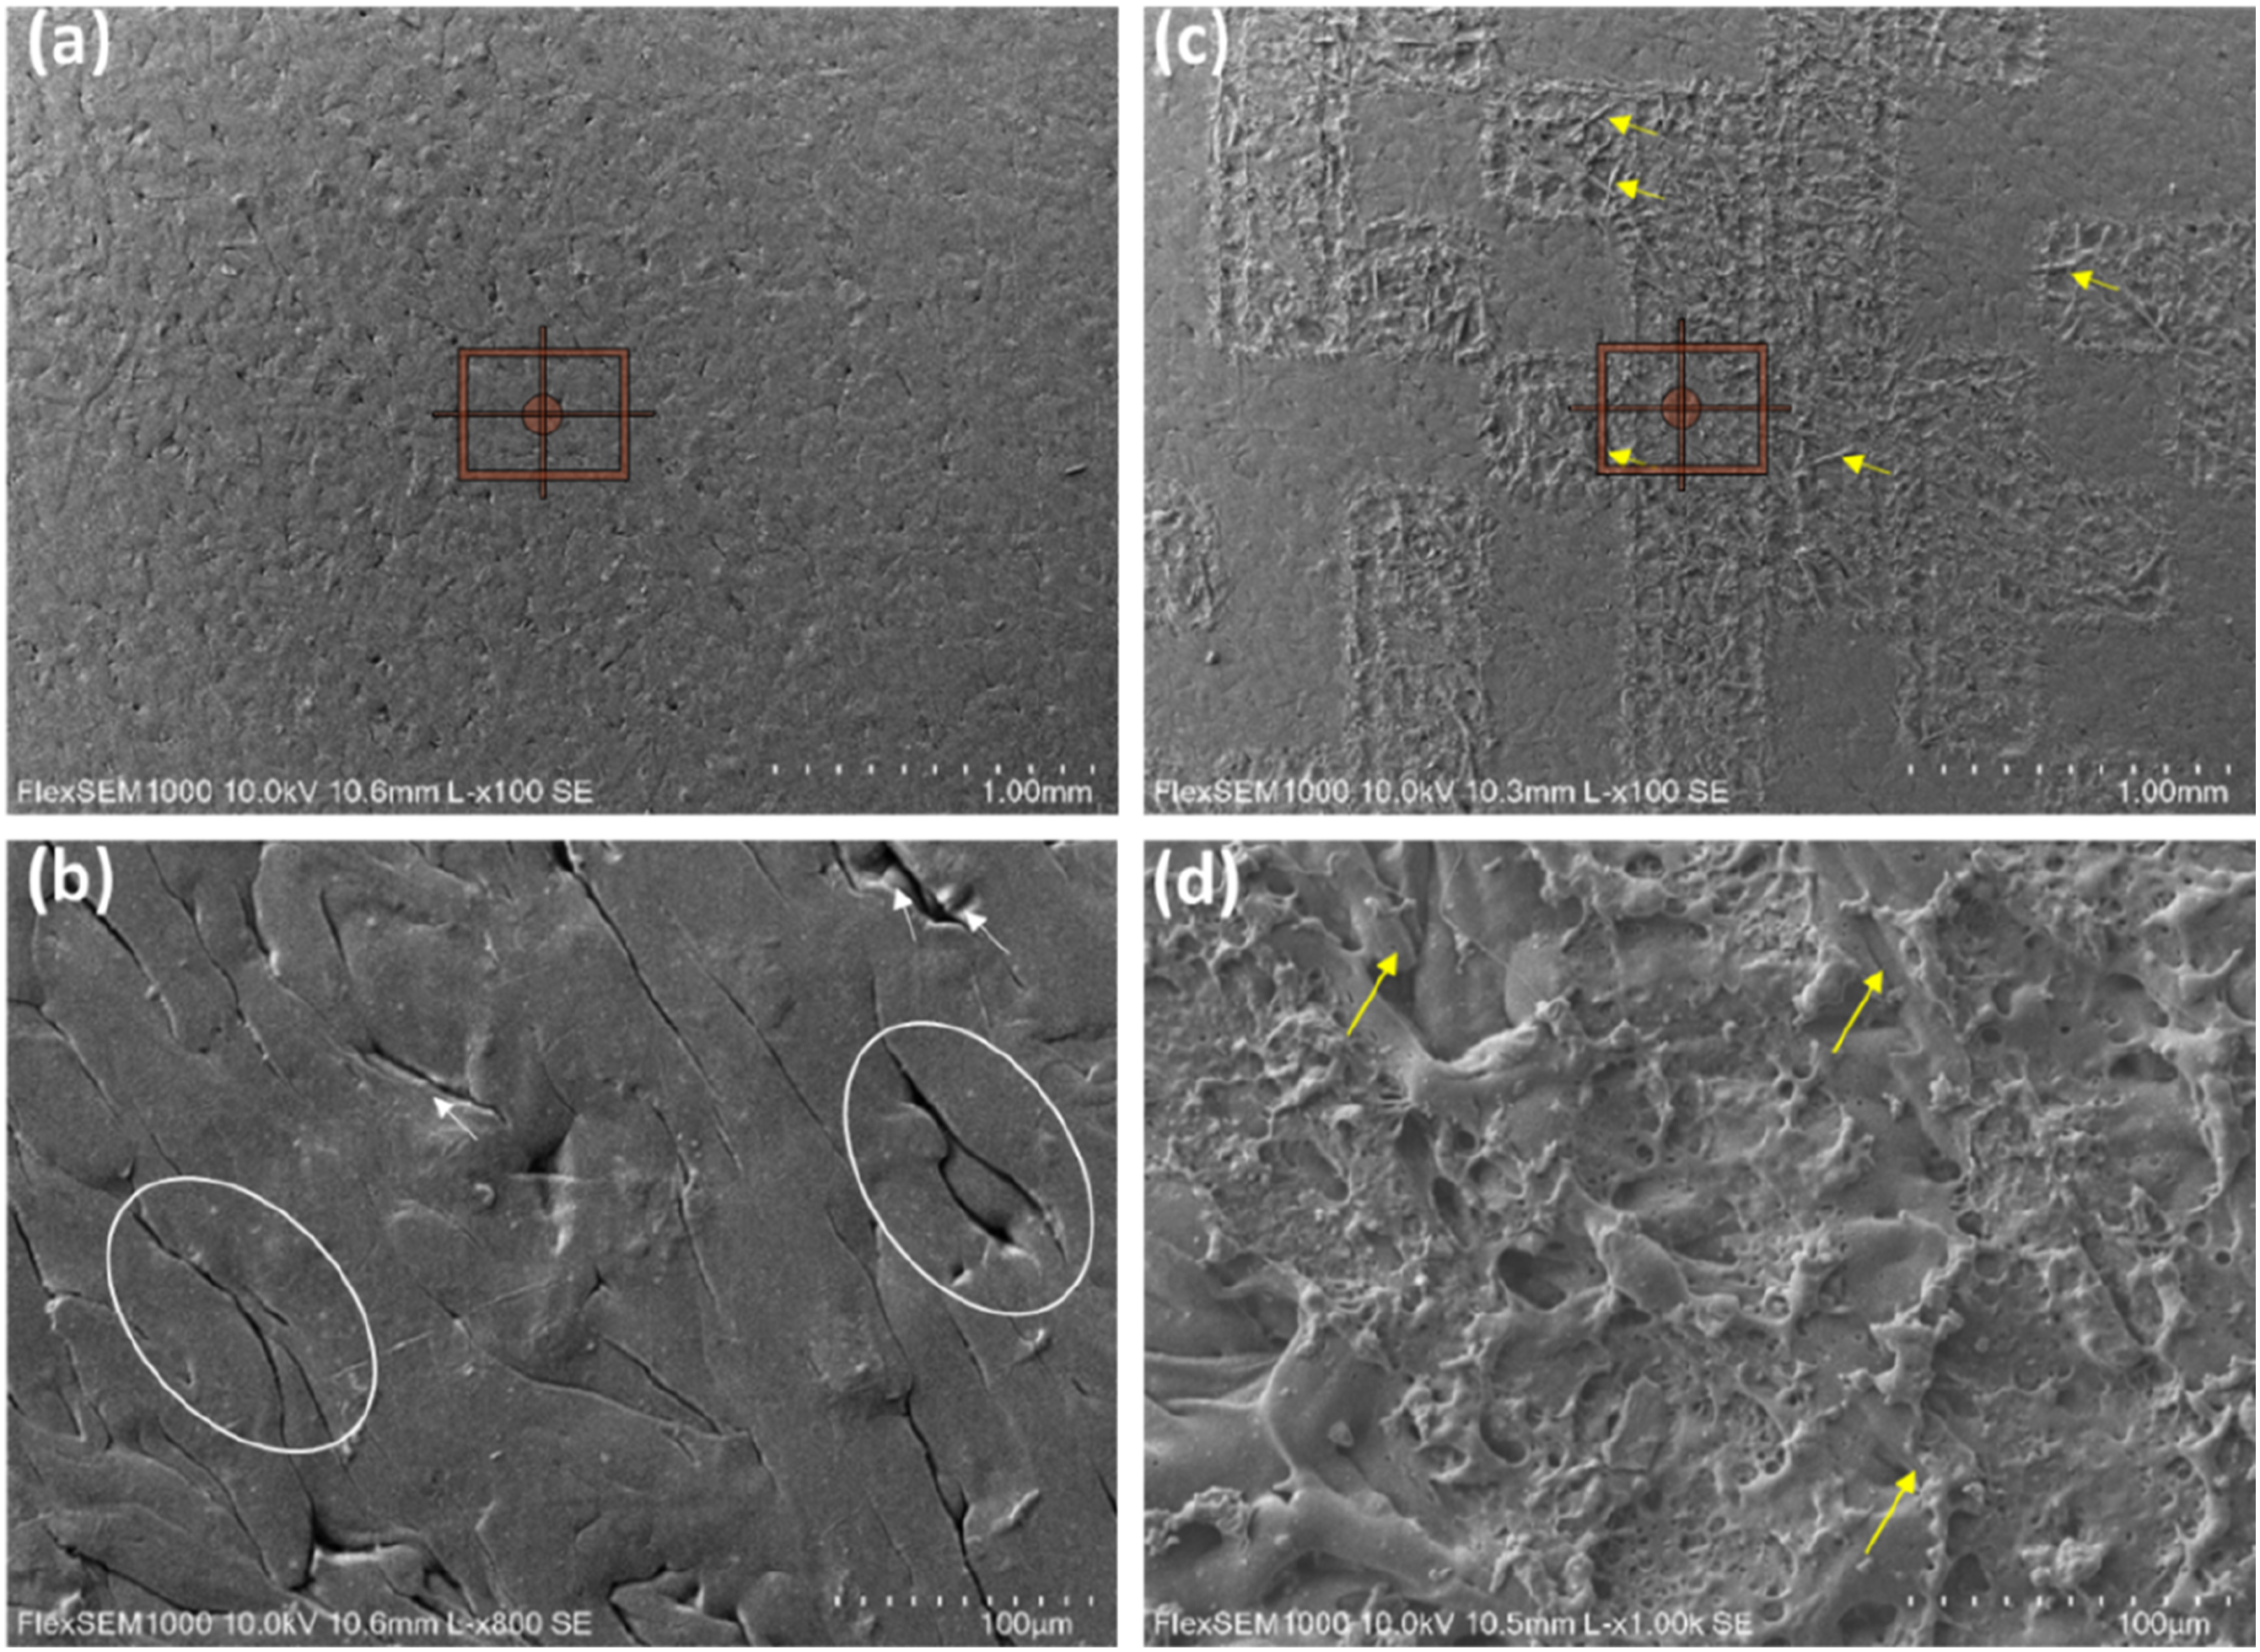
Figure 17(c) and (d) show the sample surface after the laser marking operation. Following code creation, some glass fibers are exposed, as shown by needle features indicated by yellow arrows in Figure 17(c). Figure 17(d) shows a laser marking area magnified 1000 times. These images show the rough surface caused by the melting of the polymer matrix, which is represented by depressed holes and uneven protrusions. 52 The melting of the polymer matrix caused by laser action in contact with the surface exposes the small glass fibers utilized as reinforcement in this composite material, as seen by the yellow arrows (Figure 17(d)).
This phenomenon happens when chemical components that can absorb laser light and change the environment in which it is entered are added to polymers in order to have a good reaction within the laser marking parameters. The material under analysis, Ultradur® B 4406 G6, PBT-GF30 FR (17) (BASF), 33 has a Material Safety Data Sheet that states that it is made up of 49% polybutylene terephthalate (PBT), 30% glass fiber, 1% carbon black, 5.5% antimony trioxide (Sb2O3), and 13% halogen (13%), which is a fire retardant. It is widely known that adding antimony compounds—like antimony trioxide (Sb2O3)—to halogen-containing substances results in a potent synergy. As the primary flame retardant, bromine is often used in conjunction with antimony trioxide as a synergist. 53
After the sample surface was laser marked, the dark grey and light grey patterns shown in Figures 18 and 19 are visible. The reason for this variation is the impact of the laser on the sample surface; the light grey pattern denotes locations where the sample has been impacted by the surface effect of the laser, while the dark grey pattern indicates areas where the sample has not been subjected to the laser. These patterns could be recognized as black areas where the laser has not interacted with the material and light areas where the code has been marked using the Verifier apparatus (Tables 5 and 13). SEM images of Sample 63 (a) 1 mm; (b) 100 μm. Laser marking parameters: Laser power: 19 W, pulse frequency: 30 kHz, scan overlap: 30%, and scan speed: 1000 mm/s. Adapted from.
49
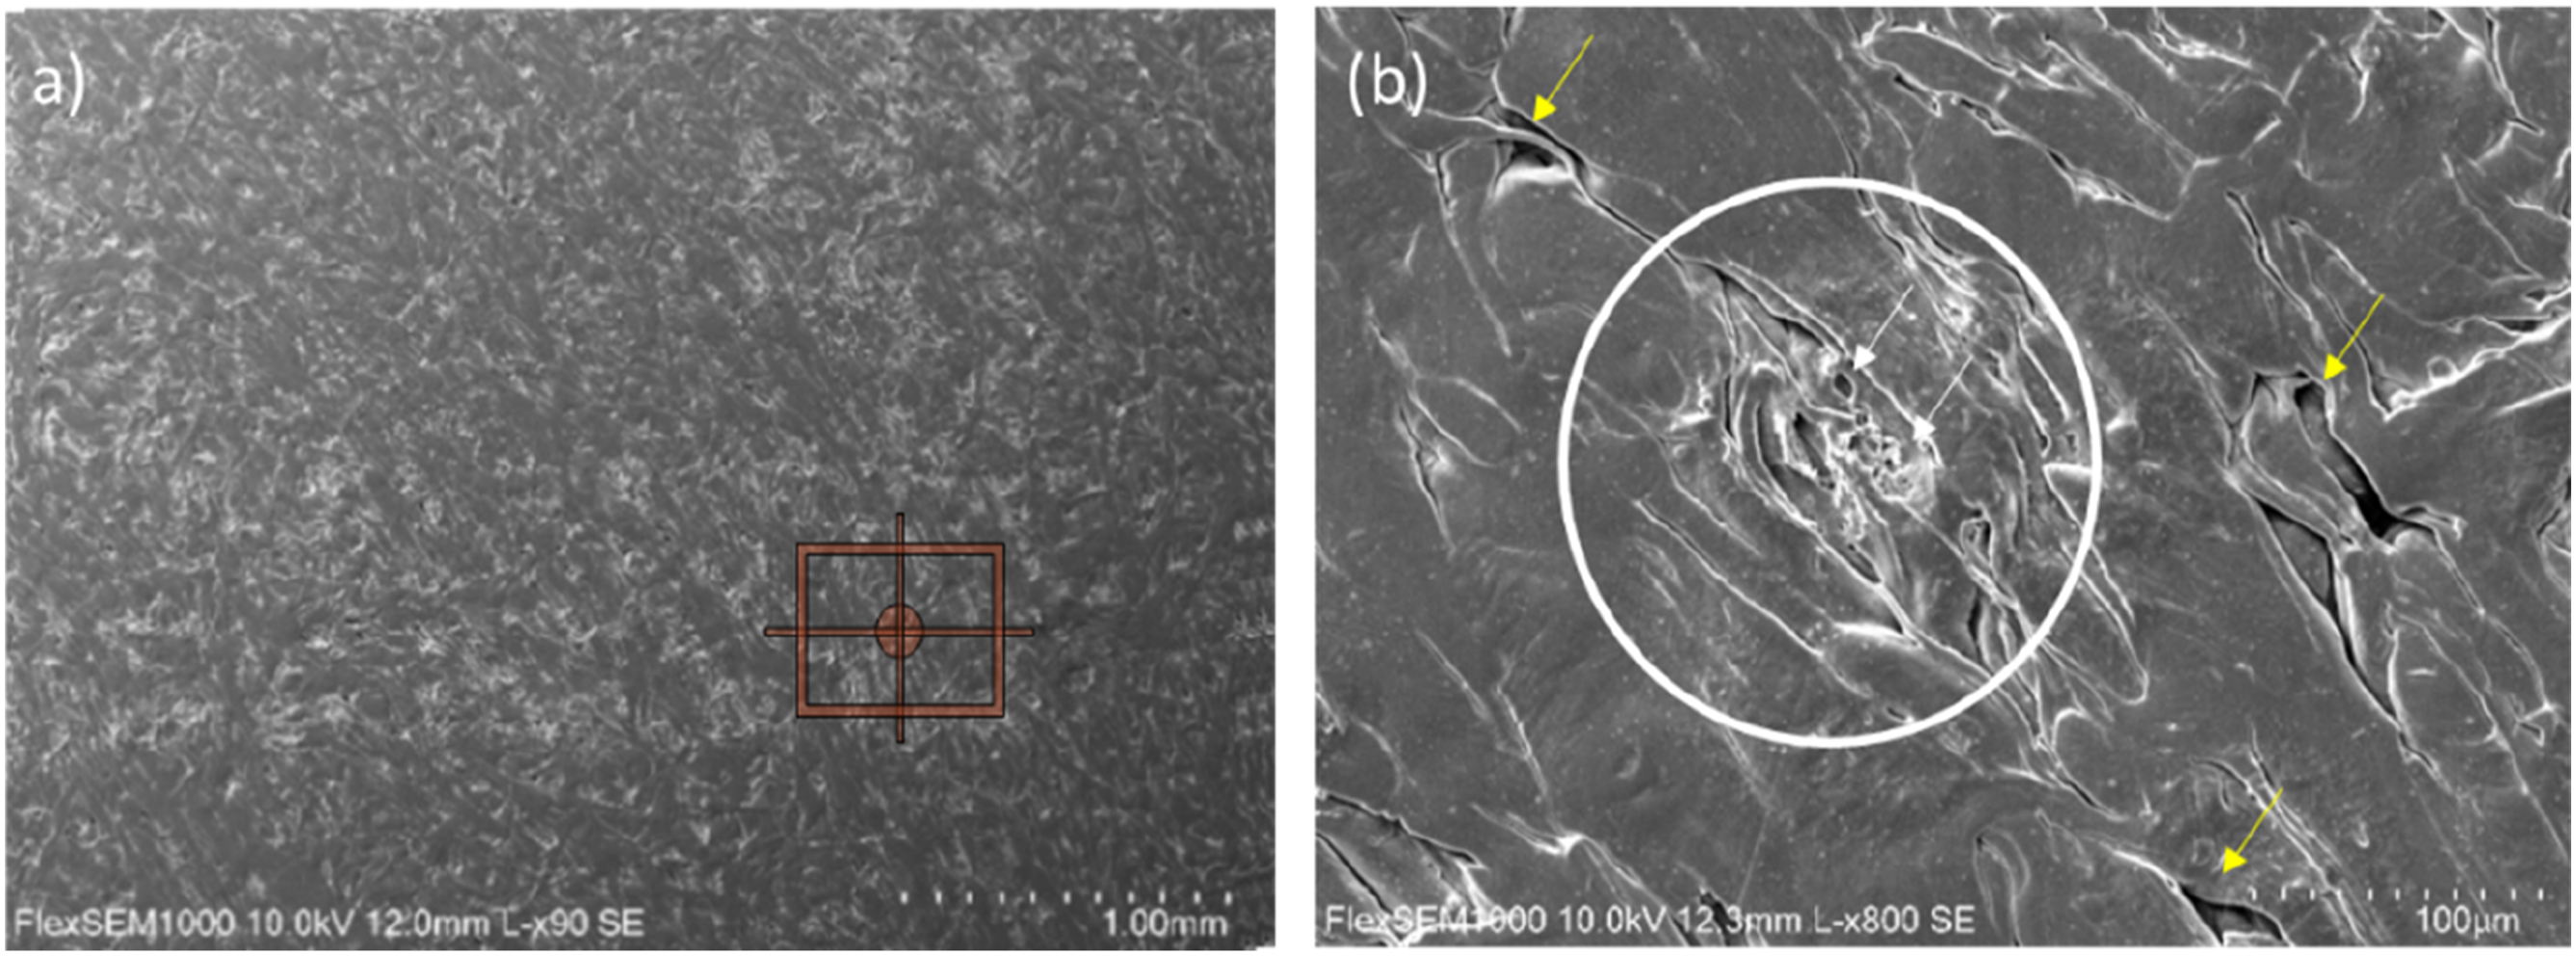
SEM images of Sample 37 (a) 1 mm; (b) 100 μm. Laser marking parameters: Laser power: 15 W, pulse frequency: 15 kHz, scan overlap: 0%, and scan speed: 3000 mm/s. Adapted from.
49
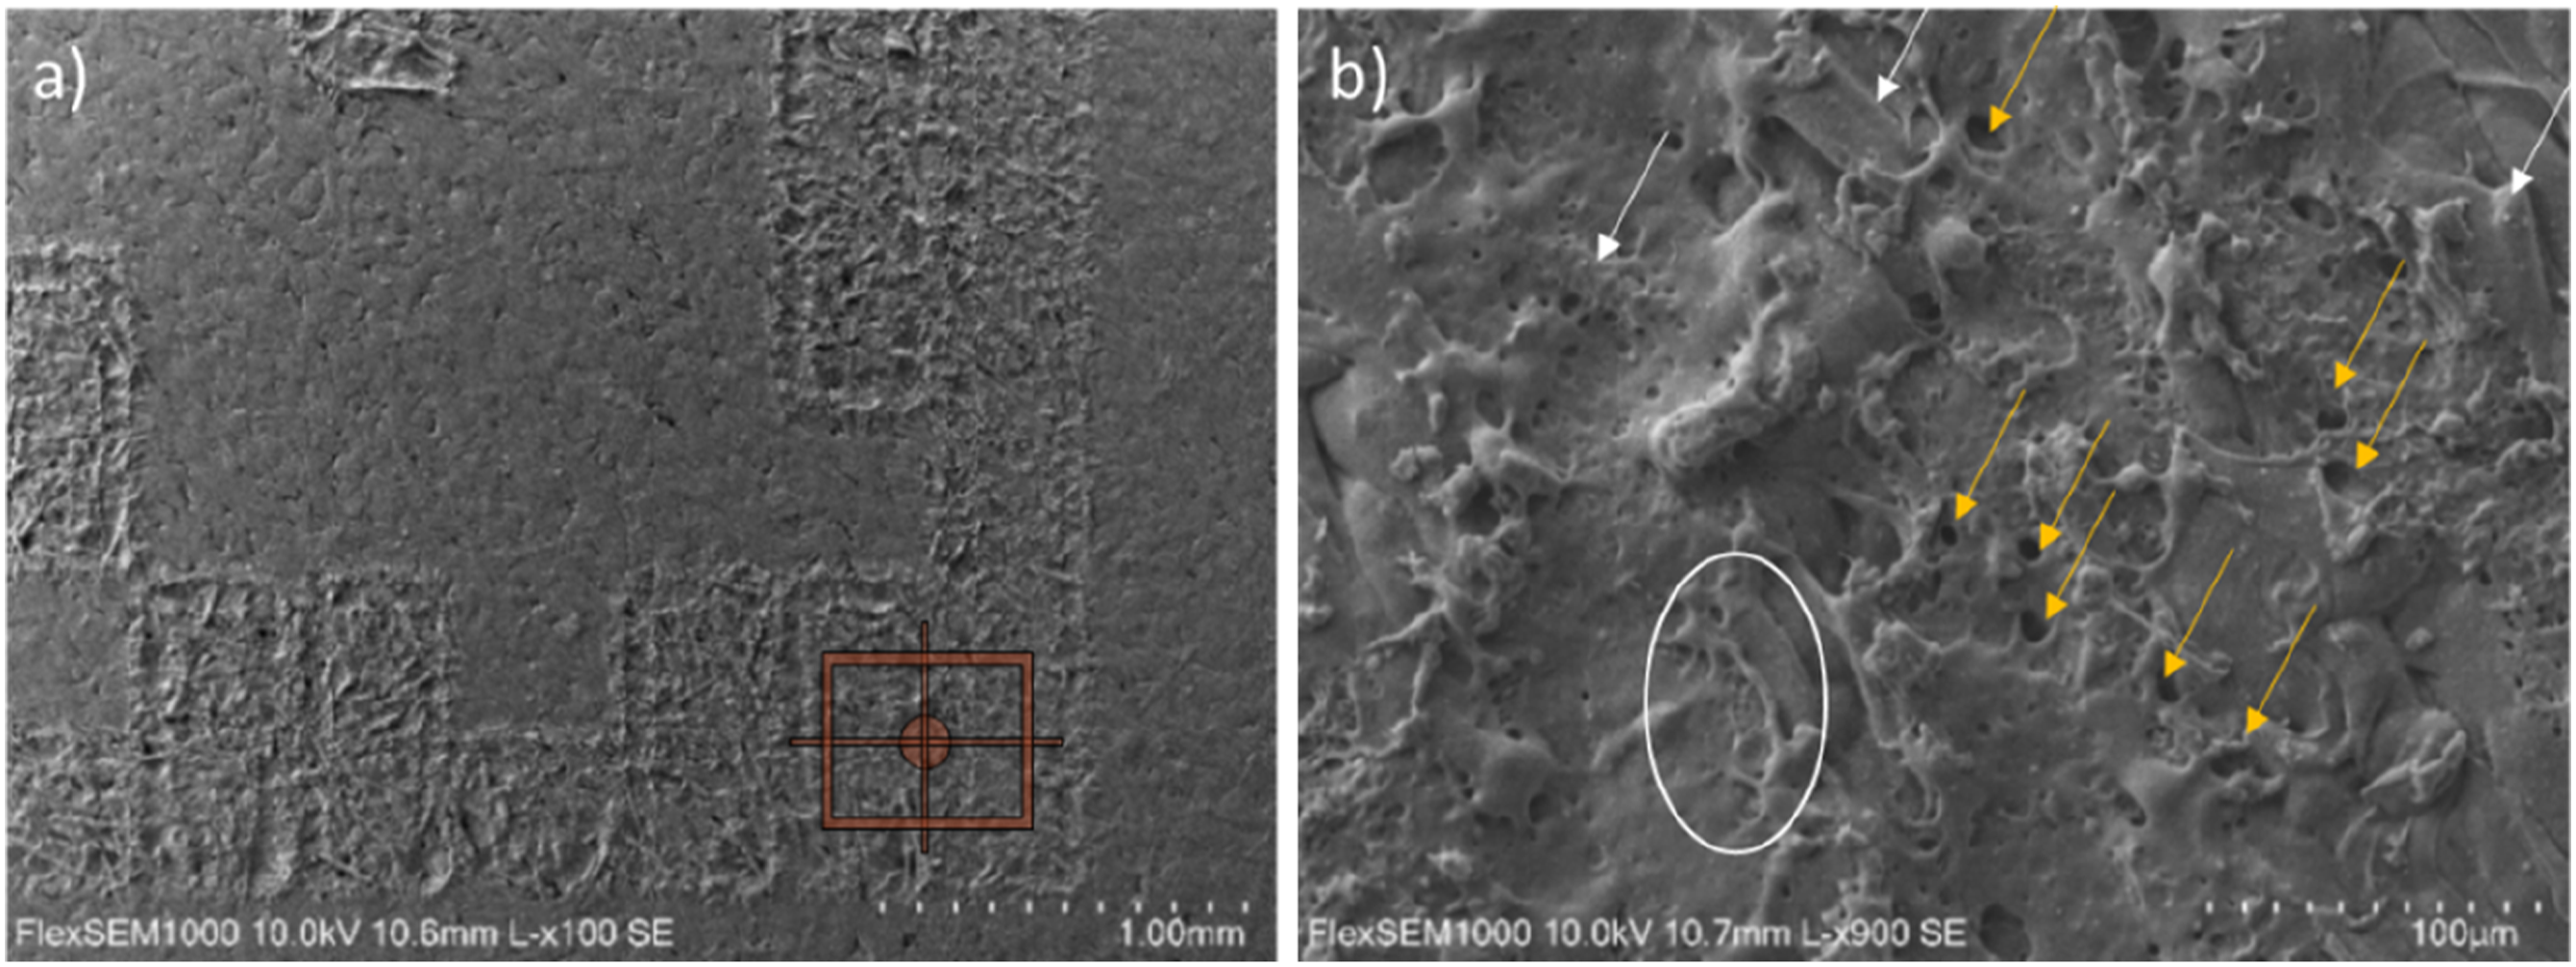
Comparing the surface of sample 63 (Figure 18) with sample 37 (Figure 19) using the SEM technique, it can be seen that when the pulse frequency, laser power, and scan overlap are increased to levels above those recommended by the manufacturer, and the scan speed is set to levels below those recommended, the surface is more etched and the marking becomes more visible and continuous due to greater interaction of the laser with the material. The total number of pulses determines how much matrix is eliminated. The glass fibers became more visible as the number of laser pulses increased. 52 On the other hand, during the marking process, the glass fibers can absorb and increase local energy and transform it into heat. This will facilitate the surrounding heating process and promote the melting of the polymer in the vicinity. 54 The temperature released by the 250°C laser is not high enough to modify the surface of the glass fibers.49,54
The sample 63’s surface, which has the highest quality code out of the sample set, is depicted in Figure 18 following the laser marking procedure. It is possible to see the distinction between marked and unmarked surfaces in this sample. With a continuous marking showing numerous regions with deformed polymer due to melting from the interaction with the laser (i.e., inside the white circle), black dots denoting the formation of deep pores (yellow arrows), and exposure of fibers (white arrows), the surface resulting from the combination of parameters appears to be more etched by the laser. These surface features are seen in Figure 18(b).
In contrast, sample 37’s surface, represented in Figure 19, has the lowest quality code out of all the sample sets. It is impossible to distinguish between the marked and unmarked surfaces in this sample. The combination of settings produces a faded marking and a surface look with minimal modification (Figure 19(a)). The material has an almost homogenous smooth surface with some injection defects (yellow arrows) in Figure 19(b), which shows, at greater magnification, a slight deformation on the PBT matrix surface (inside the white circle) with some superficial porosity (white arrows).
Mass concentration of each chemical element contained in the sample surface before and after the laser marking process.
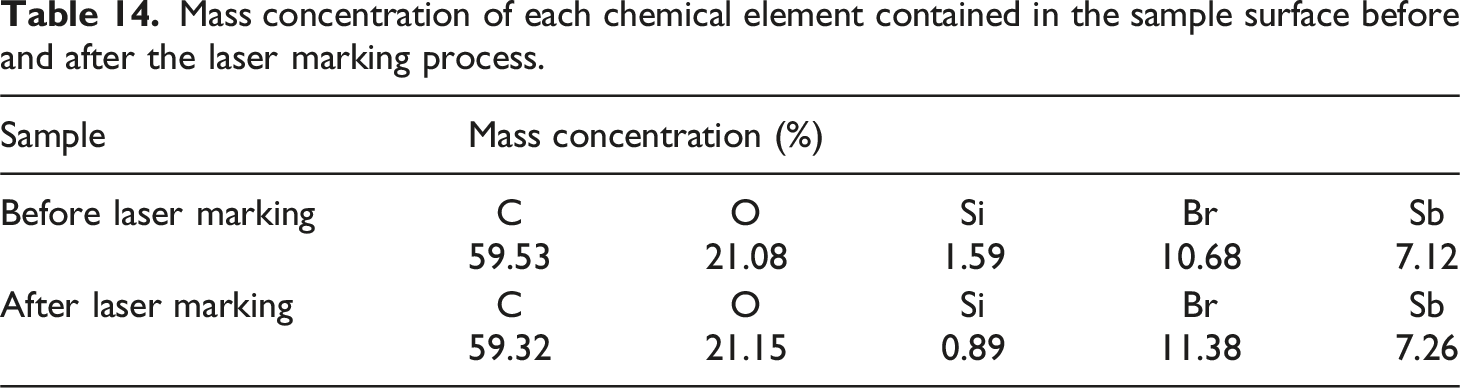
EDS examination allowed to detect the presence of Sb and Br compounds on the PBT composite, as Table 14 illustrates. As previously indicated, these additives improve the laser marking process by melting the polymer matrix, heating the surrounding area, absorbing laser energy, and converting it into thermal energy. Cheng et al.’s 55 laser marking studies of TPU/Sb2O3 composites revealed a similar phenomenon. Sb2O3 particles absorb the laser during the laser marking process and convert it to thermal energy. An XRD analysis shows that Sb2O3’s crystal structure remains unchanged, suggesting that the material is not broken down but rather melts and evaporates.
As mentioned by the manufacturer, carbon black is also present in the polymer matrix but was not separately identified by the EDS technique. The carbon black also improves the marking contrast, it absorbs the laser light and converts it into thermal energy, increasing the local temperature in the polymer matrix and contributing to its melting. This finding confirms that carbon compounds enhance the heat conductivity of PBT composites, as reported by Yenier et al. 29
Conclusions
This work investigated the code quality on Ultradur® B 4406 G6, PBT-GF30 FR surface obtained by laser marking process using an Nd: YAG laser. All marked codes were optically analyzed using a verifier and classified according to ISO/IEC 29158:2020. The best process conditions were identified using the Taguchi method, and each parameter’s statistical significance on the performance metrics was assessed using ANOVA. The analyses allowed to draw the following conclusions: (1) The lower the power and pulse frequency and the higher the scan speed, the fuzzier the resulting marking and therefore the poorer the code quality. (2) Scan overlap does not have a significant effect on the overall code quality score, as there are codes with low scan overlap and good scores. (3) The statistical analysis showed that the pulse frequency and the scanning speed are more important than the other laser marking parameters in all the characteristics of both DMCs and QRs. (4) The most important parameters for the CC of DMCs are the pulse frequency, the scan speed, and the scan overlap, while for QRs only the scan speed is important. (5) For CM and FPD, the most significant parameters for both DMCs and QRs are pulse frequency and scan speed. (6) For GNU, pulse frequency and scan speed are the most important parameters for DMCs, and scan overlap for QRs. (7) According to the DoE, the laser marking parameters that allow obtaining the best level of quality in the different features of the DMC correspond to those used in experiment number 63 (P = 19 W, f = 30 kHz, v = 1000 [mm/s], s = 30%), while in the QR they correspond to those used in experiment number 39 (P = 17 W, f = 25 kHz, v = 2000 mm/s, s = 30%). (8) The results show that the presence of defects on the surface reduces the quality of the codes, namely by reducing the contrast. Therefore, since the codes are important elements for the registration of traceability data and the spots are inherent to the injection, it is important to allocate the best possible area of the parts to the positioning of the codes, avoiding injection spots.
The main conclusion is that the choice of parameters obtained by the Taguchi method represents a competitive advantage in terms of obtaining codes with better reading quality since the laser parameters recommended by the manufacturer do not correspond to the best results obtained. Further studies will be necessary for more tests to understand how deep the laser can interact with the substrate to improve the surface code quality and relate the code quality with the roughness variation. The same material could be tested with different laser sources and compared with those presented here.
Supplemental Material
Supplemental Material - Quality improvement of Nd: YAG laser marked DMC and QR codes on the surface of PBT/glass fiber composites by DOE methodology
Supplemental Material for Quality improvement of Nd: YAG laser marked DMC and QR codes on the surface of PBT/glass fiber composites by DOE methodology by Rita de Cássia Mendonça Sales-Contini, João Pedro Costa, Arnaldo MG Pinto
Footnotes
Acknowledgements
The authors thank the Polytechnic Institute of Porto - Instituto Superior de Engenharia do Porto - IPP/ISEP for the infrastructure offered for the development of this project and Centro Paula Souza - College of Technology São José dos Campos, Professor Jessen Vidal, FATEC/SJC- Brazil for supporting the internationalization of the RJI project in partnership with IPP-ISEP- Porto Portugal.
Author contributions
Conceptualization, R.C.M. Sales-Contini, J. P. Costa and F.J.G. Silva: Conceptualization, methodology, formal analysis, and investigation, F.J.G. Silva and A. M. G. Pinto: funding acquisition, project administration, resources, and data curation, R.C.M. Sales-Contini and J. P. Costa; writing—original draft preparation and writing—review and editing, F.J.G. Silva, A. M. G. Pinto and I. M. Pinto, and V. F. C. Sousa; visualization, supervision, and writing—review and editing. All authors have read and agreed to the published version of the manuscript.
Declaration of conflicting interests
The author(s) declared no potential conflicts of interest with respect to the research, authorship, and/or publication of this article.
Funding
The author(s) received no financial support for the research, authorship, and/or publication of this article.
Ethical statement
References
Supplementary Material
Please find the following supplemental material available below.
For Open Access articles published under a Creative Commons License, all supplemental material carries the same license as the article it is associated with.
For non-Open Access articles published, all supplemental material carries a non-exclusive license, and permission requests for re-use of supplemental material or any part of supplemental material shall be sent directly to the copyright owner as specified in the copyright notice associated with the article.