
Abstract
Biobased polymers have emerged as a promising alternative to petroleum-based polymers in terms of lower environmental impact. However, to improve their carbon footprint, it is important to study strategies, such as recycling, extending the useful life of these biopolymers, and mitigate their higher costs compared to petroleum-based polymers. Adding agro-industrial wastes as fillers or reinforcements is another option to reduce the cost and increase the biobased content to produce composites. This study aimed to evaluate the addition of agave fibers to biobased linear low-density polyethylene (bio-LLDPE) and their effect on its reprocessing by extrusion, i.e., close-loop mechanical recycling. The results revealed that it was possible to reprocess the bio-LLDPE alone as limited changes in their physical properties were observed up to 34 cycles. However, for the composites, the viscosity changed in the first eight cycles mainly due to fiber break-up (lower aspect ratio). The dimensions of the agave fibers are modified by reprocessing. In the initial 8 cycles, there is a notable decrease in fiber dimensions, affecting the tensile, flexural, and impact properties of the composites. The water uptake was found to decrease with each cycle due to better fiber dispersion and the reduction of interfacial voids/defects. Nevertheless, the color of the bio-LLDPE and its composites showed significant changes by reprocessing, which is associated with thermal and oxidation degradation. Despite minor property losses, the study reveals that bio-LLDPE/agave fiber composites exhibit a commendable level of sustainability. This characteristic enables their extended reuse and reprocessing over a prolonged duration.
Introduction
The continuous increase in consumption of conventional petroleum-based polymers has prompted an upsurge in consciousness regarding their use, leading to increased interest in alternatives such as biobased polymers. 1 Biodegradable polymers have received significant attention due to their potential for mitigating environmental pollution associated with petroleum-based plastics. Nevertheless, most biodegradable polymers require specific conditions to achieve complete biodegradation. This situation raises concerns, as these polymers could only break down into smaller fragments, transforming into more resilient and challenging-to-remove compounds within the soil or their disposal site. Conversely, traditional polymers are non-biodegradable and come from non-renewable sources. In this sense, proper management and disposal alternatives are imperative for both biodegradable and non-biodegradable polymers. A viable approach to minimize the environmental impact caused by polymer waste landfills or aquifers involves reusing or recycling these materials. Additionally, the economic benefits of recycling are noteworthy, considering that polymers can generate high-added value. 2 Saleem et al. 3 assessed the life cycle of recycled plastic pellets, demonstrating that recycling plastic waste consumes less energy and emits fewer greenhouse gases than producing new plastic pellets. This is why recycling became a topic of paramount importance within governmental, industrial, and scientific communities, as it represents one of the main alternatives for environmental conservation. 4
Polyethylene stands out as one of the main polymers extensively used by the plastic industry, characterized by its non-biodegradable nature and petroleum origin. However, a more environmentally friendly biobased polymer known as biopolyethylene (bio-PE or green-PE) has emerged as an alternative to conventional polyethylene. This innovative polymer exhibits similar properties as conventional polyethylene, but with an important distinction: it is derived from renewable resources such as sugar cane, sugar beet, and lignocellulosic waste.5,6 One of the most appealing aspects of biobased polymers, including bio-PE, is that the plants used for their production actively absorb carbon dioxide (CO2) from the atmosphere during their growth. This process counterbalances the greenhouse effect, contributing to a more sustainable and eco-friendly approach to polymer production. 7
Utilizing natural fibers to reinforce polymers for producing composite materials is an effective strategy to enhance physical and mechanical properties while simultaneously cutting costs, as these fibers typically originate from agro-industrial waste. 8 Several studies investigated bio-PE and its reinforcement with natural fibers to enhance its mechanical properties, producing sustainable composites. For instance, Kuciel et al. 9 examined the incorporation of wood, cellulose, and kenaf fibers, revealing a significant increase in stiffness and flexural strength. However, the hydrophilic nature of these natural fibers poses concerns, as they may lead to easier degradation when exposed to humidity and its incompatibility with bio-PE, thereby affecting the performances. Barbalho et al. 10 explored the addition of curaua fibers to biobased high-density polyethylene (bio-HDPE), using maleic anhydride (MA) as a compatibilizer. The results indicated better interfacial adhesion, leading to a 23% increase in tensile strength and better resistance to thermal degradation, thereby improving the overall performance. Similarly, Guilhen et al. 11 incorporated 20% of cellulose into bio-HDPE, improving tensile strength (23 to 32 MPa) and tensile modulus (466 to 937 MPa). Furthermore, adding 5% lignin as a stabilizer significantly increased the oxidation induction time (OIT) from 24 to 77 min. Robledo-Ortiz et al. 12 prepared rotomolded samples using biobased linear low-density polyethylene (bio-LLDPE), agave, and coir fibers, as well as maleated polyethylene (MAPE) as a compatibilizer. A 30% fiber content was found to maintain mechanical properties similar to neat bio-LLDPE, showcasing the potential of these fully biobased composites without compromising their overall performance.
The single-use utilization of polymeric materials has become a significant concern for governments due to the substantial volume of waste generated. Consequently, recycling has received significant interest as the most promising approach to addressing polymer pollution. Mechanical and chemical recycling are the two main methods for recycling these polymers. These techniques involve using polymer waste produced by human activities to create new products. Mechanical recycling encompasses two main approaches: (i) Primary recycling, where the recovered plastic is used in items exhibiting performances comparable to those crafted from virgin plastics. 13 In an ideal scenario, closed-loop recycling reintegrates the reclaimed material into its initial application. The advantage of primary recycling lies in eliminating the need for a washing step before reprocessing the polymer. (ii) Secondary recycling, on the other hand, involves the recovery of polymeric waste, followed by separation and cleaning, before reprocessing it into new products. 14 Researchers, such as Jin et al., 15 studied the reprocessing of low-density polyethylene (LDPE) up to 100 cycles and observed that the melting and crystallization temperatures remain unaffected. However, rheological studies indicated thermal degradation, leading to chain scission and crosslinking reactions. Benoit et al. 16 focused on reprocessing HDPE/flax fiber composites for 50 cycles. The thermal properties were unaffected by reprocessing, but the mechanical properties decreased due to some degradation, such as the gradual reduction of fiber length with each cycle. Interestingly, the mechanical properties suggested a balance between fiber breakup and improved material homogeneity.
In conclusion, the recycling of polymeric biobased materials holds great promises for mitigating pollution and enhancing sustainability in various industries. Nevertheless, carefully considering the specific recycling method/conditions and the potential impact on material properties is crucial for promoting effective and eco-friendly recycling practices.
Considering the prevailing issue of plastics pollution and the growing interest in environmentally sustainable materials, this study aimed to assess the reprocessing of biobased LLDPE/agave fiber composites. The main objective was to determine the influence of the agave fibers on the thermal degradation behavior of the composites during twin-screw extrusion reprocessing.
Experimental
Materials
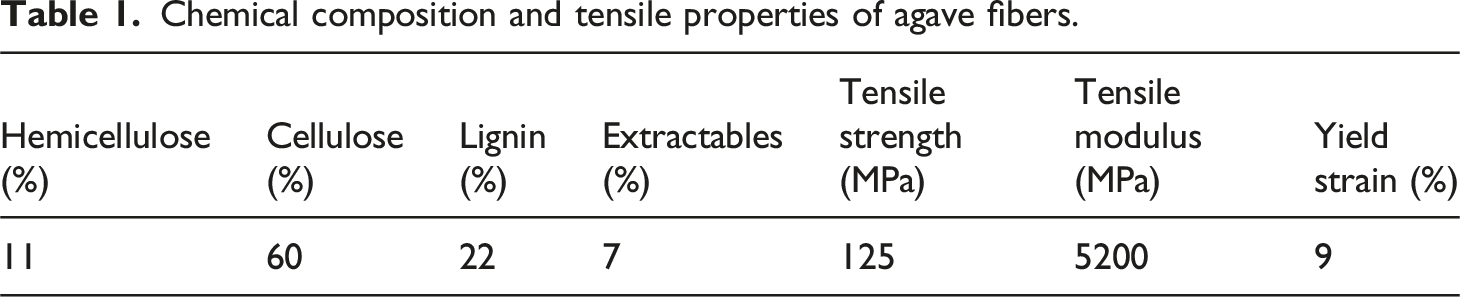
Chemical composition and tensile properties of agave fibers.
Processing methods
Before processing, all the materials were dried at 65°C for 24 h. The bio-LLDPE and its composites were processed by extrusion. Initially, the composites were prepared by blending 65% wt. (72% v/v) bio-LLDPE, 30% wt. (22% v/v) agave fibers, and 5% wt. (6% v/v) MAPE. The extrusion was conducted using a Leistritz MICRO 27GL/32D twin-screw extruder with eight heating zones. The screw speed was set at 100 rpm/min, and the temperature profile was 130, 140, 150, 155, 160, 160, 170, and 170°C. The obtained extruded materials had the form of threads and were subsequently pelletized. Then, the pellets were dried (65°C for 24 h) and reprocessed using the same procedure for different cycles (Ci).
A fraction of pellets from each cycle were subjected to compression molding to produce sheets. A hydraulic press (homemade) was used to produce the samples before their characterization. For this, 35 g of pellets were placed in a 125 × 125 × 2 mm3 mold and pressed as follows: 2 min of preheating at 180°C without pressure, 2 min at 100 bar, 2 min at 200 bar, and 2 min at 300 bar maintaining the same temperature. Ultimately, the mold was cooled for 10 min at 300 bar before mold opening and sample demolding. The materials were then characterized, and analysis of variance (ANOVA) and Tukey tests (p < .05) were performed to determine significant differences in their properties.
Fiber size and morphology
The changes in fiber size during the reprocessing cycles were determined by dissolving a composite sample in xylene at 90°C. Subsequently, the resultant suspension was filtered and dried at 65°C for 24 h. Then, digital images of the filter paper containing the fibers were obtained using a Nikon DSLR D5500 camera with a macro lens AF-S Micro Nikkor 85 mm. The Image-Pro Plus software was used to analyze the obtained images. A minimum of 200 fibers per sample were measured for statistical significance.
The state of fiber-matrix adhesion and fiber dispersion in the composites were analyzed using scanning electron microscopy (SEM) with a HITACHI TM-1000. For this purpose, the fractured surface of impact test samples was coated with a layer of gold (Au) under vacuum for 120 s using a SPI module sputter coater before SEM observation.
Rheological characterization
The melt flow index (MFI) of the materials was determined using a plastometer CEAST MF20 plastometer following ASTM D-1238. The material was loaded in the plastometer cylinder and preheated for 90 s at 190°C. Afterward, a 2.16 kg weight was applied to obtain the extruded sample and the MFI (g of material/10 min). The reported values are the average of three runs.
Additionally, a TA Instruments ARES Rheometer was used at two different temperatures, 160°C and 180°C, to obtain the elastic modulus (G′) and viscous modulus (G″). A parallel plate geometry (25 mm diameter) with a 1.5 mm gap was selected. Frequency sweeps were conducted within a range of 0.01 to 60 Hz, and a deformation of 3%–5% (linear viscoelastic conditions) was applied during the measurements.
Mechanical characterization
The impact strength test was conducted using an INSTRON CEAST model 9050 following ASTM D-6110. At least 10 notched specimens were tested for each sample to ensure statistical significance. The flexural test was performed according to ASTM D-790 on an INSTRON 4411 testing machine using specimens of 120 × 12 × 2 mm3. The crosshead speed during the test was set to 2 mm/min. An INSTRON 3345 machine was used for the tensile test following the ASTM D-638 standard. The test was conducted at 5 mm/min using type IV specimens. A 1 kN load cell was used for flexural and tensile tests, and at least five specimens were tested to get average values and standard deviations.
Water absorption
The water absorption test was performed according to ASTM D-570. Specimens of 62.5 × 12 × 2 mm3 were immersed in distilled water and removed at different times. The removed specimens were wiped off with a dry cloth to measure the weight gained and returned to the water bath again. The water absorption was calculated as follows:
Thermal properties
Thermogravimetric analysis (TGA) was performed in a TA Instruments TGA DISCOVERY programmed to work in a temperature range from 40 to 600°C at a heating rate of 10°C/min under an air atmosphere. The thermal analysis was performed by differential scanning calorimetry (DSC) using a TA instrument model Discovery Q100. The samples (2-5 mg) were set in aluminum capsules and heated from 30 to 170°C at a heating rate of 10°C/min under a nitrogen flow of 50 mL/min. The crystallinity (X
c
) was calculated as:
Color change
The change in color with reprocessing was measured using the CIELab color space parameters with a FRU WR-10 colorimeter. The reported values for the test are the average of at least six samples. The total color change (ΔE) was calculated as:
Results and discussion
Morphology and fiber size
Figure 1 presents typical SEM micrographs of the composites for cycles 1, 8, 16, and 34. A clear fiber length and diameter reduction is observed, especially between cycles 1 and 8. For C34, the fiber sizes are much smaller compared to C1. An improvement in fiber dispersion can also be observed, leading to better biocomposite homogeneity throughout the cycles, which explains that the tensile properties are slightly affected by reprocessing, i.e., a balance between fiber break-up and improved dispersion. Extracted fibers (left column) and their dispersion into the composite (right column) for different processing cycles.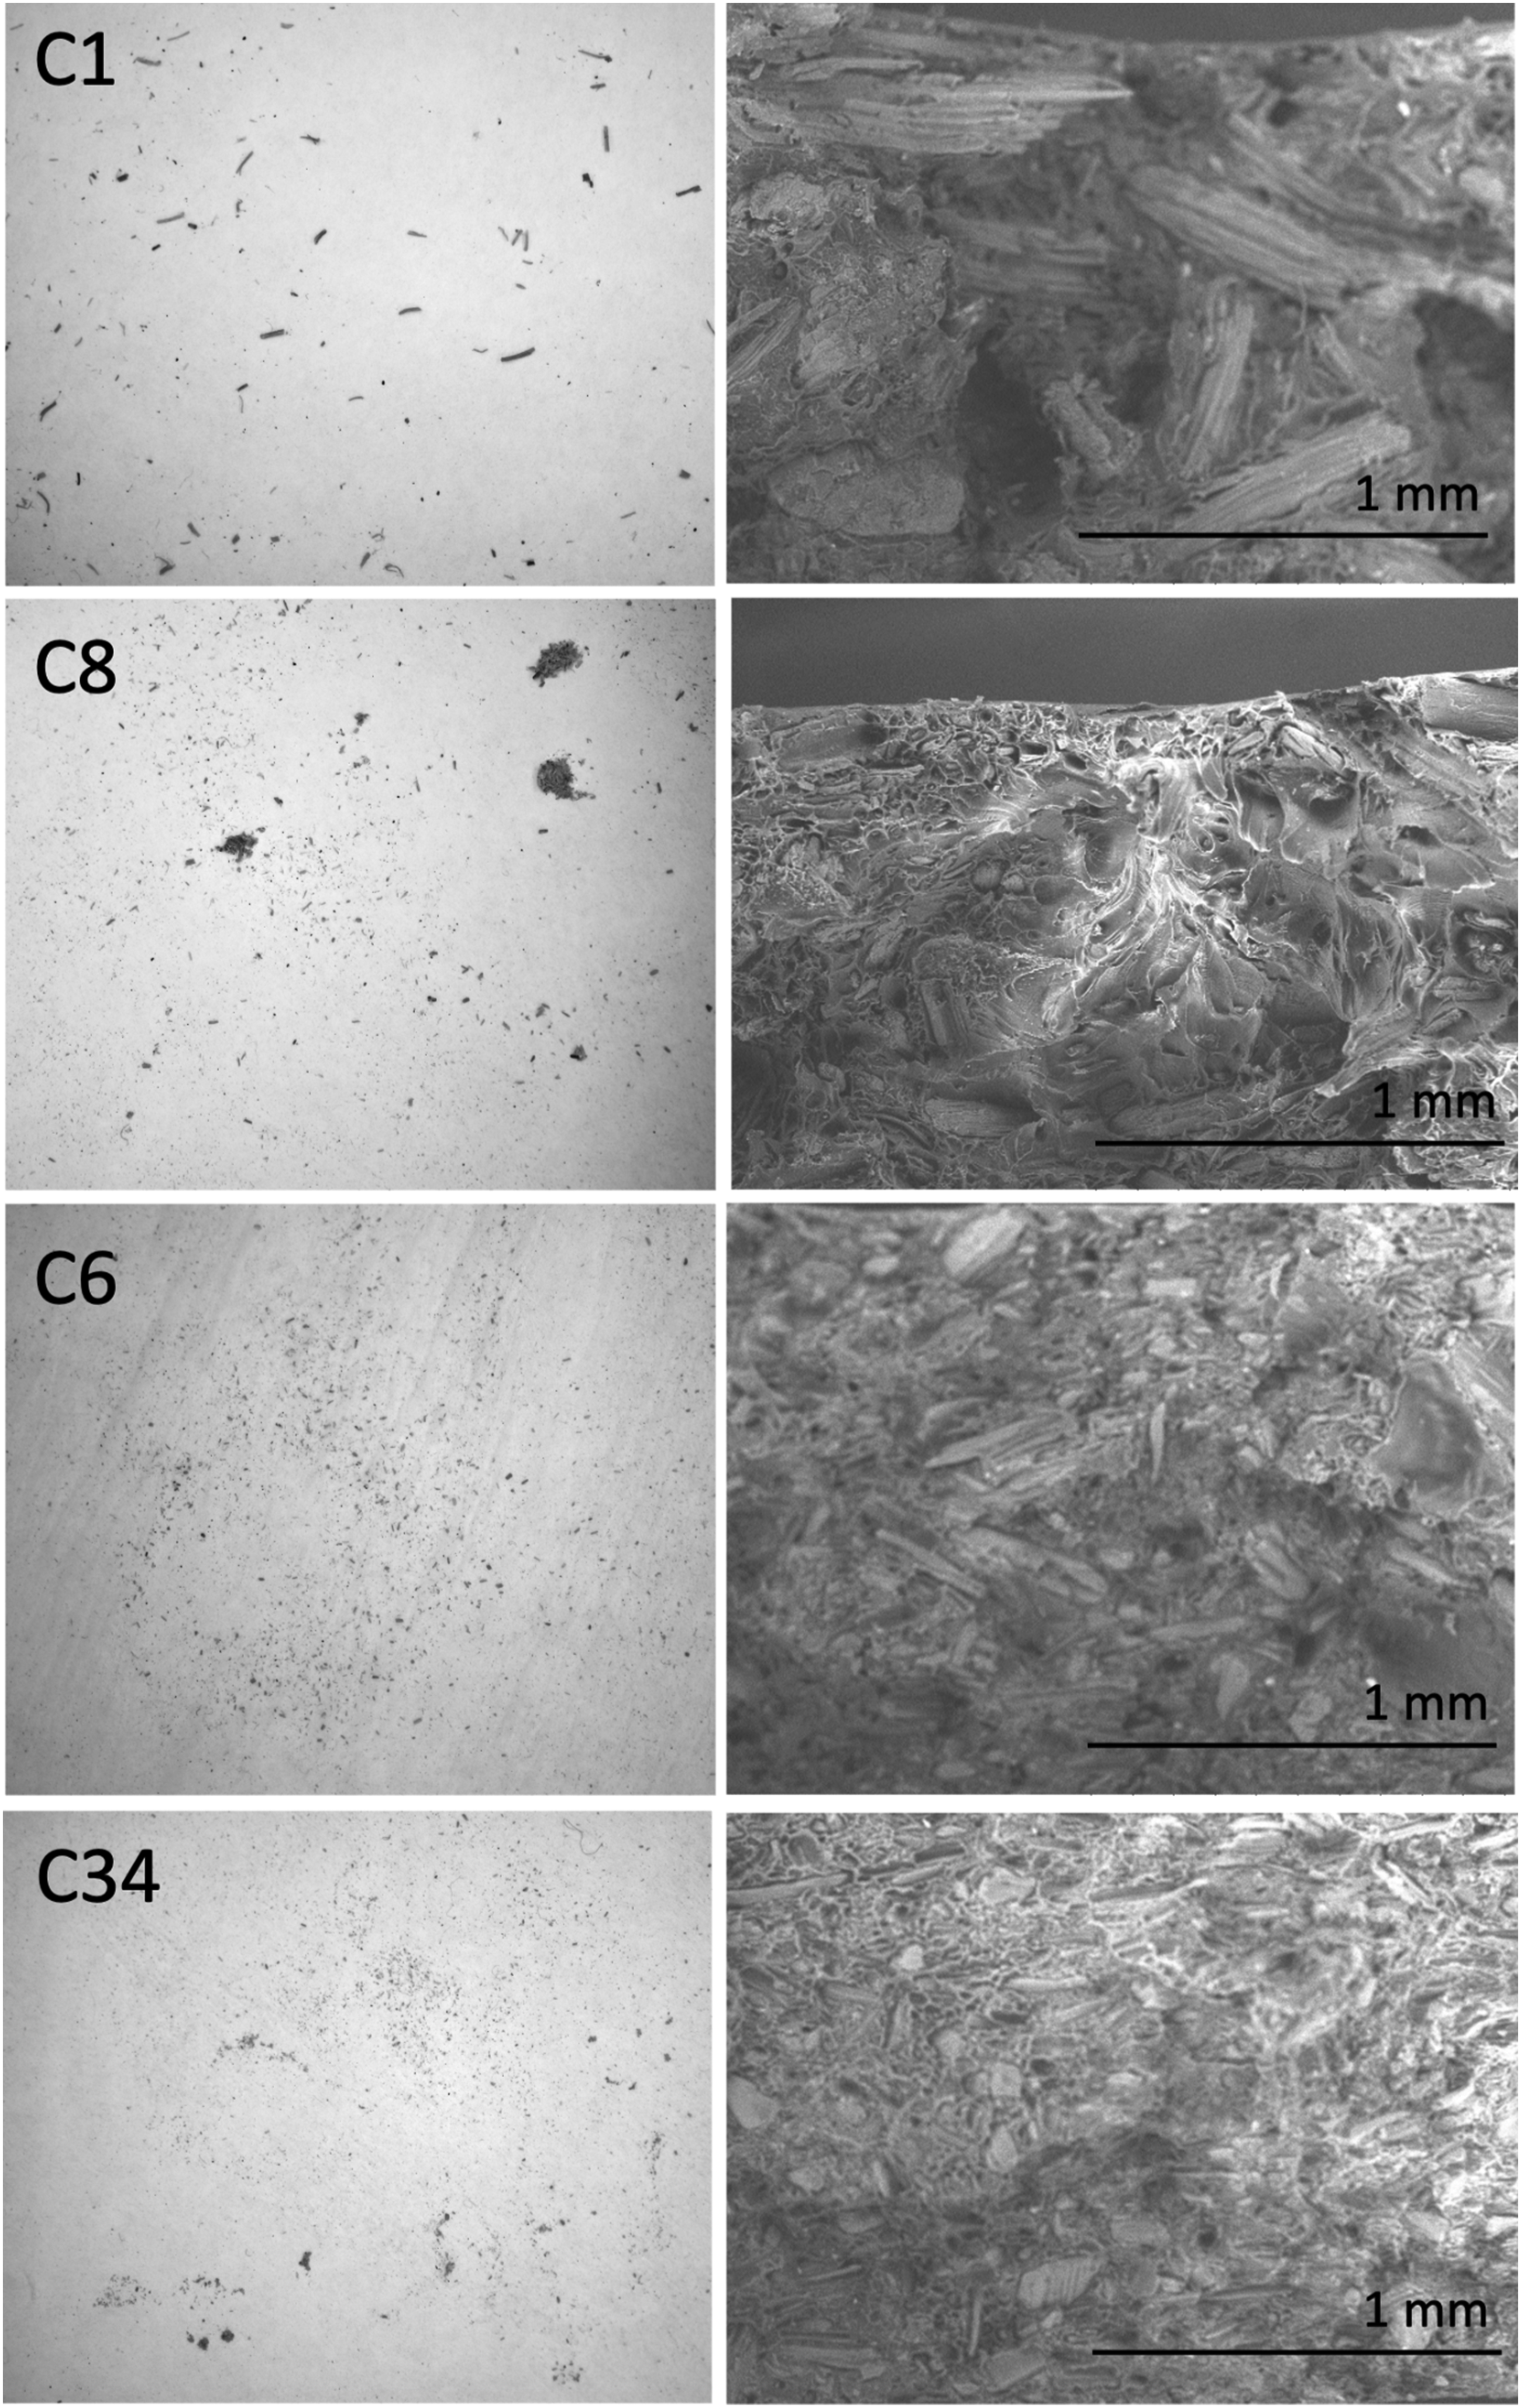
The fiber dimensions are an important factor in the composite performance since the strength is related to the aspect ratio (length/diameter).
17
Figure 2 shows the fiber sizes (diameter, length, and aspect ratio) after each reprocessing cycle. The initial fiber length and diameter were 3.24 and 0.48 mm, respectively. However, a significant decrease in the sizes of the original fibers (55.5% in length and 66.1% in diameter) can be observed compared to the fibers from the first reprocessing (1.80 and 0.32 mm). The length of the fibers decreases consistently until C24, while the diameter remains nearly constant from cycles 1 to 4. At C8, a more significant diameter decrease occurs, with some variation in subsequent cycles. Notably, the most significant aspect ratio changes occur between cycles 1 and 4, with less pronounced changes after that. These results are similar to those reported by Benoit et al.,
16
who reprocessed up to 50 times HDPE composites with flax fibers as reinforcement and MAPE as a compatibilizer. Changes in fiber sizes result from shear/elongational stresses during reprocessing (extrusion) and pelletizing post-extrusion. The change in fiber diameter signals structural alterations. Plant-based natural fibers possess a wall-based structure. Fiber cell walls comprise primary and secondary layers, with cellulose content consistently increasing, hemicellulose remaining constant, and lignin content decreasing. It has been noted that the secondary layer primarily influences fiber mechanical properties. Thus, modifications in diameter impact fiber structure, subsequently affecting strength and stiffness.
18
Fiber sizes (a) diameter and length, and (b) aspect ratio, for different reprocessing cycles. Letters indicate significant differences.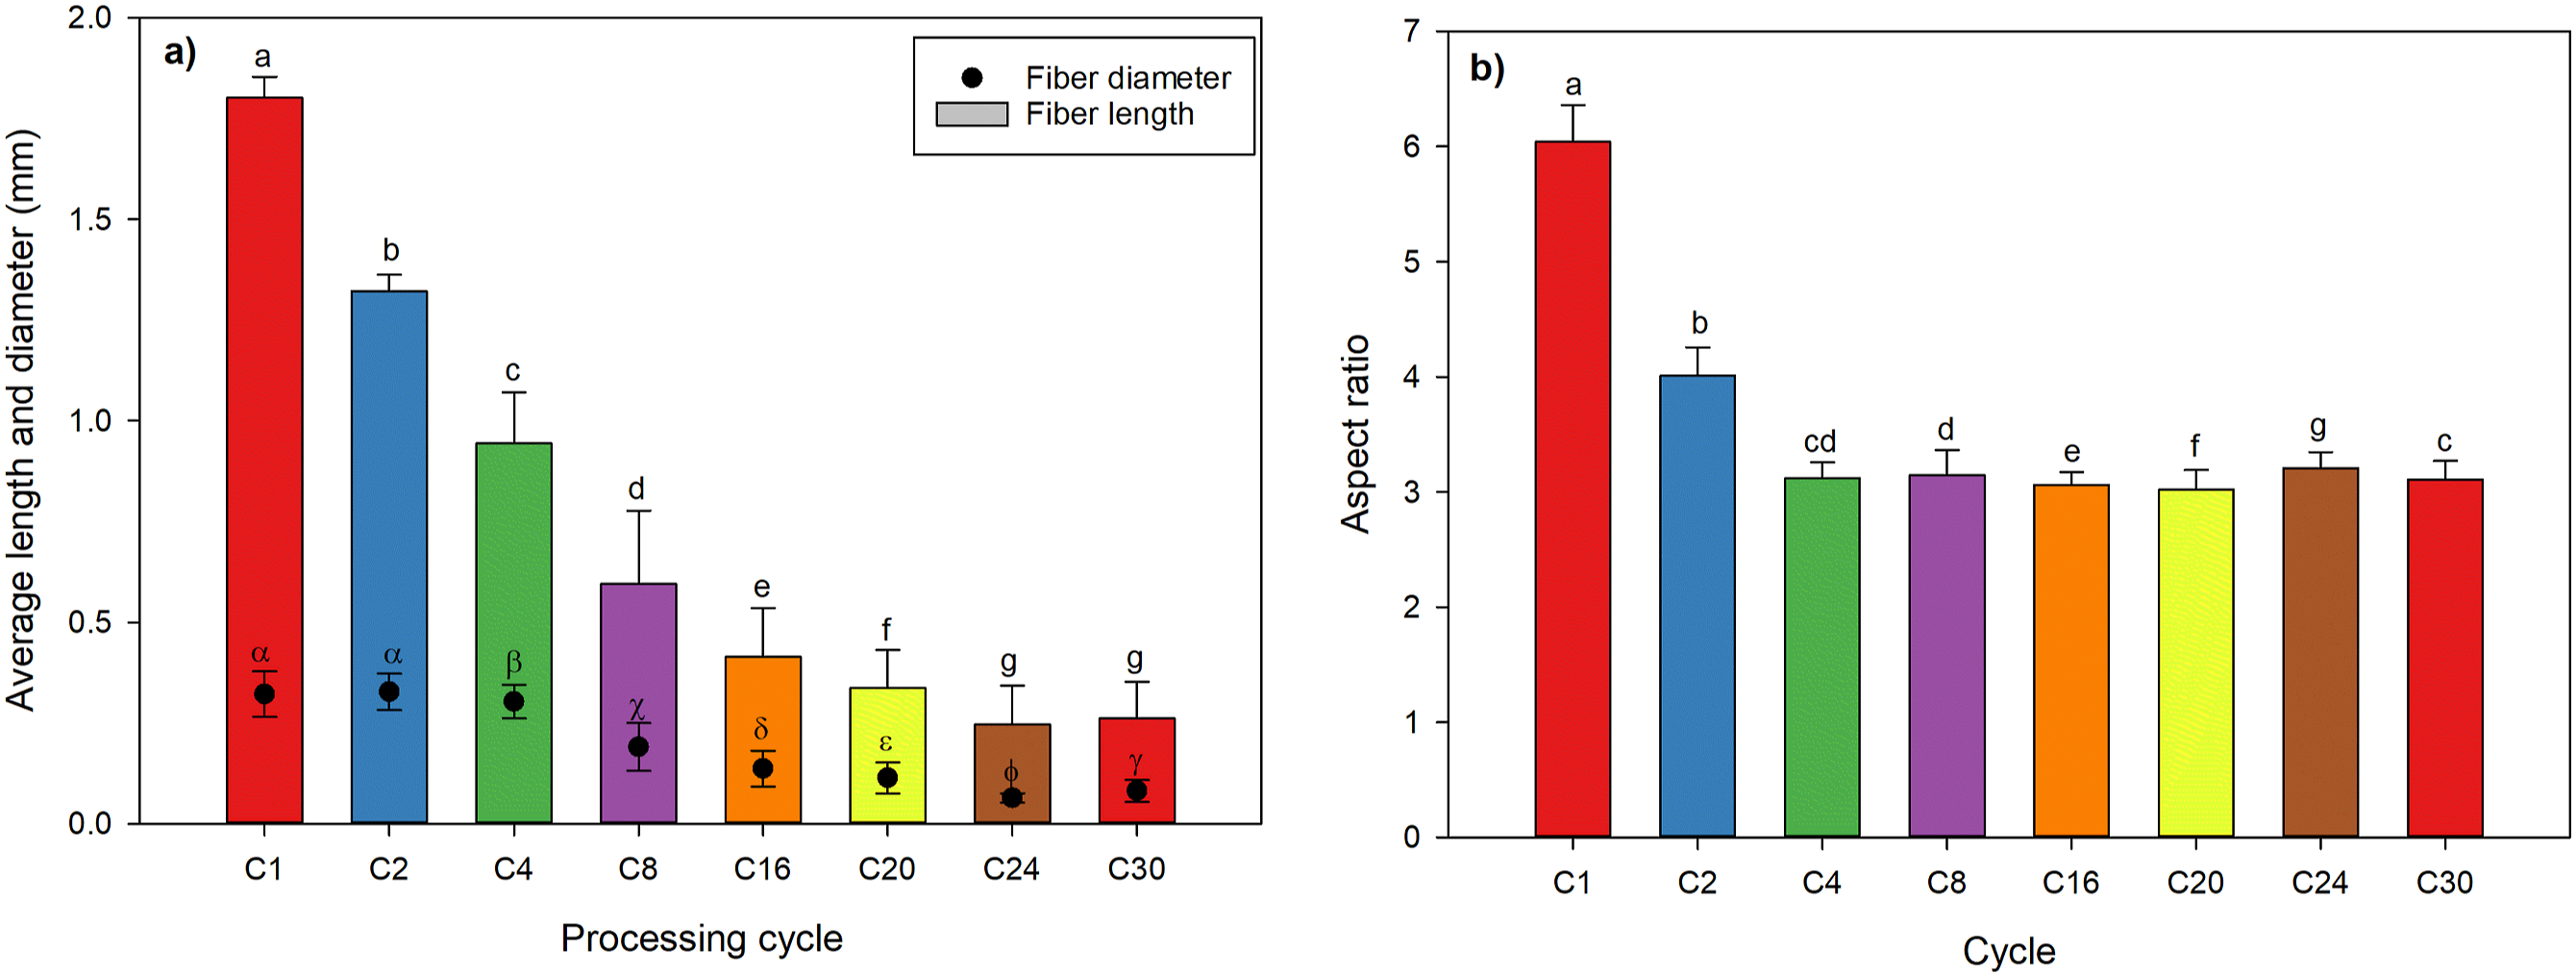
Rheological properties
Figure 3 illustrates the effect of reprocessing on the MFI of bio-LLDPE and its composites. Initially, the MFI of neat bio-LLDPE remains relatively stable for the first four cycles with a value around 4 g/10 min. However, a slight increase in viscosity (lower MFI) was observed at cycle 8, suggesting the occurrence of branching or crosslinking reactions.
19
Subsequently, the MFI gradually increases with each cycle, which indicates degradation reactions during reprocessing, mainly molecular weight reduction associated with bio-LLDPE chain scission. Melt flow index (MFI @ 2.16 kg/190°C) of the bio-LLDPE and its composites for different reprocessing cycles. Letters indicate significant differences.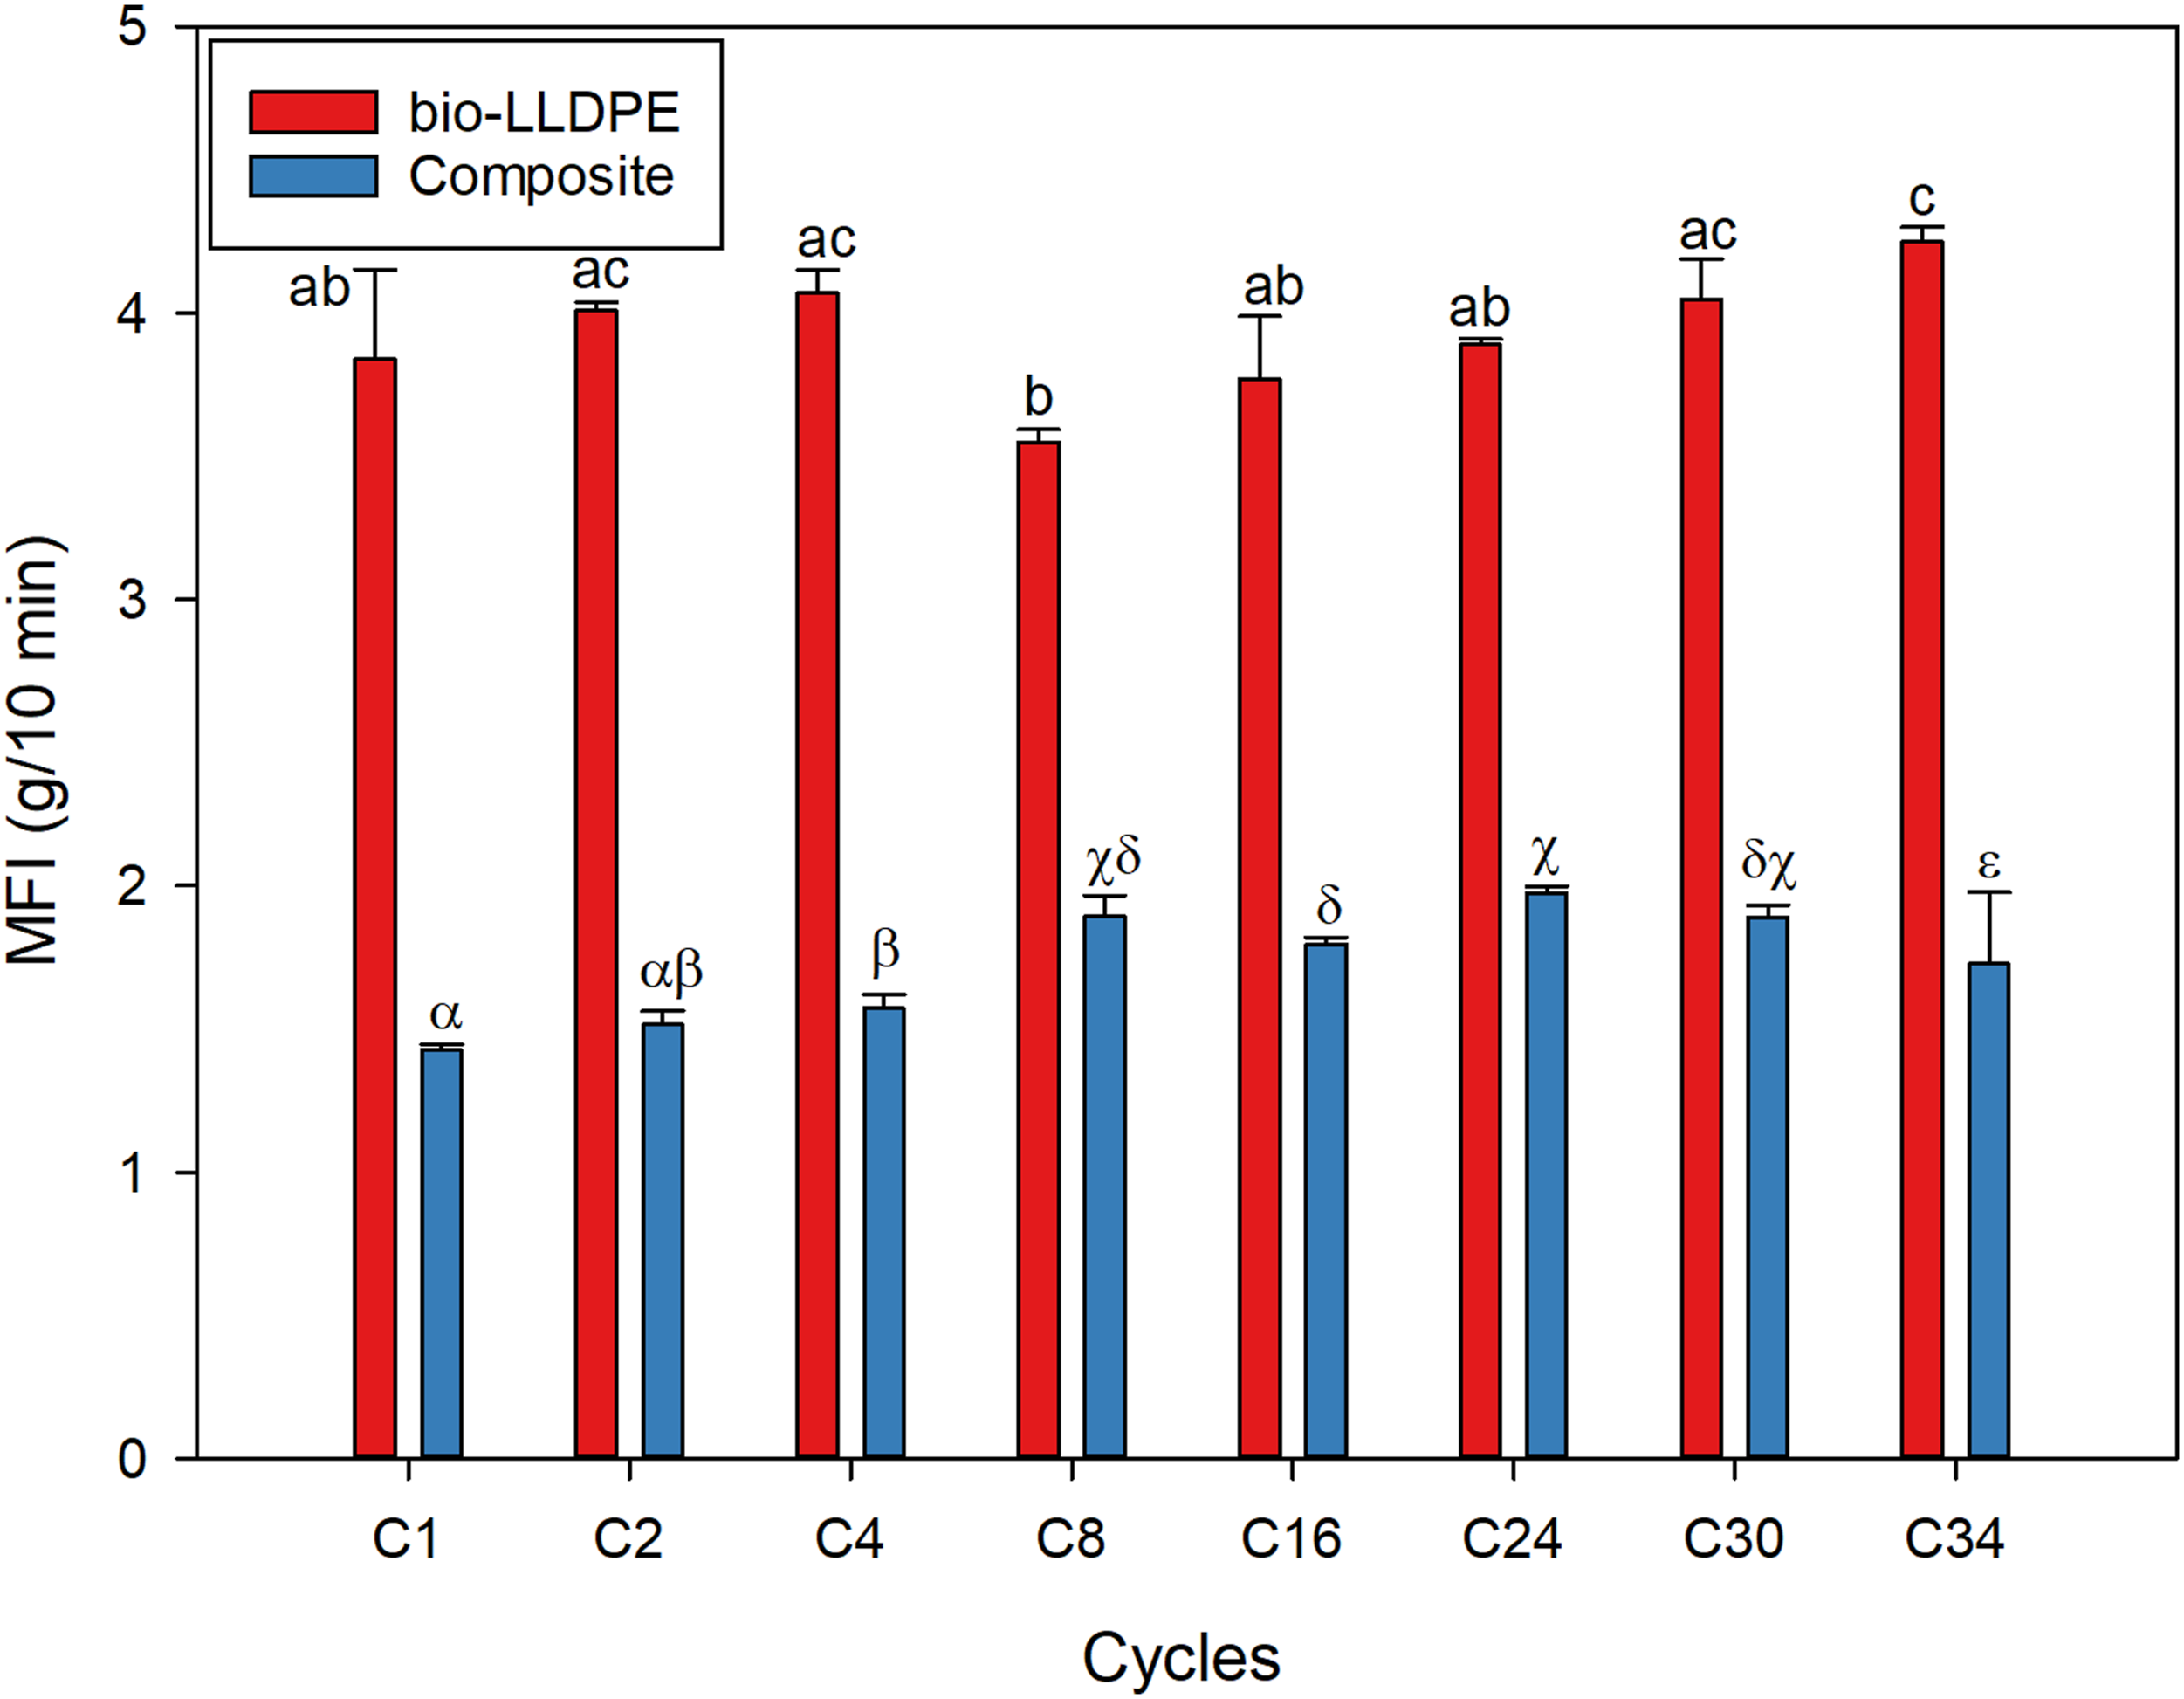
As expected, incorporating agave fibers into the bio-LLDPE matrix results in a significant increase in viscosity. This phenomenon can be attributed to the flow resistance caused by fiber/fiber interactions within the composite and the fiber presence limiting the mobility of the polymer molecules, leading to decreased MFI. In the first cycle, the MFI of the composite was 1.4 g/10 min, which is a significant (169%) reduction compared to the neat bio-LLDPE (C1). Upon reprocessing the composites, a progressive MFI increase is observed. This behavior is attributed to fiber break-up (Figure 2) and polymer degradation, leading to less flow resistance and, consequently, higher MFI values. Yuan et al. 20 observed that the viscosity of PE/wood composites substantially increases at higher fiber length. In this study, after cycle 8, it can be inferred that the fiber size experiences relatively small changes, resulting in almost constant MFI values. The latter indicates again a balance between the degradation of the polymer (mechanical, oxidative, and thermal) offset by the presence of agave fibers. Similar observations were reported by other researchers studying PE reprocessing, highlighting the ability of this polymer to withstand multiple extrusion cycles without undergoing significant modifications.19–21
Figure 4 presents the elastic (G′) and viscous (G″) moduli at 160 and 180°C as a function of angular frequency. For both temperatures, G″ > G′ in the 0.01-40 Hz range, indicating a predominant viscous behavior. For the composites, the elastic modulus curve approaches that of the viscous modulus at both temperatures, which is attributed to the presence of the fibers. It is also observed that G′ decreases with reprocessing at low frequencies, probably due to a reduction in fiber size. Similar results were reported by Jin et al.
15
as they reprocessed LDPE via closed-loop extrusion (up to 100 cycles), reporting on the behavior of their elastic and viscous moduli at 240°C. For the unprocessed polymer (virgin), a predominantly viscous response was observed with G″ > G′ up to 64 rad/s, where both moduli were equal (G″ = G′); as the frequency increased, the LDPE behaved more elastically. Nevertheless, after 30 extrusion cycles, a predominantly elastic behavior was obtained (G″ < G′) across the entire frequency range tested, without a crossover point between both moduli, indicating a gel-like behavior as the number of extrusions increased. Elastic modulus (G′) and viscous modulus (G″) of the bio-LLDPE and its composites as a function of frequency at 160 and 180°C.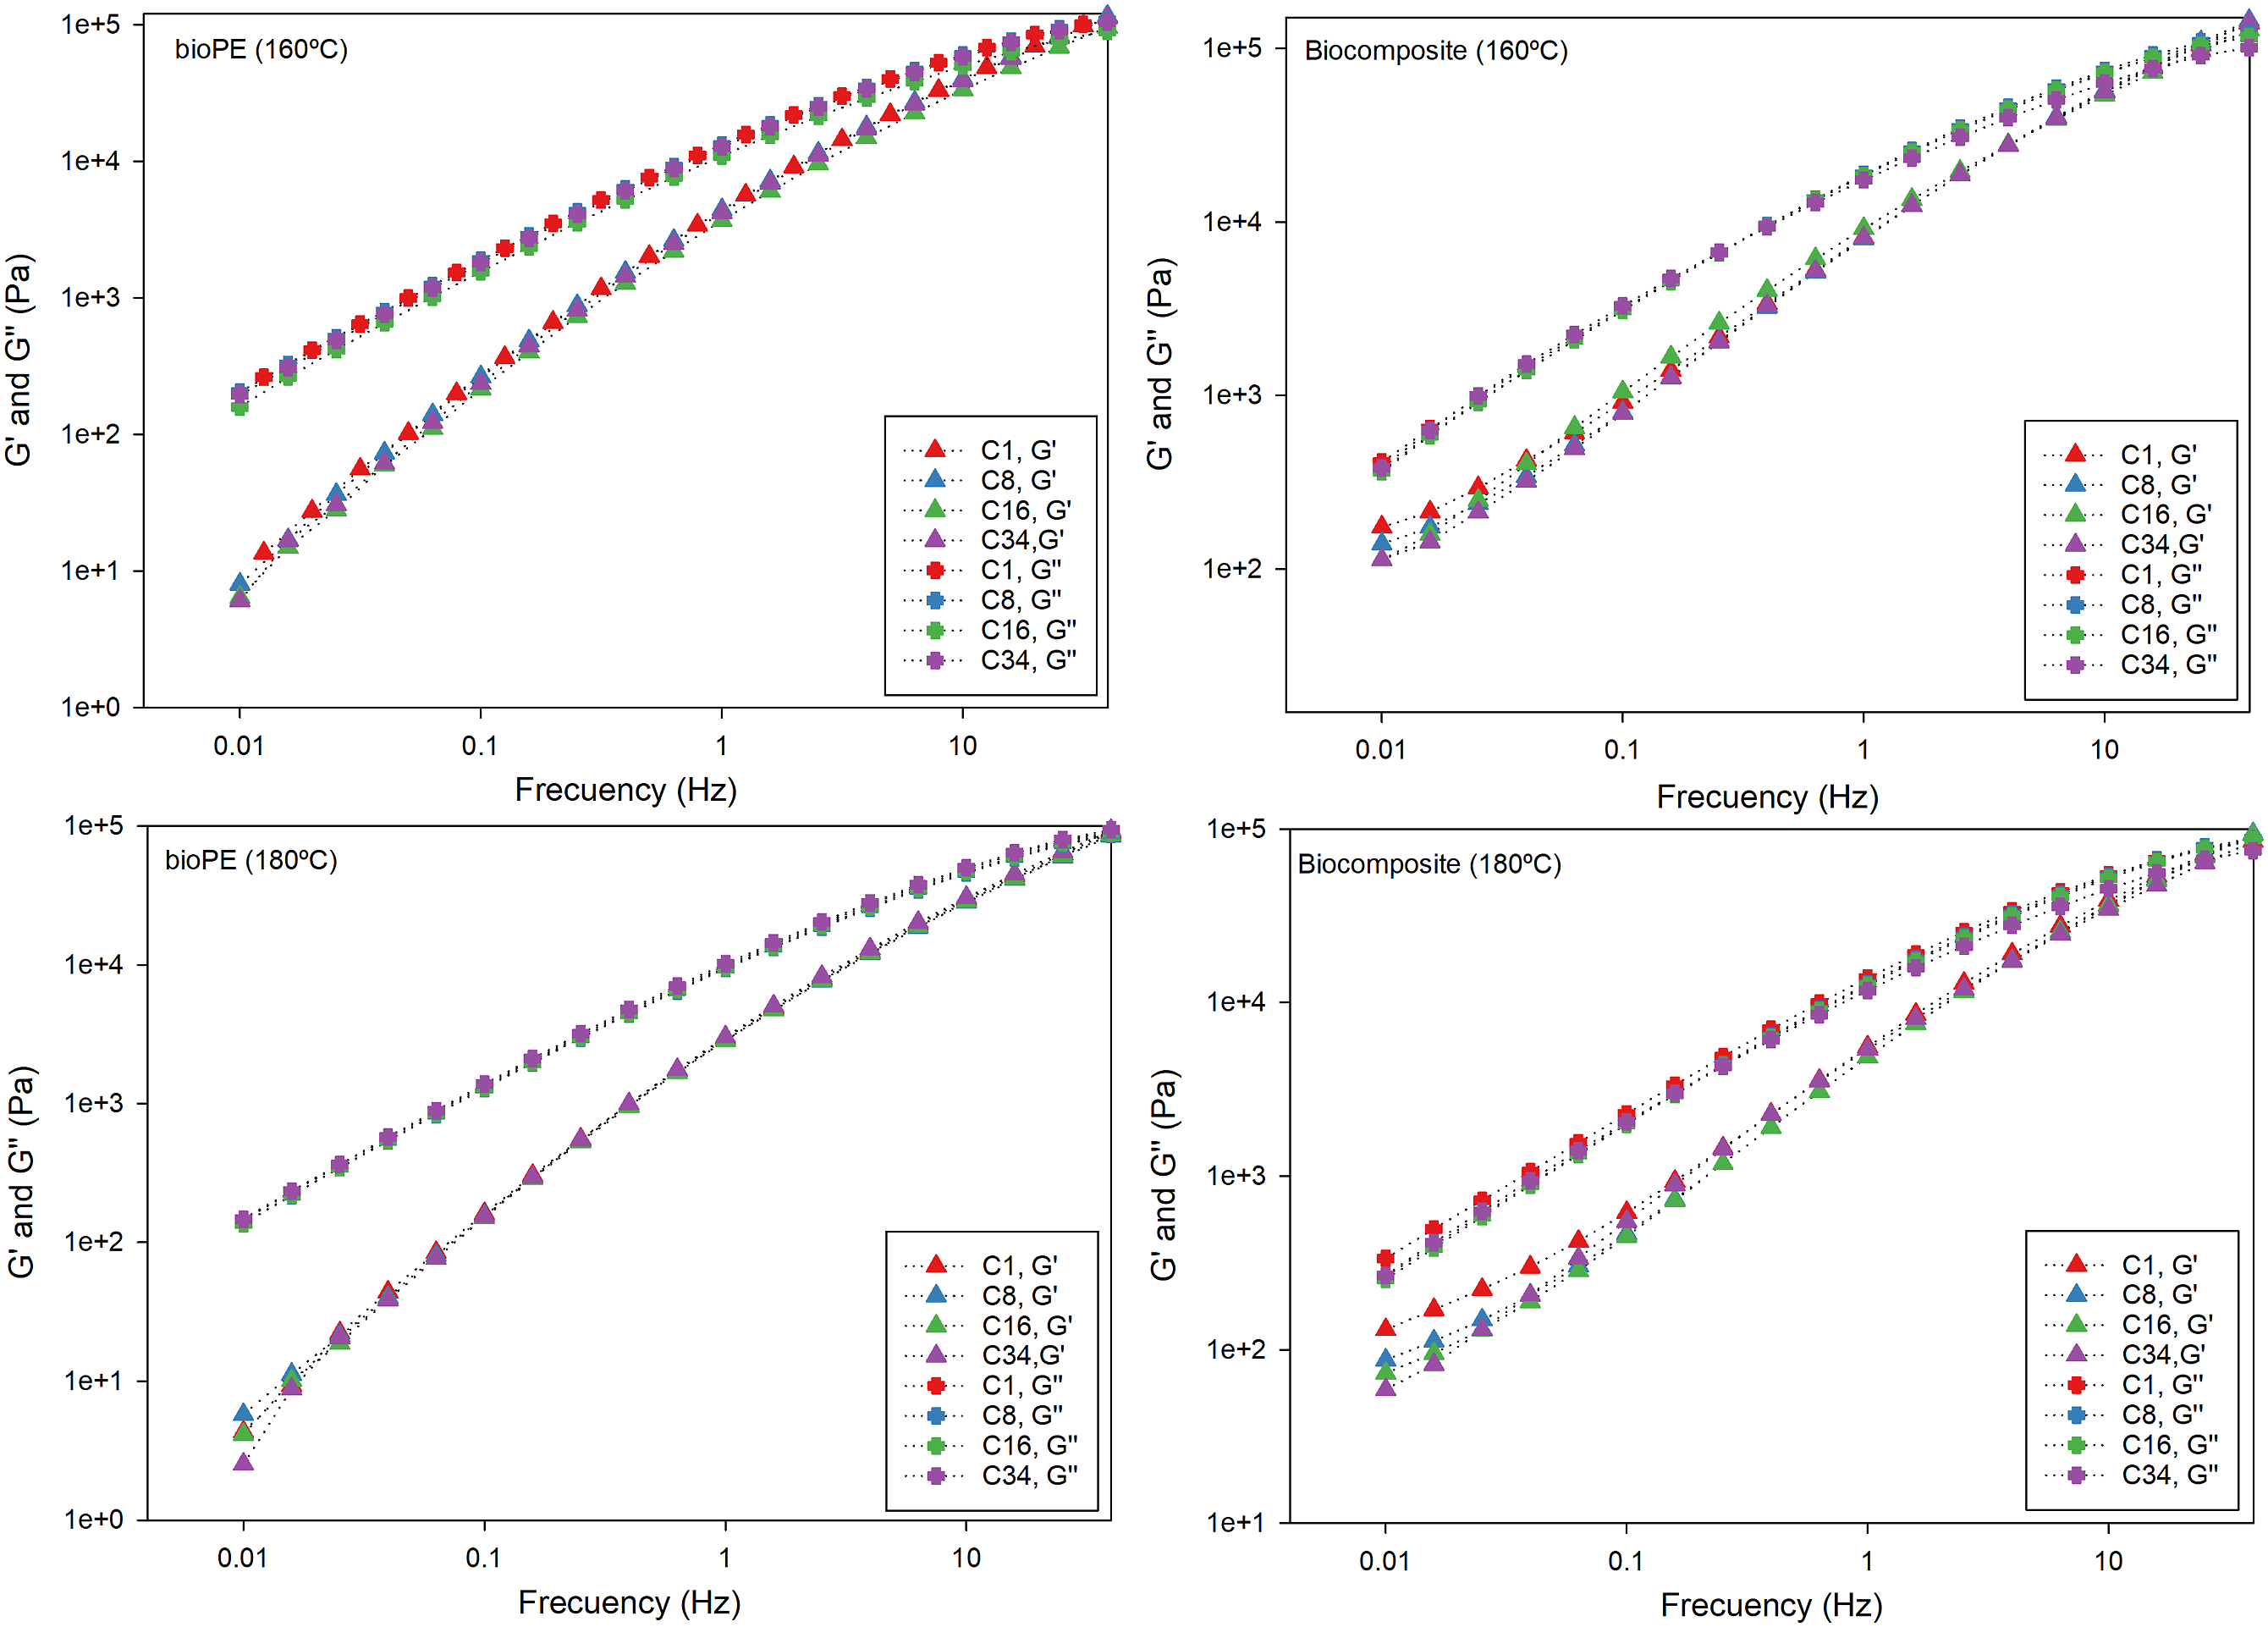
In general, Figure 4 shows that both moduli are not significantly affected by reprocessing. Comparing the values for the matrix (bio-LLDPE) against the composites, it is clear that the neat matrix presents lower values than the biocomposite, which confirms the MFI results reported in Figure 3. The rheology tests showed that elastic and viscous moduli decreased at the higher temperature of 180°C compared to 160°C. At a frequency of 1 Hz, the values for the bio-LLDPE went from 4.2 to 2.8 kPa for G′ and 13.500 to 9.5 kPa for G″, while for the composites, they decreased from 8 to 5 kPa for G′ and from 18 to 12 kPa for G″. The complex viscosity was calculated from the G′ and G″ values. For bio-LLDPE, the value decreased from 13.5 to 9.8 kPa·s, while it decreased from 20.0 to 13.5 kPa·s for the composites. Lower rheological properties at higher temperatures are related to higher free volume accelerating the molecular motion, as well as the reduction in entanglement density and weakening of intermolecular interactions. 22
Impact strength
Figure 5 reports the impact strength of the bio-LLDPE and its composites following reprocessing cycles. The initial impact strength of the matrix (C1) was 217 J/m, but its reprocessing did not significantly affect its impact strength. However, incorporating agave fibers into the bio-LLDPE matrix reduced the impact strength. For the first cycle (C1), the impact strength decreased from 217 J/m (bio-LLDPE) to 137 J/m (biocomposite). Similar findings were reported by Mendes et al.
23
who noted that adding fibers into high- and low-density polyethylene reduces molecular chain flexibility/mobility, decreasing the energy absorption capacity and the impact resistance. Mazur et al.
24
produced bio-LDPE composites with 40% wt. of various fillers (wood, flax, walnut shell), reporting a more fragile behavior (lower impact strength) with significant losses (up to 70%). Impact strength of the bio-LLDPE and its composites for different reprocessing cycles. Letters indicate significant differences.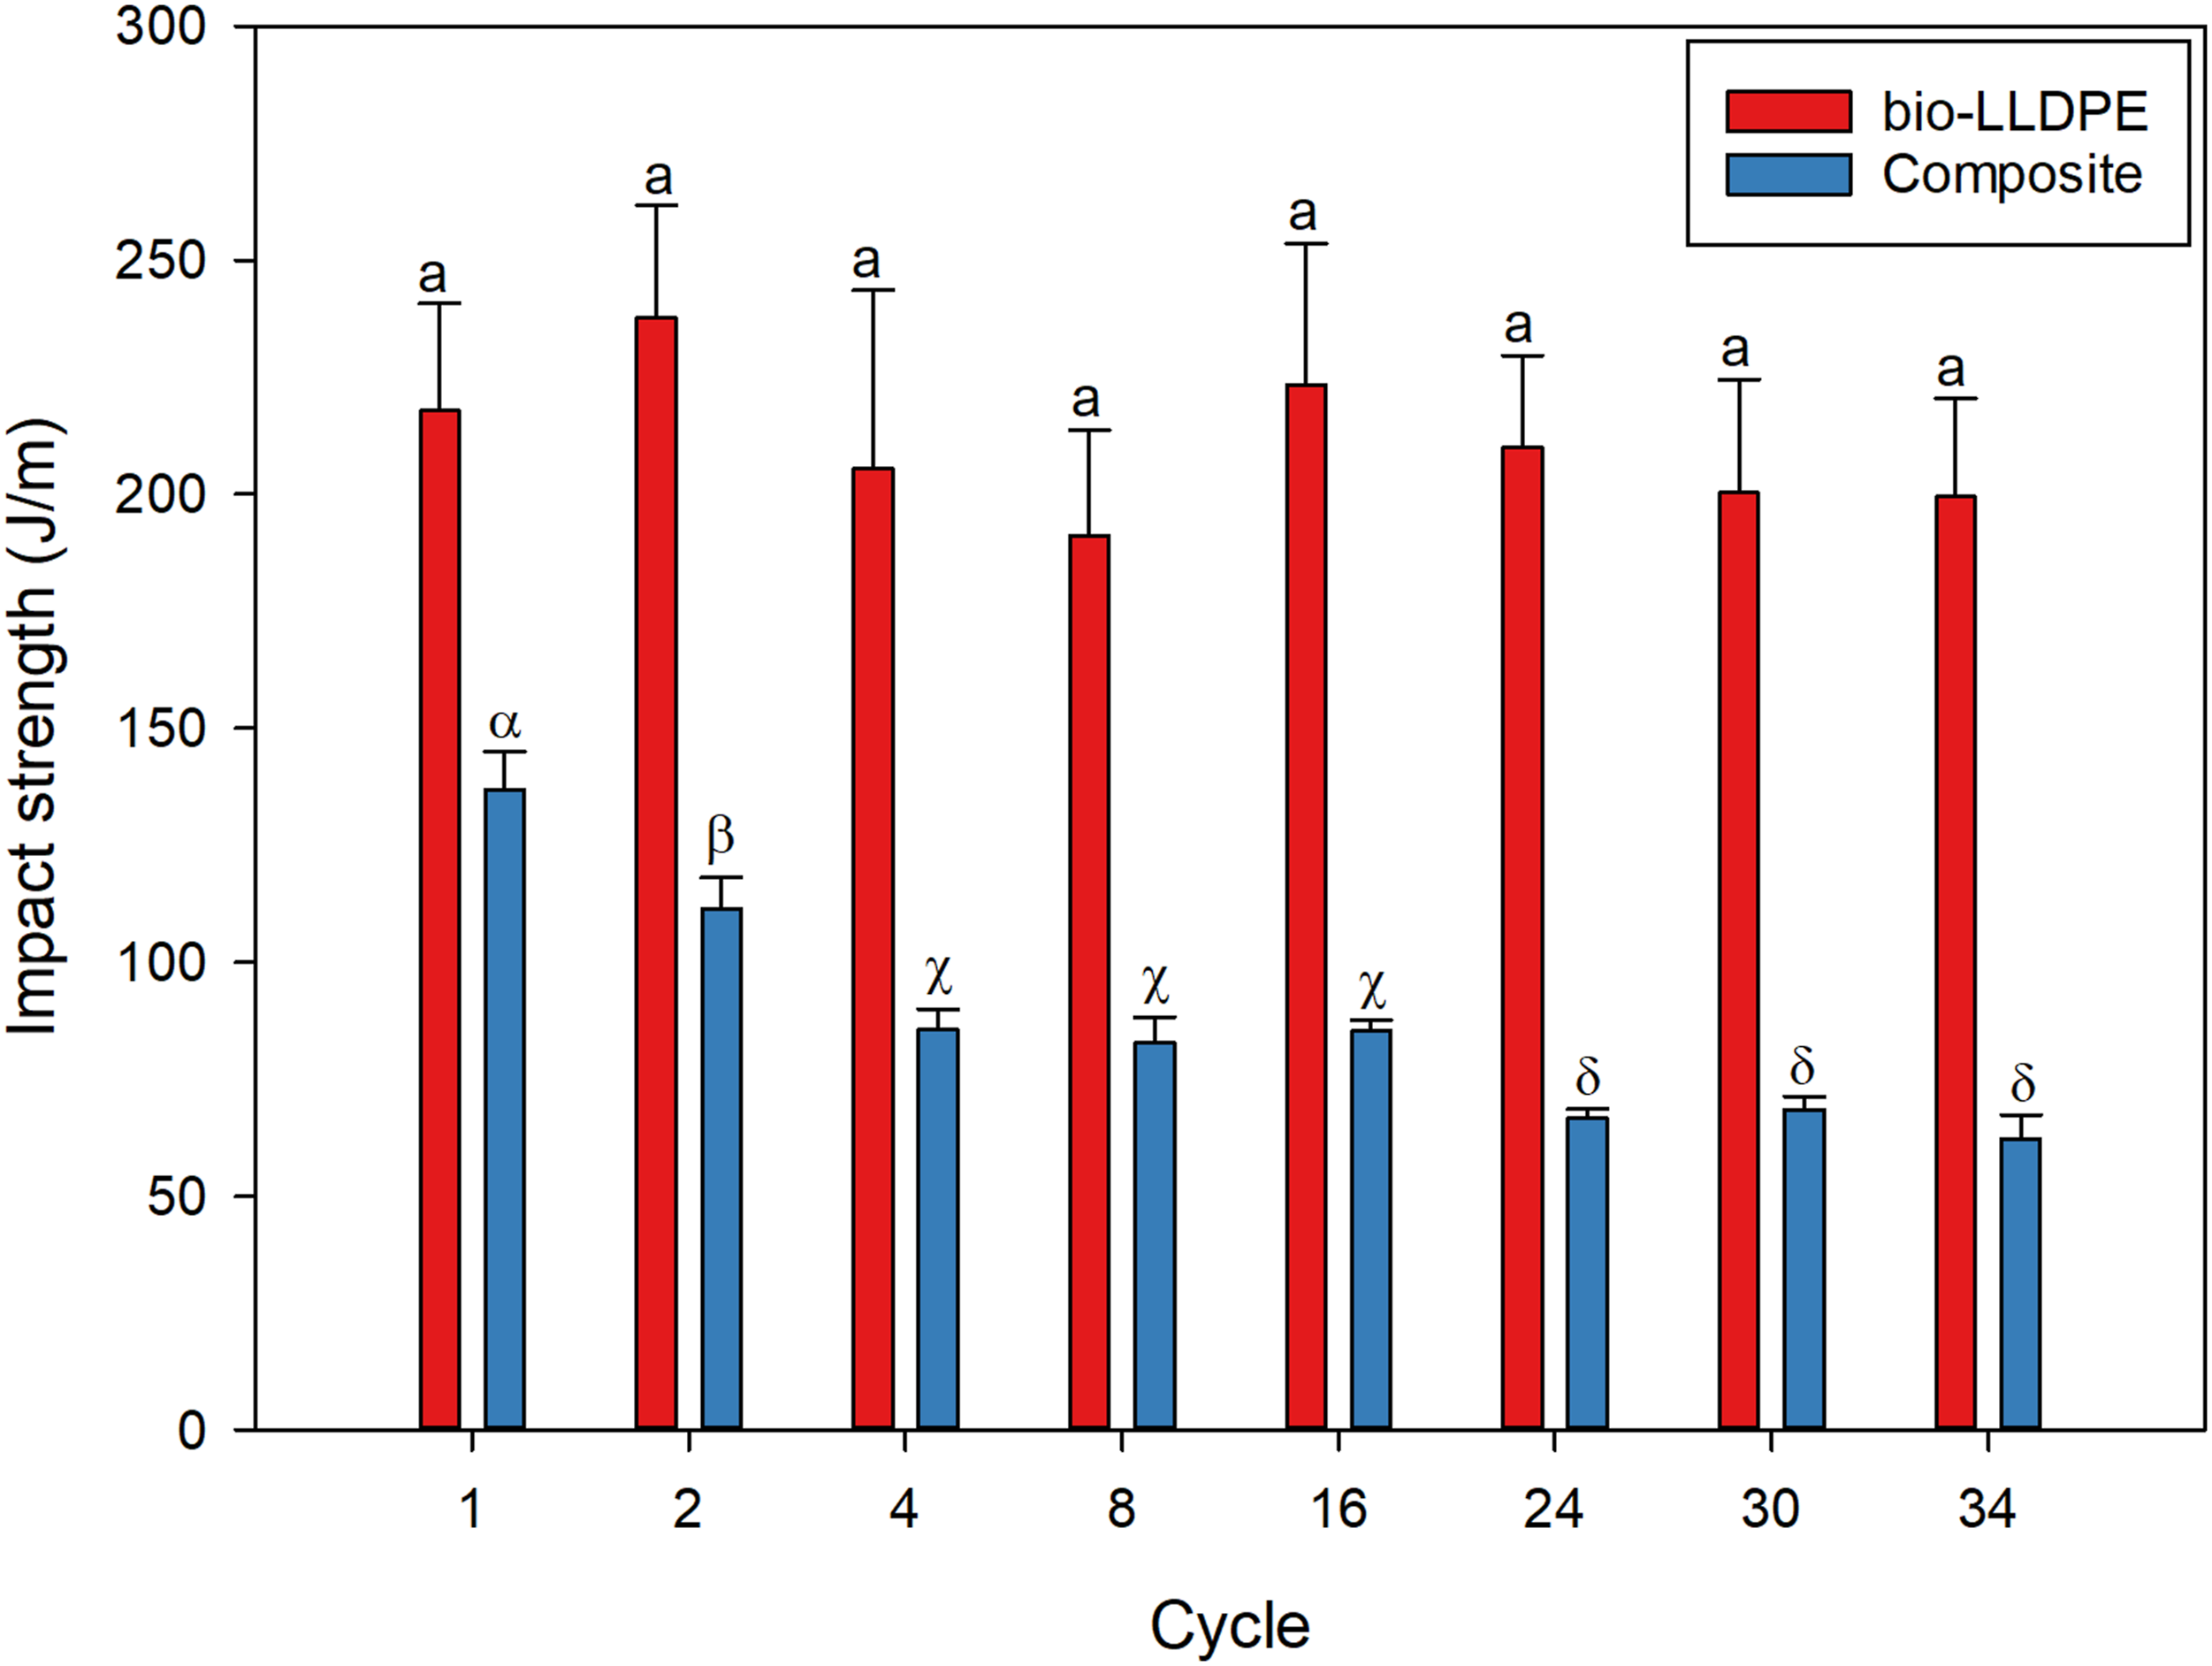
The reprocessing effect on the impact strength of the composites was more pronounced than in the neat bio-LLDPE. Between cycles 1 and 8, the impact strength significantly decreased from 137 J/m to 82 J/m. Longer fibers in composites are related to higher impact strength since the fiber pullout distance during the fracture will also be longer. 25 In this sense, the observed reduction can mainly be attributed to the gradual decrease in fiber dimensions due to reprocessing (Figure 2), resulting in lower energy absorption capacity.
Flexural tests
In Figure 6, the flexural modulus of neat bio-LLDPE is 362 MPa in the first cycle. Subsequent reprocessing cycles led to a gradual decrease in the flexural modulus, with values reaching 245 MPa in cycle C34. Incorporating agave fibers, known for their favorable structural properties, contributed to increased stiffness in the bio-LLDPE matrix, resulting in a substantial improvement up to 624 MPa (155% increase). Upon reprocessing the composites, the flexural modulus trend is similar to that of the matrix, experiencing a decrease from 624 to 479 MPa from cycle 1 to 16, after which the value remained relatively constant. This decrease can be attributed to lower polymer molecular weight due to chain scission and changes in the fiber size (Figure 2). Benoit et al.
26
made similar observations for the HDPE reprocessing for 50 extrusion cycles, noting a gradual decrease in the flexural modulus throughout the cycles. In another study involving flax fibers, with and without compatibilizer (MAPE), the flexural modulus decreased by 16% for samples without compatibilizer and 30% with compatibilizer. This decrease was associated with chain scission and fiber break-up during the reprocessing cycles.
16
Flexural modulus and flexural strength of the bio-LLDPE and its composites for different reprocessing cycles. Letters indicate significant differences.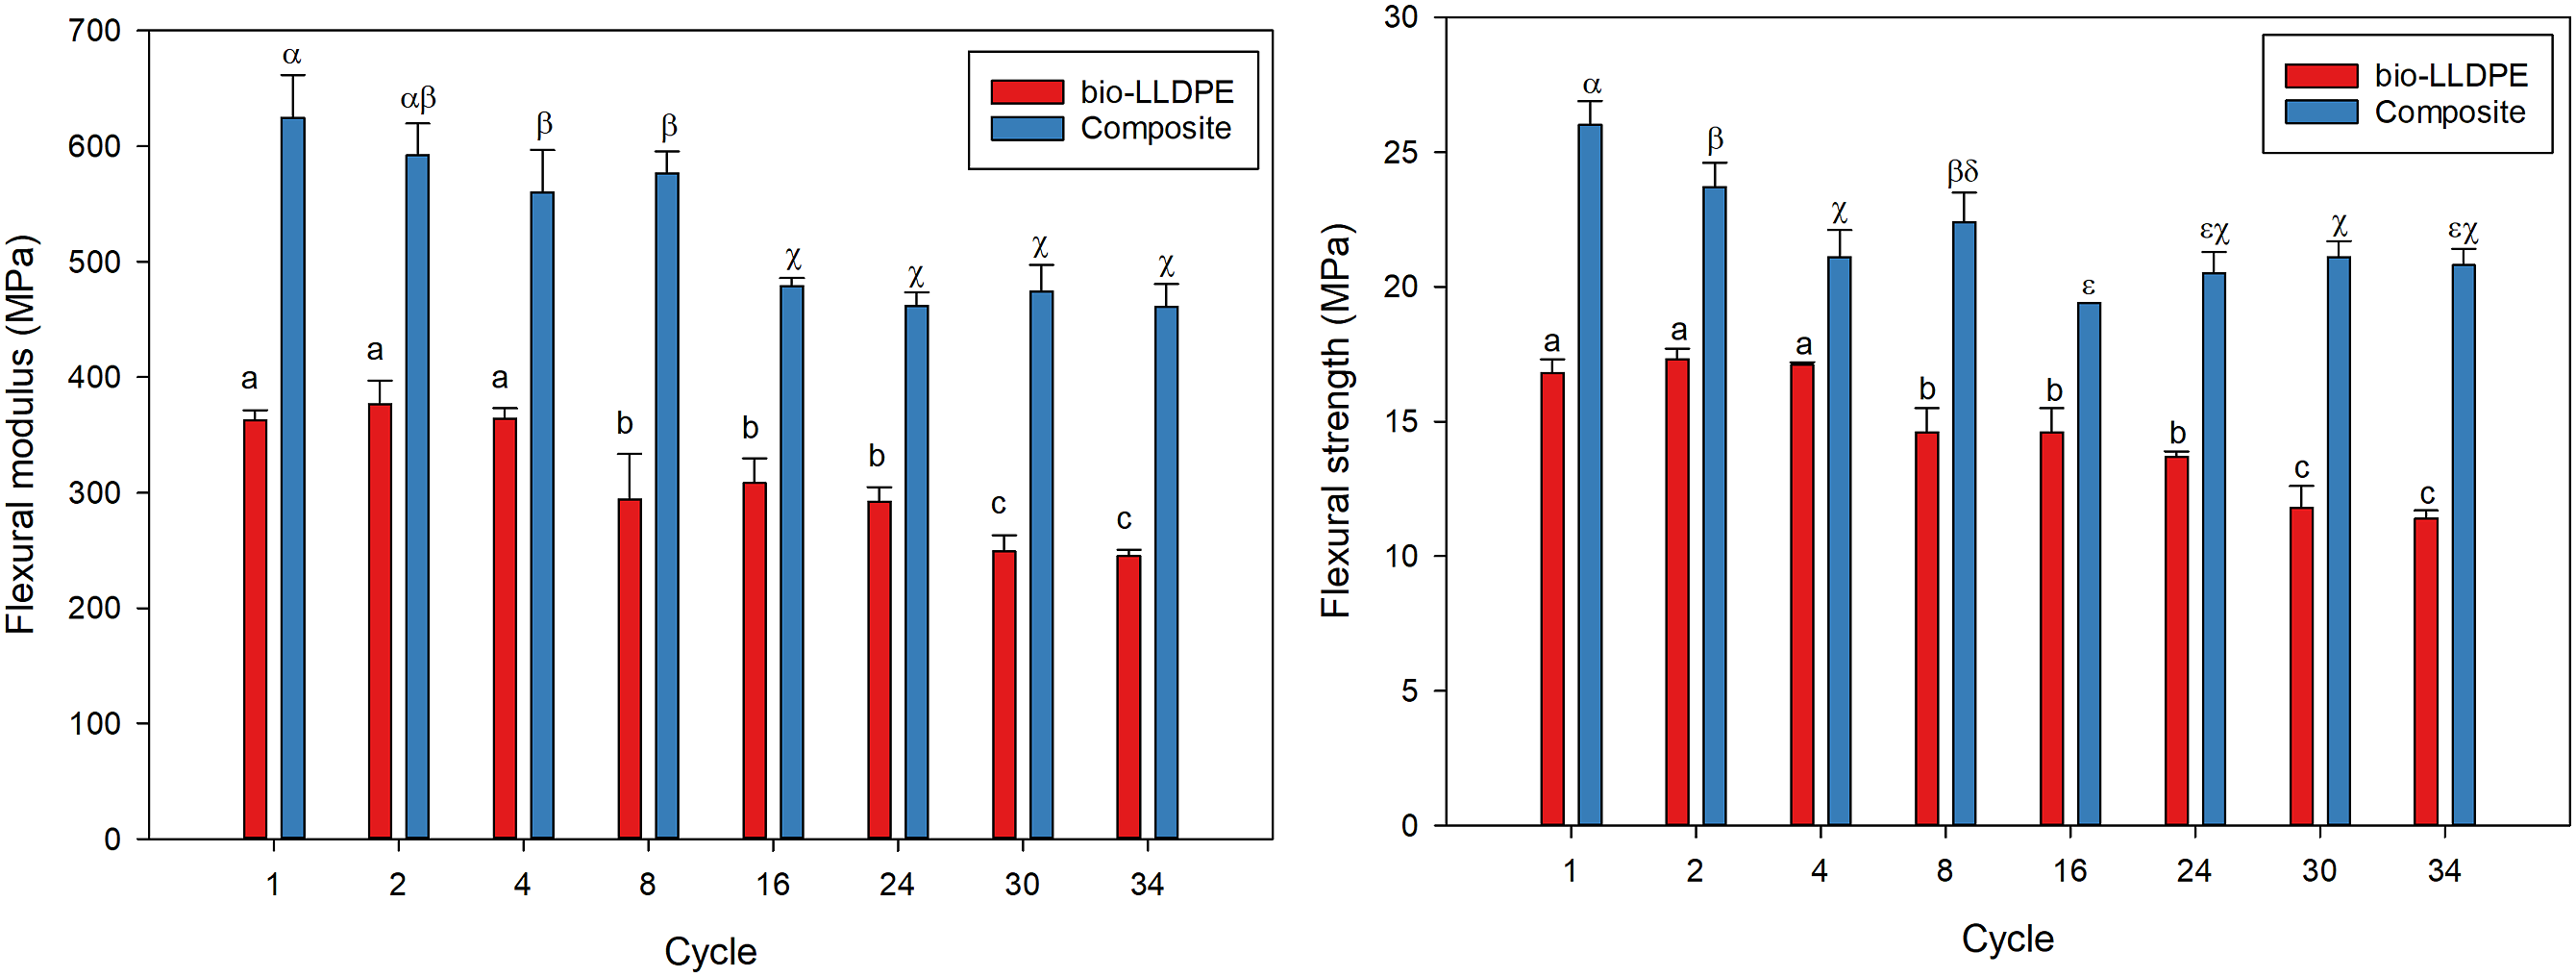
Figure 6 also presents the flexural strength of bio-LLDPE and its composites. In the initial cycle, bio-LLDPE exhibits a flexural strength of 16 MPa. The observed decreases in flexural strength during bio-LLDPE reprocessing suggest possible degradation reactions, leading to lower flexural strength down to 11 MPa. The incorporation of agave fibers, along with the use of a compatibilizing agent, results in a significant increase in flexural strength, reaching values as high as 26 MPa. This improvement is associated with better fiber-matrix adhesion in the biocomposite. Similar to the flexural modulus, the flexural strength experiences more significant losses during the first 16 cycles with a value of 19 MPa, but subsequently remains relatively constant for the following cycles around 20 MPa.
Tensile test
Figure 7 presents the tensile modulus of the bio-LLDPE and its composites. The initial tensile modulus of the neat bio-LLDPE (cycle 1) is 231 MPa, and subsequent cycles of reprocessed bio-LLDPE indicate minimal variation. Incorporating fibers into the bio-LLDPE significantly increased the tensile modulus, reaching 400 MPa, which can be attributed to the higher stiffness of lignocellulosic fibers compared to the polymeric matrix.
16
Moreover, reprocessing of the composites leads to further increases in the tensile modulus between cycle 1 and cycle 8, reaching values as high as 497 MPa. However, after cycle 8, the tensile modulus exhibits a decreasing trend due to the decreased fiber size (Figure 2) and polymer molecular weight. Tensile modulus, strength, and strain at yield of the bio-LLDPE and its composites for different processing cycles. Letters indicate significant differences.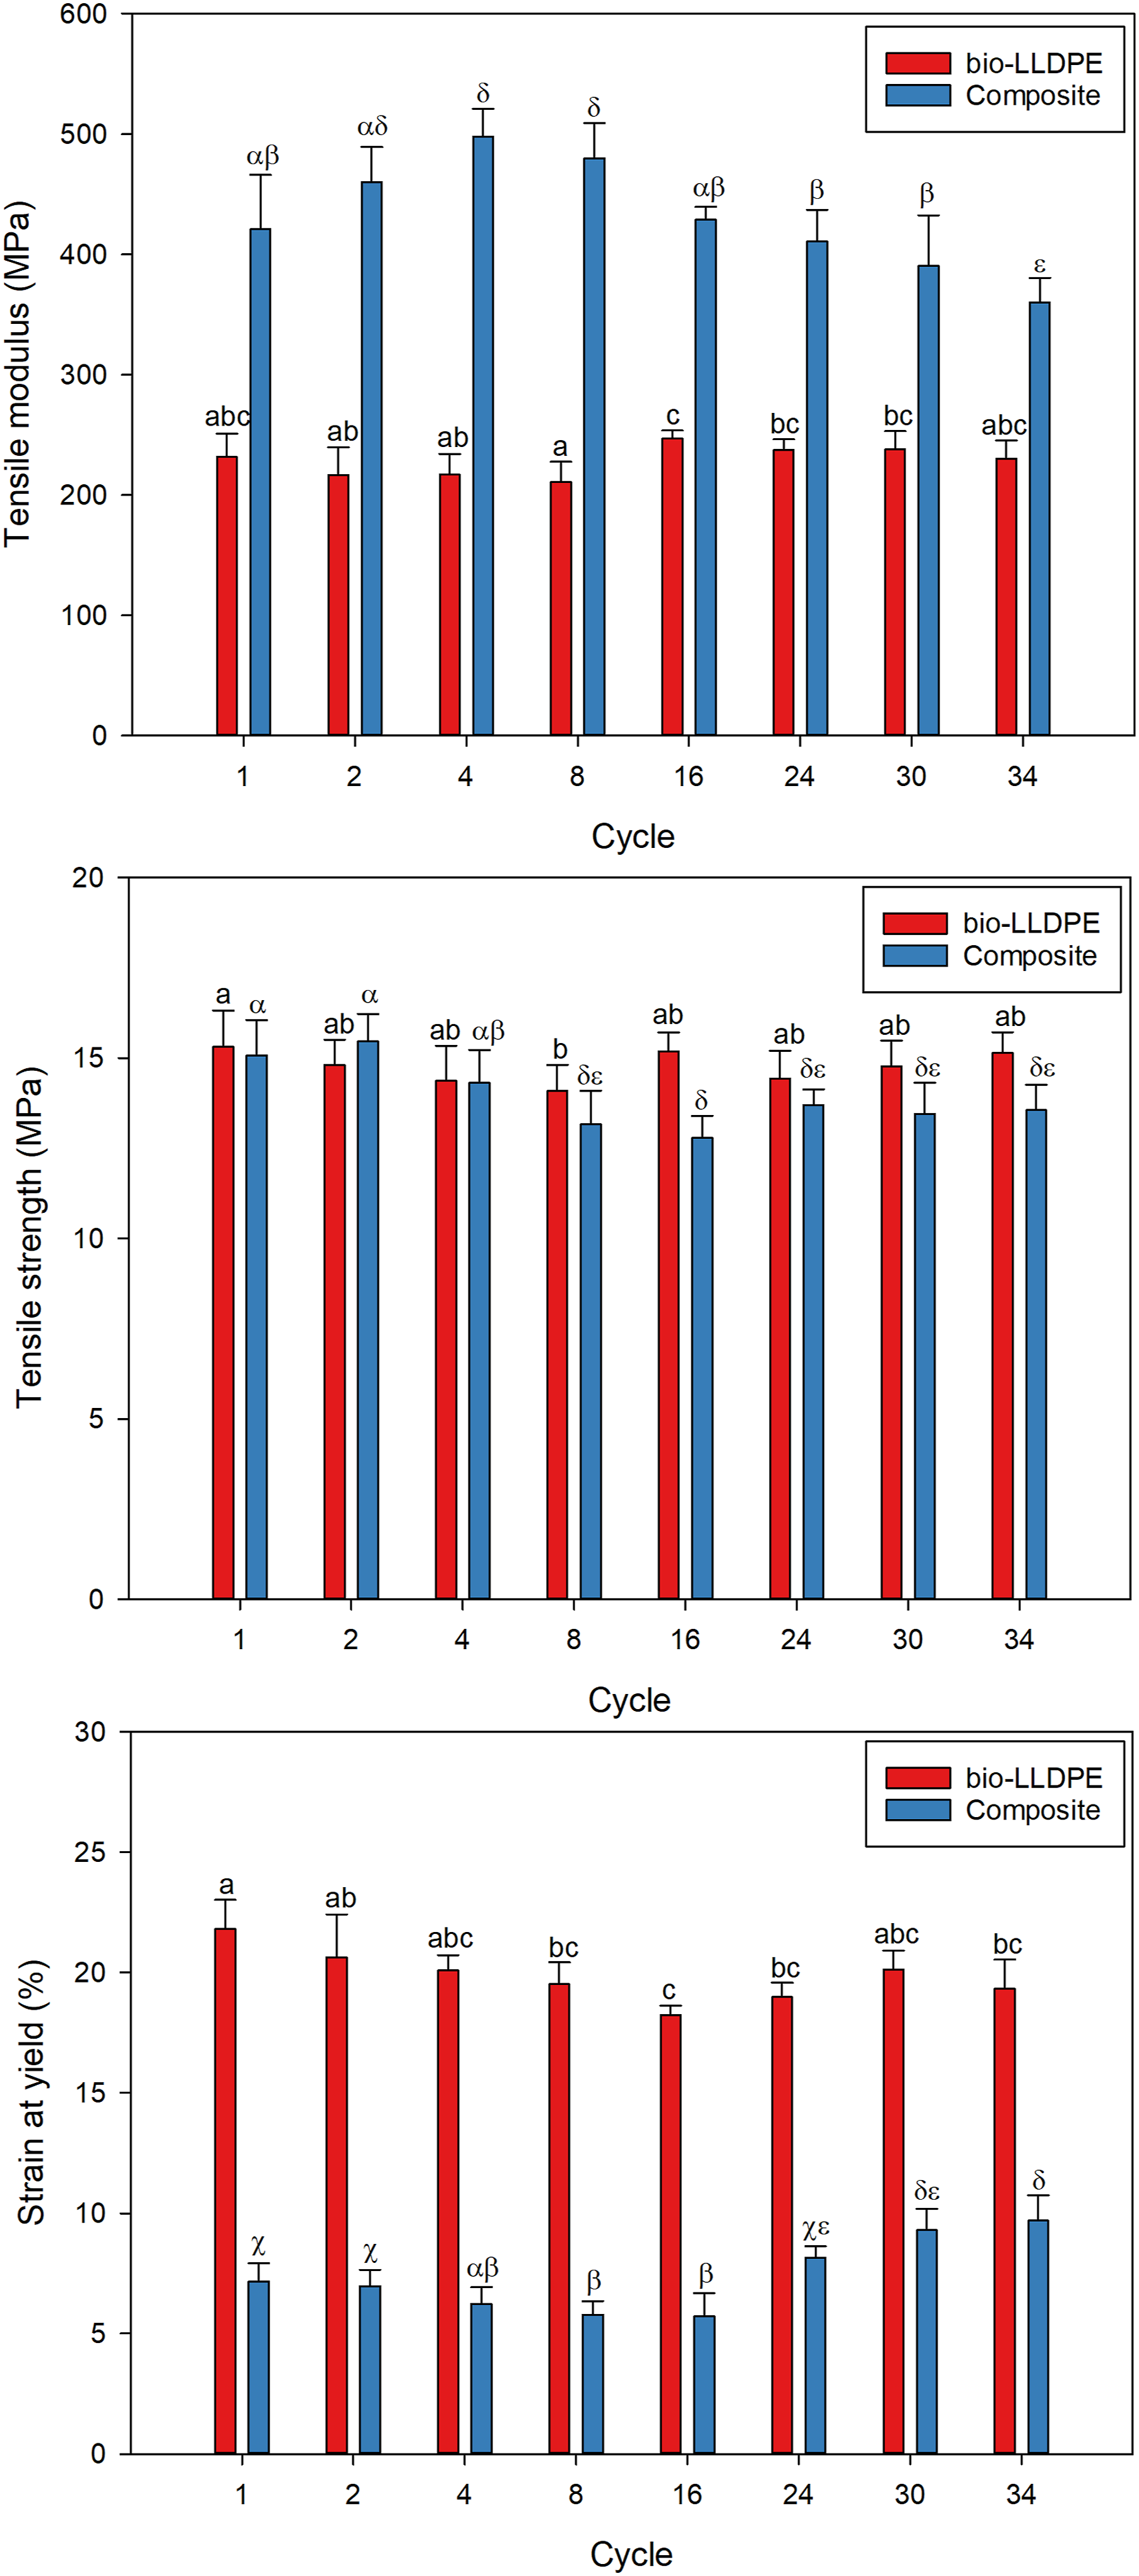
Figure 7 shows that the tensile strength for the neat bio-LLDPE is 15 MPa. Interestingly, the reprocessing cycles do not significantly affect the tensile strength of the neat matrix as its value remains nearly constant throughout the 34 reprocessing cycles, showing only significant differences in two cycles: 1 and 8.
Adding agave fibers and MAPE makes the tensile strength of the composites remain stable at 15 MPa, which could be attributed to improved interfacial adhesion. In the reprocessed composites, there was a slight but statistically significant reduction in tensile strength between cycles 2 and 16 (from 15 to 13 MPa), which correlates with changes in fiber dimensions, as shown in Figure 2. Debonding emerges as the primary micromechanical deformation process in short fiber-reinforced composites. In instances where it occurs, voids form under external loads, readily expanding into large cracks that culminate in failure. 27 Beyond reprocessing cycle 16, the changes in the agave fiber length become less significant. Consequently, the shorter agave fibers disperse more easily in the polymer matrix, maintaining the tensile strength at 13.5 MPa. The reprocessed neat bio-LLDPE exhibits constant strain at yield between the cycles, ranging from 18% to 20%. Conversely, adding agave fiber reduces the deformation of bio-LLDPE, and the strain at yield begins to increase significantly, rising from 5.7% at cycle 16 to 9.7% at cycle 34. Increased values from cycle 16 onwards can be attributed to fiber degradation as the composites behave more like the neat matrix.
Water absorption
Figure 8 shows the water absorption results as a function of time and the maximum uptake at different reprocessing cycles. Upon fiber addition into the matrix, a substantial increase in water absorption capacity was observed, reaching up to 9%, in contrast to less than 0.3% for neat bio-LLDPE.
12
Figure 8 illustrates that the maximum water absorption occurs between 1000 and 1200 h. The hydrophilic behavior of the fibers makes lignocellulosic composites highly prone to swelling and alterations in their dimensional stability.
28
This drawback necessitates careful consideration of their possible applications. Interesting results were observed with the reprocessing of the composites as the water absorption (rate and capacity) decreases. Furthermore, the material from cycle 1 exhibits the highest maximum absorption capacity, and the effect of reprocessing leads to a slight decrease in the maximum water absorption (a decrease of 11% between cycles 1 and 4). The reduction in water absorption rate and maximum capacity is attributed to the smaller fiber size and improved fiber dispersion within the matrix as the number of cycles increases (Figure 2). These factors contribute to less interfacial voids and better fiber encapsulation. (a) Water absorption of the composites as a function of time for different processing cycles and (b) water absorption capacity as a function of the number of reprocessing cycles. Letters indicate significant differences.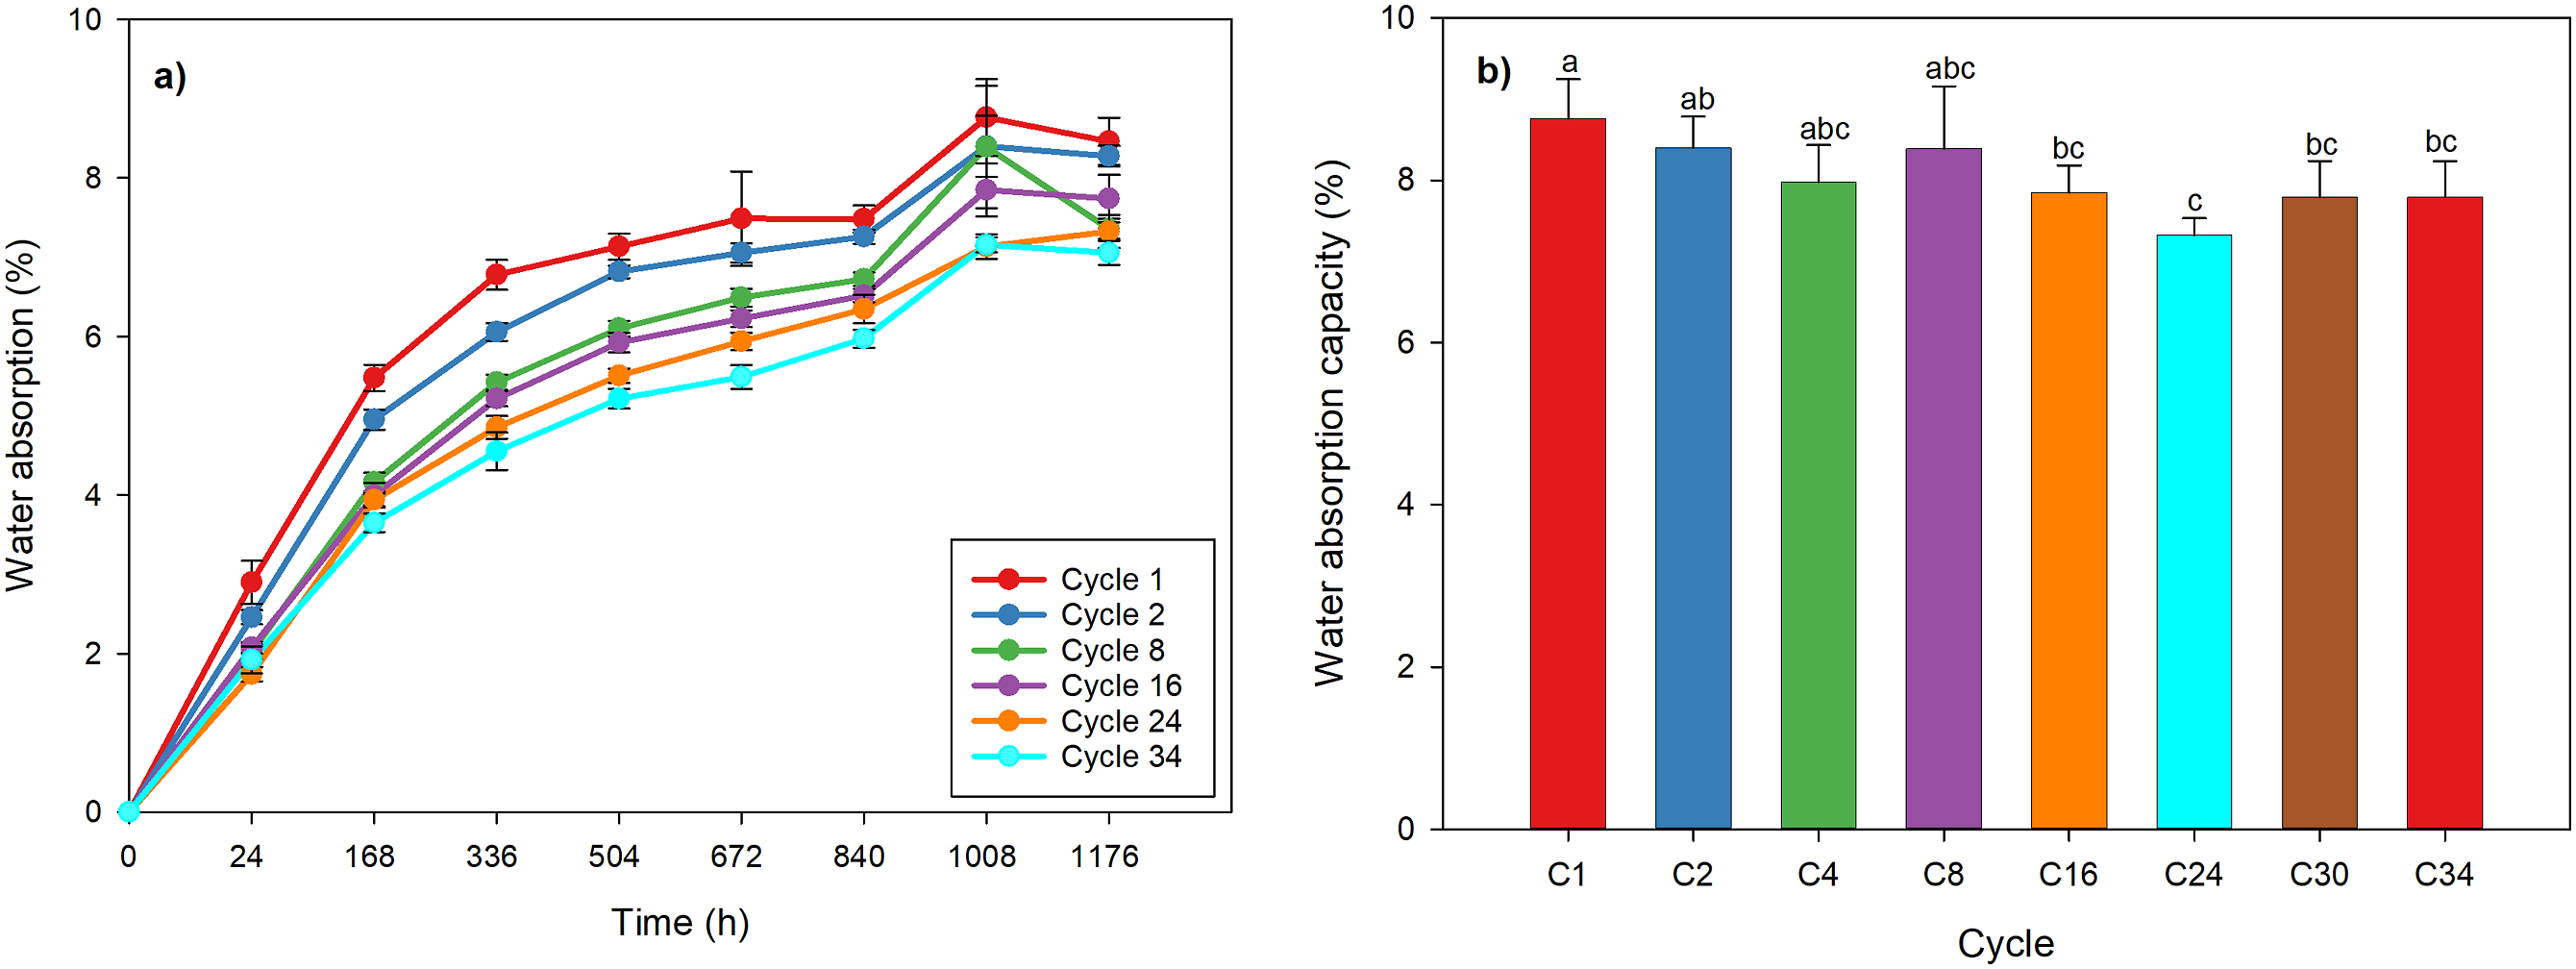
Thermal properties
The TGA thermograms of bio-LLDPE are shown in Figure 9. The degradation of the bio-LLDPE starts around 350°C and ends around 520°C. Since bio-LLDPE is highly hydrophobic, no weight loss is observed in the 50 to 150°C range, where moisture is usually removed. For composites based on natural (lignocellulosic) fibers, four zones are generally observed: a weight loss between 50 and 150°C corresponding to moisture evaporation; a second stage in the range of 230°C–350°C corresponding to the decomposition of low molecular weight components such as hemicelluloses; a third stage between 350 and 410°C related to the thermal decomposition of cellulose; and a fourth stage above 410°C where lignin degradation occurs.
29
To better understand the degradation processes, Figure 9 also presents the derivative of the weight loss with respect to the temperature. For the bio-LLDPE (C0), a main peak is observed, representing the degradation of the neat polymer (maximum point at 395°C) and a secondary overlapping peak at 510°C that can be associated with the degradation of the green pigment. The composites have two main peaks and some overlapping peaks (shoulders), indicating the superposition of several degradation reactions. The effect of reprocessing on the degradation processes of both materials is significant, as can be seen in these curves. In the case of bio-LLDPE, there are overlapping peaks, and for the composites, there is a shift and change in the magnitude of the peaks. These results may indicate that reprocessing generates species degrading at temperatures different from those of unprocessed polymers and agave fibers. TGA and DTG curves (air atmosphere) of the bio-LLDPE and its composites for different reprocessing cycles.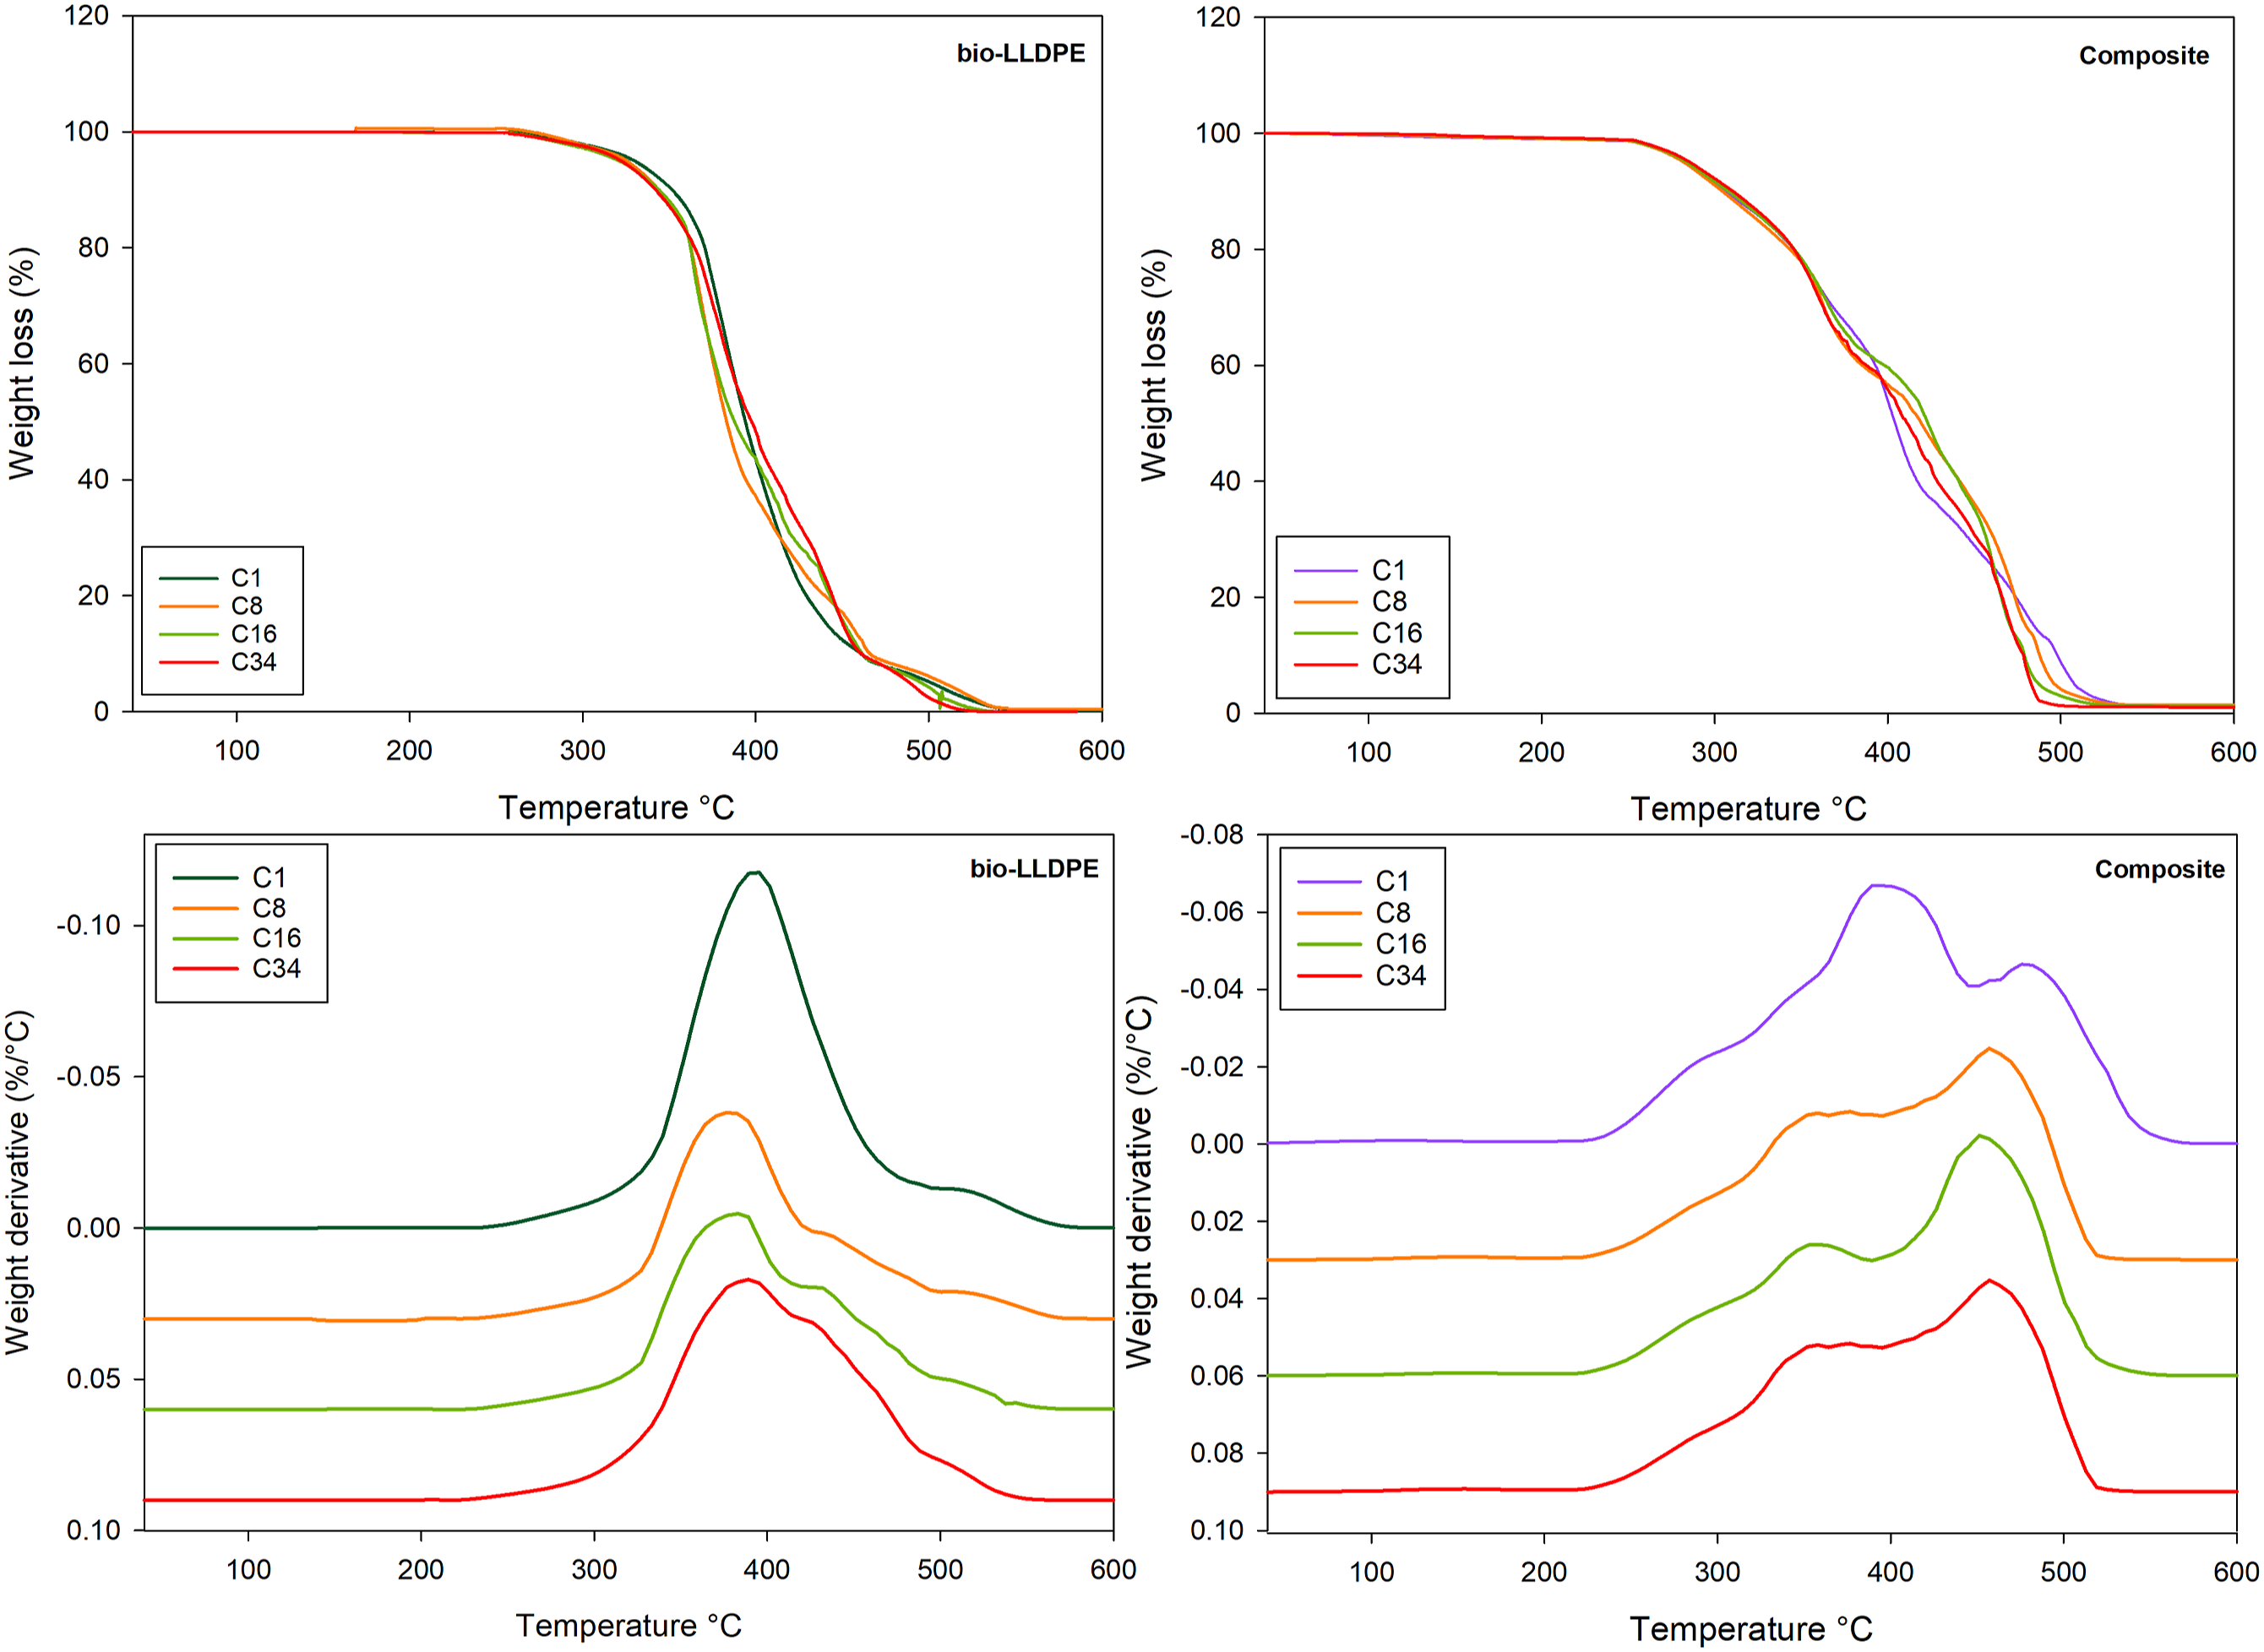
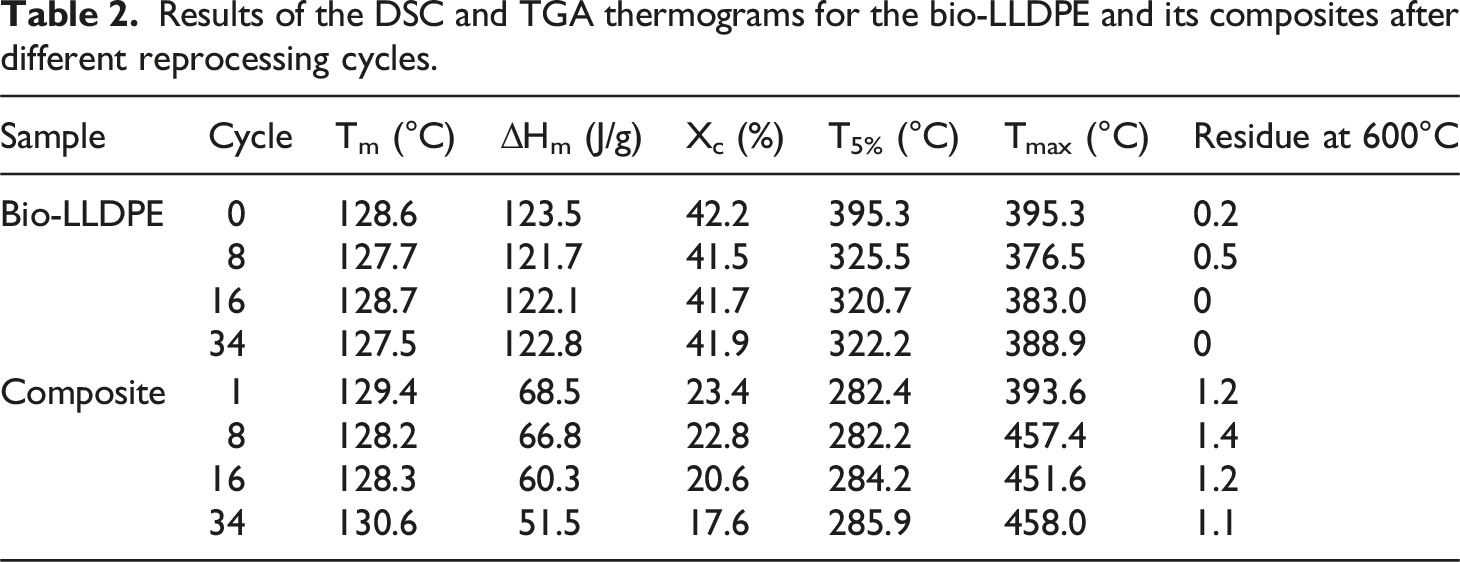
Results of the DSC and TGA thermograms for the bio-LLDPE and its composites after different reprocessing cycles.
Color change
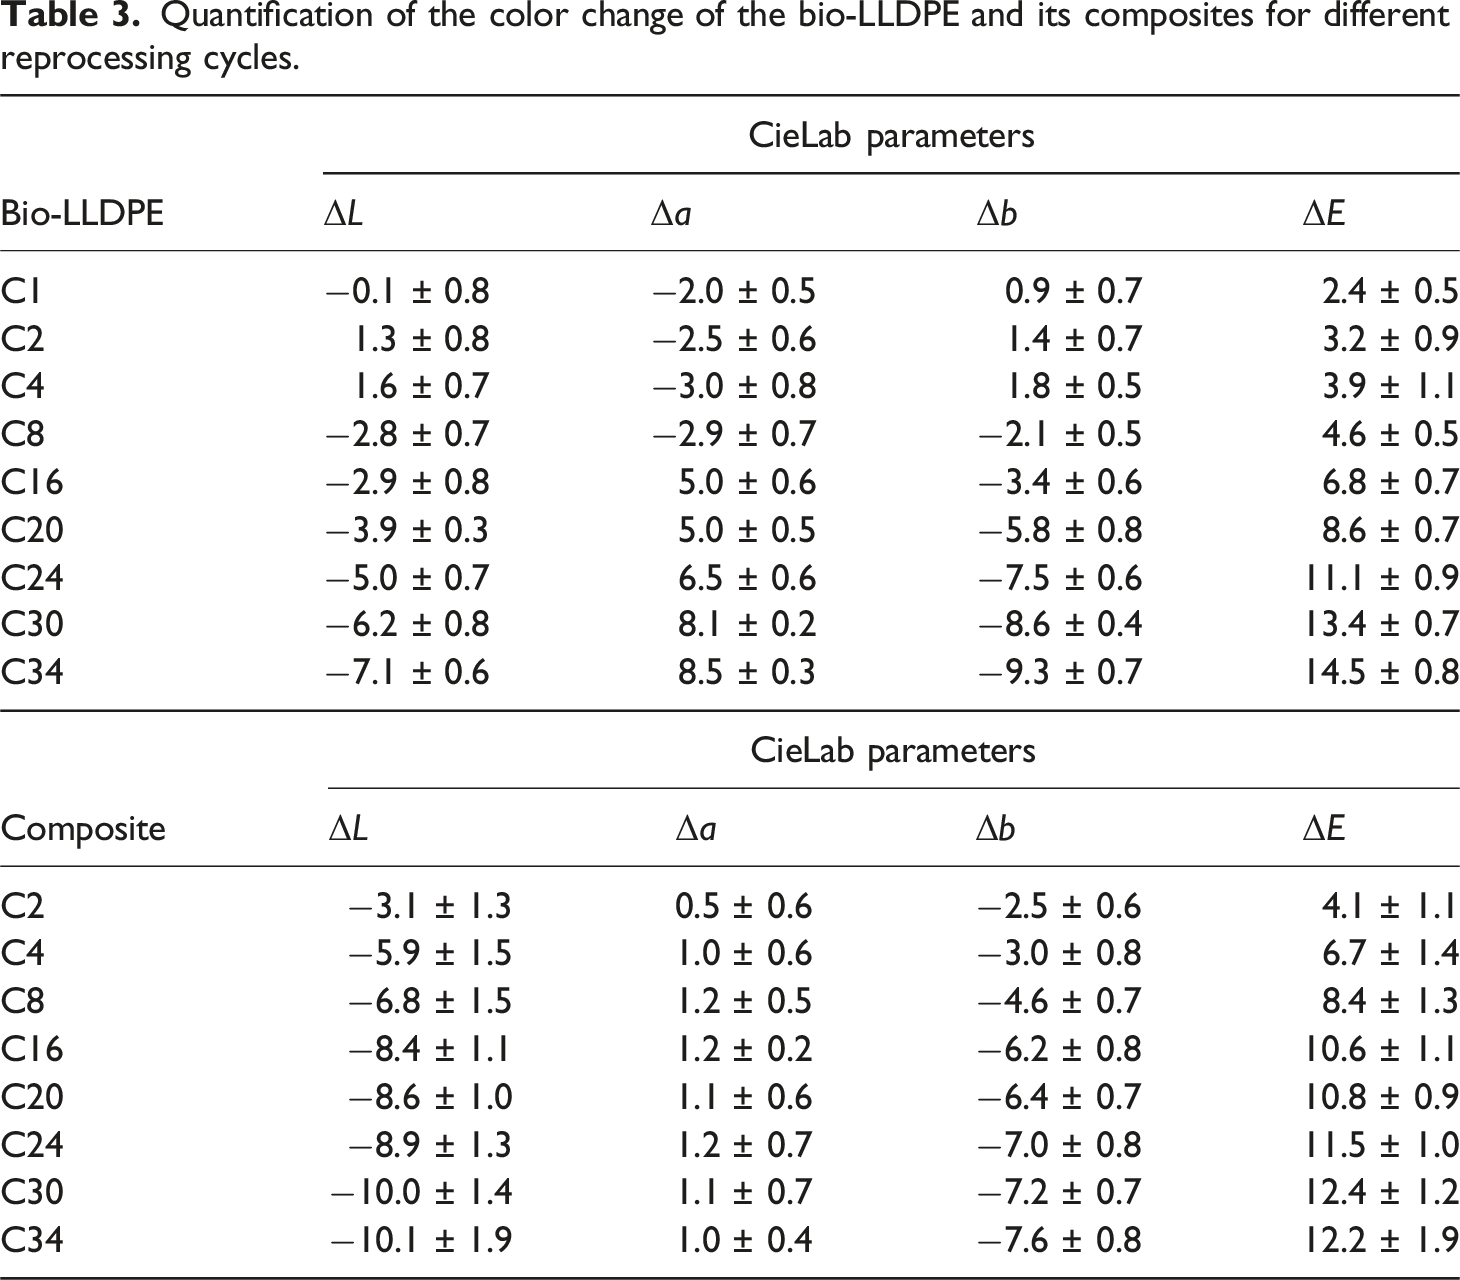
Color change after reprocessing is another essential parameter for applications where visual appearance is important, and the results are presented in Figure 10. The ΔL, Δa, and Δb values were calculated by taking sample C0 as a reference for the bio-LLDPE (L = 71.42, a = −28.12, b = 39.01) and C1 for the composite (L = 44.89, a = 3.66, b = 10.19). Visual color changes through the cycles of (left) bio-LLDPE and (rigth) its composites.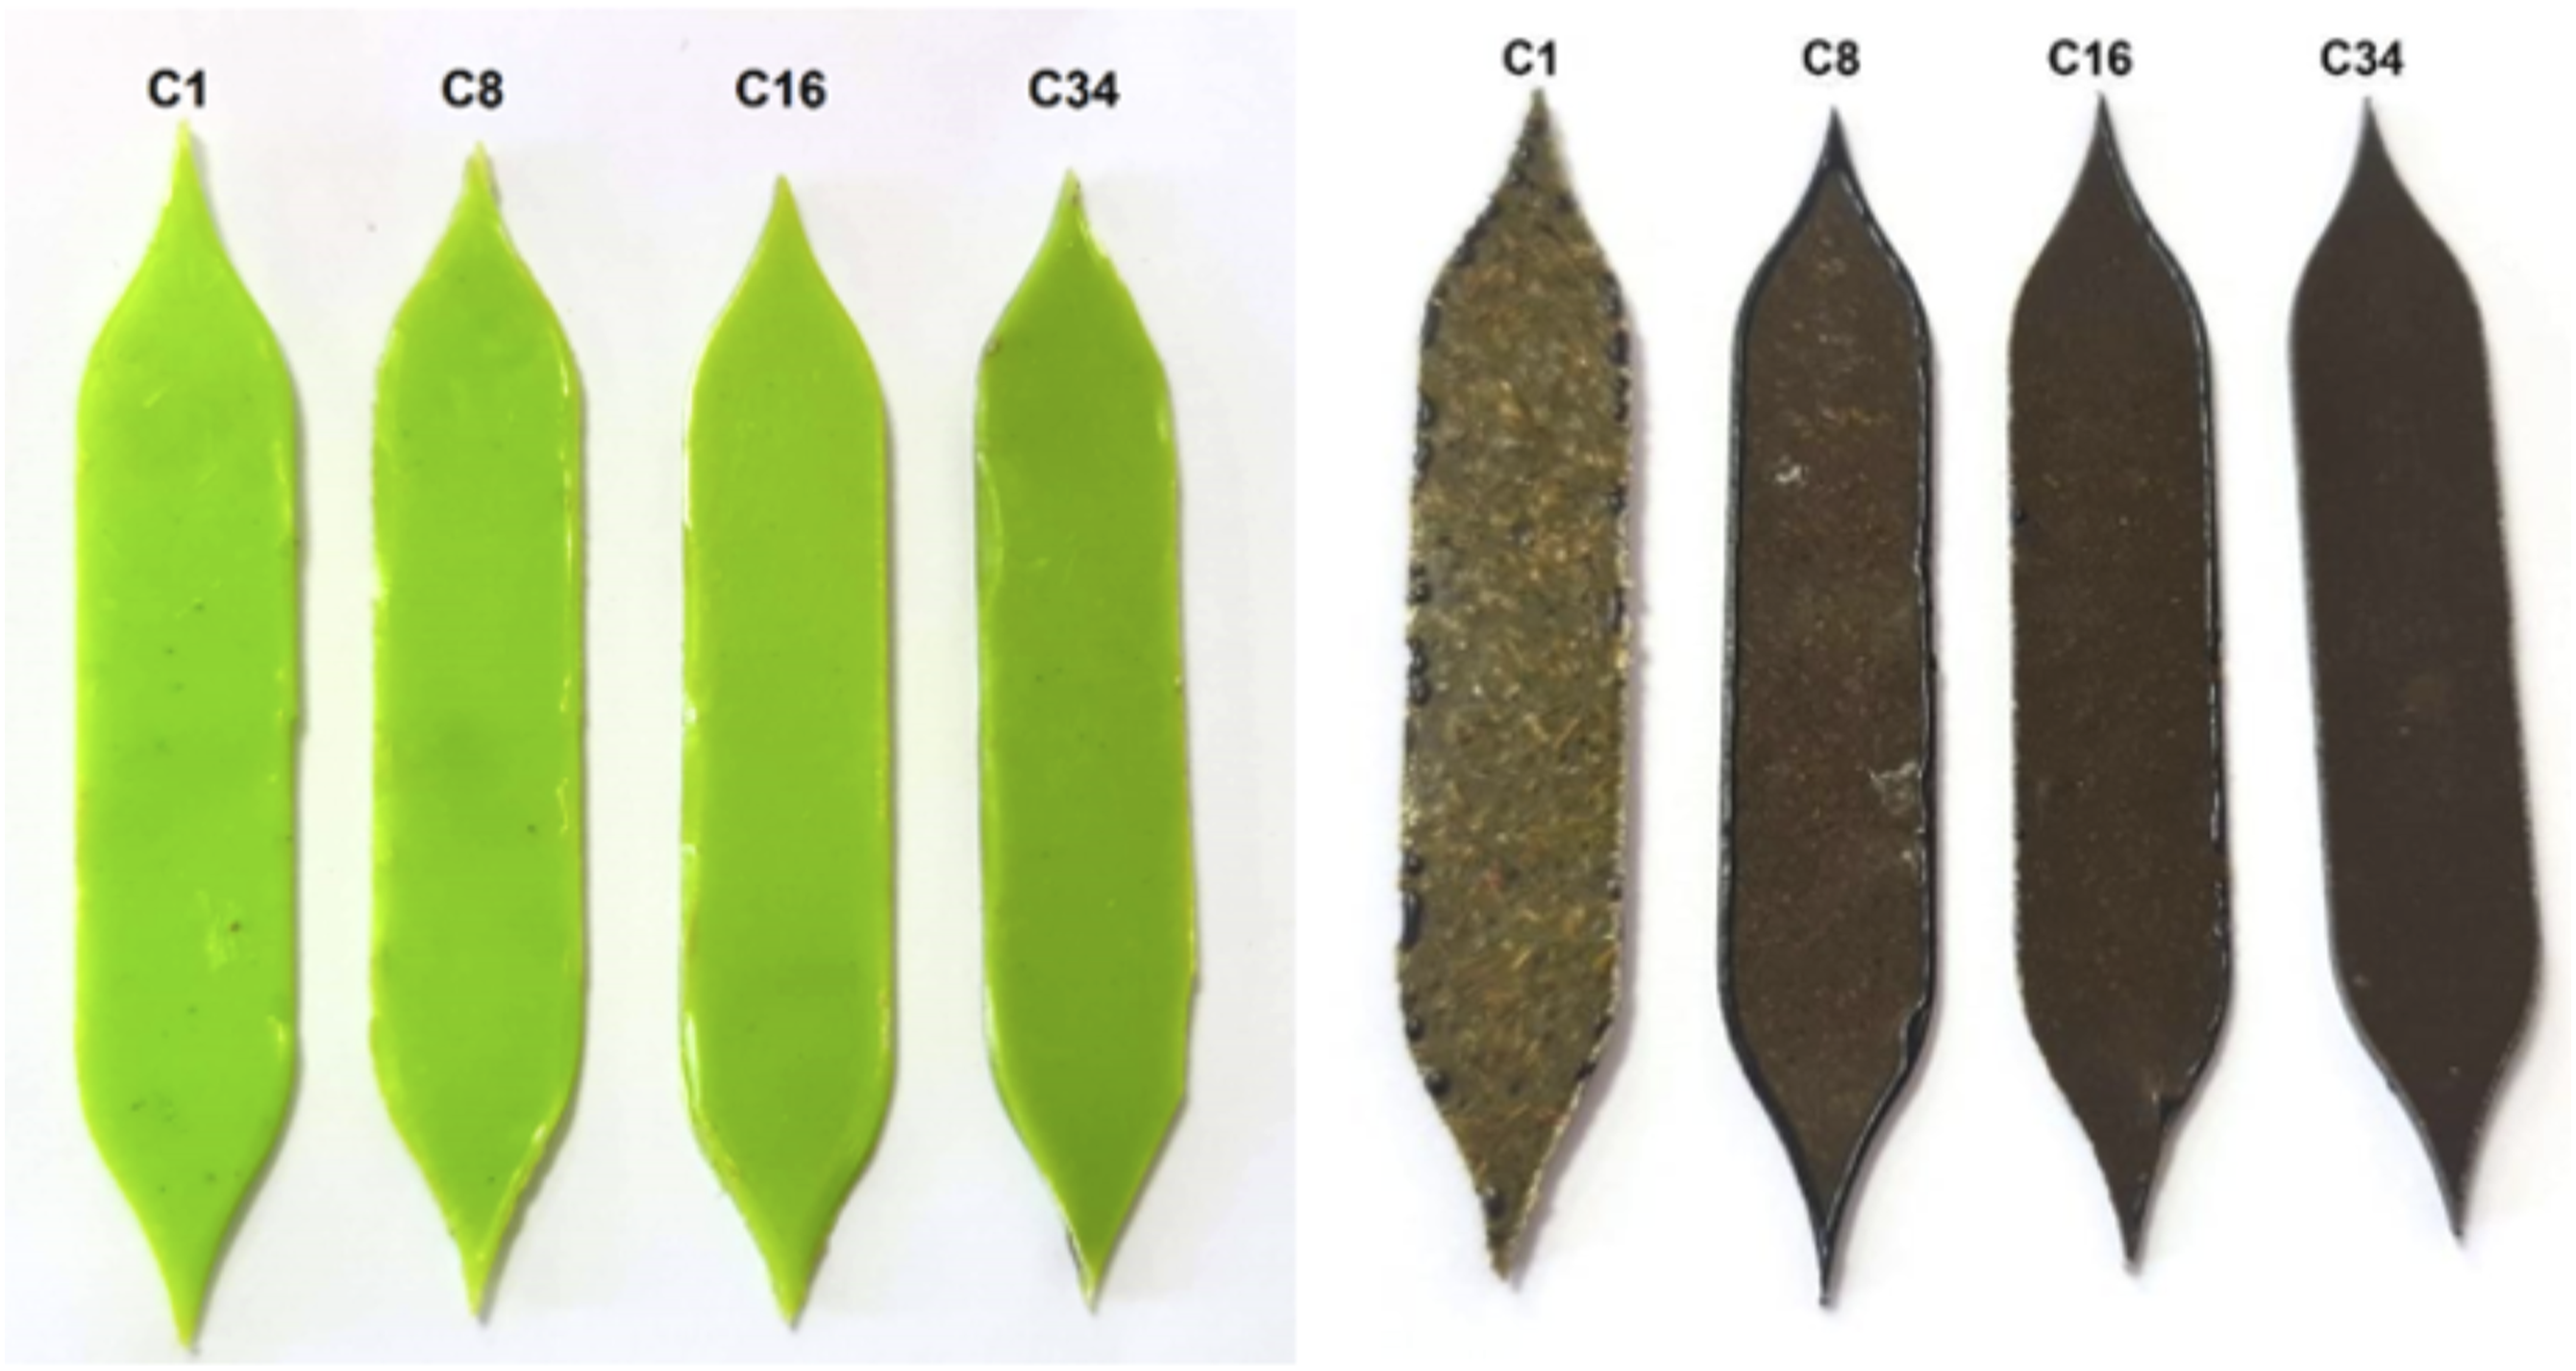
Quantification of the color change of the bio-LLDPE and its composites for different reprocessing cycles.
Conclusions
This study involved bio-LLDPE as the matrix and agave fibers (30% wt.) to determine how the properties changed with mechanical reprocessing (closed-loop extrusion). A total of 34 cycles were performed to get information on the long-term properties, including morphological, mechanical, physical, rheological, and thermal.
The viscosity of bio-LLDPE and its biocomposite slightly decreased with reprocessing without affecting their reprocessability. The viscous and elastic moduli, as well as the complex viscosity of the bio-LLDPE and its composites, decreased with higher temperatures. Nevertheless, the rheological properties were not significantly affected by reprocessing. As for the mechanical properties, the tensile tests showed that strength and modulus were not significantly affected for the number of cycles investigated, while the strain at yield decreased over the first 16 cycles before stabilizing. For the flexural properties, the modulus and strength decreased by up to 30% over 34 extrusion cycles, showing that this property is much more affected by possible macromolecular chain scission and fiber break-up. The impact strength also decreased mainly due to fiber size reduction. However, values above 75 J/m were obtained, much higher than those of other commercial or biobased polymers.
Thermal properties, such as melting and degradation temperatures, were slightly affected by reprocessing (with minor changes in crystallinity). However, color change for the neat bio-LLDPE and its biocomposite was one of the properties most affected by reprocessing due to thermal and oxidative degradations occurring over material reprocessing.
In general, the results showed that reprocessing of bio-LLDPE and its composites with relatively high agave fiber content (30% wt.) is possible without substantial changes in their properties, thus generating products with a long lifetime when recycled.
Footnotes
Author contributions
All authors whose names appear on the submission: 1) made substantial contributions to the conception or design of the work; or the acquisition, analysis, or interpretation of data; or the creation of new software used in the work; 2) drafted the work or revised it critically for important intellectual content; 3) approved the version to be published; and 4) agree to be accountable for all aspects of the work in ensuring that questions related to the accuracy or integrity of any part of the work are appropriately investigated and resolved.
Declaration of conflicting interests
The author(s) declared no potential conflicts of interest with respect to the research, authorship, and/or publication of this article.
Funding
The author(s) disclosed receipt of the following financial support for the research, authorship, and/or publication of this article: S. E. González-Aguilar acknowledges the financial support of the Mexican National Council of Science and Technology (CONACyT) for a scholarship (1106074).
Data availability statement
The datasets generated during and/or analyzed during the current study are available from the corresponding author upon reasonable request.