
Abstract
Polymethyl methacrylate (PMMA) has been widely used as a material in dentistry. The deterioration of pure PMMA denture teeth is a significant issue that can alter the vertical dimensions of dentures. This study investigates the effect of aluminum oxide (Al2O3) nano-ceramic addition as reinforcements into the heat-cure acrylic resin denture teeth. The PMMA was reinforced with Al2O3 concentrations of 1, 3, 5, and 10 wt.%. The PMMA without ceramic addition is produced for comparison purposes. The color change, densification, microhardness, and compressive properties of the produced PMMA resin and its composites were investigated to detect the effect of Al2O3 nano ceramic addition on the physical and mechanical properties. Furthermore, the microstructure was also performed using scanning electron microscopy (SEM) analysis. A chewing simulator was utilized to conduct two-body wear testing, employing a human enamel antagonist. The wear behavior of the PMMA and their composites were assessed by measuring the weight loss after submitting them to 37,500 cycles. The SEM microstructure analysis revealed sound specimens of PMMA reinforced with 0, 1, 3, and 5 wt.% Al2O3 without any porosity and micro defects using the applied production procedures. In contrast, the aggregated sites and propagation of cracks were detected for the PMMA/10 wt.% Al2O3 specimen. The densification and hardness properties of the produced PMMA composites improved with increasing the Al2O3 additions. The microhardness of PMMA/10 wt.% Al2O3 improved by around 233% compared to the PMMA matrix. The higher compressive properties were detected for the PMMA/5 wt.% Al2O3 composite specimen with ultimate compressive strength (UCS) of 54.75 MPa and yield strength (YS) of 45.6 MPa and improved than the PMMA matrix by around 98 % and 117 %, respectively. In addition, incorporating Al2O3 nano-ceramic particles into a PMMA matrix revealed a significant improvement in the wear resistance of the produced composites compared to the PMMA matrix.
Introduction
Polymethyl methacrylate (PMMA) has been widely used as a base material in dentistry. Since its introduction to denture applications, it has been owing to its excellent biocompatibility in the oral environment, ease of usage, acceptable aesthetic, lower susceptibility to clicking or fracture, color-matching ability, lightweight, and cheap cost.1–3 Despite this, there are several drawbacks, the most notable of which are inadequate surface hardness and low flexural strength, which might increase the risk of denture fracture.4,5 Previous investigations showed that over 60 % of PMMA dentures fail within some years after being produced. 6 Numerous studies have been conducted to enhance the properties of PMMA. Numerous investigations have been undertaken to improve the properties of PMMA involving reinforcement with metallic plates or wires and fibers.7,8 Firstly, stainless steel or Co/Cr alloys produce metallic plates or wires.9,10 However, these metallic alloys exhibit limitations at odds with the accepted standards, such as poor bonding between the PMMA resin and the reinforcing metal. 11 This poor adhesion reduces the properties of PMMA resin dentures and induces poor aesthetics. In addition, metal-reinforced PMMA becomes noticeably heavier, and they may be costly and tend to corrosion. 11 Other studies focused on improving PMMA resin properties include fiber reinforcement.9,12 Different fibers like aramid fiber, 13 carbon fiber,14,15 nylon fiber,16,17 and glass fiber18,19 have all been investigated. Ultra-high polyethylene fiber does not indicate good bonding to PMMA resin; thus, no notable improvement in properties has been marked. Aramid and carbon fibers are unsuitable reinforcement due to difficulties in polishing and poor aesthetics of the final products. However, nylon reinforcement improves the properties of the PMMA acrylic resins. An investigation by Vallittu et al. 18 on the heat-cured PMMA resin reinforced with glass fiber revealed improved PMMA/glass fiber properties. However, a random distribution of the fibers in the resin matrix might lead to defects in the final product. 20 Also, controlling the orientation of the fibers in the PMMA resin matrix is technically tricky. 21 Recently, nano-ceramic materials, such as bio-ceramic nanoparticles, have been studied for their potential to enhance the properties of PMMA acrylic resins in recent years.5,22–24 Aluminum oxide (Al2O3) is a ceramic material commonly used to manufacture dentures as reinforcements for the PMMA.25,26 It is biocompatible, which means it does not cause an allergic reaction when it comes into contact with the body.27,28 It is also strong, durable, and wear and tear-resistant.29,30
Available previous works applied the Al2O3 as reinforcement to produce PMMA/Al2O3.
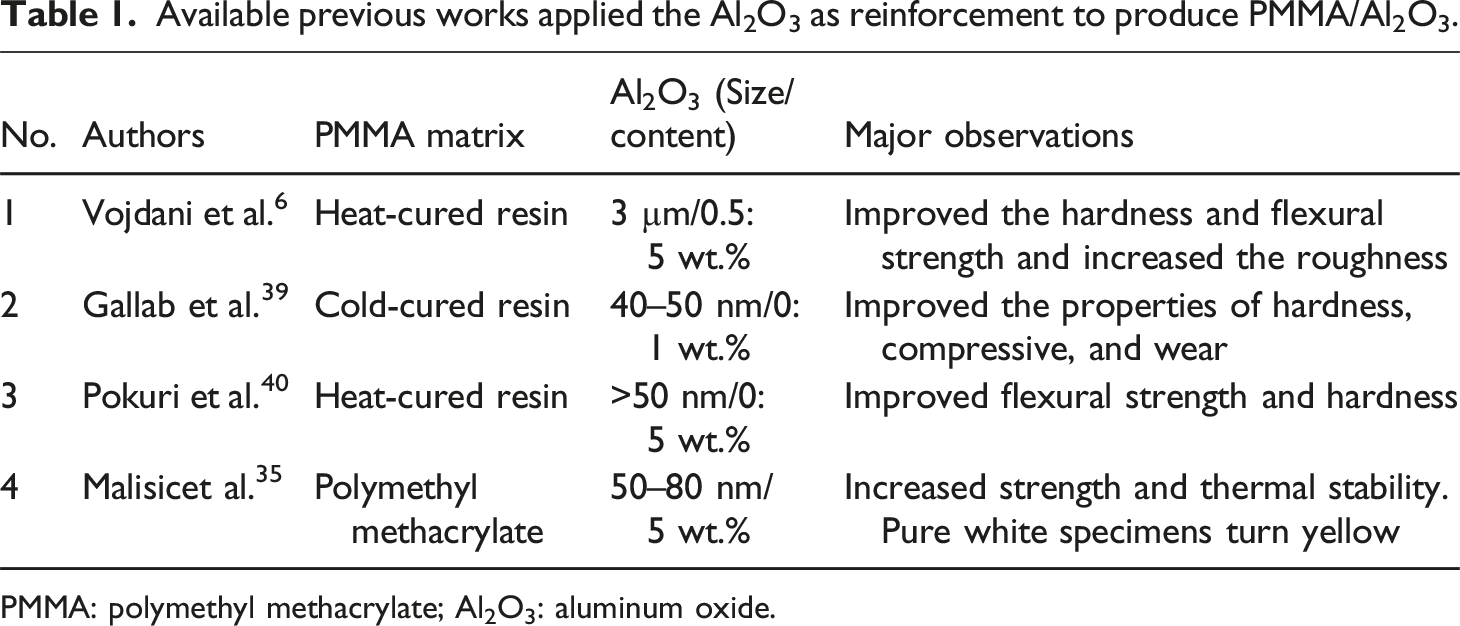
PMMA: polymethyl methacrylate; Al2O3: aluminum oxide.
Based on the available previous works, Vojdani et al. 6 and Pokuri et al. 40 applied the Al2O3 as reinforcements with a concentration ranging from 0.5:5% and 0:1%, respectively, to enhance the Heat-cure acrylic resins. In the investigation of Vojdani et al., 6 the results showed that adding Al2O3 nanoparticles up to an optimal concentration of 1% by weight improves the tensile strength, flexural strength, hardness, thermal conductivity, and wear resistance of PMMA nanocomposites compared to pure PMMA. While in the Pokuri et al. 40 investigation, the optimum content of 0.6 wt% Al2O3, the nanocomposites exhibited significant enhancements in compressive yield strength (14% increase), elastic modulus (20% increase), fracture toughness (10% increase), and wear resistance (26% reduction in wear rate) compared to pure PMMA. Based on the available literature, there is a lack of comprehensive studies investigating the effects of Al2O3 nanoparticles as a reinforcement for heat-cure acrylic resins on the properties of PMMA/Al2O3 nanocomposites, particularly their physical, mechanical, and wear characteristics. Consequently, the present investigation aims to bridge this knowledge gap by producing PMMA reinforced with Al2O3 nanoparticles (20–50 nm) at a wide range of different concentrations, specifically 0, 1, 3, 5, and 10 wt.%. Also, the current work suggested a different production cycle to produce PMMA/Al2O3 nanocomposites samples. The study aims to evaluate the color changing, density, hardness, compressive, and wear properties of the produced PMMA material and their nano Al2O3 composites.
Experimental work
Materials
Heat-cure acrylic resins (Polymethyl methacrylate - PMMA) are used as a matrix and supplied by Acrostone company for Dental and Medical materials in Egypt. Aluminum oxide nano-ceramic particles (Sigma-Aldrich Company, 82024 Taufkirchen, Germany) were chosen as reinforcement to fabricate the PMMA/Al2O3 nanocomposites. Figure 1 displays the SEM images and X-ray diffraction (XRD) analysis of the nano Al2O3 particles. The XRD patterns provide evidence of the Al2O3 powder’s high purity. At the same time, the SEM image reveals that the nano Al2O3 powder exhibits irregular shapes and particle sizes ranging from 20 to 50 nm. XRD analysis and SEM images of the Al2O3 nano ceramic particles. SEM: scanning electron microscopy; Al2O3: aluminum oxide.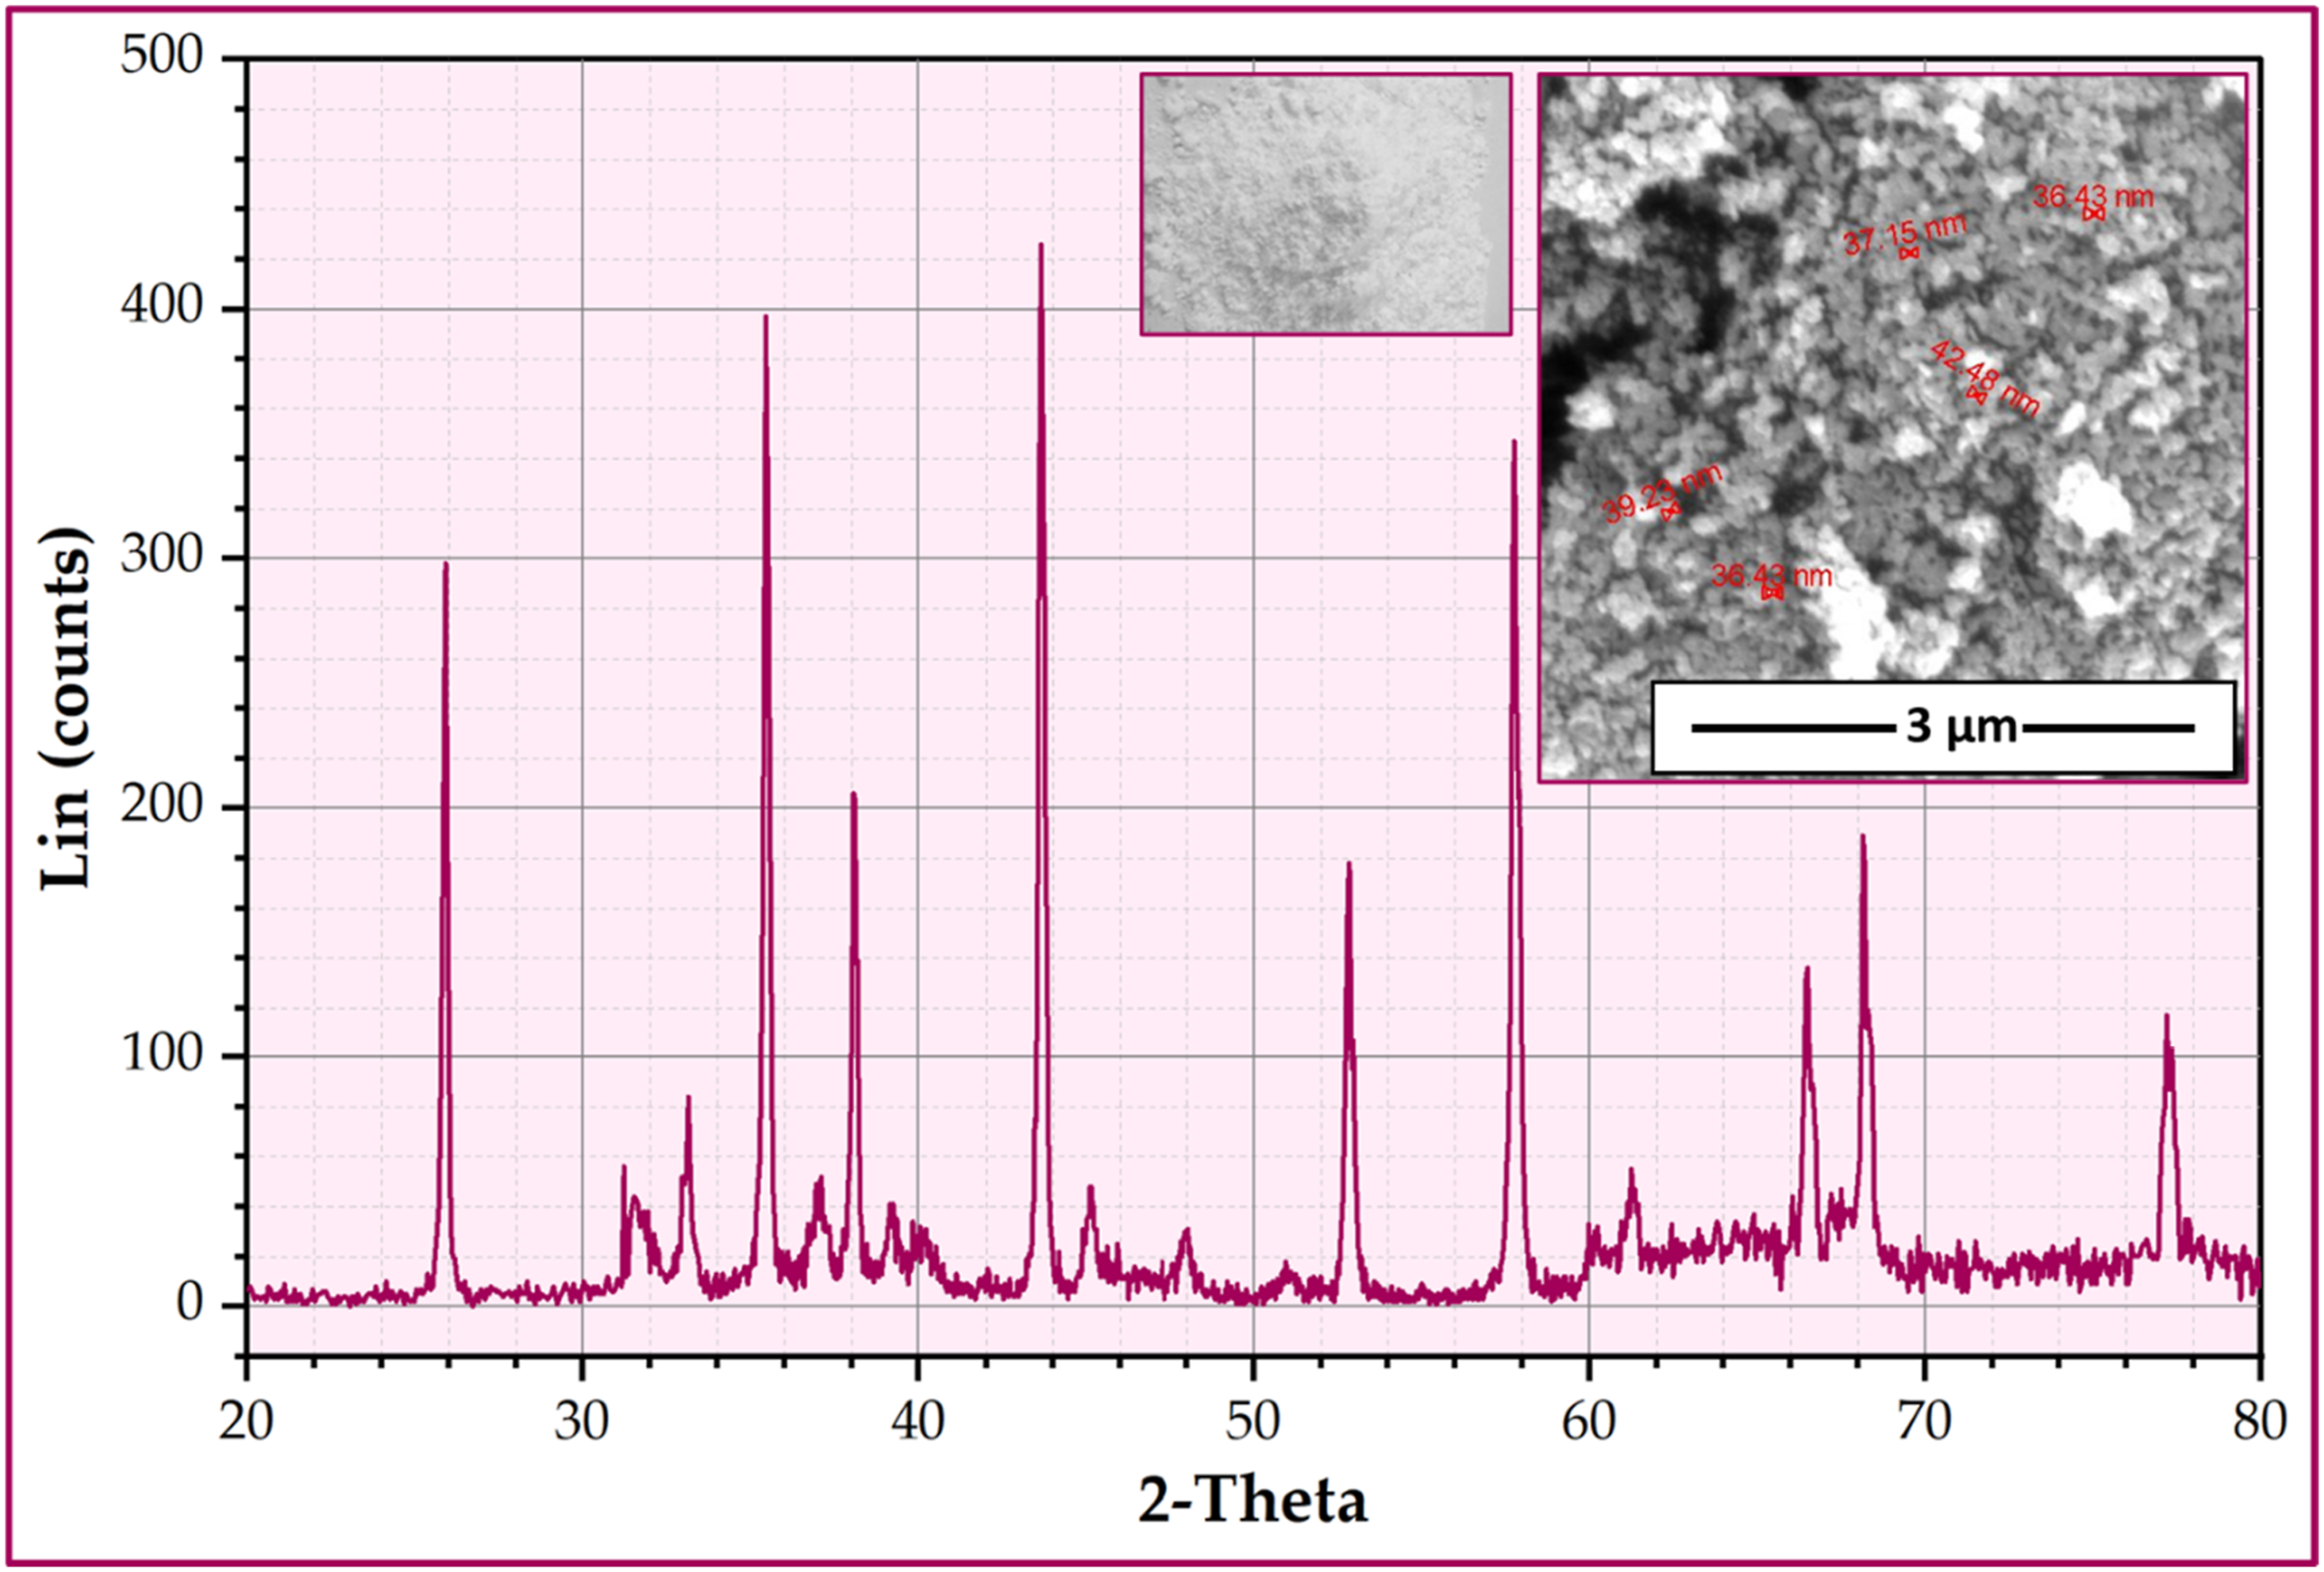
Fabrication of PMMA/Al2O3 nano composites
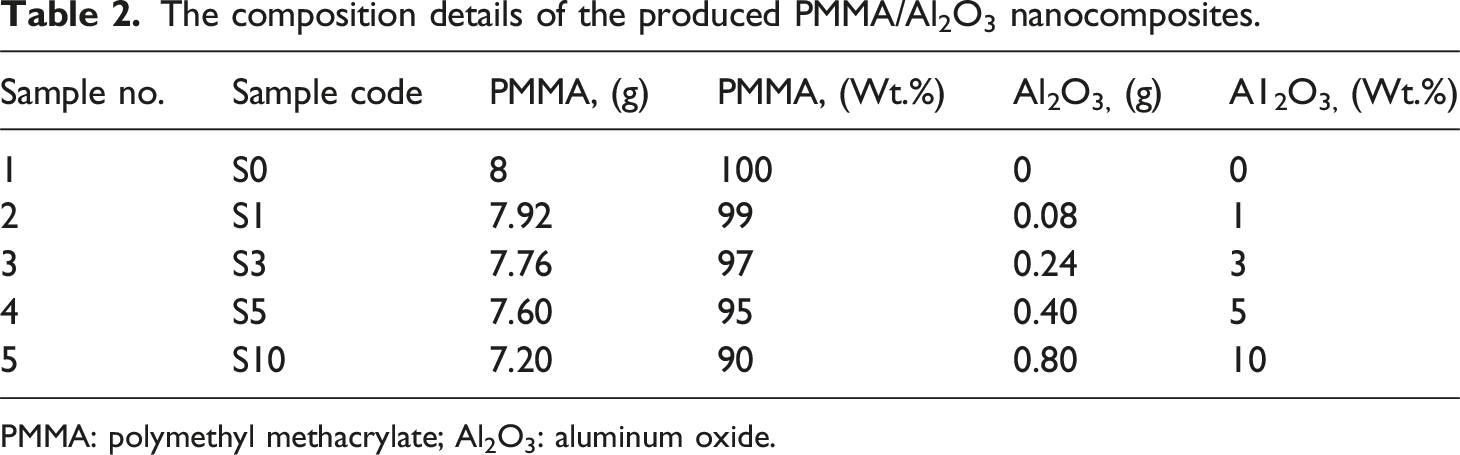
To produce the PMMA/Al2O3 nanocomposites, the PMMA matrix was reinforced with additional weight percent (wt.%) of Al2O3 of 1, 3, 5, 10 wt.%. The PMMA resin powder and Al2O3 nanoparticles were preweighed (Figure 2(a)) using 0,0001g electronic analytical balances (model: BA-E Series, Lixia District, Jinan, Shandong, China). The PMMA/Al2O3 mixture composition details and their coding utilized in this investigation are illustrated in Table 2. Afterward, the PMMA resin powder was mixed with Al2O3 nanoparticles and liquid monomer. The PMMA powder and the nano Al2O3 were thoroughly mixed utilizing a mortar and pestle for the initial blending (Figure 2(b)). Tumbling by hand in a plastic bowl was performed until a uniform color was obtained. The monomer solution was added to the PMMA/Al2O3 mixture at a 2:1 ratio by volume (according to the manufacturer’s instructions) in a mixing bowl with a close-fitting lid (Figure 2(c)). Illustration sketch of the manufacturing of PMMA/nano Al2O3 composite samples for dentures. PMMA: polymethyl methacrylate; Al2O3: aluminum oxide. The composition details of the produced PMMA/Al2O3 nanocomposites. PMMA: polymethyl methacrylate; Al2O3: aluminum oxide.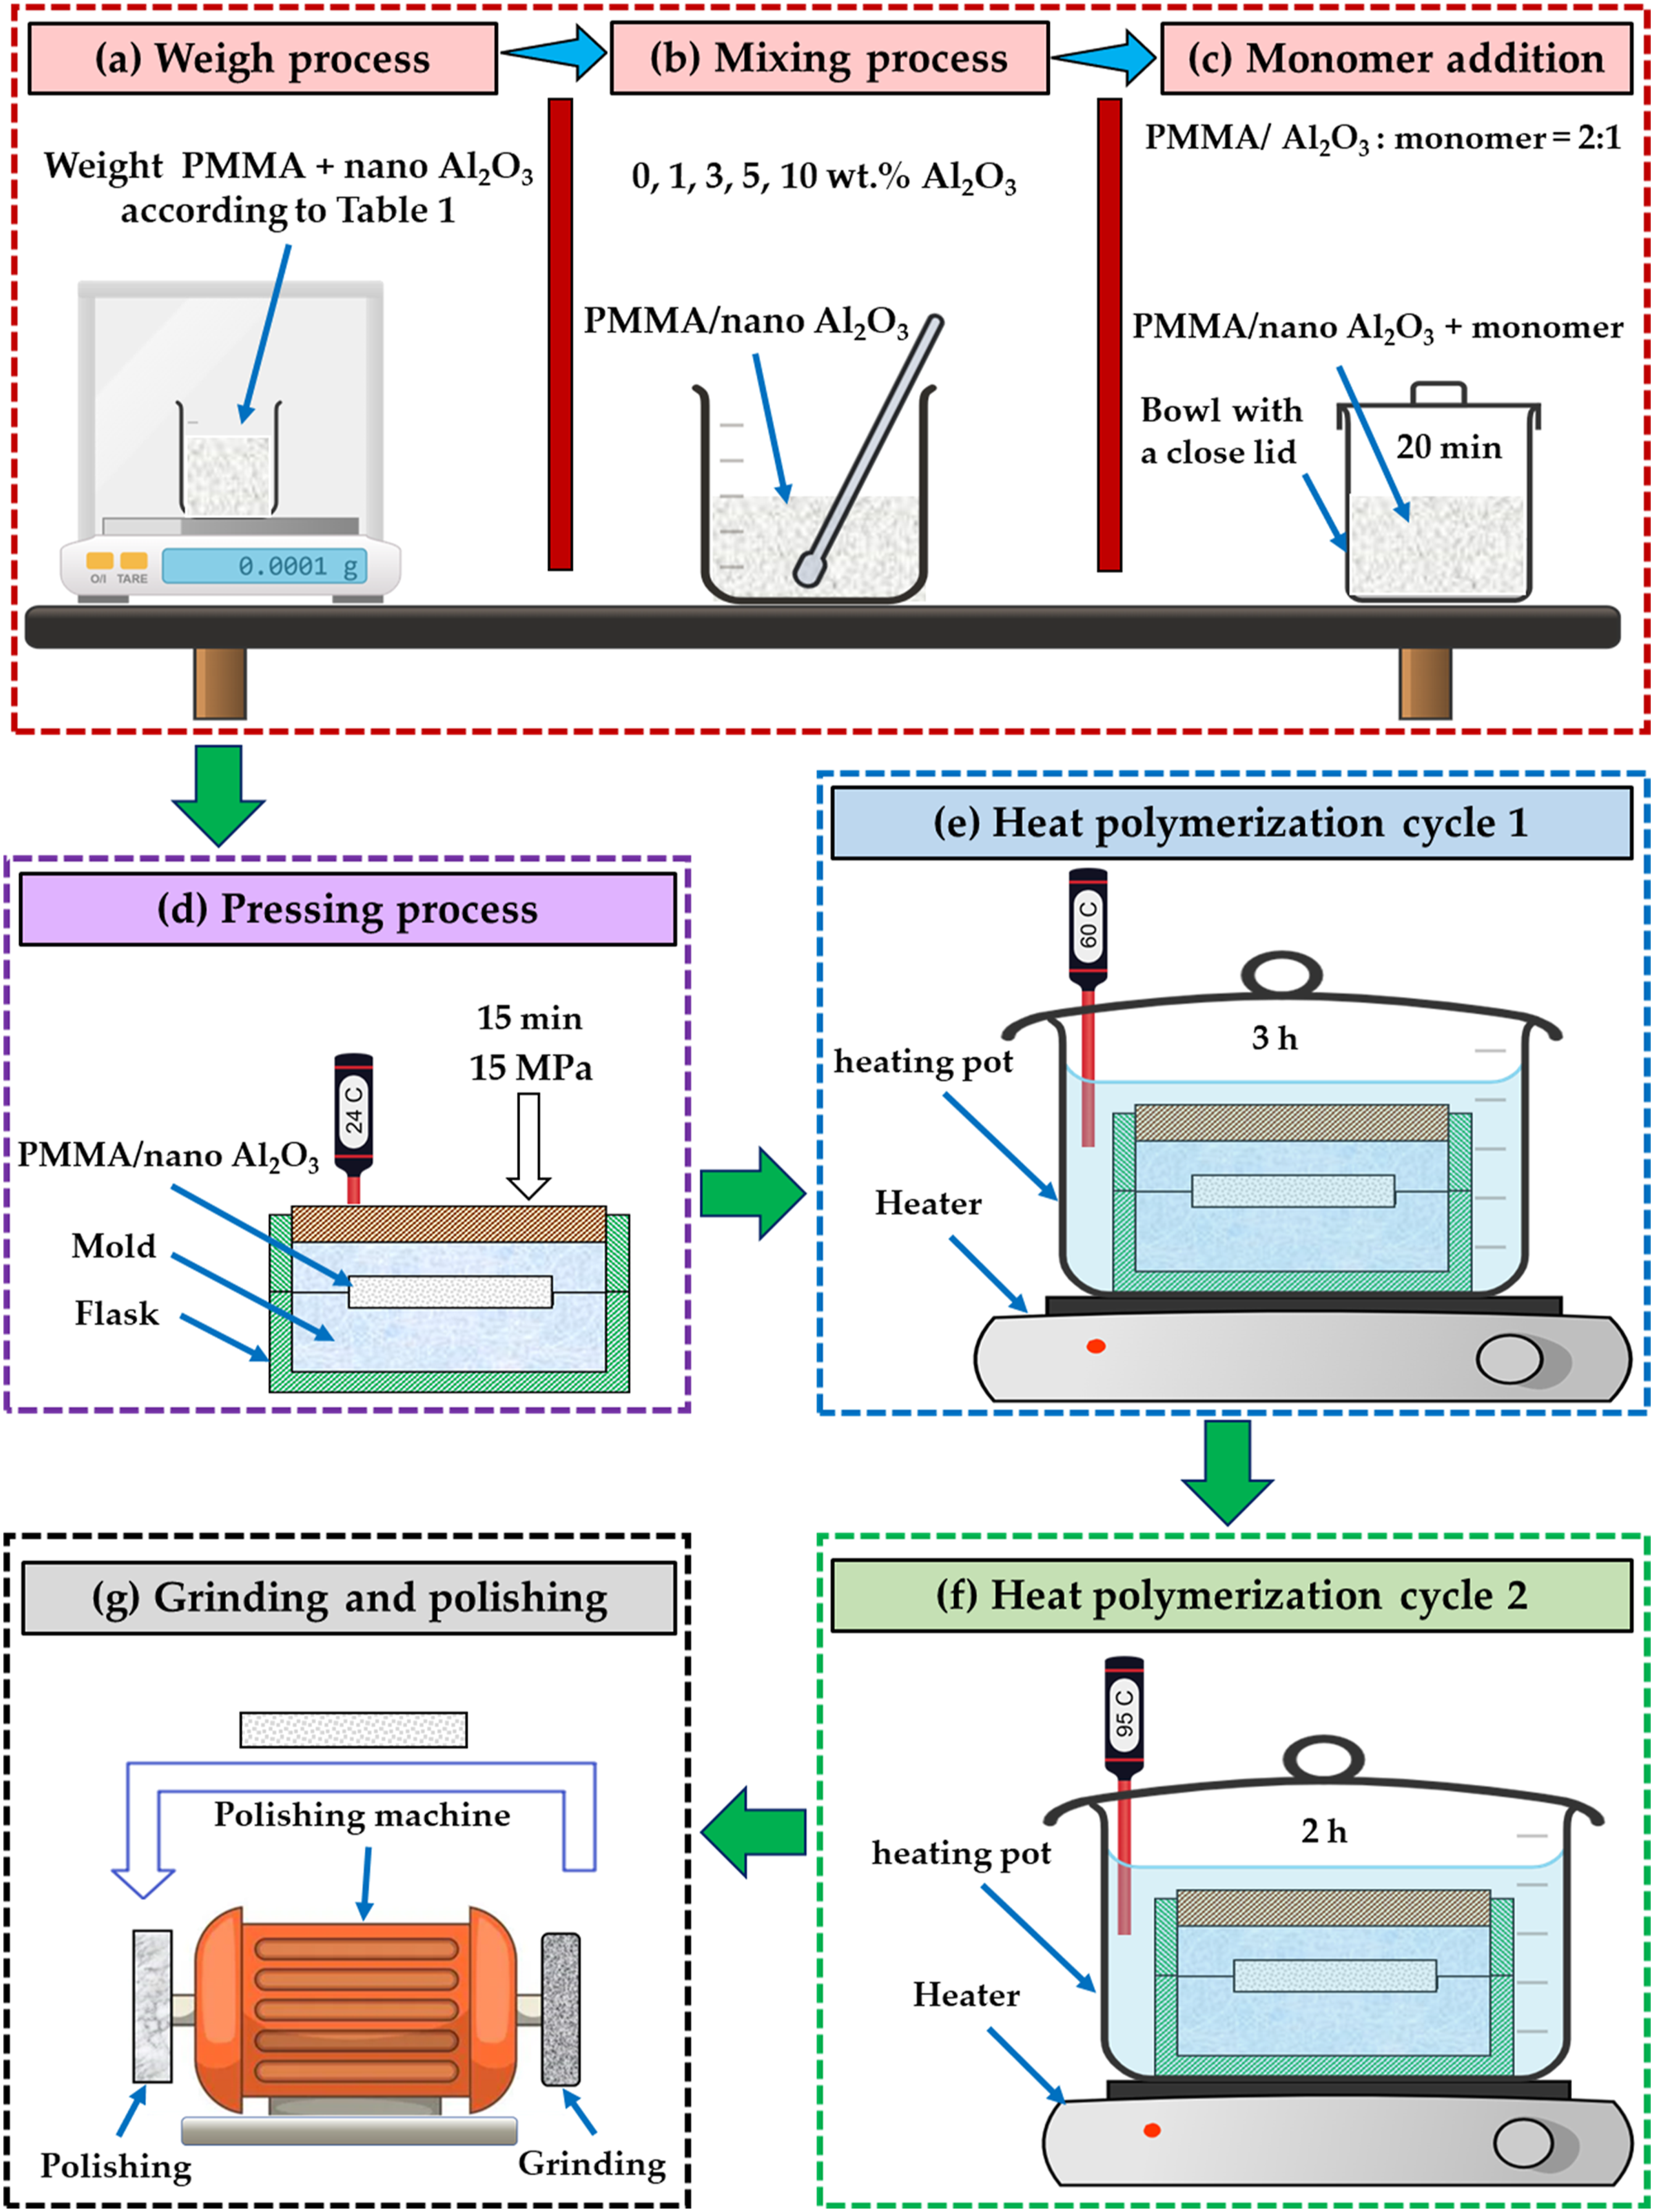
The mixing of PMMA and Al2O3 proceeded for roughly 20 min until the mixture reached the dough-like stage and was appropriate for handling. Afterward, the mixture was placed into a mold by hand, including two cavities with a 7 mm diameter and height of 50 mm (Figure 2(d)). The mold was formed inside an aluminum flask. Before packing the mixture into the mold, a separating medium of sodium alginate (Acrostone company for Dental and Medical materials in Egypt) was used on the mold surface to subtract the samples easily and quickly. The aluminum flask was then closed, placed in a press at 15 MPa, and the pressure was released (Figure 2(d)). The remaining mixture was taken from the mold and repressed for 15 min at room temperature. The flask with mold was cured for 6 h in a temperature-controlled water bath. The curing procedure required heating to approximately 60 ± 2°C over 1 h and maintaining it for 3 h (Figure 2(e)). The heat polymerization cycle was completed by raising the temperature to approximately 95 ± 2°C over 2 h (Figure 2(f)). After 30 min at ambient temperature, the flask was removed from the curing water. The flask was opened, and the PMMA/nano Al2O3 samples produced were removed from the mold. The PMMA/nano Al2O3 samples were ground and then polished (Figure 2(g)) with pumice powder with the emery paper using a polishing machine (Bench Brinder, Elite, Model: PT-BG011-200, China).
Characterization of PMMA/nano Al2O3 composites
The densities of the PMMA/nano Al2O3 composites specimens were produced according to the American Society for Testing and Materials (ASTM) D-792. Furthermore, at least two specimens were measured for each composite. Microhardness measurements of the produced PMMA and their nanocomposites were measured at 100 g with a dwell time of 10 s using the BUEHLER 1600-6300 Microhardness Tester, Guiseley, England. The average microhardness of the measured specimens was calculated from at least eight readings for each produced specimen. The compression test of the PMMA/nano Al2O3 composites was also conducted according to the ASTM D695. The compression test was achieved at room temperature with a 1.2 mm/min crosshead speed using the universal testing machine, WDW-300D, Guangdong, China. For the wear test, caries-free human premolar teeth without fractures or worn cusps were removed for orthodontic treatment and preserved in 0.1% thymol solution (approved by the authorized ethical committee of the Faculty of Dentistry Suez Canal University, no297/2020). The Miniflex diamond disc (No. 943) manufactured by Brasseler, Lemgo, Germany, was used to cut the buccal cusps together with the buccal surfaces. They were placed in a self-cured acrylic resin mold (Acrostone Co., Cairo, Egypt) within a specimen holder. A dental surveyor directed their placement to fit the natural tooth surfaces to the specimen holder’s long axis.
41
The buccal surface of each tooth specimen was wet abraded, and polished with 1000, 2500, and 4000 grit abrasive paper before the wear test to obtain a flat region ranging from 2 to 3 mm for loading during the wear test.
41
The wear test used a Robtonic, Netherlands, Model CS4 chewing simulator (Figure 3(a)). Figure 3(b) shows an illustration sketch of the chewing simulator setup. The buccal surface of premolar teeth was used as an antagonist in the lower plastic container for all PMMA samples (Figure 3). The upper holder held produced PMMA samples in contact with the teeth (Figure 3). 5 kg (49 N) as chewing power was applied, and 37,500 cycles were used to simulate 3 months of clinical function on the tested samples. After the wear test, the tested samples were rinsed with running water and ultrasonically cleaned for 2 min to eliminate any abraded particles during the wear test. The PMMA and their nanocomposite tooth samples were tested for wear using weight loss. The weight loss before and after the wear test was measured using an electronic analytical balance (model: BA-E Series, Lixia District, Jinan, Shandong, China)) with 0.0001 g accuracy. The PMMA/nano Al2O3 composites densities specimens and the worn surface of the wear-tested samples were investigated using SEM model QUANTA FEG 250, FEI Company, USA. (a) Chewing simulator and (b) illustration sketch for one testing chamber of the chewing simulator setup.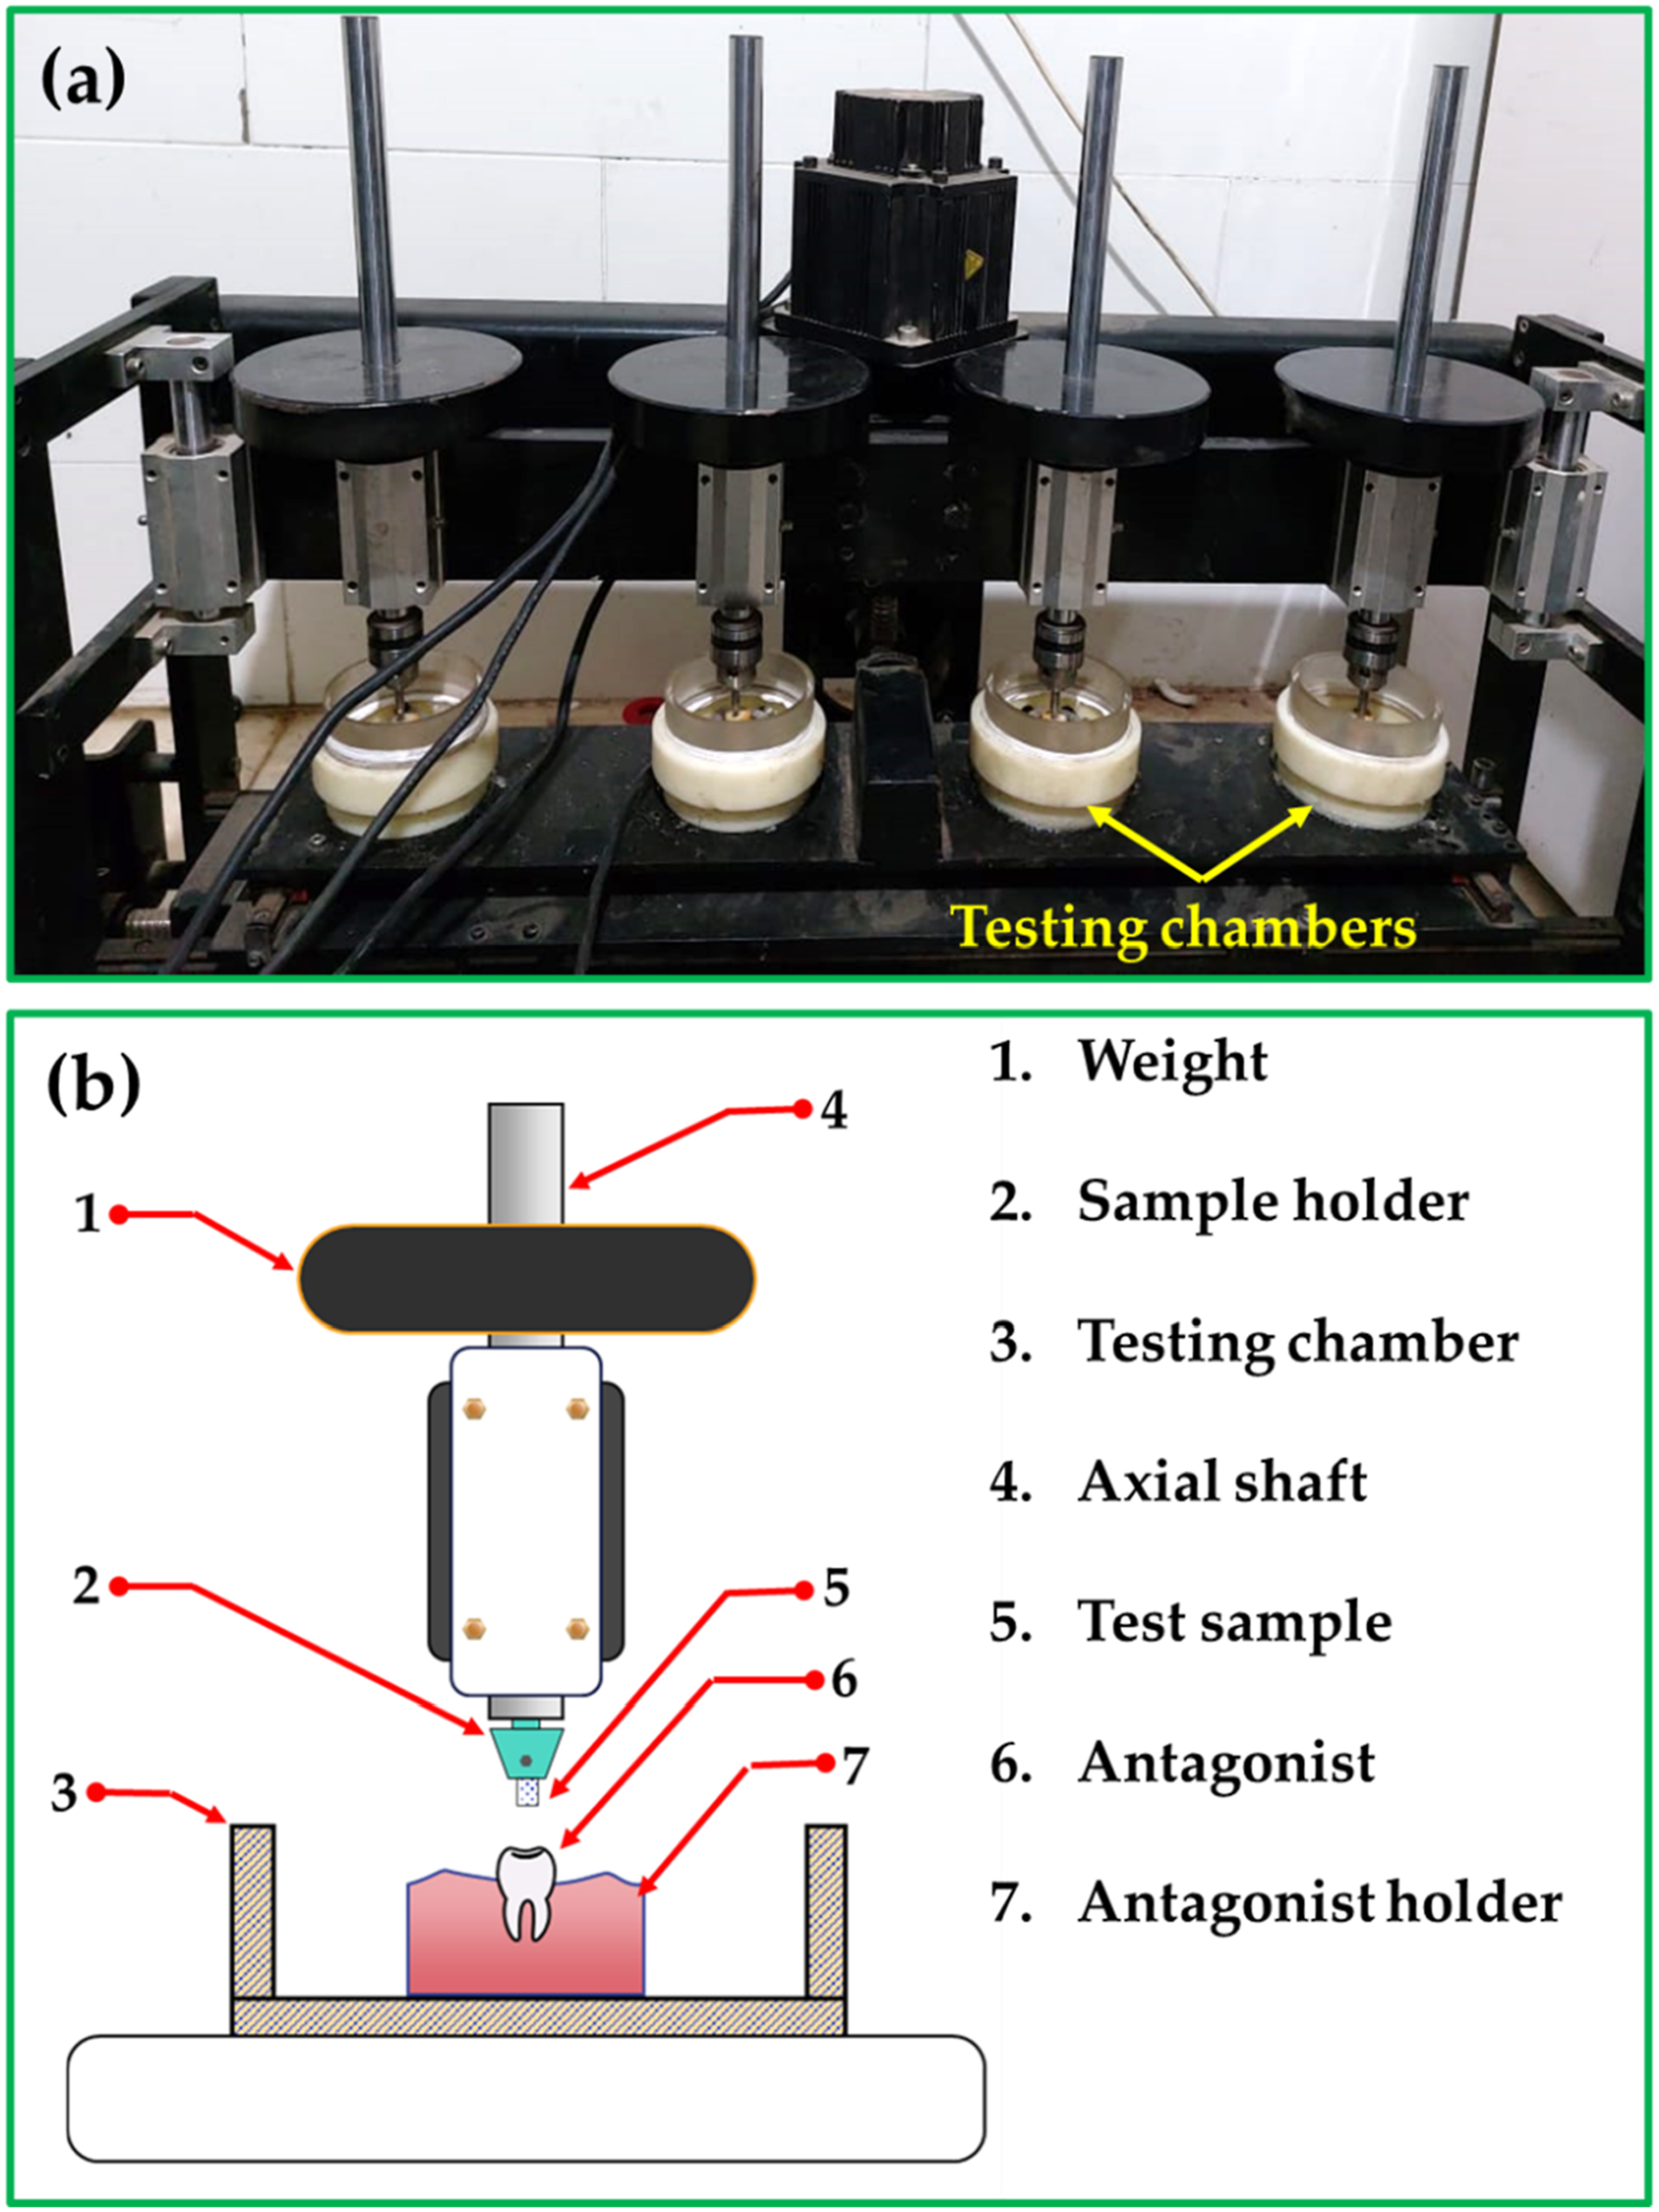
Results and discussions
PMMA/nano Al2O3 composites color changes
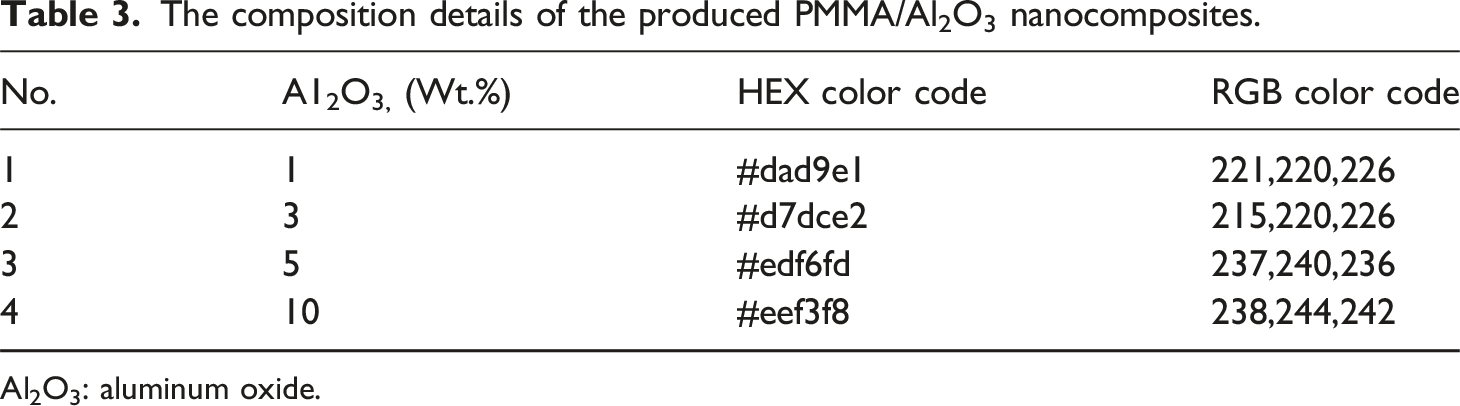
PMMA composite color is of significant importance in dental applications. PMMA and its composites are common in dentistry for fabricating dental. The color of the PMMA composite used in these applications plays a crucial role in achieving natural esthetics of the fabricated dental. The color of the PMMA composite must closely match the natural color of the teeth to create a seamless and natural-looking restoration. Figure 4 illustrates the general effect of the concentration of Al2O3 on the transparency and color of the PMMA/Al2O3 composites. It can be remarked that the PMMA without Al2O3 (0 wt.%) exhibits high transparency compared to the reinforced PMMA samples. With increasing the Al2O3 concentrations from 1 to 10 wt.%, the optical properties of the produced PMMA composites are changed, including their transparency and color. At 1 to 3 wt.% concentrations of Al2O3, the PMMA/Al2O3 composites may show reduced transparency compared to PMMA without Al2O3. The presence of Al2O3 nanoparticles leads to increased light scattering, reduced transparency, and color changes. In addition, PMMA/nano Al2O3 composites with high 5 and 10 wt.% Al2O3 concentrations exhibit significantly reduced transparency with color changes. As Al2O3 concentration increases in the PMMA matrix, the probability of aggregation and light scattering increases, leading to reduced light transmittance and increased opacity in the produced PMMA composites. The natural color of teeth can vary, but a typical range for the color of human teeth is between A1 and B4 on the Vita shade guide, which corresponds to a range of hex and RGB color codes.42,43 The hex code for A1 is #F2EFE9, and the RGB values are R: 242, G: 239, and B: 233. The hex code for B4 is #D4C8BE, and the RGB values are R: 212, G: 200, and B: 190. These color codes are used in dentistry for shade matching and cosmetic dental procedures. Table 3 lists the HEX and RGB codes of the produced PMMA/Al2O3 composites. It can be noted that the color codes of the PMMA composites reinforced by the 1 and 3 wt.% Al2O3 in the accepted range of the color of human teeth. Besides, the PMMA composites reinforced by the 5 and 10 wt.% Al2O3 in the acceptable range of R and the values of G and B are considered close to the upper limits of adequate values. Effect of the Al2O3 concentrations on the PMMA/Al2O3 color. PMMA: polymethyl methacrylate; Al2O3: aluminum oxide. The composition details of the produced PMMA/Al2O3 nanocomposites. Al2O3: aluminum oxide.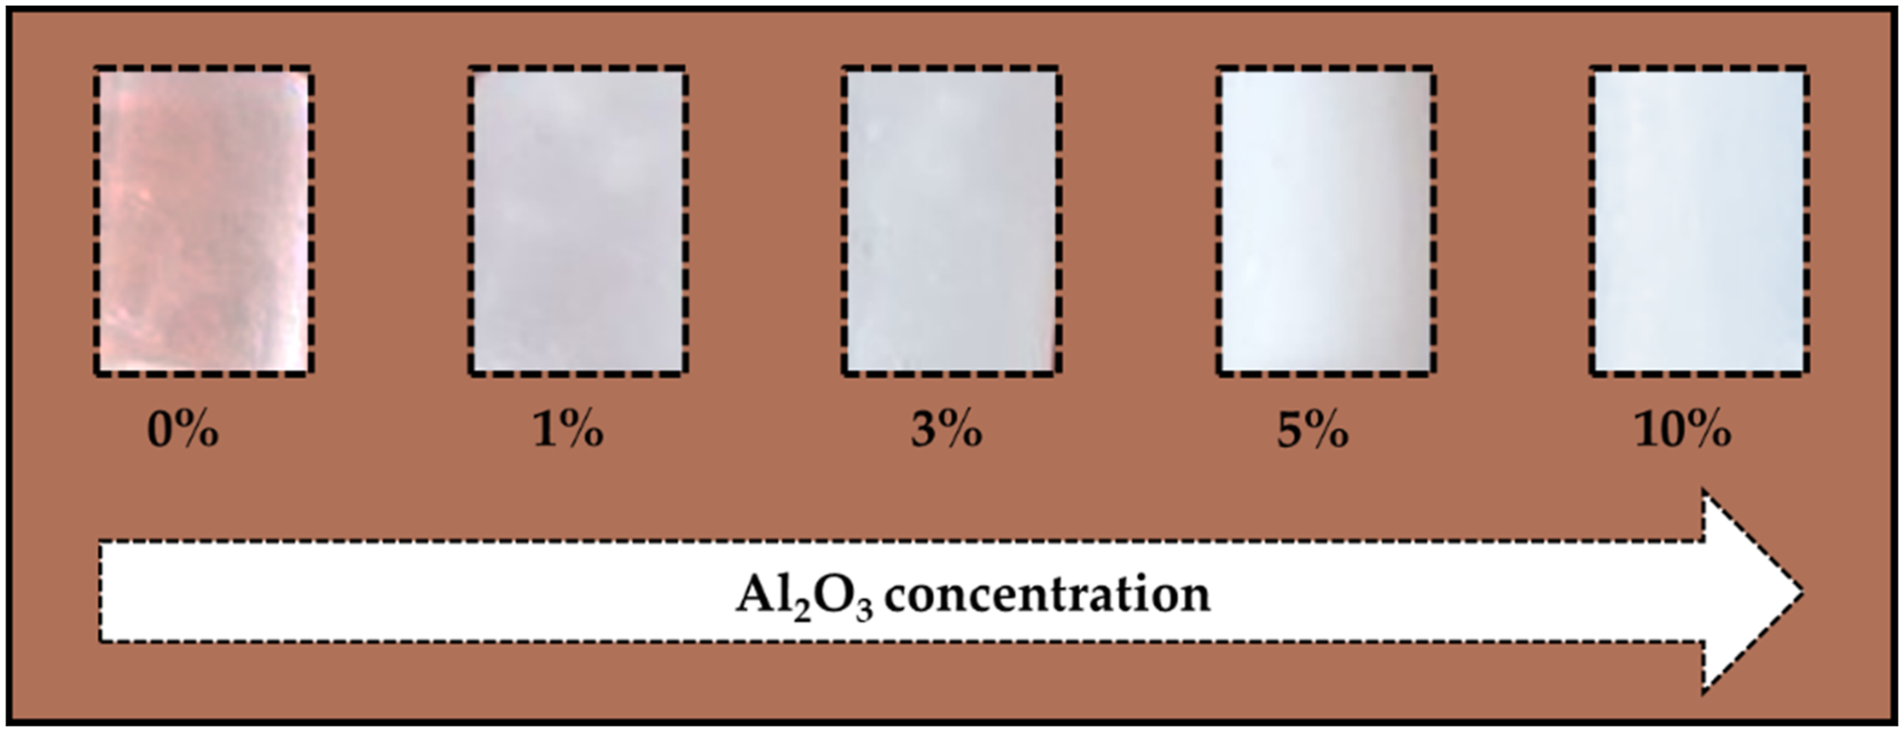
Microstructure of PMMA/nano Al2O3 composites
Figure 5 illustrates the SEM microstructure of the produced (a) PMMA sample and their composites reinforced with (b) 1 wt.%, (c) 5 wt.% nano Al2O3 ceramic particles. The PMMA matrix has a dark grey appearance, but the Al2O3 nanoparticles manifest as white spots dispersed across the PMMA matrix. It can be remarked that the unreinforced PMMA sample revealed no porosity. The absence of porosity in the unreinforced PMMA sample suggests that the applied production technique (Figure 2) can successfully develop sound PMMA composites with high densifications near the theoretical density of composites. The PMMA composites reinforced with Al2O3 exhibit a near homogeneous distribution of A12O3 nanoparticles, with few agglomerations up to a 5% Al2O3 content, as depicted in Figure 5(b) and (c). The SEM images of the produced samples, which were reinforced with A12O3 up to a concentration of 5%, demonstrated that the employed production technique effectively facilitated the uniform distribution of nanoparticles without any porosities. The developed microstructure of composite samples can be attributed to the influence of the implemented techniques involving mixing, pressing, and heating procedures in manufacturing PMMA/nano Al2O3 composites (Figure 2). So; the applied procedures can be used to manufacture the PMMA/nano-ceramic composites that exhibited a good dispersion of nanoparticles characterized by minimal aggregation sites. SEM images of the produced (a) PMMA samples and their corresponding PMMA composites reinforced by (b) 1 wt.%, (c) 5 wt.% Al2O3. SEM: scanning electron microscopy; PMMA: polymethyl methacrylate; Al2O3: aluminum oxide.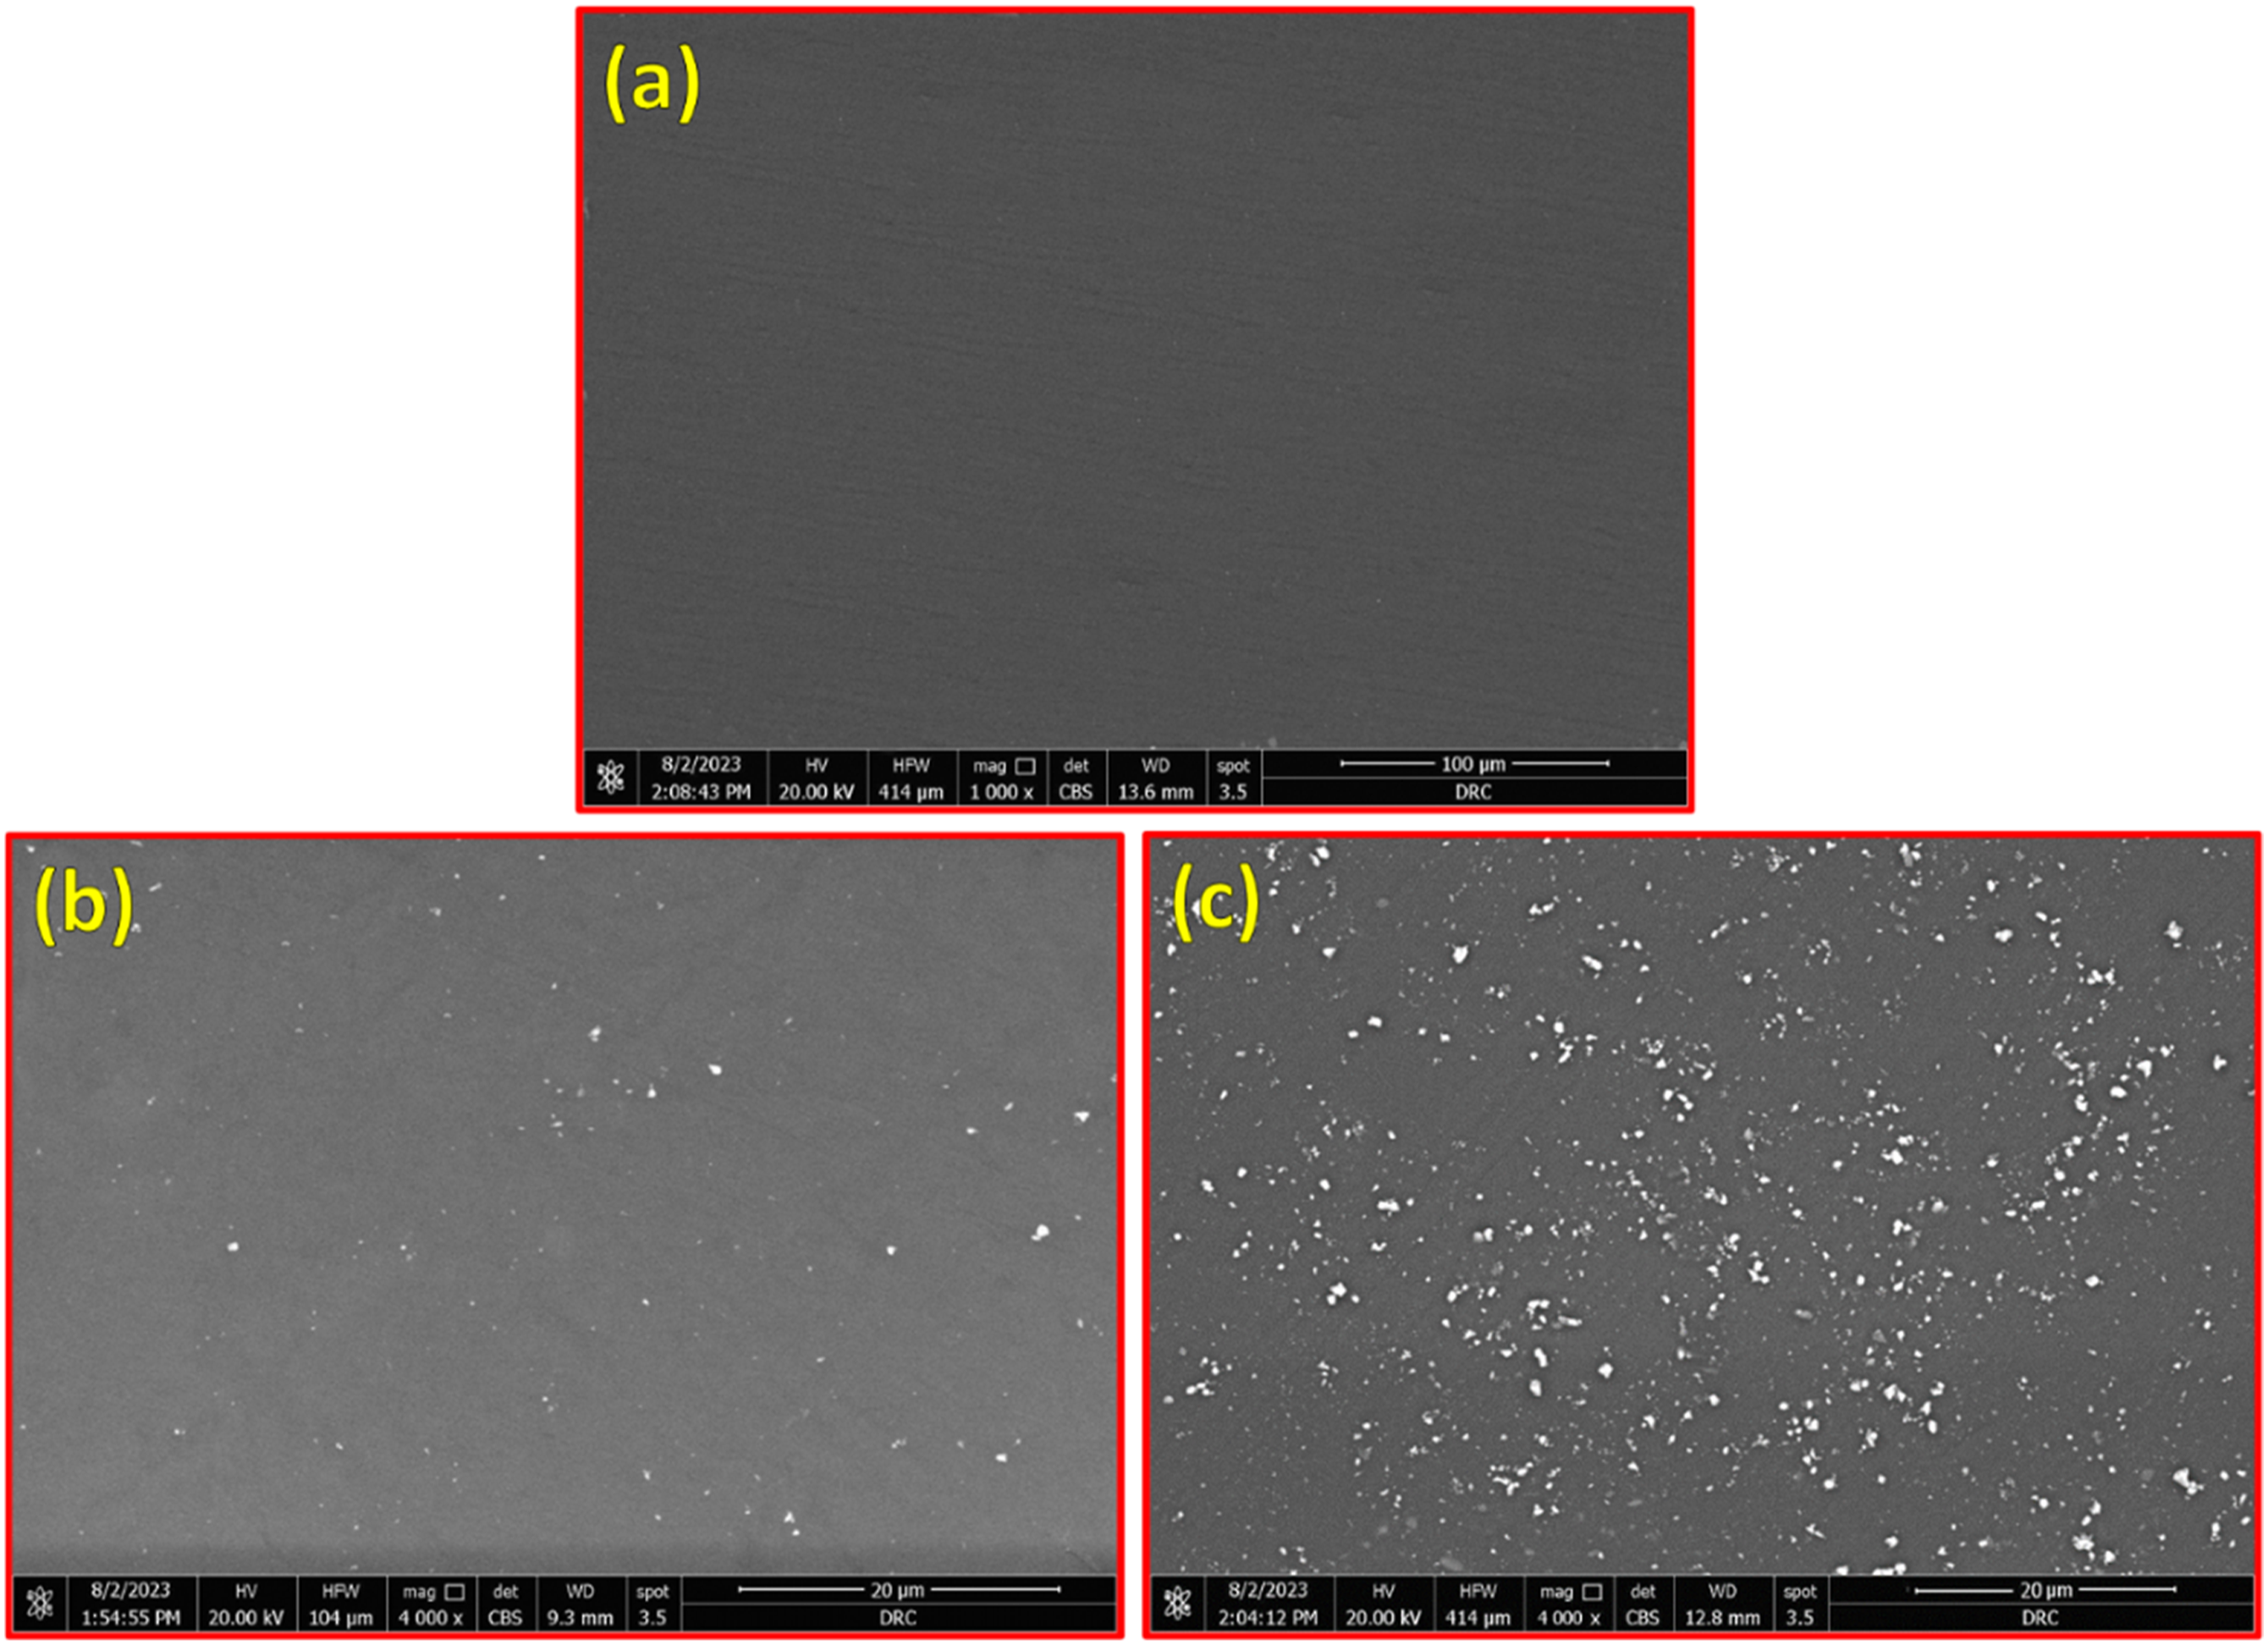
Figure 6 shows the microstructure of the PMMA reinforced by the high concentration of 10 wt.% nano Al2O3 composite sample. It can be remarked that the addition of a high concentration of 10 wt.% Al2O3 within the PMMA matrix has been found to have a pronounced effect on the aggregation of Al2O3 particles and promoting crack initiation, as shown in Figure 6(a)–(c). The high concentration of Al2O3 results in inter-particle attraction, leading to increased particle aggregation and subsequently negatively affecting the uniformity of dispersion within the PMMA matrix. As a result, these aggregated sites have the potential to serve as sites for stress concentration, hence increasing the initiation and propagation of cracks inside the produced composite. These aggregations are expected to negatively affect densification and mechanical properties and heightened susceptibility to crack formation under external loads. Different magnifications of SEM images for the PMMA/10 wt.% Al2O3 composite sample. SEM: scanning electron microscopy; PMMA: polymethyl methacrylate; Al2O3: aluminum oxide.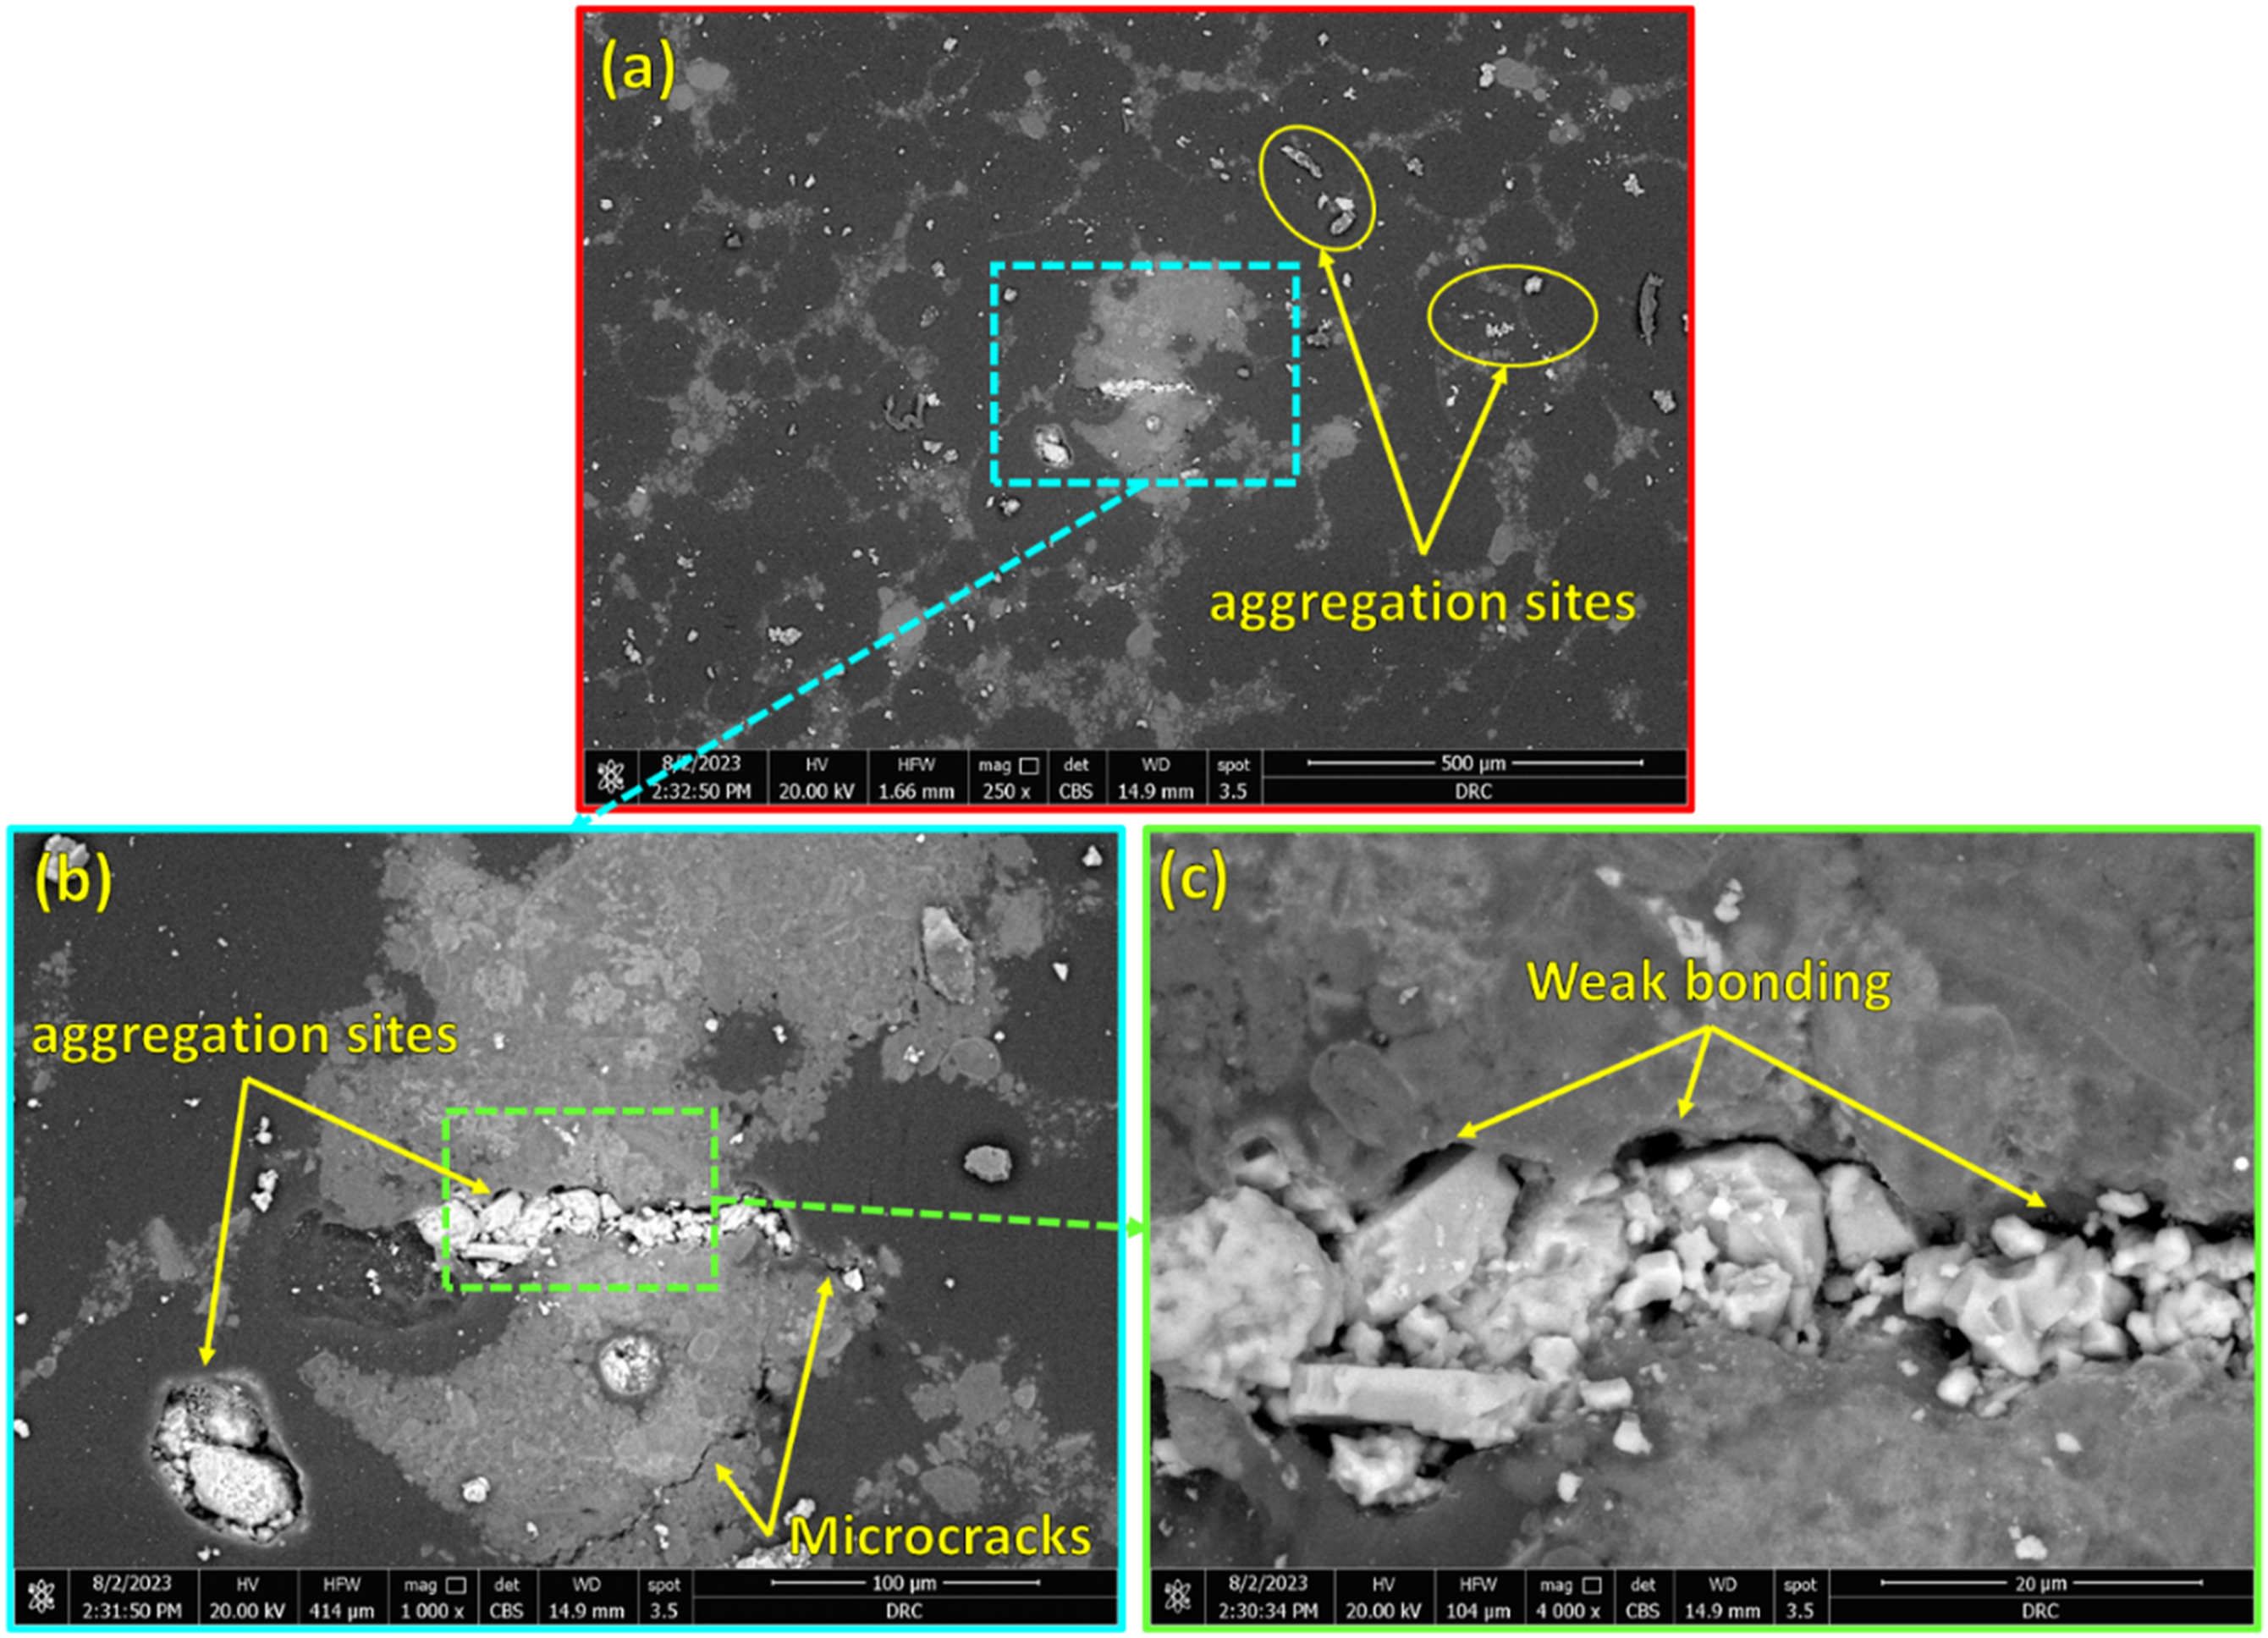
The objective of colored elemental mapping is to detect the dispersion of Al2O3 in the PMMA matrix and provide a visual representation of the distribution and concentration of Al and O elements within the PMMA matrix. The color-coded map represents the elemental distribution of the PMMA composite reinforced with 5 wt.% Al2O3 is dotted in different colors, as shown in Figure 7. Figure 7(a)–(c) depicts the elemental maps of carbon (C), oxygen (O), and aluminum (Al), respectively. Furthermore, it was observed that the A12O3 nanoparticles exhibit a uniform distribution within the PMMA matrix. The EDS results in Figure 7 demonstrate no evidence of any unwanted phase formation during the preparation and production of PMMA/nano Al2O3 composites. Elemental colored map and the corresponding composition analysis of the PMMA/5 wt.% Al2O3 composite sample. PMMA: polymethyl methacrylate; Al2O3: aluminum oxide.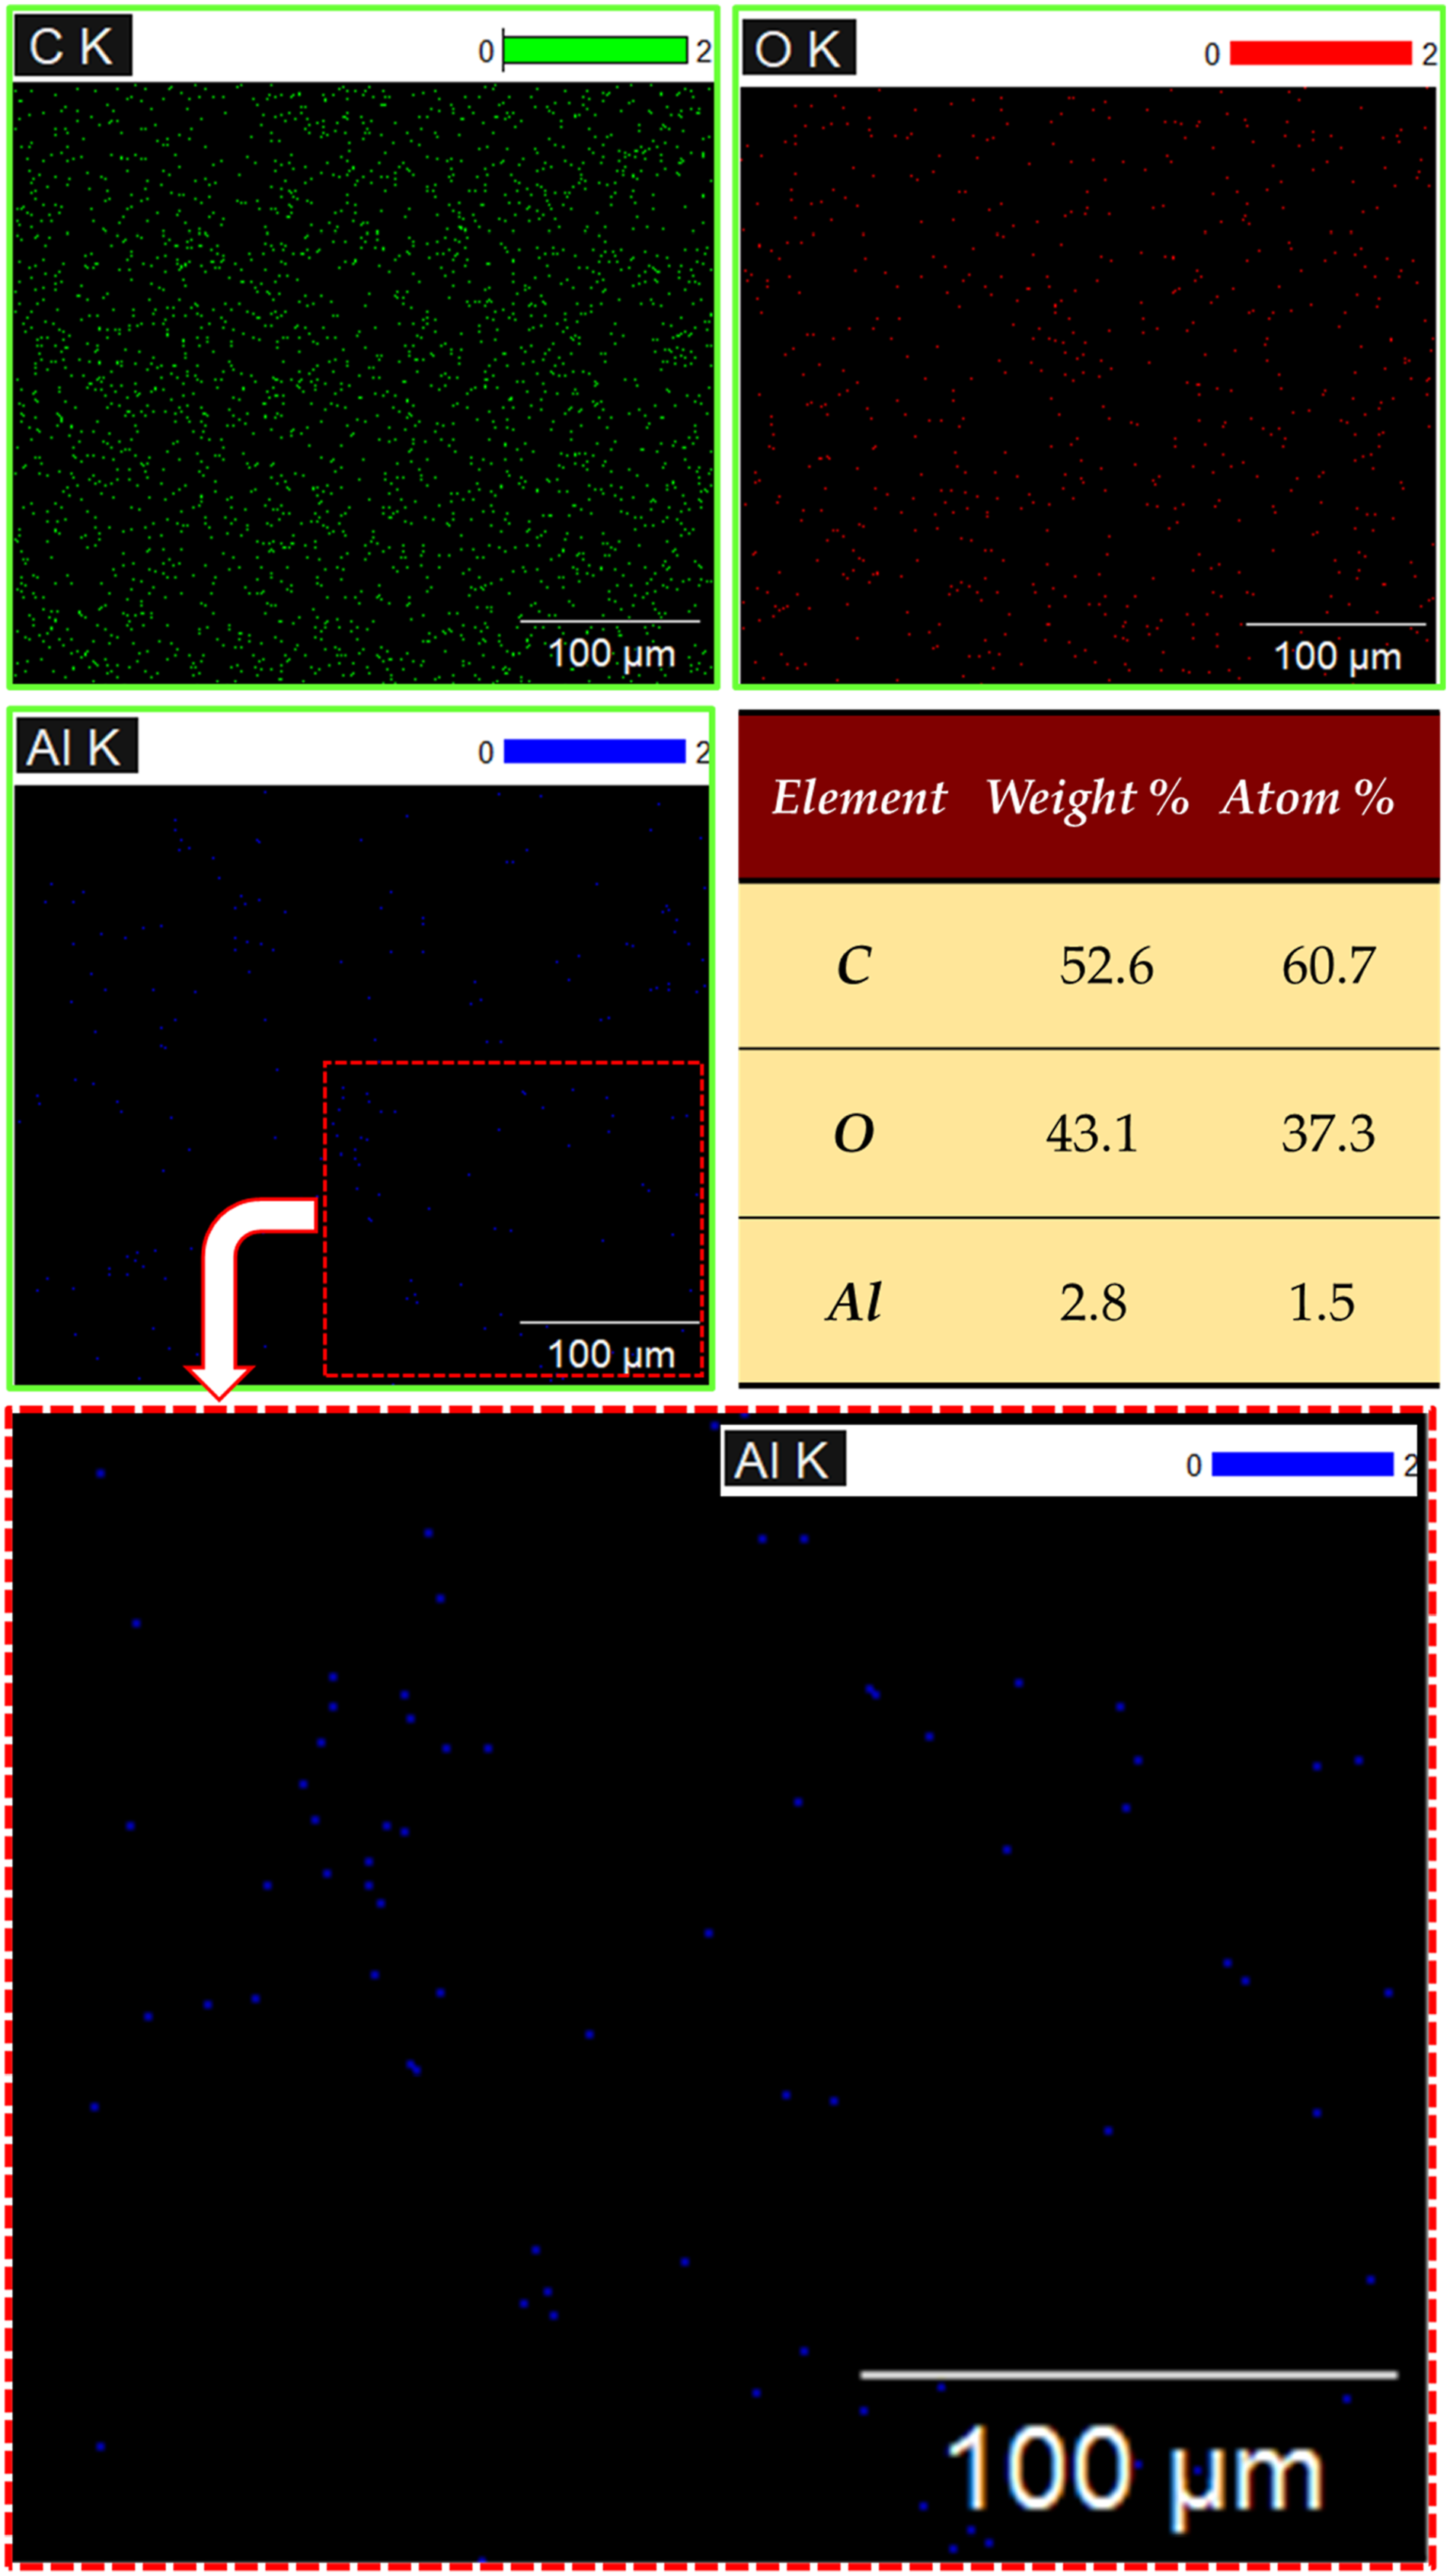
Density of PMMA/nano Al2O3 composites
Figure 8 shows the bulk and the relative densities of the produced PMMA/Al2O3 composites reinforced with five concentrations (0, 1, 3, 5, and 10 wt.%) of Al2O3. The bulk density of the PMMA/Al2O3 composites increases with increasing Al2O3 concentrations, and the relative density decreases. The density of the PMMA matrix and their composites ranged from 1.171 to 1.405 g/cm3 with increasing the Al2O3 concentration from 0 to 10 wt%, respectively. In contrast, the lower relative density of 96.88 % was achieved at a higher Al2O3 concentration of 10 wt.%, and the higher relative density of 99.26 was obtained at the PMMA sample produced without the Al2O3 addition. Firstly, the Al2O3 nanoparticles have a higher density than the PMMA matrix. Al2O3 has 3.95 g/cm3, while PMMA has 1.18 g/cm3. So, as denser Al2O3 nanoparticles are added to the matrix, the bulk density of the PMMA composites increases. In addition, the Al2O3 nanoparticles can fill the void spaces between the PMMA chains. This leads to an increase in the bulk density of the produced PMMA composites. On the other hand, the relative density refers to the ratio of its bulk density to the theoretical density of the composite. It can be remarked that increasing the Al2O3 concentration decreased the relative density of the PMMA/nano Al2O3 composites, as shown in Figure 8. It can be noted that increasing the Al2O3 concentration leads to reducing the relative density of the PMMA/nano Al2O3 composites, as shown in Figure 8. This is because Al2O3 is denser than the PMMA matrix, and increasing its concentration in the PMMA composites can increase the volume without adding much mass, leading to a decrease in the relative density of the PMMA composite. Density and relative density of the PMMA/nano Al2O3 composites produced at different concentrations of 0, 1, 3, 5, and 10 wt.% Al2O3. PMMA: polymethyl methacrylate; Al2O3: aluminum oxide.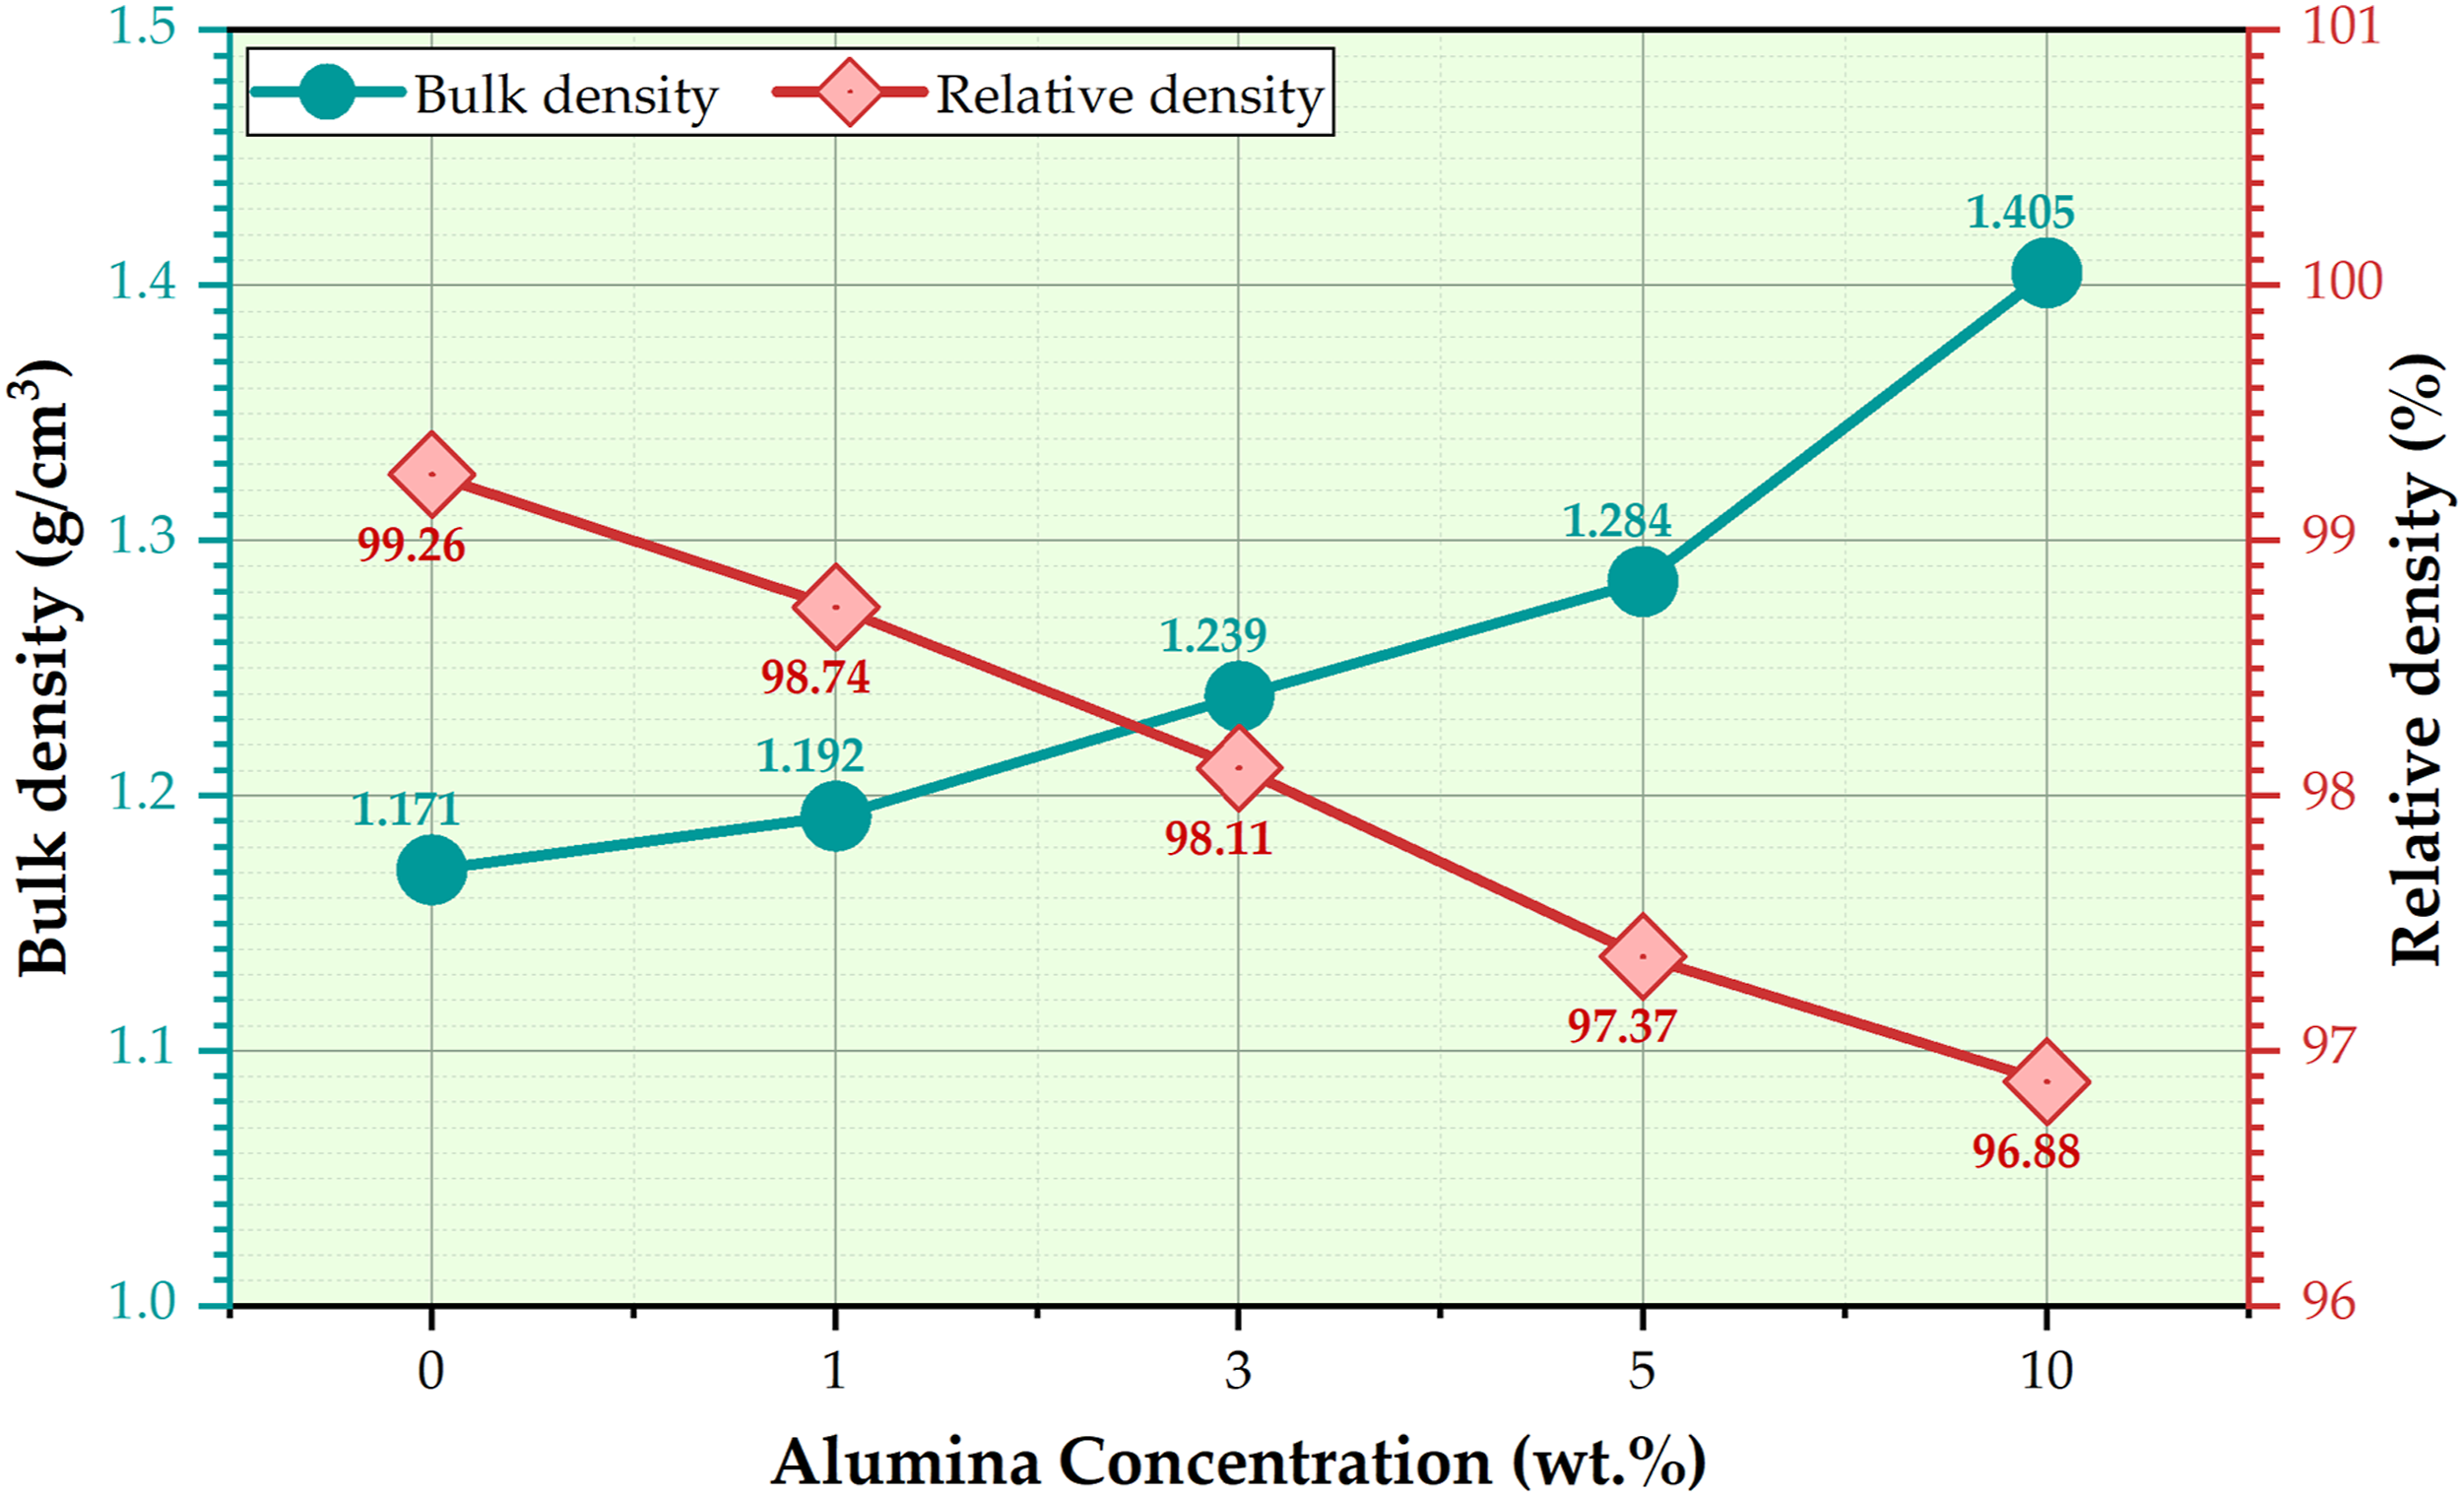
Moreover, during the heat polymerization process (Figure 2), the applied temperature is attained, and therefore, part of the monomer evaporates, leading to a chance of void formation. 44 Additionally, adding Al2O3 nanoparticles can create voids or pores in the produced composites during the manufacturing process of the PMMA composites. These formed voids decrease the relative density of the PMMA composites. As Panda et al. 45 mentioned, increasing the proportion of voids within the produced composites can impact their different properties. As a result, the formed void volume fraction (according to Figure 8) in the formed PMMA matrix and their composite remained below 4%, which is considered an acceptable value according to Latief et al. investigation. 46 Finally, the PMMA/nano Al2O3 composite density slightly increased with the Al2O3 wt.% addition. The slight increase in the density property of the PMMA composites preserves the broad applicability of the PMMA and their composites, 47 especially in dental applications.
Compression test for PMMA/nano Al2O3 composites
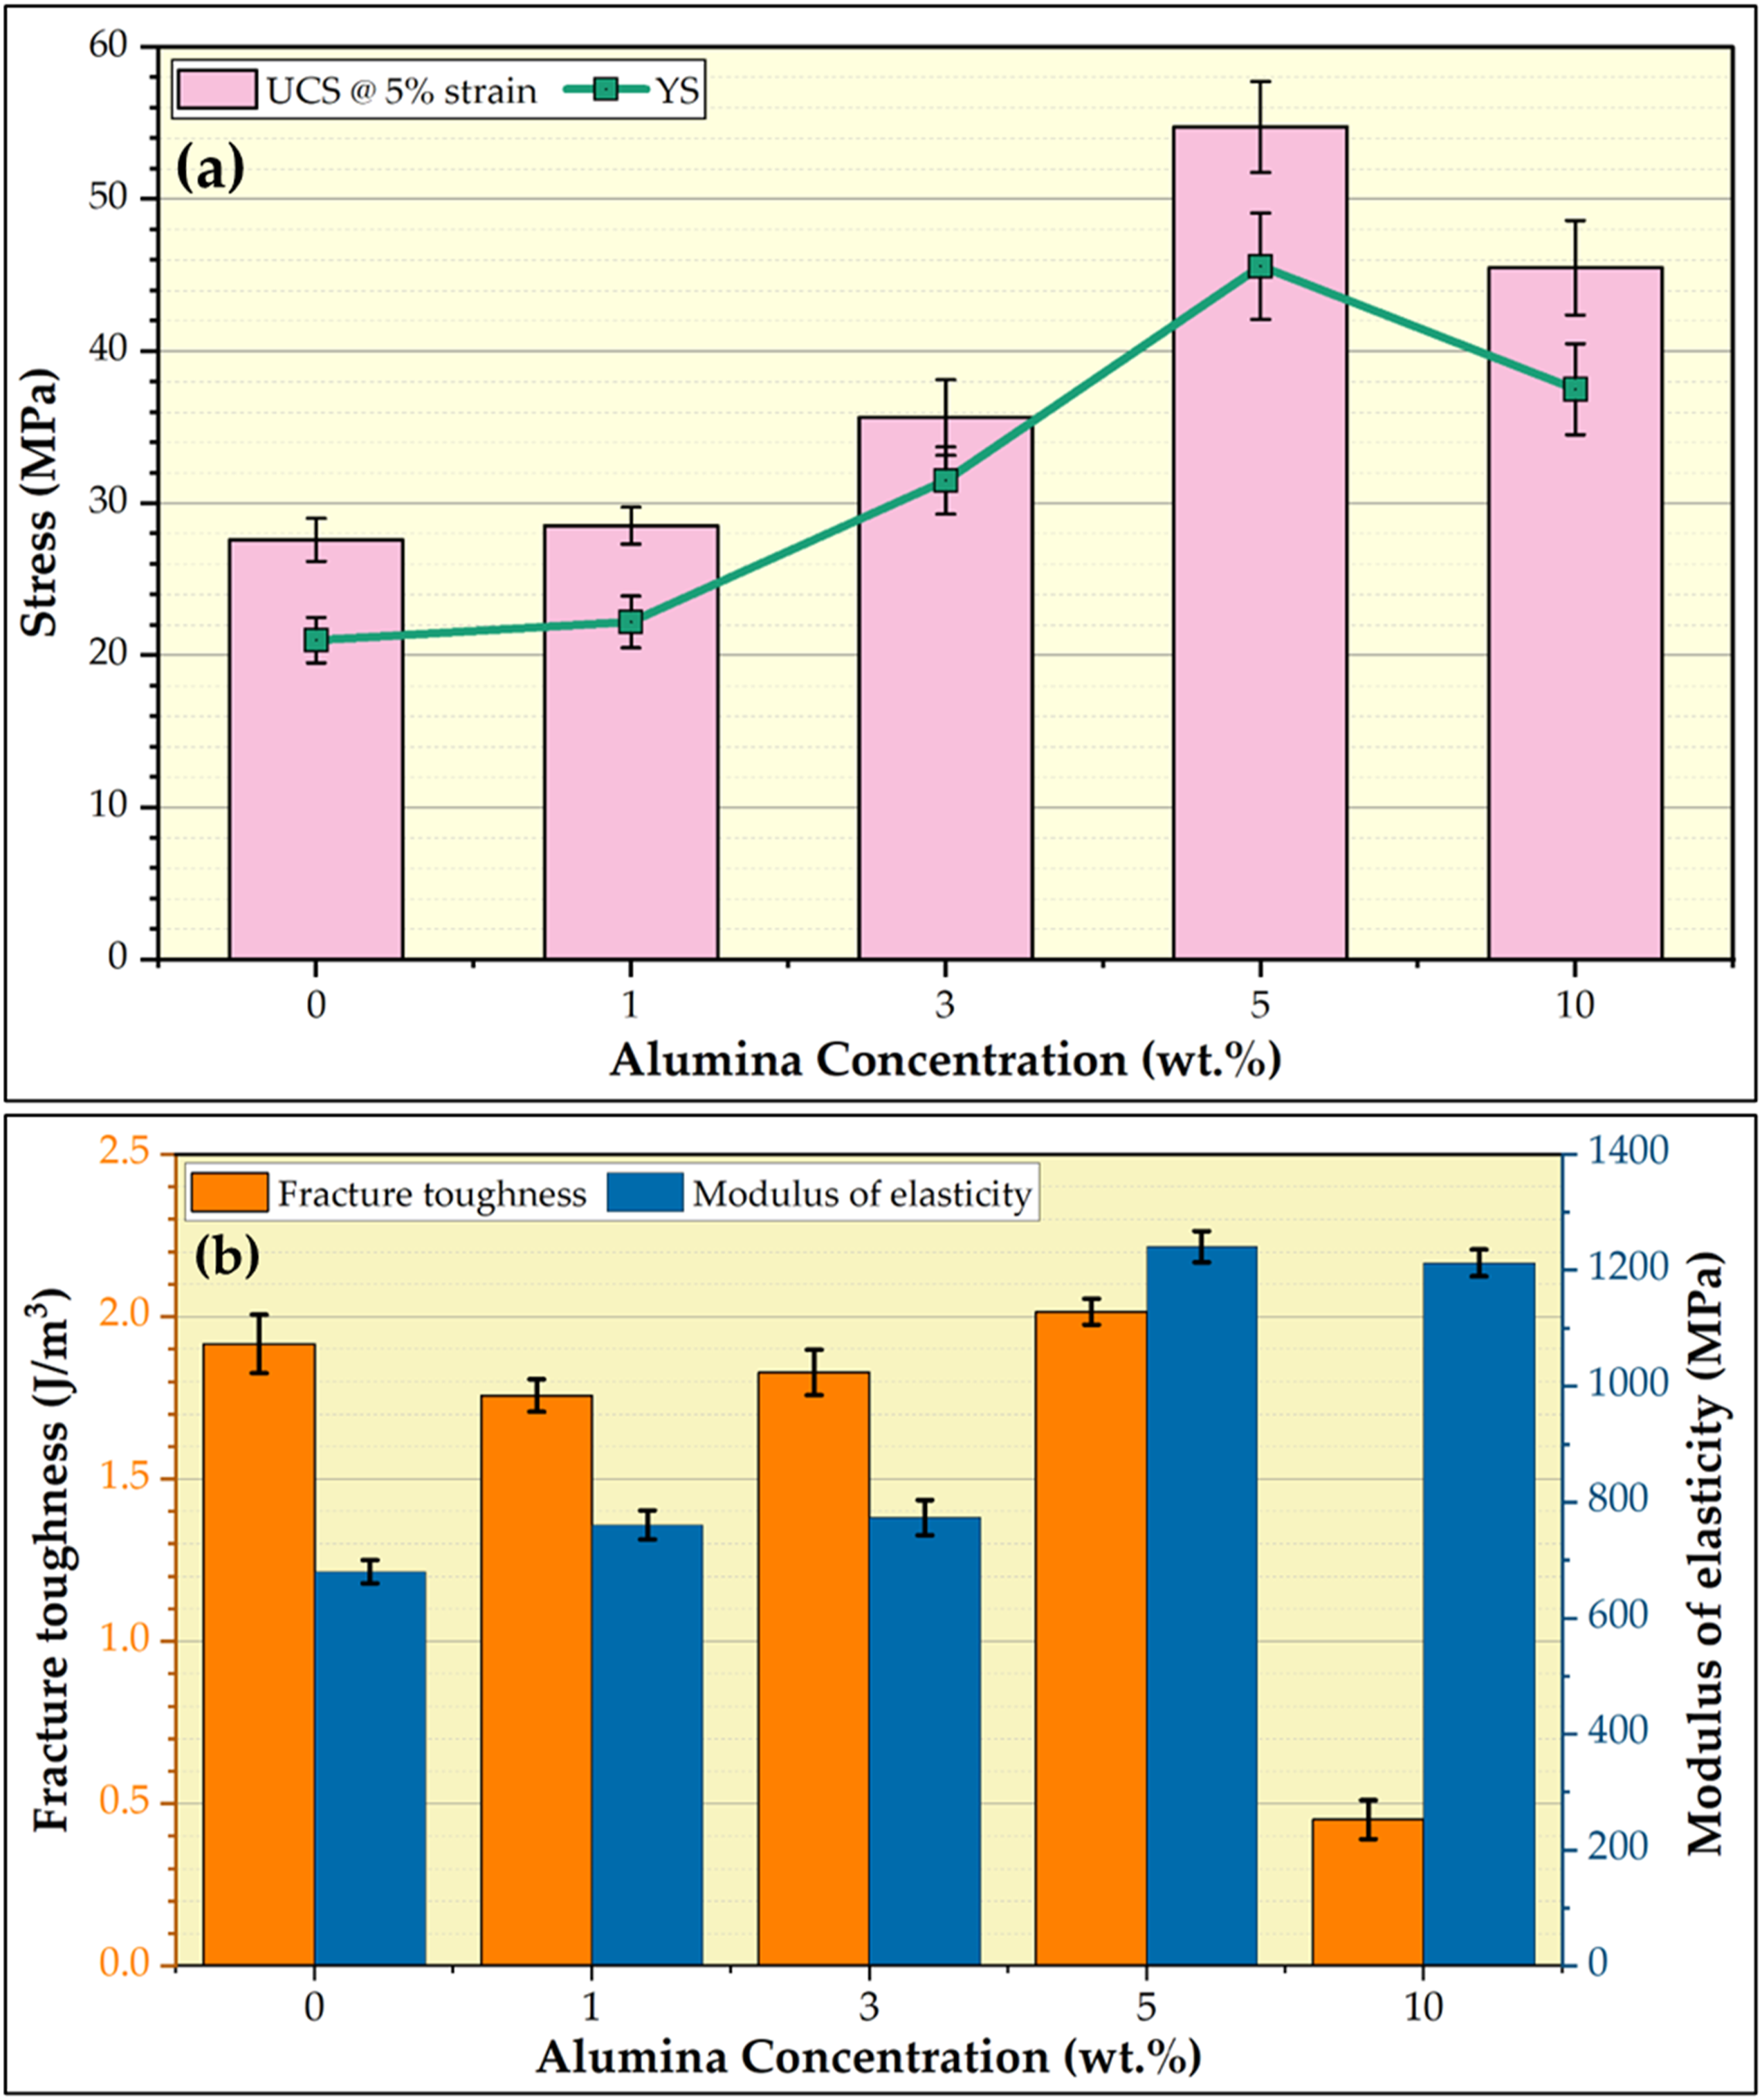
The compression test is a crucial evaluation test in dentistry for assessing dental materials' mechanical properties and performance. Dental materials, such as PMMA composites, must withstand the compressive forces exerted during chewing, biting, and occlusal loads. Compressive stress–strain curves of the PMMA matrix and their composites reinforced by the different concentrations of 1, 3, 5, and 10 wt.% are presented in Figure 9. These curves of tested specimens contribute to assessing the compressive properties of the formed PMMA/nano Al2O3 composites compared to the PMMA matrix. Figure 10(a) shows the compressive loading impact of the Al2O3 reinforcement on the denture PMMA matrix. UCS at 5% strain and YS were computed from the compressive stress–strain curves (Figure 10(a)). The UCS and the YS improved with increasing the Al2O3 nanofiller materials in the PMMA matrix and then decreased with increasing the Al2O3 over five wt.%. The maximum UCS of 54.75 MPa and YS of 45.60 MPa were observed in the PMMA/5 wt.% nano Al2O3 composite specimen, and compared with the PMMA matrix, the UCS and YS improved than the PMMA matrix by around 99 % and 117 %, respectively, this improvement for the PMMA with adding 1, 3, and 5 wt.% nano Al2O3 can be attributed to the homogenous distribution of the nano Al2O3 ceramic particles in the PMMA matrix (Figures 5 and 7), which enabled the PMMA to transfer the compressive load to the nano ceramic particles and disperse it. Further, during the compressive testing of PMMA composites, the nano Al2O3 can prevent the propagation of PMMA cracks as they start to form [8,9]. The significantly higher compressive properties of nano Al2O3 compared to the PMMA matrix.
46
The observed results indicate that adding the Al2O3 with 1, 3, and 5 wt.% can improve the compressive properties of the PMMA matrix, unlike 10 wt.% reinforced ceramic materials that promote aggregation of ceramic particles (Figure 6) and deteriorate the compressive properties like UCS and YS properties. Figure 10(b) illustrates the fracture toughness and the modulus of elasticity of the processed PMMA/nano Al2O3 composites compared to the PMMA matrix. From Figure 10(b), the modulus of elasticity and the fracture toughness increases with the increasing concentration of Al2O3 nanoparticles up to 5 wt.% and then decreases at 10 wt.% Al2O3. However, the 5 wt.% addition of Al2O3 nanoparticles to the PMMA matrix has significantly improved the modulus of elasticity by around ∼82 % compared with the PMMA matrix and slightly improved the fracture toughness by ∼ 1.12 %, as shown in Figure 10(b). This indicates that the toughness and ductility of the PMMA/nano Al2O3 composite improvement could be attributed to the addition of the nano ceramic particles.29,48 Stress–strain curve of the compressive tested specimens for the PMMA matrix and their composites reinforced by the 1, 3, 5, and 10 wt.% Al2O3 nanoparticles. PMMA: polymethyl methacrylate; Al2O3: aluminum oxide. Compressive properties of (a) UCS, YS, (b) fracture toughness, and modulus of elasticity of the compressive tested PMMA specimens. PMMA: polymethyl methacrylate.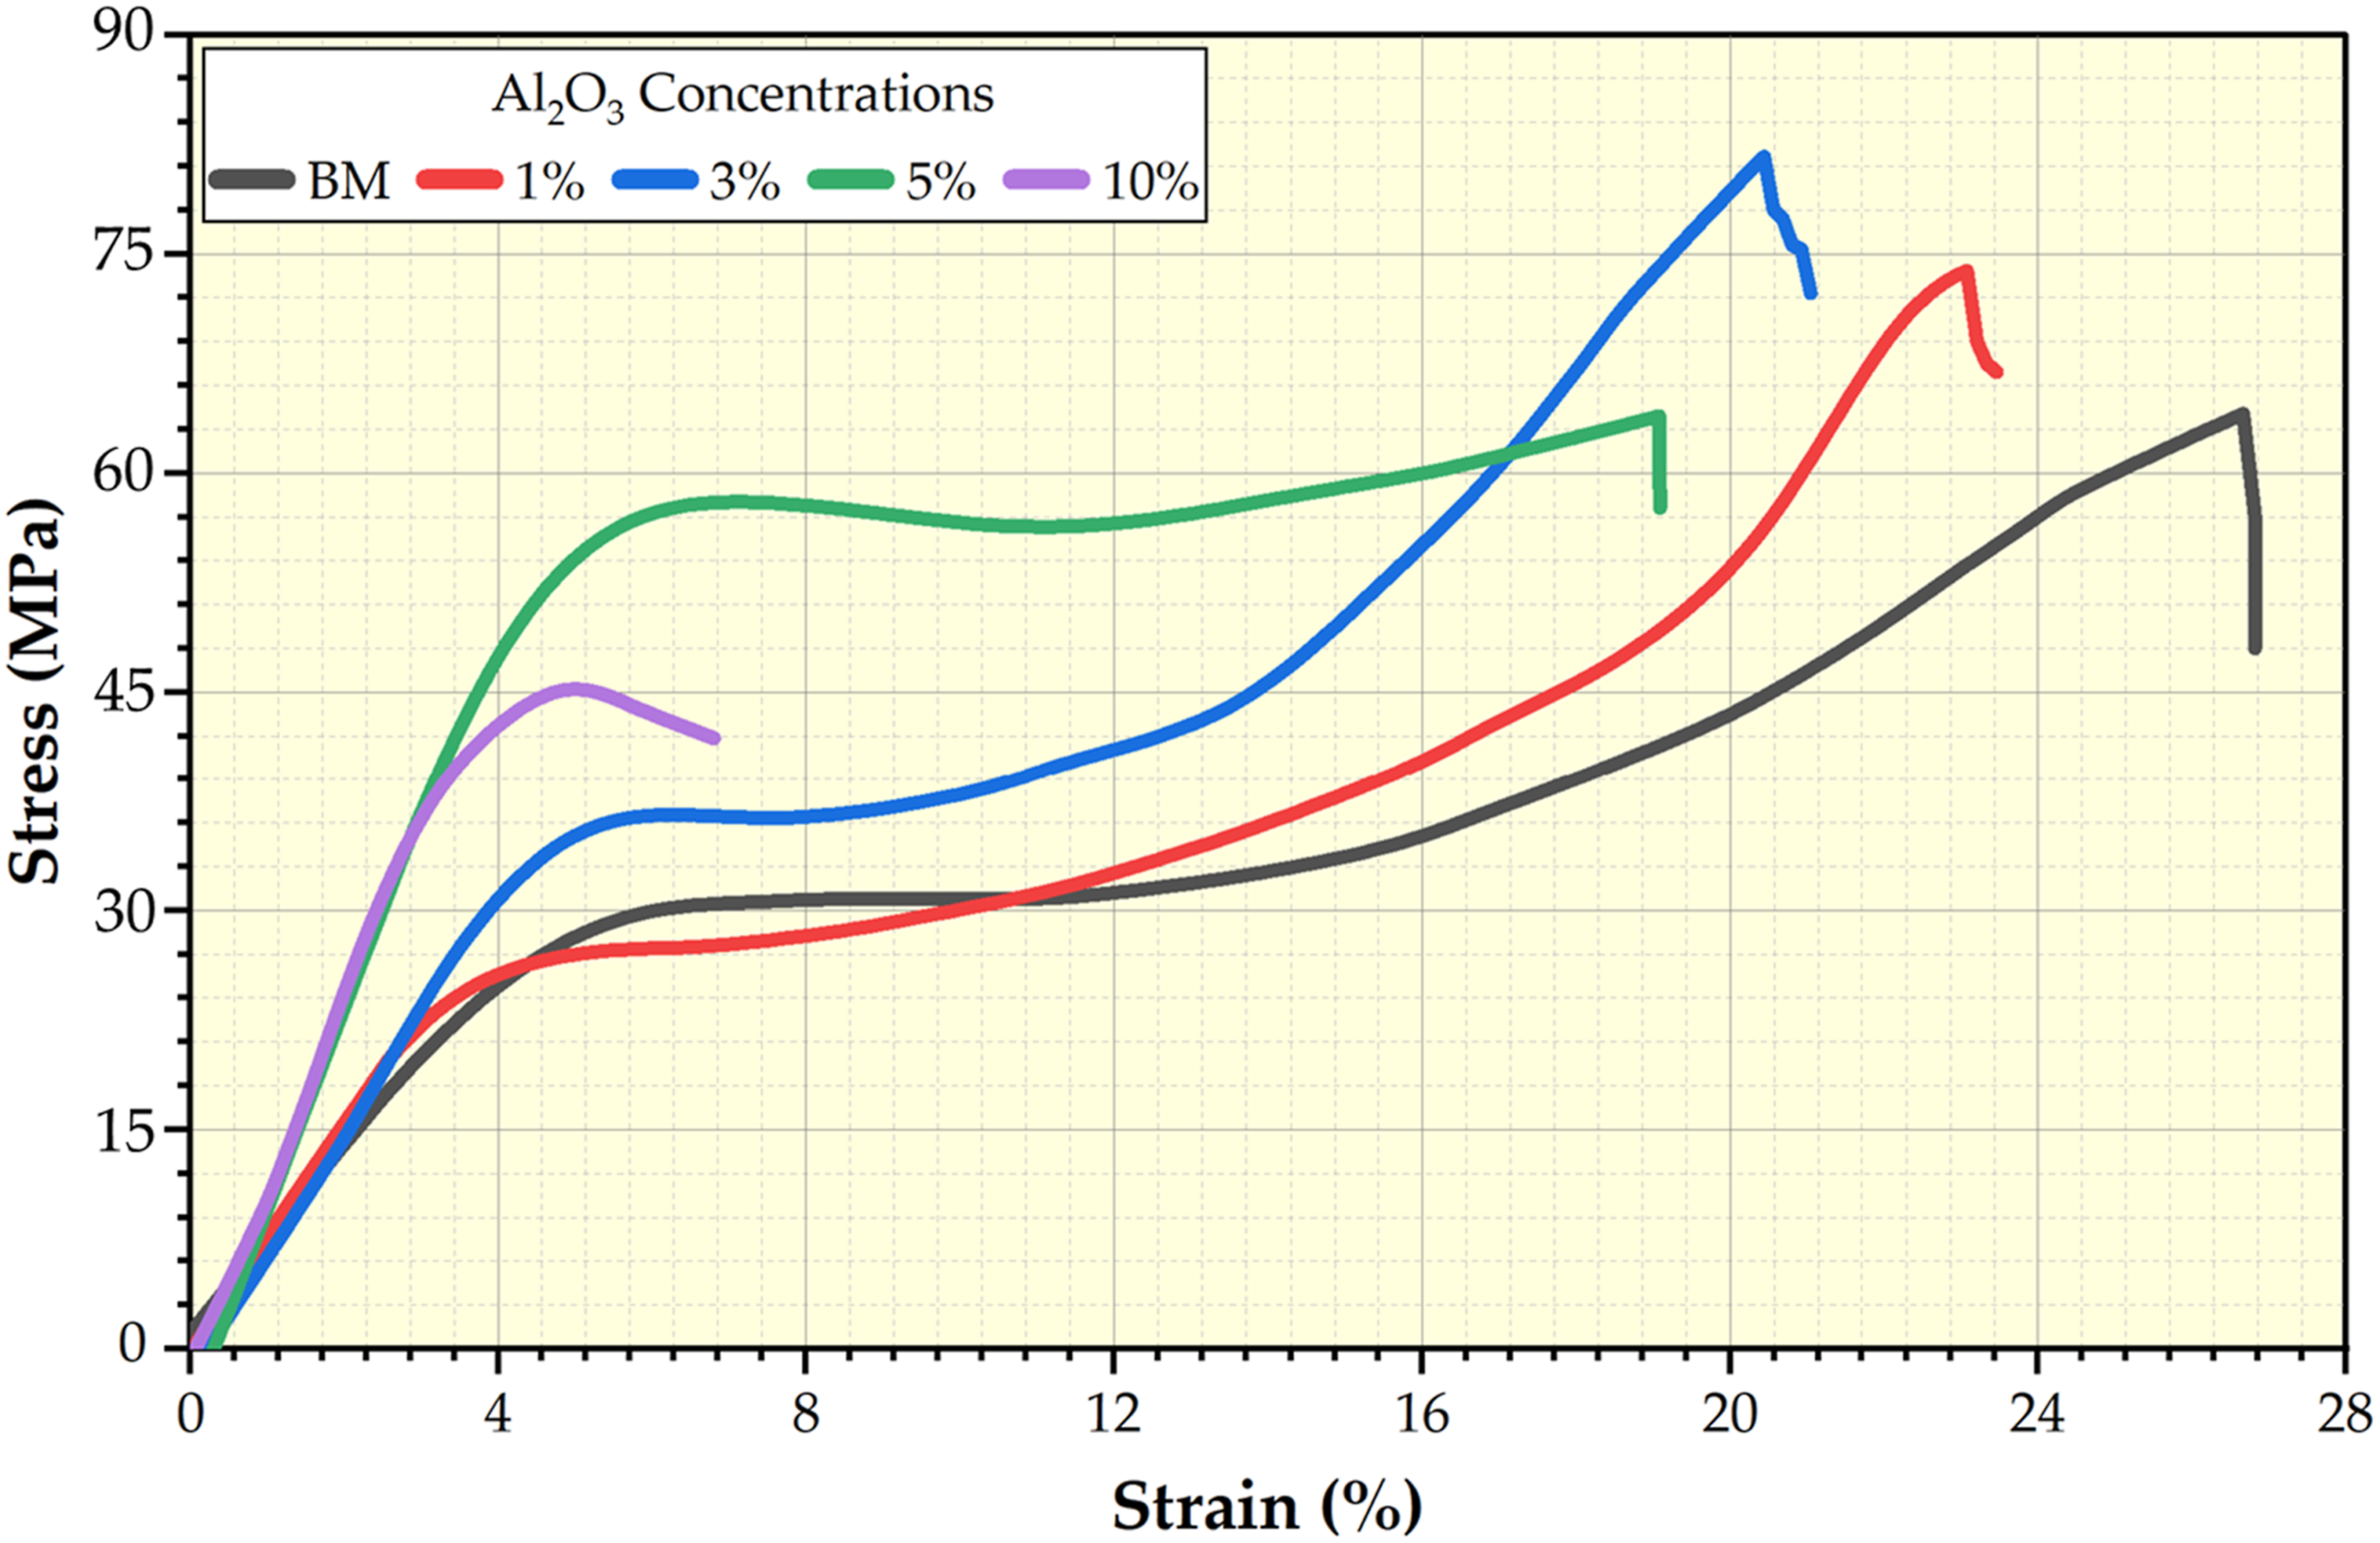
Microhardness of PMMA/nano Al2O3 composites
Hardness property is an important test to evaluate dental composites. The hardness value of tested composites can indicate their ability to resist deformation and fracture during chewing, biting, and occlusal loads. As evidenced by Figure 11, the PMMA without the Al2O3 addition has a microhardness of 22.8 ± 2.1HV. After adding the Al2O3 nanoparticles to the PMMA matrix, the produced PMMA composites were enhanced by increasing the content of nanoparticles. The PMMA matrix with 1, 3, 5, and 10 wt.% nanoparticles of Al2O3 revealed the microhardness values of 25.6 ± 3.3, 36.8 ± 3.1, 41.2 ± 2.5, and 49.5 ± 6.8 HV, with an enhancement around 12, 58, 80, and 115 % compared with the PMMA matrix, as shown in Figure 11. The explanation may be due to the hardness of the Al2O3 nano-ceramic particles being much higher than the PMMA matrix. Furthermore, the nano Al2O3 ceramic particles reinforce the PMMA matrix by filling in the gaps between the PMMA chains and forming a strong interfacial bonding between the particles and the matrix. As a result, the applied loads are shared across these strong interfaces, forming a hard surface by hindering the motion of the PMMA matrix along the stress direction.31,49 The wide range of the hardness measurements for the PMMA/10 wt.% nano Al2O3 composite specimen was observed due to the agglomeration of the Al2O3, as shown in Figure 6. Microhardness of the PMMA matrix and the PMMA/nano Al2O3 composites. PMMA: polymethyl methacrylate; Al2O3: aluminum oxide.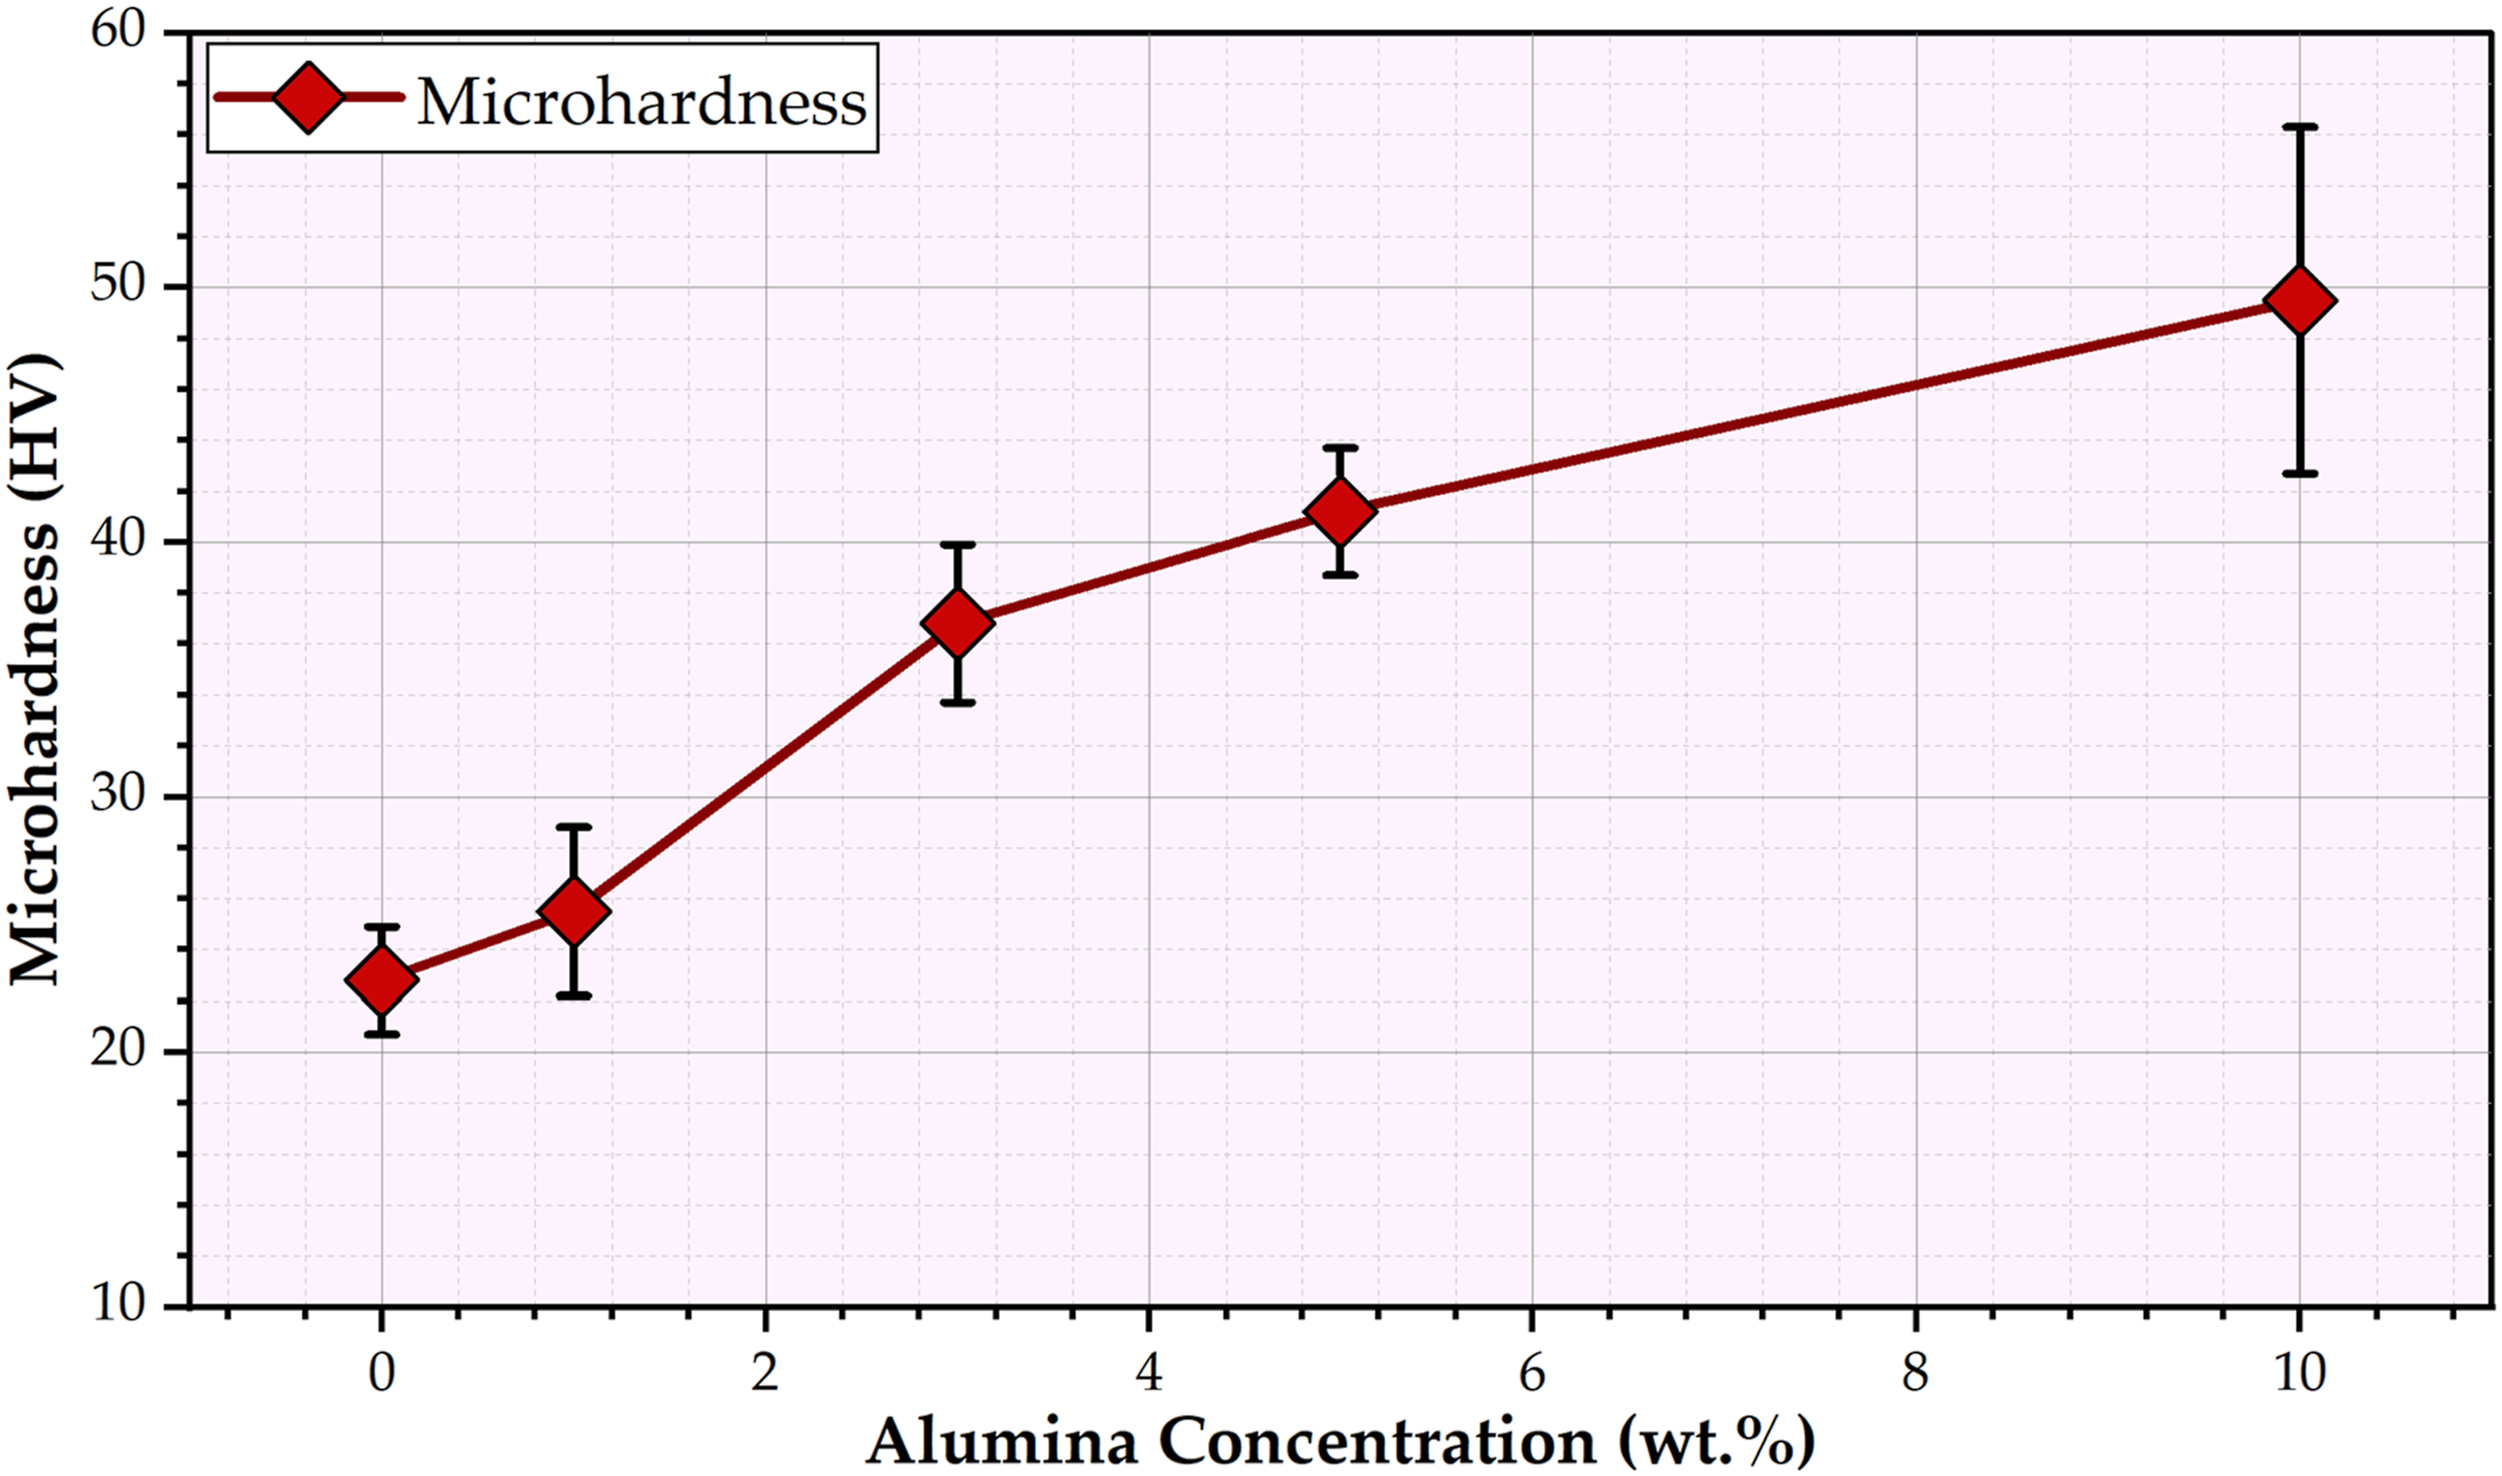
Wear performance of PMMA/nano Al2O3 composites
The wear test for dental materials like PMMA and their composites holds pivotal significance as it accurately evaluates their durability and longevity within the oral environment by simulating masticatory motions during everyday activities like chewing. This essential evaluation aids in developing high-quality dental prosthetics. The results of the wear test as a function of weight loss for the PMMA matrix and their corresponding PMMA/nano Al2O3 composites are illustrated in Figure 12. Incorporating Al2O3 nano-ceramic particles into a PMMA matrix has shown a beneficial effect during wear tests for produced PMMA/nano Al2O3 composites at all 1, 3, 5, and 10 wt.% concentrations, as shown in Figure 7. This is attributed to the Al2O3 nanoparticle’s extremely small size and high surface area, which effectively interacts with the PMMA matrix. In addition, the ability of the nano ceramic particles to absorb and distribute stresses reduces the propensity for cracks and material loss during the wear test.
41
As a result, integrating Al2O3 nano-ceramics particles into the PMMA matrix shows considerable potential in improving the durability and dependability of PMMA composites in dental applications. This is achieved by enhancing the composite material’s overall mechanical strength (compressive; Figure 10; hardness; Figure 11) and resistance to wear (Figure 12). Also, it was noticed that the wear resistance of the PMMA/nano Al2O3 composite samples went down when the Al2O3 concentration was raised to 10 wt.% compared to PMMA/5 wt.% Al2O3, as shown in Figure 12. The high concentrations of ceramic particles can lead to stress concentrations around the ceramic particles, resulting in micro-cracking or debonding between the matrix and the ceramic particles (Figure 6). This can accelerate wear by creating more wear debris and roughening the surface. Weight loss of the wear-tested specimens of the PMMA matrix and the PMMA/nano Al2O3 composites. PMMA: polymethyl methacrylate; Al2O3: aluminum oxide.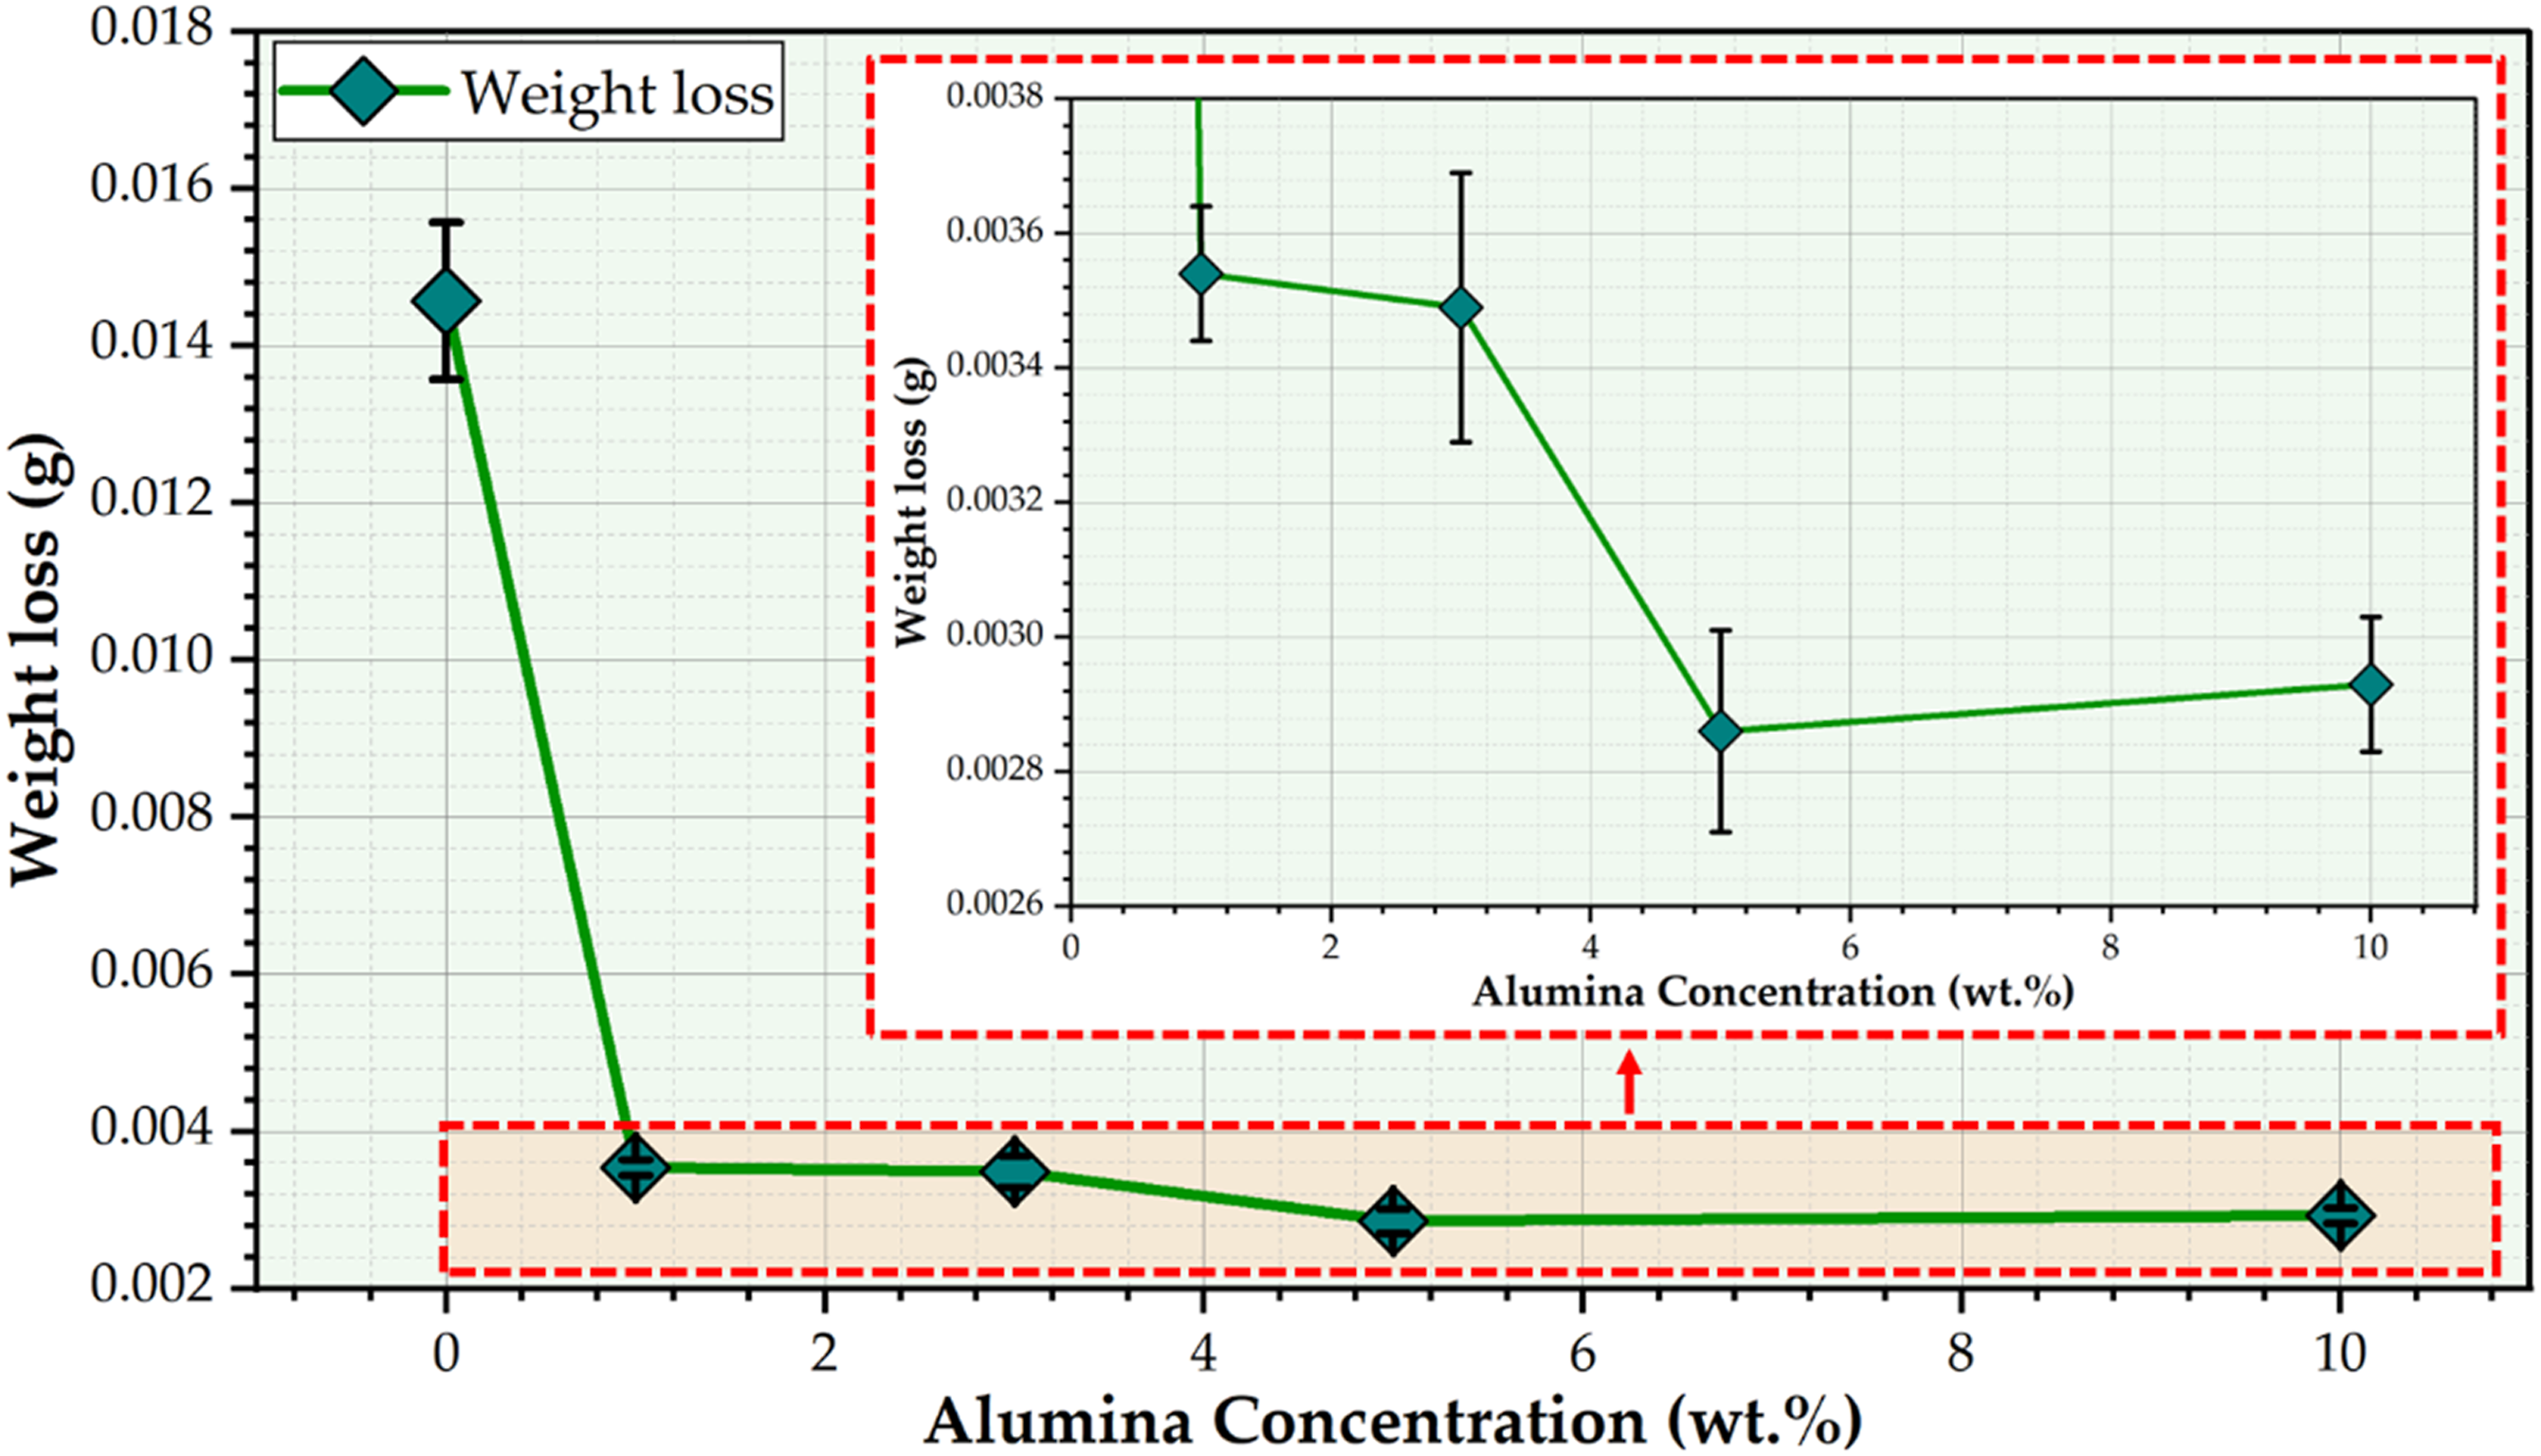
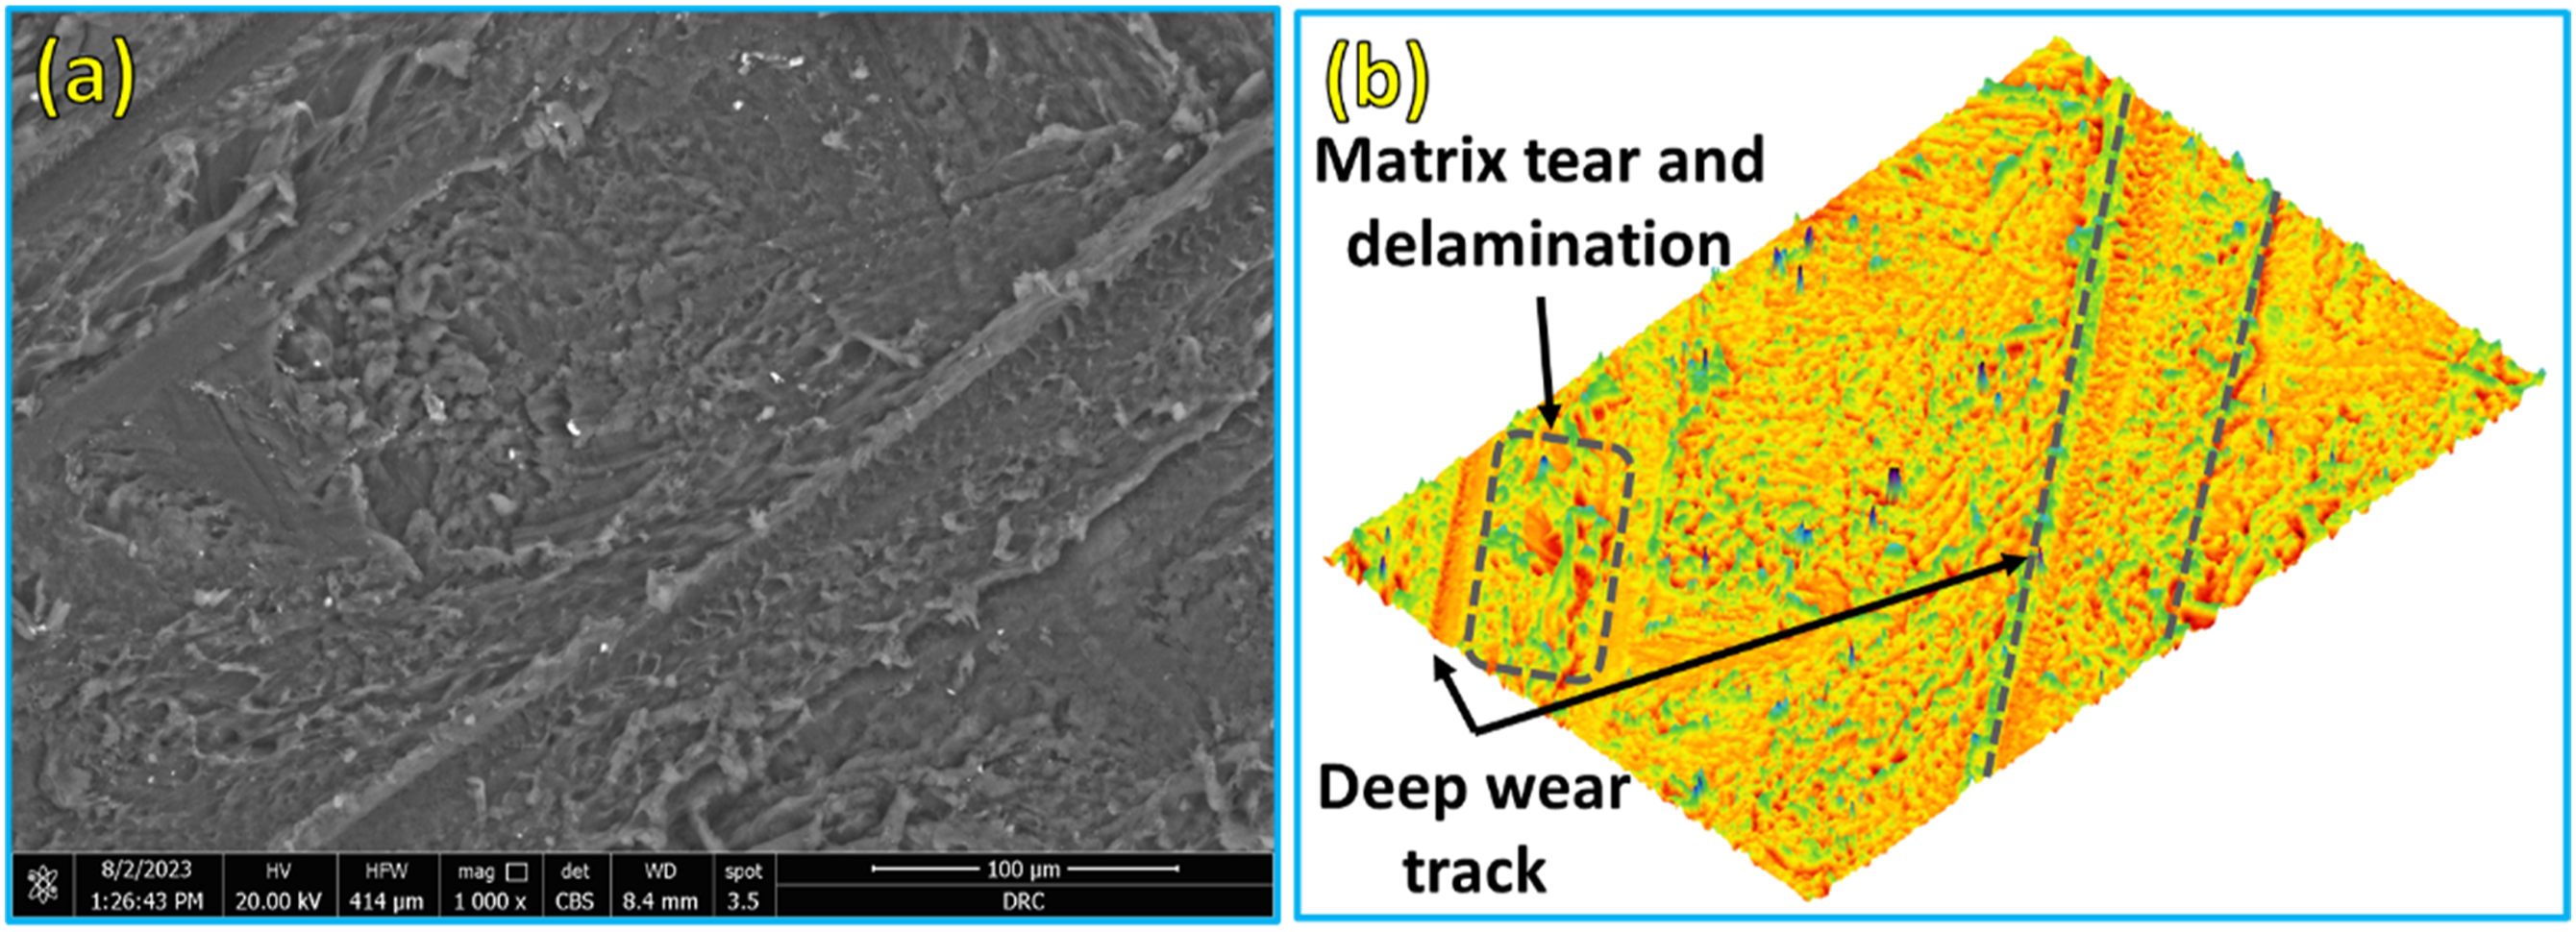
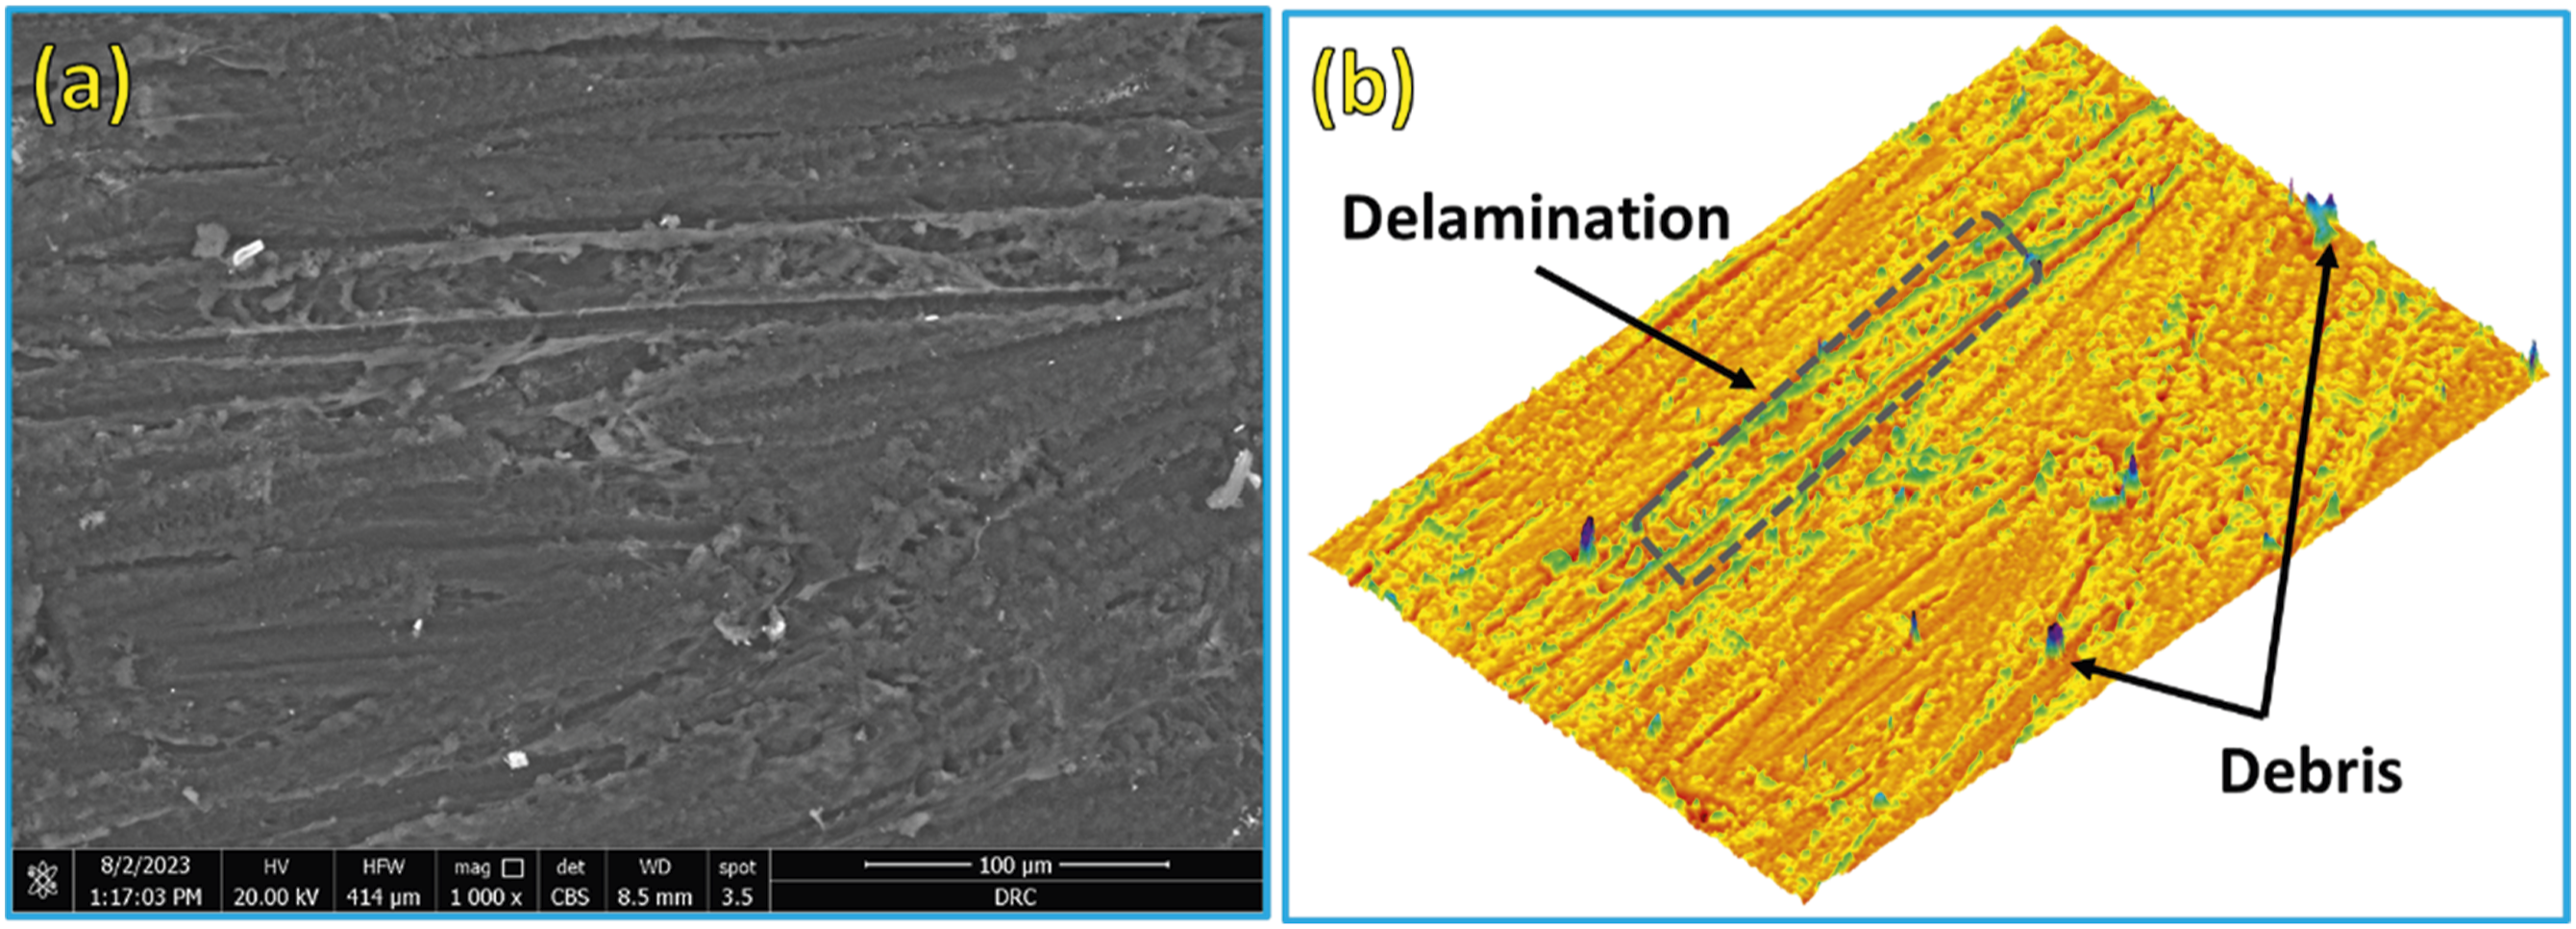
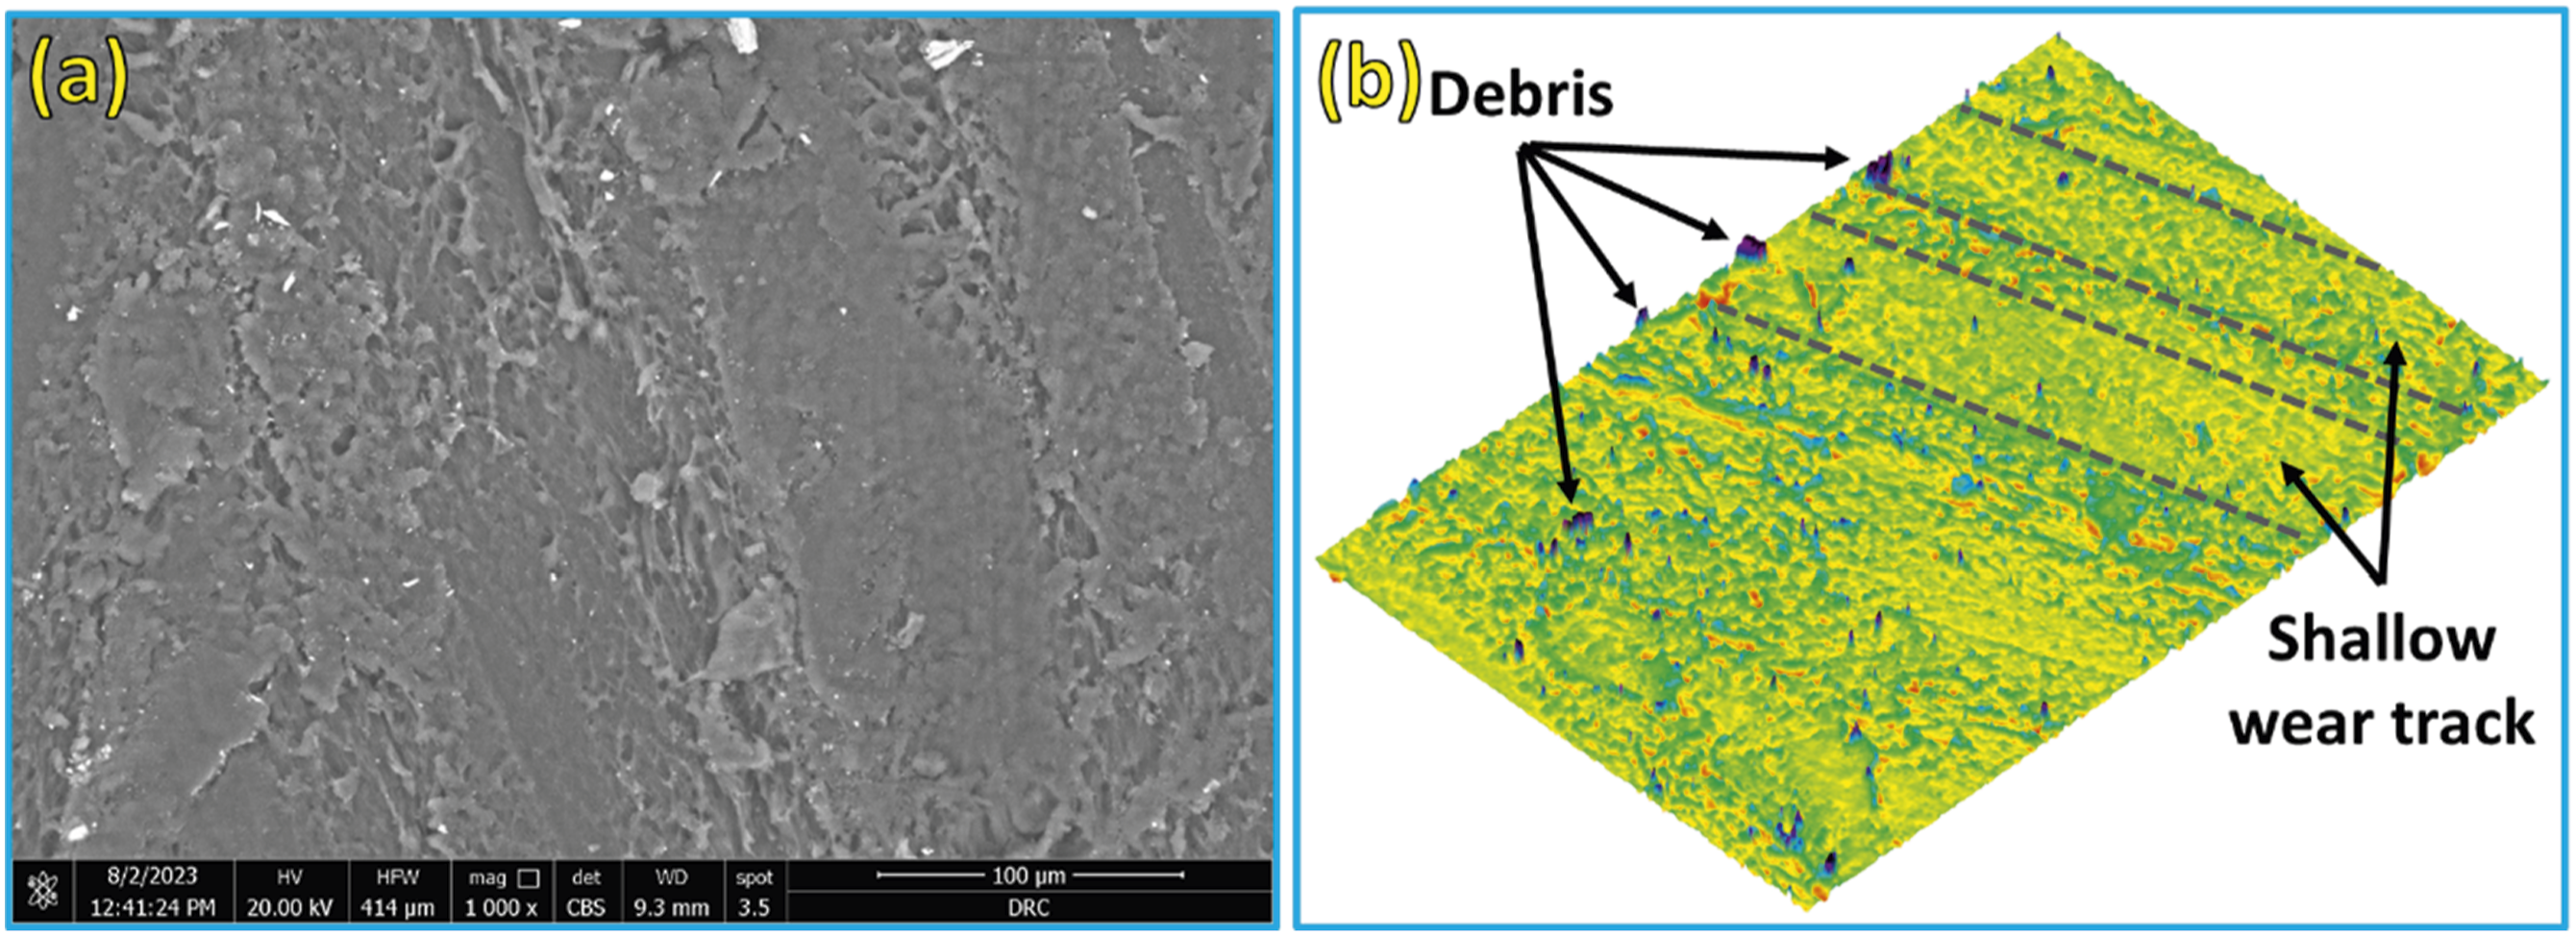
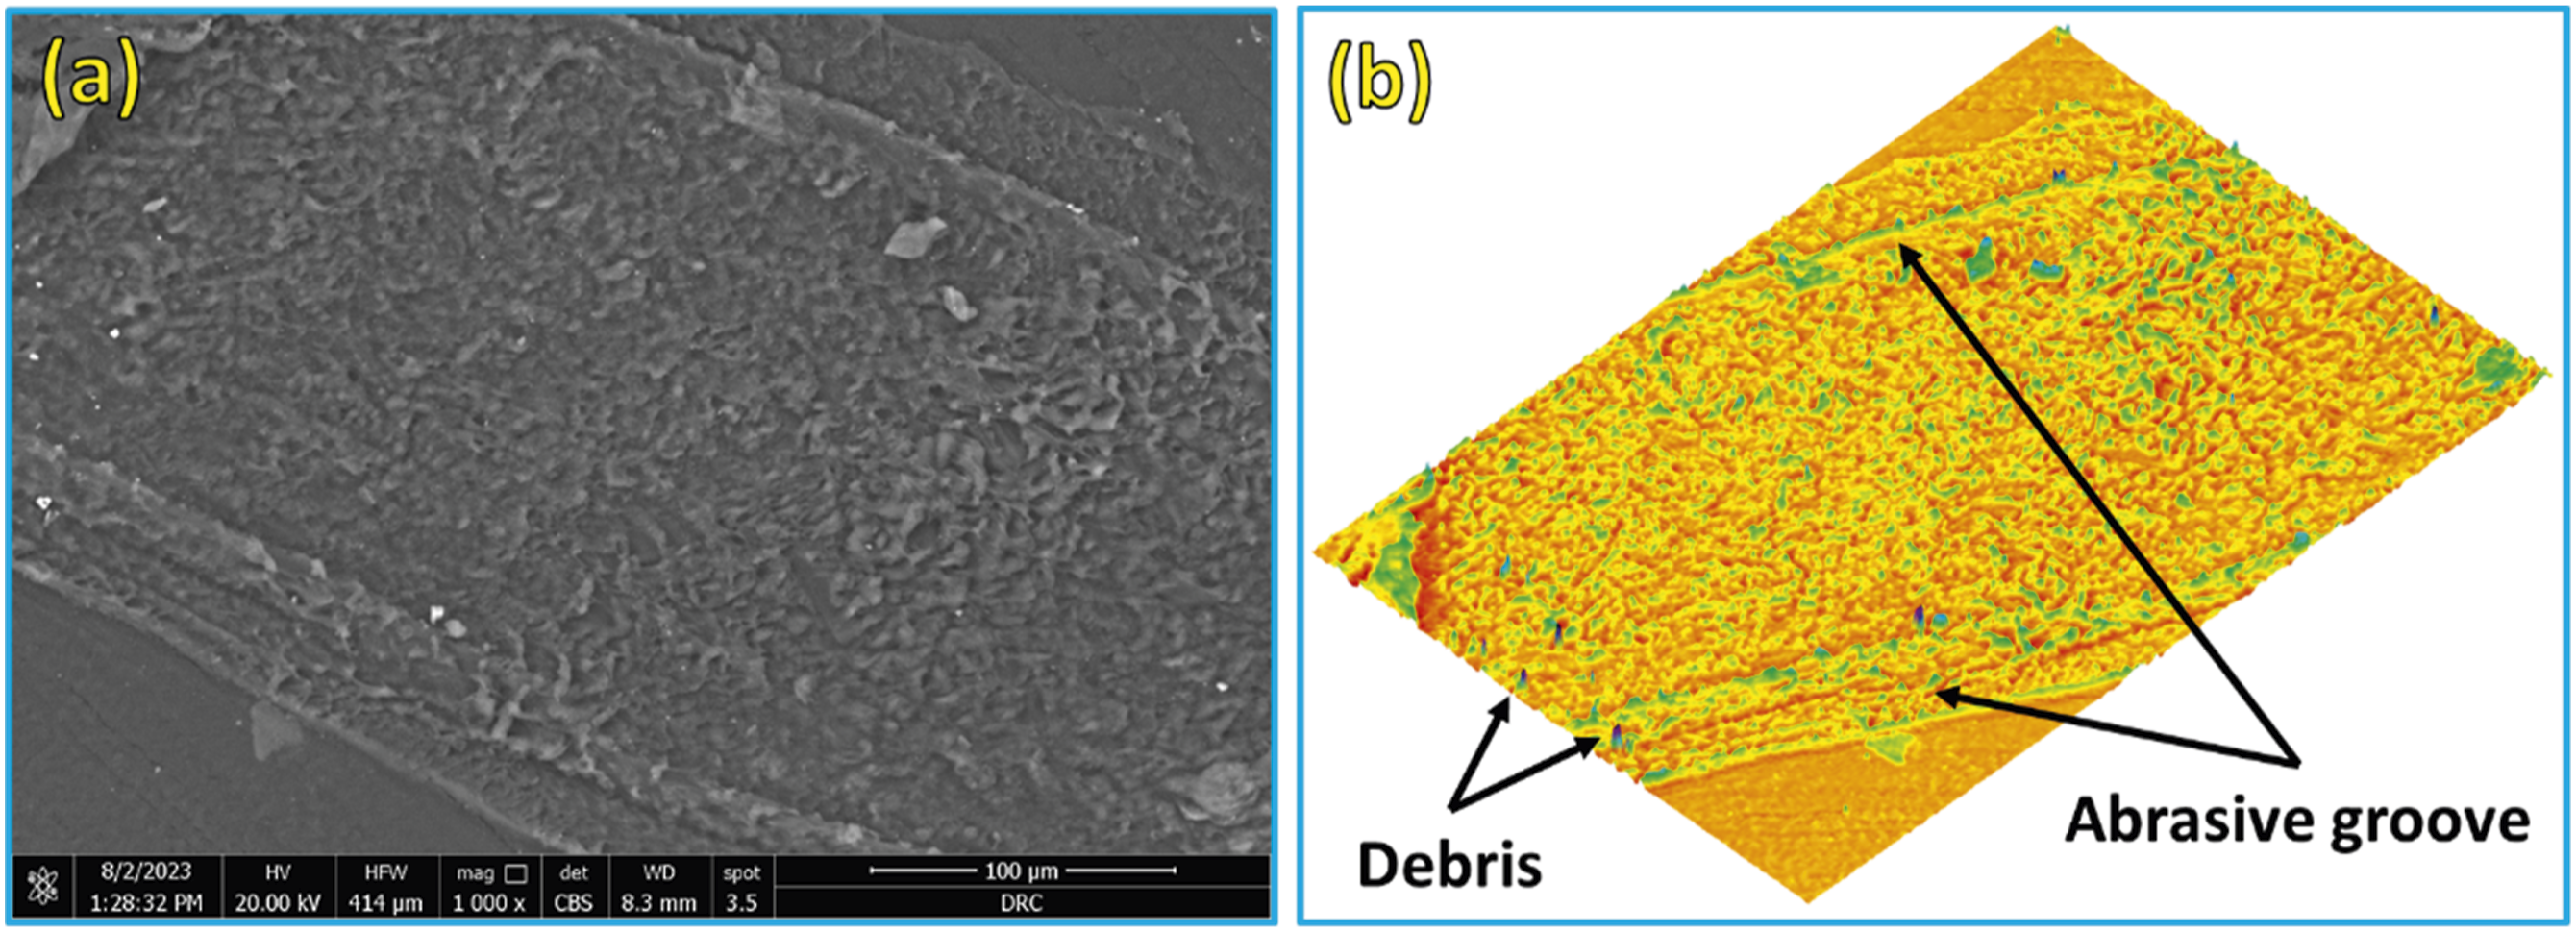
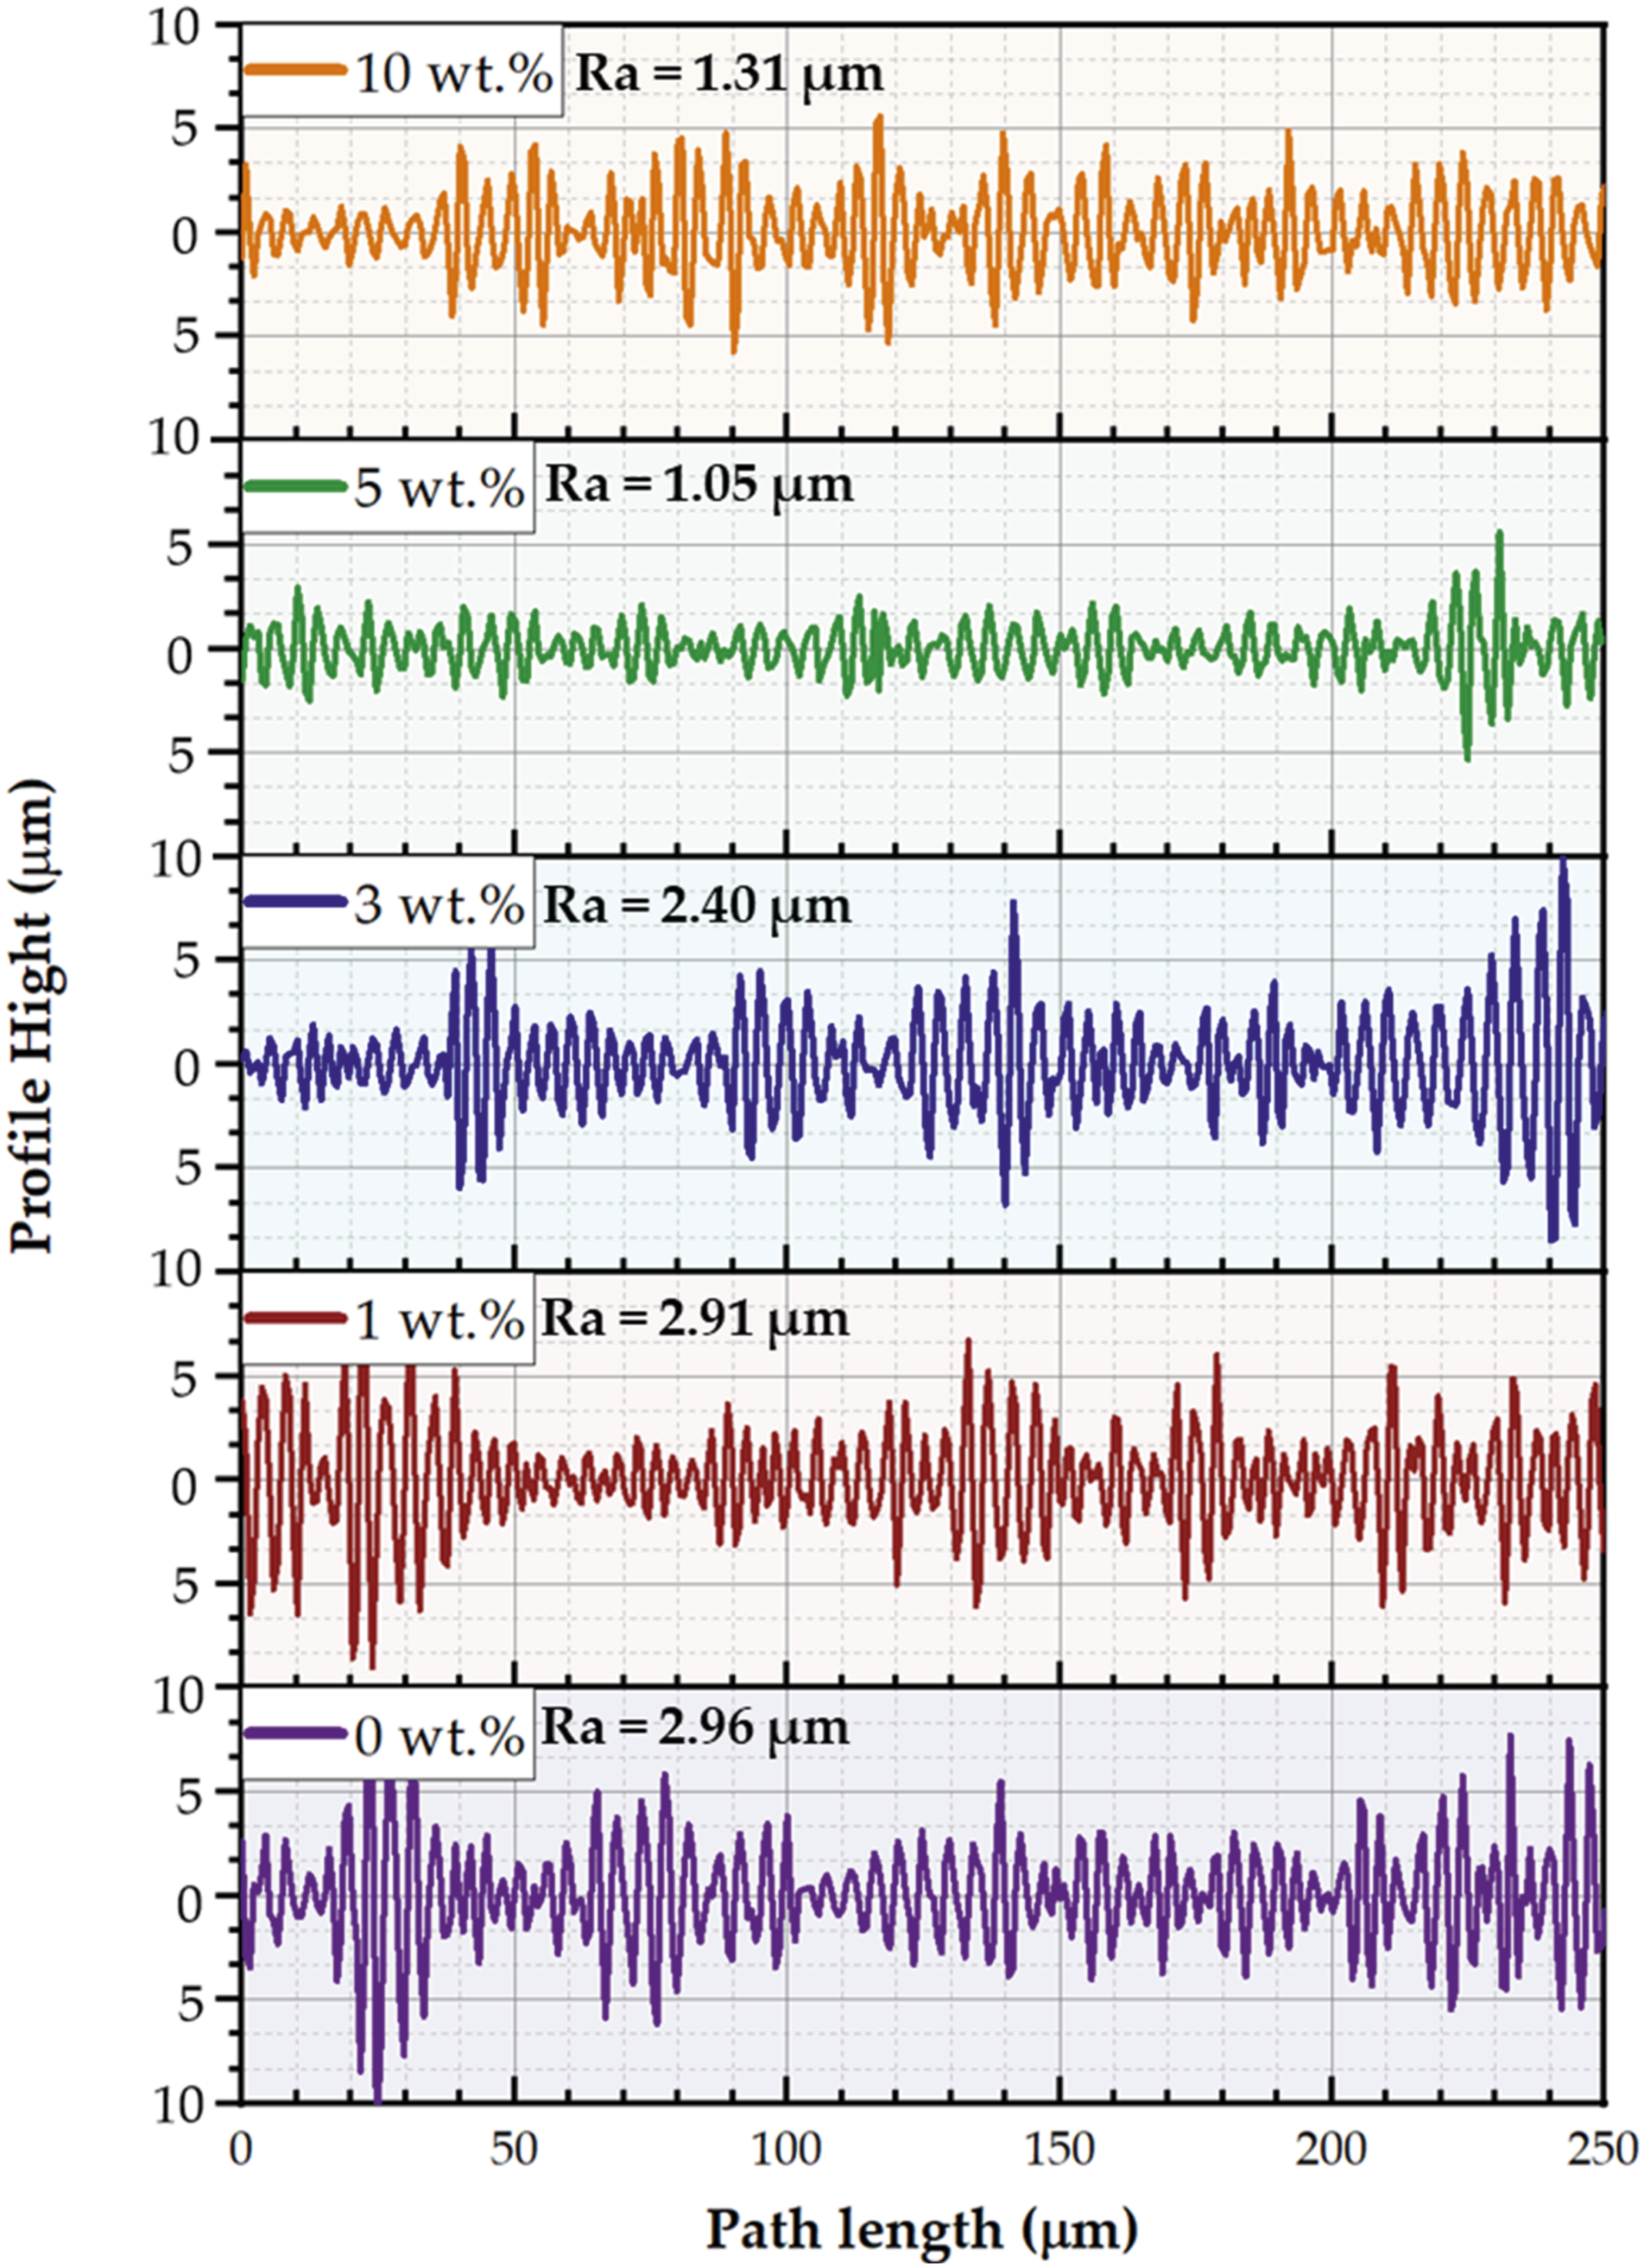
The SEM of worn surfaces for the PMMA and their corresponding PMMA/nano Al2O3 composites were investigated to reveal the different wear mechanisms during the wear test. Figures 13–17 depict the worn surfaces and 3D topography of the wear-tested samples of the PMMA and their PMMA/nano Al2O3 composites. Furthermore, The surface roughness profiles were measured for the worn surfaces of the wear-tested samples (PMMA matrix and their corresponding composites) using the Gwyddion software (An SPM data visualization and analysis tool, Version 2.60), as shown in Figure 18. The PMMA matrix without Al2O3 nanoparticles and the PMMA reinforced with a smaller amount of Al2O3 (1 wt.%) showed severe wear, as evidenced by deep wear tracks, tearing, and delamination in Figures 13 and 14, respectively. Adding Al2O3 nanoparticles at concentrations of 3, 5, and 10 wt.% changed the features of the wear surface, as depicted in Figures 15–17, respectively. As the wear features were less severe, the surface became smoother, corresponding to the increasing Al2O3 content up to 10 wt.% (Figure 18). Furthermore, no microcracks were detected, particularly at the 5 and 10 wt.% Al2O3 concentrations can be ascribed to the excellent microhardness and mechanical behavior of PMMA/nano Al2O3 composites and the Al2O3 particles’ ability to withstand loads. Also, these results indicated an increase in the wear resistance of the PMMA/nano Al2O3 composites. The entire surface of the PMMA matrix sample and the PMMA reinforced with 1 wt.% Al2O3 (Figures 13 and 14) displays debris, deep wear tracks, areas of tear, and delamination. There is evidence of a considerable weight loss of the pure sample on the contact zone due to peeling and wear debris. The SEM images of the worn surface of a PMMA that reinforced 3, 5, and 10 wt.% of Al2O3 nanoparticles, respectively, are displayed in Figures 15–17. Because of their high hardness, Al2O3 nanoparticles were added, which reduced the areas of tear and delamination. Additionally, the frictional contact forces were decreased by the rolling effect of the Al2O3 nanoparticles.39,49–51 Thus, a low weight loss indicating high wear resistance was obtained by increasing the content of Al2O3 nanoparticles in the PMMA/nano Al2O3 composites. However, compared to PMMA included with 0, 1, and 3 wt.% of Al2O3 nanoparticles, the SEM picture of PMMA incorporated with 5 and 10 wt.% reveals a low weight loss, indicating higher wear resistance (Figure 12). PMMA/nano Al2O3 still has a lower wear rate than the PMMA matrix. As previously indicated, adding more Al2O3 nanoparticles to PMMA improves its tribological characteristics. In addition, The PMMA matrix exhibits the highest surface roughness value of 2.96 µm among the wear-tested samples. In contrast, a lower surface roughness value of 1.05 µm is attained for the PMMA/5 wt.% Al2O3 denture base sample. The relationship between the tested samples’ wear and the worn surfaces’ roughness is complex and multifaceted. In general, adding nano-Al2O3 has a noticeable effect on the roughness of worn surfaces of PMMA/Al2O3 wear-tested samples, which was greatly affected by the properties acquired as a result of the addition of nano-ceramics like hardness, wear resistance, and wear mechanisms. First, the wear mechanisms, such as deep wear tracks, tearing, and delamination (Figures 13–15), create deeper grooves and higher peaks, generating rougher surfaces. Meanwhile, shallow wear tracks and smoother areas (Figures 16 and 17) lead to less roughness on worn surfaces. On the other hand, increasing the hardness (Figure 11) resists wear, leading to smoother surfaces. (a) SEM images of the worn surfaces (b) 3D topography for the wear-tested specimens of the PMMA matrix. SEM: scanning electron microscopy; PMMA: polymethyl methacrylate. (a) SEM images of the worn surfaces (b) 3D topography for the wear-tested specimens of the PMMA matrix reinforced with 1 wt.% nano Al2O3. SEM: scanning electron microscopy; PMMA: polymethyl methacrylate; Al2O3: aluminum oxide. (a) SEM images of the worn surfaces (b) 3D topography for the wear-tested specimens of the PMMA matrix reinforced with 3 wt.% nano Al2O3. SEM: scanning electron microscopy; PMMA: polymethyl methacrylate; Al2O3: aluminum oxide. (a) SEM images of the worn surfaces (b) 3D topography for the wear-tested specimens of the PMMA matrix reinforced with 5 wt.% nano Al2O3. SEM: scanning electron microscopy; PMMA: polymethyl methacrylate; Al2O3: aluminum oxide. (a) SEM images of the worn surfaces (b) 3D topography for the wear-tested specimens of the PMMA matrix reinforced with 10 wt.% nano Al2O3. SEM: scanning electron microscopy; PMMA: polymethyl methacrylate; Al2O3: aluminum oxide. The roughness profile of the PMMA matrix and their composites reinforced with 1, 3, 5, and 10 wt.% nano Al2O3. PMMA: polymethyl methacrylate; Al2O3: aluminum oxide.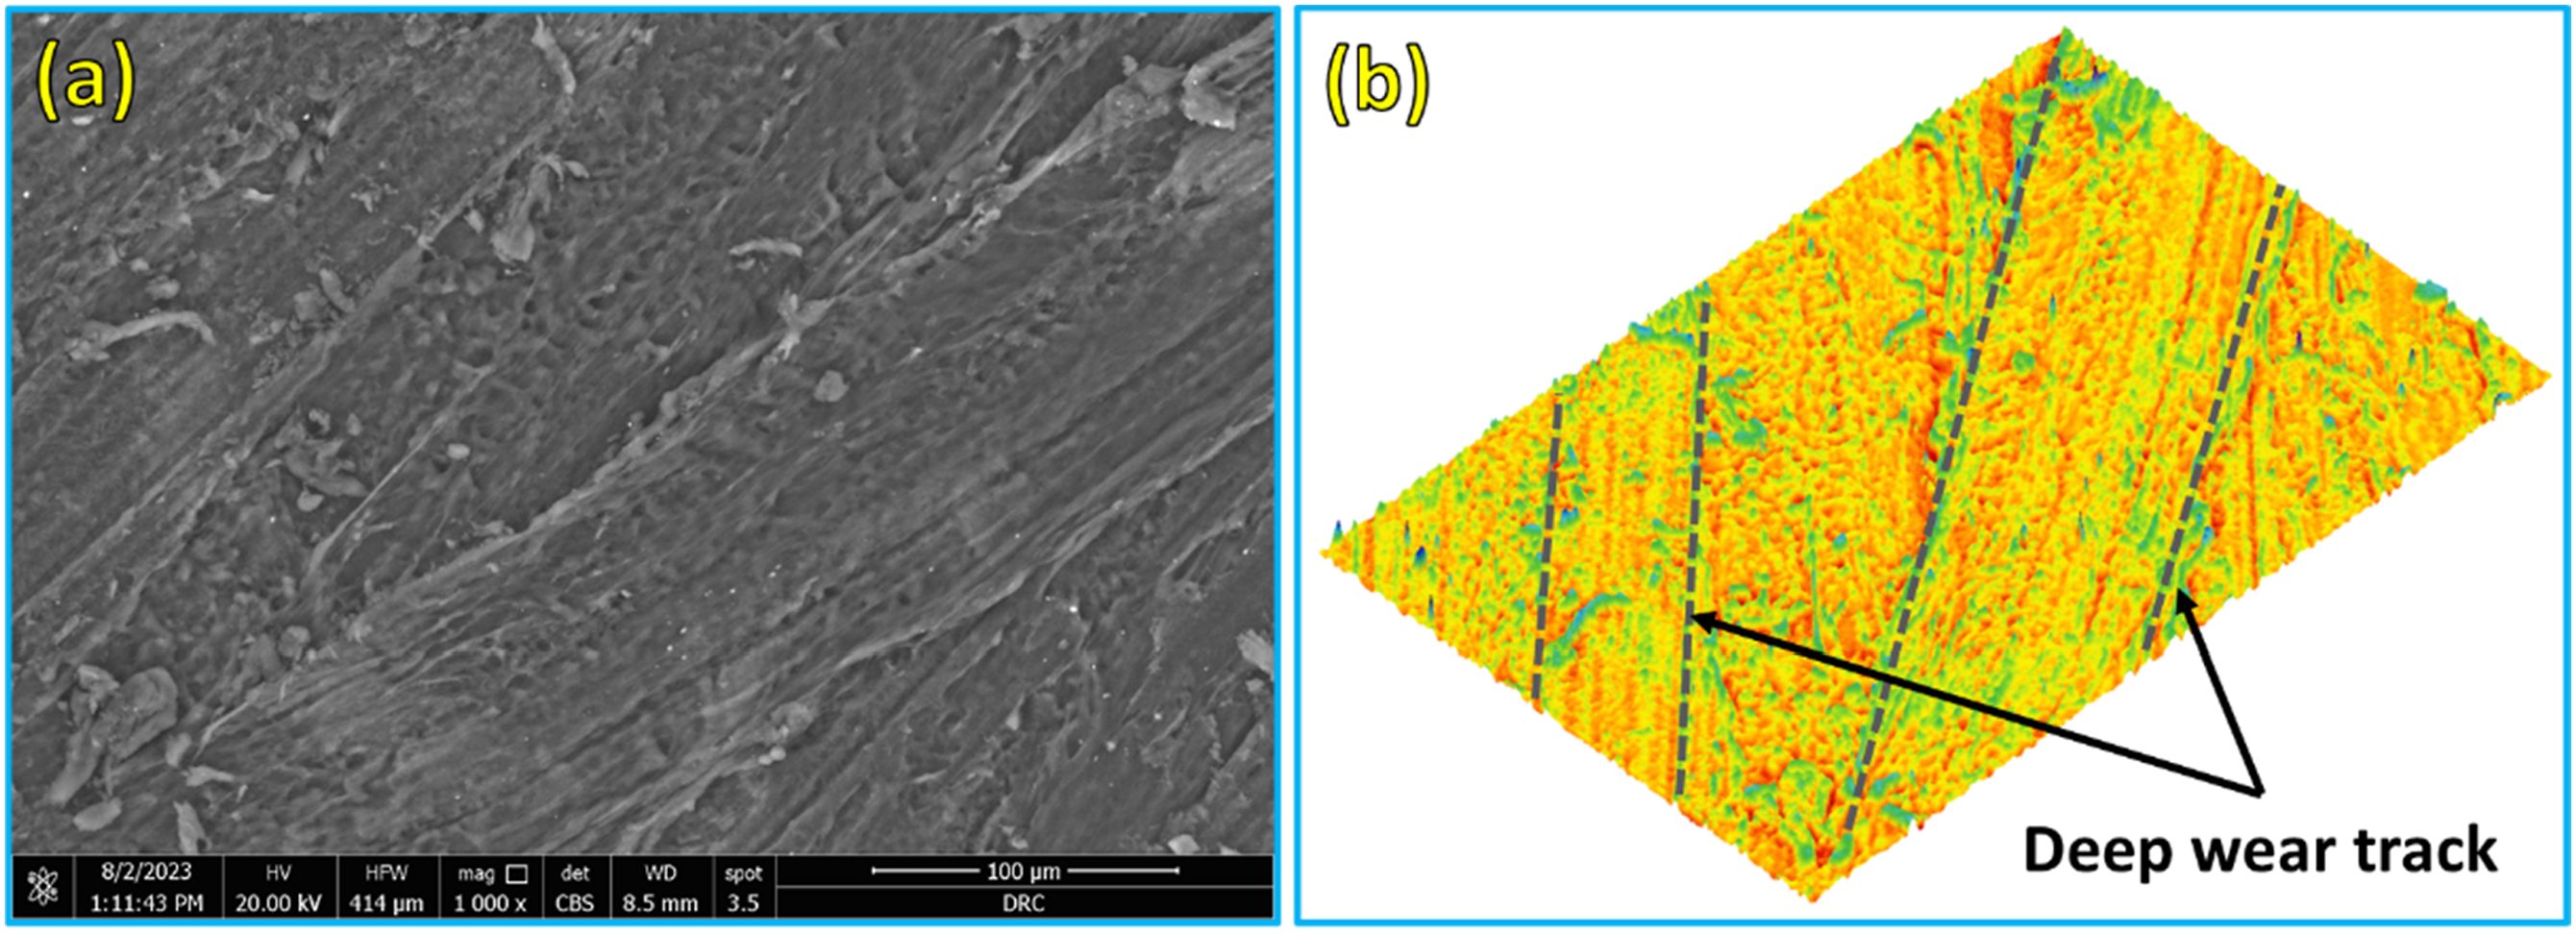
Conclusions
This study aimed to examine the impact of incorporating Al2O3 as a nanoparticle filler in acrylic denture base applications, intending to improve their properties like compressive strength, hardness, and wear resistance. Based on the findings, it is possible to infer the following conclusions: 1. The microstructure results of dentures that have been reinforced reveal that the material preparation was done well utilizing the applicable regime, resulting in a lack of porosity and micro defect. No segregation was detected in the PMMA reinforced with Al2O3 nanoparticles up to 5 wt.%. 2. Incorporating Al2O3 nanofillers into PMMA denture base material at concentrations up to 10% resulted in a notable increase in the bulk density of the PMMA composites produced with an acceptable porosity of less than 5%. 3. The compressive strength increased until reaching a maximum at composites with 5 wt.% nano Al2O3 and then decreased at composites with 10 wt.%. A similar trend was also observed for the yield strength and the modulus of elasticity values of the PMMA composites. The enhancement of the composites' compressive strength compared to that of the PMMA matrix was 82% for the composites with 5 wt.% of Al2O3. 4. The microhardness of PMMA was shown to increase upon adding Al2O3 nanoparticles at concentrations ranging from 1 to 10 wt.%. The highest microhardness value recorded was 49.5 HV, achieved by adding 10 wt.% Al2O3 with an improvement of around 115% over the PMMA matrix. 5. Adding Al2O3 reduced weight loss relative to the PMMA matrix, indicating improved wear resistance and increasing the nanoparticles up to 10 wt.% Al2O3 further improved the wear resistance.
Footnotes
Declaration of conflicting interests
The author(s) declared no potential conflicts of interest with respect to the research, authorship, and/or publication of this article.
Funding
The author(s) received no financial support for the research, authorship, and/or publication of this article.