
Abstract
Poly(vinylidene fluoride) (PVDF) based conducting polymer composites with carbon nanomaterials can be used for mechanical energy harvesting through piezoelectric or triboelectric effect. This study aims to investigate the influence of PMMA molecular weight on the electrical, thermal, and wetting properties of PVDF/40 wt.% PMMA blend nanocomposites reinforced with expanded graphite (ExGr). The blend nanocomposites with 40 wt.% PMMA have been prepared by solution blending method by using two different molecular weights of PMMA whose melt flow indices are 2 g/10 min and 2.3 g/10 min. The coexistence of the electroactive gamma and non-polar alpha phases of PVDF in the blend nanocomposites has been confirmed by X-ray diffraction, Fourier transform infrared spectroscopy and differential scanning calorimetry analyses. While overall crystallinity (%) of low molecular weight PMMA employed blend nanocomposites is lower than that of high molecular weight PMMA blended nanocomposites, the electroactive gamma phase has been found to increase in the former blend nanocomposites. The dispersion of graphite nanosheets has been observed to be better in high molecular weight PMMA employed blend nanocomposites which results in higher electrical conductivity. Impedance analysis of PVDF-40 wt.% PMMA-2 wt.% ExGr blend nanocomposite with high molecular weight PMMA results in enhanced interjunction capacitance (74.5 pF) in comparison to low molecular weight PMMA mixed blend nanocomposites (68 pF). Water contact angle (WCA) increases with molecular weight of PMMA and ExGr loading level. Thermogravimetric analysis has shown that the char content (above 500°C) is slightly higher for the blend with low molecular weight PMMA than with high molecular weight PMMA.
Keywords
Introduction
Polymer blending is a cost-effective and easily processible technique to produce materials with desirable and enhanced properties compared to its constituents. 1 Polymer blends can be broadly classified into two types, namely miscible and immiscible blends. The morphologies of the polymer blends play a great role in altering the properties of the blends. Though blending of two semi-crystalline polymers have been investigated and reported, forming miscible blends and the associated morphology changes correlated to end properties is being extensively focused.2,3 Incorporation of suitable fillers into polymer blends results in significant enhancement in mechanical, electrical, and thermal properties of the material.4–7 The ability to fine-tune the properties of a blend nanocomposite by varying several parameters like filler loading, filler shape, filler orientation, and dispersion to meet commercial demands has opened a wide range of applications.
PVDF, a semi-crystalline polymer possessing excellent mechanical properties, chemical resistance, and piezoelectric properties, has attracted significant attention in sensor, energy harvesting, and biomedical applications. 2 PVDF has five different crystalline phases such as α, β, γ, δ, and ε, among which β, γ, and δ phases have been reported to possess electroactive properties. The most stable phase of PVDF is non-polar α phase. Several methods to induce electroactive phases in PVDF have been reported such as uniaxial stretching, electrospinning, solution blending, and incorporation of nanofillers.3,8,9 Inducing electroactive phases of PVDF is very important for energy harvesting applications. Specialty polymers like PVDF is costlier and hence blending with polymers like PMMA is often carried out without compromising the required property level to reduce the cost. The mechanical properties of PVDF-PMMA miscible blend have been reported to be enhanced due to the interaction between carbonyl group of PMMA and CH2 group of PVDF. 10 PMMA is an amorphous, transparent thermoplastic polymer with high impact and shatter resistance, which has profound applications in aerospace, electronics, automotive and biomedical areas and forms a miscible blend with PVDF as reported elsewhere.11,12 Xia et al. 13 have investigated electrospun PVDF-PMMA based triboelectric nanogenerators and reported enhanced tensile modulus due to blending of PMMA with PVDF. The authors further reported an open circuit voltage of 810 V, short circuit current of 70 μA and maximum peak power density of 13.8 W/m2. Ma et al. 14 have studied in detail the effect of loading of different weight fractions of PMMA in PVDF on the morphology, crystallinity, mechanical properties of the membrane when thermally induced phase separation process has been employed using a single diluent. Zhao et al. 15 have investigated non-solvent precipitation of PVDF-PMMA blends. The crystallization of PVDF is affected by the volume of non-solvent in DMF/ethanol mixture and it has been reported that beta phase of PVDF is induced when the ethanol content is less than 60% by volume. Friere et al. 16 have investigated non-isothermal crystallization behavior of PVDF-PMMA blends. The authors have reported generation of beta phase of PVDF when PMMA is blended under a suitable processing condition and shifting of fusion peak to lower temperatures due to PMMA blending. PVDF-PMMA microporous membranes for lithium battery applications has been reported by Cui et al. 17 The membranes are prepared by thermally induced phase separation process. The authors have reported decrease in the crystallinity with increase in the loading of PMMA and phase separation results beyond 40 wt.% PMMA loading in the blend along with increasing porosity of the blend membrane. Tang et al. 18 have investigated the piezoresistive properties of PVDF- 20 wt.% PMMA and PVDF- 30 wt.% poly (butylene succinate) with the incorporation of conducting carbon black. At 5 % strain, the blend nanocomposite exhibits 78% change in electrical resistance. For PVDF-PMMA-graphene oxide nanoparticle (GO) blend nanocomposite, after incorporating, the crystallinity is decreased, and the energy band gap of nanocomposite film has been shown to be decreased with the incorporation of GO nanoparticles. 19 Alhusaiki-Alghamdi, H.M. et al. 20 have investigated the effect of incorporation of graphene oxide (GO) on the electrical and dielectric properties of blend nanocomposites. The electrical conductivity has been shown to increase with the loading of the filler. Lee et al. 21 have prepared nanocomposites of PVDF-PMMA blend with multiwalled carbon nanotubes by melt mixing and hot press moulding followed by quenching or annealing. Addition of CNTs promoted beta crystals formation. Feng et al. 22 have studied crystallization behavior of PVDF in PVDF/PMMA blend when carbon nanotubes are incorporated. The authors proved the fact that CNTs exhibited stronger interfacial interaction with PMMA which resulted in uniform dispersion of fillers. Mohammadi et al. 23 have prepared PMMA/graphene master batch compounded with PVDF by solution mixing in different ratios. PMMA chains induced beta phase but at elevated temperature the beta phase of PVDF could not be stabilized. However, incorporation of graphene stabilizes the beta phase of PVDF at elevated temperature. Through DSC analysis the authors proved that graphene sheets can act as nucleating agent and enhance crystallinity. Apart from incorporating various carbon nanostructures in PDVF/PMMA blends, nanocomposites are prepared by incorporating exfoliated layered silicates in the blend matrix. 24 The authors have made use of PMMA as the interfacial agent. The morphology rheological behaviors of the blend nanocomposites were investigated.
Most of the works reported in the literature related to PVDF-PMMA blend are mainly focused on crystallization studies. However, how the crystallization of PVDF changes with molecular weight of PMMA is seldom investigated and addressed in the literature. In a similar fashion, the dependence of electrical conductivity of PVDF/PMMA blend with incorporation of carbon nanostructures on the molecular weight of PMMA has not been addressed in the literature. Hence the knowledge gap in understanding the effect of molecular weight of PMMA on the electrical, thermal properties of PVDF-40 wt.% PMMA with expanded graphite incorporation will be addressed in this paper.
Electrically conducting polymer composites (CPC) with various carbon nanostructures such as graphene, CNT incorporated in polymer matrices such as PVDF are being investigated for diversified applications such as EMI shielding, sensors etc. 25 In order to disperse the carbon nanostructure like CNT in polymer matrices, usually functionalization is being carried out. 26 Carbon nanostructures have distinct advantages over metals due to low density, non-corrosive etc. PVDF-based nanocomposites with various carbon nanostructures have been studied well. Bidsorkhi et al. 27 have synthesized PVDF-graphite nanoplatelets (GNP) composite using solution mixing method with varying filler concentration where the addition of GNP has been reported to induce electroactive β phase and reduce the porosity in the composite. Yu et al. 28 prepared PVDF-2 wt.% CNT composite using solution sonication and mechanical mixing methods and have shown that a mixture of α and β phase is induced in the sonicated PVDF-2 wt.% CNT composite, while the unsonicated PVDF-2 wt.% CNT composite did not exhibit electroactive β phase. Kar et al. 29 have prepared PVDF-exfoliated graphite submicron platelets (GP) composites by solution casting method with varying filler concentration. An increase in β phase fraction has been observed with the incorporation of GP. Further, it has been reported that PVDF-0.5 wt.% GP film exhibits maximum β phase fraction of nearly 96%. Chiu et al. 30 have investigated the electrical property and crystallization behavior of both PVDF-graphite nanoplatelets (GNP) binary and PVDF-PMMA-GNP ternary composites synthesized by solution blending technique. The nucleation efficiency of GNP in ternary composites has been reported to be higher than that of binary composite without PMMA. Further the storage modulus of both binary and ternary composite systems enhanced with the incorporation of GNP. The authors did not report any electroactive phase formation with the incorporation of GNP and PMMA. Sachin et al. 31 have studied structure, electrical and thermal properties of PVDF-20 wt.% PMMA-expanded graphite blend nanocomposites. The generation of electroactive gamma phase in the blend and blend nanocomposites has been studied by the authors. Further the thermal stability of the blend nanocomposites has also been shown to increase. After going through the literature, though there are reports on crystallization aspects of PVDF-PMMA blends, limited investigations have been carried out related to PVDF-PMMA blend nanocomposites which are electrically conducting. Not only electrical properties, wetting behavior, impedance analysis of PVDF-PMMA-expanded graphite blend nanocomposites are not addressed much. Most of the studies are pertained to formation of conducting networks between the conducting fillers even in ternary systems. Seldom any investigation has been carried out related to the effect of molecular weight of PMMA in PVDF-PMMA-ExGr conducting blend nanocomposites as the dispersion of filler particles in the polymer matrix can be affected. There exists a knowledge gap in the literature regarding the effect of molecular weight of PMMA on the electrical, thermal, and wetting properties of PVDF/PMMA/ExGr blend nanocomposites which has been addressed in the present work. Hence the novelty of the present work can be justified. A particular blend composition, namely PVDF-40 wt.% PMMA-expanded graphite has been chosen to study the effect of molecular weight of PMMA. Since PMMA is amorphous, the effect of PMMA will be more at higher loading to clearly understand the effect of the same in the blend and blend nanocomposites. Hence 40 wt.% PMMA-PVDF blend has been chosen for the study.
Experimental
Materials
PVDF (Grade Solef 1006-Melt flow index-30-40 g/10 min at 230°C/2.16 kg) has been procured from Solvay Solexis, France. Expandable graphite (grade 3772) has been kindly provided by Asbury Carbons Inc., USA. PMMA-injection grade (IH830C-MFI-2.0 g/10 min, at 230°C/3.8 kg by ASTM D1238 method) and PMMA-injection grade (IH830C-MFI-2.3 g/10 min, at 230°C/3.8 kg by ASTM D1238 method) have been procured from L.G. MMA Corp. South Korea. N. N- Dimethylacetamide (DMAc) (AR grade) has been procured from S. D-fine chemicals, India.
Preparation of poly(vinylidene fluoride)- 40 wt.% poly(methyl methacrylate)-expanded graphite blend nanocomposites
To synthesize PVDF-40 wt.% PMMA blend, required quantities of PVDF and PMMA are dissolved individually using a mechanical stirrer in 8 ml DMAc at 60°C for 45 minutes. Both the solutions are mixed for 1 hour at 60°C after that casted at the same temperature on glass slides and petri dishes to obtain the PVDF-40 wt.% PMMA blend films. For the preparation of expanded graphite, 0.1-0.2 g of commercially available expandable graphite has been taken in an alumina crucible and placed in a microwave (model-LGMH2342 W) oven for 10 seconds which resulted in expanded graphite. Based on the filler loading, required quantity of prepared expanded graphite (ExGr) has been taken in 8 mL DMAc and probe sonicated (ENUP-500 model from Life-Care Equipments) for 30 minutes intermittently to obtain graphite nanosheets. The filler dispersion is mixed with the PVDF-40 wt.% PMMA blend solution by probe sonication for another 30 minutes. The resultant solution is cast at 60°C on glass slides to obtain PVDF-40 wt.% PMMA-x wt.% ExGr (x = 0, 1, 2) films. The thickness of the film obtained is 0.1 mm. To analyze the effect of molecular weight of PMMA, two sets of such blend nanocomposites films are prepared using two different PMMA grades: PMMA-2 g/10 min (PMMA grade-A) and PMMA-2.3 g/10 min (PMMA grade-B). The blend prepared using PMMA grade-A has been labeled as blend A and the blend prepared using PMMA grade-B has been labeled as blend B in this manuscript. In similar fashion blend nanocomposites are labeled as ‘blend nanocomposite A’ and ‘blend nanocomposite B’ when PMMA grades A and B respectively are used.
Characterization
Structural characterization
The X-ray diffraction (XRD) analysis of the prepared PVDF- 40 wt.% PMMA- ExGr blend nanocomposites A and B has been carried out using XPERT-PRO model from Panalytical instruments, UK to analyze the structural changes brought about by the incorporation of expanded graphite. The range of 2θ scanned is from 10° to 80°, where ‘θ’ is the glancing angle.
FTIR analysis
FTIR spectra of PVDF- 40 wt.% PMMA-x wt.% ExGr (x = 0,1,2) with two different grades of PMMA have been recorded in ATR mode using Alpha II model FTIR spectrometer from Bruker, USA, with a resolution better than 4 cm−1. Through FTIR analysis, the electroactive phase of PVDF in blend and blend nanocomposites have been confirmed. The scan range has been restricted from 500 cm−1 to 1900 cm−1.
Field emission scanning electron microscopy analysis
The surface morphologies of cross section of etched PVDF- 40 wt.% PMMA and PVDF-40 wt.% PMMA-ExGr solvent cast blend and blend nanocomposites have been investigated using FESEM (model Gemini 300 from Carl Zeiss, Germany) at an acceleration voltage of 10 kV. The blend and blend nanocomposite films are etched for about an hour in DMAc vapor one day before FESEM analysis.
DC electrical resistance and impedance measurement
The dc electrical resistances of solution blended PVDF-40 wt.% PMMA-x wt.% ExGr (x = 0,1,2) blend A and B, blend nanocomposite A and B films are measured by using a source meter (Model 2450 from Keithley, A Tektronics company, USA). A specially constructed brass holder has been used to keep the films intact and to make external connections to the source meter. The electrical resistances of three samples are measured and the average value has been used for calculating electrical conductivity. The thickness of the film is 0.1 mm. The error in conductivity of all the samples investigated in this work is below 5%. The room temperature impedance measurement has been carried out on solution blended PVDF-40 wt.% PMMA- 2 wt.% ExGr blend nanocomposite A and B films over the range of 1 KHz to 5 MHz using a LCR meter model: ZM2376 from NF corporation, Japan.
Thermogravimetric analysis
The thermal stability of the neat PVDF film, neat PMMA film, PVDF-PMMA blend and PVDF-PMMA-expanded graphite blend nanocomposites are analyzed using a thermogravimetric analyzer (Model: SDT Q600 from TA Instruments, USA). The samples are heated from room temperature to 700°C at 10°C/min heating rate in nitrogen atmosphere (flow rate is 50 ml/min).
Differential scanning calorimetry analysis
Differential scanning calorimetry (DSC) analysis on PVDF-PMMA blend and PVDF-PMMA-expanded graphite blend nanocomposites with two different grades of PMMA has been carried out under nitrogen atmosphere with 10°C/min heating and cooling rates using the DSC model Q20 from TA Instruments, USA. The flow rate of nitrogen is kept at 50 mL/min. Two heating and cooling cycles are performed and the data corresponding to the second cycle is taken for the analysis. The first heating and cooling cycle has been performed to destroy the previous history of the sample.
Contact angle analysis
Water contact angles (WCA) of solution blended PVDF-40 wt.% PMMA-x wt.% ExGr (x = 0,1,2) films have been measured using Kruss drop shape analyzer (Model: DSA25, Germany). A syringe is used for dosing. The water drop dosing volume is maintained at 2 µl/drop. Multiple trials (five) have been carried out on different parts of the same sample, and the average contact angle is reported.
Results and discussion
DC conductivity analysis of solution blended poly(vinylidene fluoride)- 40 wt.% poly(methyl methacrylate)- expanded graphite blend nanocomposites.
Figure 1 shows the comparison of electrical conductivities of solution blended PVDF-40 wt.% PMMA-x wt.% ExGr (x = 0, 1, 2) in which two grades of PMMA have been used. Without incorporation of sonicated expanded graphite, both the blends (denoted as A and B) have same level of electrical conductivity signifying the insulating nature of the blends. When 1 wt.% sonicated ExGr particles are incorporated in PVDF-40 wt.% PMMA blend, the electrical conductivity increases by more than 2.5 orders depending upon the blend nanocomposites due to the formation of conducting channels for the charge transport as reported elsewhere.
32
It can be clearly seen that blend nanocomposites synthesized by using low molecular weight PMMA (grade B) exhibit at least one order lesser conductivity in comparison to high molecular weight PMMA (grade A) employed blend nanocomposites. The same trend is also realized when 2 wt.% ExGr is incorporated in PVDF-40 wt.% PMMA blend. The result clearly suggests that the graphite nanosheets in the blend nanocomposite in which high molecular weight PMMA has been employed form a greater number of conducting networks. During solvent evaporation, since PVDF is semi-crystalline, crystallizes faster and hence the PMMA chains adhere onto the surface of the graphite nanosheets. The possible interaction between PMMA and expanded graphite has been reported well in the literature.
33
Essentially PMMA coated graphite nanosheets form conductive networks and hence the electrical conductivity of blend nanocomposites increases. It is like that of localization of filler particles in one of the polymers in the immiscible blends with co-continuous morphology as reported elsewhere for polypropylene-natural rubber-multiwalled carbon nanotube blend nanocomposites.
34
It should be mentioned that Feng et al.
22
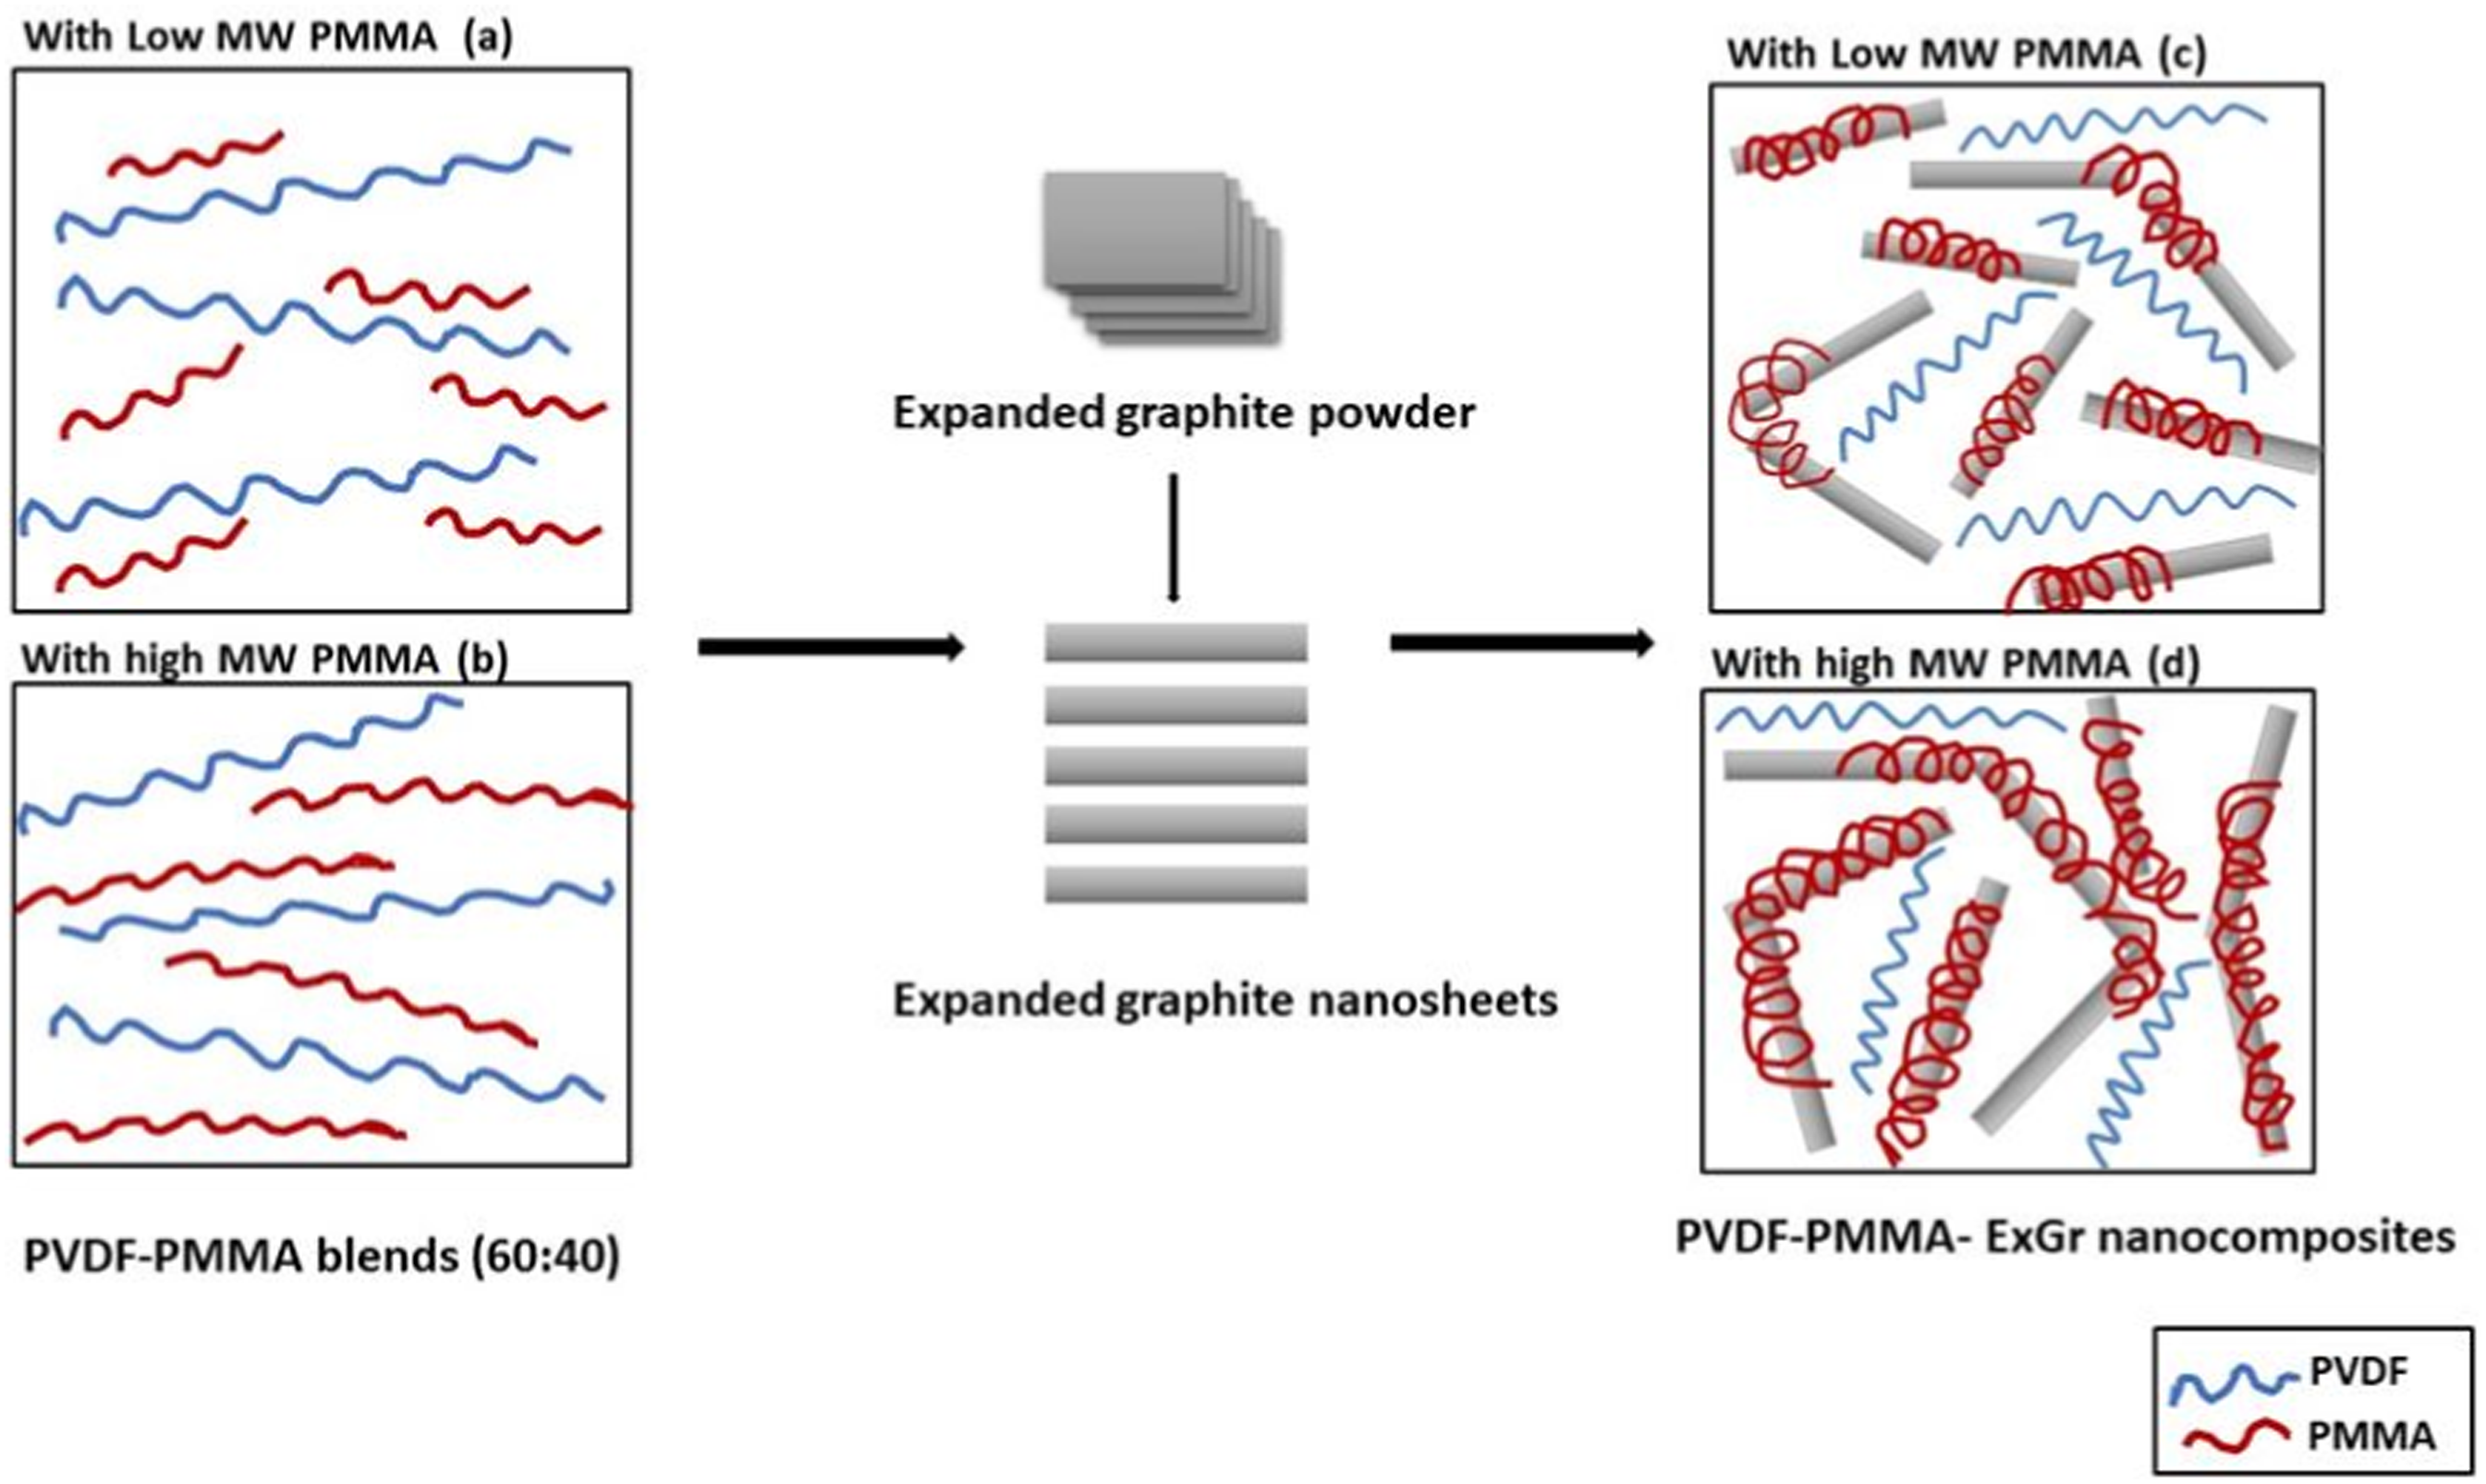
have proved that the interfacial affinity of CNT is higher with PMMA than PVDF. In a similar fashion, PMMA can have better interfacial interaction with ExGr particles. Since the blend nanocomposites are prepared by solvent casting method, the crystallization of PVDF will be faster as it is a semi-crystalline polymer and hence the PMMA chains would be pushed towards graphite nanosheets and eventually coated onto them. The electrical conductivity of the blend nanocomposites increases with higher loading of ExGr due to an increase in the number of contacts between the PMMA coated filler particles. To understand the effect of molecular weight of PMMA in the chosen blend nanocomposites, a model has been proposed as shown in Figure 2 below. DC conductivity plot of solution blended PVDF-40 wt.% PMMA-x wt.% ExGr (x = 0,1,2) films. Model depicting solution blended (a) PVDF-PMMA blend B (low MW) (b) PVDF-PMMA blend A (high MW) (c) blend nanocomposite B and (d) blend nanocomposite A.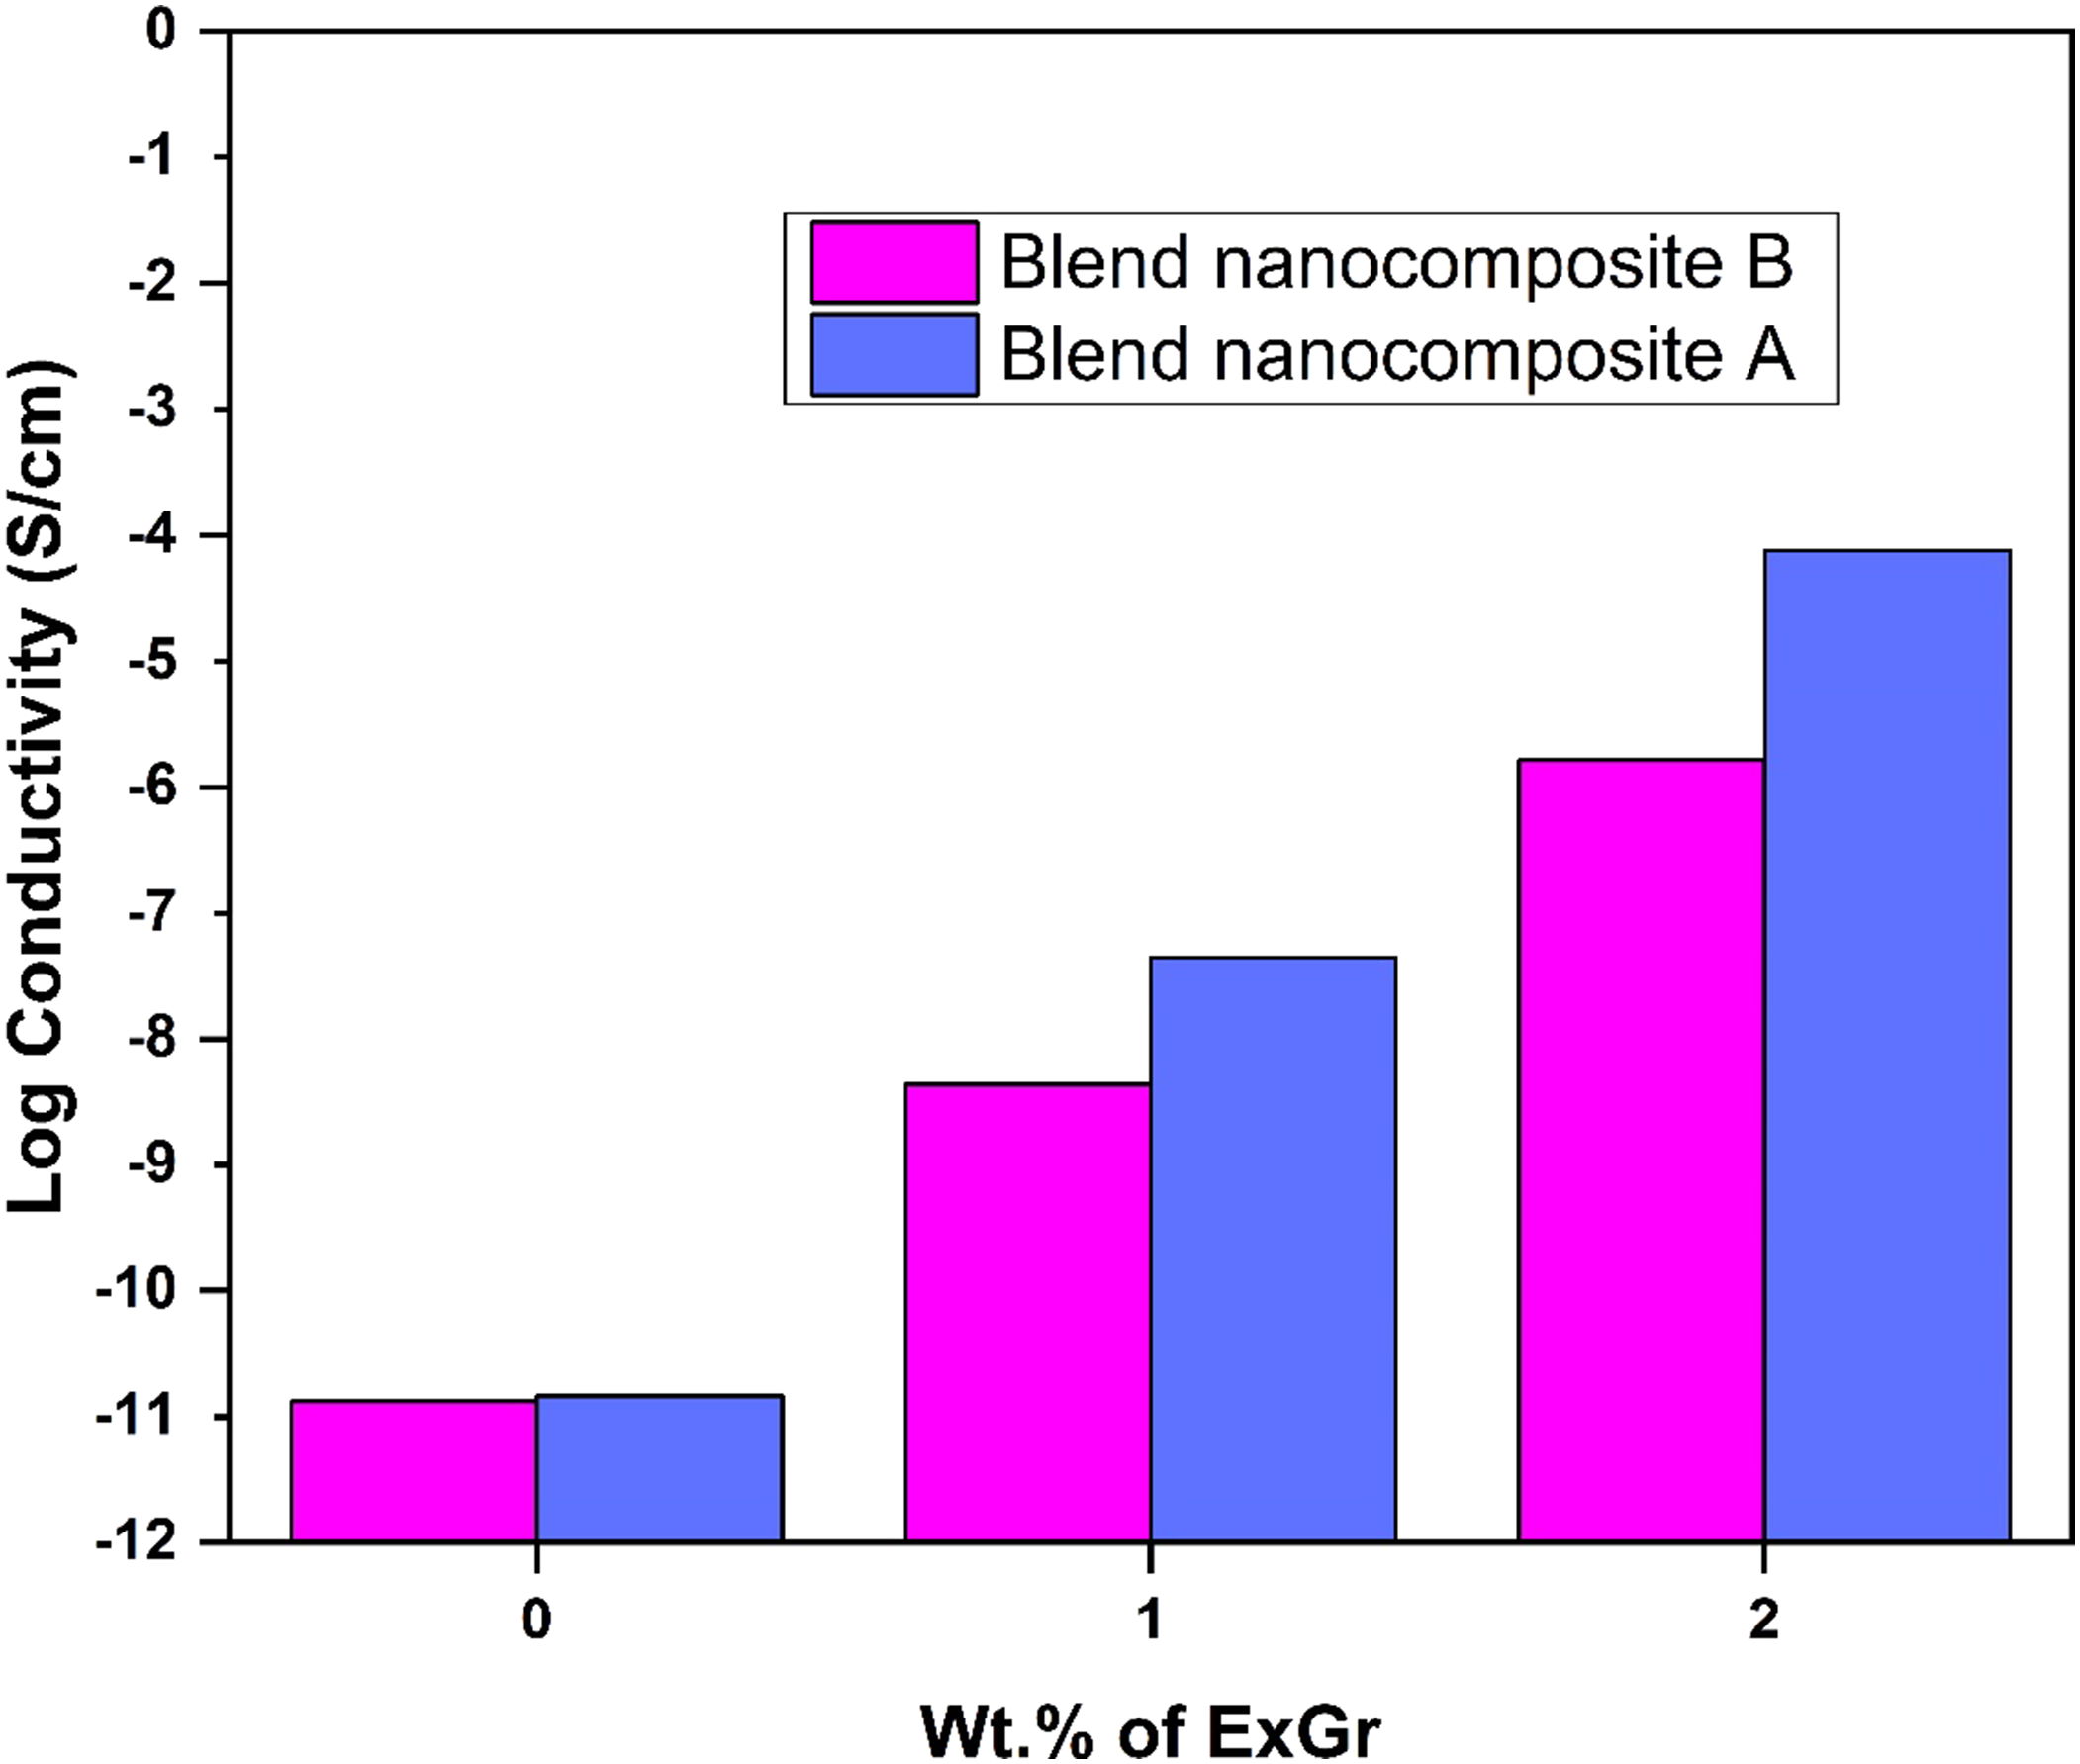
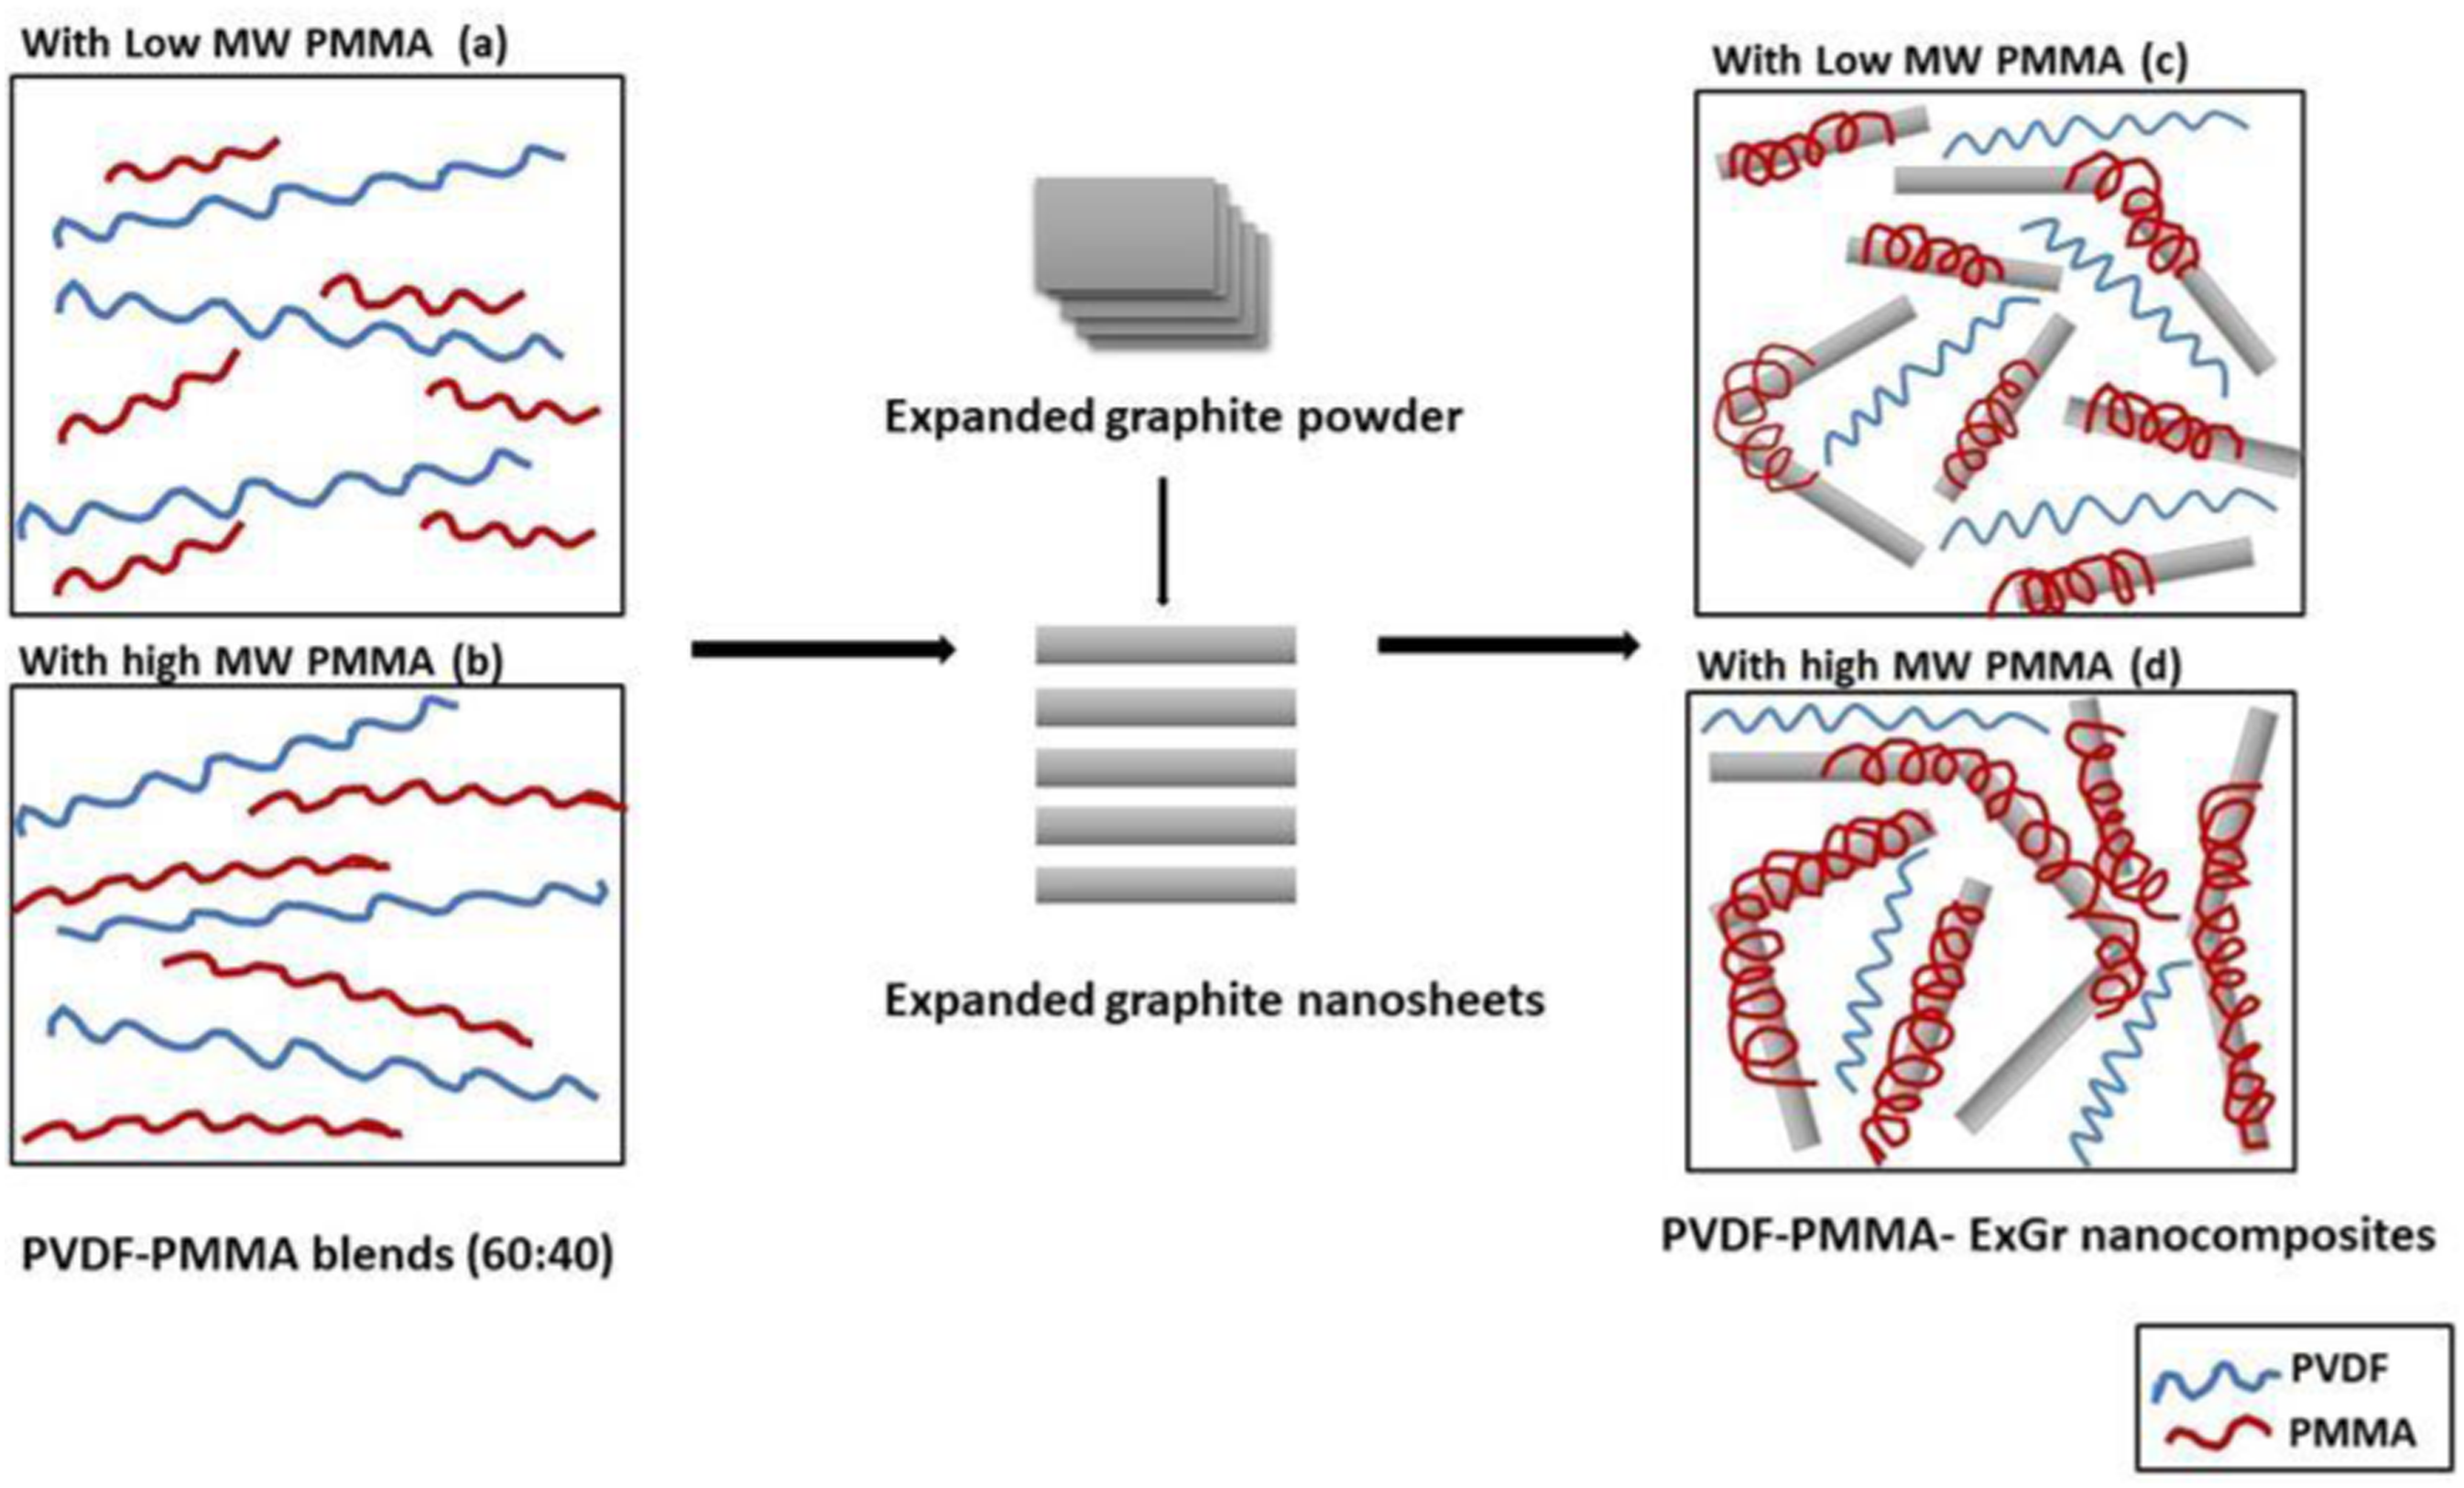
PVDF forms miscible blend with PMMA. Figure 2(a) and (b) depict solution blended PVDF-low molecular weight PMMA (blend B) and PVDF-high molecular weight PMMA blends (blend A) respectively. High molecular weight PMMA has more chain length compared to that of low molecular weight PMMA.
Figure 2(d) depicts wrapping of PMMA chains on to graphite nanosheets after solvent evaporation as PVDF will be crystallizing faster and dissolved PMMA chains would be pushed towards graphite nanosheets. Since the chain length of high molecular weight PMMA is higher, the polymer coated graphite nanosheets form network between them which results in higher conductivity at lower loading of filler as depicted in Figure 2(d). On the contrary when low molecular weight PMMA is employed, though PMMA can coil around graphite nanosheets, the number of network formation between the fillers could be lesser as there may not be sufficient chain length of the polymer to connect many graphite nanosheets and hence the conductivity is lower at the same loading of ExGr particles. Further the composite filler, because of incomplete coiling of low molecular weight PMMA can be present between the PVDF chains disturbing both the crystallinity as well as the network formation between them as shown in Figure 2(c). Hence the number of contacts established between the filler particles in low molecular weight PMMA employed blend nanocomposites will be lesser than that of the high molecular weight PMMA employed blend nanocomposites resulting in lower electrical conductivity of blend nanocomposite B. Thus, the conductivity variation in blend nanocomposites can be understood. It should be mentioned that the charge transport through the amorphous PMMA layer will be better than that through PVDF. The thickness of the coated PMMA on graphite nanosheets also decides the level of electrical conductivity. The result clearly proves the fact that for blend nanocomposites, to realize better network formation between fillers, high molecular weight PMMA can be used. In DSC analysis section, it will be explicitly proved that the crystallinity in PVDF-PMMA (high molecular weight)-ExGr is always higher than that of low molecular weight PMMA employed blend nanocomposites. The formation of graphite nanosheets and their dispersion in the blend matrix will be understood through the FESEM analysis as described below.
Surface morphology analysis of poly(vinylidene fluoride)-poly(methyl methacrylate)-expanded graphite blend nanocomposites
To prove the formation of graphite nanosheets due to probe sonication of ExGr particles in DMAc solvent and to understand the surface morphology changes of the blend nanocomposites in which two different molecular weights of PMMA have been used as explained previously, FESEM images are taken and shown in Figure 3(a) and (b) respectively. The surface roughness is more uniform in the case of blend nanocomposites in which high molecular weight PMMA is used when compared to that of low molecular weight PMMA employed blend nanocomposite. Compared to Figure 3(a) and (b) clearly proves the fact that more open structures are produced when low molecular weight PMMA has been used for preparing the blend. It can also be seen in Figure 3(a), the fiber like structures on top of flat sheets signify PMMA coated graphite nanosheets. On the other hand, the cross-section images of low molecular weight PMMA employed blend nanocomposites prove the fact that PMMA chains do not completely coat and more pores are observed as depicted in Figure 3(b). The PMMA coated graphite nanosheets occupy inter PVDF chains and increase the separation between the chains. Therefore, more open structures can be seen in Figure 3(b). The sheet like projection also suggests that the composite filler could be disturbing the PVDF chains coming closer affecting the crystallinity which will be addressed in DSC section. Hence because of this reason the distribution of composite filler in the PVDF matrix in blend nanocomposite B is not as uniform as what can be observed in high molecular weight PMMA employed blend nanocomposite A. In fact, low molecular weight PMMA cannot completely wrap graphite nanosheets to form more networks due to lesser chain length when compared to high molecular weight PMMA. Therefore, during solvent evaporation more pore like structure results. The change in morphology due to the molecular weight of PMMA also affects the water contact angle which will be discussed in the subsequent sections. FESEM analysis of cross sections of etched (a) PVDF-40 wt.% PMMA (blend A) (b) PVDF-40 wt.% PMMA (blend B) films.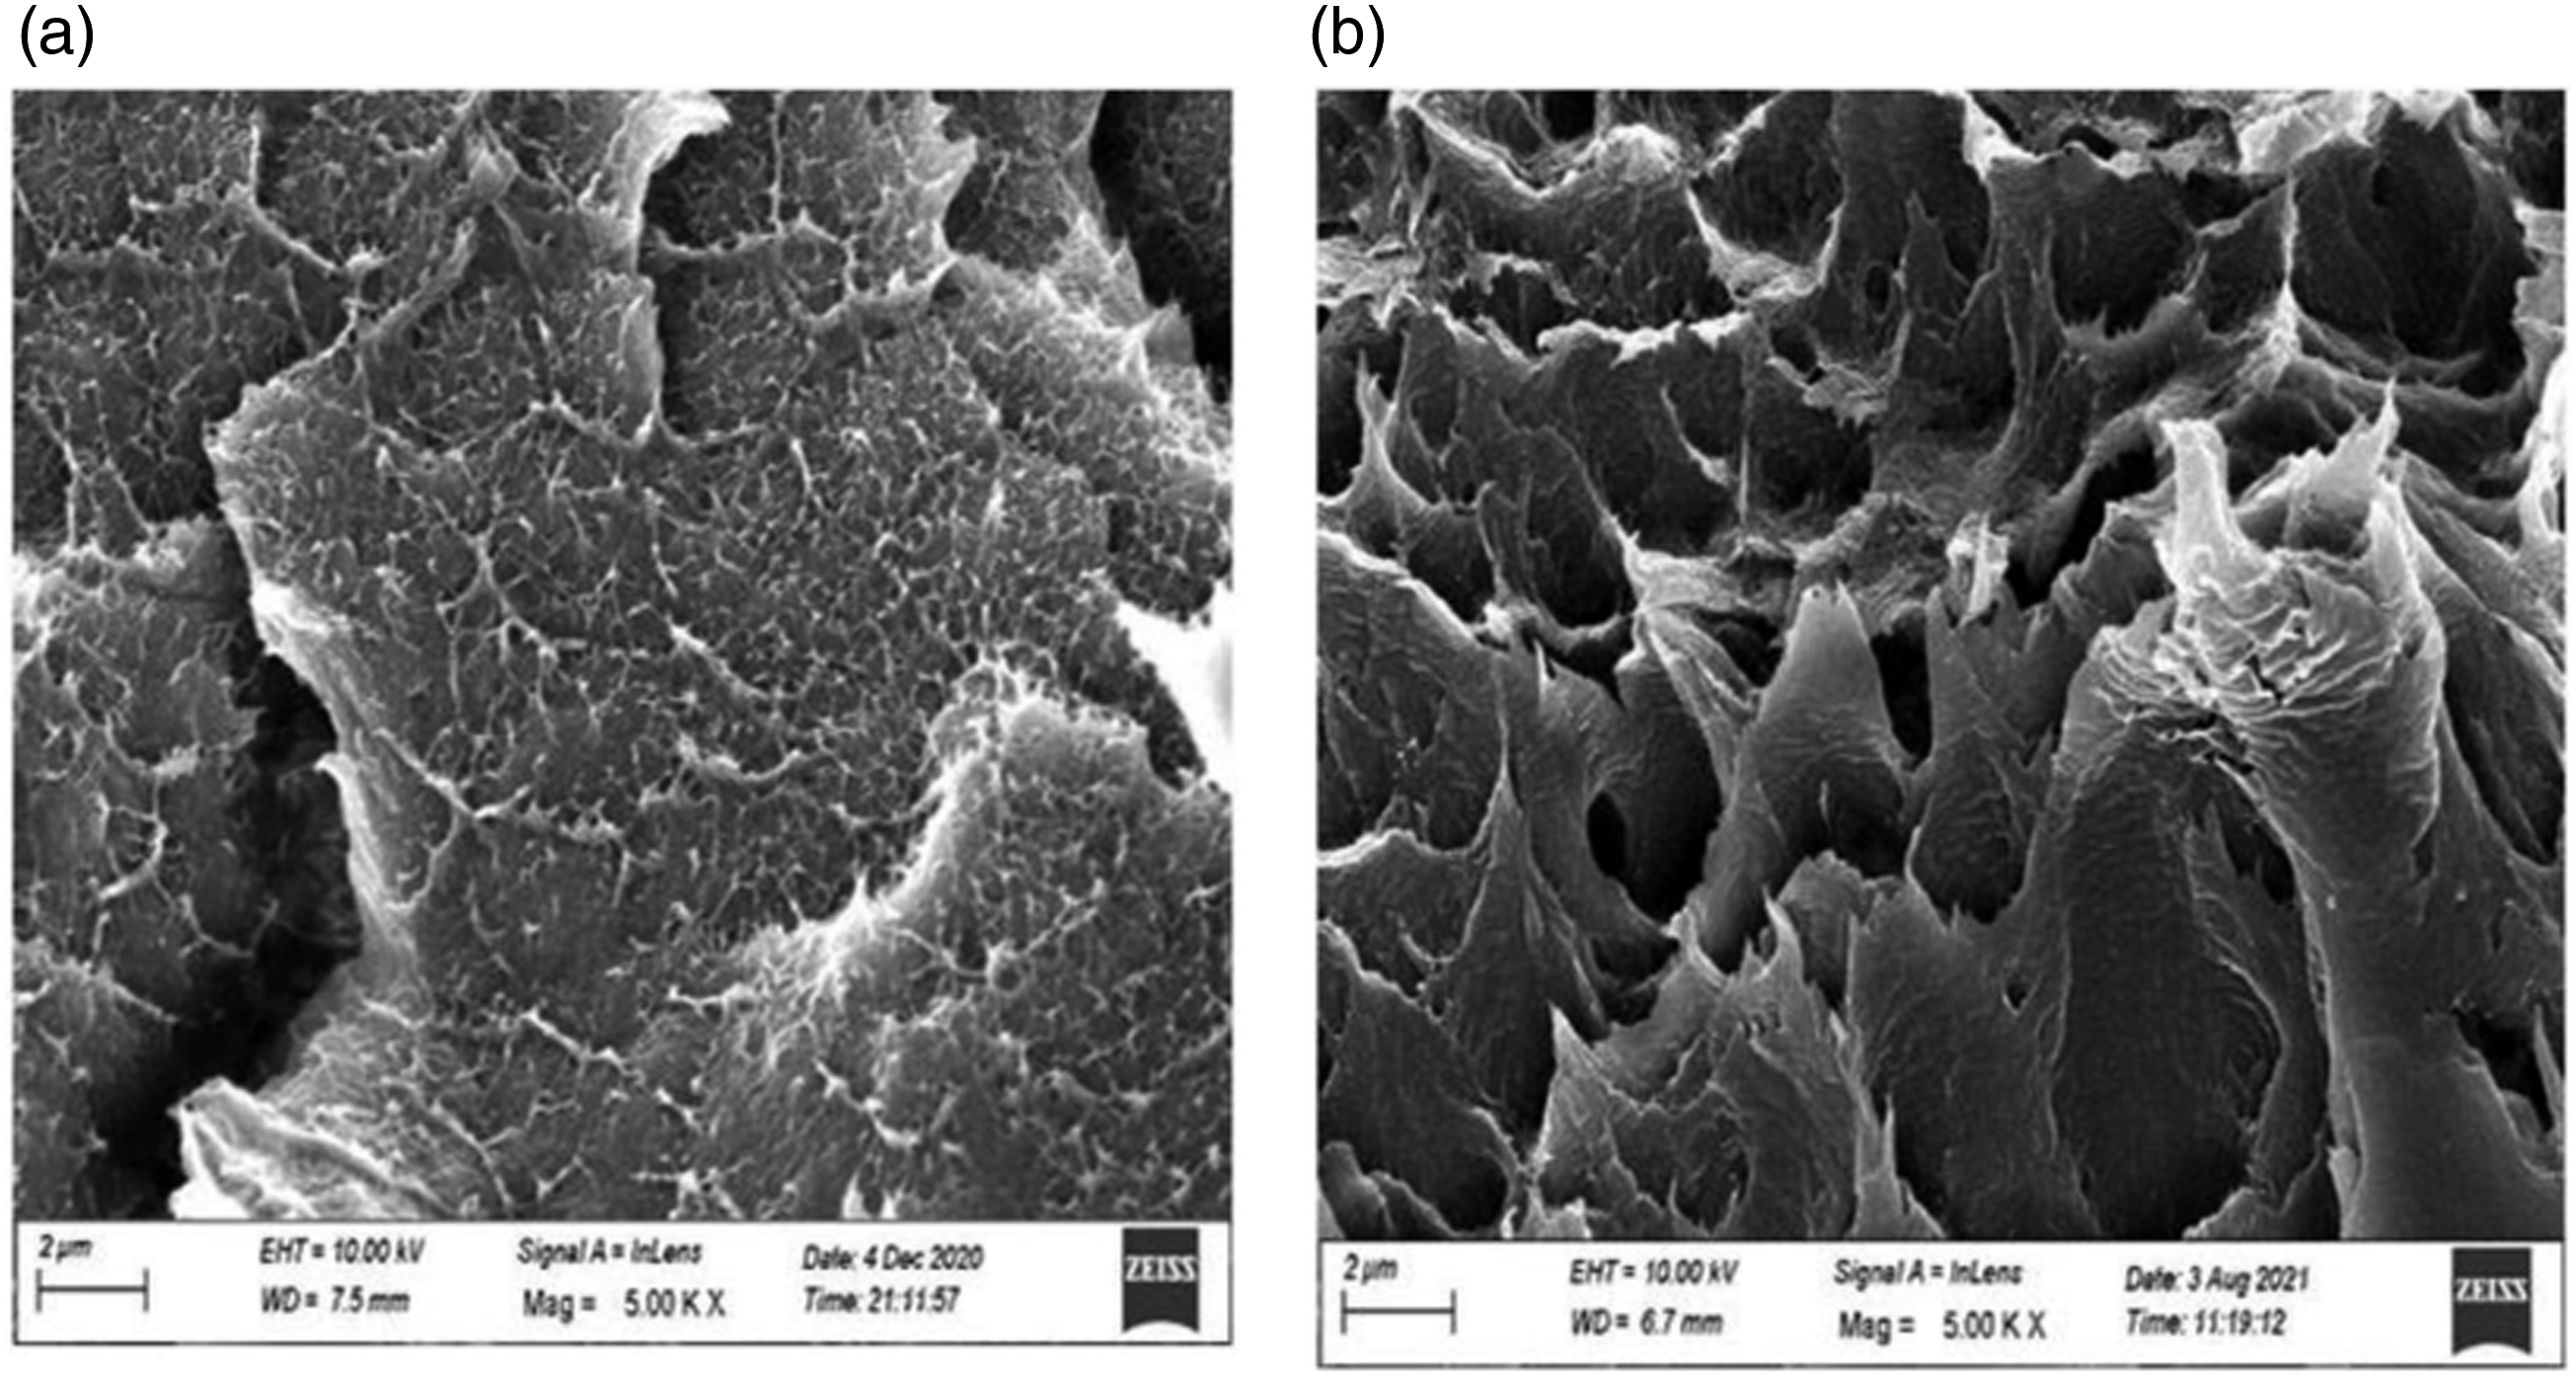
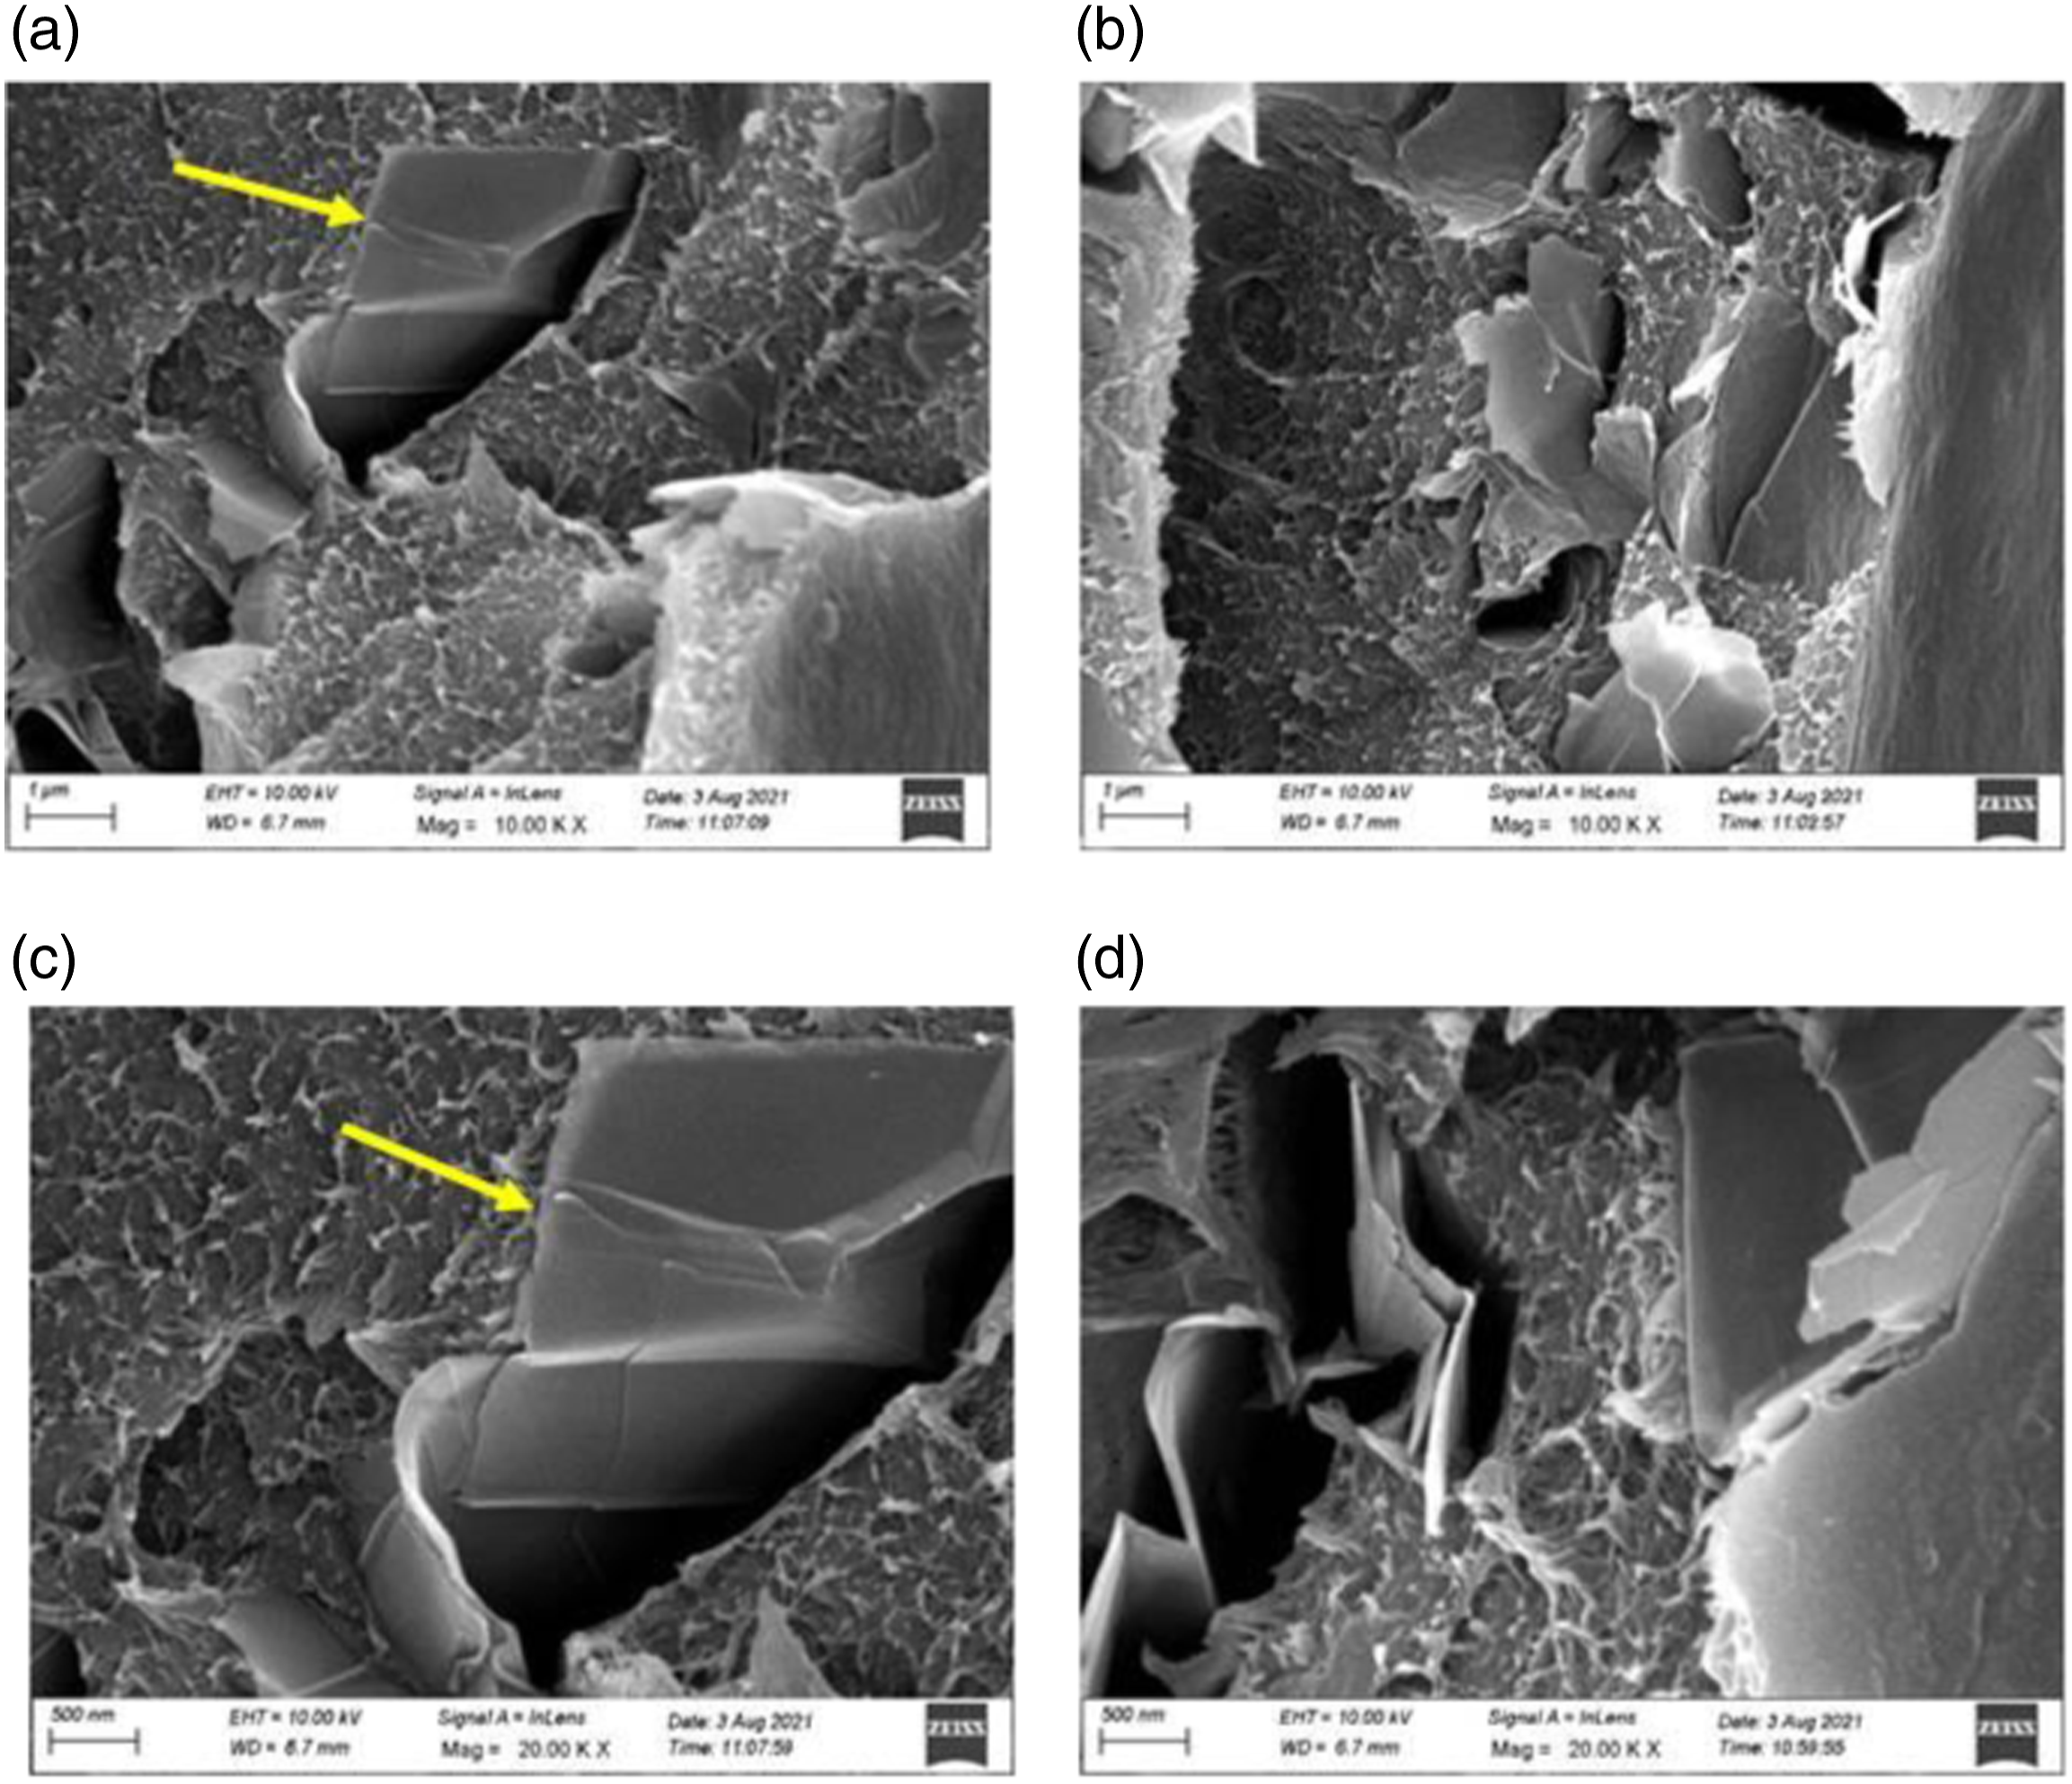
Figure 4 (a) and (e) clearly proves the existence of graphite nanosheets in PVDF- 40 wt.% PMMA blend in which lower MFI (high molecular weight) PMMA has been used under different magnifications. Similarly, when higher MFI rather low molecular weight PMMA has been used in the preparation of blend nanocomposites, the presence of graphite nanosheets can be clearly seen in Figure 5(a) and (d). When high molecular weight PMMA is used, the graphite nanosheets are better distributed in the matrix compared to low molecular weight PMMA employed blend nanocomposites. In fact, the contacts between PMMA coated graphite nanosheets can be seen in Figure 4(a). In Figure 5(a) and (d), clustered graphite nanosheets are present in the crevices found in the polymer matrix. The FESEM image corroborates the model proposed in Figure 2(d). Hardly graphite nanosheets could be seen in the nearby areas of the selected region. However, this is not the case when high molecular weight PMMA is employed in the blend nanocomposite as from Figure 4(a) and (e) relatively better distribution of graphite nanosheets (coated with PMMA) could be observed in the polymer matrix. Figure 4(e) clearly proves the network formation between PMMA coated graphite nanosheets. This result supports the electrical conductivity data as high molecular weight PMMA employed blend nanocomposites exhibit higher electrical conductivity in comparison to low molecular weight PMMA employed blend nanocomposites. (a)–(e) FESEM pictures of cross sections of solution blended PVDF- 40 wt.% PMMA-1 wt.% ExGr (Blend nanocomposite-A) films at different magnifications. (a)–(d) FESEM pictures of cross-sections of solution blended PVDF- 40 wt.% PMMA-1 wt.% ExGr (Blend nanocomposite-B) films at different magnifications.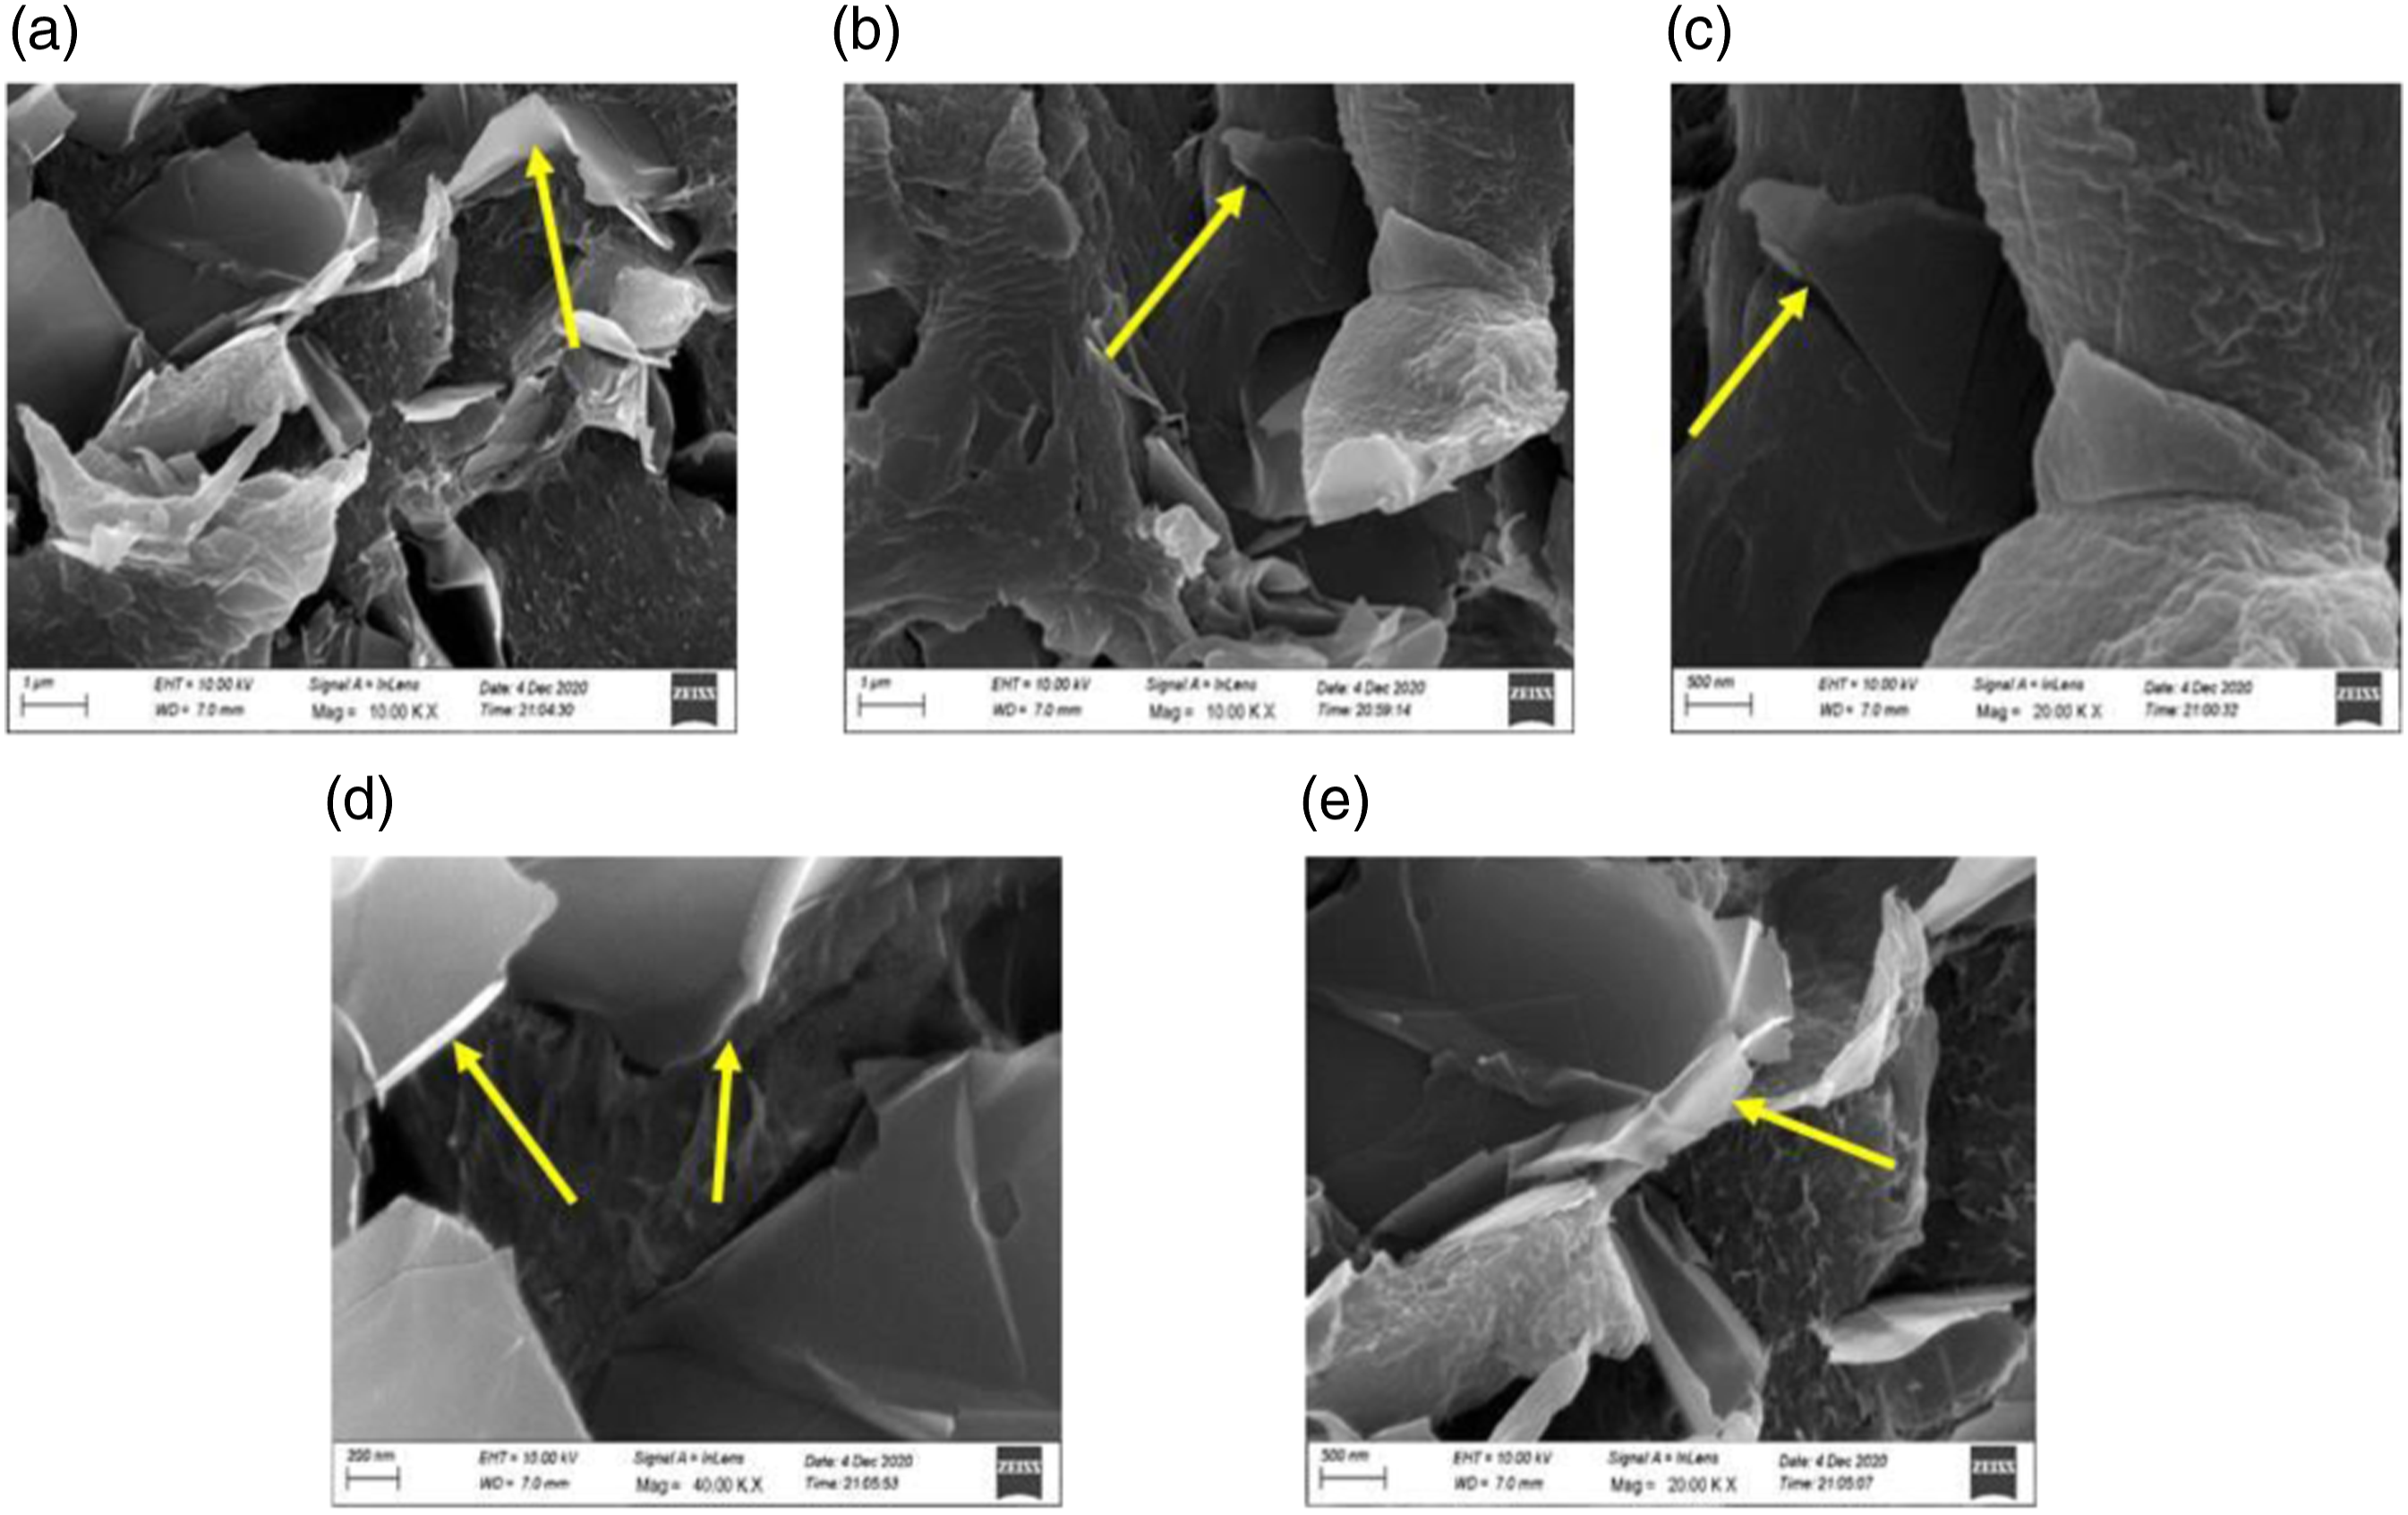
Optical microscope analysis of poly(vinylidene fluoride)-40 wt.% poly(methyl methacrylate)-expanded graphite nanocomposites
In order to further prove the fact that the dispersion of PMMA coated graphite nanosheets is better in high molecular weight PMMA employed blend nanocomposites A, optical microscope images at two different magnifications i.e., 10X and 40X are taken. The images are captured for a representative sample namely PVDF- 40 wt.% PMMA-1 wt.% ExGr in which both high and low molecular weight PMMA have been employed and depicted in Figure 6(a) and (b) respectively below. In Figure 6(a) and (b), it can be clearly seen blacker region and connectivity between them compared to what can be found in Figure 6(c) and (d) (A-high molecular weight PMMA used blend nanocomposite, B-Low molecular weight PMMA used blend nanocomposite). Thus, the dispersion of PMMA coated graphite nanosheets is better in sample A compared to that of what can be seen in sample B. The optical microscope pictures clearly support FESEM results. Optical microscope images of PVDF-40 wt.% PMMA-1 wt.% ExGr with high molecular weight PMMA under 10X (a) and 40X (b) magnifications and Low molecular weight PMMA under 10X (c) and 40X (d) magnifications.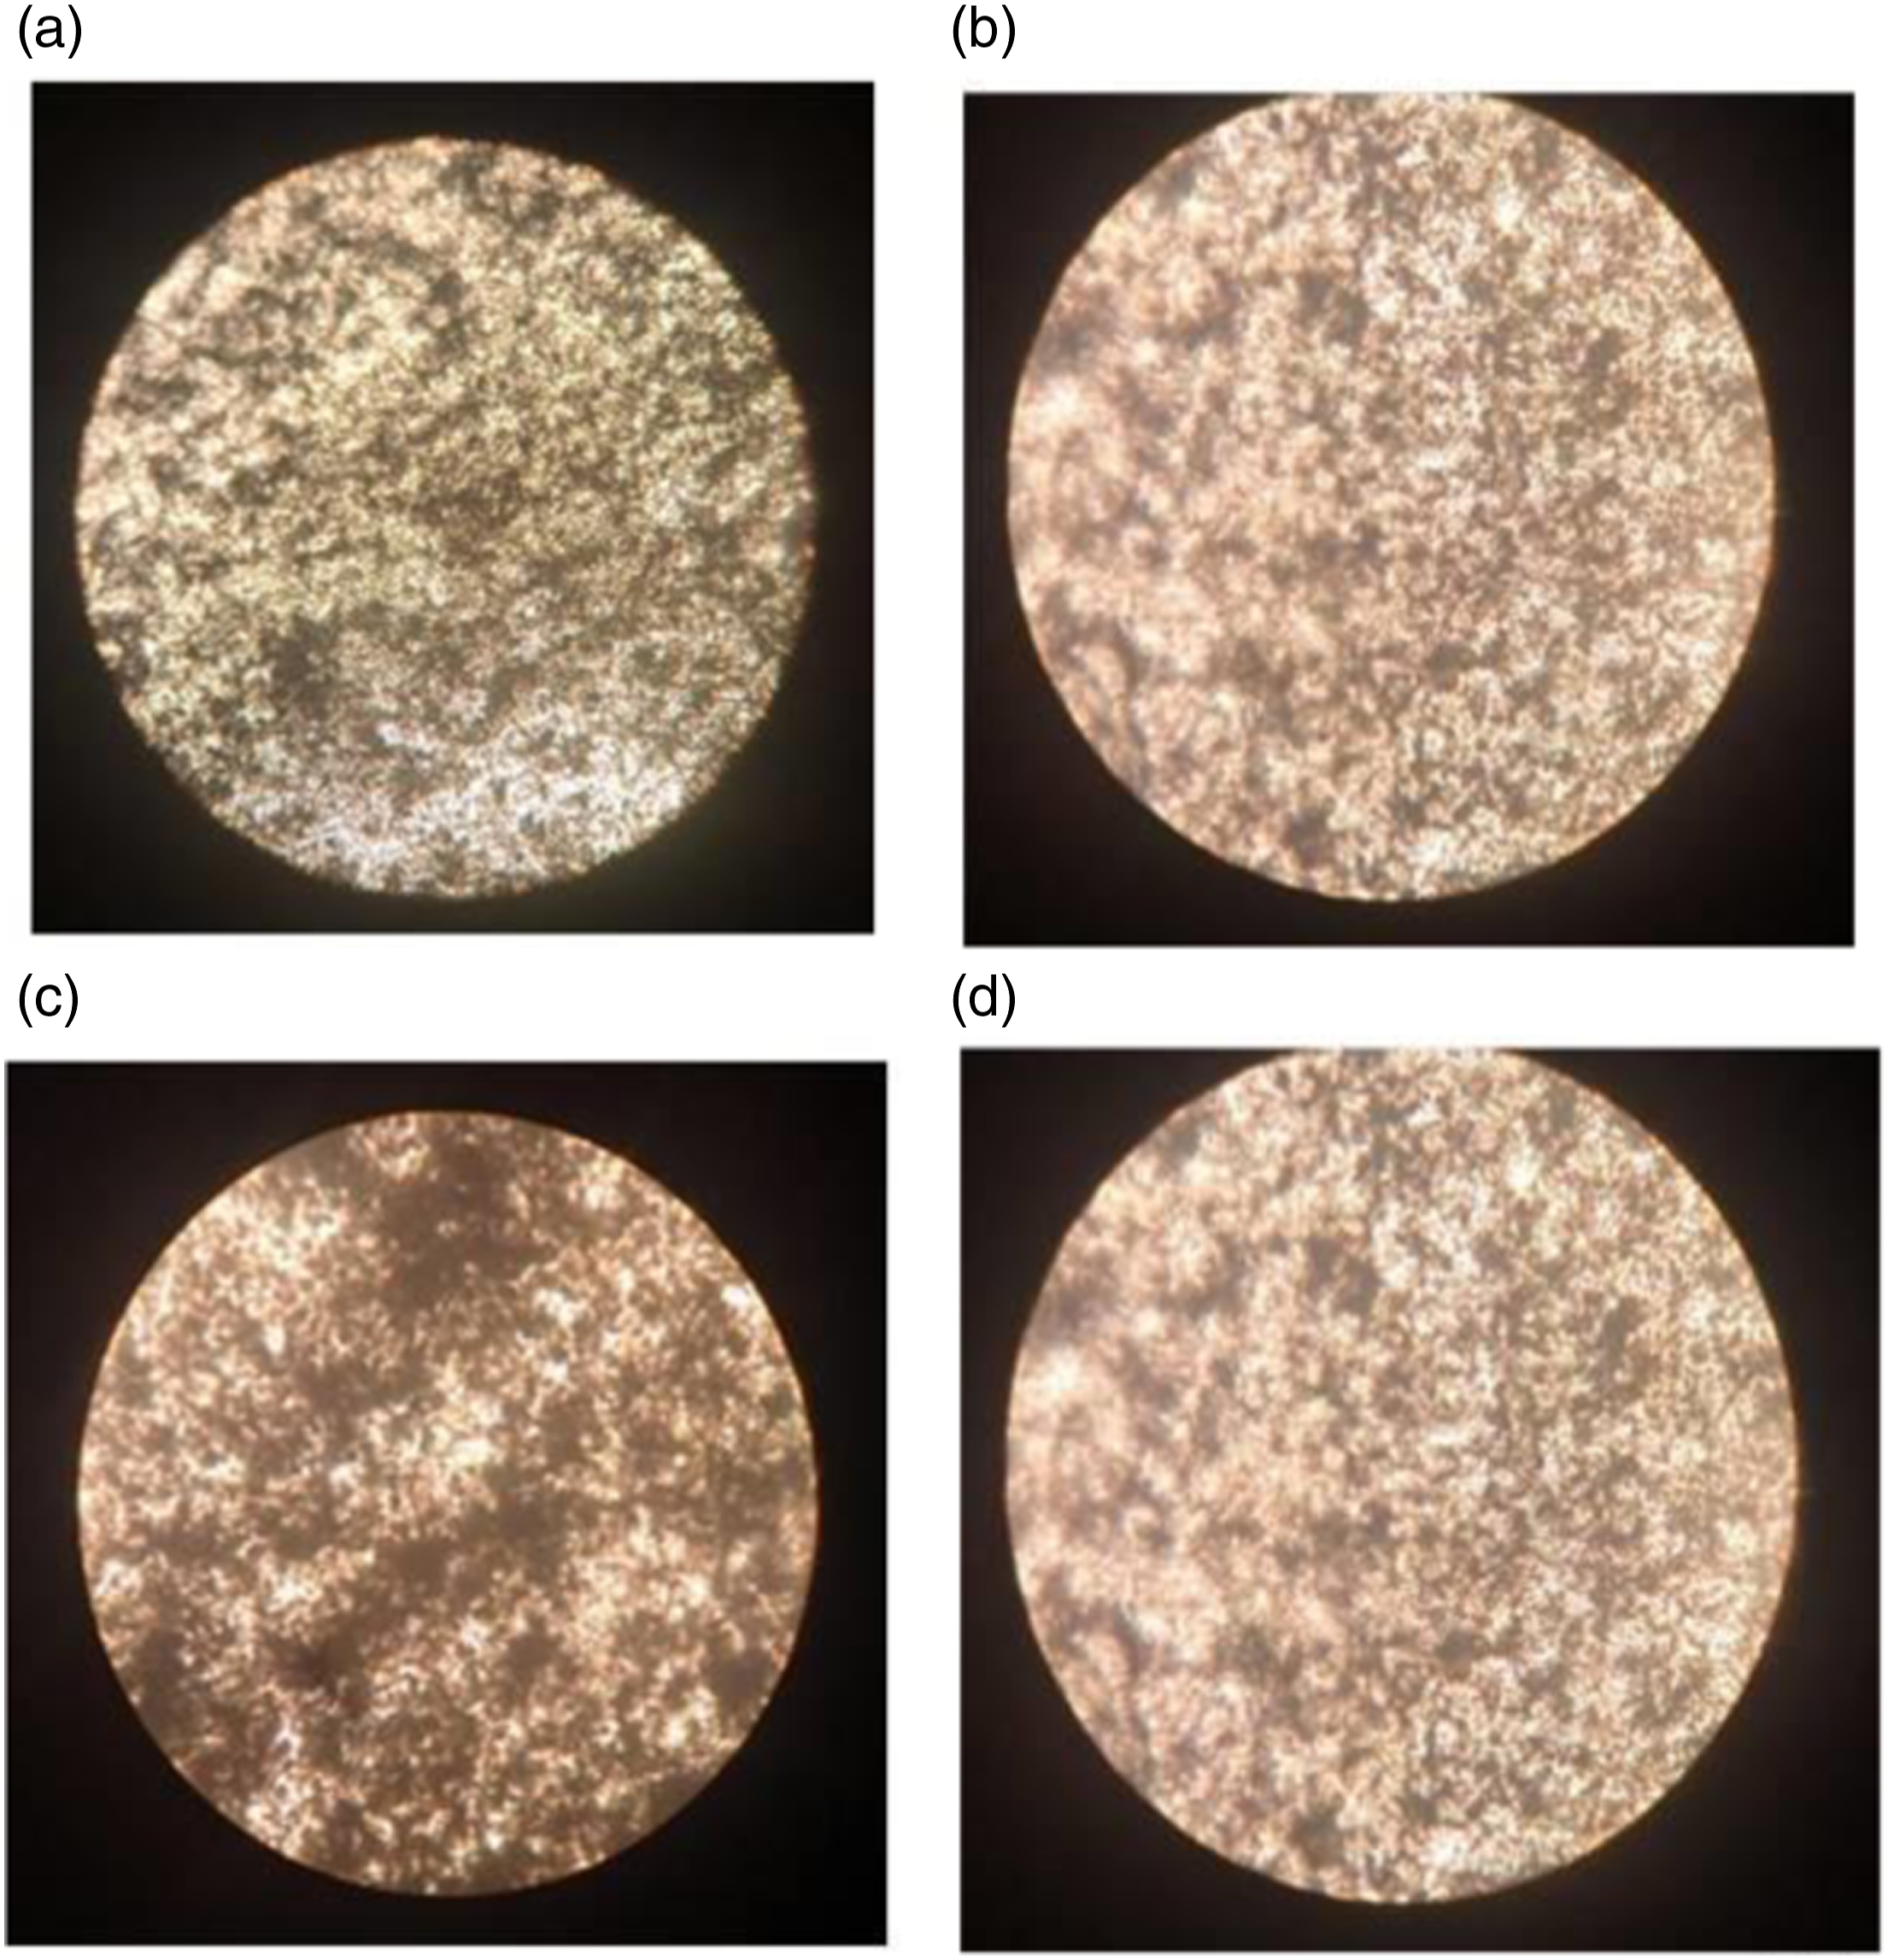
X-ray diffraction analysis of solution blended poly(vinylidene fluoride)- 40 wt.% poly(methyl methacrylate)- x wt.% expanded graphite blend (x = 0 ,1 ,2) blend and blend nanocomposite films
Figure 7(a) and (b) depict the X-ray diffractograms of solution blended PVDF-40 wt.% PMMA-x wt.% ExGr (x = 0,1,2) in which high (7a) and low molecular weights (7b) PMMA have been used to make blend nanocomposites. The XRD patterns of PVDF-40 wt.% PMMA and PVDF- 40 wt.% PMMA- ExGr blend nanocomposites exhibit characteristic peaks corresponding to electroactive gamma phase of PVDF at 20.3° [(110)/(101) reflection] and 39° corresponding to (211) planes.
35
The reflection at 26.6° corresponds to graphite (002) reflection.
36
The result suggests that graphite nanosheets have been very well incorporated into the blend matrix. In Figure 7(c), the XRD patterns of both high and low molecular weight PMMA employed PVDF-40 wt.% PMMA- 1 wt.% ExGr are compared. It should be noted that the intensity of graphite (002) reflection is higher in blend nanocomposite with low molecular weight PMMA in comparison to the blend nanocomposite with high molecular weight PMMA. Also, the FWHM corresponding to (002) reflection in low molecular weight employed blend nanocomposite is lesser than that of high molecular weight employed samples. The higher peak intensity and lower FWHM of (002) reflection of graphite clearly proves that fact that there can be agglomeration of graphite nanosheets in low molecular weight PMMA employed blend nanocomposite when compared to that of high molecular weight PMMA employed blend nanocomposites. Thus, the dispersion of graphite nanosheets in blend A with high molecular weight PMMA is better than that of low molecular weight PMMA employed blend nanocomposites. This result also corroborates FESEM and optical microscope analysis along with the proposed model. From XRD analysis it can be concluded that the electroactive gamma phase exists along with traces of alpha phase of PVDF as around 36° alpha phase reflection corresponding to (200) plane can be seen.
37
The formation of electroactive gamma phase shall not only be confirmed through XRD analysis as there are reports of similar 2θ values associated with the electroactive beta phase of PVDF.
38
Both FTIR and DSC analyses should support the XRD results. Our previous study related to solution blended PVDF-PMMA blend resulting in an electroactive gamma phase has been convincingly proved through FTIR and DSC analyses.
31
From XRD it can be concluded that both electroactive gamma and non-polar alpha phases of PVDF coexist in all the samples. From Figure 7(e), the intensity of (002) of graphite has been enhanced in blend nanocomposite A in comparison to blend nanocomposite B. It should be mentioned that at 26.6°, monoclinic alpha phase of PVDF also exhibits medium intensity corresponding to (021) planes. Since with increasing ExGr loading, the induction of alpha phase of PVDF shall be more in blend nanocomposite A than blend nanocomposite B. Hence at 26.6°, the peak intensity of graphite appears to have been increased in blend nanocomposite A. This aspect will be discussed in FTIR analysis section where quantification of electroactive phases has been done. X-ray diffractogram patterns of solution blended PVDF-40 wt.% PMMA-x wt.% ExGr (x = 0, 1, 2) with (a) high molecular weight PMMA (b) low molecular weight PMMA (c) comparison of PVDF-40 wt.% PMMA-1 wt.% ExGr with different grades of PMMA (d) comparison of XRDs of blend A and blend B (e) XRD patterns of blend nanocomposite A and B with 2 wt.% ExGr loading.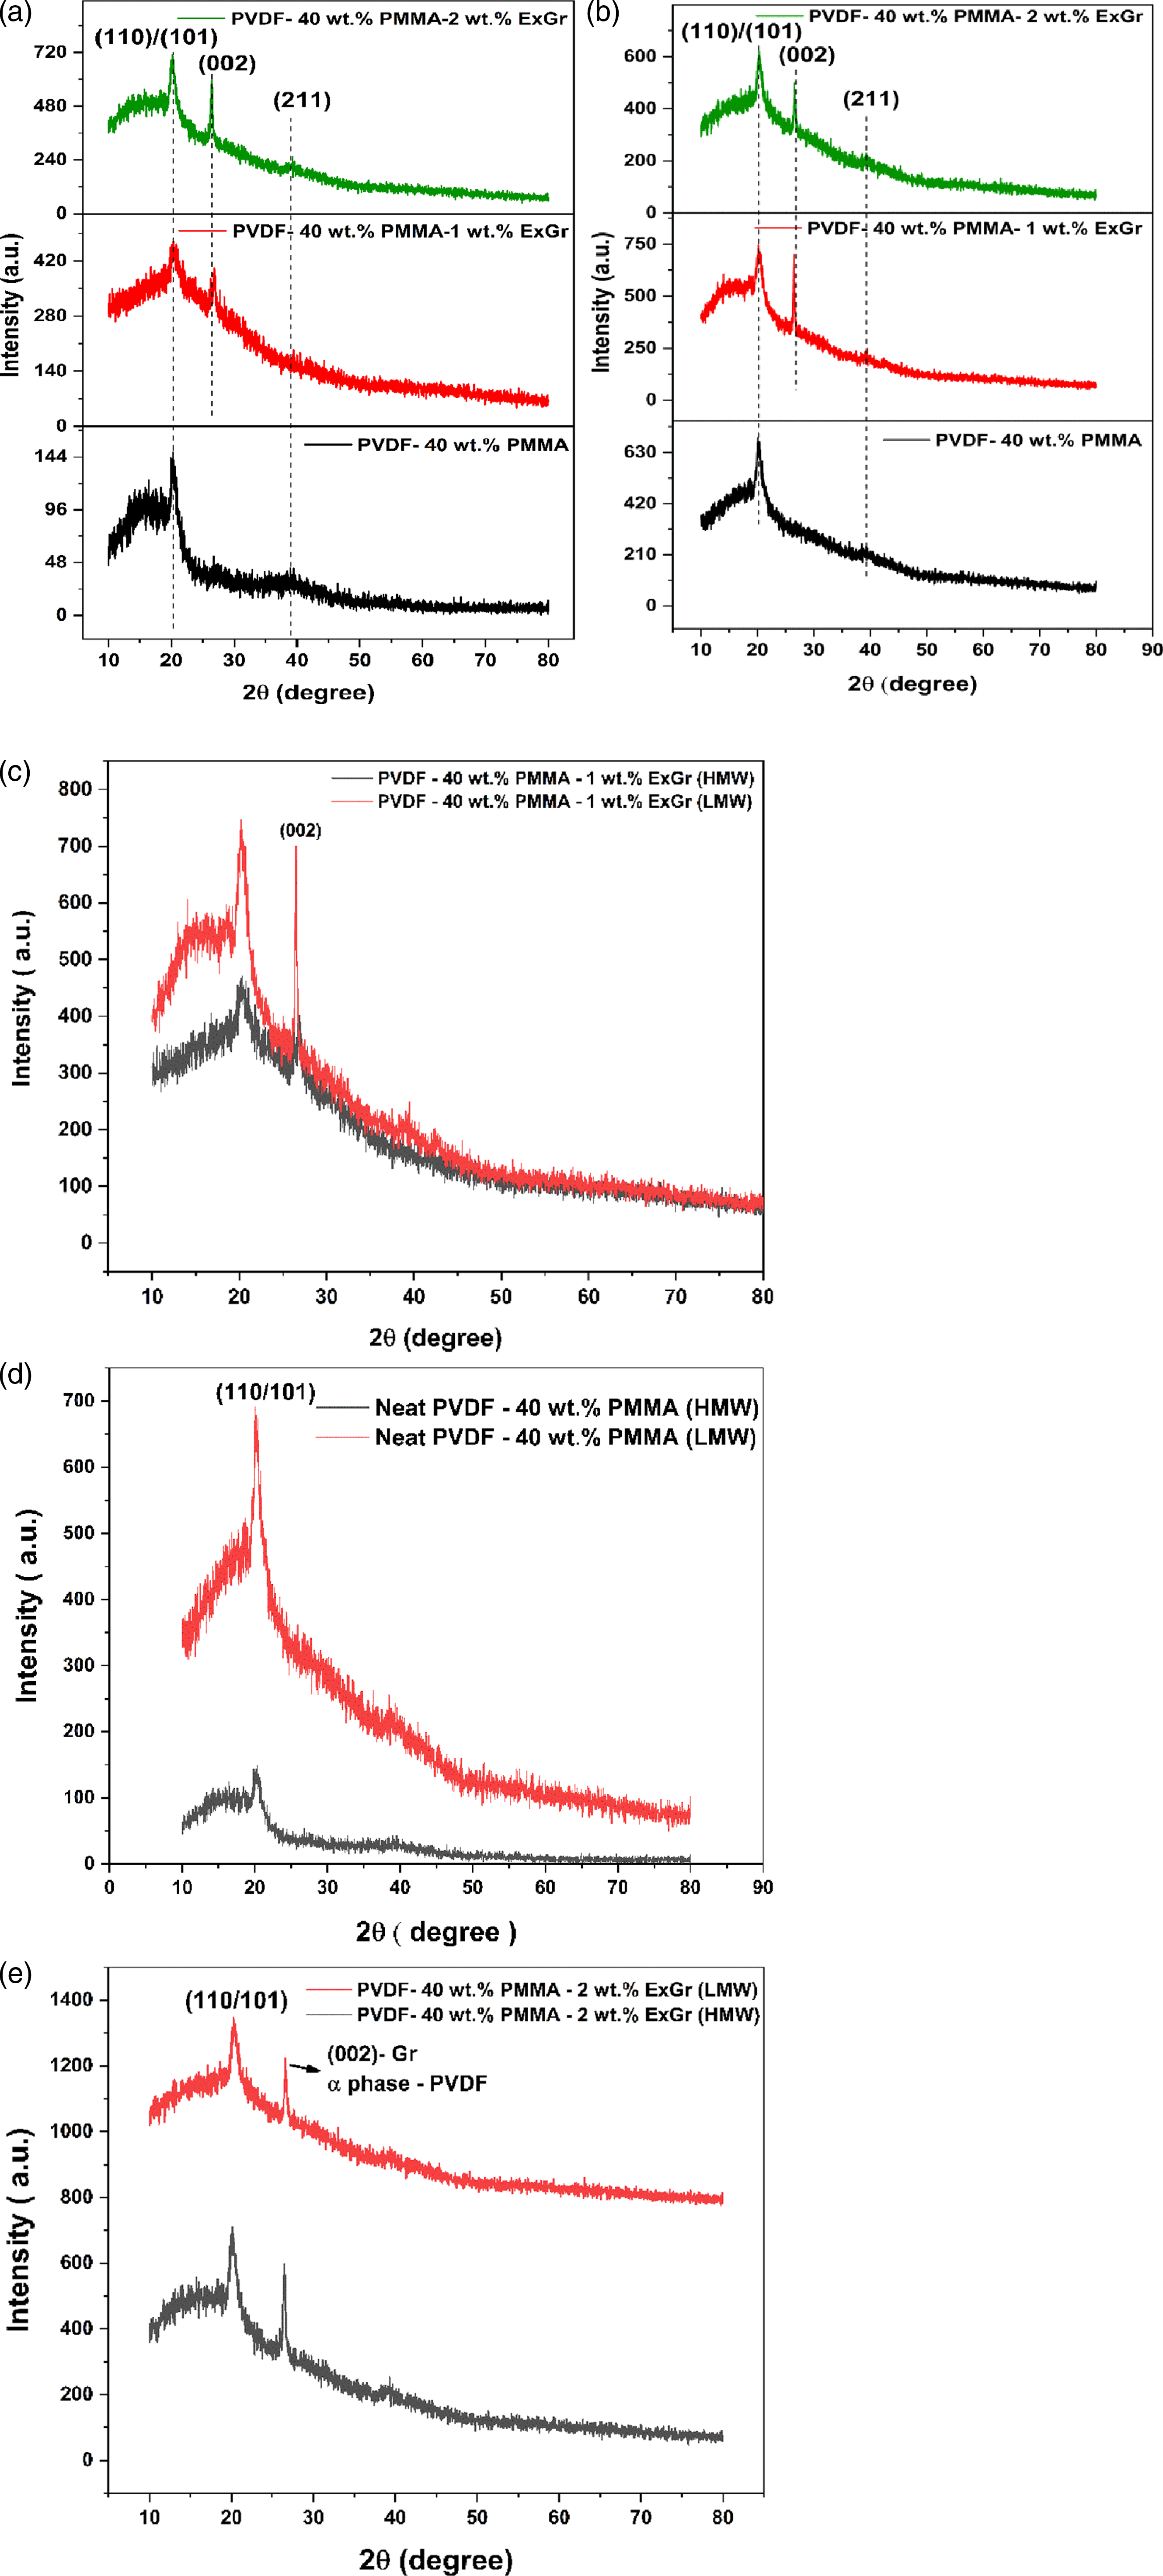
FTIR analysis of poly(vinylidene fluoride)-40 wt.% poly(methyl methacrylate) blend and blend nanocomposite films
It is clear from the FTIR vibration spectra as shown in Figure 8(a) and (b) that the presence of electroactive gamma phase of PVDF is confirmed due to the occurrence of vibration bands at 833 cm−1 and 1234 cm−1 in both blends and blend nanocomposites as reported elsewhere.
37
With the incorporation of sonicated ExGr particles, the structure of PVDF is not altered. Vibration bands corresponding to the electroactive gamma phase of PVDF are shown in the FTIR spectra of neat blends with PMMA of different molecular weights. There are no vibration bands in the blend and blend nanocomposites at 842 cm−1 and 1240 cm−1 which corresponds to PMMA. Hence there cannot be interference of PMMA bands at 833 cm−1 and 1234 cm−1. The vibration band corresponding to alpha phase is observed at 1149 cm−1 35–37 which also supports XRD data. A very close vibration band corresponding to PMMA appears at 1142 cm−1. The appearance of the 1142 cm−1 and other wave numbers have been mentioned in the published work of Tommasini et al.
39
Thus, the FTIR analysis of both blend and blend nanocomposites prove the co-existence of electroactive gamma and non-polar alpha phases. The interaction of solvent, evaporation rate of the solvent and the conditions employed in the work would have aided the formation of electroactive gamma phase and not the beta phase. Our group has already published the formation of electroactive gamma phase in solvent cast neat PVDF film also.
40
Since the effect of molecular weight of PMMA is compared in this work, only the FTIR of polymer blend and blend nanocomposites are compared. FTIR spectra of solution blended PVDF-40 wt.% PMMA-x wt.% ExGr (x = 0,1,2) films (a) with high molecular weight PMMA (b) with low molecular weight PMMA (c) control PMMA films with different MFI.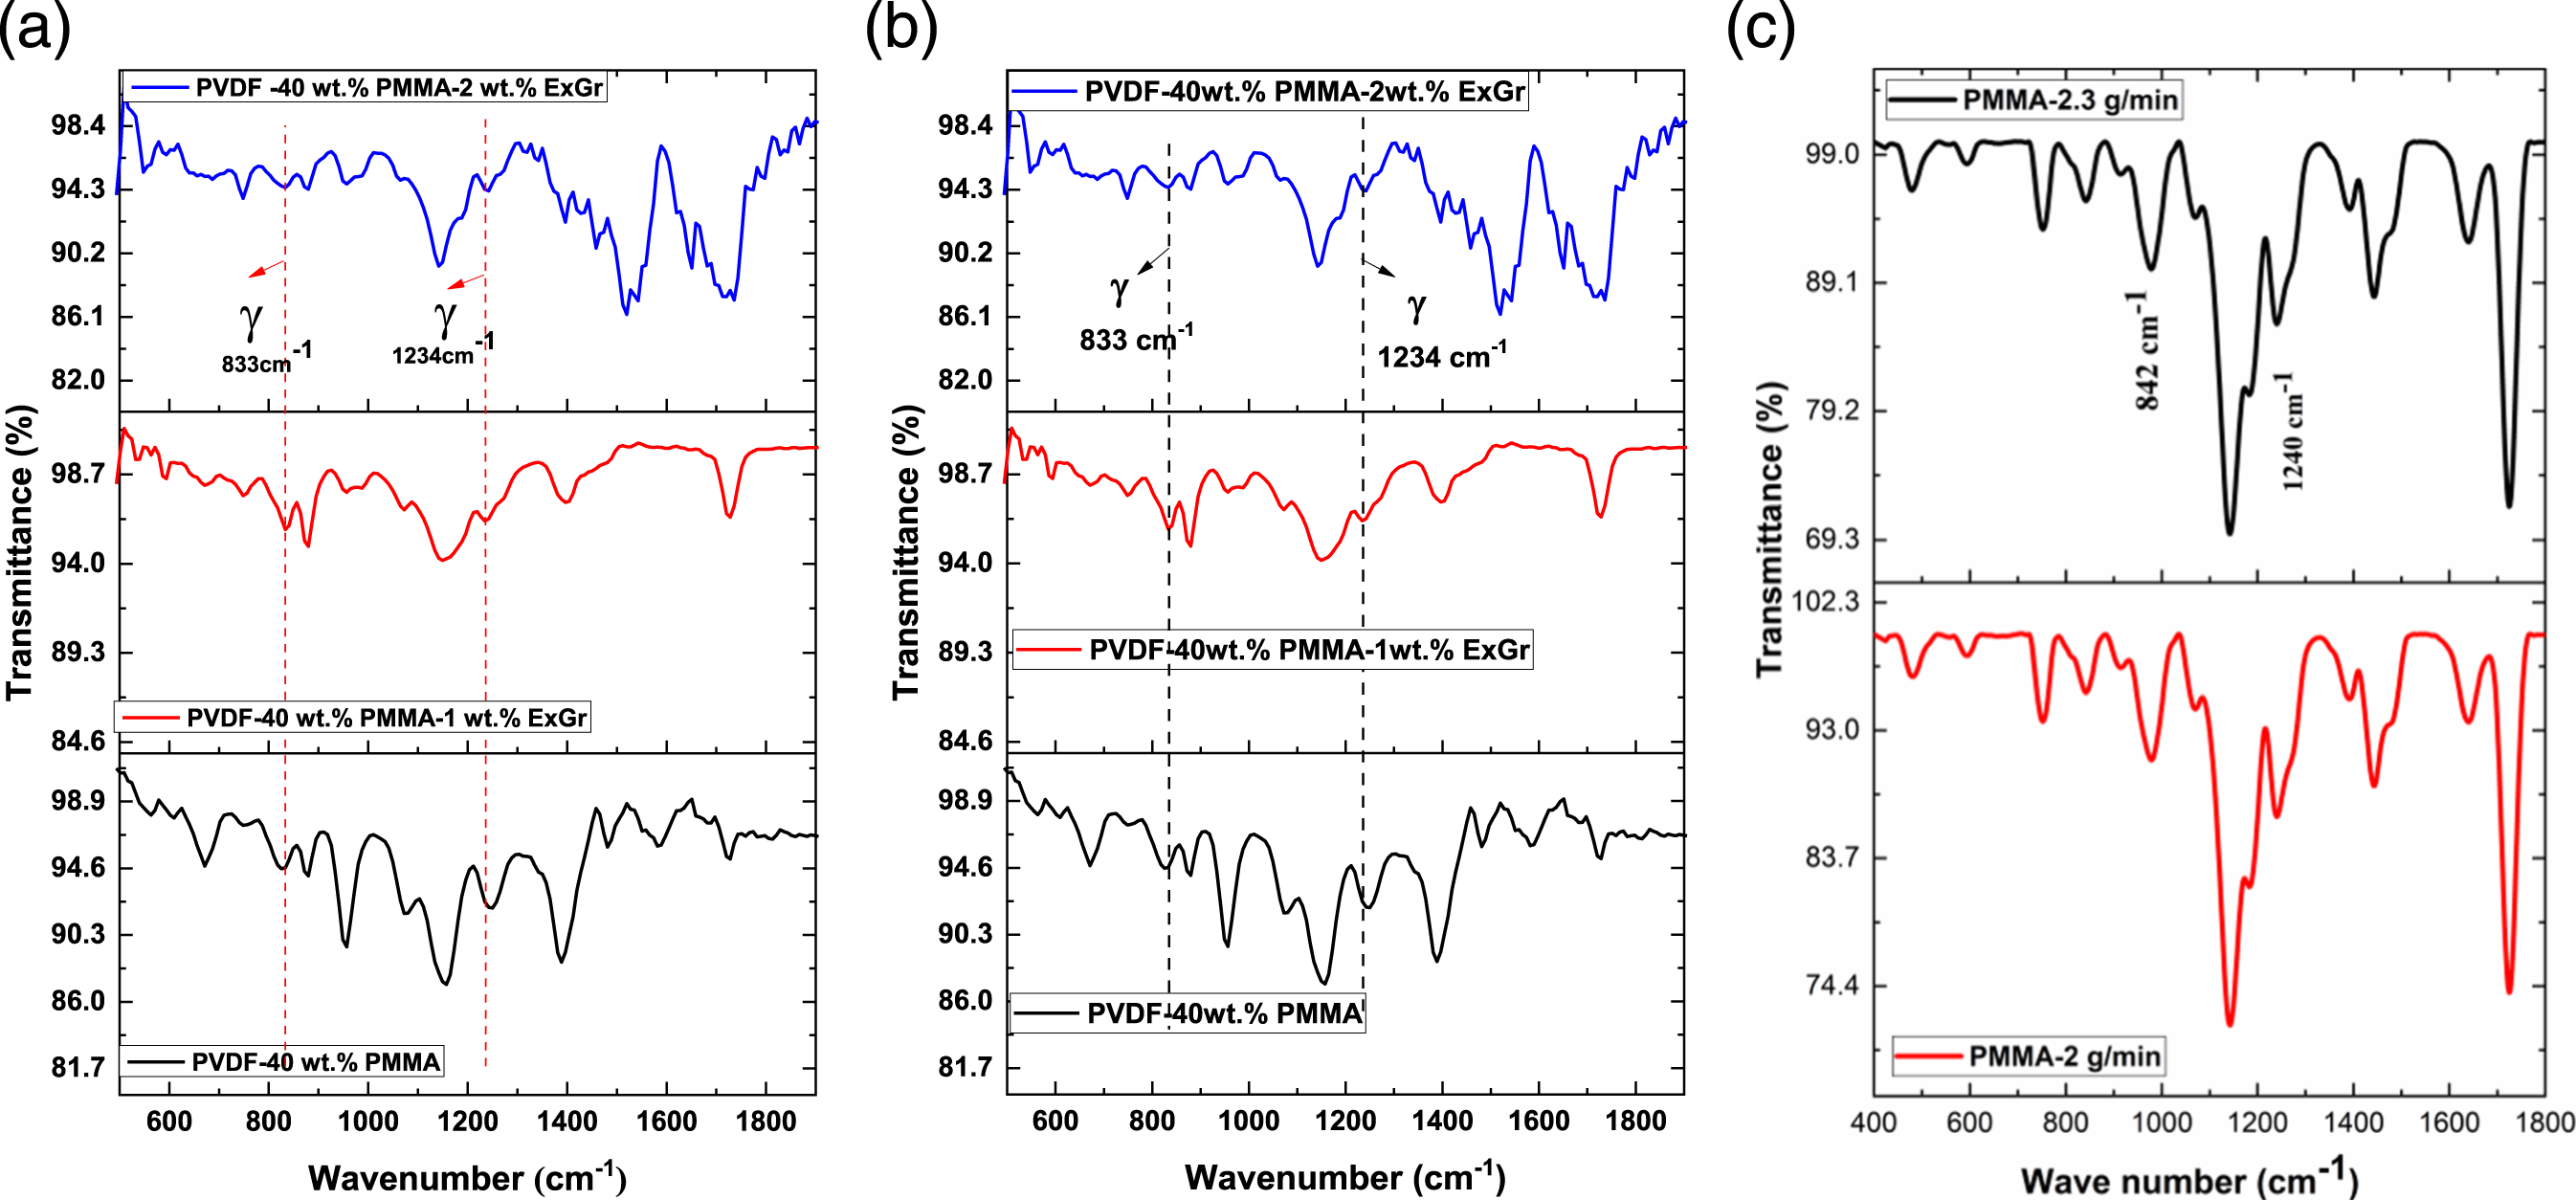
Electroactive gamma phase fraction in solution blended PVDF-40 wt.% PMMA-x wt.% ExGr (x = 0, 1, 2) blend nanocomposites.
It can be clearly seen that the gamma phase fraction in blend A is lesser than that of blend B. For neat solution blended PVDF, the electroactive gamma phase fraction has been reported elsewhere which is slightly greater than 85%. 40 Compared to neat PVDF, in high molecular weight PMMA employed blend, the gamma phase content is lesser and in low molecular weight PMMA employed blend, the electroactive gamma phase content is higher than that of both neat PVDF and blend A.
Lin et al. 41 have convincingly proved through SAXS and DSC analyses that with increasing molecular weight of PMMA in PVDF-PMMA blends, the rejection of PMMA from the interlamellar and interfibrillar space would be higher. Further the authors have proved that the diffusion coefficient of amorphous phase is lower and the growth rate of PVDF crystals with high molecular weight PMMA decreases due to increase in viscosity of the blend. Also, the authors have proved through polarized optical microscope (POM) analysis that the growth rate of crystals in neat PVDF is the maximum when compared to that of blends. With high molecular weight PMMA employed blends, since the crystal growth rate is less along with more rejection of PMMA chains from the interlammellar spaces, the crystallinity of the blends could be lesser than that of low molecular weight PMMA employed blend. In our finding the crystallinity is lower in blend A than blend B as discussed in the DSC analysis section. Similarly, the electroactive phase content in high molecular weight PMMA employed blend is lesser than that of low molecular weight PMMA employed blend. This particular aspect can be understood from the fact that compared to low molecular weight PMMA, high molecular weight PMMA will be rejected more from the interlammellar space of PVDF suggesting there will be more number of PMMA low molecular weight chains in the crystallized region of PVDF in comparison to high molecular weight PMMA chains. The carbonyl group of PMMA will interact well with CH2 groups of PVDF as reported elsewhere 42 resulting in higher gamma phase content in blend B, higher than that of neat PVDF and blend A. If this is true, in the XRD, the peak intensity corresponding to electroactive gamma phase at 20.3° should be higher for blend B than blend A. Also, FWHM corresponding to 20.3° peak is higher in blend A compared to blend B, suggesting crystallite size is increased in low molecular weight employed blends. Figure 7(d) in the XRD section exactly proves the above-mentioned points.
When sonicated ExGr particles are incorporated in PVDF-PMMA blend, since high molecular weight PMMA is rejected from the interlammellar region of PVDF easily, these PMMA chains can completely wrap up the graphite nanosheets and forms network between the filler particles. This results in enhanced crystallinity of PVDF as the hindrance to PVDF chains coming closer will be lesser when compared to neat PVDF-PMMA blend. The crystalline region may contain multiple phases of PVDF. With 1 wt.% ExGr loading in the blend in which low molecular weight PMMA is employed, not all PMMA chains will be coated onto the nanosheets as some of them would be still present in the interlamellar space of PVDF chains and hence crystallinity would be less in comparison to high molecular weight (HMW) PMMA employed PVDF-40 wt.% PMMA-1 wt.% ExGr blend nanocomposite. Apart from that graphite nanosheets which might be incompletely coated by low molecular weight (LMW) PMMA chains can locally interact with amorphous phase of PVDF and hence increase the electroactive gamma phase content in comparison to HMW PMMA coated nanosheets.
In XRD also, it can be clearly seen that the intensity corresponding to electroactive gamma phase is increased when LMW PMMA is incorporated along with 1 wt.% ExGr loading as depicted in Figure 7(c). Also, higher intensity of graphite (002) reflection supports the above argument.
When ExGr loading is increased to 2 wt.% in the blend (HMW PMMA employed blend nanocomposite), the PMMA coated graphite nanosheets can occupy inter PVDF chains decreasing the crystallinity when compared to 1 wt.% ExGr incorporated blend as at 2 wt.% ExGr loading more number of graphite nanosheets would be present. However, those sheets would have been coated well by HMW PMMA. Hence there exists a reduction in the electroactive gamma phase content in blend nanocomposites A with 2 wt.% ExGr loading in comparison to 1 wt.% ExGr loading in blend A. For the same loading of ExGr (2 wt.%) in LMW PMMA employed blend nanocomposites, the occupation of graphite nanosheets in the interspace between PVDF chains decreases further the crystallinity compared to HMW employed blend nanocomposites. However, the graphite nanosheets uncoated by PMMA can have sufficient interaction with PVDF chains resulting in marginal increase in the electroactive phase content in comparison to 1 wt.% ExGr loading in blend B. There is a remarkable difference in the electroactive phase content in blend nanocomposite A and B with 2 wt.% ExGr loading (74.5% and 93%). It should be mentioned here that in FESEM analysis also, it has been convincingly proved that the graphite nanosheets in low molecular weight PMMA employed blend are distributed randomly in the blend matrix. Thus, the variation of electroactive gamma phase fraction can be understood. In short, in high molecular weight PMMA employed blend nanocomposites with 2 wt.% ExGr loading, the electroactive gamma phase content decreases due to complete wrapping of PMMA chains rejected from the inter lamellar region of PVDF. The interaction of PMMA chains with PVDF chains will be minimal in comparison to low molecular weight PMMA employed blend. However, the electroactive gamma phase increases in low molecular weight PMMA employed blend nanocomposites in comparison to HMW PMMA employed blend nanocomposites due to incomplete wrapping of graphite nanosheets because of reduction in the chain length of PMMA resulting in graphite π-electron interaction with PVDF chains. This interaction causes electroactive gamma phase to be increased. In the XRD section (Figure 7(e)) it can be seen that the peak intensity at 26.6° increases in blend nanocomposite A with 2 wt.% ExGr loading compared to that of blend nanocomposite B. Since the electroactive gamma phase is lesser for 2 wt.% ExGr loaded blend A, the alpha phase content would have been increased. The (021) reflection of alpha phase of PVDF also appears at 26.6°.
Differential scanning calorimetry analysis of solution blended poly(vinylidene fluoride)-40 wt.% poly(methyl methacrylate)-exapnded graphite blend nanocomposites
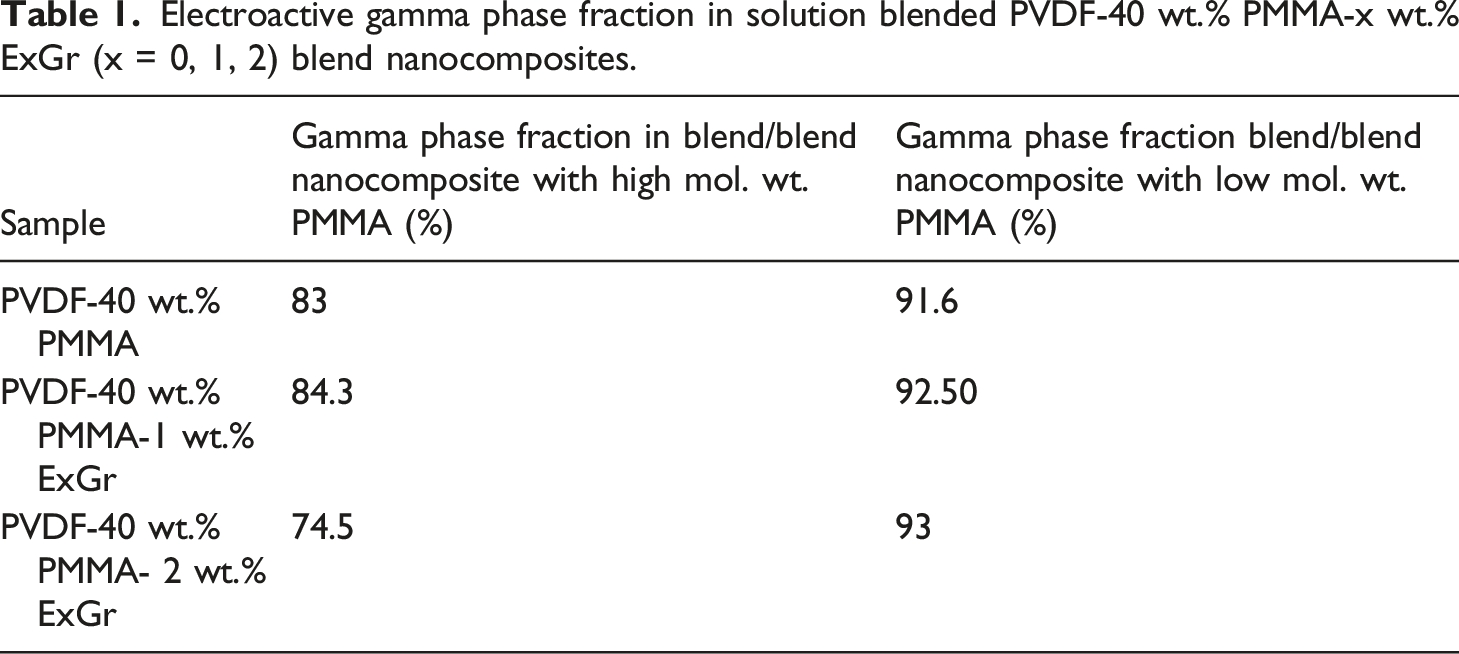
Figures 9(a)–(c) and 10(a)–(c) depict the DSC curves of PVDF-40 wt.% PMMA-x wt.% ExGr (x = 0,1,2) blend nanocomposites prepared using PMMA grade A and PMMA grade B respectively. The melting temperature (Tm), degree of crystallinity, and crystallization temperature (Tc) of the blend nanocomposites have been summarized in Table 2. DSC analysis of solution blended PVDF-40 wt.% PMMA-x wt.% ExGr (PMMA grade A) films. (a) x = 0, (b) x = 1, (c) x = 2. DSC analysis of solution blended PVDF-40 wt.% PMMA-x wt.% ExGr (PMMA grade B) films (a) x = 0, (b) x = 1, (c) x = 2. DSC analysis of PVDF-40 wt.% PMMA-ExGr blend nanocomposites.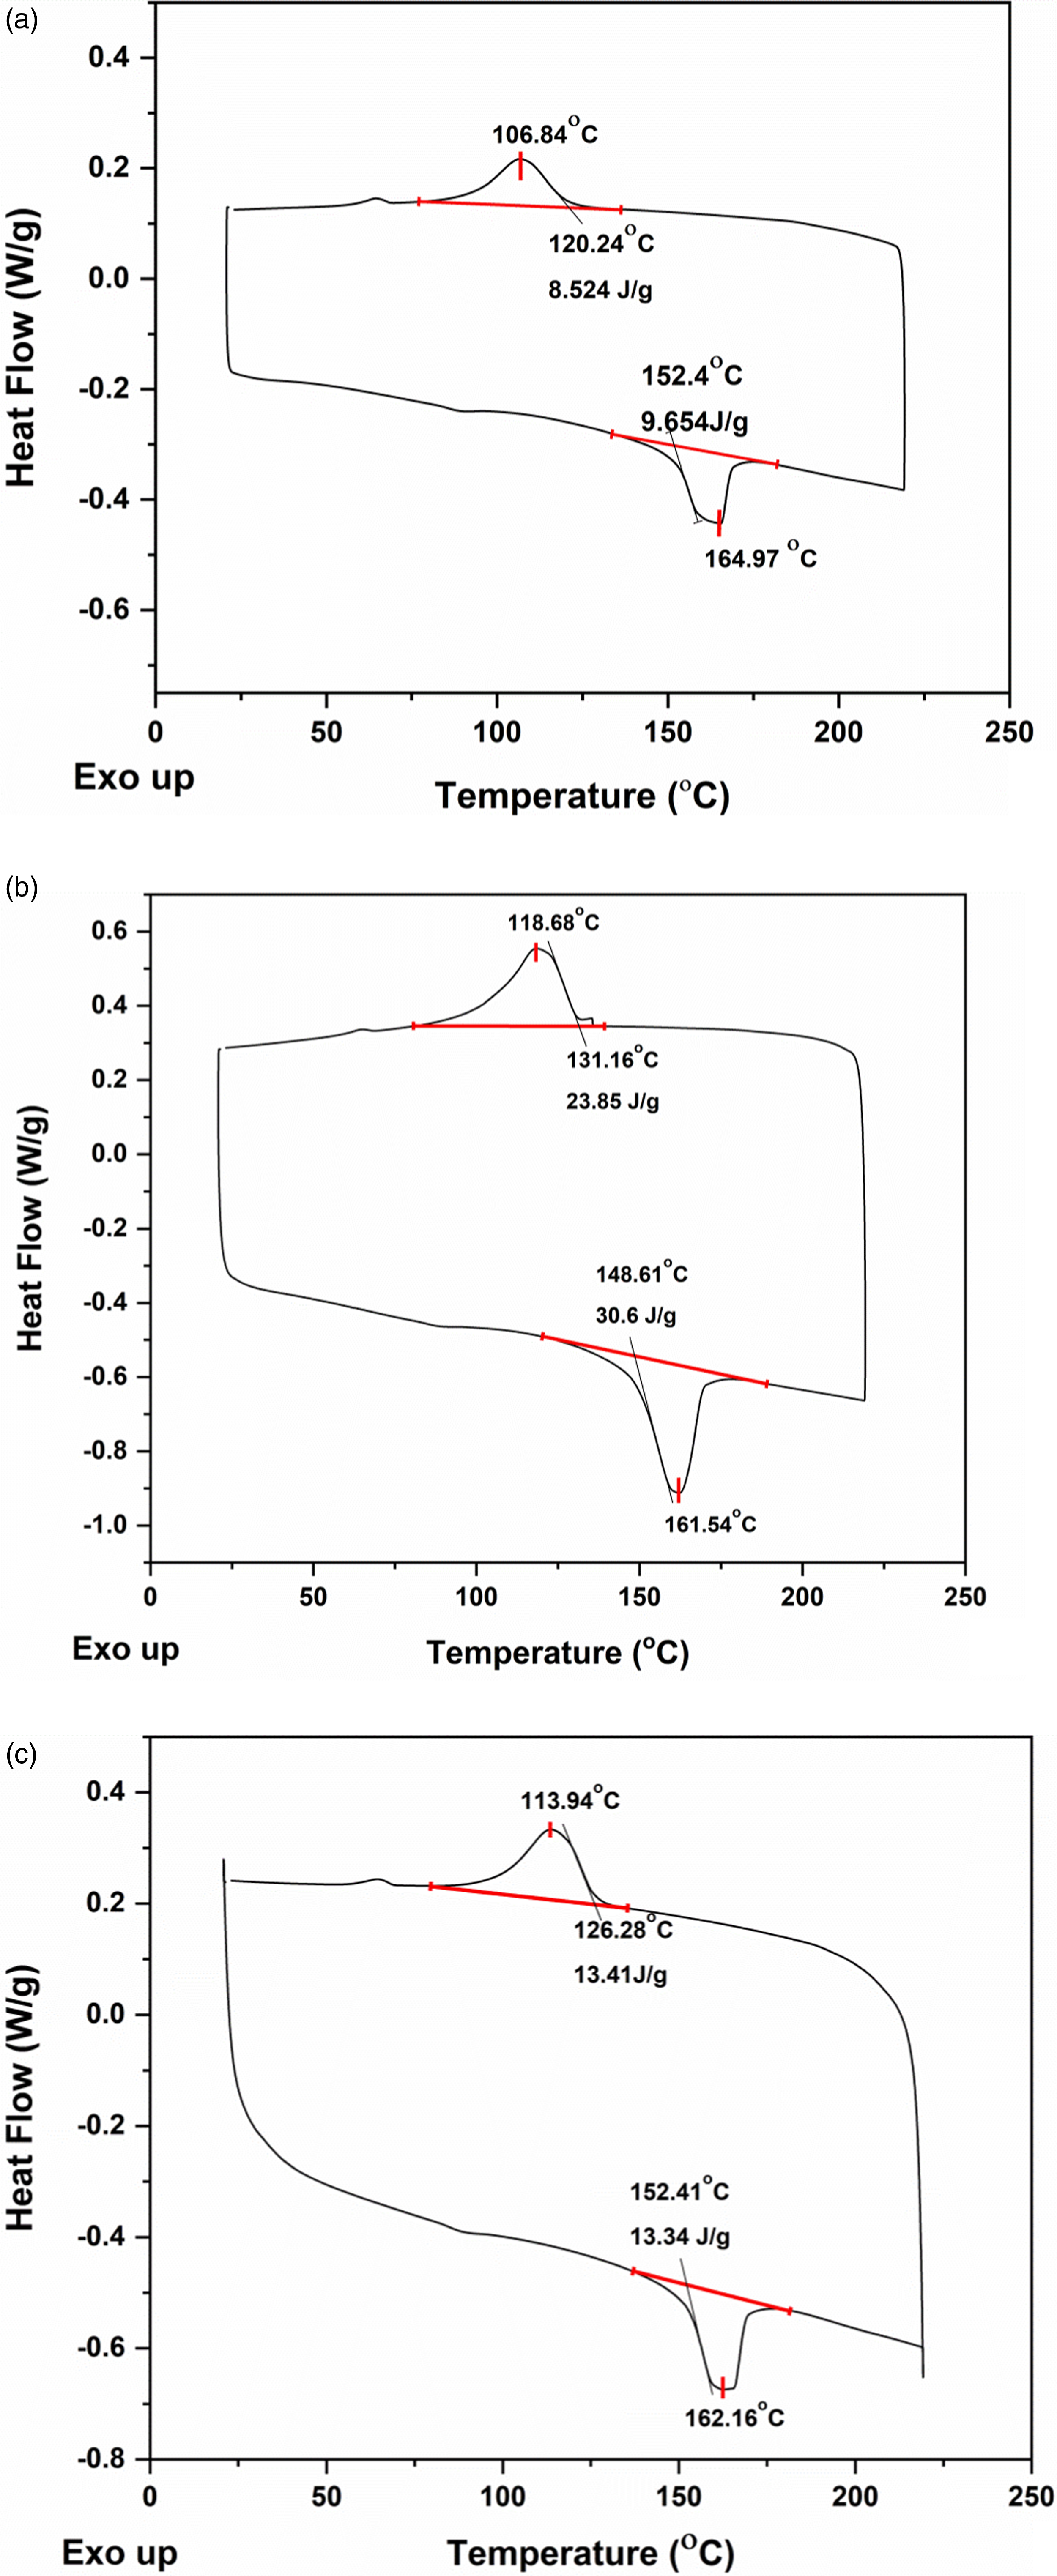
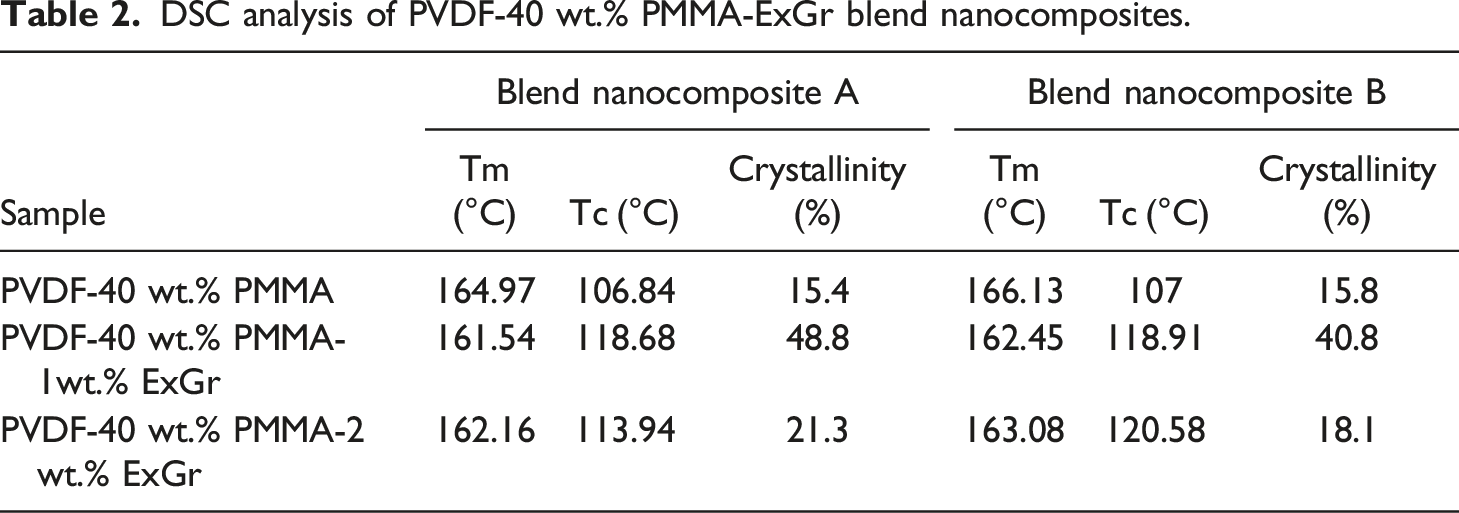
An increase in crystallization temperature is observed with the increase in loading of expanded graphite that can be attributed to the nucleation effect of expanded graphite.
43
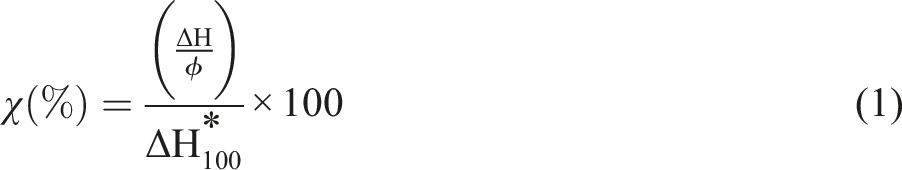
The degree of crystallinity (χ) has been calculated using equation (1), where ΔH is the melting enthalpy, ϕ is the weight fraction of PVDF and ΔH*100 corresponds to melting enthalpy of 100% crystalline PVDF which is 104.5 J/g. 44 The PVDF-40 wt.% PMMA blend prepared using PMMA grade B exhibits slightly higher crystallinity as compared to PMMA grade A employed blend. With HMW PMMA incorporated blend, the melt viscosity would be increased more than that of LMW PMMA employed blend. 41 The viscosity increase impedes crystallization and hence the percentage crystallinity is less for blend A in comparison to blend B.
The increased crystallinity is also ensured by higher melting temperature of blend B when compared to that of blend A. Though PMMA is amorphous, the PVDF chains coming closer will significantly contribute to crystallinity. The crystallization temperature of PVDF-40 wt.% PMMA (LMW) is slightly higher than that of the blend in which high molecular weight PMMA is used. From the melt, while cooling, PVDF can crystallize faster rejecting low molecular weight PMMA chains. On the contrary, when high molecular weight PMMA is employed, the crystallization of PVDF is hampered due to more chain length of PMMA resulting in increased viscosity and hence more heat should be removed. Therefore, the crystallization temperature of blend A is lower than that of blend B. When 1 wt.% sonicated expanded graphite is incorporated in the blend, since PVDF can crystallize faster from the solution, PMMA chains can adhere on to the surface of graphite nanosheets. This ensures that more PVDF chains will come closer resulting in higher crystallinity. Same is true for crystallization of PVDF from the melt in blend nanocomposites as already PMMA chains would have coated the graphite nanosheets in the film. When high molecular weight PMMA is used, the chains can effectively coat the surface of graphite nanosheets. Therefore, the crystallinity is increased to 48.8% from 15.4% for the neat blend. It is because of PMMA effective coiling on the surface of graphite nanosheets. Since amorphous PMMA chains have been adhered onto graphite surface, PVDF can easily crystallize. Therefore, the crystallization temperature is also increased when high molecular weight PMMA is used in the blend nanocomposite. Since the blend nanocomposite is electrically conducting when 1 wt.% ExGr is incorporated, the heat transfer would have been faster resulting in the decrease of melting temperature. When ExGr loading is further increased to 2 wt.% from 1 wt.%, since the number of graphite nanosheets also proportionately increased, the number of high molecular weight PMMA chains would have been completely used for coiling up of graphite nanosheets. The PMMA coiled graphite nanosheets which is a composite filler can occupy interspaces of PVDF chains thus decreasing crystallinity when compared to that of 1 wt.% ExGr loading in the blend. However, the crystallinity is higher (21%) when compared to that of neat PVDF-40 wt.% PMMA blend (15.4%) due to PMMA chains coiling around graphite nanosheets. It should be mentioned that the electrical conductivity of PVDF-40 wt.% PMMA- 2 wt.% ExGr is higher than that of 1 wt.% ExGr loading in the blend. Though the coiling of PMMA around nanosheets exists, it is the network formation between the composite filler which is responsible for the charge transport. It should be mentioned that the thickness of the coated PMMA layer is important to decide the level of electrical conductivity. Since PMMA is amorphous, the charge transport through the coated layer is easier when compared to that of semi-crystalline PVDF layer. The melting temperature of blend nanocomposites with 2 wt.% ExGr is slightly higher than that of 1 wt.% ExGr loaded blend nanocomposites. Though at 2 wt.% ExGr loading, the blend nanocomposite exhibits higher conductivity than that of 1 wt.% ExGr loaded composites, the crystallinity is decreased and there would not be fast transfer of heat to the polymer matrix when compared to that of 1 wt.% ExGr loaded blend nanocomposites. Hence the melting temperature increases. However, when compared to the melting temperature of neat blend, the blend nanocomposite’s melting temperature is decreased essentially due to conducting nature of graphite nanosheets. Also, the crystallization temperature is decreased (∼113°C) due to the obstruction of composite filler in bringing the PVDF chains closer.
For low molecular weight PMMA employed blend nanocomposites, the melting temperature and crystallinity follow similar trend as that of high molecular weight employed blend nanocomposites. However, the crystallization temperature increases with ExGr loading. With 2 wt.% ExGr loading in blend nanocomposites, number of graphite nanosheets is increased. Since low molecular weight PMMA is used, the number of chains will be more and hence they can completely coat all the graphite nanosheets. This shall result in enhancement in crystallization temperature (120.58°C) when compared to that of 1 wt.% ExGr loading in the blend (118.91°C) due to the fact that in low molecular weight PMMA employed blend nanocomposites, the dispersion of composite filler may not be that uniform as that of what could be witnessed in high molecular weight PMMA used blend nanocomposites. In fact, the crystallinity in the blend nanocomposite B is lesser than that of blend nanocomposite A which could be attributed to the dispersion of composite filler. This explanation is consistent with the model proposed earlier as well as proved by FESEM analysis. Also, the electrical conductivity of high molecular weight (HMW) PMMA employed blend nanocomposites is higher than that of low molecular weight (LMW) PMMA employed blend nanocomposites. The various parameters such as melting temperature (Tm), crystallization temperature (Tc) and percentage crystallinity for the blend nanocomposites A and B are depicted in Table 2.
Deconvolution of melting peaks and the analysis
The deconvolution of melting curves of blends and blend nanocomposites are done with Voight and Lorentzian functions wherever required as depicted in Figure 11(a)–(f). Melting curves of neat blend A and blend B have been deconvoluted such that the cumulative curve matches the original melting curve to the maximum possible extent, as the shape of the melting curves obtained for blends A and B are quite difficult to exactly match. However, the present deconvolution of melting curves gives significant results which support FTIR data. The existence of two melting peaks for all the samples clearly proves XRD and FTIR analyses as the solution blended blend nanocomposites exhibit coexistence of alpha and gamma phases of PVDF. Deconvolution of melting peaks corresponding to solution blended PVDF- 40 wt.% PMMA-x wt.% ExGr (x = 0, 1, 2) (a) neat blend with LMW PMMA (b) neat blend with HMW PMMA (c) blend nanocomposite with 1 wt.% ExGr and LMW PMMA (d) blend nanocomposite with 1 wt.% ExGr and HMW PMMA (e) blend nanocomposite with 2 wt.% ExGr and LMW PMMA (f) blend nanocomposite with 2 wt.% ExGr and HMW PMMA.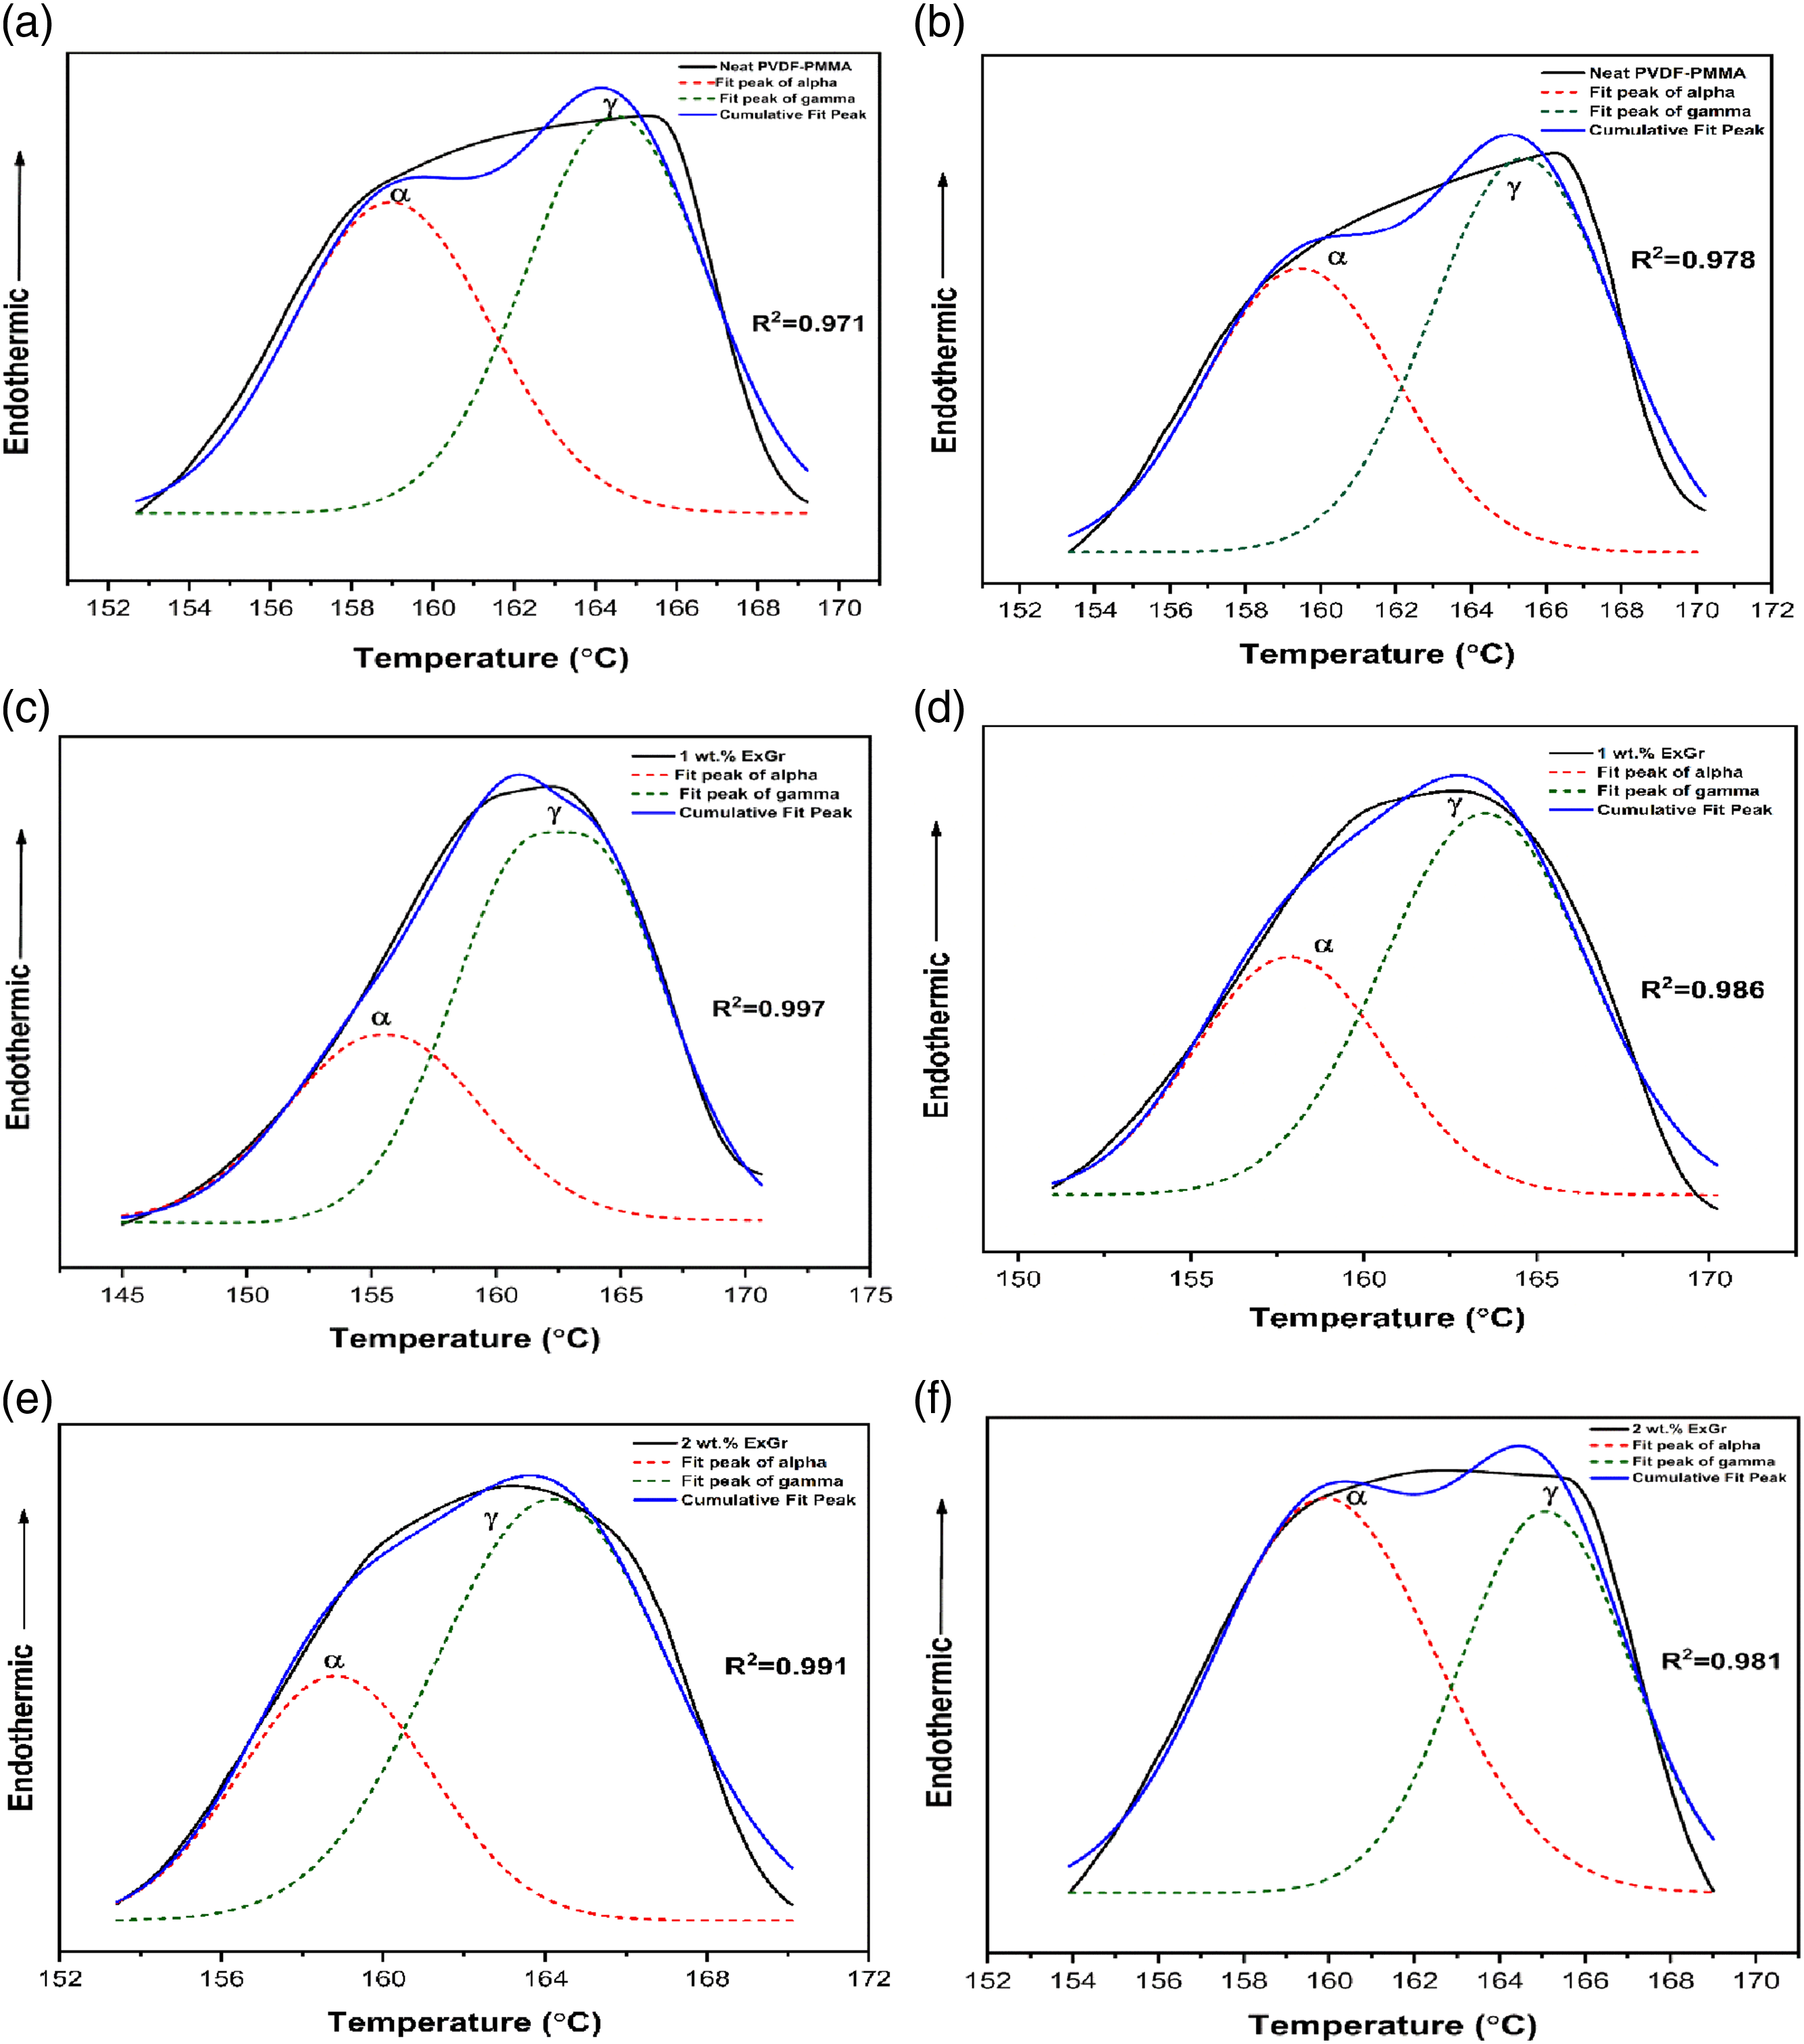
Deconvolution of melting peaks of blend A, blend B, blend nanocomposite A and blend nanocomposite B.
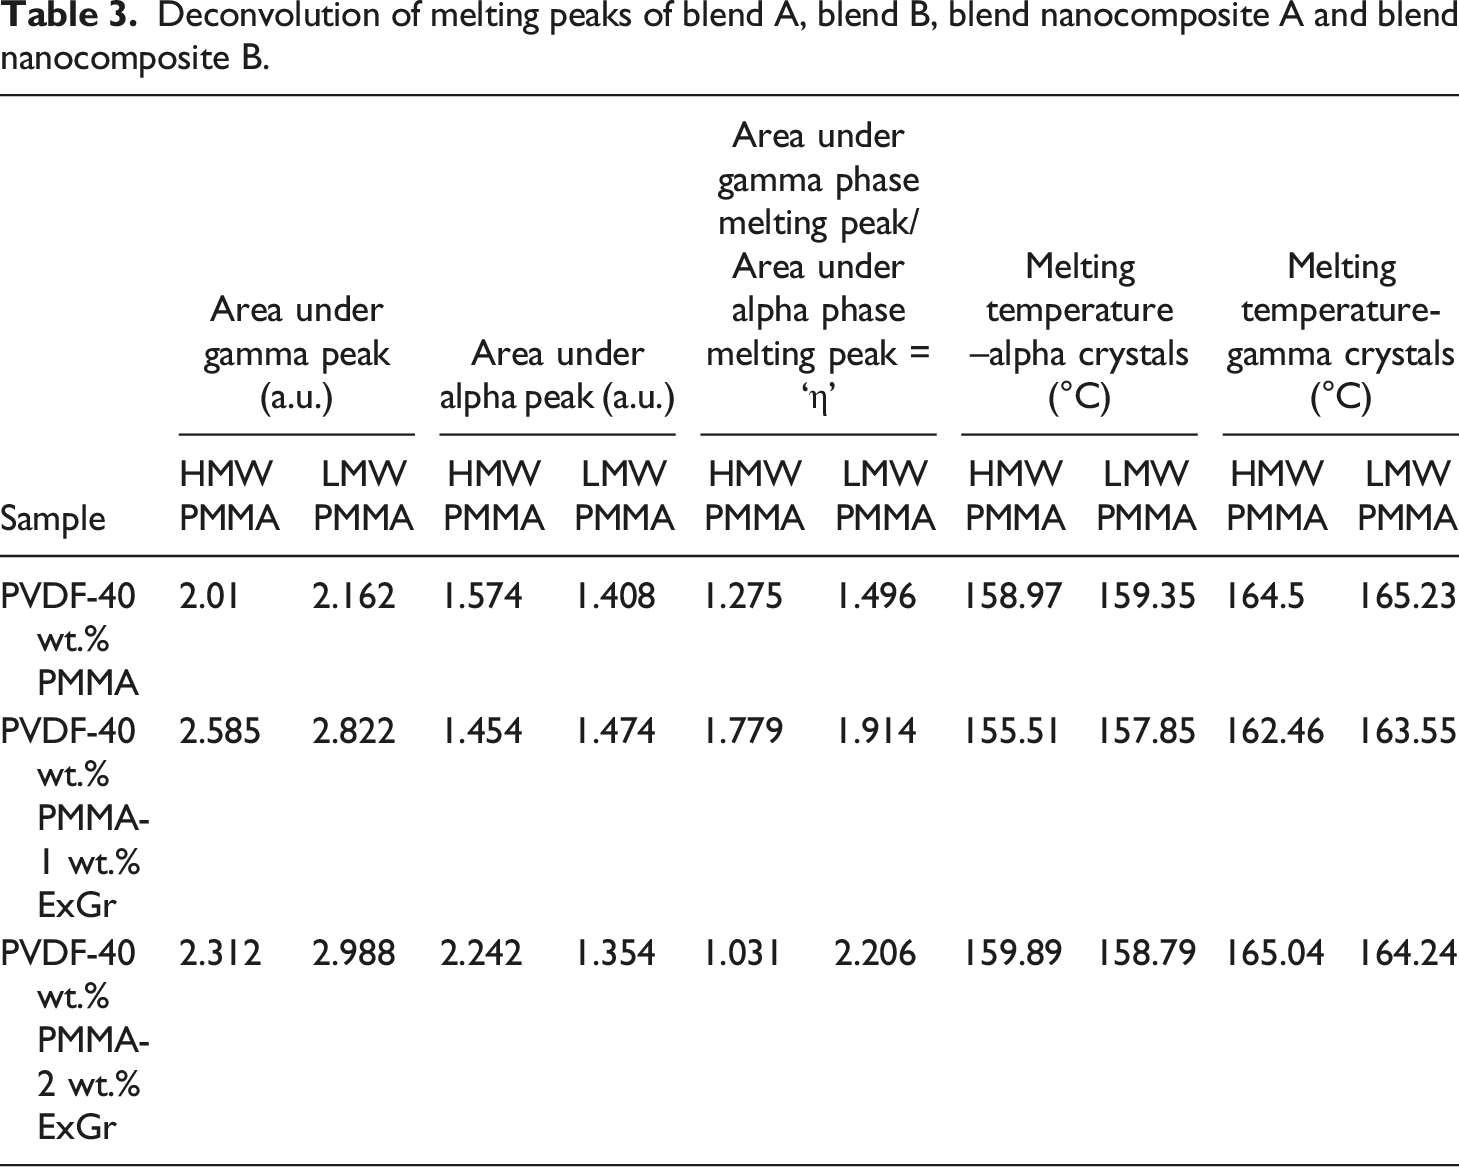
It can also be seen from Table 3 that the non-polar alpha phase content decreases in LMW PMMA employed blend and blend nanocomposites which is consistent with the FTIR results. A useful parameter to adjudge enhancement in electroactive gamma phase in the blend nanocomposites is ‘η’ (Ratio of area under electroactive gamma phase melting curve and alpha phase melting curve) as mentioned in Table 3. The parameter ‘η’ varies in the same trend as that of electroactive gamma phase content evaluated from the FTIR. Thus, the deconvolution of melting curves obtained from DSC analysis supports the electroactive gamma phase variation as deduced from the FTIR results.
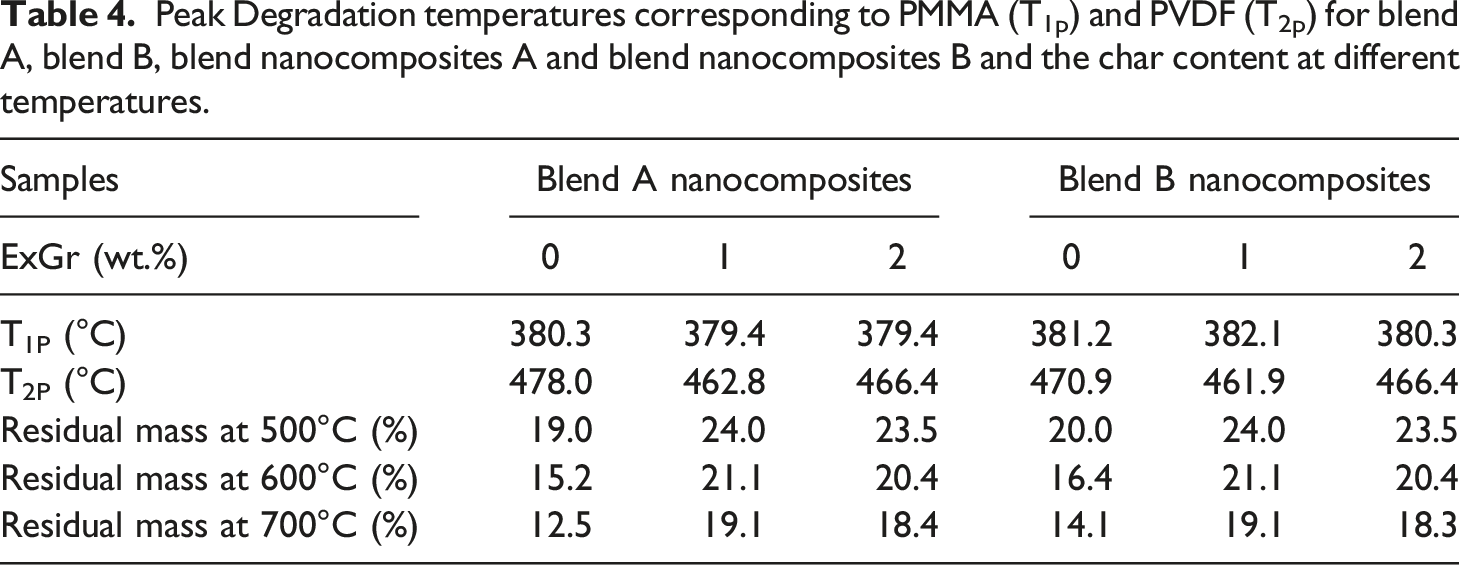
Peak Degradation temperatures corresponding to PMMA (T1p) and PVDF (T2p) for blend A, blend B, blend nanocomposites A and blend nanocomposites B and the char content at different temperatures.
In short deconvolution of melting peaks corresponding to blends and blend nanocomposites prove the following points (1) Coexistence of alpha and gamma phases of PVDF (2) The parameter ‘η’ very clearly proves the fact that area under gamma crystals melting peak is higher in LMW PMMA employed blend and blend nanocomposites in comparison to HMW PMMA employed blend and blend nanocomposites.
The above results convincingly support FTIR and XRD results.
Thermogravimetric analysis of solution blended poly(vinylidene fluoride)-40 wt.% poly(methyl methacrylate)-expanded graphite blend nanocomposite films
Thermogravimetric analysis of blend A, blend B, blend nanocomposites A and B has been presented in Figures 12 and 13 respectively. A two-step degradation is observed for the blends and blend nanocomposites where the initial step which occurs between 300°C to 400°C corresponds to degradation of PMMA main chains and the second step above 400°C corresponds to the degradation of PVDF main chains.
45
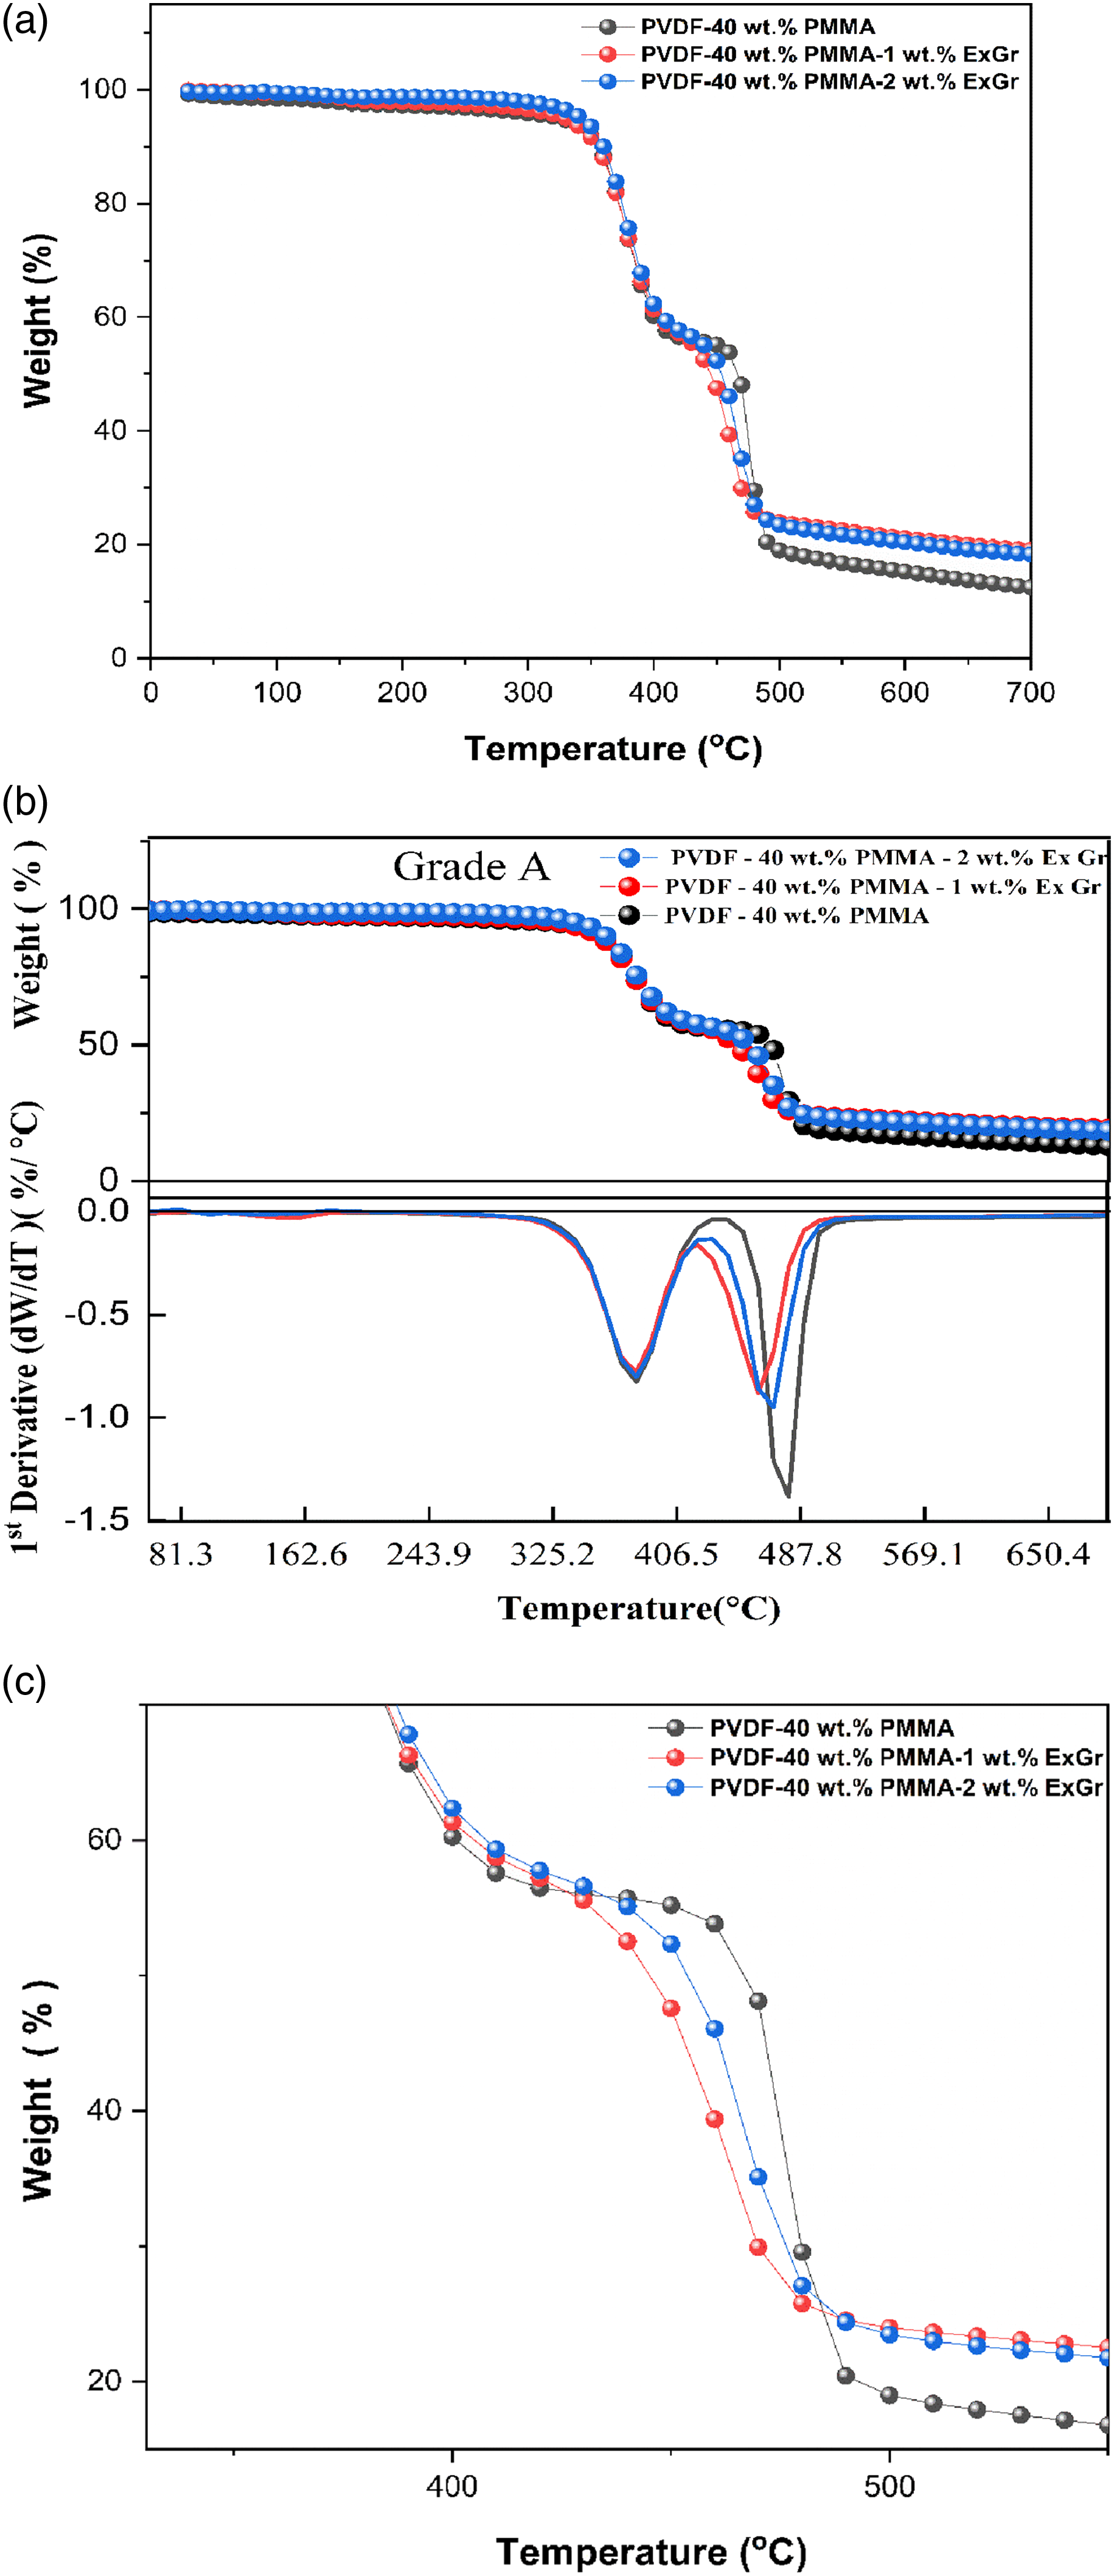
(a) TGA plot of solution blended PVDF-40 wt.% PMMA blend A and blend B (b) DTG curves of blend A and blend B. (a) TGA plots of blend A and blend nanocomposites A (b) TGA/DTG plots of blend A and blend nanocomposites A (c) TGA plots of blend A and blend nanocomposite A between 330°C to 550°C.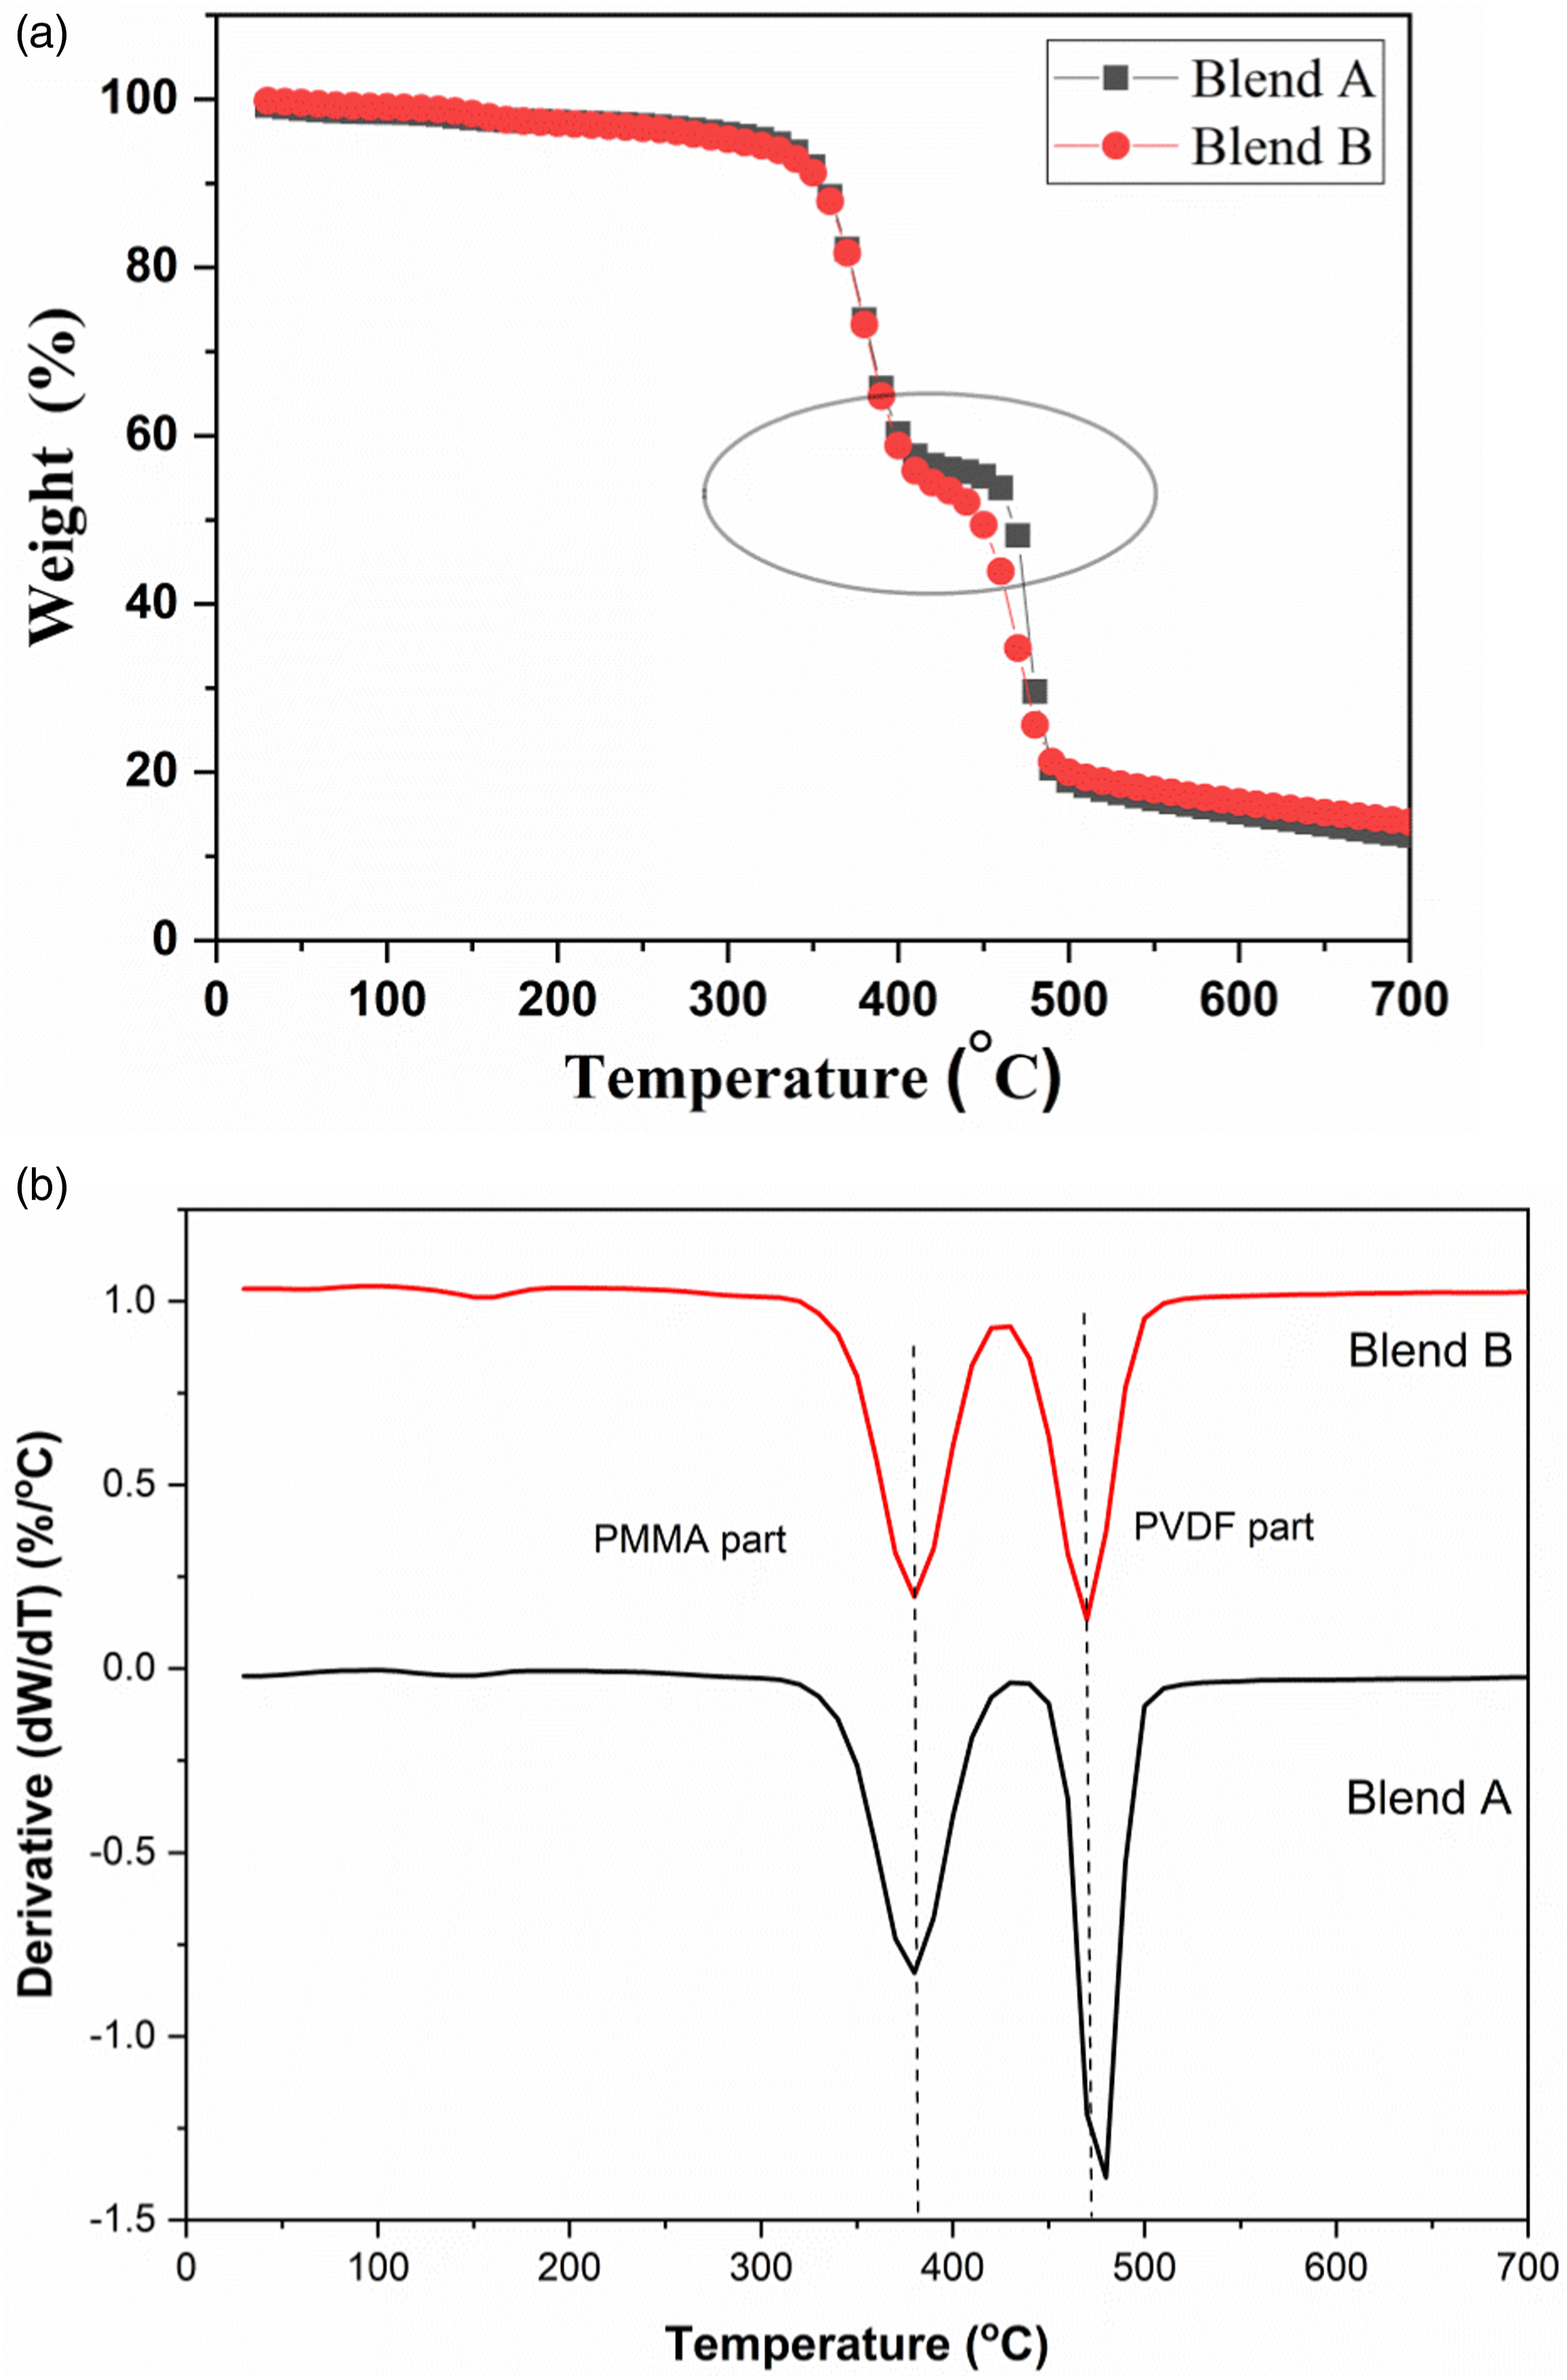
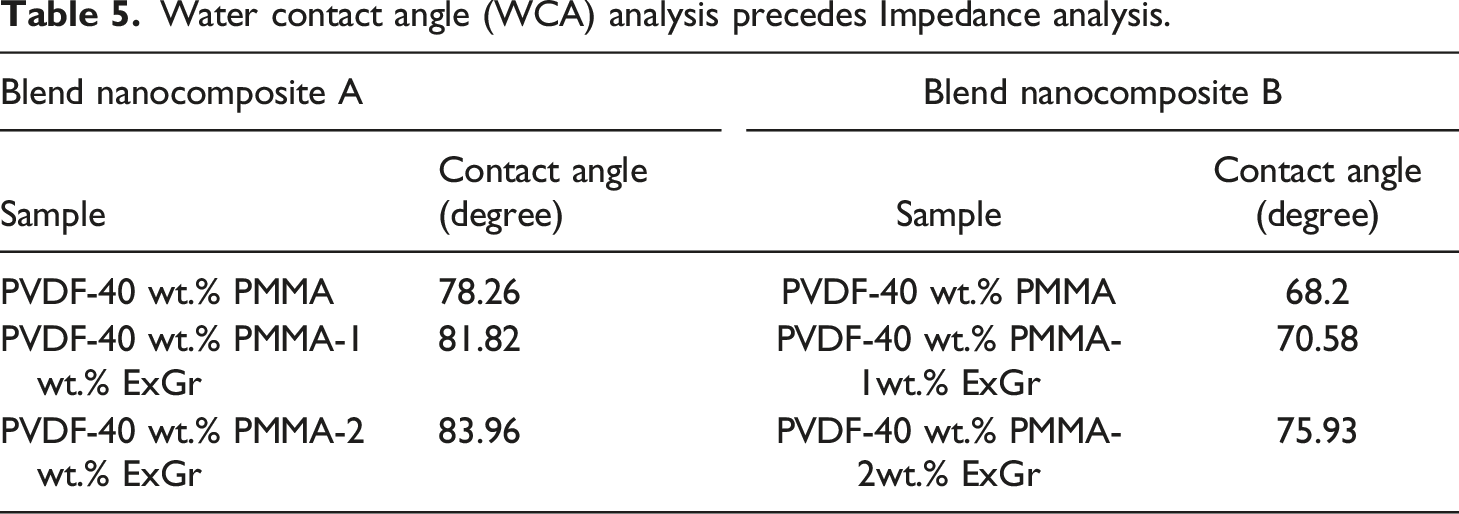
Water contact angle (WCA) analysis precedes Impedance analysis.
With the incorporation of 1 wt.% ExGr in blend A, the T1p corresponding to PMMA shifts to 379.4°C and T2p corresponding to PVDF decreases to 462.79°C in comparison to blend A. The degradation temperature corresponding to PMMA main chains decreases slightly because of wrapping of high molecular weight PMMA chains onto graphite nanosheets when ExGr is incorporated into blend A which implies that the chains are well apart and at lower temperatures itself those chains start degrading. Similarly, the peak main chain degradation temperature corresponding to PVDF decreases when 1 wt.% ExGr is incorporated into blend A in comparison to blend A as PMMA will be completely degraded above 400°C, it is the enhanced dispersion of graphite nanosheets which results in fast heat transfer to the matrix due to the conducting nature of filler particles. These aspects can be deduced from Figure 13(c). In the transition region especially between 450°C to 480°C, it can be clearly seen from Figure 12(c) that neat blend A has higher stability followed by blend nanocomposite A with 2 wt.% ExGr loading and blend nanocomposite A with 1 wt.% ExGr loading. Since dispersion is better with 1 wt.% ExGr loading in blend A, the degradation is faster due to the conducting nature of graphite nanosheets. However, 2 wt.% ExGr loading in blend A, in the temperature region between 450°C to 480°C, the degradation is lesser than that of 1 wt.% ExGr loaded blend A. This result clearly proves the fact that there can be local agglomeration where heat transfer to the polymer matrix will be inferior to what could be realized with 1 wt.% ExGr loading in blend A. With 2 wt.% ExGr loading, the peak degradation temperature corresponding to PVDF increases when compared to that of blend nanocomposite A with 1 wt.% loading of ExGr. This can be attributed to local agglomeration of filler particles resulting in inferior dispersion compared to 1 wt.% ExGr loading in the blend. This is also reflected in the peak main chain degradation temperature of PVDF which is increased to 466.37°C for 2 wt.% ExGr loading in blend A from 462.79°C for 1 wt.% ExGr loading in blend A. It should be mentioned that with the incorporation of ExGr, the main chain degradation temperature of PVDF chain is lesser than that of neat blend A due to the conducting nature of the graphite nanosheets.
The main chain degradation temperature of PMMA is increased from 380.29°C in blend A to 381.19°C in blend B. This result convincingly proves the fact that low molecular weight PMMA chains will not be completely rejected from inter lamellar spaces of PVDF. This result supports the fact that electroactive phase content is more in blend B than blend A as the interaction between low molecular weight PMMA chain and PVDF will be higher in blend B. There exists 8°C reduction in the peak degradation temperature for PVDF main chain in blend B in comparison to blend A which can be witnessed from Table 4. This can be attributed to the fact that PVDF chains would have been far apart because of the occupation of low molecular weight PMMA. Though PMMA would have been completely degraded at that temperature range, the PVDF chains would be well separated resulting in lesser degradation temperature of PVDF chains in blend B. It can be clearly seen that when ExGr particles are incorporated, the peak main chain degradation temperature corresponding to PMMA is slightly increased in blend B in comparison to blend A which proves the fact that low molecular weight PMMA chains would not be completely rejected from the PVDF lamellae. In fact, the main chain degradation temperatures of PMMA in ExGr loaded blend A is slightly lesser than that of blend B due to the aforementioned reason. Similarly, comparing the T1P of blend B with that of blend A with 1 wt.% ExGr loading, the peak degradation temperature is increased in the former case. As mentioned before there will be more low molecular weight PMMA chains in the inter lamellar space of PVDF apart from PMMA chains coiling around graphite nanosheets. The low molecular weight PMMA wrapped graphite nanosheets act as a barrier for the heat transfer and hence the degradation temperature is increased to 382.09°C. With a further increase in ExGr loading to 2 wt.% there will be incomplete wrapping of PMMA chains resulting in fast transfer of heat as the number of graphite nanosheets is increased at that loading. Therefore, the peak main chain degradation temperature corresponding to PMMA decreased from 382.09°C to 380.29°C. Also, it should be noted that at 2 wt.% ExGr loading, the T1p is lesser than that of neat blend B suggesting fast heat transfer to the matrix.
The TGA plots corresponding to blend B and blend nanocomposites B along with DTG plots have been depicted in Figure 14(a) and enlarged TGA plots in the temperature range 350°C to 550°C are shown in Figure 14(b). (a)TGA/DTG plots of blend B and blend nanocomposites B (b) TGA plots of blend A and blend nanocomposite A between 330°C to 550°C.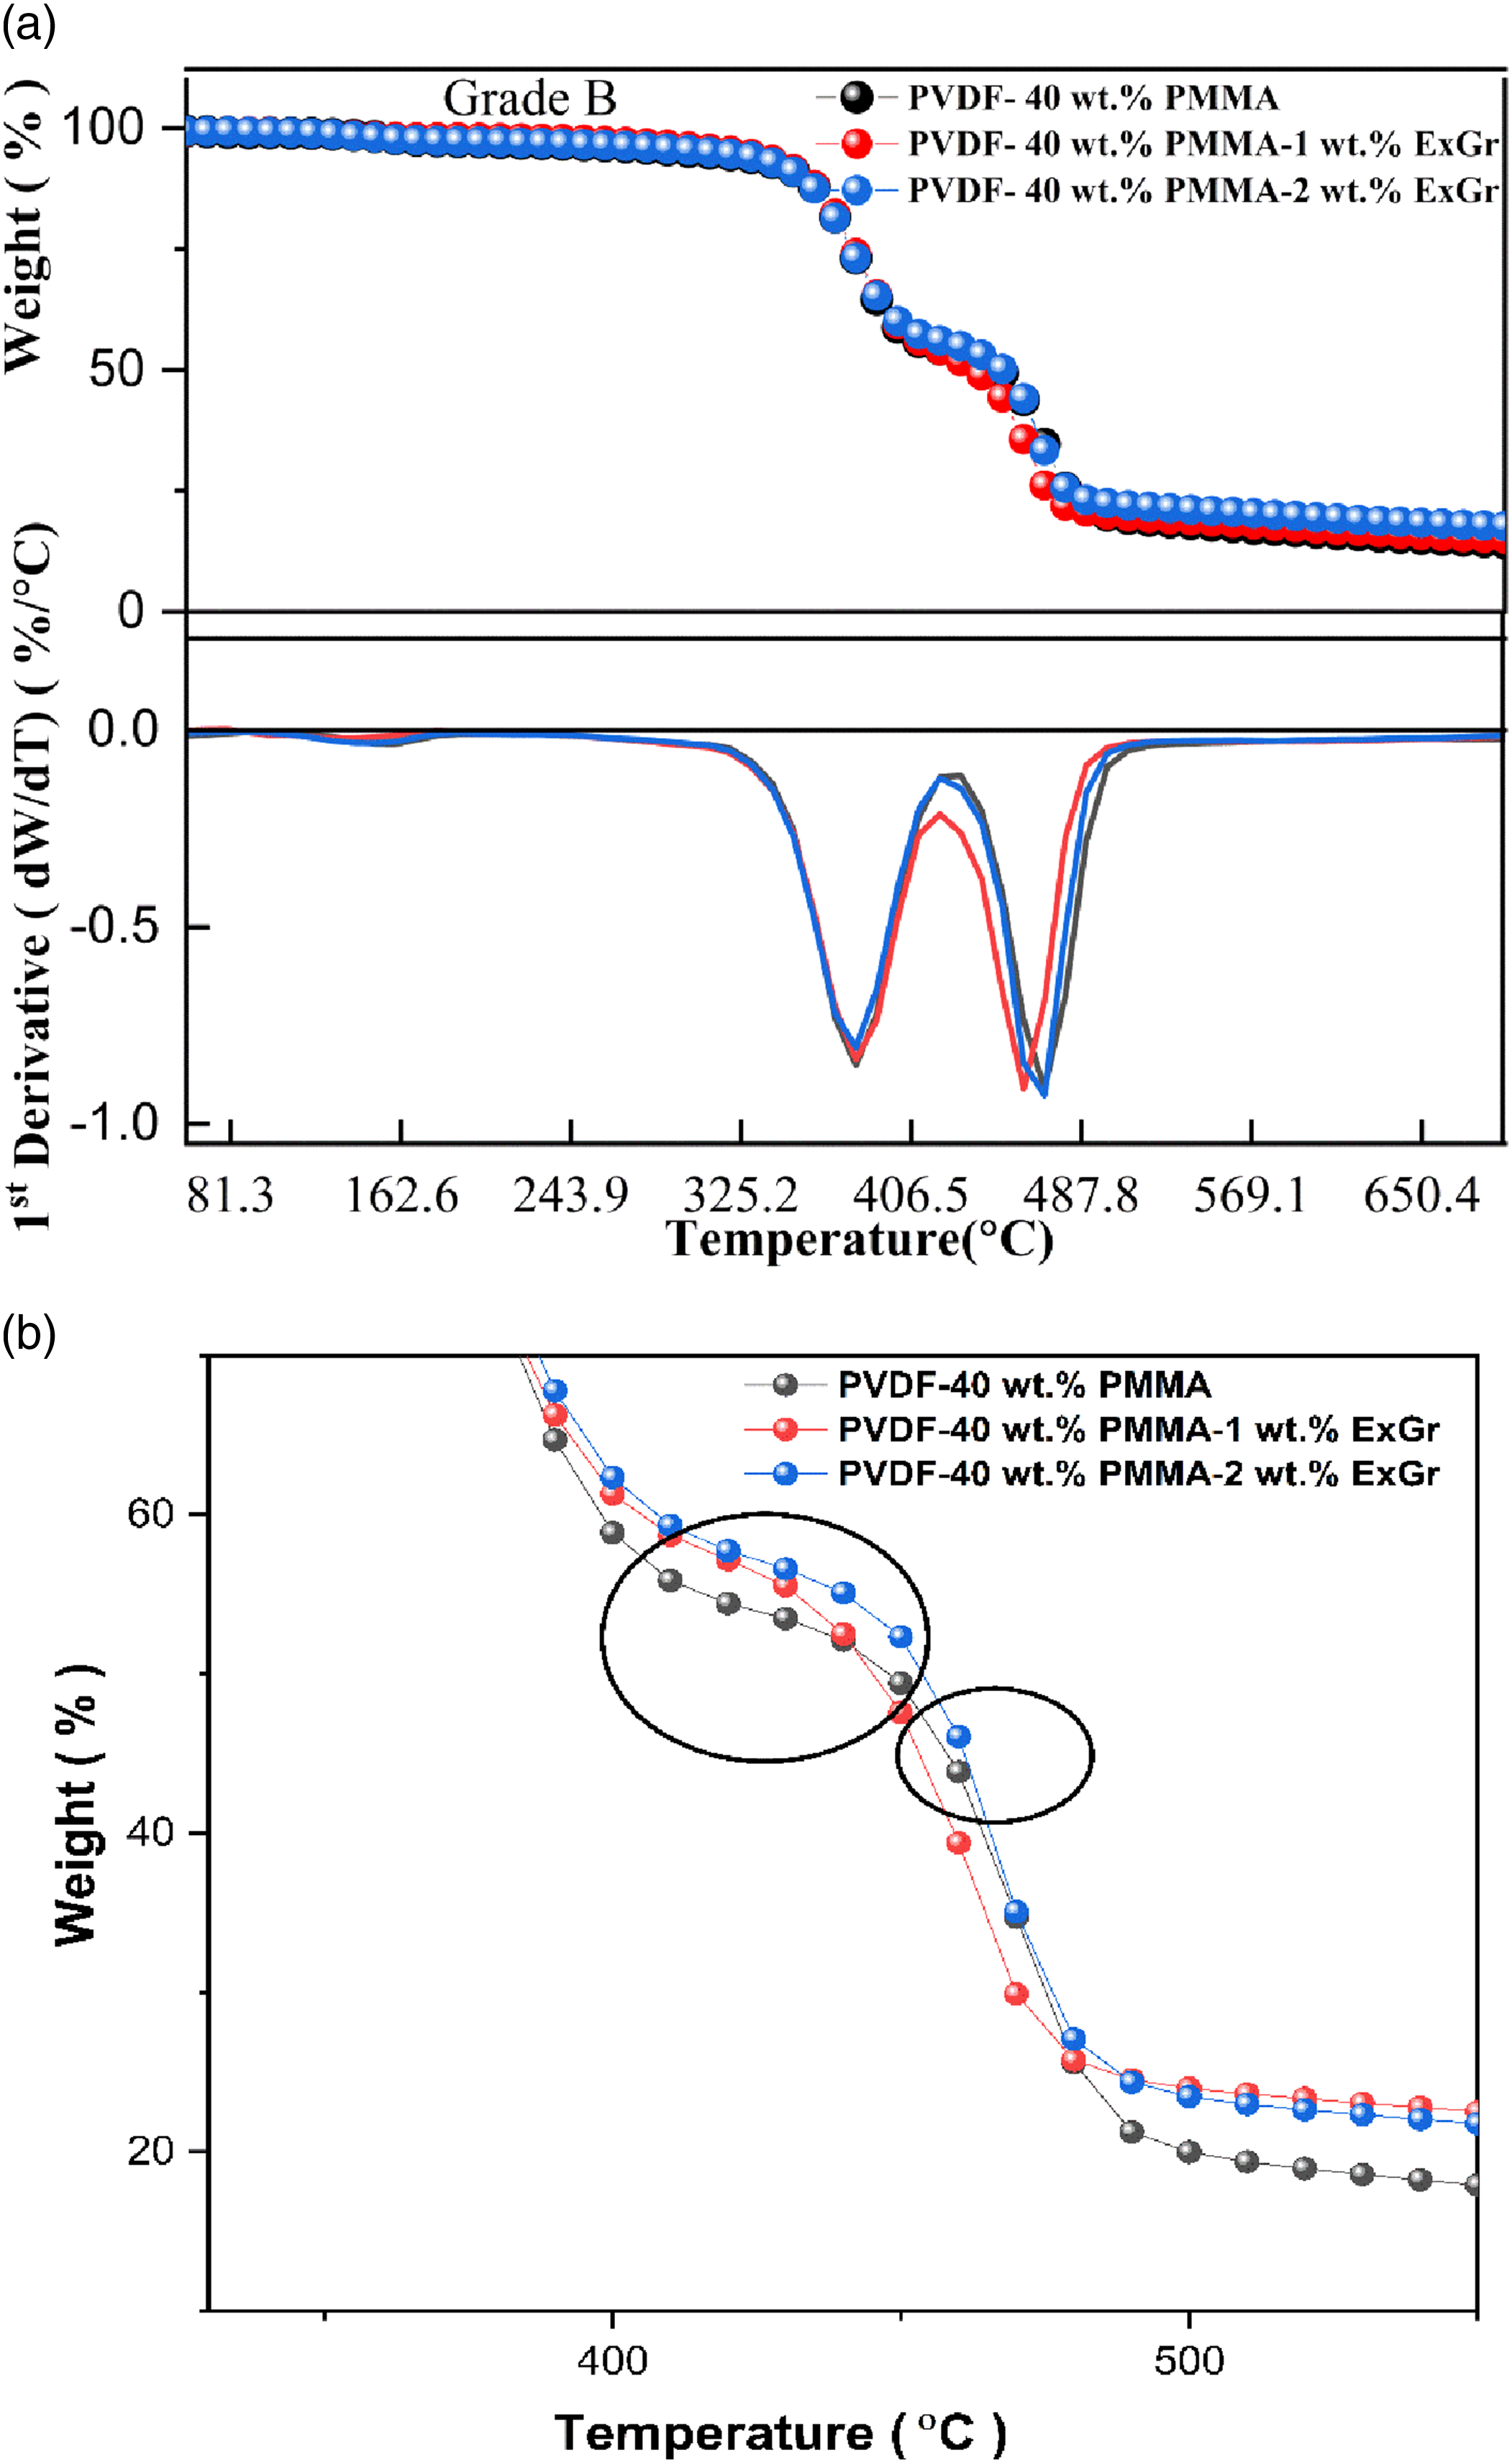
The main chain degradation temperature corresponding to PVDF decreases from 470.86°C in blend B to 461.89°C for 1 wt.% ExGr loaded blend B. Above 400°C, PMMA chains would have been completely degraded and the PVDF polymer chains can be spaced apart which causes the graphite nanosheets to be dispersed randomly causing a reduction in the degradation temperature. On the other hand, with 2 wt.% ExGr loaded blend B exhibits slightly higher main chain peak degradation temperature compared to 1 wt.% ExGr loaded blend B. Since at this loading, number of graphite nanosheets will be more in spite of the fact that after complete degradation of PMMA chains, though PVDF chains might be well apart, the graphite nanosheets will be much more randomly distributed resulting in local agglomeration blocking reasonably the heat transfer to the matrix. Hence T2p increases by 4°C for 2 wt.% ExGr loaded blend B when compared to that of 1 wt.% ExGr loaded blend B. It should be noted that T2P is not changed for 2 wt.% ExGr loaded blend A and blend B. However, the trends in the variation of main chain degradation temperature in ExGr loaded blend A and blend B are similar.
In Figure 14(b), the transition region from PMMA main chain degradation temperature to PVDF main chain degradation temperature is highlighted in circle. In the temperature region between 400°C to 430°C, blend B has lower thermal stability than blend nanocomposite B with 1 wt.% ExGr and 2 wt.% ExGr respectively. Between 450°C to 480°C, blend nanocomposite B with 1 wt.% ExGr has lower thermal stability followed by blend B and then blend nanocomposite B with 2 wt.% ExGr loading. This result proves the fact the with 1 wt.% ExGr loading in blend B, the dispersion is uniform compared to 2 wt.% ExGr loading in blend B so that heat transfer is faster. Thus, the degradation of main chain of PVDF is faster in blend B with 1 wt.% ExGr than neat blend B and blend nanocomposite B with 2 wt.% ExGr loading. Between 460°C to 480°C, blend nanocomposite B with 2 wt.% ExGr loading slightly degrades faster than blend B due to better heat transfer to the matrix. Also, at higher loading of graphite there will be agglomeration which results in lesser degradation in comparison to blend nanocomposite B with 1 wt.% ExGr. In the transition region, there is a switch over in thermal degradation effect which could be witnessed.
The TGA graphs of ExGr particles, low molecular weight PMMA and high molecular weight PMMA along with blend nanocomposite A with 1 wt.% ExGr loading are shown in Figure 15 below. It should be mentioned that the thermal degradation of low and high molecular weight PMMA is similar. There is weight loss in neat ExGr particles which could be due to volatile content as ExGr particles are synthesized by acid intercalation followed by microwave irradiation. However, the blend nanocomposite exhibits much better thermal stability compared to neat PMMA. The results clearly signify the effect of molecular weight of PMMA on the thermal stability of blend and blend nanocomposites. TGA graphs of expanded graphite, PMMA (both low molecular weight and high molecular weight) and blend nanocomposite with 1 wt.% ExGr.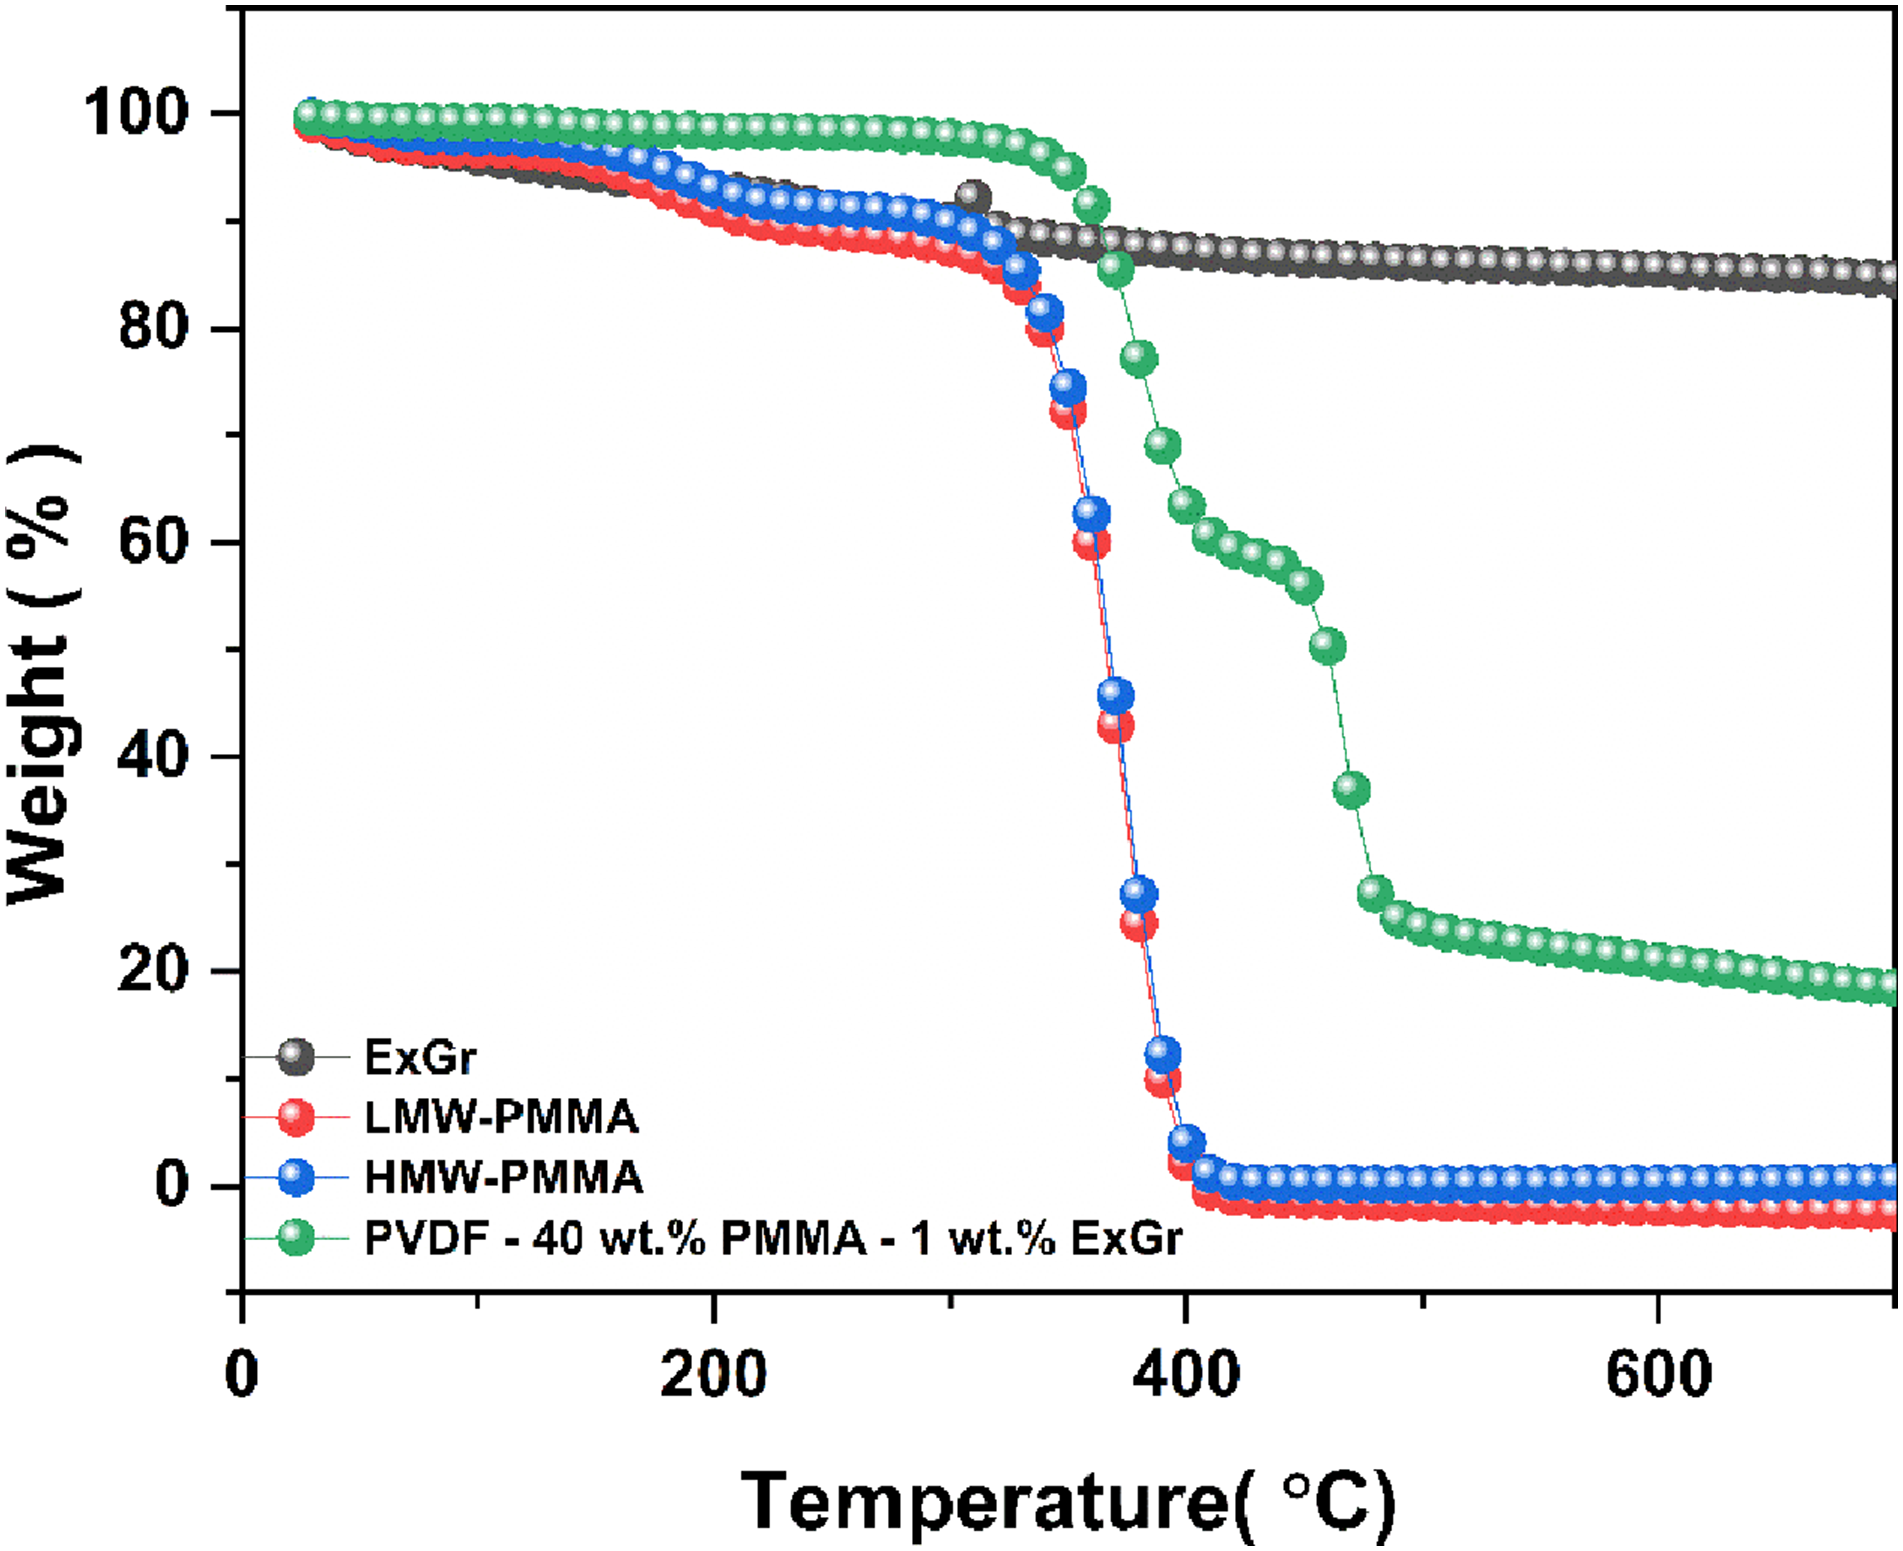
The char contents at three different temperatures i.e., 500°C, 600°C and 700°C are compared for blend A, blend B, blend nanocomposite A and blend nanocomposite B with variation in ExGr content as presented in Table 4 below. It can be clearly seen that the char contents at the above-mentioned temperatures for blend B are higher than that of blend A. The increase in char content very clearly proves the fact that the low molecular weight PMMA chains would not be completely rejected out of PVDF lamella, and those chains will have more interaction with PVDF chains. This fact is also reflected in the electroactive phase content variation in blend B in comparison to blend A. In the FTIR section, it has been convincingly proved that the electroactive gamma phase content is higher in blend B, and the percentage crystallinity is higher in blend B in comparison to blend A. The char content decreases with an increase in temperature in both the blends and blend nanocomposites. The char content is mainly attributed to hydrogen fluoride gas (HF) evolution due to which there is an unsaturation in the PVDF backbone that is difficult to degrade as reported elsewhere. 46 With 1 wt.% ExGr loading in blend A and blend B, at all temperatures the char content due to PVDF degradation is higher than that of neat blends. These results very clearly prove the fact that the dispersion is enhanced in the blend when 1 wt.% ExGr is incorporated. Though there can be quick heat transfer, the volatile content would not be easily escaped due to blocking effect provided by graphite nanosheets resulting in higher char content. With further increase of ExGr loading to 2 wt.%, the char content is reduced when compared to that of 1 wt.% ExGr loading due to the aforementioned agglomeration of graphite nanosheets so that the volatile content can be easily escaped when compared to that of 1 wt.% ExGr loading in the blend.
In short, the TGA analysis of bend and blend nanocomposites clearly proves the following facts. 1. Low molecular weight PMMA would not have been completely rejected from PVDF lamellae as the thermal stability is higher for blend B than blend A. This result supports both crystallinity and electroactive phase content in both the blends as corroborated by DSC and FTIR results. 2. The wrapping of PMMA chains on the graphite nanosheets is reflected in the main chain degradation temperature of PMMA. 3. Better thermal stability with respect to PMMA is observed in blend B and blend nanocomposites B. 4. Better thermal stability with respect to PVDF is observed in blend A and blend nanocomposite A where high molecular weight PMMA has been employed in comparison to blend B and blend nanocomposites B.
Wetting properties of solution blended poly(vinylidene fluoride)-poly(methyl methacrylate)-expanded graphite blend nanocomposites
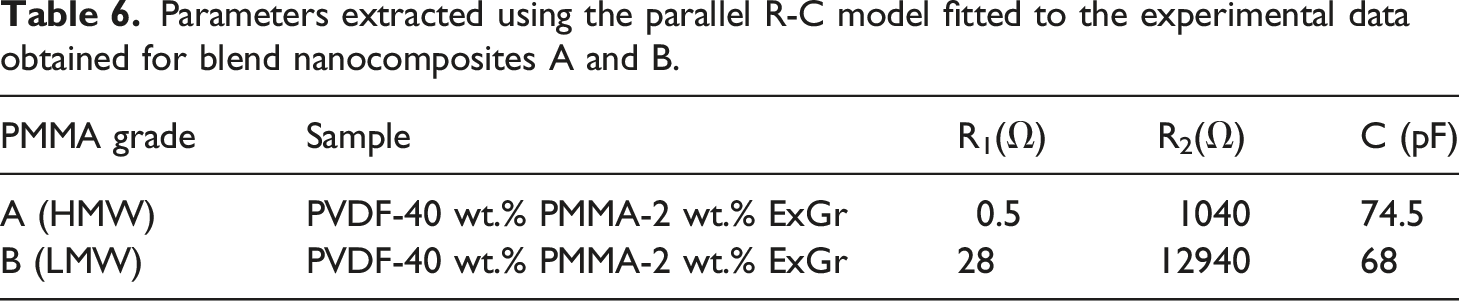
The digital images of water droplets on blend nanocomposite A and B are depicted in Figure 16(a)–(f) and the water contact angles of solution blended PVDF-40 wt.% PMMA-x wt.% ExGr (x = 0, 1, 2) blend nanocomposites have been summarized in Table 6. Digital pictures of water droplet on solution blended (a) PVDF-40 wt.%PMMA (PMMA grade A) (b) PVDF-40 wt.% PMMA-1wt.% ExGr (PMMA grade A) (c) PVDF-40 wt.% PMMA-2 wt.% ExGr (PMMA grade A) (d) PVDF-40 wt.% PMMA (PMMA grade B) (e) PVDF-40 wt.% PMMA-1 wt.% ExGr (PMMA grade B) (f) PVDF-40 wt.% PMMA-2 wt.% ExGr (PMMA grade B). Parameters extracted using the parallel R-C model fitted to the experimental data obtained for blend nanocomposites A and B.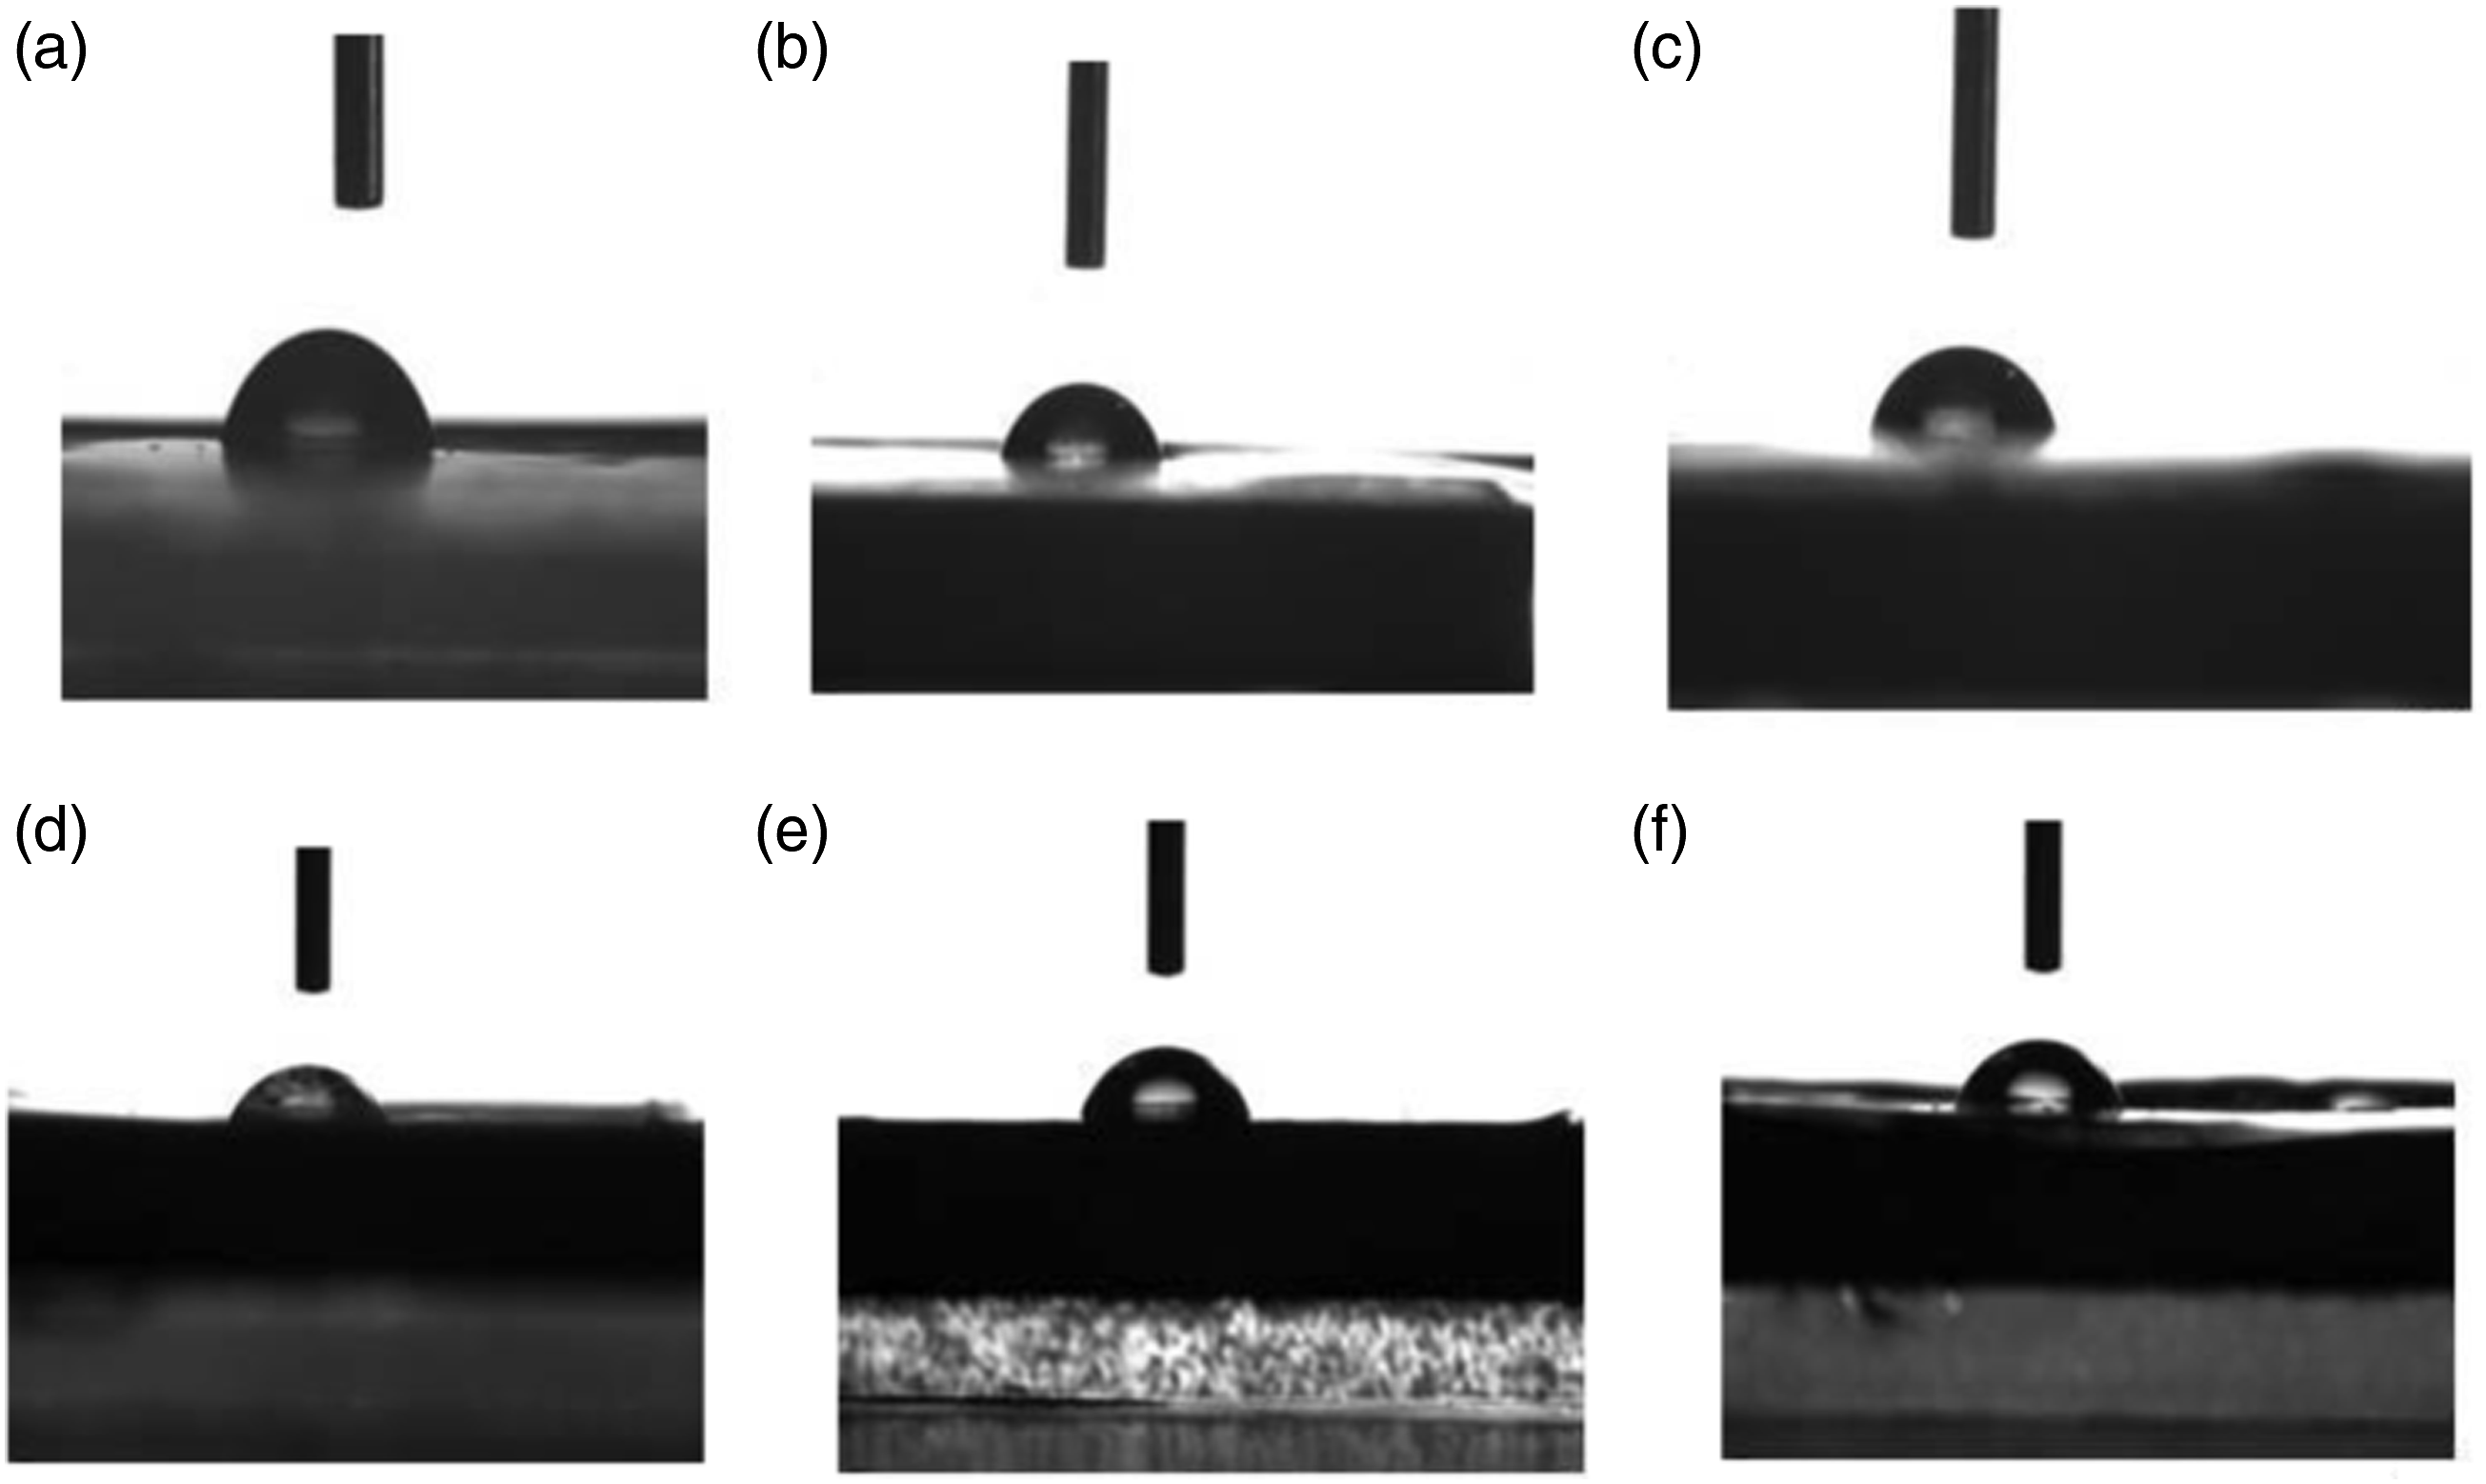
It can be seen that solvent cast PVDF- 40 wt.% PMMA blend exhibits a contact angle of 78.26° because of the presence of hydrophilic PMMA chains. Neat solution blended PVDF films under similar synthesis condition exhibit a WCA of around 134° as reported elsewhere. 46 The reduction in the WCA in blends in comparison to neat PVDF film is attributed to the hydrophilic character of PMMA. With the incorporation of 1 wt.% ExGr in blend A, the WCA increases to 81.82. With further increase in the loading of ExGr, the WCA increases to 83.96°. As already mentioned, PMMA coated graphite nanosheets when higher molecular weight PMMA is used results in surface roughness as evidenced in the FESEM analysis section. The interparticular distance between the composite filler decreases which results in an increase in the WCA. Since PMMA has been coated, the WCA value is less than 90°. Similar trend has been observed for blend nanocomposites B in which low molecular weight PMMA has been used. The WCA of blend A is higher than that of blend B. The reason could be attributed to the enhanced crystallinity and rejection of high molecular weight PMMA from the interlamellar spaces of PVDF compared to low molecular weight PMMA employed blend B. Also, on comparing the WCA of high molecular weight PMMA employed PVDF- 40 wt.% PMMA-ExGr with that of low molecular weight PMMA employed blend nanocomposite film, the WCAs of blend nanocomposites B have been observed to be lower than that of blend nanocomposites A. It should be mentioned that in FESEM section, more open structures are shown for blend nanocomposite B in comparison to blend nanocomposite A. The low molecular weight PMMA coiled graphite nanosheets are not uniformly distributed and hence the interparticular distance is higher in blend nanocomposite B when compared to that of blend nanocomposite A. It is because of this reason WCA is found to be lesser for low molecular weight PMMA employed PVDF-40 wt.% PMMA blend. The surface roughness of the blend nanocomposite is highly influenced by the presence of expanded graphite. 47 Hydrophobicity has been found to decrease with the decrease in molecular weight of PMMA while the incorporation of expanded graphite had the opposite effect due to the increase in surface roughness. 48 With increase in loading of ExGr in blend nanocomposites, the WCA has been observed to be increased. This is attributed to a decrease in the interparticle distance and increase in surface roughness. It should be mentioned that contact angle is related to surface phenomenon. Though 2 wt.% ExGr can result is local agglomeration, since more number of graphite nanosheets are present, the interparticular distance could have been reduced. In short, WCA of high molecular weight PMMA loaded blend and blend nanocomposites are higher than that of low molecular weight PMMA employed samples. The WCA values for different blend nanocomposites and the blends are depicted in Table 5.
Impedance analysis of poly(vinylidee fluoride)-40 wt.% poly(methyl methacrylate)-expanded graphite blend nanocomposites
Impedance analysis of conducting polymer composites enables one to calculate interjunction capacitance (C), series resistance (R1) between filler particles and the bulk resistance of the composite (Rp). In general CPCs can be modeled as a parallel combination of resistor (R2) and capacitor (C) as shown in Figure 17(a).
46
The conducting filler particles in insulating polymer matrix can be thought of as a parallel plate capacitor with a dielectric in between. When the loading of conducting filler particles is increased, the interparticle distance between the filler particles will be reduced and eventually the interjunction capacitance will increase. In order to understand the effect of molecular weight of PMMA on the dispersion characteristics of PMMA coated graphite nanosheets, impedance plots of representative samples namely PVDF- 40 wt.% PMMA- 2 wt.% ExGr blend nanocomposites in which both high and low molecular weight PMMA have been employed are shown in Figure 17(b) and (c) respectively. (a) Equivalent circuit model for conducting polymer composites, Nyquist plot and equivalent circuit fit of solution blended (b) PVDF- 40 wt.% PMMA-2 wt.% ExGr (PMMA grade A) (c) PVDF- 40 wt.% PMMA-2 wt.% ExGr (PMMA grade B).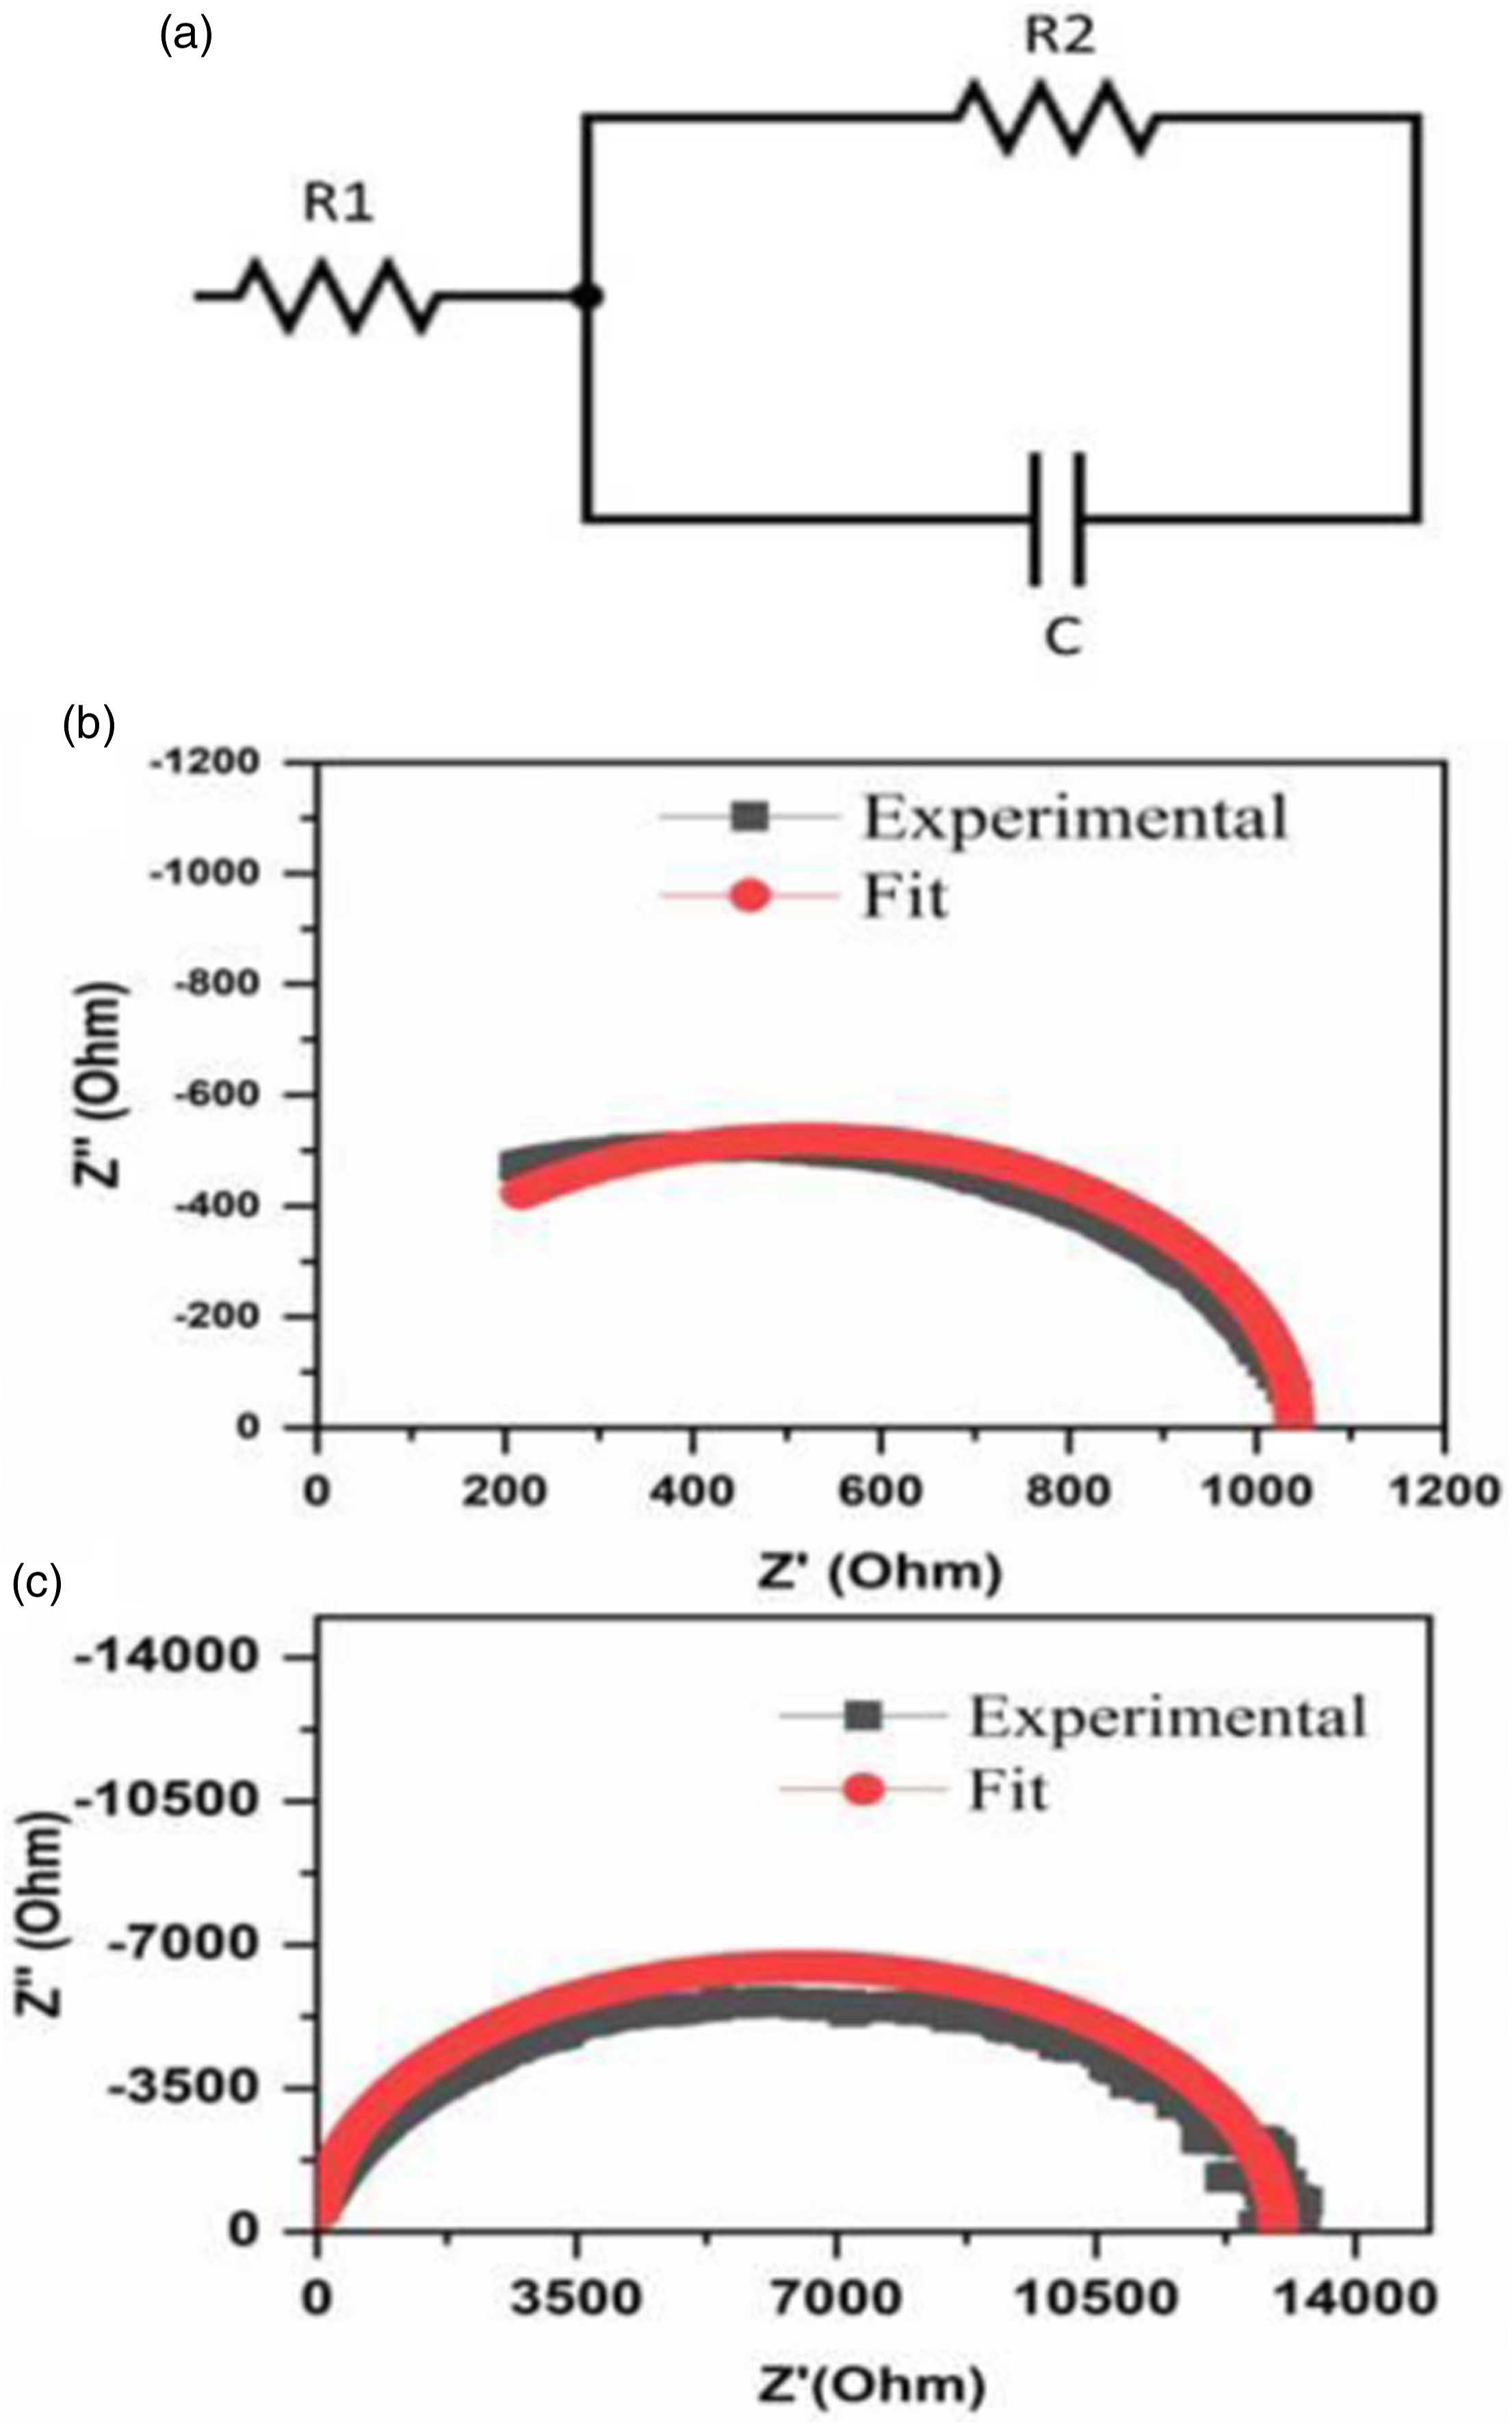
The Nyquist plots very clearly show that the diameter of the semicircle of blend nanocomposite A is lesser than that of blend nanocomposite B. This clearly suggests that the bulk resistance of blend nanocomposite A with 2 wt.% ExGr loading is lesser than that of the bulk resistance (R2) of blend nanocomposite B with the same loading of ExGr particles. As explained in the dc conductivity analysis, the high molecular weight PMMA coated graphite nanosheets form better network formation since the distribution of the composite filler is uniform in the PVDF matrix when compared to that of low molecular weight PMMA coated graphite nanosheets. This result also supports the model proposed earlier. It can be clearly seen from Table 6 that the interjunction capacitance in high molecular weight PMMA employed PVDF-40 wt.% PMMA- 2 wt.% ExGr blend nanocomposite is 74.5 pF which is higher than that of same blend in which low molecular weight PMMA has been used (68 pF). The original impedance plot and fit data according to parallel model for a representative sample namely 2 wt.% loaded ExGr in blend A and blend B are shown in Figure 17(b) and (c) respectively. Also, it should be mentioned that the series resistance (R1) decreases from 28 Ohm for low molecular weight PMMA employed blend nancocomposite with 2 wt.% ExGr loading to 0.5 Ohm for high molecular weight employed blend nanocomposite with the same loading of ExGr. Thus, the impedance analysis of blend nanocomposites supports the electrical conductivity data. The impedance data are fit using EIS spectrum analyser software using the equivalent circuit model depicted in Figure 17(a).49,50 It should be mentioned that though low frequency data points are bit scattered, the dc resistance value extracted from the impedance plot matches with the value obtained from the measurement using the electrometer model-2450 from Keithley Instruments. Further while fitting the data the capacitance is assumed to be a constant. However, the capacitance in principle depends on the frequency. This type of result has been published for HDPE-CB composites. 49
Conclusion
The effect of molecular weight of PMMA in solution blended PVDF- 40 wt.% PMMA-x wt.% ExGr (x-0,1,2) on the electrical conductivity, structure development, thermal and wetting properties has been thoroughly investigated. The DC electrical conductivity analysis proves the fact that high molecular weight PMMA employed blend nanocomposites (blend nanocomposite A) exhibit higher electrical conductivity due to enhanced dispersion of graphite nanosheets in the blend matrix. FESEM analysis proves the formation of graphite nanosheets after probe sonication of expanded graphite and also enhanced dispersion of PMMA coated graphite nanosheets in blend A in comparison to blend B. The enhanced dispersion of graphite nanosheets in blend A has been proved through optical microscope analysis as well. The formation of electroactive gamma phase of PVDF in both blend and blend nanocomposites has been convincingly proved through XRD, FTIR and DSC analyses. The electroactive phase is increased in blend nanocomposite B than blend nanocomposite A due to the trapping of low molecular weight PMMA chains in the inter lamellae of PVDF chains. The electroactive gamma phase slightly increases to 84.3% in 1 wt.% ExGr loaded blend A from 83% for neat blend A. With 2 wt.% ExGr loading in blend A, the electroactive phase content sharply decreases to 74.5%. Similarly, the electroactive gamma phase content in blend B with 1 wt.% ExGr is increased to 92.5% from 91.6% for blend B. With further increase in ExGr loading to 2 wt.% in blend B does not significantly increase the electroactive gamma phase (93%). The FTIR analysis clearly supports the fact that low molecular weight PMMA employed blend and blend nanocomposite result in enhanced electroactive gamma phase in comparison to high molecular weight PMMA employed blend nanocomposites. The compositional dependence of the electroactive phase with respect to ExGr loading is attributed to exclusion of PMMA from the inter lamellar region of PVDF chains. The DSC analysis very clearly proves the coexistence of electroactive gamma and non-polar alpha phases in the blend and blend nanocomposites. TGA analysis reveals enhanced thermal stability of blend nanocomposite A above 500°C in which 1 wt.% ExGr is incorporated. The water contact angle analysis (WCA) of blends and blend nanocomposites proves an increase in the contact angle with ExGr incorporation. The WCA values suggest that the blends and blend nanocomposites exhibit hydrophilic behavior as the contact angle is less than 90°. This is mainly attributed to the hydrophilic nature of PMMA. With ExGr loading in blend A and blend B, the WCA value increases which can be understood through an increase in surface roughness. The improvement in electroactive phases of PVDF for the blend nanocomposites with PVDF and with low molecular PMMA will have implications for energy conversions through piezoelectric or triboelectric effects. Hence, this study will promote further investigations on optimizing the blend nanocomposites based on an electroactive polymer, a commodity polymer and conducting nanoparticles, for potential energy harvesting, and self-powered sensor applications.
Footnotes
Acknowledgements
The authors are grateful to Dr M. Sivakumar, Department of Physics, Amrita School of Physical Sciences Coimbatore, India for extending his lab facilities, which were important for the completion of this work. The authors also extend their gratitude to Mr Senthil kumar, COE AMGT, Amrita Vishwa Vidyapeetham, Coimbatore for technical assistance related to FESEM of samples examined in this work.
Declaration of conflicting interests
The author(s) declared no potential conflicts of interest with respect to the research, authorship, and/or publication of this article.
Funding
The author(s) disclosed receipt of the following financial support for the research, authorship, and/or publication of this article: This work was supported by the Amrita Vishwa Vidyapeetham.