
Abstract
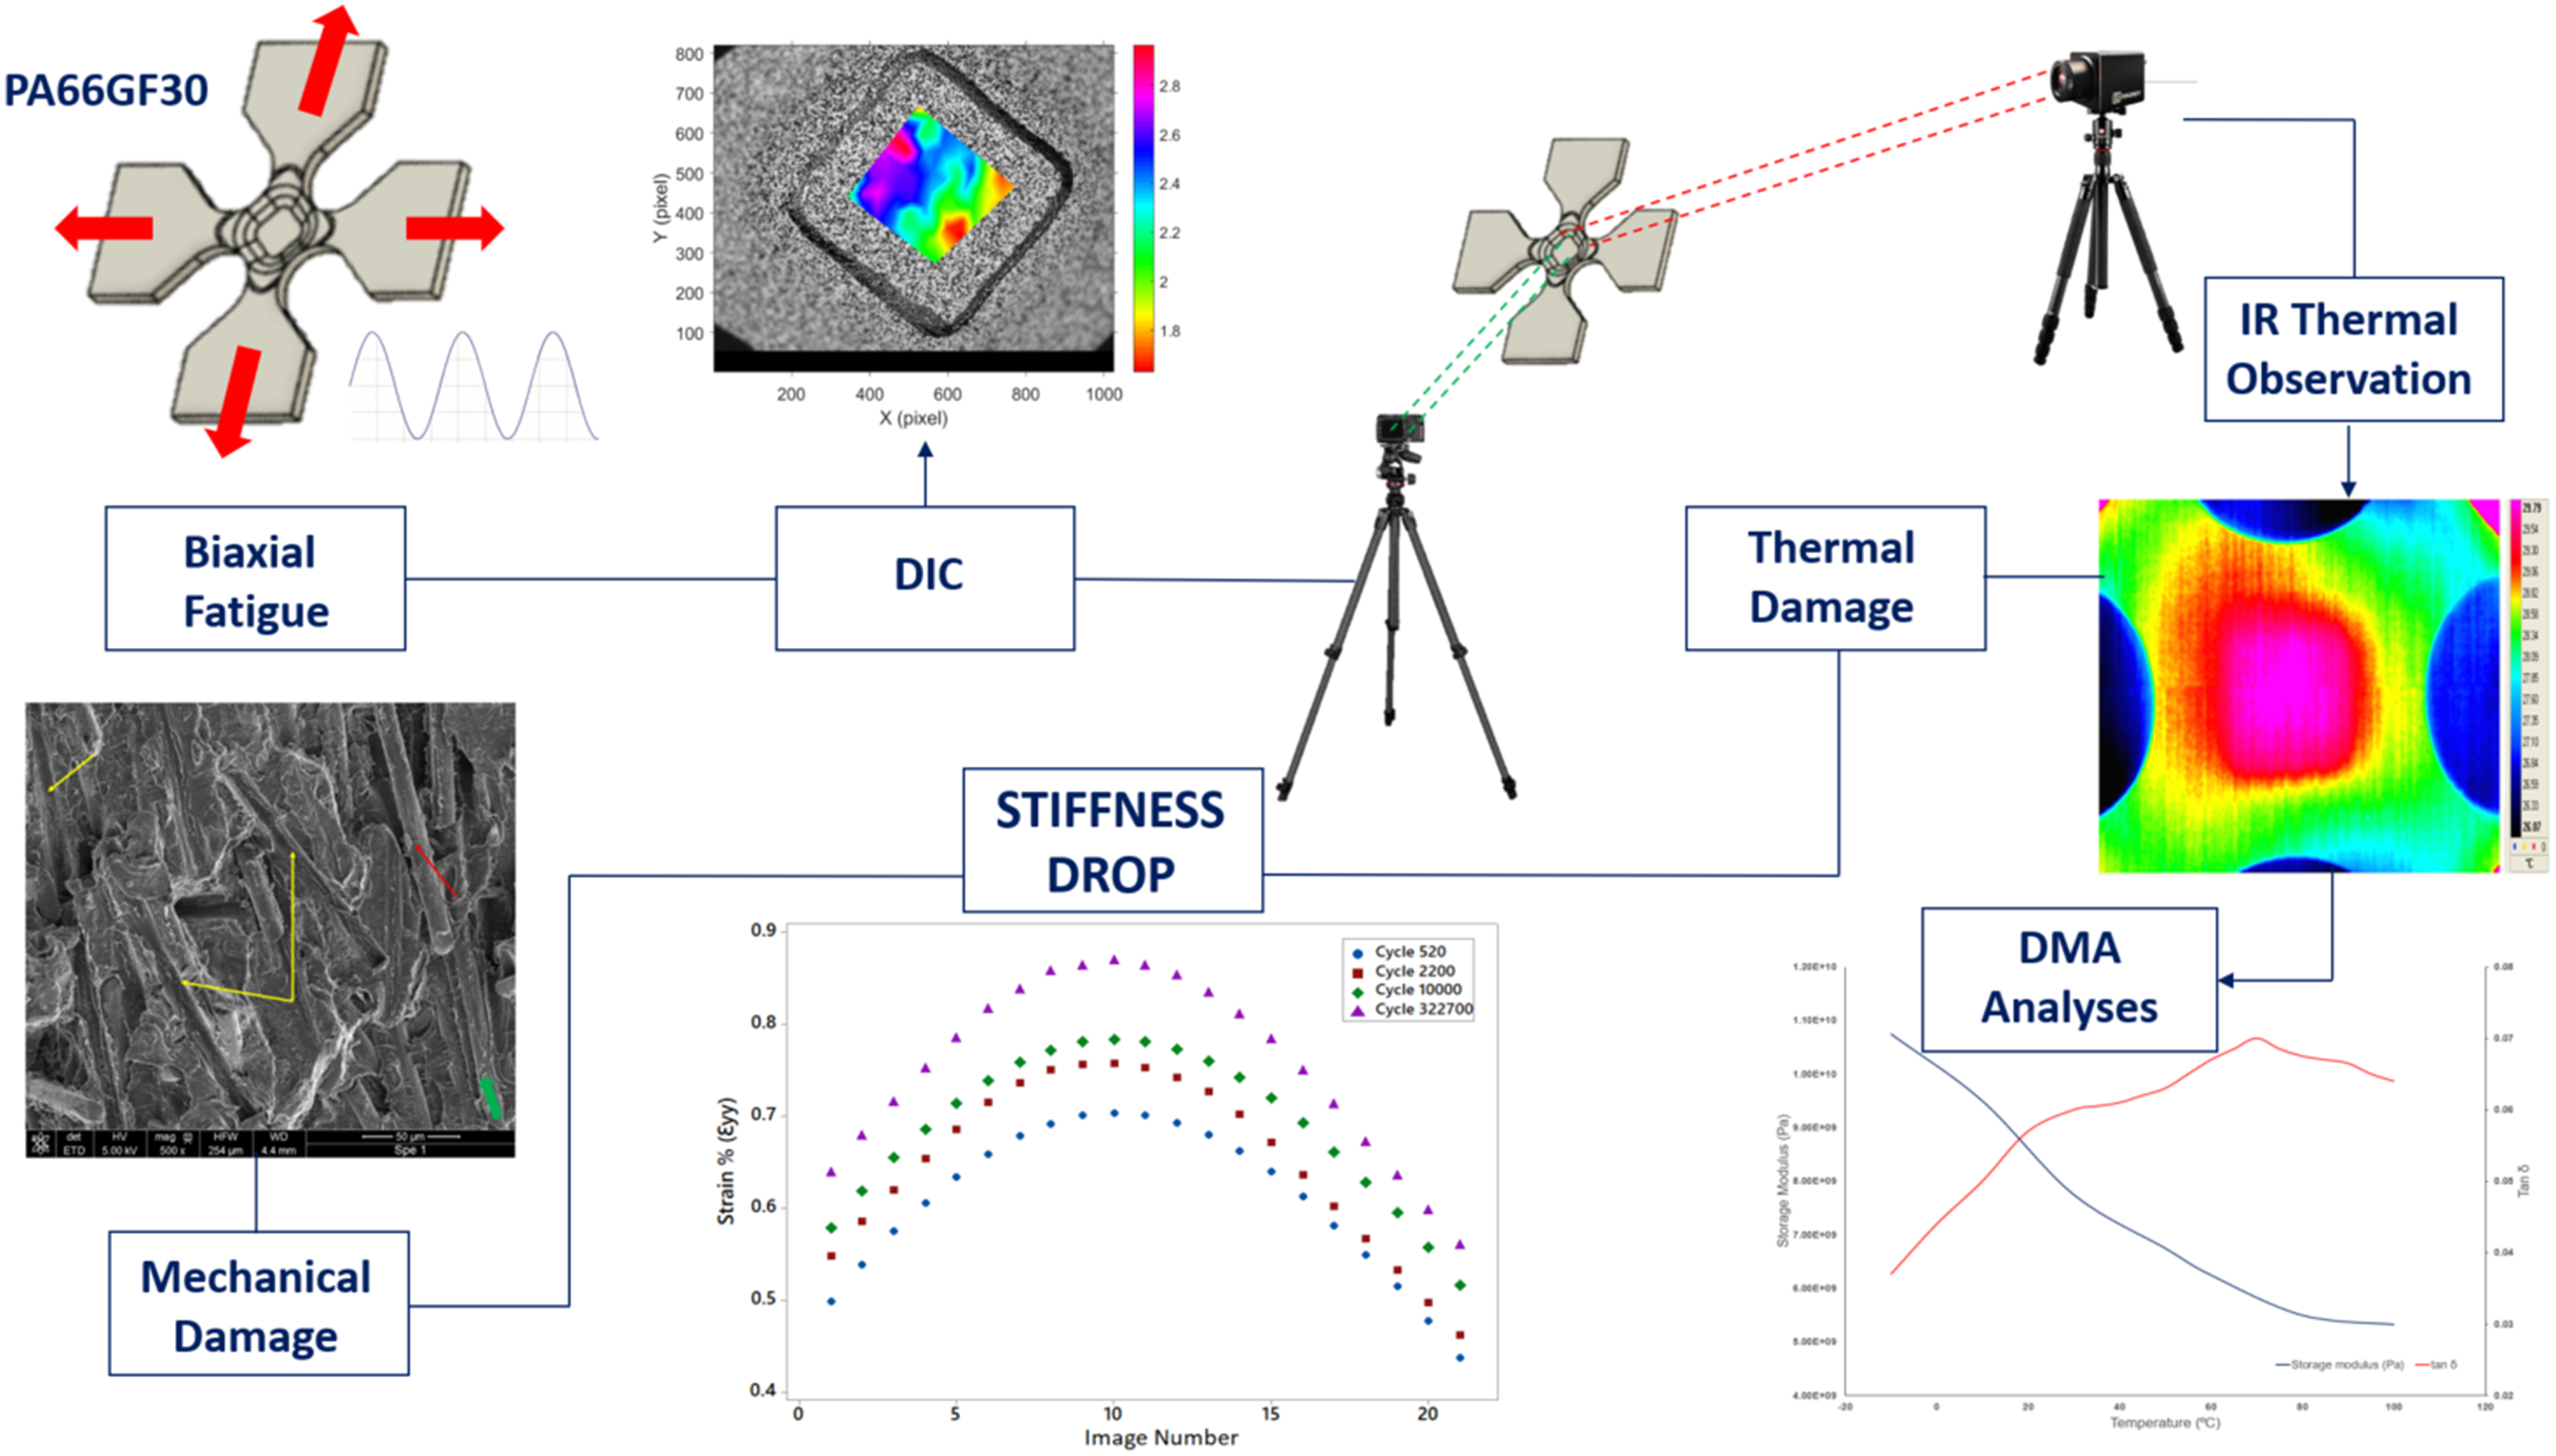
In the automotive industry, short glass fiber-reinforced thermoplastics are widely used under the hood and subjected to dynamic vibrations of the engine in multiple directions resulting in fatigue failure. Under fatigue loading, a significant portion of the strain energy is stored within the material, while the remaining portion is lost due to internal frictions and the damage occurrence. Internal friction results in heat generation, which in turn causes an increase in external temperature. This increase in temperature leads to thermal degradation of the polymer. Investigations on the cause of the stiffness drop are not widely available in the literature. Therefore, this study explores the source of the stiffness drop under biaxial fatigue loading of a polyamide 6,6 reinforced with 30 wt. % short glass fibers (PA66GF30) and distinguishes the contributions of thermal degradation and damage accumulation. The thermal evolution of the specimens was captured by means of thermography. In addition, the digital image correlation (DIC) technique was used to measure the in situ strain field during the fatigue. Despite the temperature stabilization being observed around the 10,000th cycle, the reduction in the stiffness continued until failure which was attributed to the mechanical damage accumulation and cyclic creep during the fatigue tests. Dynamic mechanical analyses (DMA) were carried out to quantify the stiffness drop with the varying temperature. From the results, it is seen that the damage accumulation and cyclic creep during the fatigue tests were responsible for the major part of the stiffness drop. Finally, scanning electron microscopy (SEM) inspection of the fracture surface was performed to identify fatigue damage mechanisms. Four unique features associated with the fatigue damage were identified: (1) debonding of fibers from the matrix, (2) polymer matrix crazing, and (3) cavitation and porosities, (4) pull out fiber ends and break on the fiber.
Introduction
Global warming is a major problem of our era and CO2 emission is one of the most well-known causes of this problem. Combustion of fossil fuels to generate power in conventional vehicles causes CO2 emissions. In these vehicles, in order to decrease CO2 emissions, lightweighting is a common practice implemented in all potential components. Thanks to the prominent advances in the material world, light but robust materials, including reinforced polymers, are replacing conventional steels as well as non-ferrous alloys.
Short fiber reinforced thermoplastics (SFT) are widely used in the automotive industry in comparison to thermoset matrix composites, because of their ease of manufacturing by injection molding adapted to assembly-line production (more than 100 000 parts per year). 1 A favorable weight/performance ratio is also an important characteristic of reinforced thermoplastics, which makes possible the replacement of light metal alloy parts, including aluminum, with SFTs.2,3 This brings many benefits such as the ability to inject complex geometries, the integration of many functions into a single part, and an increase in the longevity of molds.4,5
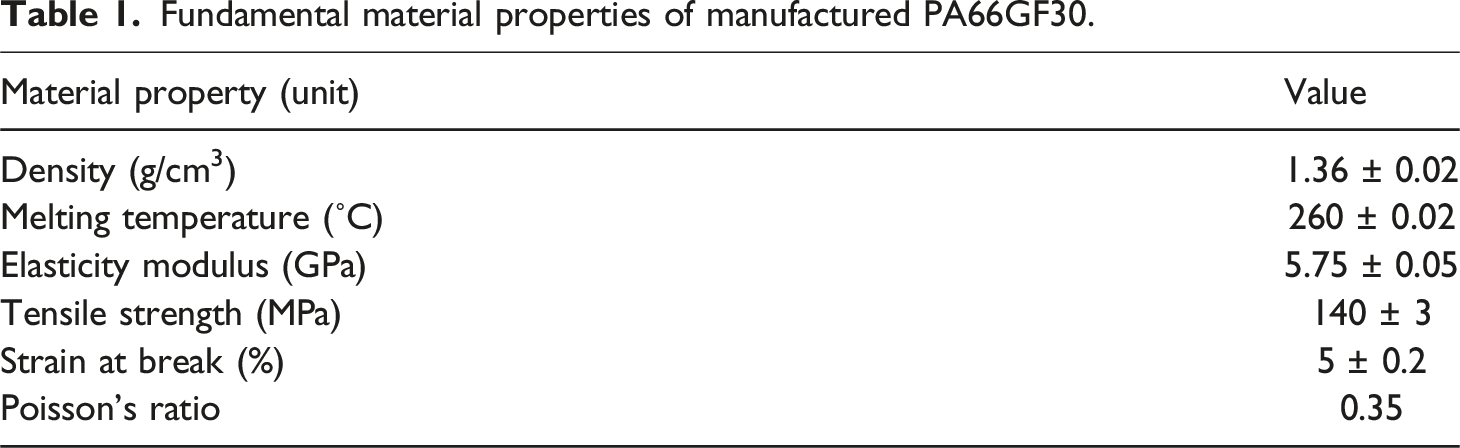
Reinforced thermoplastics were initially used for the design of non-structural parts such as interior trim parts or console modules. However, today they are used to replace structural parts subjected to high mechanical and thermal stress under the hood, including anti-vibration engine mounts or air intake manifold brackets.6,7 For these applications, polyamide 6,6 (PA6,6) reinforced with 30% by weight short glass fibers (PA66GF30) is a prime candidate. Together with a fraction of short glass fibers, the fatigue-resistant and easy-to-inject polyamide matrix represents a reinforced thermoplastic material with promising mechanical properties at a density of only 1.37 g/cm3. 8
Components made of glass fiber reinforced PA66 under the hood of an automobile are subjected to cyclic loads due to engine and road conditions. These cyclic loads oblige the designers to consider fatigue behavior of the material. Besides, these fiber reinforced components are manufactured by the injection molding process, and as a consequence, the mechanical properties of this material remain highly heterogeneous and anisotropic.9–11 Due to the irregularities observed in the fiber distribution as well as the multiaxial nature of the loads, stress-based fatigue criteria can result in inaccurate results. Therefore, strain energy-based approaches are more preferred in the fatigue lifetime studies.12–14 In this respect, Klimkeit et al. studied the multiaxial fatigue behavior of PA66GF35 using tubular specimens subjected to tension and torsion and they evaluated the fatigue damage in terms of three different criteria namely principal stress criterion, von Mises criterion and energetic criterion. In the stress-based criteria, strong influence of load ratio, fiber orientation and triaxiality was observed. On the other hand, the energetic criterion provides a good fit to the fatigue damage which is governed by the strain energy. 15 However, the researchers pointed out certain inconveniences with the tubular specimens such as difficulties in the alignment of the specimen during the tests, geometrical changes of the tubes during the tests and elastic instabilities under circumferential, axial and torsional loadings. In another research, Jegou et al. investigated the heat build-up of PA66GF50 using a single uniaxial test specimen and they plot the life time curve using an energetic approach. They indicated a good consistency between energy-based life time curve and the classical stress based Wöhler curve. However, they underlined the necessity of performing more tests to investigate the influence of other fatigue influencing parameters including orientation of fibers, fiber length distribution and load ratio. 16 Nouri et al., developed an fatigue damage model for injection molded glass fiber reinforced composites. In their model, the effect of material softening under cyclic loading due to damage was considered. Evolution of the damage was established with this model as a function of the associated thermodynamic dual forces. 17 Benaarbia et al. focused on the thermographic analysis of 30 wt. % short E-glass reinforced PA66 under fatigue loading. They reported an anisotropic elasticity because of the fiber orientation and observed a cyclic strain accumulation despite the absence of elastic and inelastic shakedown. The energy content of hysteresis loops was demonstrated to be primarily derived from stored and dissipated energies from a thermodynamic perspective.18,19 Similarly, according to Robert et al., there is a close relationship between the fatigue load ratio and the temperature levels on specimen surface. 20 Pearson et al. examined the variation of mechanical properties of glass fiber reinforced PA66 by temperature increase using dynamic mechanical analysis (DMA). In their study, they reported that glass fibers hinder the polymer chain mobility leading to material behave stiffer and this reduces the loss factor of the material. Thereby, higher volumes of reinforced glass fibers have an inverse correlation with the loss factor of the composite material. 21 Crupi et al. worked on the damage analysis of injection molded PA66GF35 using digital image correlation (DIC). In their study, they emphasized the utility of DIC in the microstructural investigation. From the DIC analysis, they identified the sensitive areas of the matrix as the fiber - matrix interface. In addition, they observed that most deformed area shown in the DIC images were generally corresponding to the point where specimen breaks. 22 Meraghni et al. examined the fatigue damage of PA6GF30 using digital image correlation and compared the damage model with fatigue tests and damage model predictions. From DIC analysis they showed the contribution of shear damage and a good agreement between models and tests were demonstrated. 23 Likewise, in the work of Benaarbia et al., in-plane heterogeneities were detected from DIC analysis. 24 In these reviewed studies, general trend is to propose a lifetime criterion for the tested materials and to use image processing techniques to track damage development. However, to the best of the author’s knowledge, an in-depth analysis of the stiffness drop of PA66GF30 under bi-axial cyclic loading is not reported in the literature. Therefore, the main objective of this manuscript was devoted to the investigation of the stiffness drop associated to the damage accumulation and thermal degradation and its analysis using an infrared (IR) camera-assisted thermal examination as well as DMA tests. Observation of the stiffness change using a combined method with DIC, IR camera, and DMA analysis constitutes the original part of this study.
In the framework of the thermal examination, self-heating effect due to the hysteresis can lead to a reduction in the matrix stiffness, since the temperature increase leads to an enhanced apparent ductility of the polymer and significantly reduces the service life of the composite. 25 In addition, creep causes to the strain change under cyclic loading. Hence, the observation of the strain field over the critical zone during the fatigue test to check the stiffness change has paramount importance. Accordingly, a high-speed camera assisted digital image correlation (DIC) analysis was performed to comprehend the nature of the deformation over the critical zone. In addition, the reduction of the stiffness is also associated with the damage accumulation during fatigue tests. Then, to distinguish those effects, DMA can be useful to focus on the temperature effect. From the DMA investigation, the change in the storage modulus of the tested material while increasing the temperature can be used to investigate the effect of self-heating during fatigue tests regarding the ductility increase.
Last but not least, the mechanical performance of the composites is directly related to the microstructure. The interface quality between fibers and matrix, the distribution of the fibers along the matrix, and manufacturing related problems have apparent indicators in the microstructure. Observation of the fracture surfaces after fatigue failure can give important insights into the damage mechanisms in the composites. In fiber-reinforced polymers, debonding of fibers from the matrix, polymer matrix yielding, cavitation and porosities, and break on the fibers are widely observed by different researchers.26–28 Therefore, SEM fractography was done to observe damage mechanisms seen in the tested composites.
The principal objectives of this study were: (i) the investigation of the thermal evolution in the critical zone under the fatigue of PA66GF30 under equi-biaxial cyclic loading (ii) the determination of the strain field of the critical damage zone by means of DIC and associating with self-heating phenomenon (iii) the investigation of the stiffness change due to temperature increase via DMA (iv) the identification of the fatigue damage mechanisms through SEM fractography. In this manuscript, the theoretical background is briefly given to demonstrate the source of the temperature increase (self-heating) during fatigue loading. After the description of the experimental tools and methods to perform the tests, the results of the tests are discussed in detail. From the findings, several conclusions are finally drawn, as well as some proposals for future studies.
Theoretical background
During fatigue loading, two different mechanisms, mechanical and thermal, simultaneously affect the results. The first is the initiation and accumulation of damage within the material during cyclic testing, and the second is the increase in temperature due to heat dissipation during testing. Both of these mechanisms result in degradation of material properties during fatigue testing.
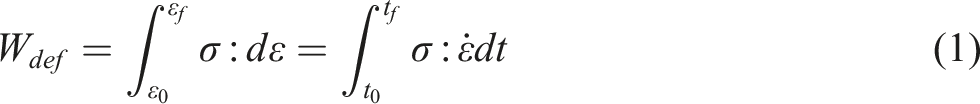
Under deformation, the energy stored by polymers is the total strain energy density, W
def
. In the case of quasi-static loading, this energy is equivalent to the work done by the external forces applied to the volume of material to deform it.18,29 W
def
can be expressed as the time integral of the stress (σ) and strain rate tensors (

Furthermore, W
in
can be composed of multiple contributors. Two major contributors are the internally (W
s
) and externally (W
d
) dissipated inelastic energies such that

Over a full cycle, the balance on the elastic energy is zero. Thus, the total strain energy density and the inelastic strain energy density are equal to each other

Experimental procedure
Material
Fundamental material properties of manufactured PA66GF30.
The PA66GF30 plates procured from Movimento Plastics were manufactured by the injection molding process and during the injection, the molten polymer has a particular field of flow velocities leading to a characteristic structure in the thickness. This structure is generally called the “core-skin” structure and a high anisotropy occurs in the internal structure.32–34 Microtomography analysis was carried out by the manufacturer and according to the supplier’s report the measured core thickness was 255 μm, which accounts for only 5.1% of the 5 mm plate thickness. The surface layer, characterized by fibers with irregular orientations, does not exceed a thickness of 75 μm which is consistent with the literature, a major part of the fibers is aligned in the flow direction and this presumption was considered during the study.
35
In addition, due to the turbulence phenomenon and discrete flow velocity distribution at the extremities of the plate (plate dimensions: 5 × 120 × 360 mm) during injection molding, heterogeneities in the fiber distribution can be observed. Therefore, a zone of interest seen in Figure 1(a) is defined and cruciform biaxial fatigue test specimens were extracted by water jet cutting from this zone of interest. Depending on the specimen cutting direction in Figure 1(a), fiber alignment is favored on one of the axes of the test specimen. In the axis-y shown in Figure 1(b), fiber alignment is considered parallel to the y-axis of the specimen, in the x-axis, fiber alignment is considered transversal to the x-axis of the specimen.
36
In addition, supplementary machining was conducted in the zone of interest (ZOI) as indicated with the dashed square in Figure 1(b) to localize the damage in a specific zone. As a result, the thickness of ZOI became 0.5 mm. (a) PA66GF30 plates fabricated by injection molding, depicting how test specimens are cut out from the plates. (b) Cruciform biaxial test specimen geometry.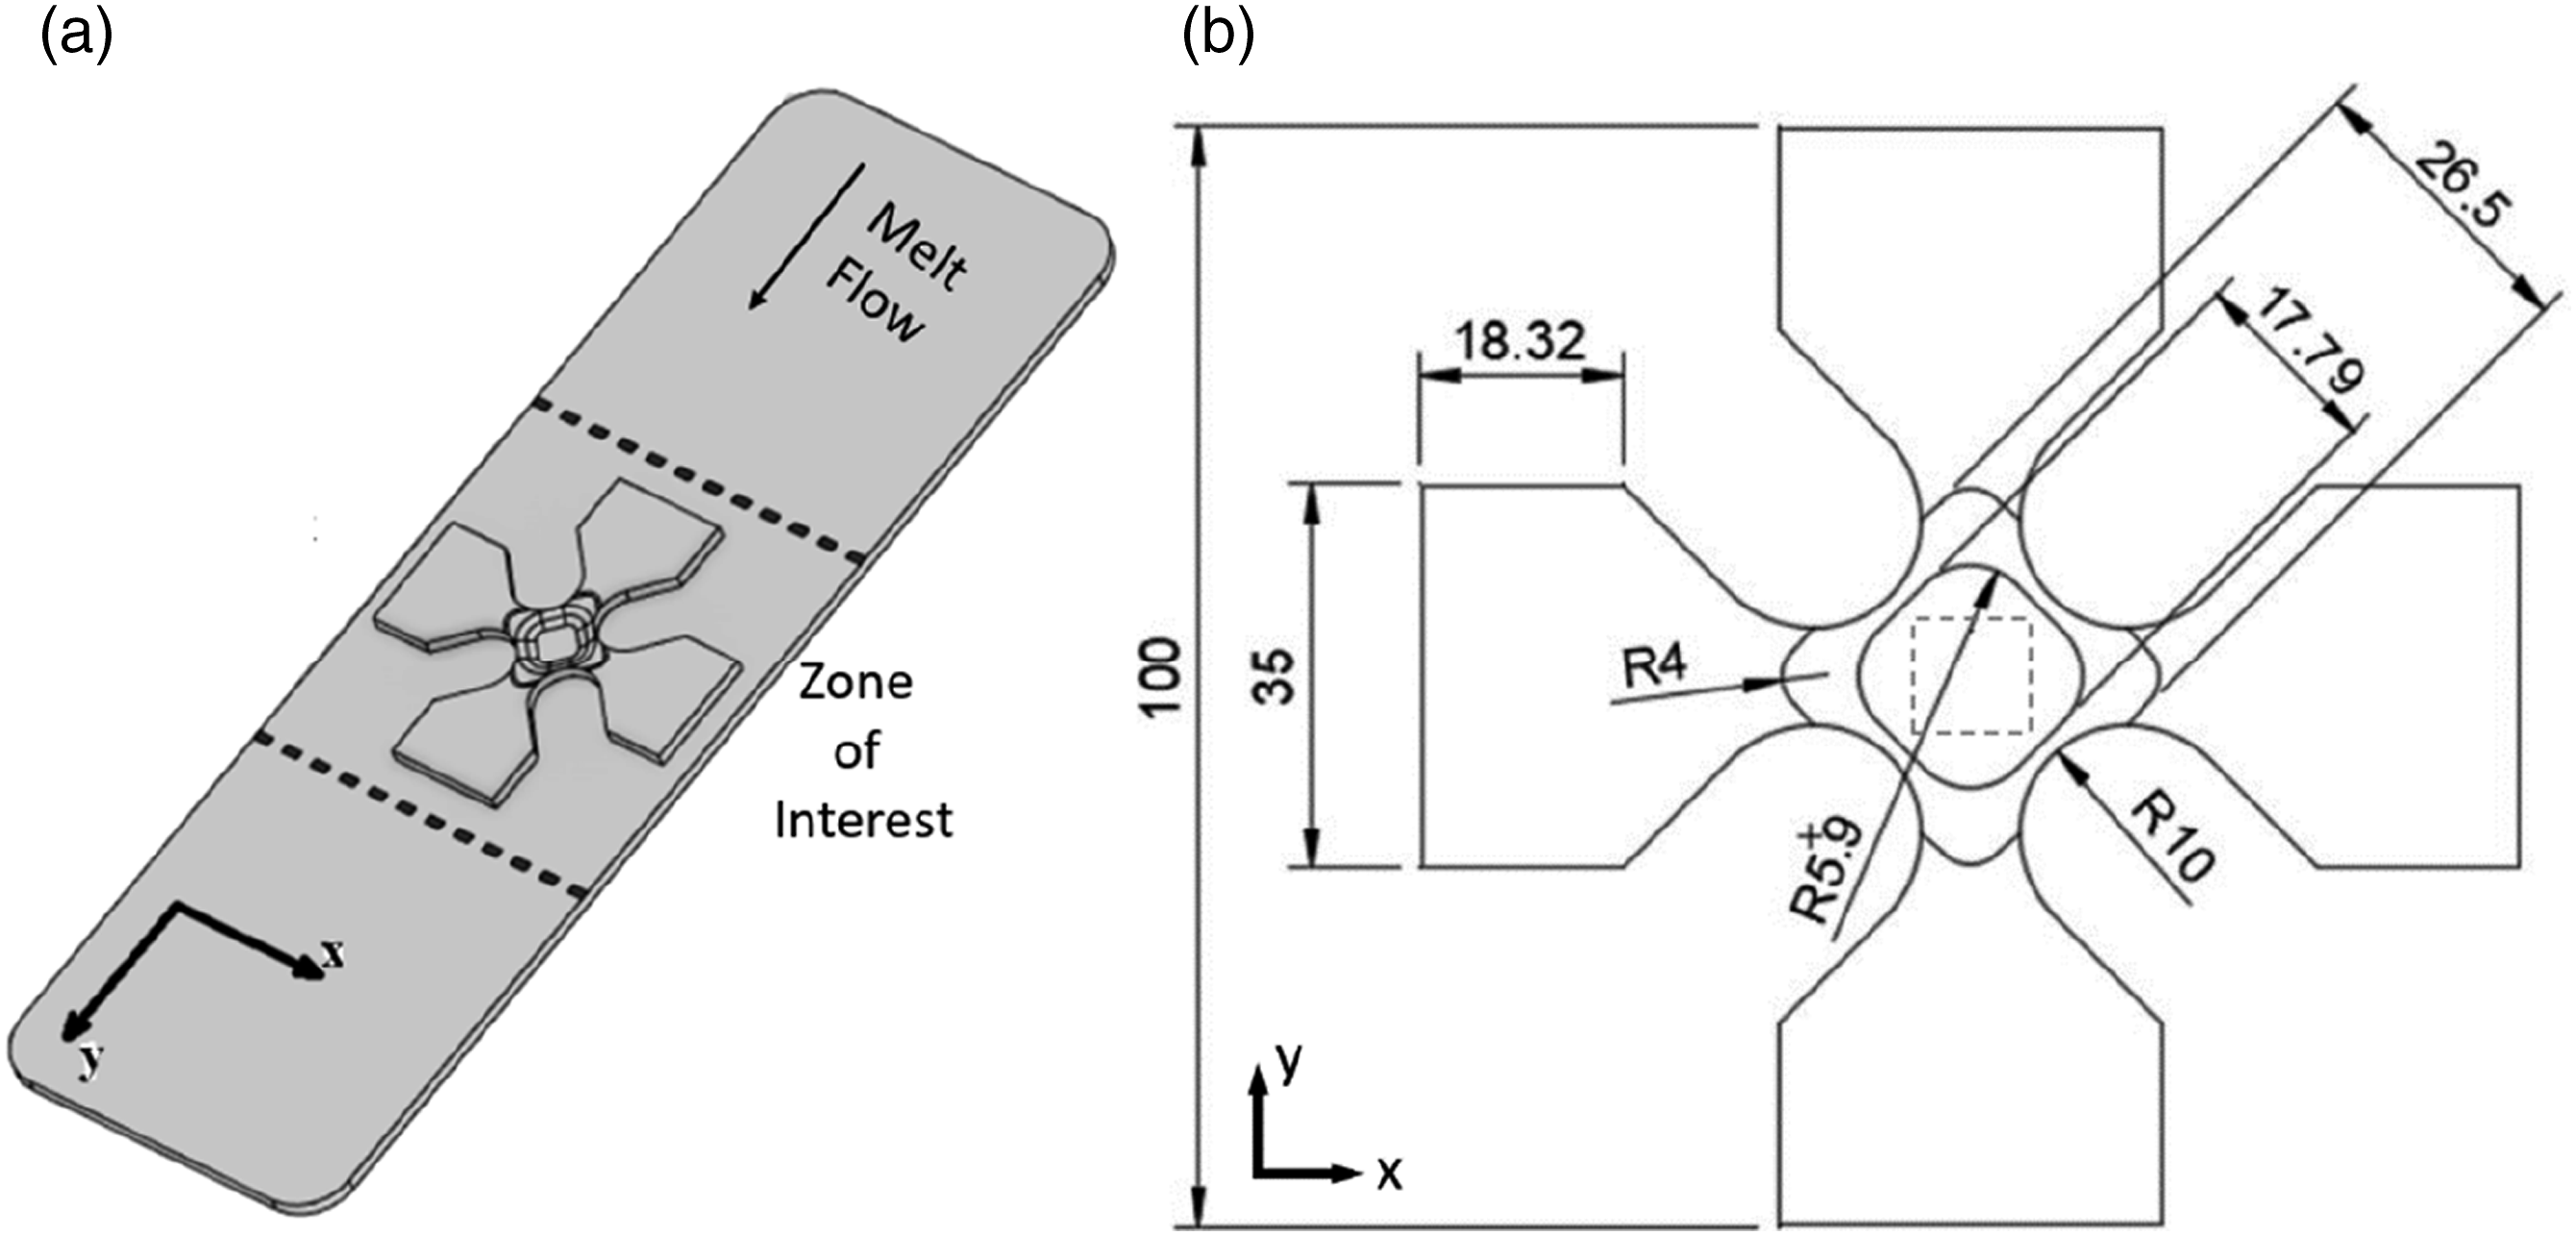
As mentioned above, relative humidity (RH) of the environment has an influence on the polymer’s behavior since H2O penetration into the matrix plasticizes the matrix. 37 Due to the storage conditions or during water jet cutting, different water absorption may occur inside the material. In this respect, to equalize the testing conditions of all specimens, they were meticulously dried at 110°C for 4 h, in accordance with the standard procedure provided in the datasheets. The drying process was performed in the presence of silica gel in a vacuum oven at an average vacuum of 0.1 mbar generated by a vacuum pump. Drying was maintained until the stabilization of the specimens’ masses. Mass stabilization indicates an equilibrium of the specimen’s moisture content with the environment. The vacuum environment together with silica gel is assumed as an environment with no humidity. If there is no change in the specimen mass after subsequent weighing with a precision balance, this indicates that all water content inside the material was evaporated.
Experimenal characterizations
Prior to biaxial tests, uniaxial fatigue tests were performed and S-N curves are plot from test data (see Figure S1) Then, biaxial fatigue tests were carried out in a humidity-controlled test room using an Instron 8800 hydraulic biaxial test machine with three identical specimens for each tested stress levels. In these tests, the main goal was to evaluate the stiffness drop rather than the life time determination and prediction. Therefore, calculation based on strain energy is not assessed in this manuscript. The biaxial test machine has a load capacity of ±100 kN with a wide range of frequencies. The impact of load ratio on creep was examined by various researchers through experimental and numerical methods. Sahputra et al. performed molecular dynamics simulations to examine how the load ratio impacts the fatigue creep of polymers. They asserted that an increase in the R-ratio leads to a decrease in the average strain, and that creep results in the lowest average strain. Furthermore, the increments in strain are associated with alterations in van der Waals and dihedral energies. These findings suggest that the polymer chains exhibit intermolecular movement, allowing them to align with the direction of the applied stress. 38 Santharam et al. built a model to predict the life time of short glass fiber reinforced PA66 under fatigue conditions. They took into account the impact of load ratio and found that criteria based on cyclic loop energy densities (either elastic or anelastic) can yield accurate results. However, these criteria do not account for the influence of creep at high positive load ratios, which leads to substantial ratcheting and premature failure. 39 Therefore, based on this notable research, load ratio was chosen as R = 0.45. In terms of the frequency, Esmaeillou et al. found that at the same level of stress, increasing frequency results in self-heating and reduced fatigue life. 40 Benaarbia continued by stating that the equilibrium kinetics of the material and polymer chain motion are altered as the frequency and energy rate increase. Additionally, these factors impact the hysteresis effect caused by the polymer matrix’s viscoelasticity. 41 Another investigation conducted by Shirinbayan et al. demonstrated that as the frequency increases, the self-heating phenomenon becomes more prominent, resulting in the material entering the β-transition zone and the matrix exhibiting viscous characteristics. 42 The induced thermal fatigue characteristic of the overall fatigue response impacts both the rate of rigidity reduction and fatigue life. Therefore, the frequency of the load was selected as 1 Hz. The maximum applied load during the fatigue tests was selected as 360 N for two fundamental axes and the amplitude was 100 N by dividing the applied load to the cross-section of the ZOI, stress was calculated (Tests with maximum load of 400 N and 320 N were also performed and the strain field results were compared with the selected load level in Figure S2). As seen from the load capacity, the test machine is designed to conduct tests primarily for metals. For this reason, PID (Proportional-integral-derivative controller) parameters of the fatigue test machine were modified to perform reliable tests, as the instant accelerations of the machine can damage the specimen and create micro-cracks that influence the final results.
A high-speed camera, Phantom® Miro M310, was used for image acquisition with an image acquisition frequency of 40 Hz during fatigue tests, and only 200 images were captured for selected intervals due to the limited hard drive memory. The objective of using a high-speed camera was to perform digital image correlation to examine the strain field of the critical zone during fatigue testing since the more images captured, the more accurate the results obtained. Considering that the frequency of the fatigue test is equal to 1 Hz, 40 images were taken for one fatigue cycle. This cycle was discretized equally into 40 instances starting from one force peak finishing in the following force peak. By doing so, the deformation under the load can be captured sensitively. The image acquisition was done for each 10.000 cycles automatically. However, at some points, supplementary images were taken manually.
In order to conduct DIC, a speckle pattern should be constituted over the critical zone of observation. In the context of this study, the speckle was produced using commercial aerosol spray can in white and black colors. First, the specimen surface was painted with white color then light sprays of black paint were applied to the useful area of the test specimens. The superposition of these thin and dissimilar layers of paint produces a finely resolved speckle. In addition, an intense light source was required by the camera to provide uniform illumination to capture images clearly at this acquisition rate. DIC was performed with a pattern size of 25 × 5 pixels. As a result, an approximate pixel resolution of 25 pixels was attained. With regard to the measured strain, the resolution in the present experimental configuration was 5 × 10⁻³. Filters were not utilized in the DIC analyses. A bright, cold light source was attached around the test specimen, which illuminated the target region. It is imperative to be cautious about the adverse effects of the light source so as not to heat up the specimen. By monitoring the thermal evolution during illumination prior to testing, the reliability of subsequent thermal measurements was ensured. After image acquisition, a Matlab implemented DIC code, Correli 1.11, was used to carry out DIC analysis.
In parallel to the DIC analysis, the temperature field of the critical zone during the fatigue tests was observed by using an IR (Infrared) camera of Cedip® Titanium. The infrared thermal camera uses a 25 mm lens and with an InSb detector which is sensitive to infrared 3–5 μm radiation. The decision was made to run the detector with a window size of 160 × 128 pixels, a pixel size of 29 μm, and an integration time of 1800 μs.
In addition, to examine the stiffness change with temperature as well as to identify the Tg of the tested material DMA analyses were carried out according to ASTM E1640 standard using Dynamic Mechanical Thermal Analyzer Q800 system of TA Instruments. The data were obtained at a frequency of 1 Hz, 0.1% strain in the temperature range from −10°C to 100°C using a heating rate of 3°C/min under tensile mode. 43
After the fatigue fracture occurred, fracture surfaces were inspected via SEM to understand the observed damage mechanisms thoroughly. Specimens were coated with a thin layer of Au-Pd prior to inspection and then placed in Scope/JSM-6010LA Jeol® electron microscope.
After performing the tests, the results were in a similar trend for all tested three specimens. Therefore, the figures below are generated by taking into consideration of a selected specimen.
Results and discussions
In situ DIC and IR camera measurements
Investigation of the thermal field in the ZOI for the cruciform specimens provides important information on the thermomechanical behavior of the composites. At the beginning of the fatigue tests, the rate of temperature increase is recorded as considerably high. However, stabilization is generally observed in the vicinity of the 5000th cycle. After the stabilization, the temperature remains constant until the visible crack opening and propagation.
16
After the crack opening the temperature increases until the fracture which is attributed to the friction, due to the localization of temperature increase in the crack zone. To illustrate the thermal evolution, thermal images of the specimen were captured at different loading cycles as shown in Figure 2. The thermal contour of the specimen at the very beginning of the test is shown in Figure 2(b) as the reference state. The specimen has an initial average temperature of 28.5–29.0°C. In the early stages of the fatigue test, the specimens exhibited a large temperature gradient in the vertical direction. At the 520th cycle, as shown in Figure 2(c), 34.17°C is found as the maximum temperature in the middle of the specimen. However, the mean temperature of ZOI was found as 32.76°C. Another measurement was performed at the 2200th cycle as shown in Figure 2(d). Compared to the temperature contour of the 520th cycle (Figure 2(c)), the temperature continued to climb up until 35.3°C. After reaching this steady-state temperature level, the temperature contour expanded horizontally as a consequence of the heat conduction within the specimen. In Figure 2(d) and (e), the average temperature levels did not change significantly. Figure 2(f) shows the steady-state thermal state of the specimen, in which ZOI reveals almost a uniform temperature that corresponds to 700 cycles before the first visible crack opening. Then, in the last phase of fatigue tests after crack opening, the temperature rises to 37.48°C as the maximum value and 36.54°C as the mean value. The temperature increase in the last phase of the fatigue tests is consistent with the energy equilibrium given in equation (3). The total strain energy density is a sum of elastic and inelastic energy components, and inelastic energy is composed of W
s
(=damage nucleation and evolution) and W
d
(=energy dissipation). In this respect, after visible crack propagation, the amount of W
s
is reduced and this reduction is compensated by the temperature increase because of the constant strain energy density during the fatigue tests.
44
Figure 2(a) summarizes the variation of the average temperature in the ZOI over the test. Noteworthy is that the average temperature reaches the steady-state level at about 10,000th cycle, which is close to the observations reported in the literature.
16
It should be noted that the temperatures shown in Figure 2 are specific to this specimen and test condition. Self-heating and temperature evolution are generally known to be strongly dependent on load level and frequency. However, tests carried out with the other specimens and stress levels showed a similar trend to that presented in Figure 2(a). One of the selected results is therefore presented in this manuscript. Temperature maps of the cruciform specimens recorded at different number of cycles: (a) average temperature variation in the ZOI with the number of cycles. (b) 20th cycle, (c) 520th cycle, (d) 2200th cycle, (e) 10,000th cycle, (f) 322,700th cycle, (g) 487,180th cycle.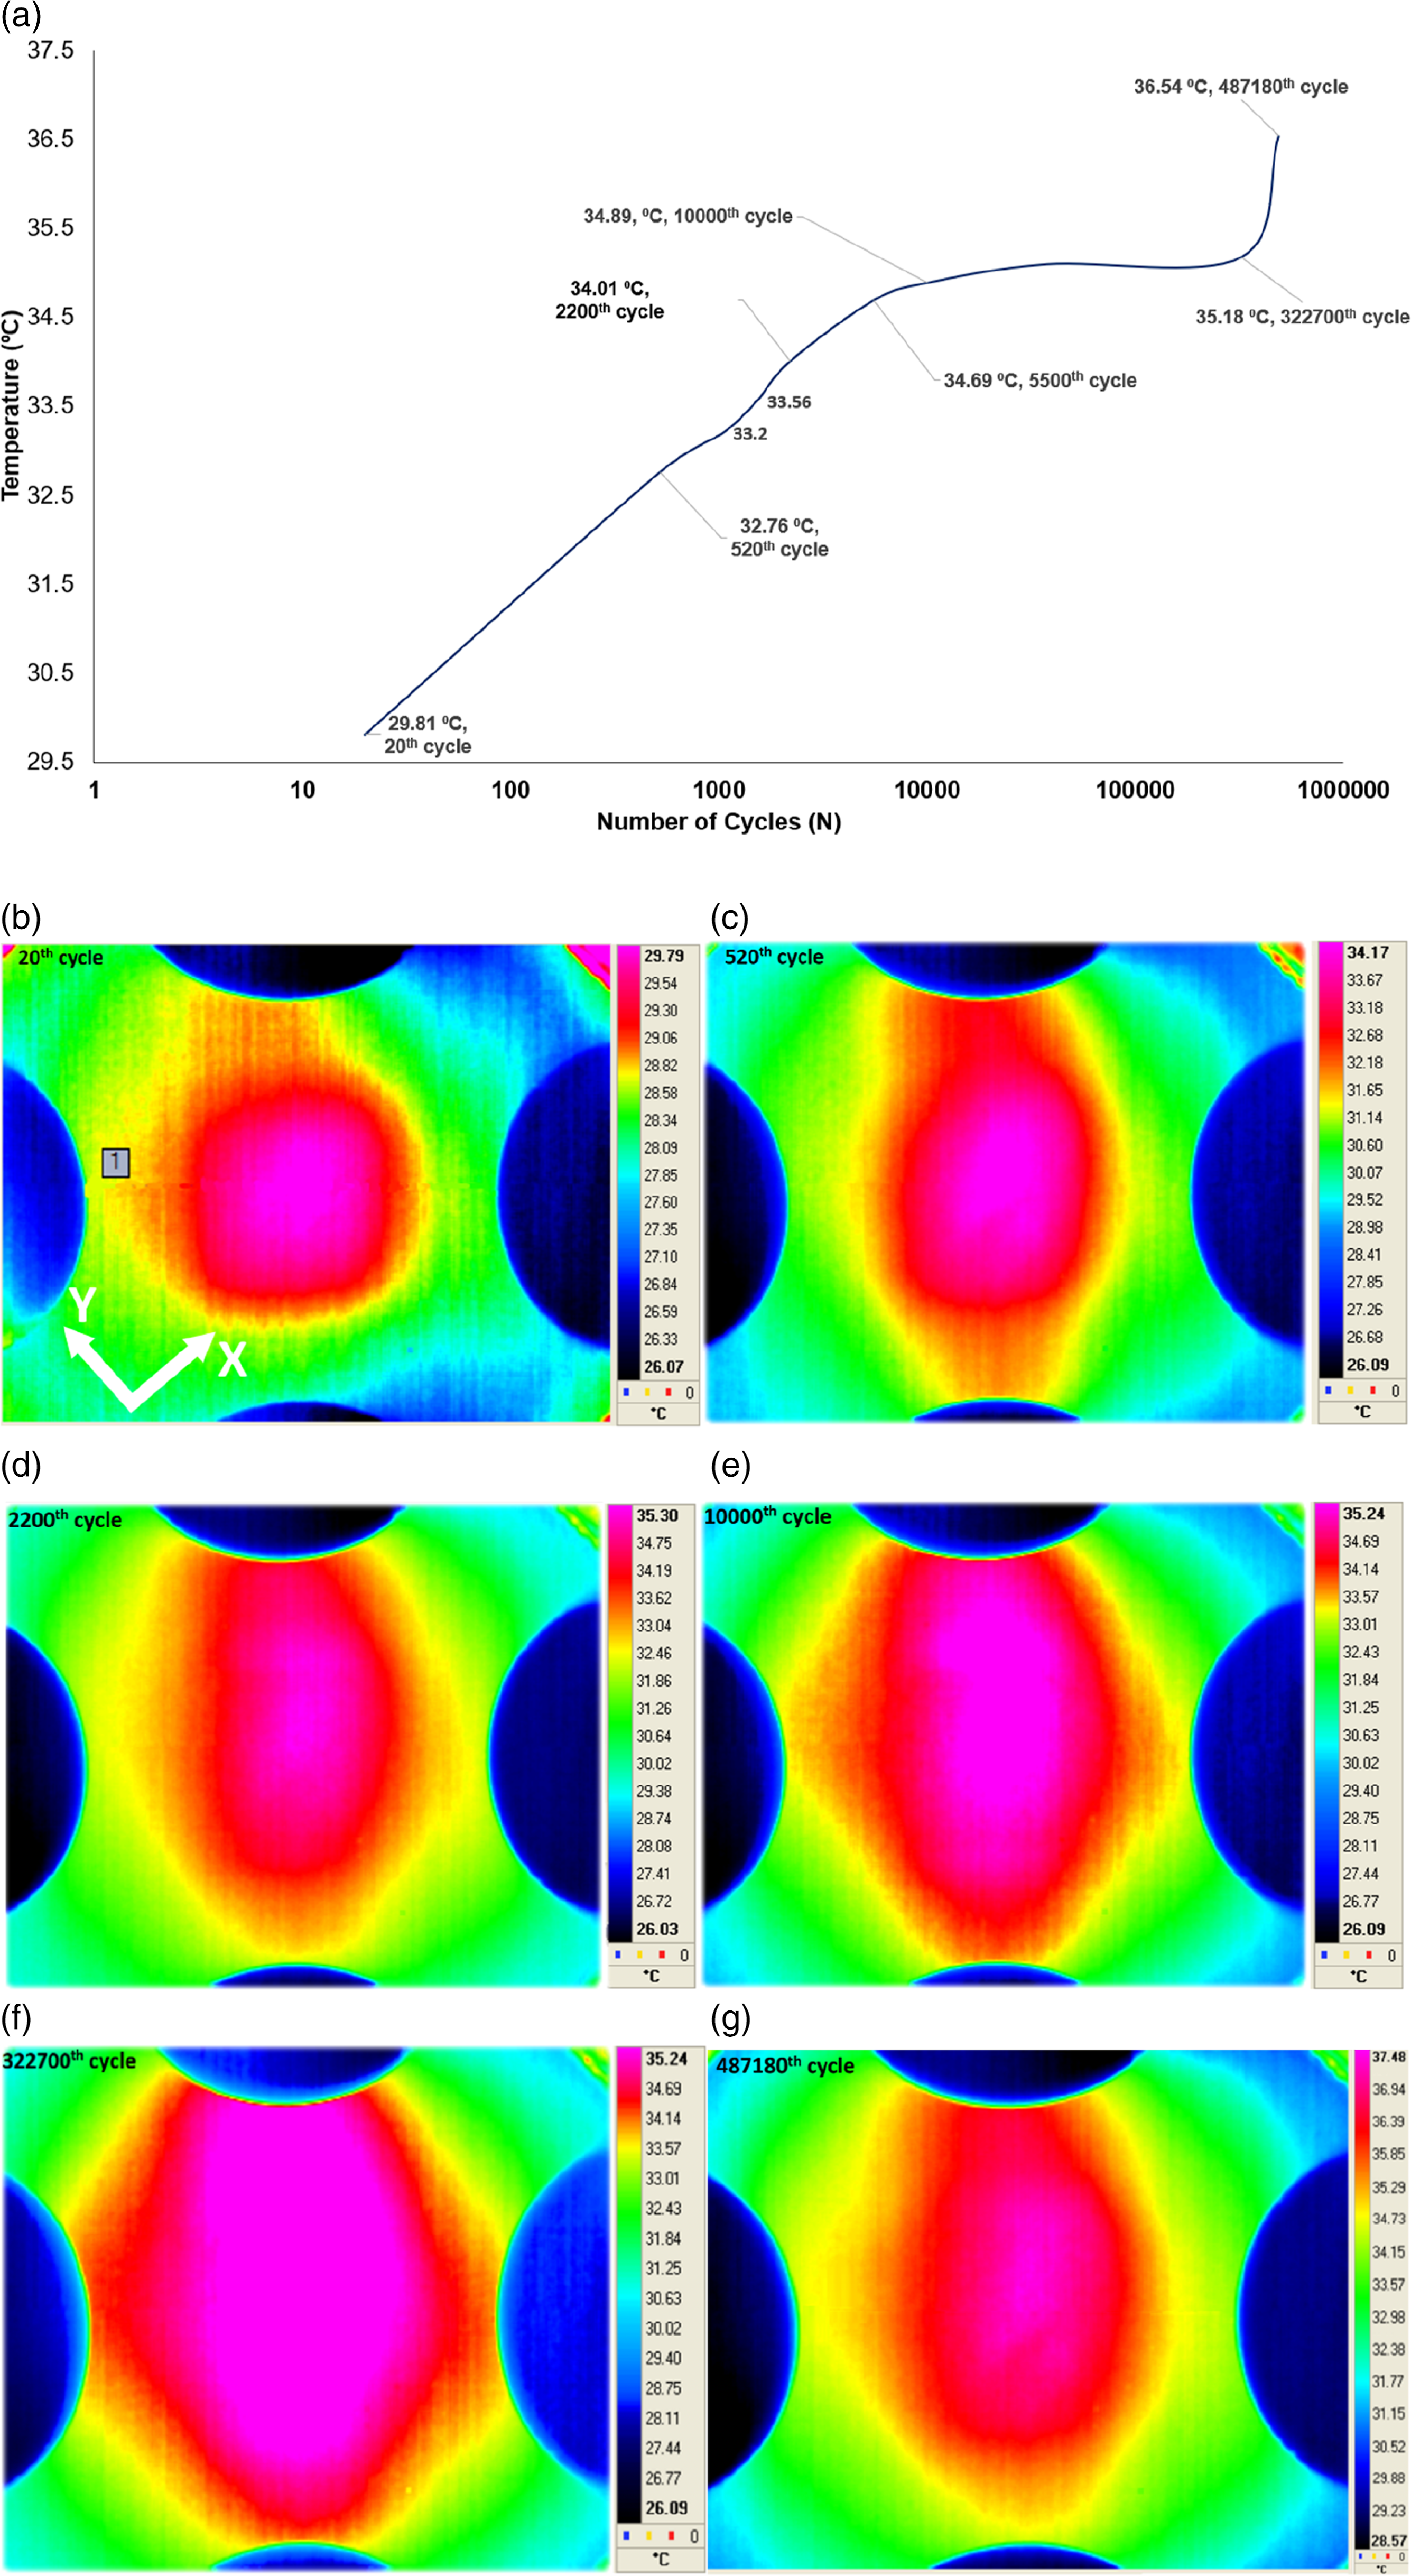
As mentioned in the theoretical background, heat dissipation from the material is observed during fatigue tests and it is linked to the internal damping in the microstructure. The viscoelastic nature of the polymer matrix, interphase effects between fiber and matrix, and the thermoelastic properties of the matrix all influence damping. In this respect, during fatigue tests polymer chain disentanglements, slipping of molecules and matrix-fiber interactions increase the damping inside the material. This increased damping leads to temperature increase also called self-heating reducing the stiffness of the specimens together with the mechanical damage accumulation and cyclic creep during the fatigue tests. 45 The reduction in stiffness can be perceived from the increased strain levels for constant stresses. In order to observe the change in strain levels, DIC analyses were carried out for the same instances that thermal observation was done.
In the DIC analysis illustrated in Figure 3, the first step is to define the reference image, which is usually chosen as the image taken before the fatigue test with no load applied to the specimen. In this study, the images were taken with a resolution of 1270 × 1270 dpi and during the DIC analysis, the zone of interest is defined by drawing a polygon with a window size of 240 × 320 pixels on the reference image as shown in Figure 3(a), and then the mesh is generated inside this polygon using triangular elements with a mesh size of 50 pixels. x and y directions given in Figure 3(a) are consistent with the given directions in Figure 1(a). After the mesh was generated, DIC analysis was initiated. In parallel to the number of cycles for thermal observation, a DIC analysis was performed for the same time interval. In Figure 3(b), the contour of the principal strain in the x-axis (ε
xx
) corresponding to the 322,700th cycle is given. In this contour, strain is not uniform throughout the ZOI. This possibly arises from the lack of homogeneity in the microstructure related to the injection molding process.
46
The non-uniformity is also similar for the principal strain in the y-axis (ε
yy
) as seen in Figure 3(c). However, a difference by a factor of three was observed in the principal strains (ε
xx
DIC results for the cycles 322.7k (a) mesh definition on the ZOI (b) strain field of Ɛxx (c) strain field of Ɛyy (d) mean strain versus image number taken during fatigue tests.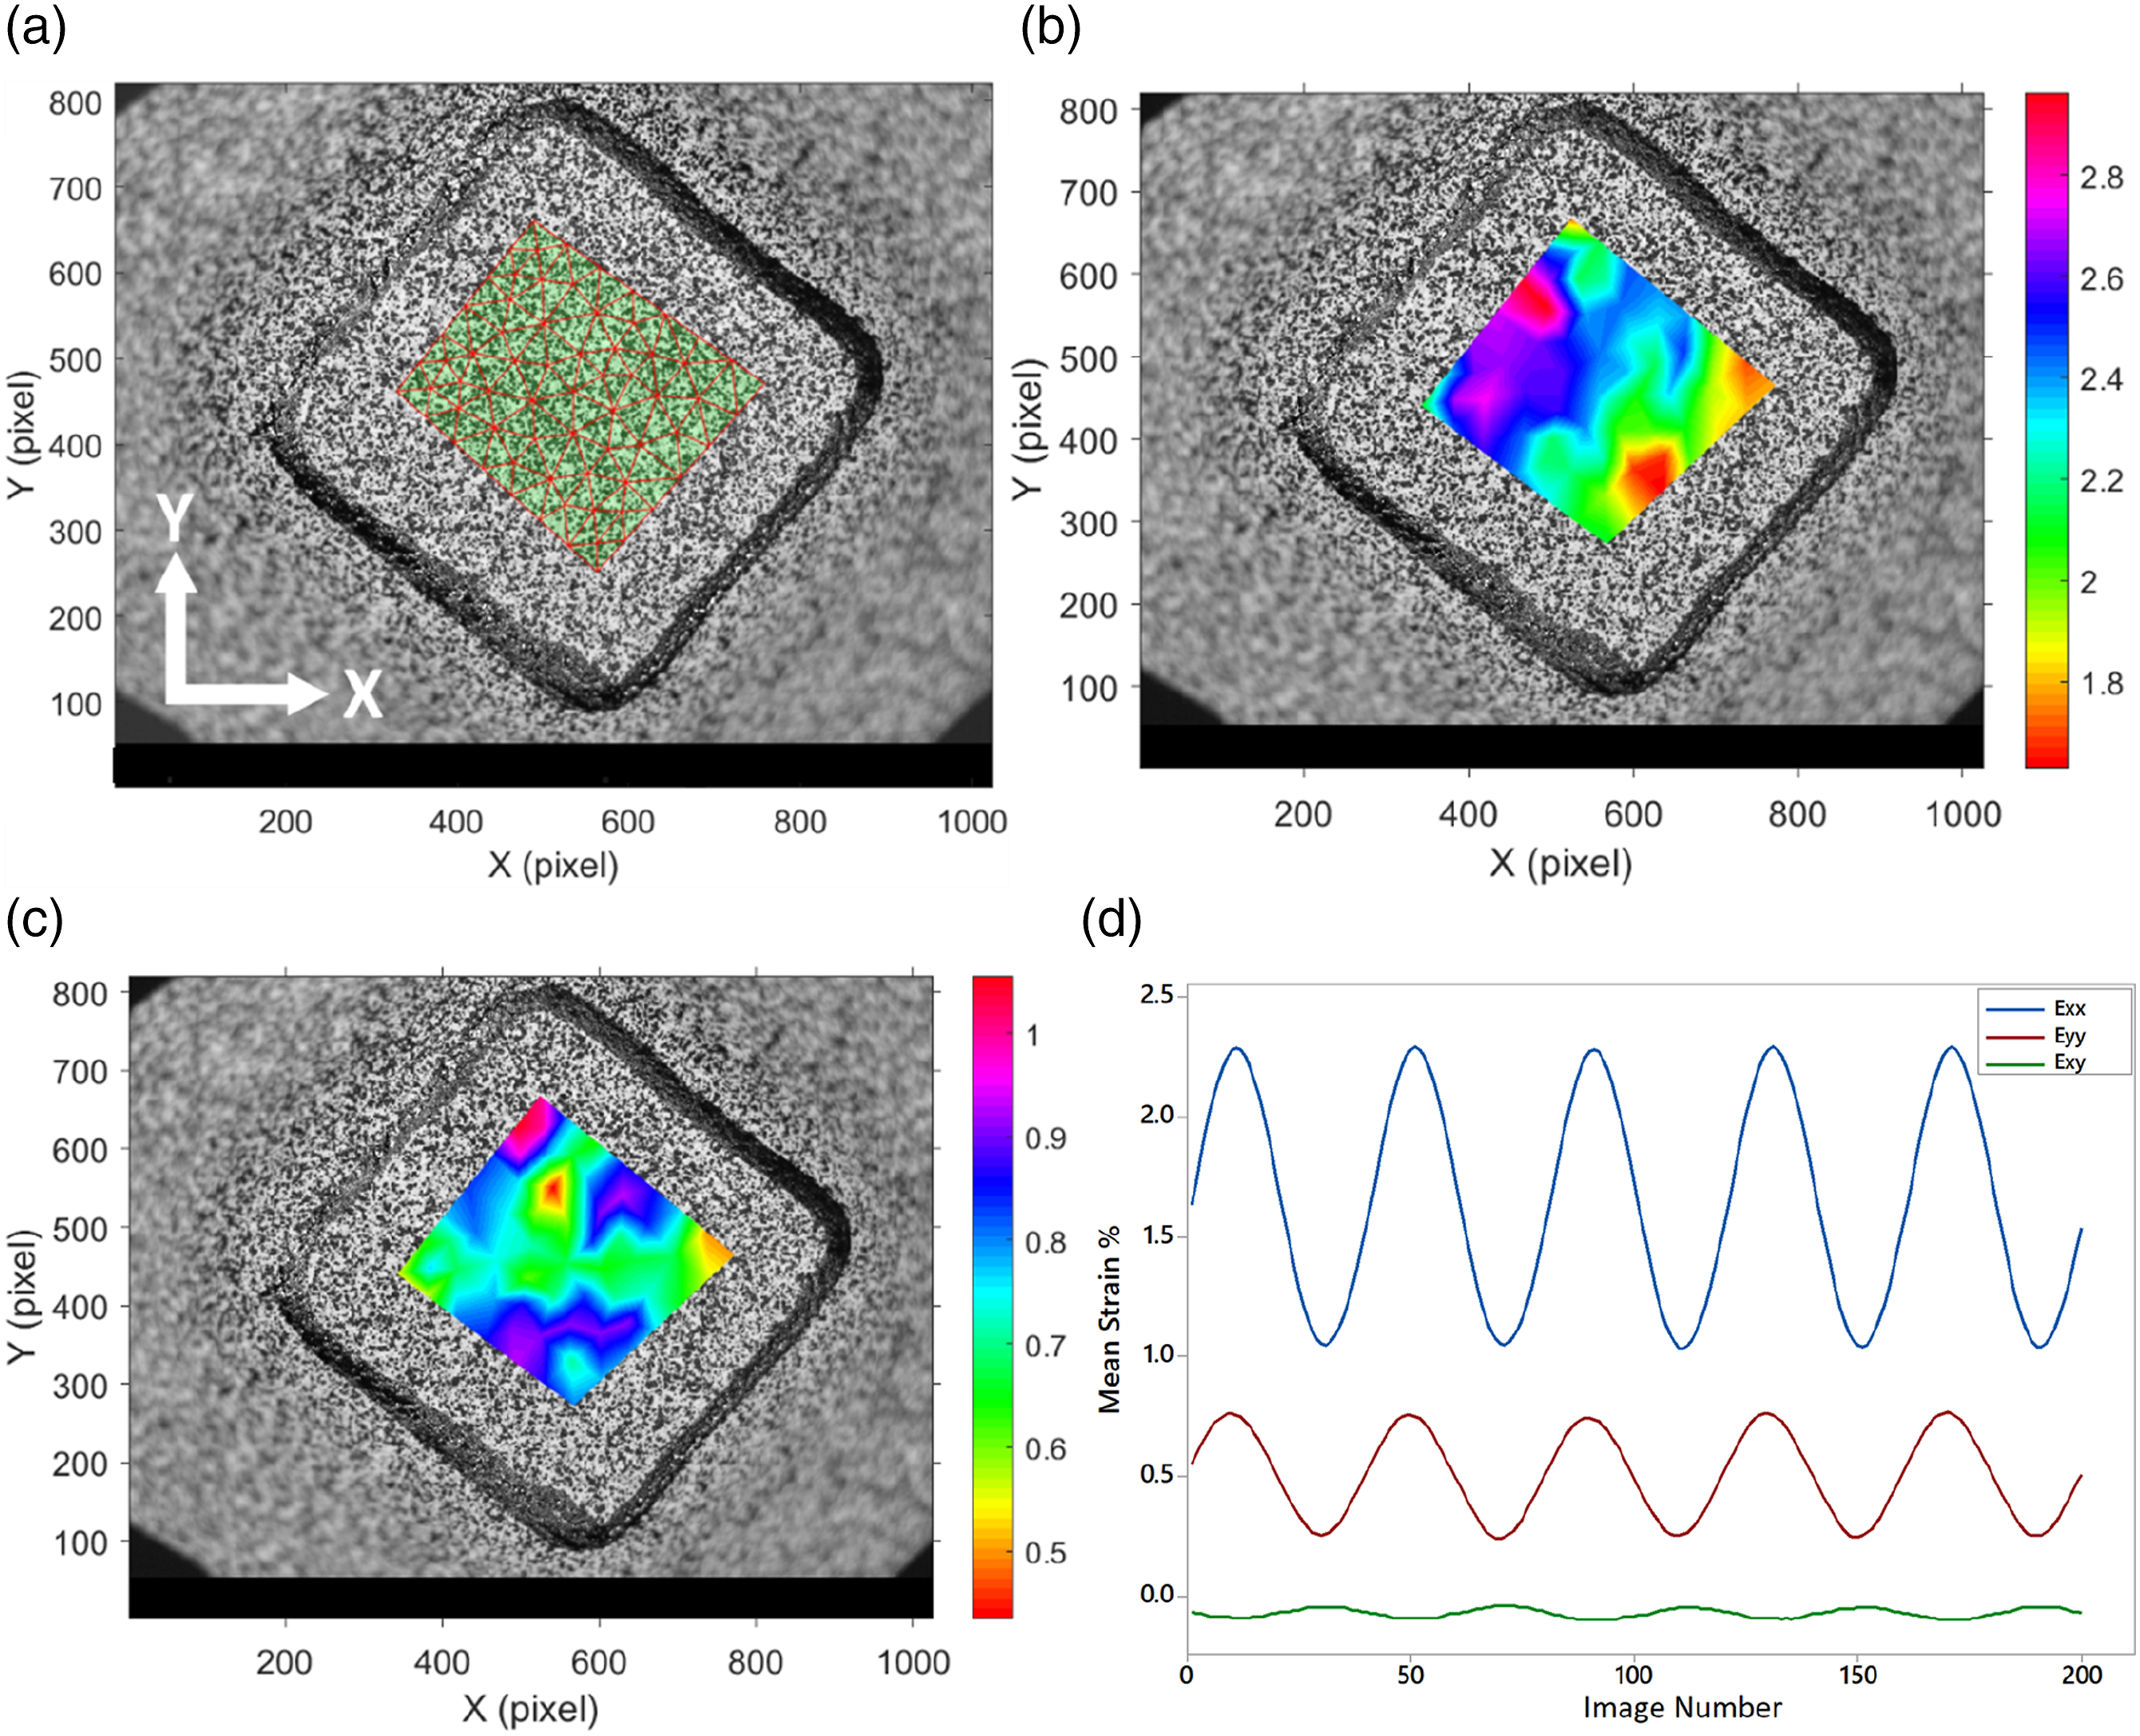
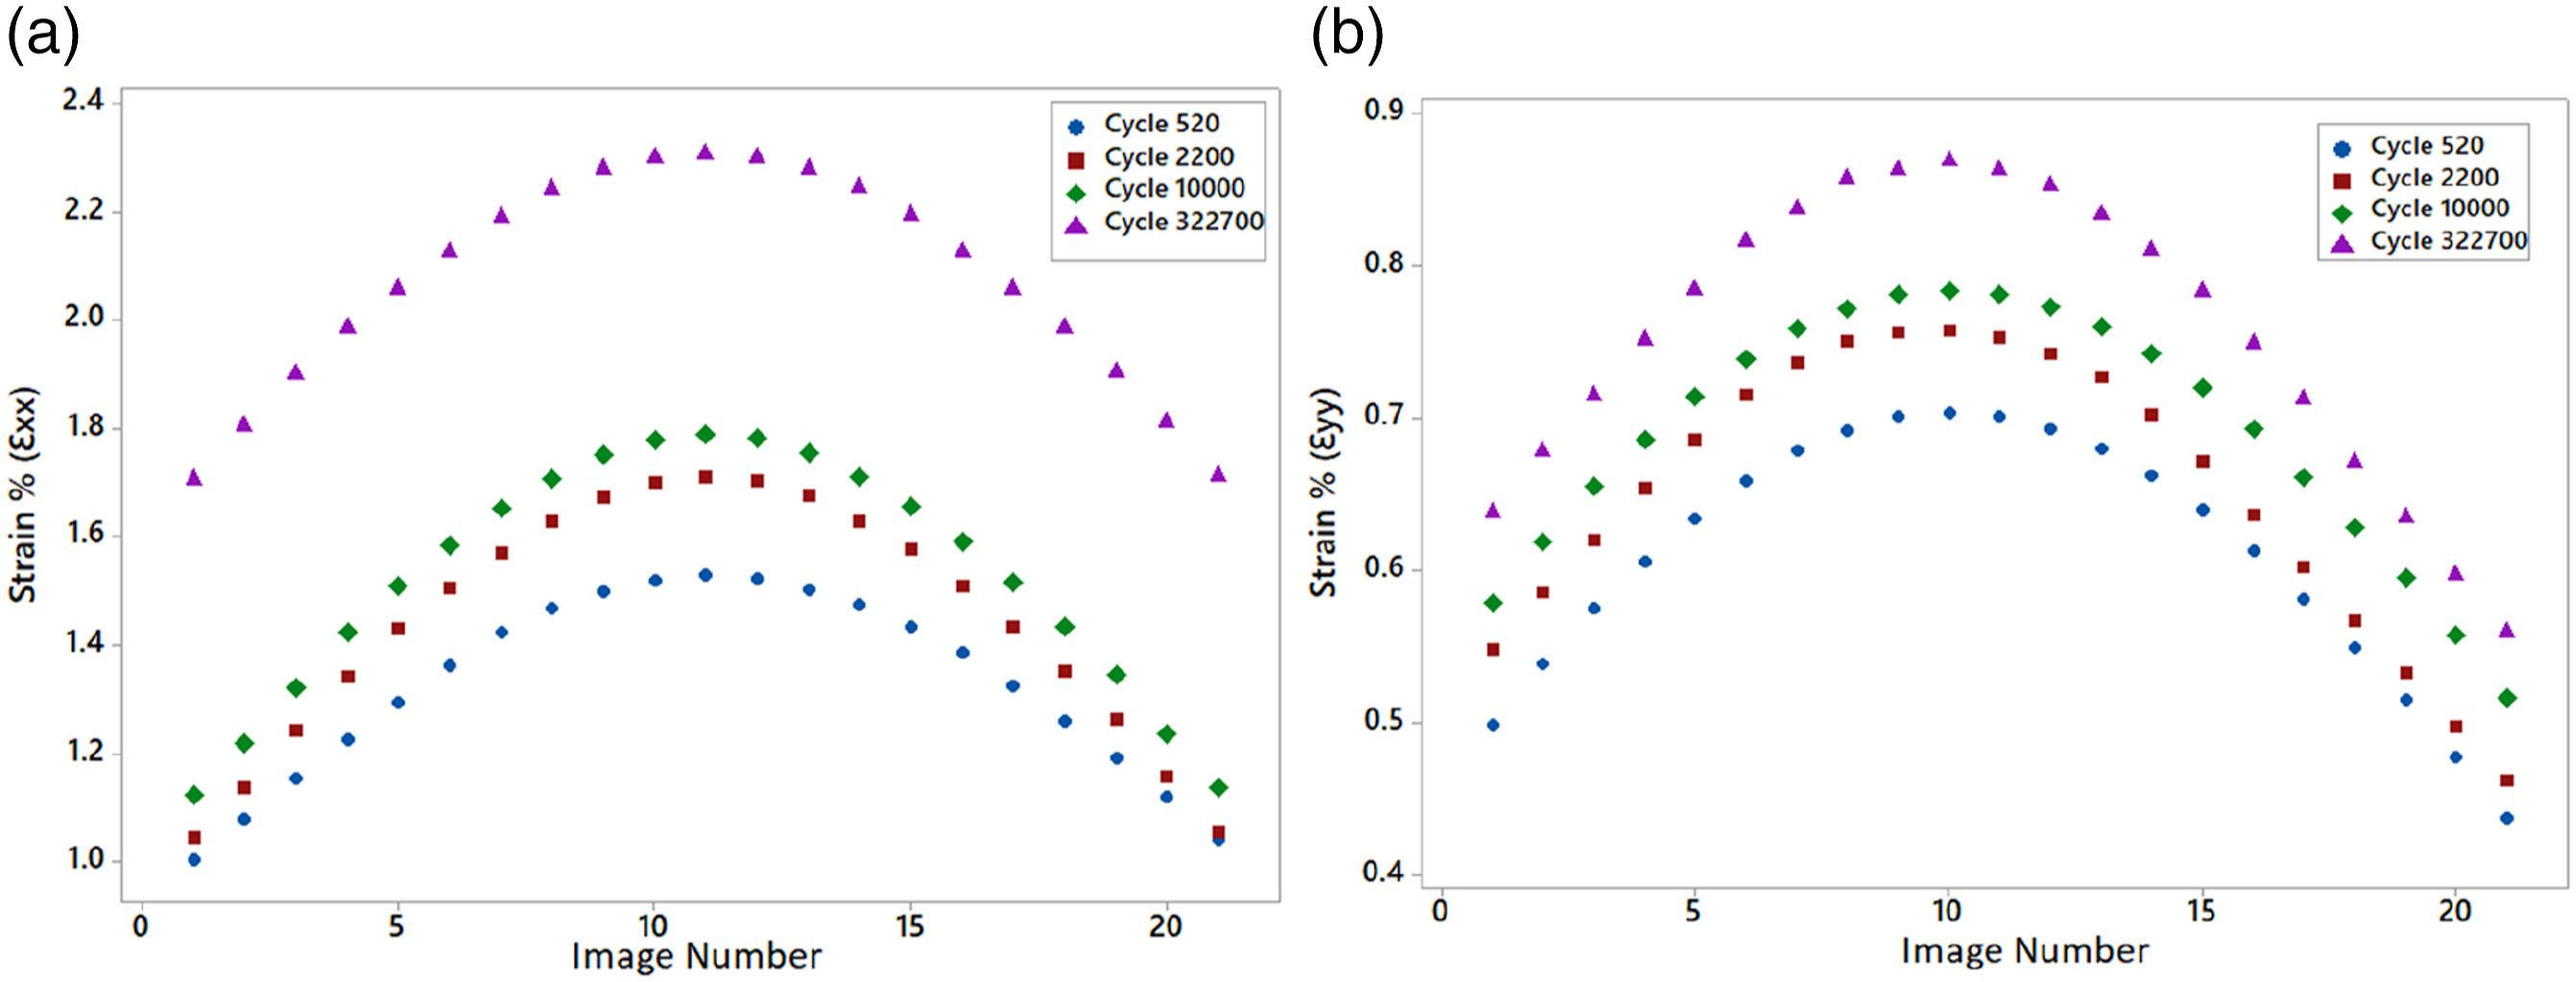
The examination of the strain evolution regarding the number of cycles has also paramount importance in the fatigue behavior of the material since an excessive reduction in stiffness can bring undesirable outcomes for structures. In this respect, the change in the strain with respect to the number of cycles was studied for PA66GF30. From Figure 4(a) which indicates the mean principal strain (ZOI averaged strain) in the x-axis (Ɛ
xx
), at the very beginning of the test around the 520th cycle, the peak of ε
xx
was observed to be 1.42%. A rise in temperature occurs during the test, as shown in Figure 2(f), and this rise results in a noticeable increase in strain for constant stress. However, this increase is not only associated with the temperature increase but also the damage that occurs during the fatigue tests due to W
s
component of the energy and the creep phenomenon. If we concentrate on the temperature effect, it is assumed that the material gets closer to its Tg (=70°C see following sub-section “DMA investigation”) due to the temperature increase during the test. Consequently, the stiffness of the material drops. By the drop in the stiffness, the same stress results in a larger strain.
18
From Figure 4(a), which indicates the mean strain obtained by taking the average of the determined strain for each element shown in Figure 3(a), a rise of 30% in ε
xx
until the stabilization of the temperature is observed. However, strain continued to increase after the stabilization of the temperature. This is considered primarily due to the creep and damage accumulation and secondarily as the result of the thermal field’s expansion shown in Figure 2(e). The increasing trend of the strain in the x-axis is also valid for the principal strain in the y-axis. However, ε
yy
remained smaller compared to ε
xx
. This is directly linked with the alignment of the glass fibers. A major part of the fibers is aligned parallel to the y-axis which increases the elasticity modulus in the y-axis (Ey > Ex). Thereby, the mean strain remains limited in the y-axis compared to the x-axis which is consistent with Hooke’s law. In addition, having more matrix-fiber interface in the x-axis can also explain why the composite is more compliant in the x-axis. Comparison of the mean strains with respect to the number of cycles (a) ε
xx
(b) ε
yy
.
Dynamic mechanical analysis (DMA) investigation
DMA was used to investigate the thermomechanical properties of the composites. The fundamental idea on the elastic and viscous response of the material can be acquired from the storage modulus (E′) and loss modulus (E″) under dynamic loading. The loss factor (tan δ) was then determined by the ratio of loss modulus to storage modulus, which is a measure of the energy lost from the material when it is loaded. Tg can be derived using the first inflection point, or the onset of the drop-in storage modulus, after the data have been obtained. Taking the peak of tan δ is, however, the simplest method for determining Tg.
The main goal to conduct DMA in this study was to see the stiffness drop while increasing the temperature of the specimen. DMA was performed using a bar specimen in which the fibers are oriented parallel to the loading direction and the evolution of the storage modulus and tan δ of PA66GF30 composites are demonstrated in Figure 5. DMA results of PA66GF30 composite specimen.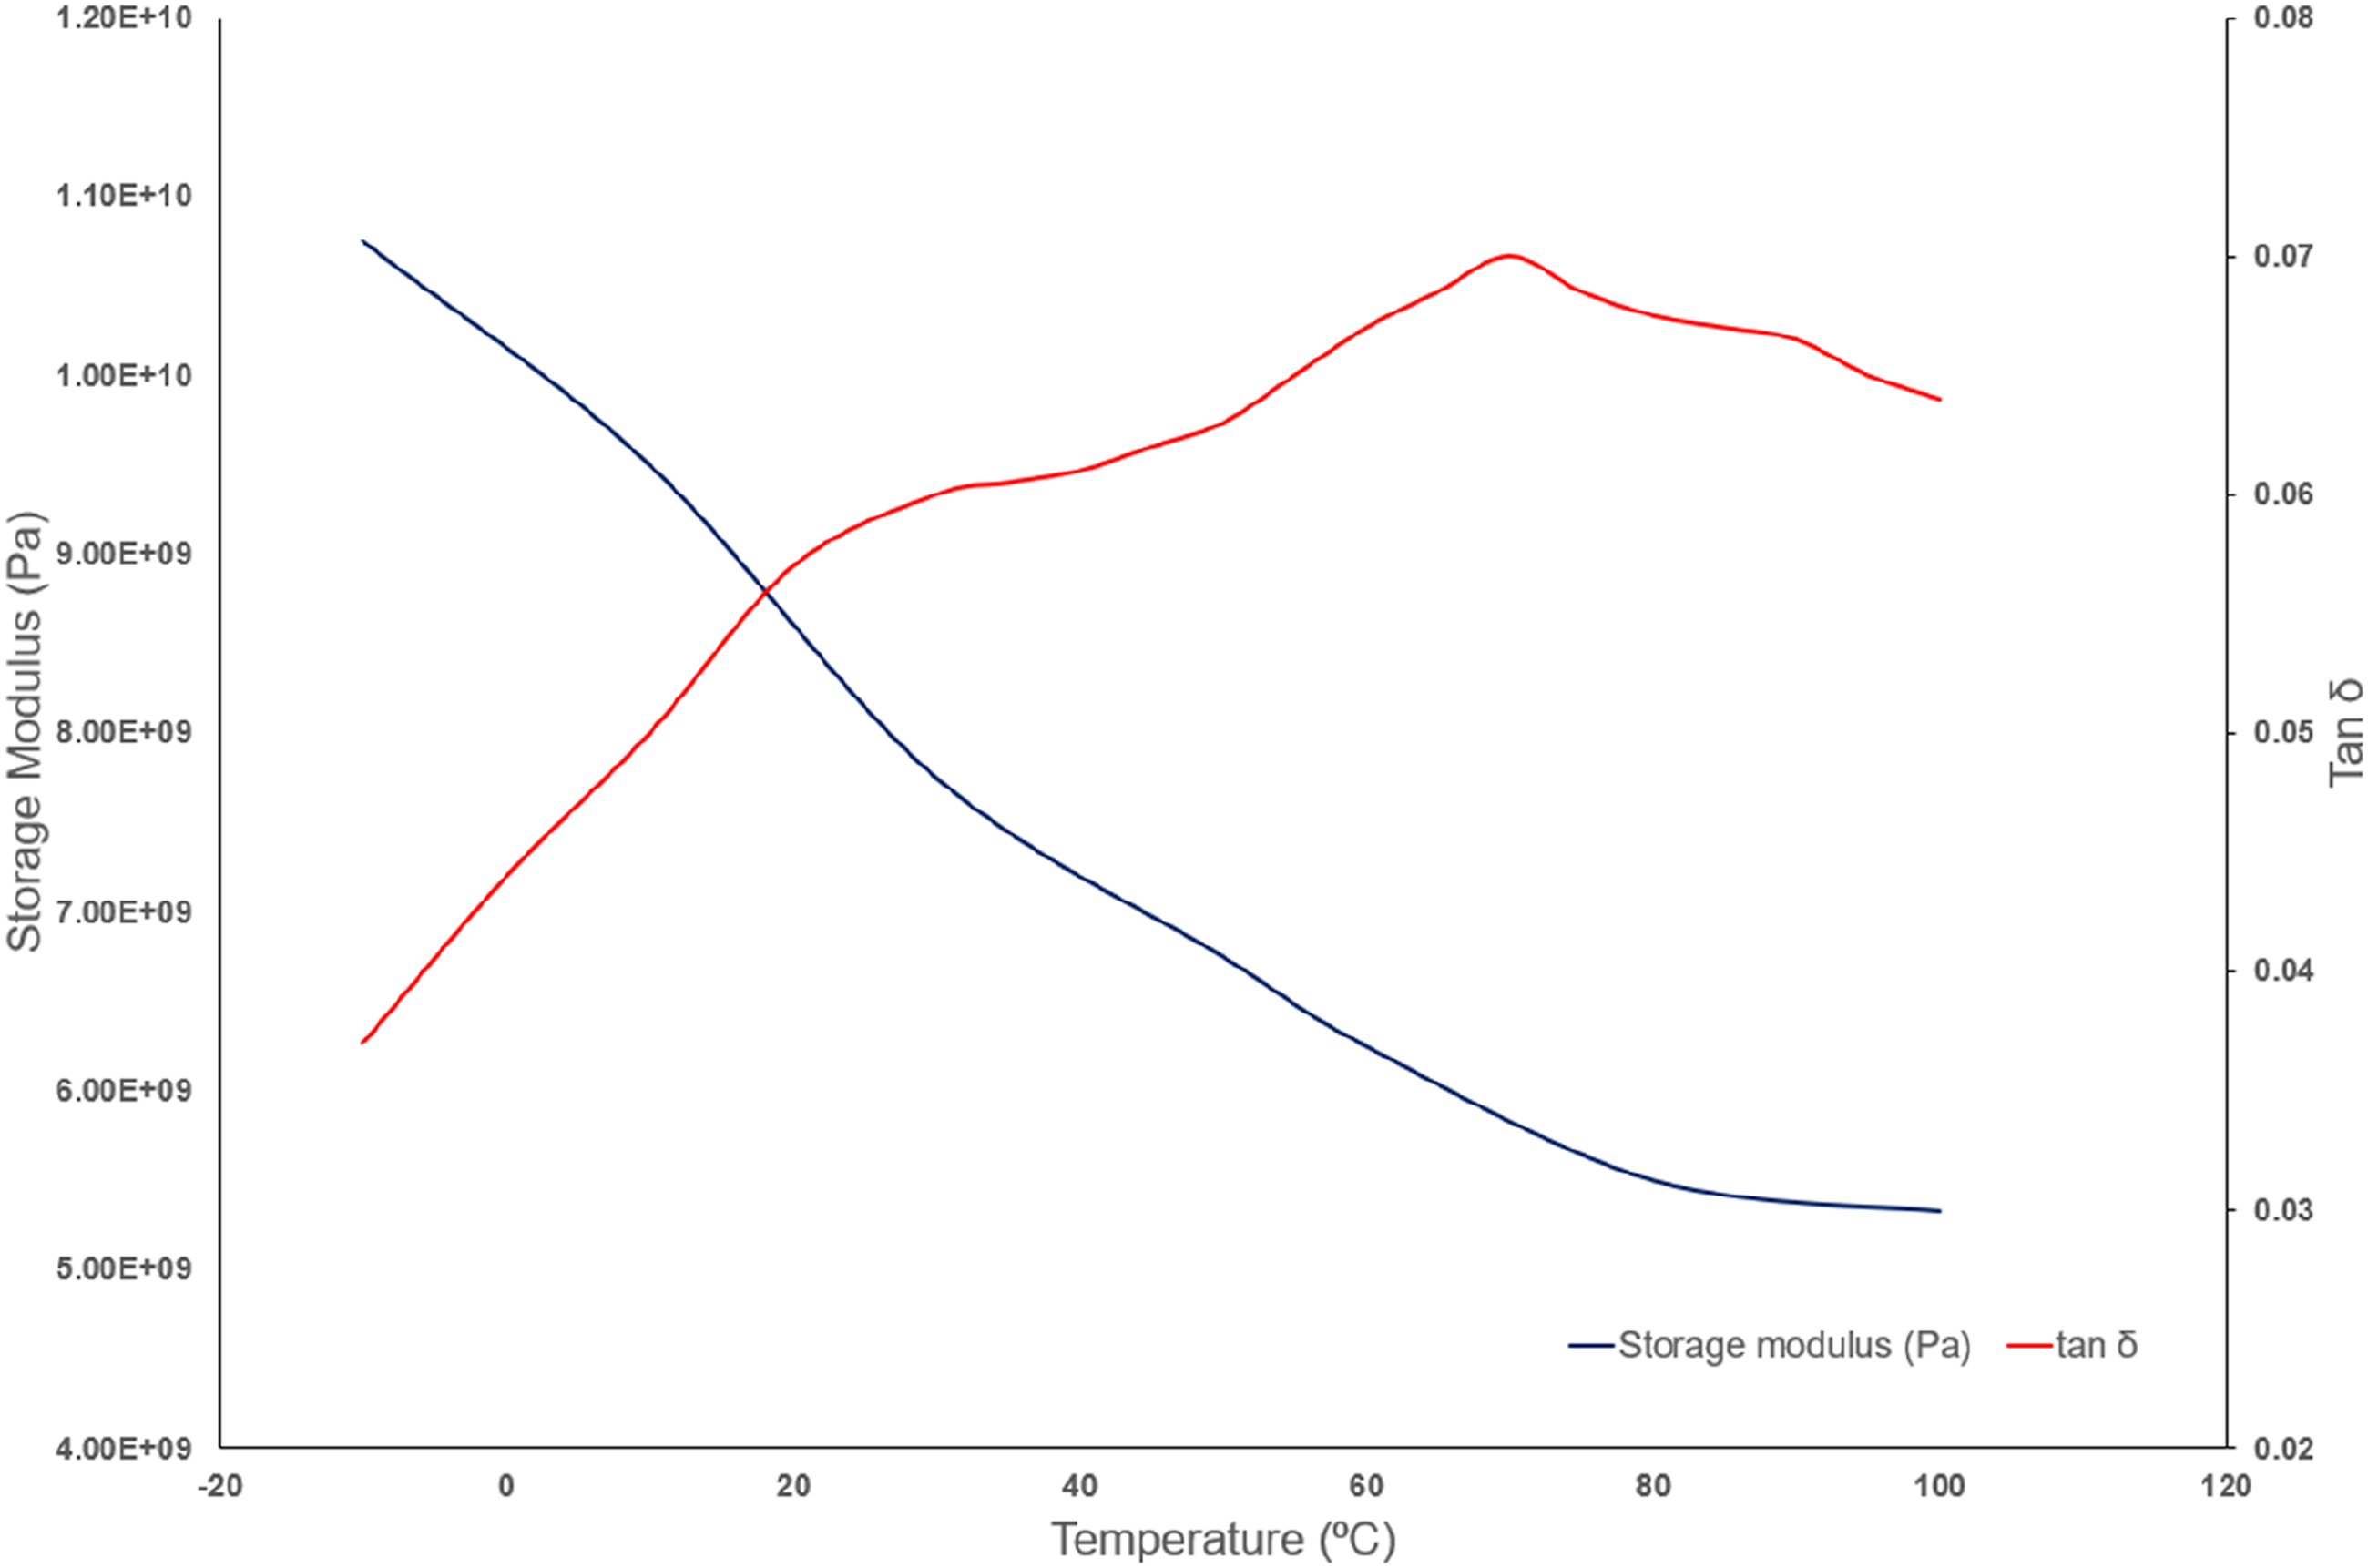
According to Figure 5, the glass transition temperature of the composite is determined from the peak of tan δ as 70°C and this can be considered as a temperature limit for the structural applications because the mechanical resistance of the composite drops dramatically after Tg. In addition, the evolution in the storage modulus indicates some important outcomes regarding the stiffness of the tested composites. As mentioned formerly, temperature increase, damage accumulation and creep lead to stiffness drop for the studied composites. During the DMA tests, we have eliminated the effect of the damage accumulation and creep during cyclic loading and focused on exclusively the temperature effect. From Figure 4(b), the strain of the 520th cycle is seen as 0.66% and the temperature at this point is observed around 32°C. On the other hand, the strain of 322,700th cycle in Figure 4(b) is around 0.88% and the temperature is around 35°C. The increase of strain is inversely proportional to the stiffness of the composite for the elastic regime and the change in the strain between two different cycles can be read as 33% of the stiffness drop.51,52 If one compares the storage moduli of the composite for 32°C and 35°C, the storage modulus has dropped from 7.8 GPa to 7.4 GPa which corresponds to a change of 5%. From the DIC observations, the change of the stiffness (1/Ɛ xx ) was observed as 33%. Then, it can be concluded that the damage accumulation and cyclic creep during the fatigue tests are responsible for the major part of the stiffness drop. The modulus values used to establish the analogy between stiffness drop and thermal effect may not completely overlap with the actual modulus values for the tested composite since the storage modulus is a component of complex modulus and has a dynamic characteristic. However, in essence, the complex modulus is a representative of the elasticity modulus as determined by standard procedures.53–55
Cyclic creep and strain relationship
The influence of cyclic creep on strain, due to the viscoelastic nature of PA66GF30, cyclic creep may play an important role in mean stress/strain sensitivity. In the literature, it was seen that cyclic creep shows a similar behavior like steady creep with respect to temperature. Then an Arrhenius type law given in equation (5) is used to define creep behavior.
56


Scanning electron microscope (SEM) observations
After fatigue fracture, fracture surfaces were observed through SEM so as to identify the damage mechanisms in the composites. General overview of the fracture surface is also given in Figure 6. In Figure 6, the fiber alignment can be seen clearly along the y-axis. Crack propagation, the interaction between fiber and matrix, and their interface are explained below in detail, and the statements proposed on fatigue damage mechanisms are supported with the SEM images. General overview of the fracture surface.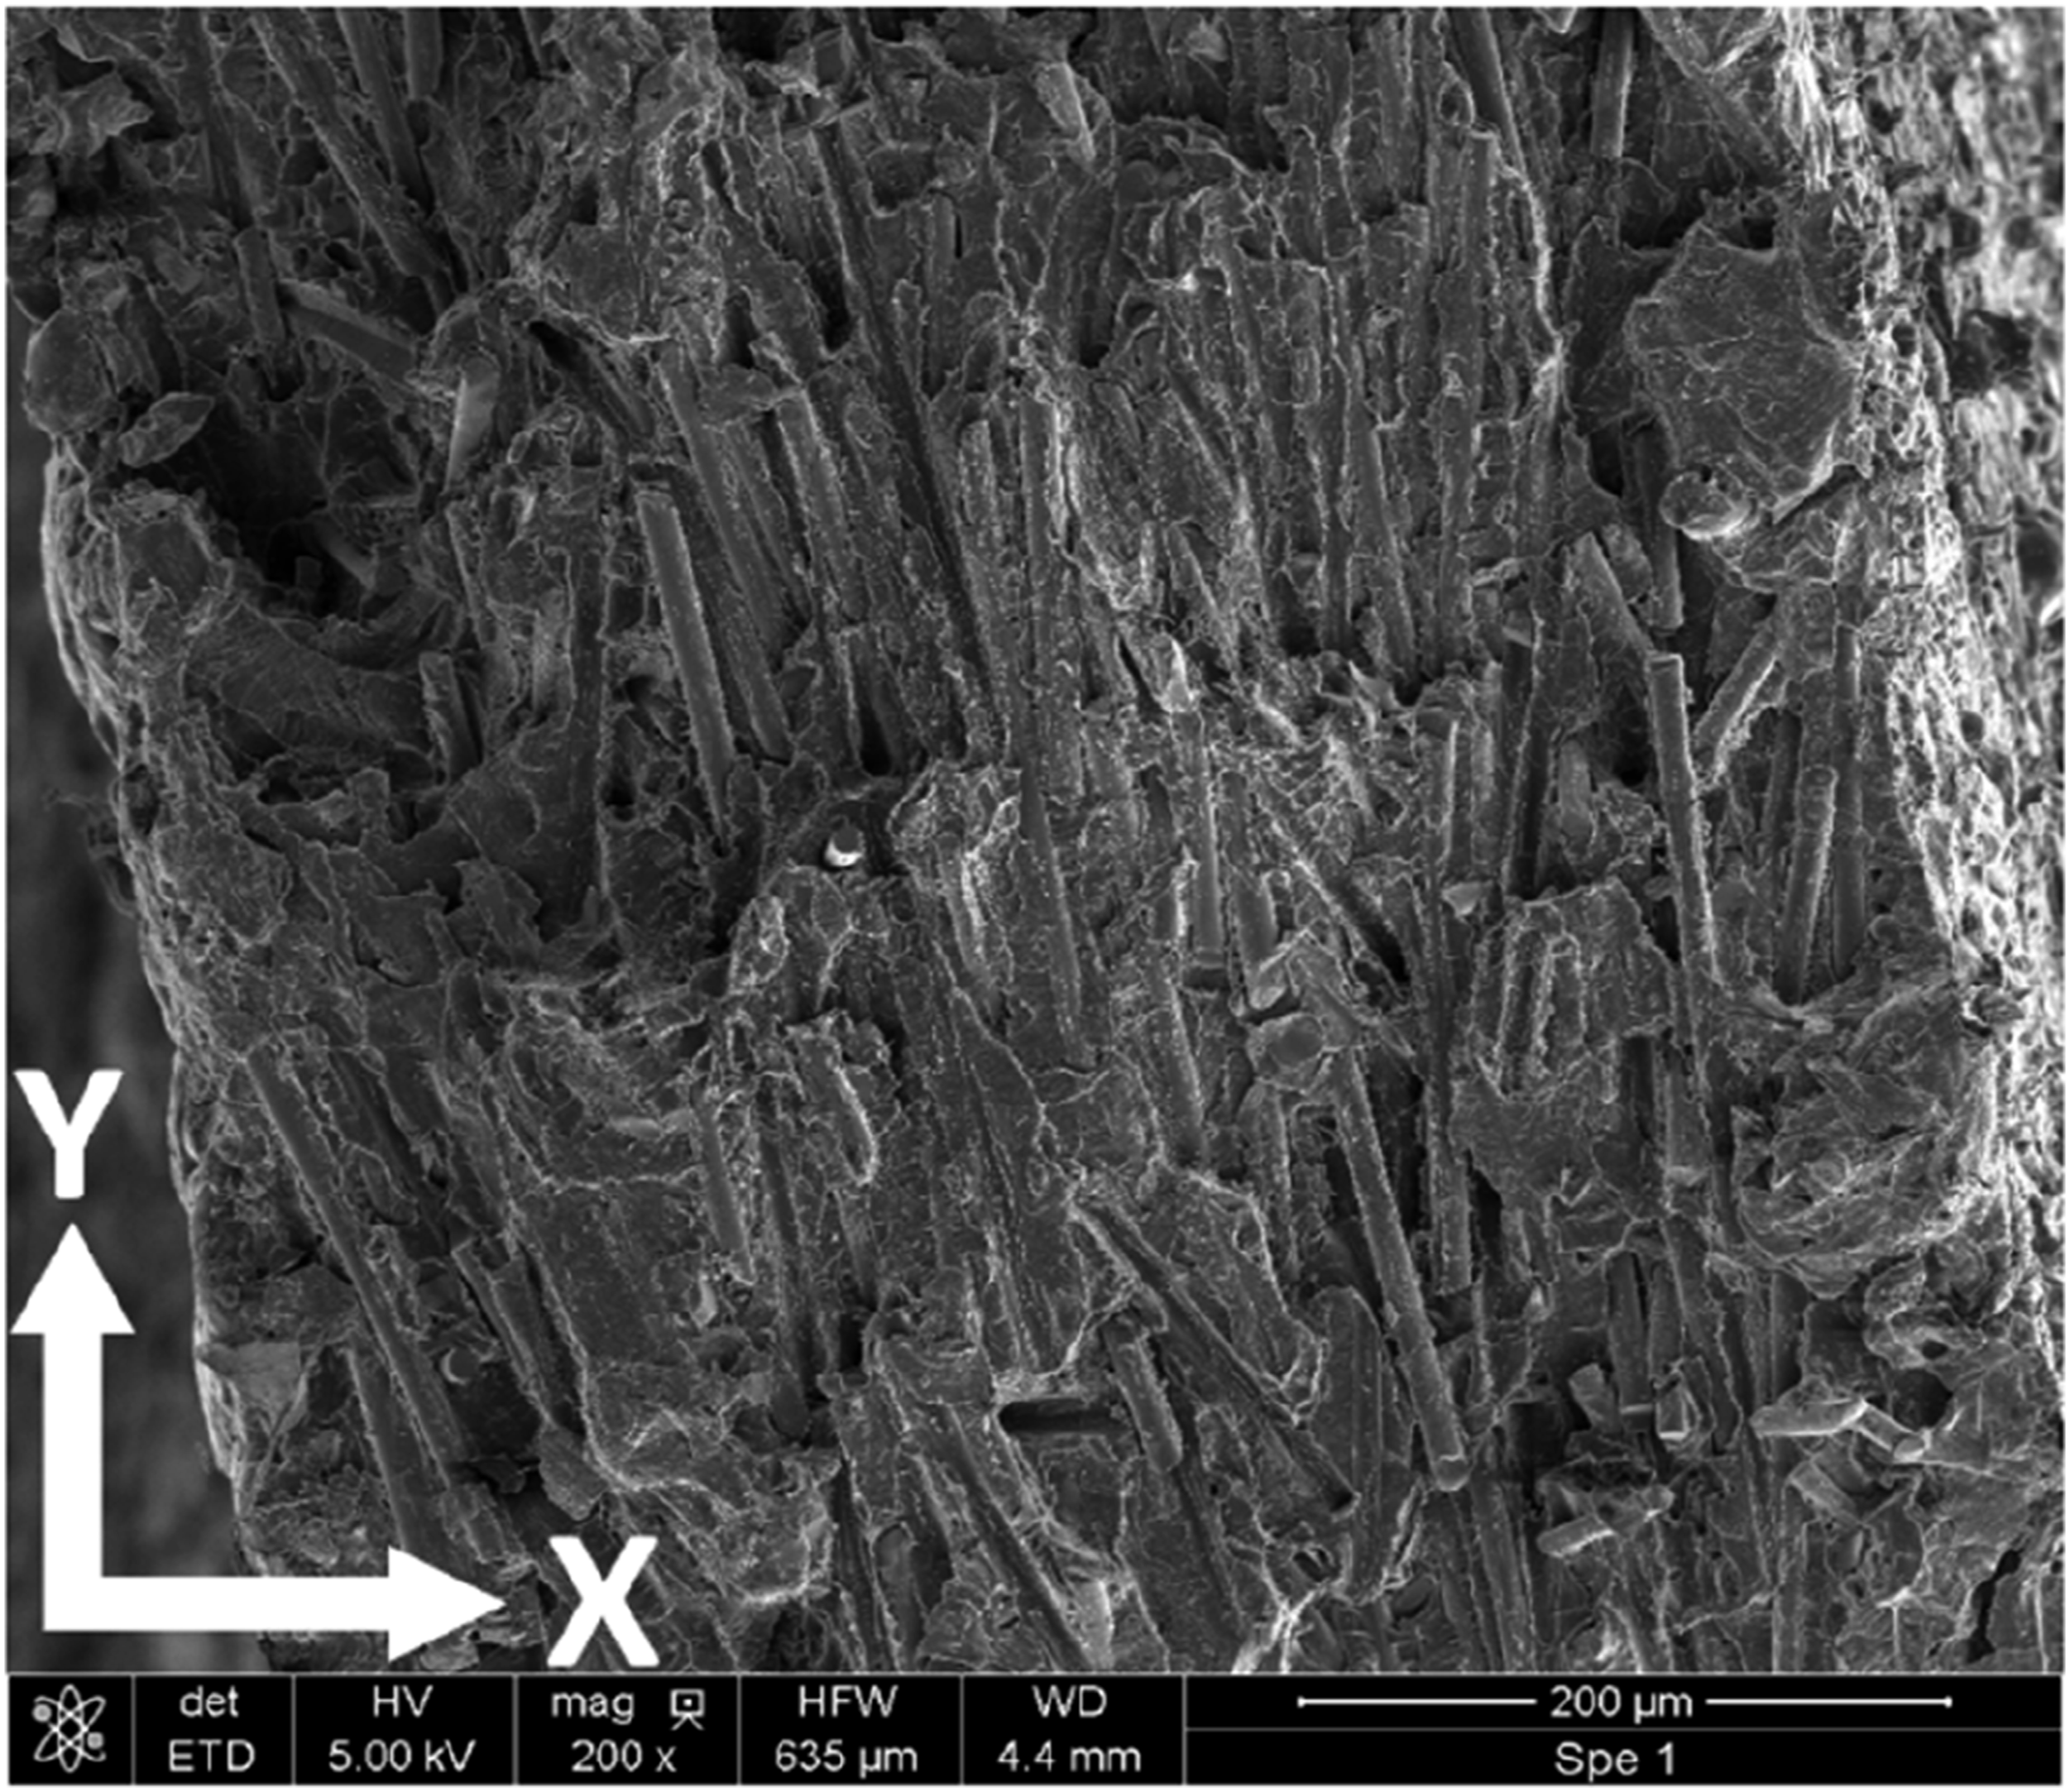
In the first stage of the fatigue tests, repeated tensile-tensile loading of the PA66GF30 creates plastic deformation zones in the PA66 due to local deformation amplifications, preferentially in areas with a microstructure gradient (fiber clusters, fiber orientation variation). Plastic deformation is observed under ductile fracture and it is a slow process, requiring much energy to occur, which lasts for most of the material’s lifetime. In addition, this plastic deformation can lead to cavity opening at the fiber extremities where a lack of chemical treatment is observed. However, at this first stage of the life cycle, this mechanism is reversible since the cavities are not enlarged in the limited energy introduction to the system. In the second stage, as the increase of cycle numbers, these plastically deformed zones will generate a typical formation called matrix crazing around fibers as shown in Figure 7(a) and (b). Crazing is a particular mode of failure for the composites during tensile deformation where a large expansion component produces a rapid volume increment before failure. This process dissipates a significant amount of energy, which consumes the energy required for the crack propagation, thus the failure is delayed.
55
(a) Plastic deformation of the matrix (b) cavity formation around the fibers.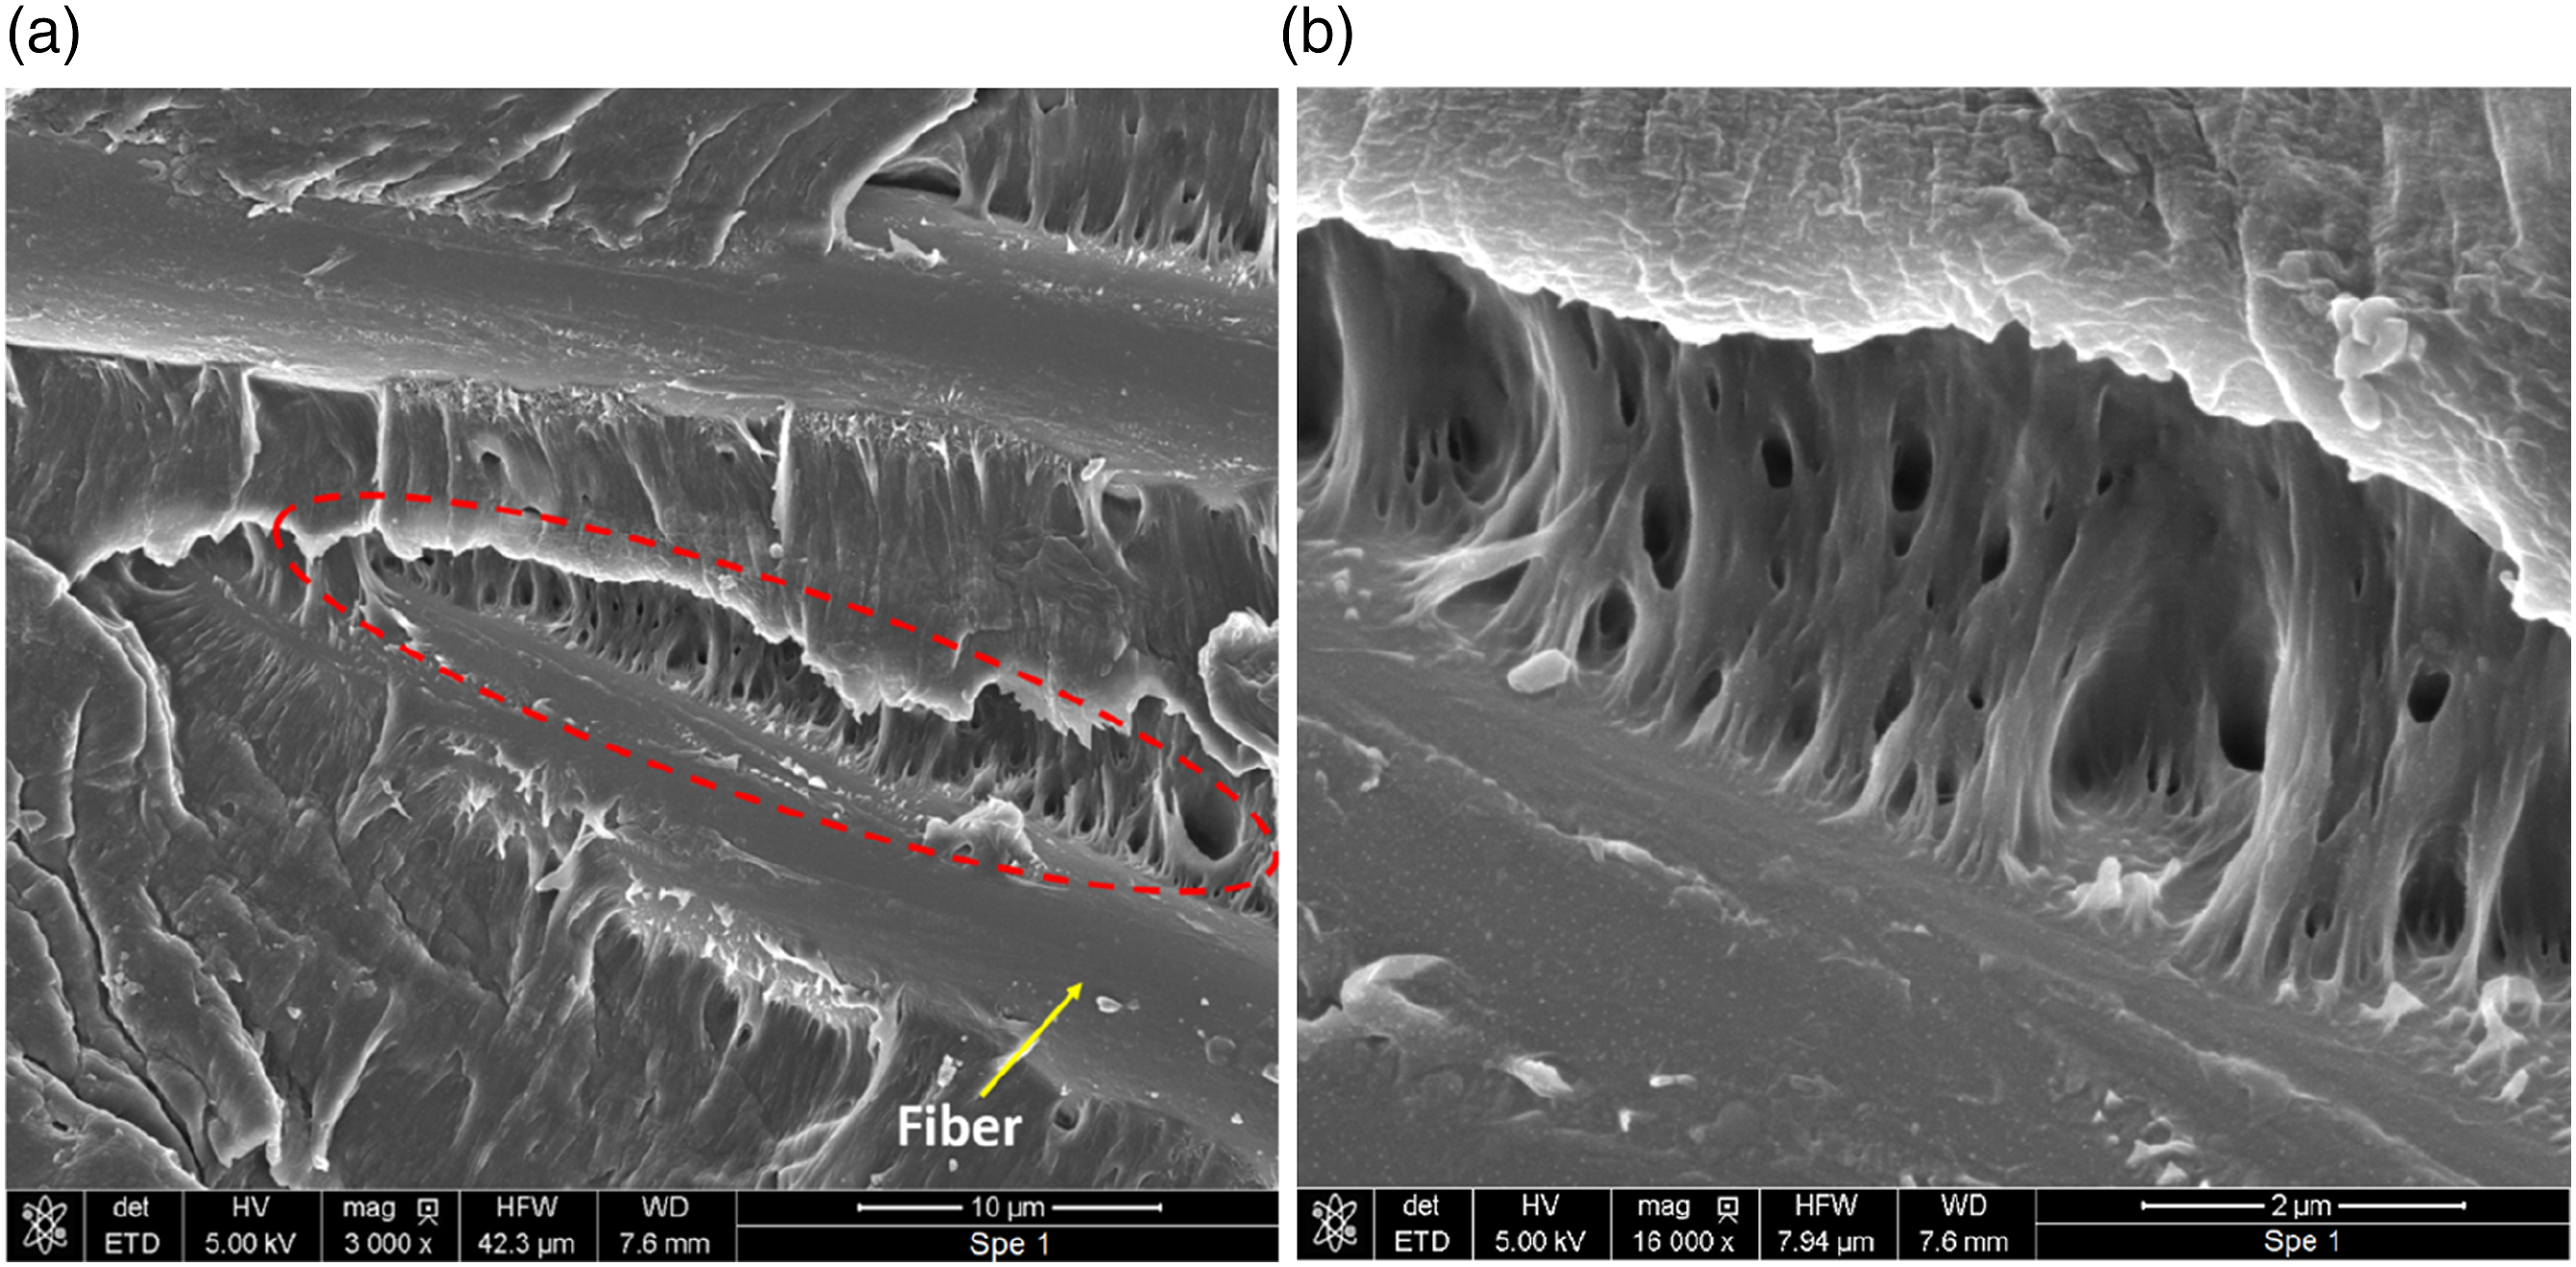
Following the appearance of the first nanovoids, with the accumulation of more energy in the material, micro-cracks eventually appear in the plastically deformed areas of the matrix. This results in a redistribution of stress in the corresponding region. It is therefore in this region that the fatigue crack is initiated as shown in Figure 8(a) and (b). Indeed, it is possible that ductile fracture can evolve into a brittle mode, but the reverse is not true. When the crack reaches a critical size, its propagation becomes faster and more unstable. Therefore, some plastically deformed zones are observed in the microstructure, as shown in the inset of Figure 8(b). (a) Crack initiation at the fiber extremities (b) plastic deformation around the fibers.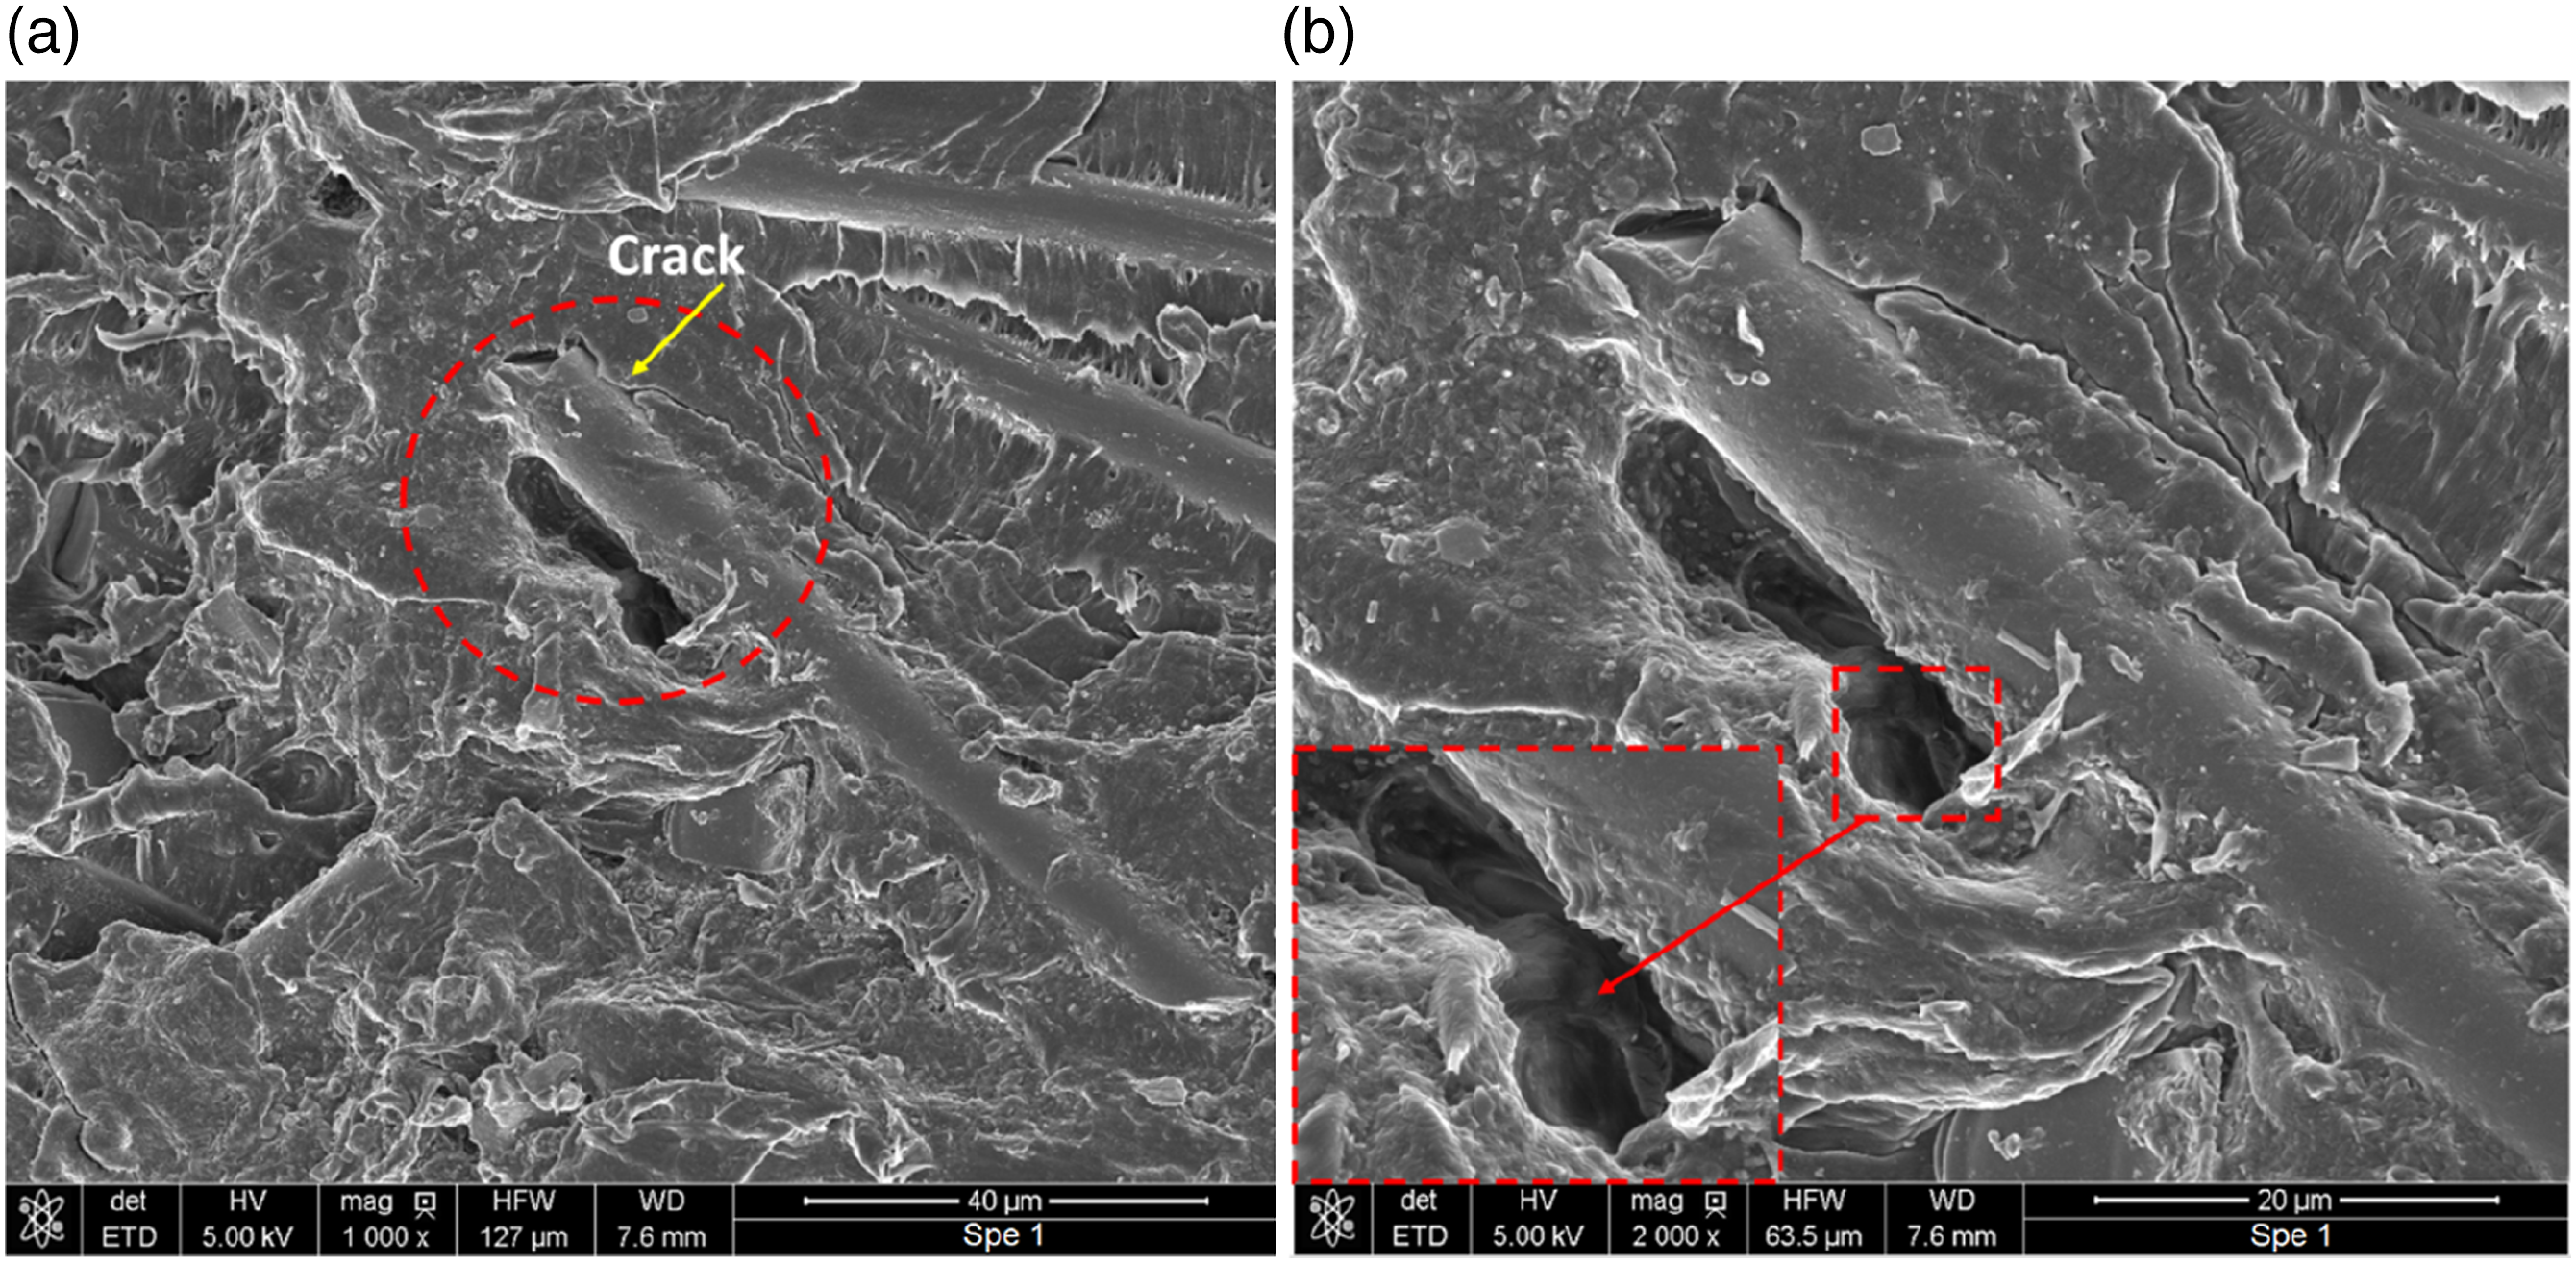
In Figure 9, the fiber indicated with the red arrow on the fracture surface shows an important length out of the fracture zone. In addition, curved empty spots (marked with yellow arrows) are observed in the fracture surface with an angle to the crack propagation direction shown with the green arrow. This indicates that fibers were pulled out during the crack propagation. This fiber pull-out from the matrix also called decohesion, releases the stress on the matrix. Accordingly, the matrix can deform more widely and flaws are generated between both sides of the crack. Moreover, if the number of pulled-out fibers increases significantly, this may also contribute to the decrease in stiffness during fatigue testing, as shown in Figure 5(a) and (b). Fiber pull-out from the matrix.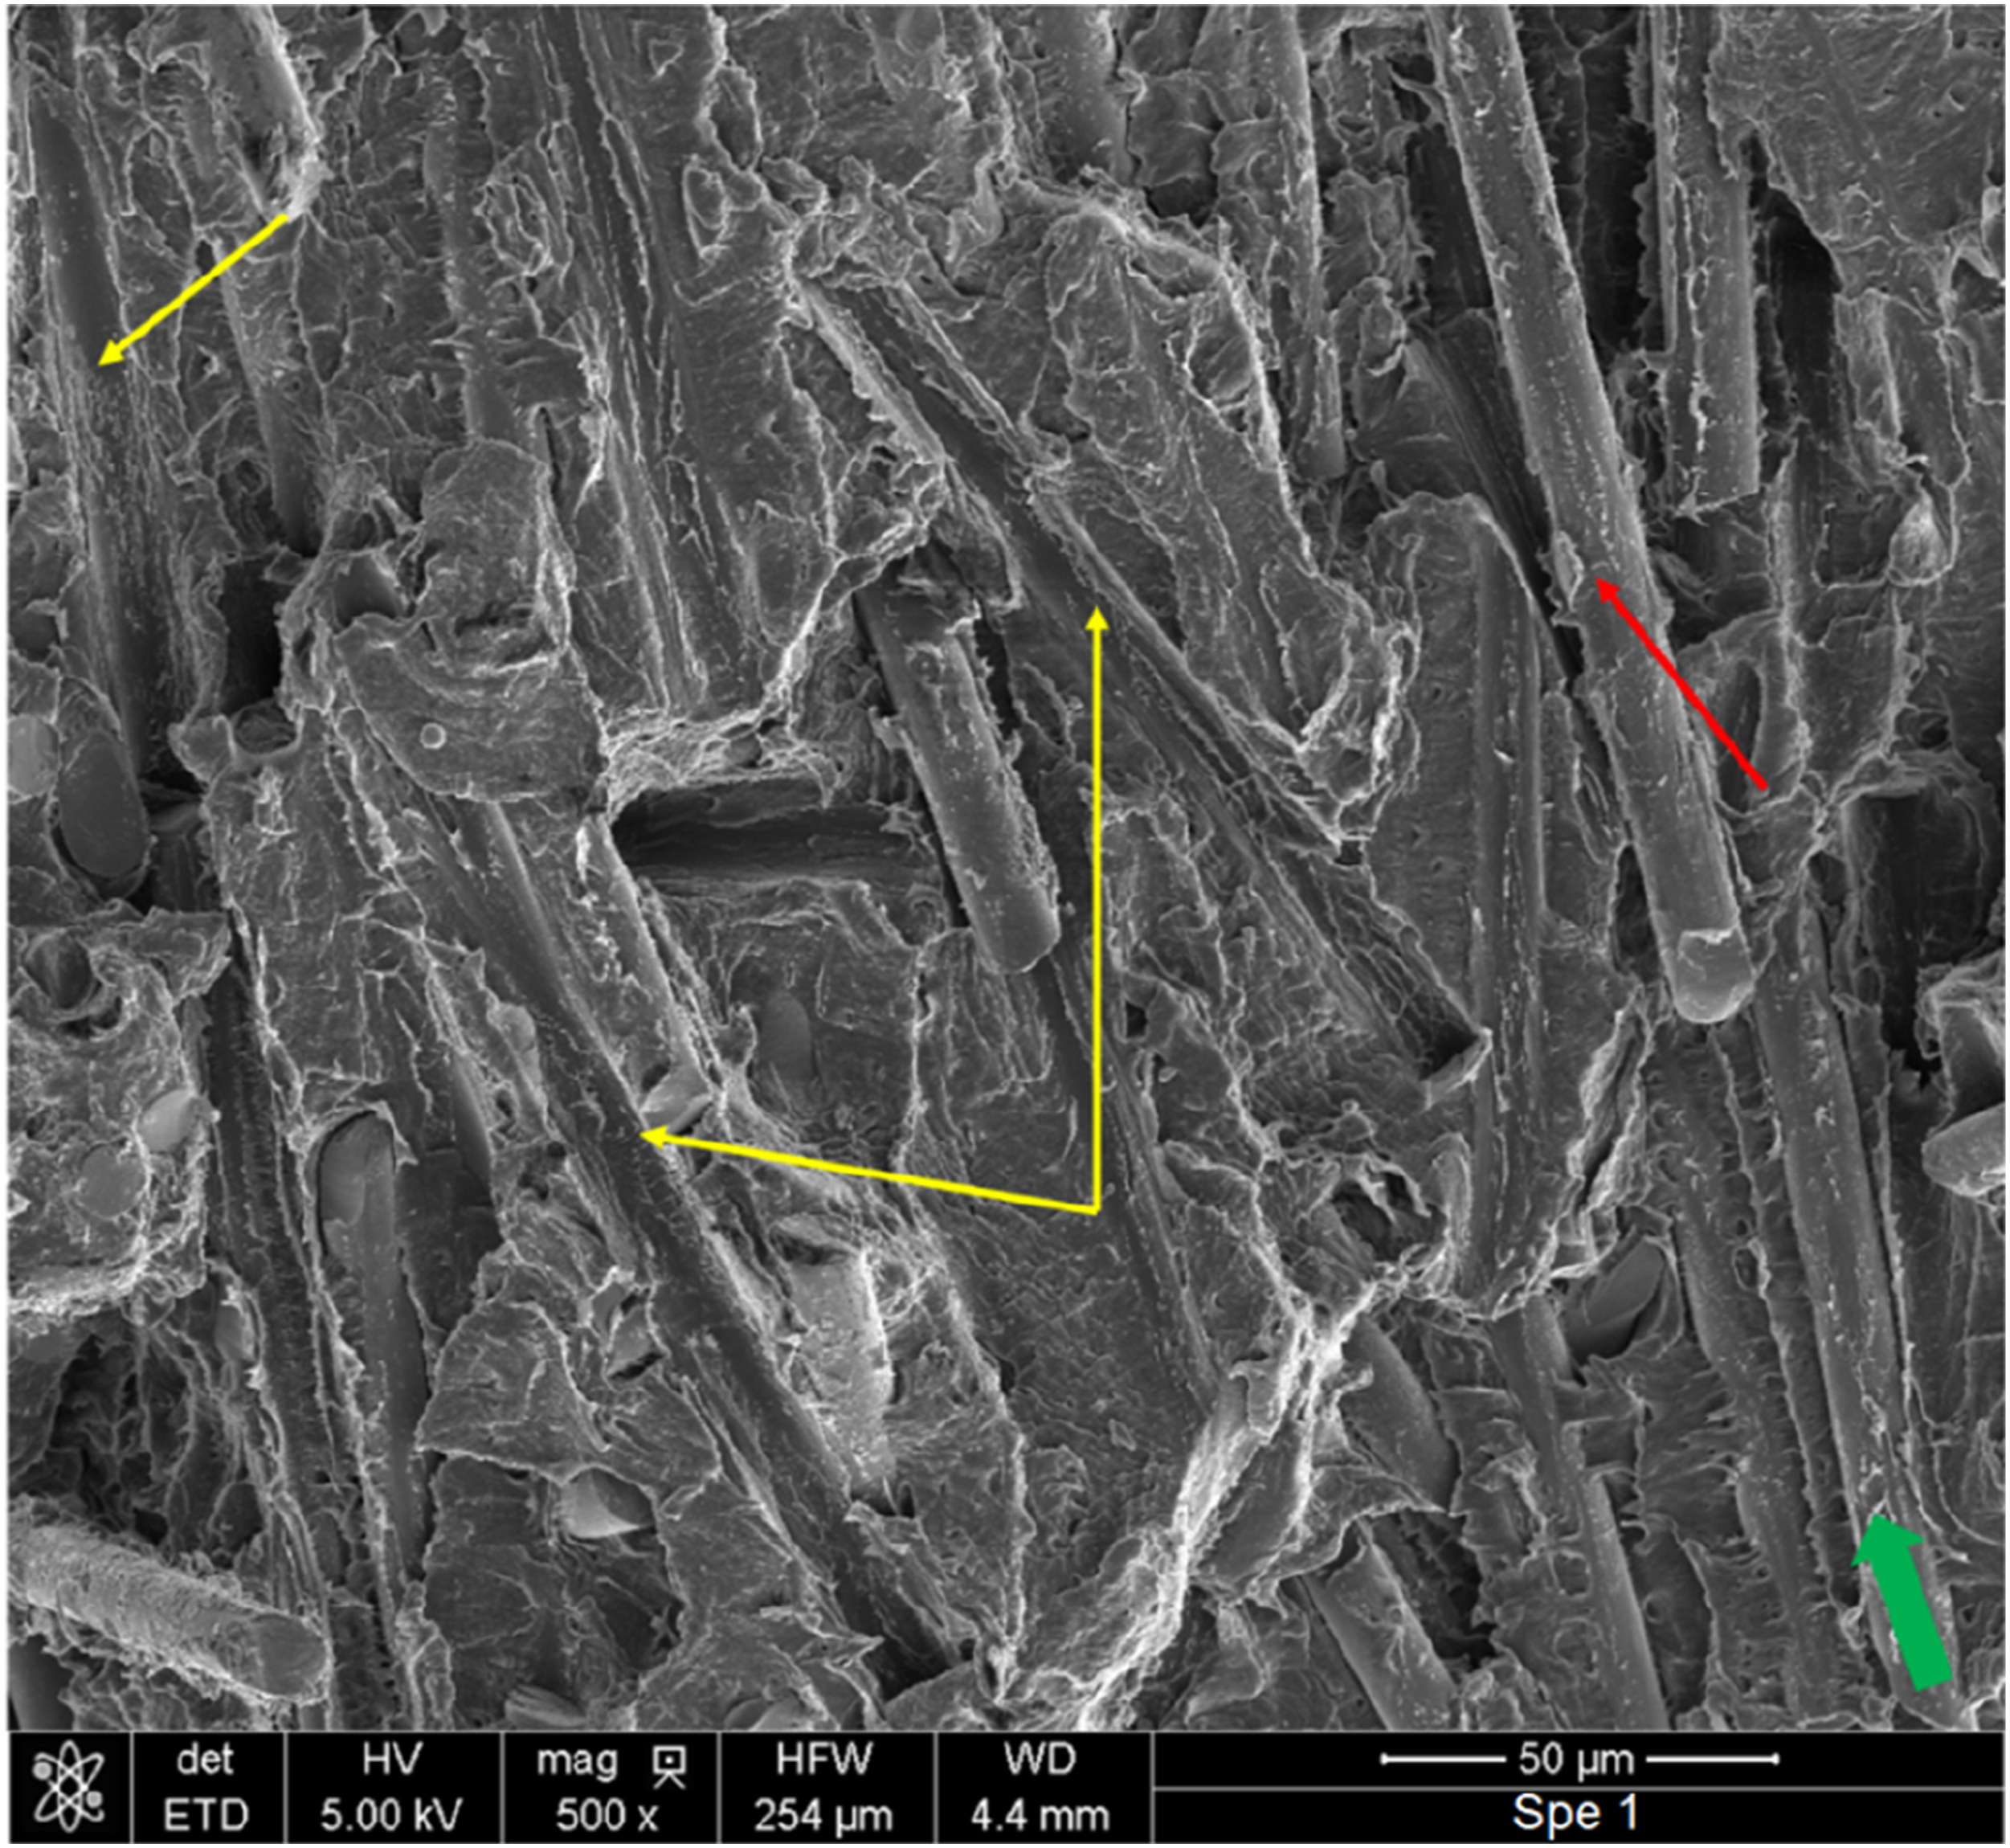
The embedded length of the fibers inside the matrix plays an essential impact in the fracture of fiber reinforced composites. The fibers break if a long length of fiber remains inside the fracture surface and there is excellent interfacial adhesion between the fiber and the matrix. The fiber, on the other hand, tends to be pulled out if the embedded length of the fiber is short and the matrix-fiber bonding is weak.
59
As illustrated in Figure 10(a), if this embedded length falls to an intermediate value, a combined mechanism of fiber break and fiber pull-out occurs. In addition, as demonstrated in Figure 10(b), the fibers aligned near normal to the crack opening or the fracture surface plane can play more likely a bridge role. This implies that at each bridging site, the fiber generates discrete traction that lowers the stress applied at the crack tip by which increasing the fracture toughness. In a similar way, one can also think of an obstruction of the crack opening in the crack propagation zone in favor of the fibers. In this regard, to advance the crack, more strain energy must be applied and then dissipated to overcome the constraint due to fiber bridging. The crack opening resistance is therefore improved due to the presence of a fiber bridging which increases the fracture toughness. (a) Break in the fibers (b) fiber bridging in PA66GF30.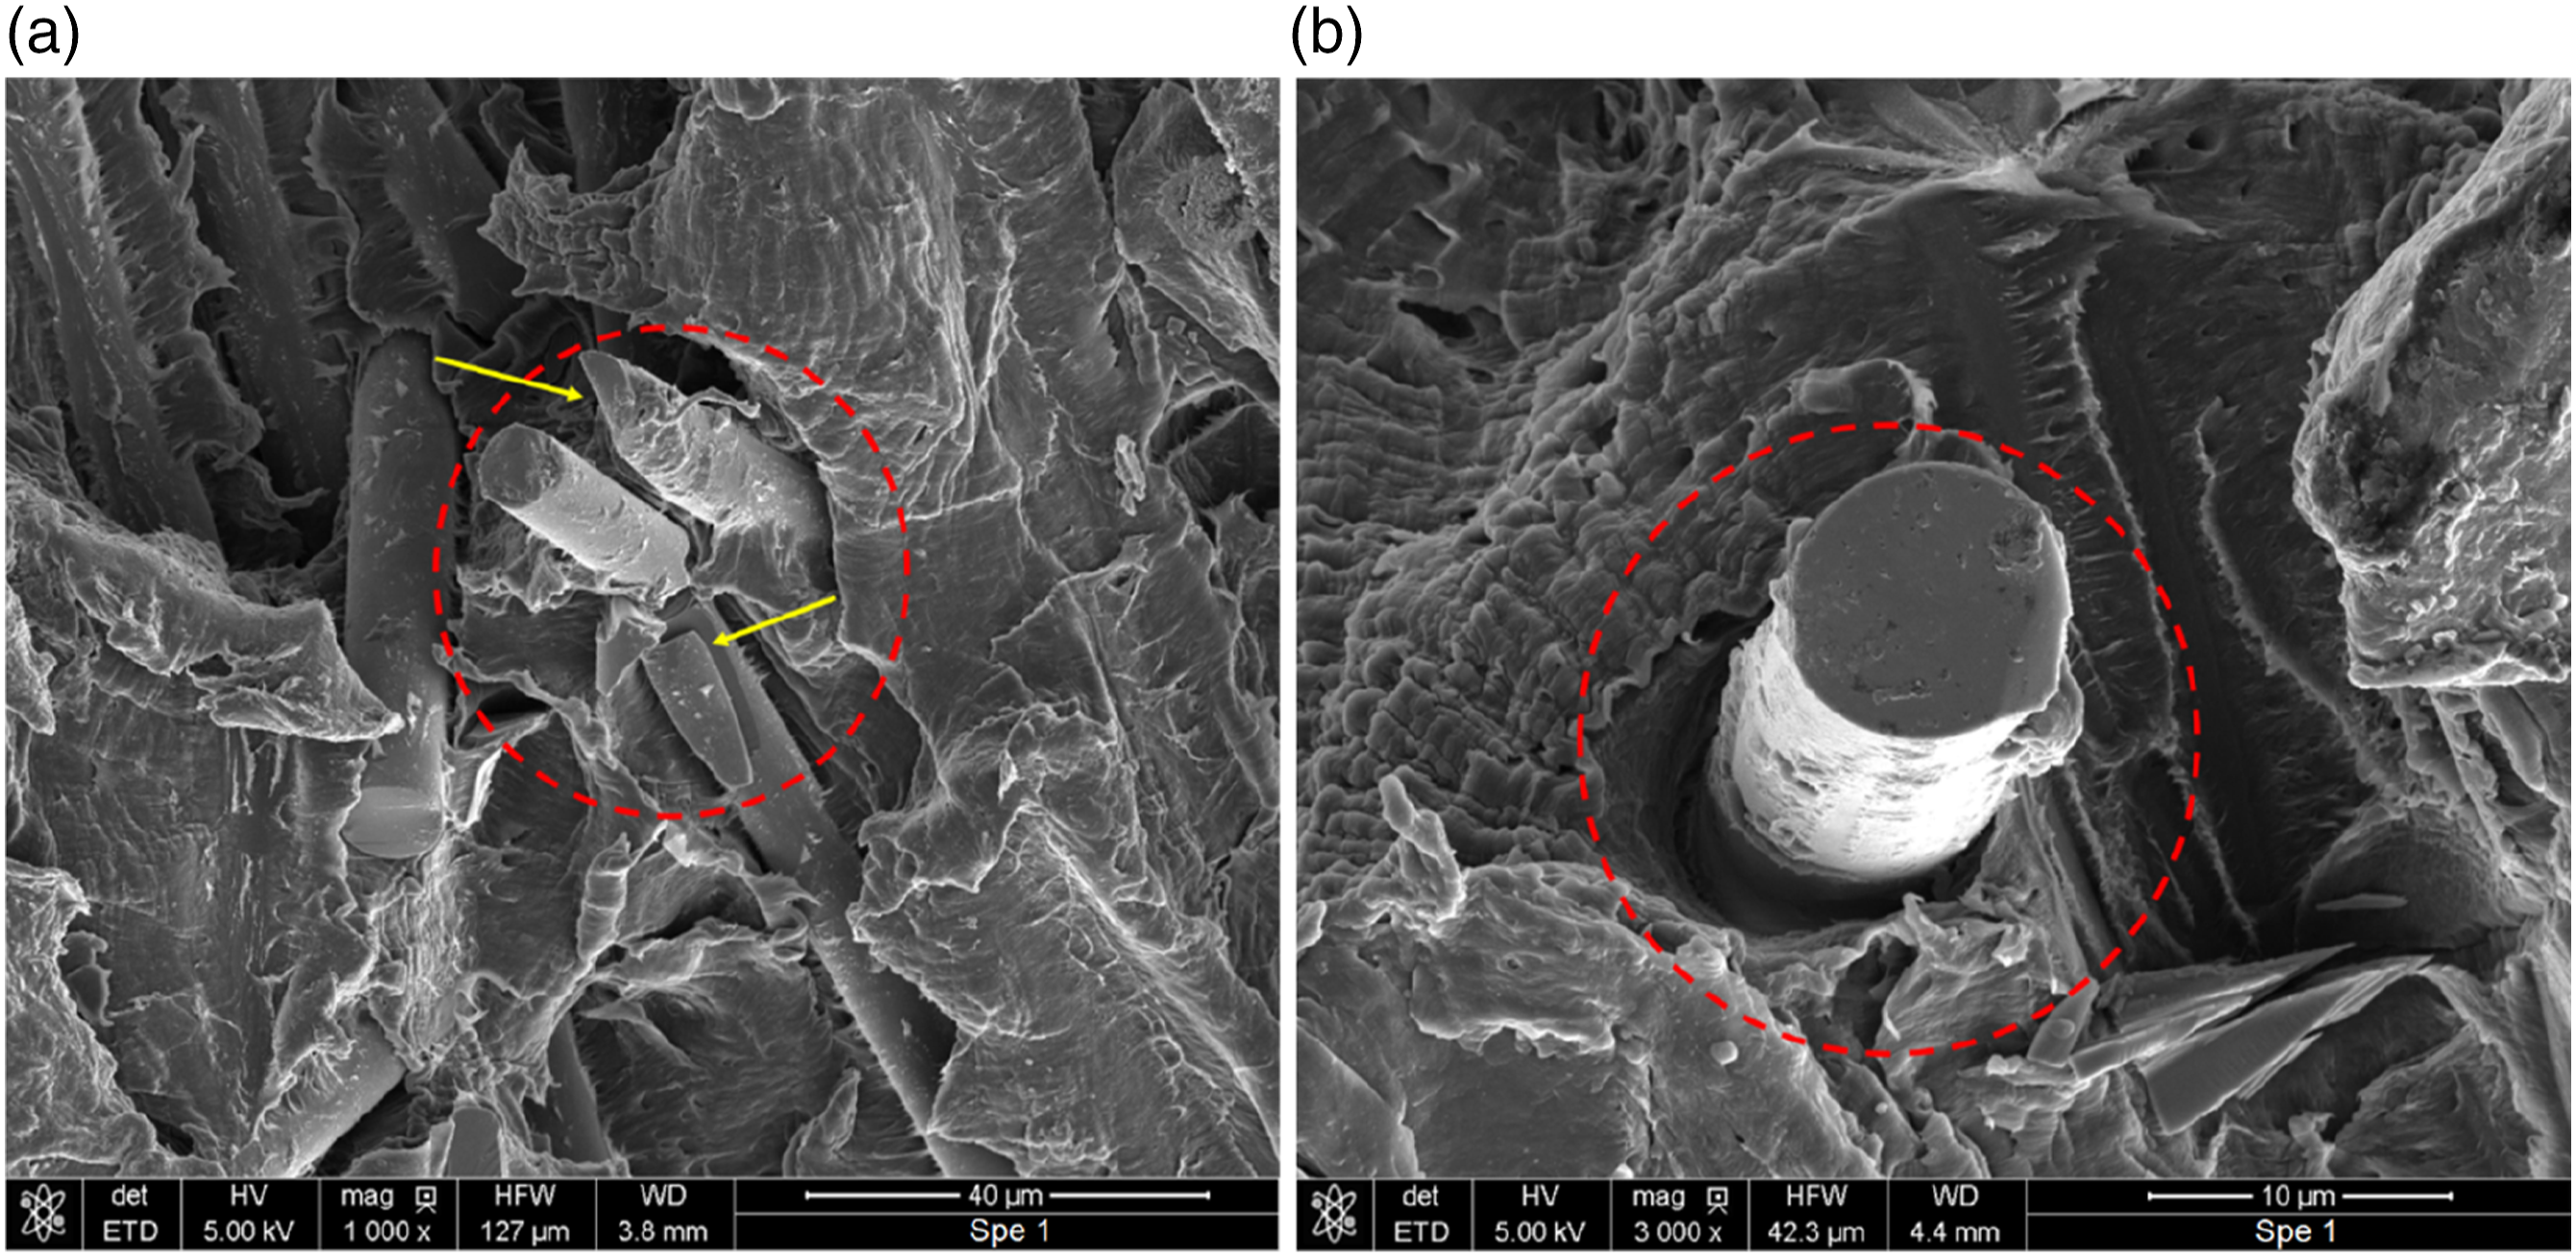
Conclusion
In this experimental study, the evolution of the thermal contour during the equi-biaxial fatigue test was examined and its influence on the strain field was investigated by employing DIC. By the initiation of the test, the maximum temperature over the ZOI climbed rapidly to 35°C with a quasi-linear trend up to 10,000 cycles then the temperature was stabilized creating a long plateau with respect to the number of cycles. However, the thermal contour expanded gradually by the increasing cycle numbers. At the same time, the strain field over the ZOI was observed. It is seen that the temperature increase leads to a drop in the stiffness and this is also called as ratcheting effect. However, from DMA investigation it is concluded that the principal cause for the strain drop was related to the damage accumulation and cyclic creep during the tests. In addition, the principal strain in the y-axis where the major part of the fibers is aligned was found lower than the x-axis. This was an expected result and it is consistent with the iso-strain modeling approach for the fiber reinforced composites. Besides, the shear stress component observed from DIC is thought a consequence of the material and geometry based inhomogeneities.
Finally, SEM fractography was carried out to identify fatigue damage mechanisms in the studied composites. Matrix crazing, fiber pull-out, and break in the fibers were observed as the main damage mechanisms in the PA66GF30. Further work on the determination and quantification of the effect of cyclic creep under biaxial fatigue loading as well as a lifetime model considering the effects of temperature, relative humidity, and fiber orientation is underway and will be presented in a forthcoming paper.
Supplemental Material
Supplemental Material - Biaxial fatigue failure of short glass fiber reinforced polyamide 6,6: An in-depth investigation of stiffness drop and microstructural evolution
Supplemental Material for Biaxial fatigue failure of short glass fiber reinforced polyamide 6,6: An in-depth investigation of stiffness drop and microstructural evolution by Alaeddin Burak Irez in Journal of Thermoplastic Composite Materials.
Footnotes
Acknowledgements
The author acknowledges Dr Taylan Ors from Université de Haute-Alsace for his technical help and valuable discussions.
Declaration of conflicting interests
The author(s) declared no potential conflicts of interest with respect to the research, authorship, and/or publication of this article.
Funding
The author(s) received no financial support for the research, authorship, and/or publication of this article.
Supplemental Material
Supplemental material for this article is available online.
References
Supplementary Material
Please find the following supplemental material available below.
For Open Access articles published under a Creative Commons License, all supplemental material carries the same license as the article it is associated with.
For non-Open Access articles published, all supplemental material carries a non-exclusive license, and permission requests for re-use of supplemental material or any part of supplemental material shall be sent directly to the copyright owner as specified in the copyright notice associated with the article.