
Abstract
In this study, poly (ethylene-co-vinyl acetate)/mesoporous silica EVA/SBA-15 nanocomposites, containing 0.5, 1.5, and 2.5 wt% of unfunctionalized and functionalized SBA-15 were prepared by melt blending in an internal mixer. Mesoporous silica was synthesized through the sol-gel method and modified by hexadecyltrimethoxysilane (HDTMS). Several characterizations were performed; including Fourier transform infrared spectroscopy (FTIR), scanning electron microscopy (SEM), differential scanning calorimetry (DSC), thermogravimetric analysis (TGA), mechanical properties, dynamic mechanical analysis (DMA), and dielectric study to characterize the physicochemical properties of elaborated materials. The results revealed the successful synthesis and functionalization of mesoporous silica, as confirmed by the FTIR and SEM. The crystallinity of the nanocomposites decreased and the elastic modulus increased with the incorporation of the mesoporous silica. Measurement of tensile properties shows that the tensile strength of the nanocomposite content of 1.5 wt% F-SBA-15 is 17.2% is higher as compared to pure EVA. DMA analysis validates the improvement in mechanical properties of the EVA/SBA-15 samples. SEM images displayed well-dispersed F-SBA-15 nanoparticles and enhanced interfacial adhesion between the phases. TGA indicates the enhancement of the thermal stability of nanocomposites as compared with the pure EVA matrix. The surface functionalization presented an approach to preparing nanocomposites with enhanced thermal stability and a low dielectric constant.
Keywords
Introduction
Over the past years, ever-increasing interest has been devoted to the study of nanofiller-reinforced polymeric materials. The use of small amounts of inorganic nanofillers such as silica has resulted in the improvement of a wide range of material properties, exceeding those of the unfilled polymers. The key factor in such superior properties, at filler loadings much smaller than conventional microfillers, is related to the size of the nanoparticles, which leads to a spectacular increase in interfacial area as compared with the traditional composites. 1 Obtaining well-dispersed nanoparticles to exploit the high specific surface area of the nano-sized filler is indispensable for achieving significant property enhancement. However, getting a good dispersion of silica to the primary particle size is a great challenge due to the high polarity and hydrophilic behavior of silica. The surface of silica contains a number of hydroxyl groups, called silanols, with strong filler-filler interactions; thus, a complex geometry from primary particles to agglomerates and clusters is formed. 1 These characteristics cause a minor dispersion of silica in the polymer matrix, which reduces the interactions due to poor chemical affinity for non-polar polymers. To enhance the compatibility between silica nanoparticles and non-polar polymers and to reduce the size of silica agglomerates, it is mandatory to modify the silica surface. 2 Such a surface modification reduces the high surface energy of the nanoparticles and the particle-particle interactions. This increase in the hydrophobicity of the nanoparticles leads to enhanced filler-matrix compatibility and improved interfacial interaction. Therefore, the dispersion of the filler in the polymer matrix improved due to the more probable interactions of the polymer with the modifier agents than with the inorganic particle surface.3,4
Mobil Corporation reported the first discovery of mesoporous materials in 1992, and since then much attention has been paid to developing their synthesis and application. 5 Due to their intrinsic nanostructural properties offering many exceptional advantages, such as high specific surface areas, large pore volume, and tunable pore sizes range from 2 to 50 nm. 6
In 1998, Zhao et al., 7 reported the synthesis of a new mesoporous silica called SBA-15 in a cooperative self-assembly process with the use of non-ionic triblock copolymer (EO20PO70EO20) as template, also known as Pluronic P123, and tetraethylorthosilicate (TEOS) as silica source in an acidic medium to hydrolyze and polycondense the silica precursor. SBA-15 is characterized by a high specific surface area (600–1000 m2·g−1), uniform pore sizes up to approximately 30 nm, and a highly ordered hexagonal mesostructure with walls thicknesses of 3.1–6.4 nm, 7 which makes them suitable candidates for numerous applications.8–11
On the one hand, poly (ethylene-co-vinyl acetate) with different acetate contents, is widely used in several applications such as wire and cable insulation,12–14 food packaging,15–17 encapsulation of photovoltaic cells,18–20 and hot melt adhesives21–23 due to its desirable physicochemical properties and its ability to accept additives. However, pure EVA shows a few limitations in terms of thermal stability and mechanical properties (tensile strength). 24 The most commonly used methods to overcome the above-mentioned inconveniences are to incorporate nano-fillers into the EVA matrix.25–29
In order to develop chemical bonds between mesoporous silica SBA-15 and polymers, more attention has been devoted to the surface functionalization of SBA-15 by chemical interactions since it can lead to much stronger interactions between organic matrices and SBA-15 nanoparticles. The surface modification takes place by the silylation reaction of organosilane with silanol groups.2,3,30 Mesoporous silica nanoparticles have more advantages than conventional SiO2 nanoparticles and could be utilized as alternative polymer-reinforced fillers; due to their ordered structure, high surface area and easiness for functionalization of the nanopores. As a result, higher polymer/mesoporous silica interaction can be obtained, and thus improve the mechanical and the thermal properties of polymer composites.
Several methods, such as, in situ polymerization, melt blending, and the sol-gel method 31 have been used for the preparation of nanostructured polymer/mesoporous silica nanocomposite. Yu et al., 32 investigated the thermal and mechanical properties of the SBA-15/phenolic resin composite, which was obtained from in situ polymerization of phenyl and formaldehyde. SBA-15 was functionalized with (GOTMS) 3-glycidyloxypropyltrimethoxysilane. As a result, chemical bonds were created between the phenolic resin and GOTMS-SBA-15, increasing the thermal stability and Tg value of the phenolic resin with increasing functionalized SBA-15 amounts. In other study, Wei et al., 33 prepared PMMA/SBA-15 composite via free radical polymerization (FRP) of methyl methacrylate (MMA), and the obtained results indicated that a rise in SBA-15 amount increased the value of Tg and molecular weight. The storage modulus of the composites was improved, and the maximum improvement was obtained at 1 wt% of SBA-15 loading. According to Zhang et al., 34 methyl methacrylate (MMA) monomer was polymerized inside SBA-15 nanopores via the activator regenerated by electron transfer atom transfer radical polymerization (ARGET ATRP) method. It was found that SBA-15 nanopores could be serving as a nanoreactor and had great confinement effects on the MMA polymerization. The results showed that the silane-modified SBA-15 could absorb more MMA monomers than the unmodified SBA-15. Furthermore, the thermal stability, molecule weight, and isotacticity of PMMA inside the pores were improved compared to the unfilled PMMA obtained by the ARGET ATRP method. In the literature, a variety of polymers, such as polypropylene, phenolic resins, polyethylene, polylactic acid, MMA, boron acrylate (BAc), were used to prepare composites with SBA-15 mesoporous silica for numerous applications.35–42
The main purpose of this study is to investigate. The effects of mesoporous silica SBA-15 content and surface functionalization on the physicochemical properties of the hybrid materials. The nanopores of silica can lead to unusually intimate interactions between the polymer and the inorganic phase and some unusual properties can be observed, when compared with nonporous fillers. Despite the massive research in previous literature about silica-based polymers, few review articles focus on polymer/mesoporous silica nanocomposites and no research has discussed the thermal, mechanical and electric properties of SBA-15 functionalized by hexadecyltrimethoxysilane reinforced EVA composites. The inclusion of functionalized SBA-15 in the poly (ethylene-co-vinyl acetate) matrix will bring new features to prepare hybrid materials with low dielectric constants for insulation applications.
Materials & characterization
Materials
Poly (ethylene-co-vinyl acetate) (containing 18% VA), with a density of 0.93 g/cm3 and a melt flow index of 2.5 g/10 min (at 190°C/2.16 kg), TAISOX 7350M was purchased from Formosa Plastics Corporation (Taiwan). The triblock copolymer Pluronic P123 [(EO)20(PO)70(EO)20], Tetraethylorthosilicate (TEOS) (99%), and hexadecyltrimethoxysilane (HDTMS) were purchased from the Sigma-Aldrich company.
Synthesis and functionalization of mesoporous silica SBA-15
The synthesis of SBA-15 includes the dissolution of a non-anionic surfactant in an acidic medium followed by the addition of a silica precursor.43–45 Typically; 4 g of amphiphilic triblock copolymer consisting of ethylene and propylene oxide units (EO20PO70EO20, Pluronic P123) was dissolved in 125 mL of 1.9 M hydrochloric acid under vigorous stirring for 2 h at 35°C. The synthesis requires strong acidic conditions pH ∼ 1. To this solution, 9.15 mL of silica source TEOS was added dropwise and stirred. Subsequently, the suspension was aged in a Teflon bottle for 24 h at 100°C, and the white solid was recovered by filtration, washing, and drying for 12 h at 80°C. The SBA-15 was obtained after calcination in an oven at 500 C using a 2°C/min ramp from 25°C to 500°C to remove the organic template. Specific surface area (SSA) of the mesoporous silica SBA-15 has been evaluated by BET method. The BJH method, based on the kelvin equation, was applied to evaluate pore size distribution by desorption (SBET = 718 m2·g−1, DBJH des = 5.91 nm). 45
The surface functionalization of SBA-15 with HDTMS was accomplished via a post-synthesis treatment of the calcined mesoporous silica. In this typical experiment, 4 g of calcined SBA-15 was added to 80:20 (v:v) ethanol/distilled water in a two-neck round-bottom flask equipped with a magnetic stirring and reflux condenser for 30 min. Then, 2 g of HDTMS was drop-wised into the solution. After homogenization, the solution was refluxed for 24 h at 90°C. The functionalized SBA-15 was recovered with filtration, washed with ethanol (3 times) and distilled water (about 1.5 L), and dried at 80°C for 12 h (the SBA-15 functionalized with HDTMS was named F-SBA-15). A schematic representation of the SBA-15 surface functionalization is given in Figure 1. Schematic illustration of surface functionalization of SBA-15 pores with hexadecyltrimethoxysilane.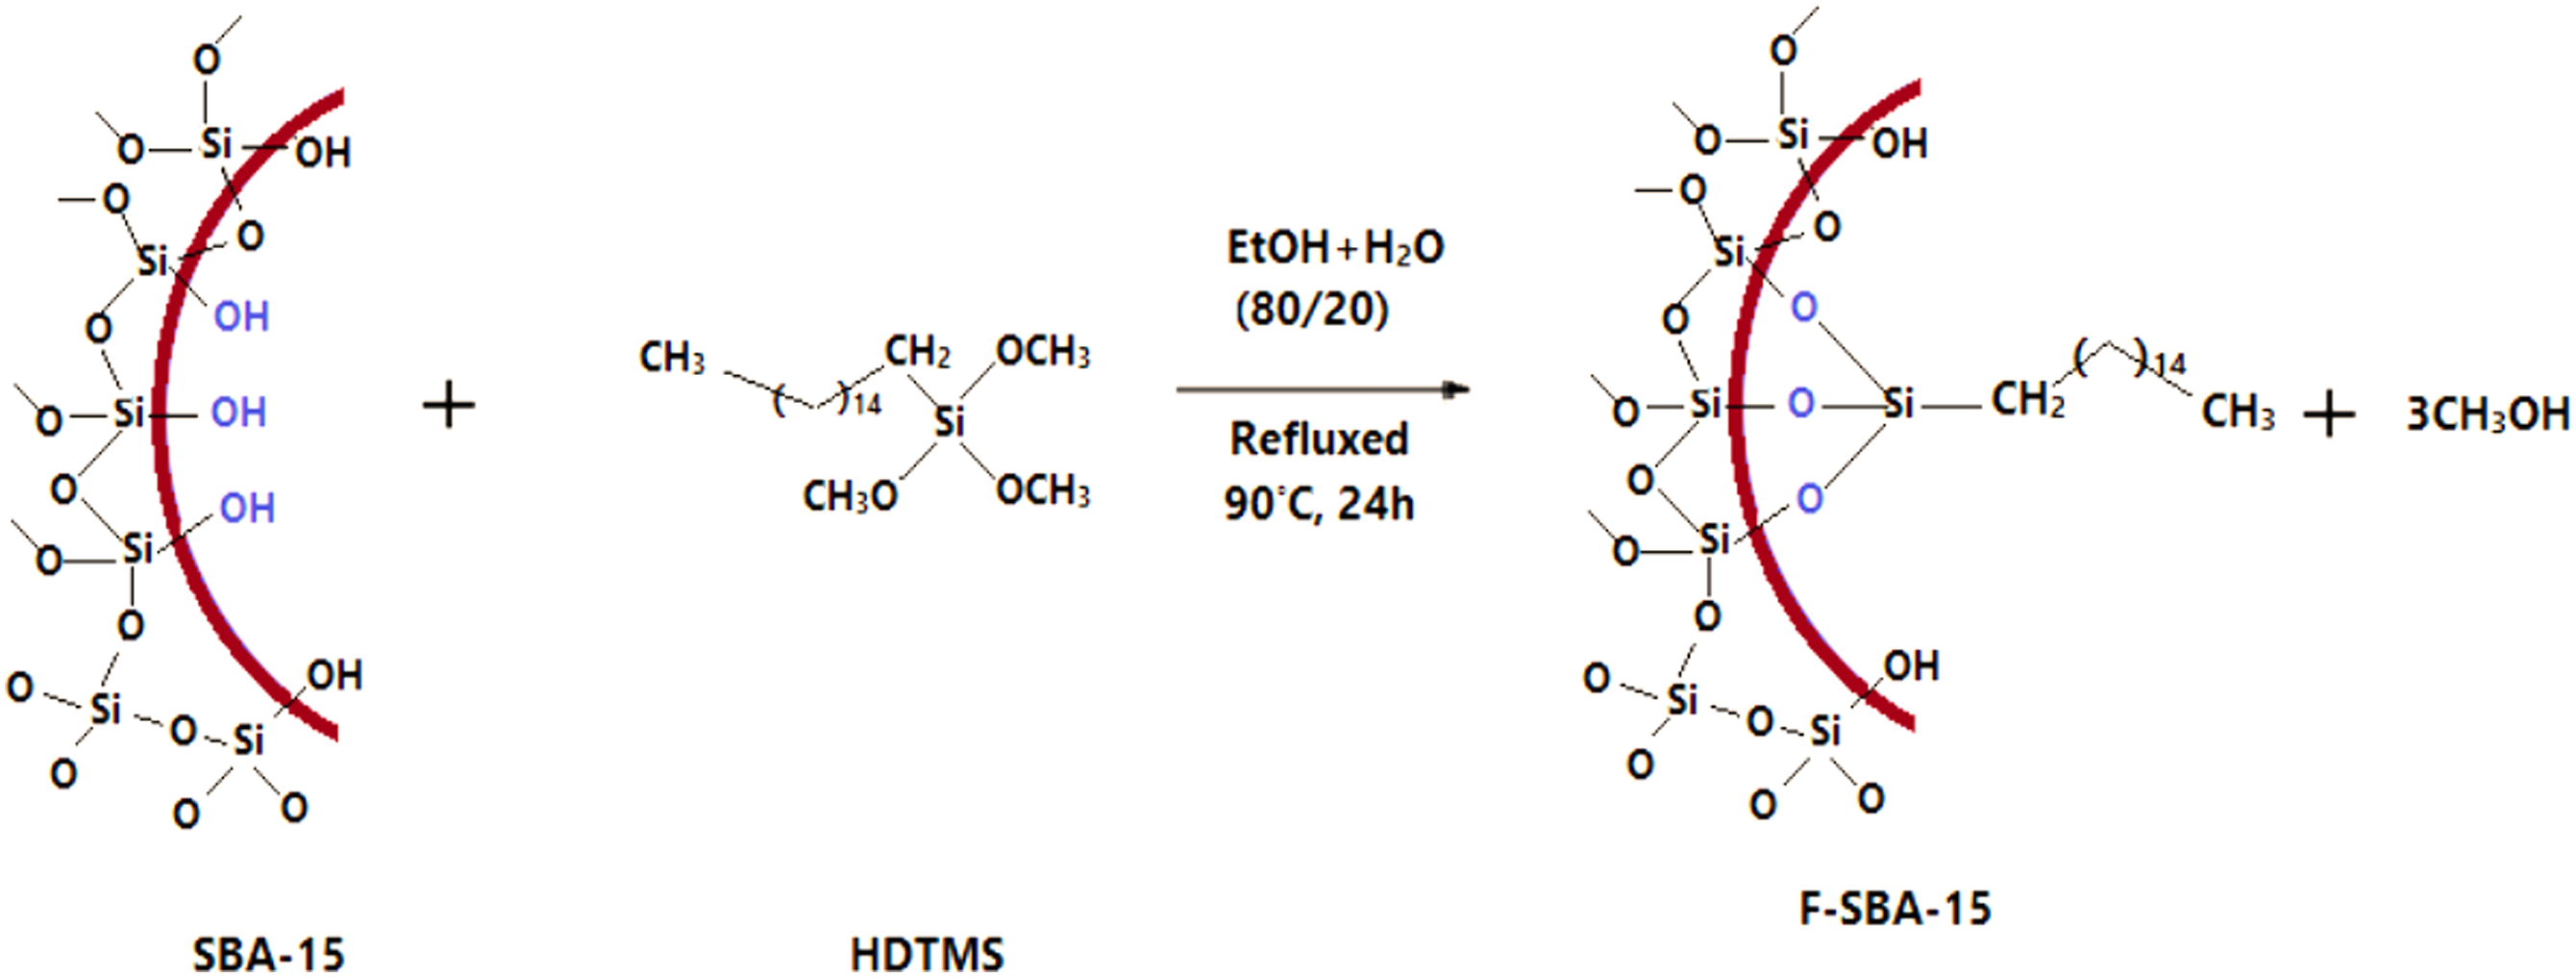
Preparation of EVA/SBA-15 nanocomposites
Poly (ethylene-co-vinyl acetate)/SBA-15 nanocomposites containing 0.5, 1.5, and 2.5 wt% of unfunctionalized and functionalized SBA-15 were prepared in the molten state using an internal mixer (Brabender) at 160°C, 60 rpm for 8 min. The SBA-15 was further dried at 80°C in a flask overnight prior to mixing. After the preparation of the nanocomposites by melt mixing process, sheets with suitable thickness (around 1 mm) were obtained by hot-press molding using a POLYLAB manual press at 180°C for 5 min with pressure of 10 MPa. After that, an iron device was used to cut normalized-shaped specimens with a size of 5 × 75 × 1 mm3 (width × length × thickness) of type 1BA according to ISO 527-2.
Characterization
Infrared spectroscopic analysis
Fourier transform infrared spectroscopy (FTIR) measurements were recorded in the transmission mode using a Perkin-Elmer spectrum one spectrometer (Universal ART sampling accessory) in wave number ranging from 600 to 4000 cm−1 at a resolution of 4 cm−1.
Morphology analysis
The morphology of the SBA-15 and F-SBA-15 and the nanocomposites was determined by scanning electron microscopy (Philips-XL30) with an accelerating voltage of 25 kV. The samples were cryogenically fractured in nitrogen liquid and coated with a thin layer of gold and palladium.
Mechanical properties
The mechanical properties of the pristine EVA and EVA/SBA-15 nanocomposites were determined via tensile strength measurements using a MTS apparatus, CRITERION model 45, in accordance with ISO 527-2. The crosshead speed was 50 mm/min. Tensile strength (σ), elastic modulus (E) and elongation at break (εb) of EVA and its nanocomposites determined according to stress-strain curve. For each sample, five measurements were carried out.
Differential scanning calorimetry
The thermal analysis was achieved using a differential scanning calorimeter (METTLER TOLEDO DSC 822e) under an inert atmosphere. Firstly, about 10 mg of each sample was heated up from room temperature to 120°C at a heating rate of 10°C min−1. The sample was kept for 3 min at 120°C to remove its thermal history. Then scans were performed by cooling down to - 80°C at 10°C/min and finally heating from −80°C to 100°C at 10°C/min.
From the second and the third scans, the melting temperatures (Tm), the crystallization temperatures (Tc) and the melting enthalpy (ΔHm) were obtained. The degree of crystallinity (χc) of each sample was calculated according to the following equation:
Φ EVA is the mass fraction of EVA in the composite.
Thermogravimetric analysis (TGA)
Thermal stability of the samples was determined by TA-Q500 (TA Instruments) in nitrogen atmosphere. About 3 mg of the samples were heated from room temperature to 550°C with a heating rate of 10°C/min.
Dynamic mechanical analysis (DMA)
The dynamic mechanical properties of EVA/SBA-15 nanocomposites were evaluated using a DMA (Q800, Multi-Frequency-Strain, TA Instruments) in tension mode. The specimens with a size of 10 × 3 × 1 mm3 (length × width × thickness) were tested under a nitrogen atmosphere from −70 to 50°C at a frequency of 1 Hz with a temperature ramp of 3°C/min. The storage modulus (E′), loss modulus (E″) and loss factor (tan δ) were recorded as a function of temperature.
Dielectric test
The dielectric behavior of the nanocomposites was performed on an ALPHA high-resolution dielectric analyzer (Novocontrol Technologies GmbH, Germany). Samples with 2 mm diameter and 0.3 mm thickness were prepared from the nanocomposites and placed in the dielectric cell between two parallel gold-plated electrodes, in frequency range of 0.717 Hz to 4 × 10⁶ Hz at room temperature. The samples were dried at 80°C under vacuum for 12 h prior test.
Results and discussion
Fourier transform infrared spectroscopy
FTIR spectroscopy was used to verify the surface functionalization of SBA-15 and the possible interactions between the hydroxyl groups of SBA-15 and the acetate groups in EVA. The FTIR spectra of SBA-15, F-SBA-15, pristine EVA, and EVA nanocomposites with 2.5 wt% filler loading are shown in Figure 2. The spectra of SBA-15 present two peaks at 1060 cm−1 and 803 cm−1 which correspond to the asymmetric and symmetric stretching vibrations of siloxane groups (Si-O-Si), respectively. The absorption bands appearing at 3440 cm−1 and 973 cm−1 are assigned to Si-OH stretching and bending vibrations, respectively. FTIR spectrum of F-SBA-15 shows two characteristic peaks at 2855 cm−1 and 2925 cm−1, attributed to the C-H stretching vibrations in the organic chain of HDTMS. An adsorption peak at 1467 cm−1 assigned to the vibration of C-Si. Moreover, the band attributed to Si-O bending vibration was shifted towards 955 cm−1. The presence of the characteristic peaks of SBA-15 and the hexadecyl group of HDTMS in the FTIR spectra of F-SBA-15 indicates that the surface functionalization of SBA-15 was successfully realized through the condensation process between the hydrolyzed part of HDTMS and the silanol groups of mesoporous silica. Similar observations were obtained by Xu et al.
47
The authors used hexadecyltrimethoxysilane (HDTMS) for the surface functionalization of silica nanoparticles via a one-step process to prepare super-hydrophobic cotton. FTIR spectra of SBA-15, F-SBA-15, EVA, EVA/SBA-15, and EVA/F-SBA-15 nanocomposites.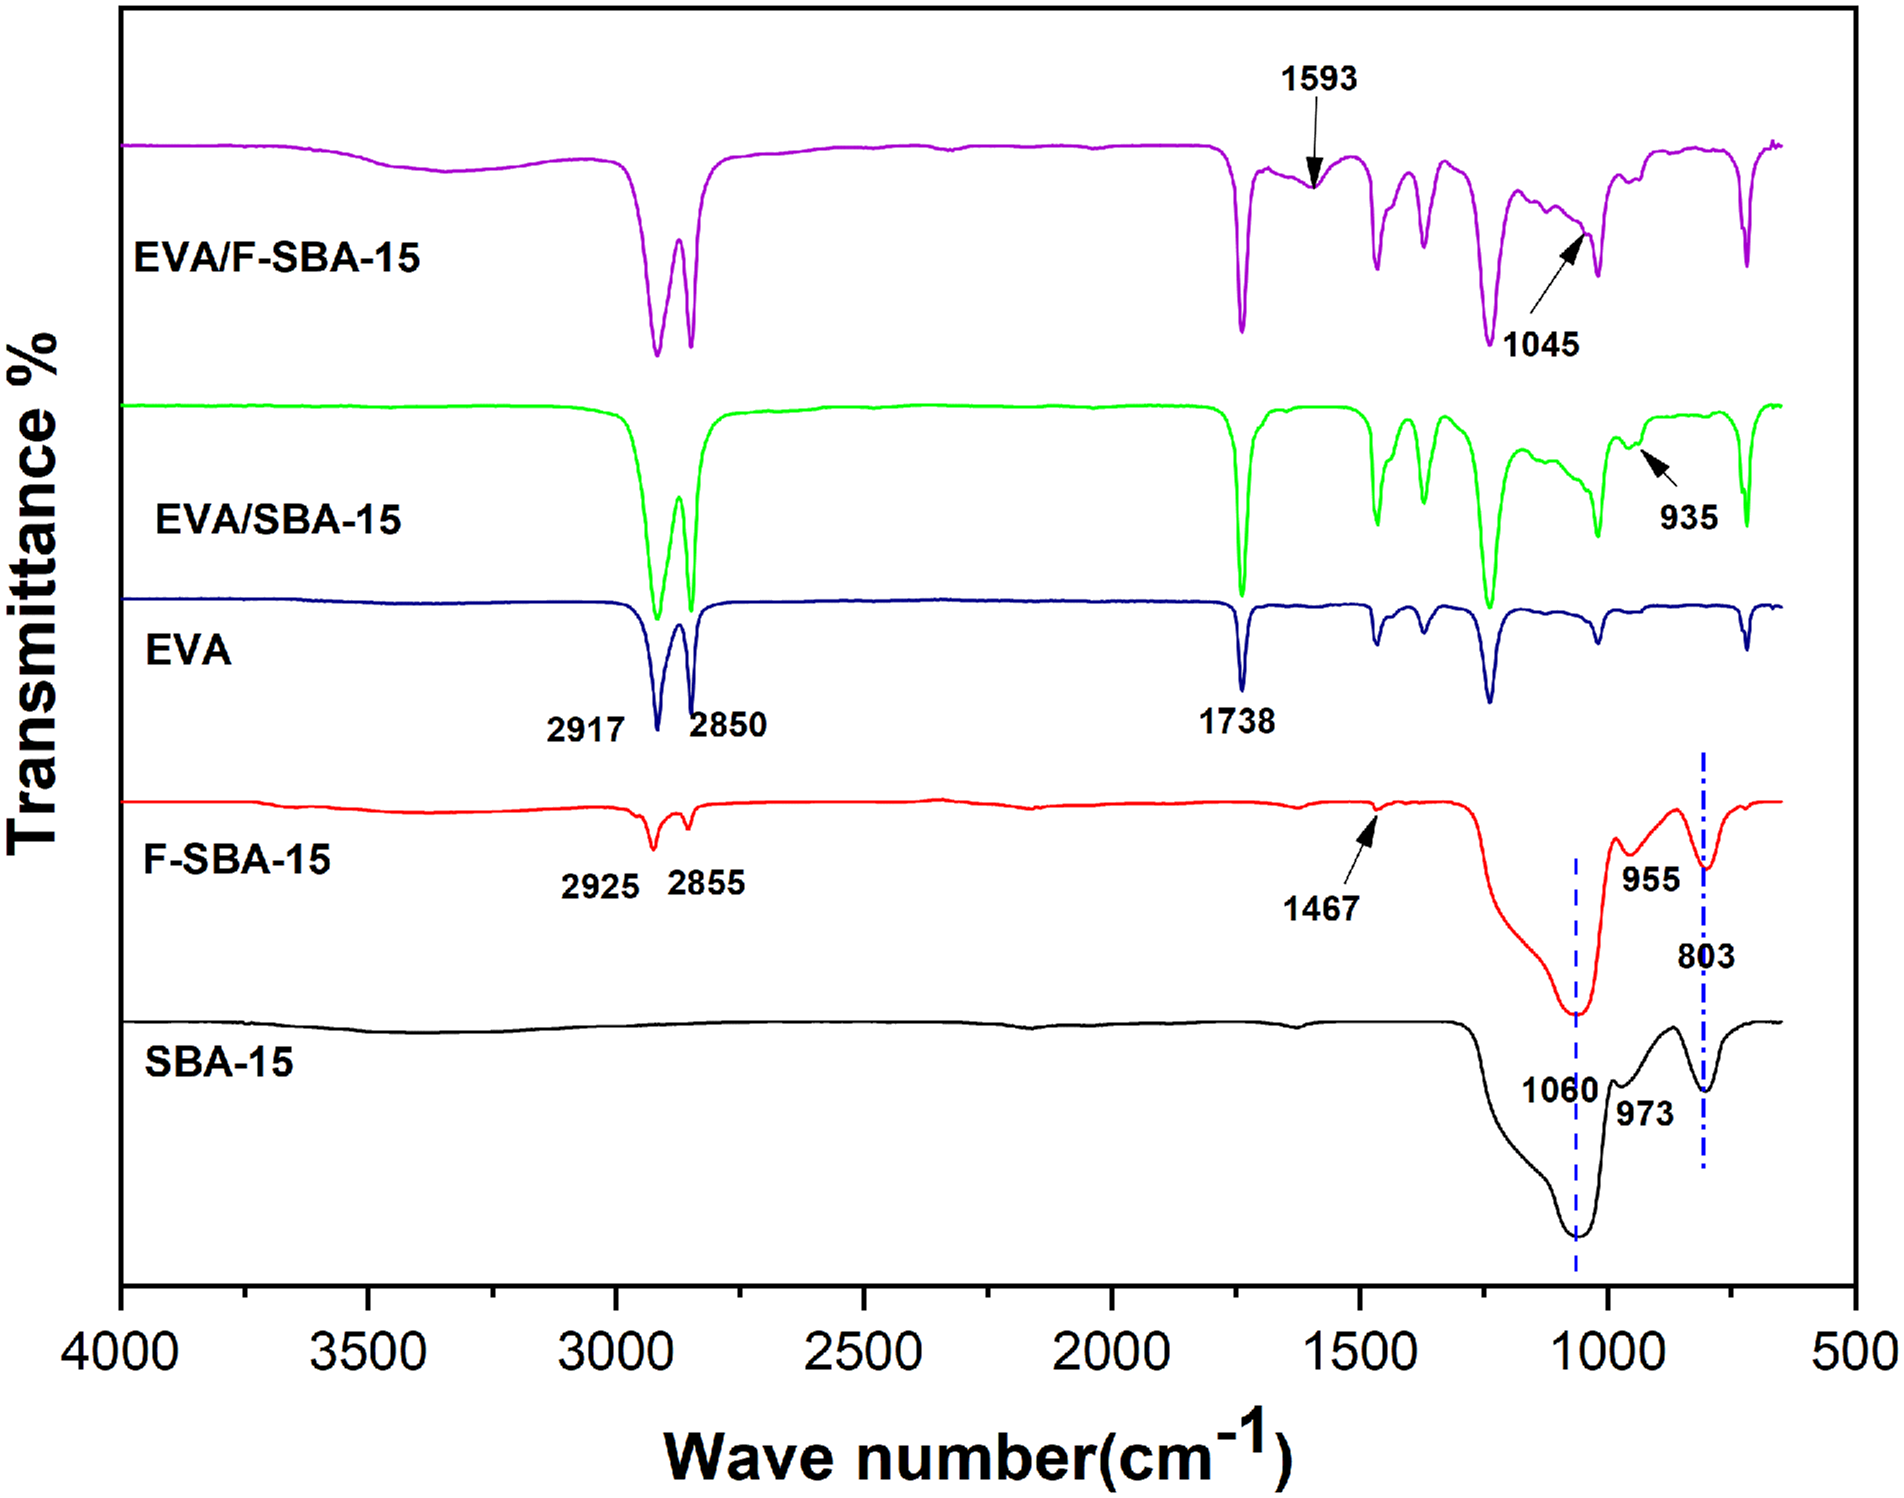
The FTIR spectra of EVA illustrated in Figure 2 shows the typical vinyl-acetate (VA) bands at 1738, 1238, 1126, and 1020 cm−1, and the ethylene segment bands at 2917, 2850, 1465, 1370, and 720 cm−1. These are the typical peaks of poly (ethylene-co-vinyl acetate) in accordance with literature.48,49 Additionally, FTIR spectroscopy was used to verify the existence of interactions between the silanol groups on the SBA-15 surface and the carbonyl groups of the VA fragment in the EVA matrix. The spectrum of EVA/SBA-15 nanocomposites shows the characteristic absorption peaks of both EVA and SBA-15. Two bands between 2850 cm−1 and 2917 cm−1 are associated with asymmetric and symmetric C-H stretching of the methylene group (-CH2-), respectively. A high-intensity band at 1738 cm−1 corresponds to the asymmetric stretching of the carbonyl group (-C=O) in vinyl acetate (VA). The two peaks detected at 1060, 973 and 955 cm−1 in SBA-15 and F-SBA-15 are observed at 1045 and 935 cm−1 in the case of EVA filled with functionalized SBA-15 and unfunctionalized SBA-15. A shifting in the wave number value of the peak assigned to the Si-O bond in the nanocomposites was observed. This shifting refers to the potential dipole-dipole interactions between the -OH surface groups of mesoporous silica and the -C=O groups in the EVA matrix in the case of the EVA/F-SBA-15 and EVA/SBA-15 nanocomposites. 50 The presence of supplementary bands in the spectra of EVA filled with functionalized SBA-15 proves the successful functionalization of SBA-15 nanoparticles. Indeed, the band associated with the Si-C bond resulting from the process of condensation of the hydrolysable fraction of the coupling agent and the functional groups (silanols) of the mesoporous silica SBA-15 can be observed at 1595 cm−1. On the other hand, there are also small changes of bending vibration (δ) of Si-O groups in spectra of the nanocomposites compared to that of pure silica, it can be suggested that there are hydrogen bonds between F-SBA-15 and the EVA matrix inside and outside pores of silica after functionalization.
Morphological characteristics
Figure 3 displays the SEM images of SBA-15and F-SBA-15 used to elaborate EVA based SBA-15 nanocomposites. SEM micrograph of synthesized mesoporous silica SBA-15 (Figure 3(a)) showed similar structure as revealed in the original publication.
7
In general, the SBA-15 exhibits long rod-like structures with relatively uniform sizes of 0.5–2 μm, which aggregates together to form a wheat-like nanostructure. This is the typical characteristic morphology of SBA-15 obtained from the condensation of TEOS around adjacent micelles of surfactant P123 reported by.32,43 After the functionalization the worm-like structure did not deteriorate and preserved the original structure (Figure 3(b)). The absence of an obvious difference in surface roughness suggests that functionalization took place in the inner surface of mesopores.
42
Similar observations were obtained by Yu et al.,
32
who employed the γ-glycidyloxypropyltrimethoxysilane (GOTMS) to functionalize SBA-15. SEM micrographs of (a) SBA-15, (b) F-SBA-15, (c) EVA, (d) EVA/0.5 wt% SBA-15, (e) EVA/0.5 wt% F-SBA-15, (f) EVA/1.5 wt% SBA-15, (g) EVA/1.5 wt% F-SBA-15, (h) EVA/2.5 wt% SBA-15, and (i) EVA/2.5 wt% F-SBA-15.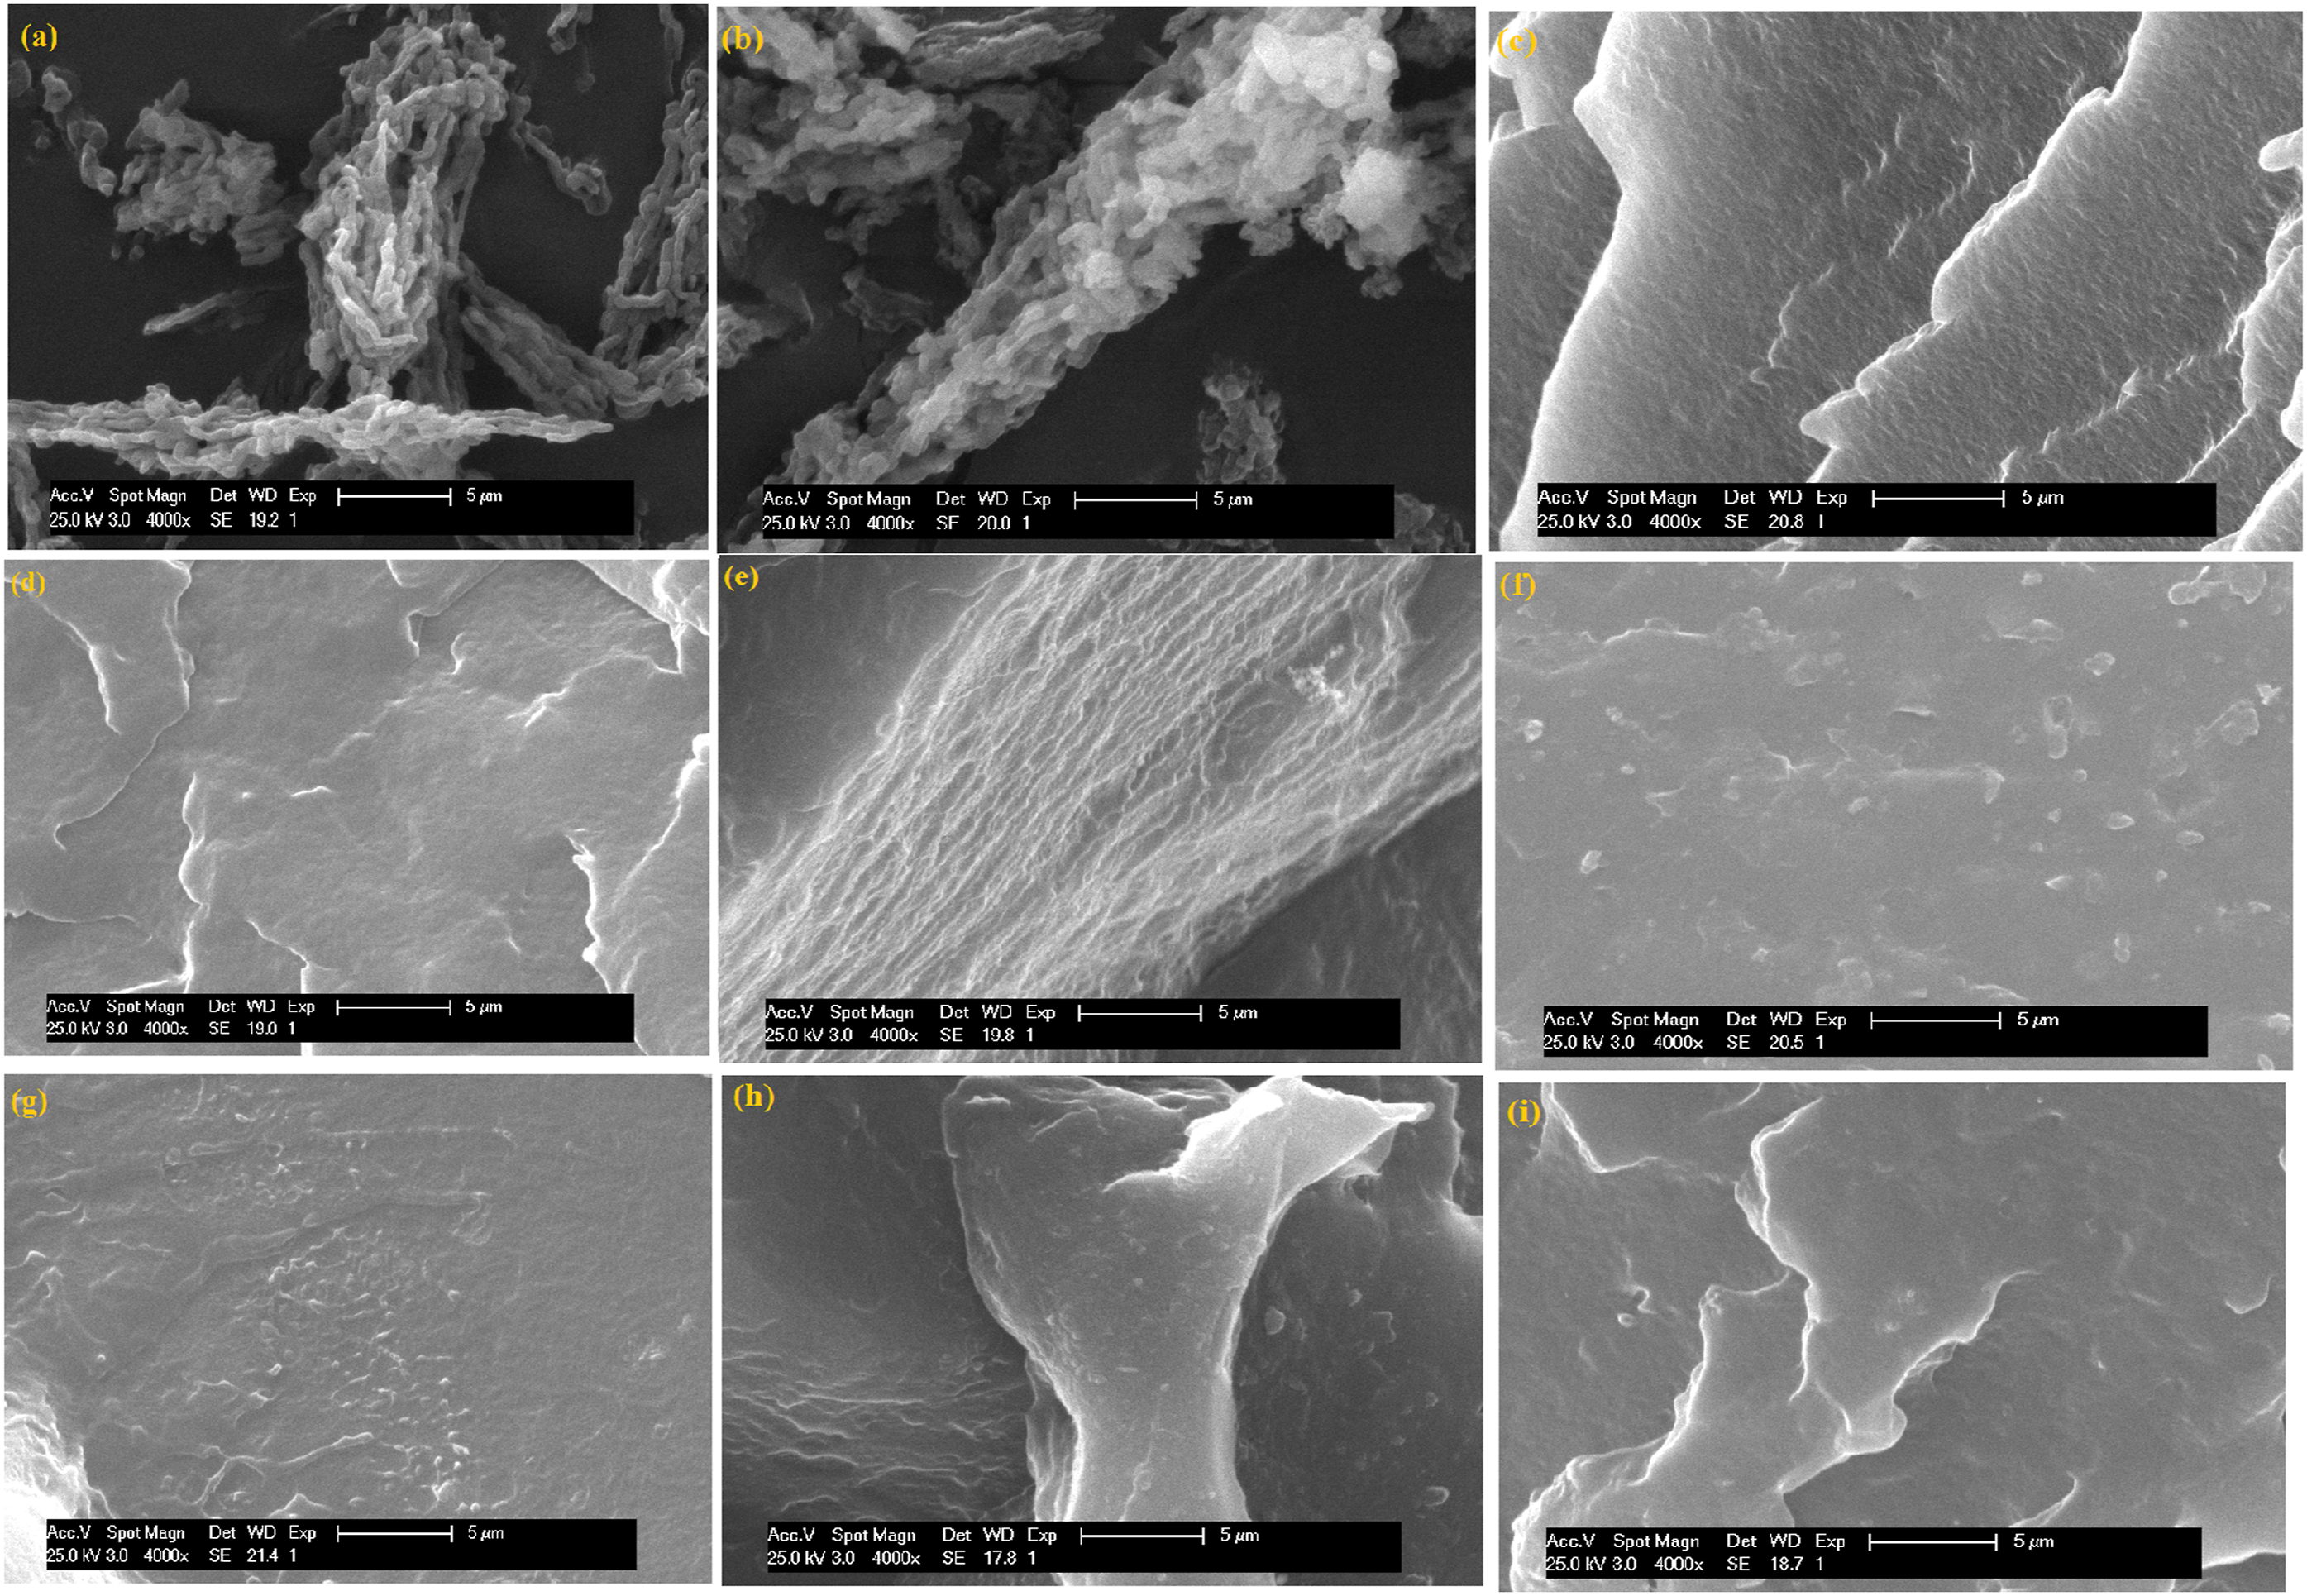
SEM micrographs provide visual observations concerning the dispersion of nanoparticles within the bulk of EVA matrix shown in Figure 3 and the difference between unfilled EVA and filled EVA can be observed. As seen in the (Figure 3(c)), the EVA matrix displays smooth fracture surface. In contrast, it is obvious from the SEM images of filled EVA (Figure 3(d)–(i)) that a heterogeneous system exists once the SBA-15 nanoparticles were added into the EVA matrix. The SBA-15 nanoparticles were distinguished as bright white spots on the SEM images of the EVA/SBA-15 nanocomposites (Figure 3(d), (f) and (h)). The SBA-15 nanoparticles were well-dispersed within EVA matrix as shown in Figure 3(d). This may be due to better interaction with the addition of small amount of filler in the matrix (0.5 wt%). As SBA-15 has a large specific surface area and numerous silanol groups on the porous surface, SBA-15 nanoparticles tend to self-agglomerate in a partially polar EVA matrix (18 wt% VA). As a result, both fine SBA-15 nanoparticles and large SBA-15 aggregates were observed at high SBA-15 loadings (1.5 and 2.5 wt%). On the other hand, after functionalization, F-SBA-15 nanoparticles presented homogeneous dispersion in EVA matrix (Figure 3(e), (g) and (i)) and the agglomerates are less as compared to unfunctionalized SBA-15 filled EVA matrix. The fracture surface of the nanocomposite shows a certain degree of chains orientation evidenced by the parallel lines seen in Figure 3(e). Fracturing the nanocomposites in nitrogen liquid aligns these polymer chains, and they can further form the packets indicated in Figure 3(e). Thus, the SEM results suggest that the elaborated nanocomposites are composed of polymer chains that pass through the porous channels of the mesoporous silica particles and leads to a more embedded polymer. Compared to conventional polymer/particle composites prepared using nonporous particles as fillers; these porous fillers can serve as pseudo-cross-linking points within nanocomposites and contribute to the improvement of mechanical properties. 31 These results suggest that HDTMS not only able to enhance the dispersion of SBA-15 in the matrix, but also improve the interfacial interactions between the two phases.
Differential scanning calorimetry (DSC)
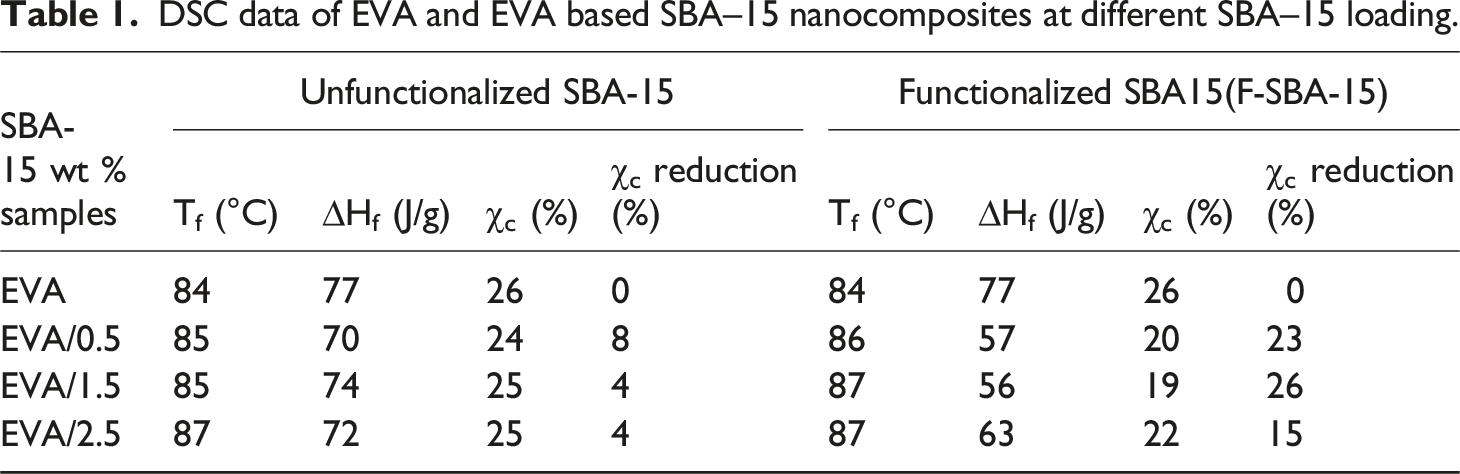
The DSC thermograms of pristine EVA and nanocomposite reinforced with unfunctionalized and functionalized SBA-15 nanoparticles are shown in Figure 4. The melting temperature (Tm), crystallization temperature (Tc), melting enthalpy (ΔHm) and degree of crystallinity (χc %) values are summarized in Table 1. The DSC thermograms of pure EVA and its nanocomposites show a single endothermic melting peak. The melting temperature of the EVA matrix is about 84°C and slightly increased by a maximum of 3°C for EVA-based nanocomposites (Table 1). However, the endothermic melting areas in the nanocomposites (Figure 4(a)) were reduced compared to the pure EVA, which may provide an indication of the reduction in crystallinity of EVA. For the EVA/SBA-15 nanocomposite the degree of crystallinity (χc %) was slightly reduced by maxima of 8% for EVA/0.5 wt% SBA-15,. This reduction increased from the unfunctionalized SBA-15 based nanocomposites to the functionalized SBA-15 based nanocomposites with a maximum reduction of 26% for EVA/1.5 wt% F-SBA-15. The reduction on the crystallinity of the sample contains 1.5 wt% of F-SBA-15 could be the result of forte interactions developed between the compounds coexisting in the system (see Figure 3(g)). Thus, the increase in compatibility between EVA matrix and F-SBA-15 restricts the free movement of EVA chains which could obstruct the spherulite development stage of the ethylene fraction in the copolymer. Almost the same trend of variations has been obtained for the crystallization thermograms (cooling curves), as it is seen in Figure 4(b), the crystallization temperatures of the nanocomposites remain unchanged. Similar results have been also reported by.44,50–52 The major reason for decrease in the degree of crystallinity is the presence of hydrogen bonds between the surface of F-SBA-15 modified with hexadecyltrimethoxysilane and C=O or C-O-C groups of EVA, this one restricts the mobility of EVA macromolecules, and as a result, crystallizable segments of EVA are no longer able to be folded into polymer crystals. DSC thermograms of EVA and their nanocomposites as function of SBA-15 and F-SBA-15 content. (a) Heating curves and (b) cooling curves. DSC data of EVA and EVA based SBA–15 nanocomposites at different SBA–15 loading.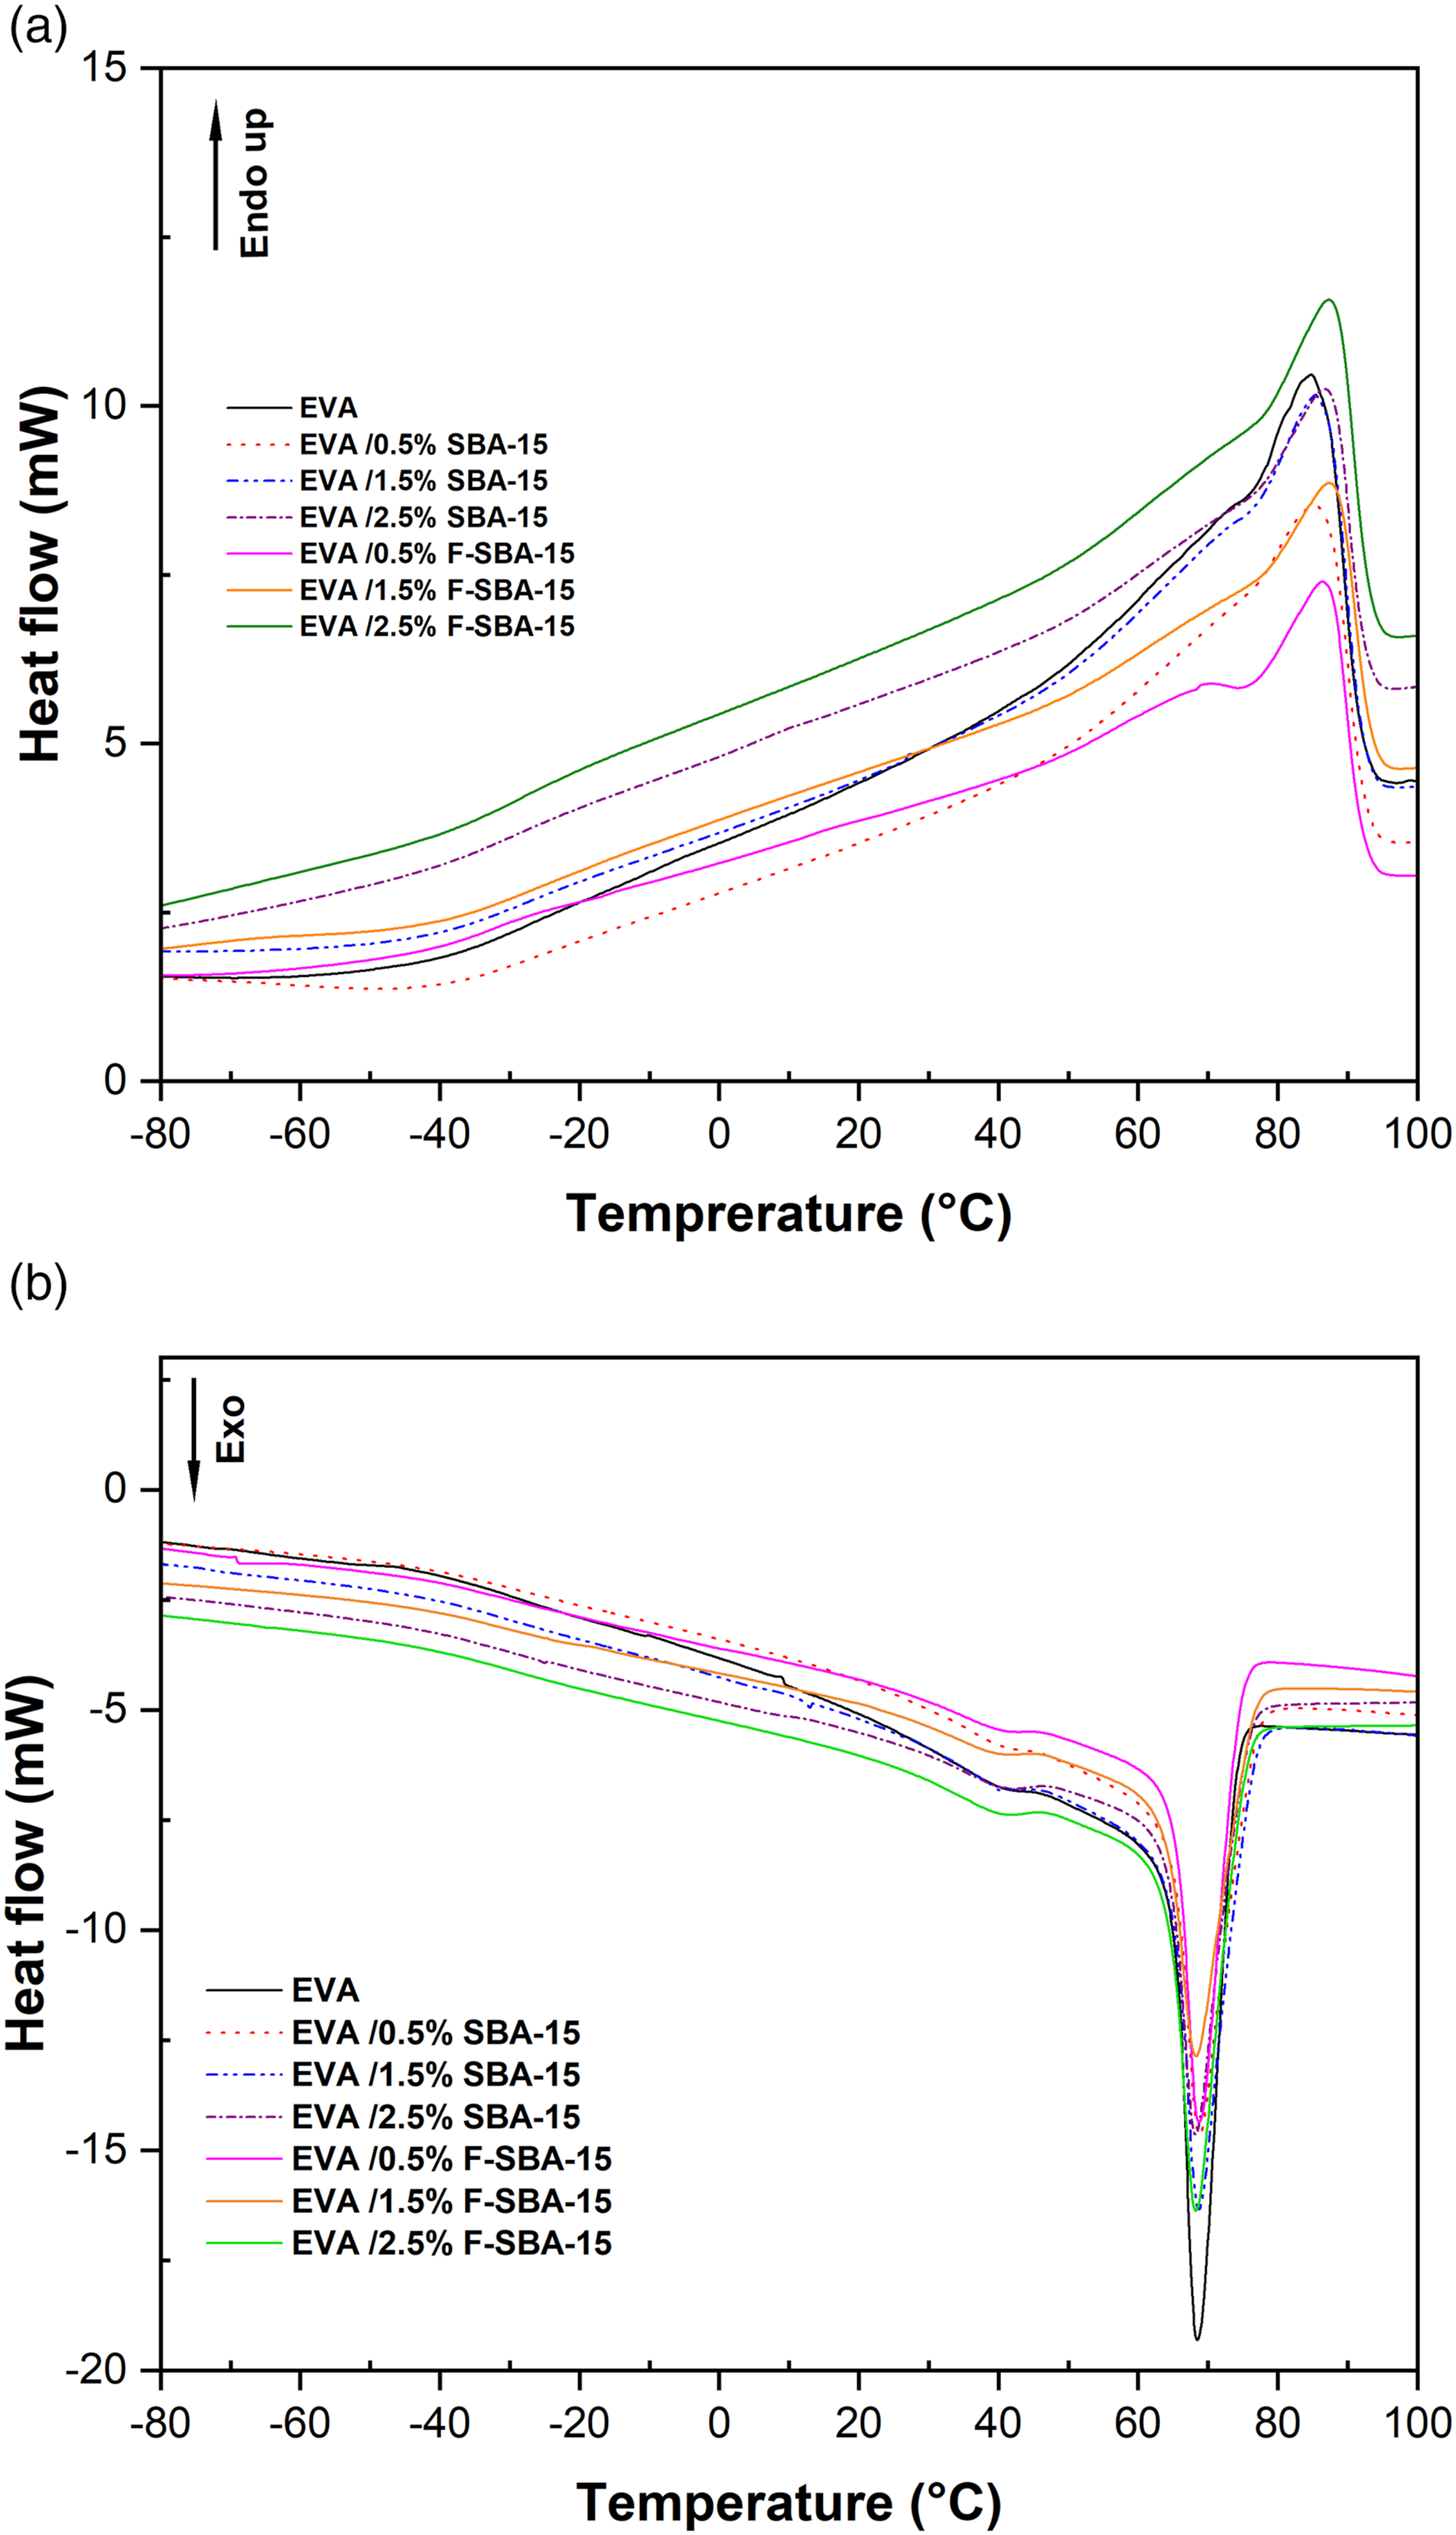
It worth to note; that no clear trend was found regarding the crystallinity reduction of mesoporous silica-based nanocomposites with different amount of SBA-15.
Mechanical properties
The effects of the SBA-15 content and surface functionalization on the mechanical properties of SBA-15 based EVA nanocomposites were studied. The stress-strain curves of EVA melt-mixed with 0.5 wt%, 1.5 wt%, and 2.5 wt% (SBA-15 and F-SBA-15) are presented in Figure 5(a). The figure shows the superposition of stress-strain curves for the unfunctionalized and functionalized SBA-15 based nanocomposites, and they are parallel to the stress-strain curve of the unfilled EVA matrix, displaying a bit higher rigidity values. In nanoparticle-reinforced polymer matrices, nanoparticles contribute to the substitution of the ductile polymer by a rigid surrounding material. As a result of the stress being transmitted to the nanoparticles, the total ability of the nanocomposites to support stress improves.
53
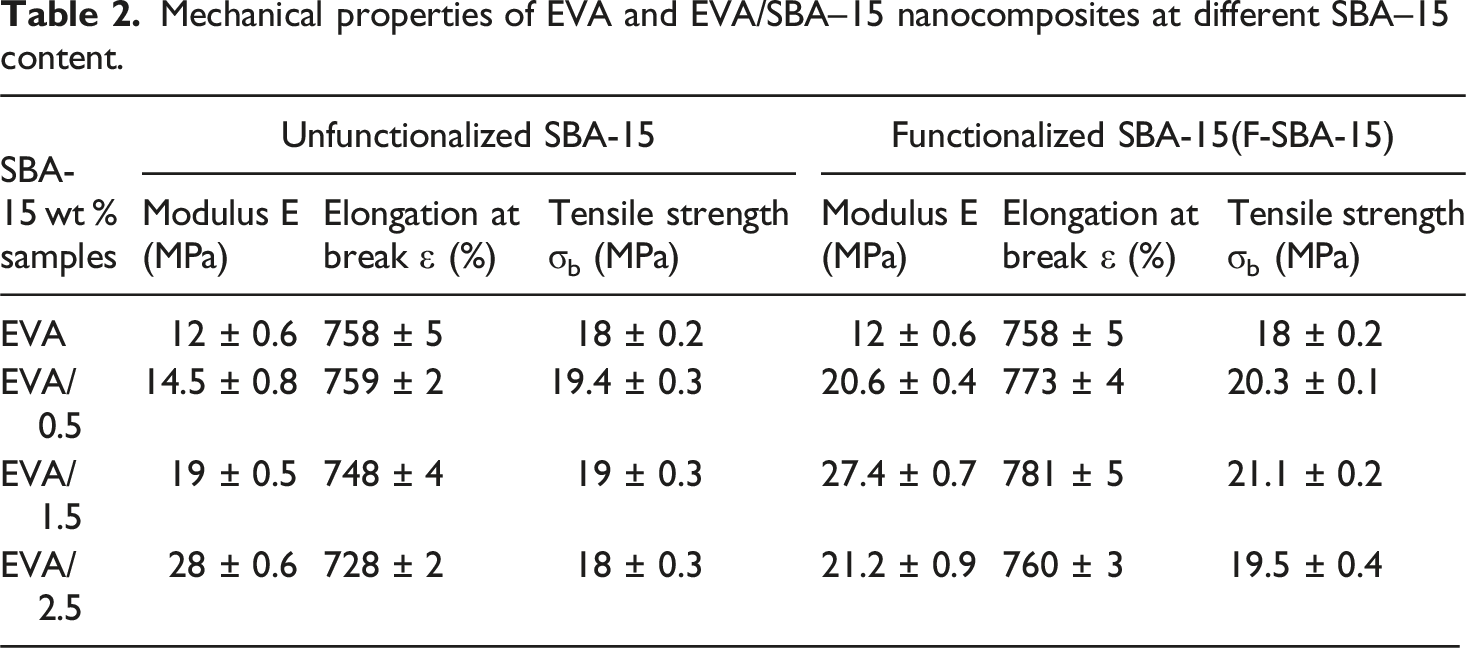
Tensile properties of EVA and EVA melt blended with 0.5 wt%, 1.5 wt% and 2.5 wt% SBA-15 and F-SBA-15. (a) Stress-strain curves, (b) e-modulus, (c) elongation at break (εb), and (d) Tensile strength (σb). (Inserts figure shows the amplifications of the initial strain region).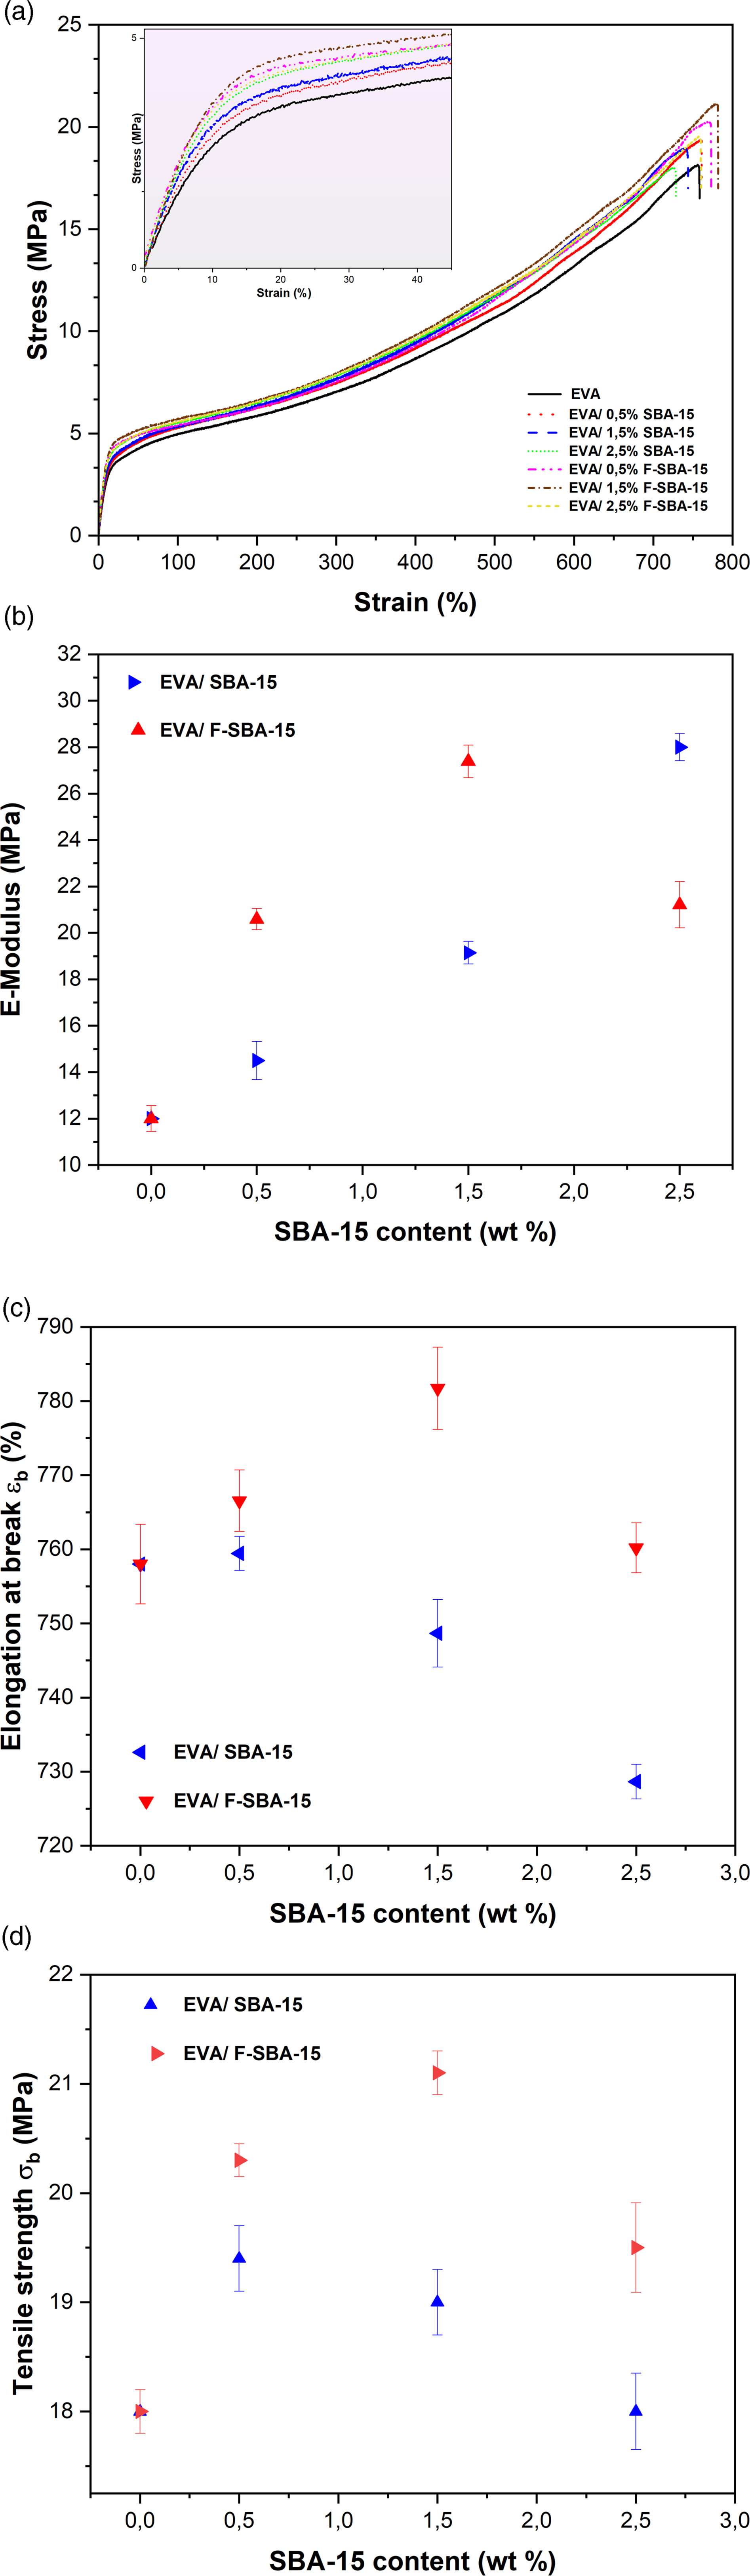
Mechanical properties of EVA and EVA/SBA–15 nanocomposites at different SBA–15 content.
The further compatibility results from the functionalization of SBA-15 surface increases the elastic modulus of EVA/F-SBA-15 nanocomposites. However, for low amounts of F-SBA-15 (0.5 and 1.5 wt%), the elastic modulus increases compared to the unfunctionalized SBA-15 and decreases with higher filler contents (2.5 wt%). At low filler content, the stiffness of the nanocomposites is associated with the positive effect of functionalization. While at high content, it is governed by the SBA-15 amount.
The elongations at break of the EVA matrix and different SBA-15 based EVA nanocomposites are shown in Figure 5(c). From the Figure 5(c) and the illustrated data in Table 2, the elongation at break of the EVA/SBA-15 nanocomposites appears to be unchanged. Regardless of the surface functionalization of SBA-15 nanoparticles and/or the SBA-15 content, the ductility of the nanocomposites seems to be preserved with respect to the unfilled EVA, with a maximum decrease and increase of 4% and 3% obtained for the nanocomposite EVA/2.5% SBA-15 and EVA/1.5% F-SBA-15, respectively.
On the other hand, Figure 5(d) describes the evolution of the tensile strength of the nanocomposites EVA/SBA-15 versus SBA-15 content. The unfilled EVA has a tensile strength at break of 18 MPa. In comparison to the unfilled matrix, the unfunctionalized SBA-15 reinforced EVA showed a maximum increase of 8%. Whereas the maximum increase for F-SBA-15 reinforced EVA was 17.2%.
The dispersion state of the SBA-15 nanoparticles is a crucial factor that might influence the mechanical properties of the nanocomposites. The main cause of such increases in tensile strength by SBA-15 inclusions may be attributed to the organic functionalization of the SBA-15 surface, which motivates the entanglement and inter-diffusion of EVA chain segments within the SBA-15 pores. Similar clarifications were given by some authors.37–39 On the other hand, a finer dispersion and an improvement of compatibility between filler and matrix lead to an increase in tensile stress. The presence of hydrogen bonding between F-SBA-15 and EVA, which was confirmed in FTIR analysis, leads to a strong interfacial interaction and a good dispersion of mesoporous silica in the matrix. As a result the expend stress can be distributed uniformly through the samples. Similar results were obtained in the work of Tham et al., 57 for EVA/organo modified silica system.
The dispersion becomes worse as the SBA-15 content increases, as aforementioned in the morphology section (see Figure 3(f) and (h)). This explains the modest tensile values found for unfunctionalized SBA-15 reinforced EVA matrix. The Surface functionalization of SBA-15 appeared to be an effective approach to enhance dispersion and create interfacial adhesions at the filler interfaces (see Figure 3(e) and (g)), which improves the tensile stress of the nanocomposites.
One of the crucial factors influencing the mechanical properties of nanocomposites is the degree of crystallinity. 56 The EVA/SBA-15 nanocomposites have a lower degree of crystallinity than the EVA matrix (see Table 1); consequently, a decrease in elastic modulus and tensile strength and an increase in elongation at break were estimated. However, an increase in the elastic modulus, a relative increase in the tensile strength, and an invariance of the elongation at break for EVA/SBA-15 nanocomposites were obtained; these were caused by the impacts of SBA-15 content and surface functionalization rather than the crystallinity of the materials.
Dynamic mechanical analysis (DMA)
Dynamic mechanical analysis is the most extensively used method to study the effect of adding nanoparticles to the polymer on its dynamic properties. 58 In this study, the test was carried out to assess the mechanical properties of EVA copolymer, EVA/SBA-15, and EVA/F-SBA-15 nanocomposites and relate them to the viscoelasticity of the EVA and how it can be changed by the addition of unfunctionalized and functionalized SBA-15 nanoparticles under the application of cyclic force (tension mode). Storage modulus (E′), loss modulus (E″), and loss factor (tan δ) were measured as a function of temperature.
Storage modulus (E′)
Figure 6 (a) shows DMA curves of storage modulus (E′) versus temperature for EVA and EVA/SBA-15 nanocomposites at a frequency of 1 Hz. Storage modulus (E′) measures how stiff or fragile the materials are.59,60 From the E′ plot, the storage modulus of EVA/SBA-15nanocomposites shows higher values either for the unfunctionalized or the functionalized SAB-15 filled EVA compared to that of the unfilled EVA matrix at the glassy state (below Tg). Across the temperature range between −70 and −13°C, the nanocomposites EVA/SBA-15 exhibit greater storage modulus compared to the virgin EVA matrix. Basically, the increases in stiffness observed in the EVA nanocomposites can be assigned to the high stiffness behavior of the SBA-15 filler, which will effectively constrain the free movement of EVA copolymer chains.
61
Thus, the physical molecular interaction via hydrogen bonds between polar groups of the EVA (VA) and silanol groups of the SBA-15 surface contributed to the stiffening of the EVA matrix. The sample EVA/1.5 wt% F-SBA-15 exhibits the highest storage modulus among all the nanocomposites. This may be related to the SBA-15 surface functionalization effect, which led to well-dispersed nanoparticles and improved interfacial adhesion. Above the Tg, and as the temperature increased, the polymer chains became more mobile, and the stiffness of EVA and EVA nanocomposites decreased. The results indicated that in the rubbery region, there is no significant change in storage modulus. Storage modulus (E′), loss modulus E″ (a), and mechanical loss factors (tan δ) (b) of the pure EVA and EVA/SBA-15 nanocomposites as a function of temperature.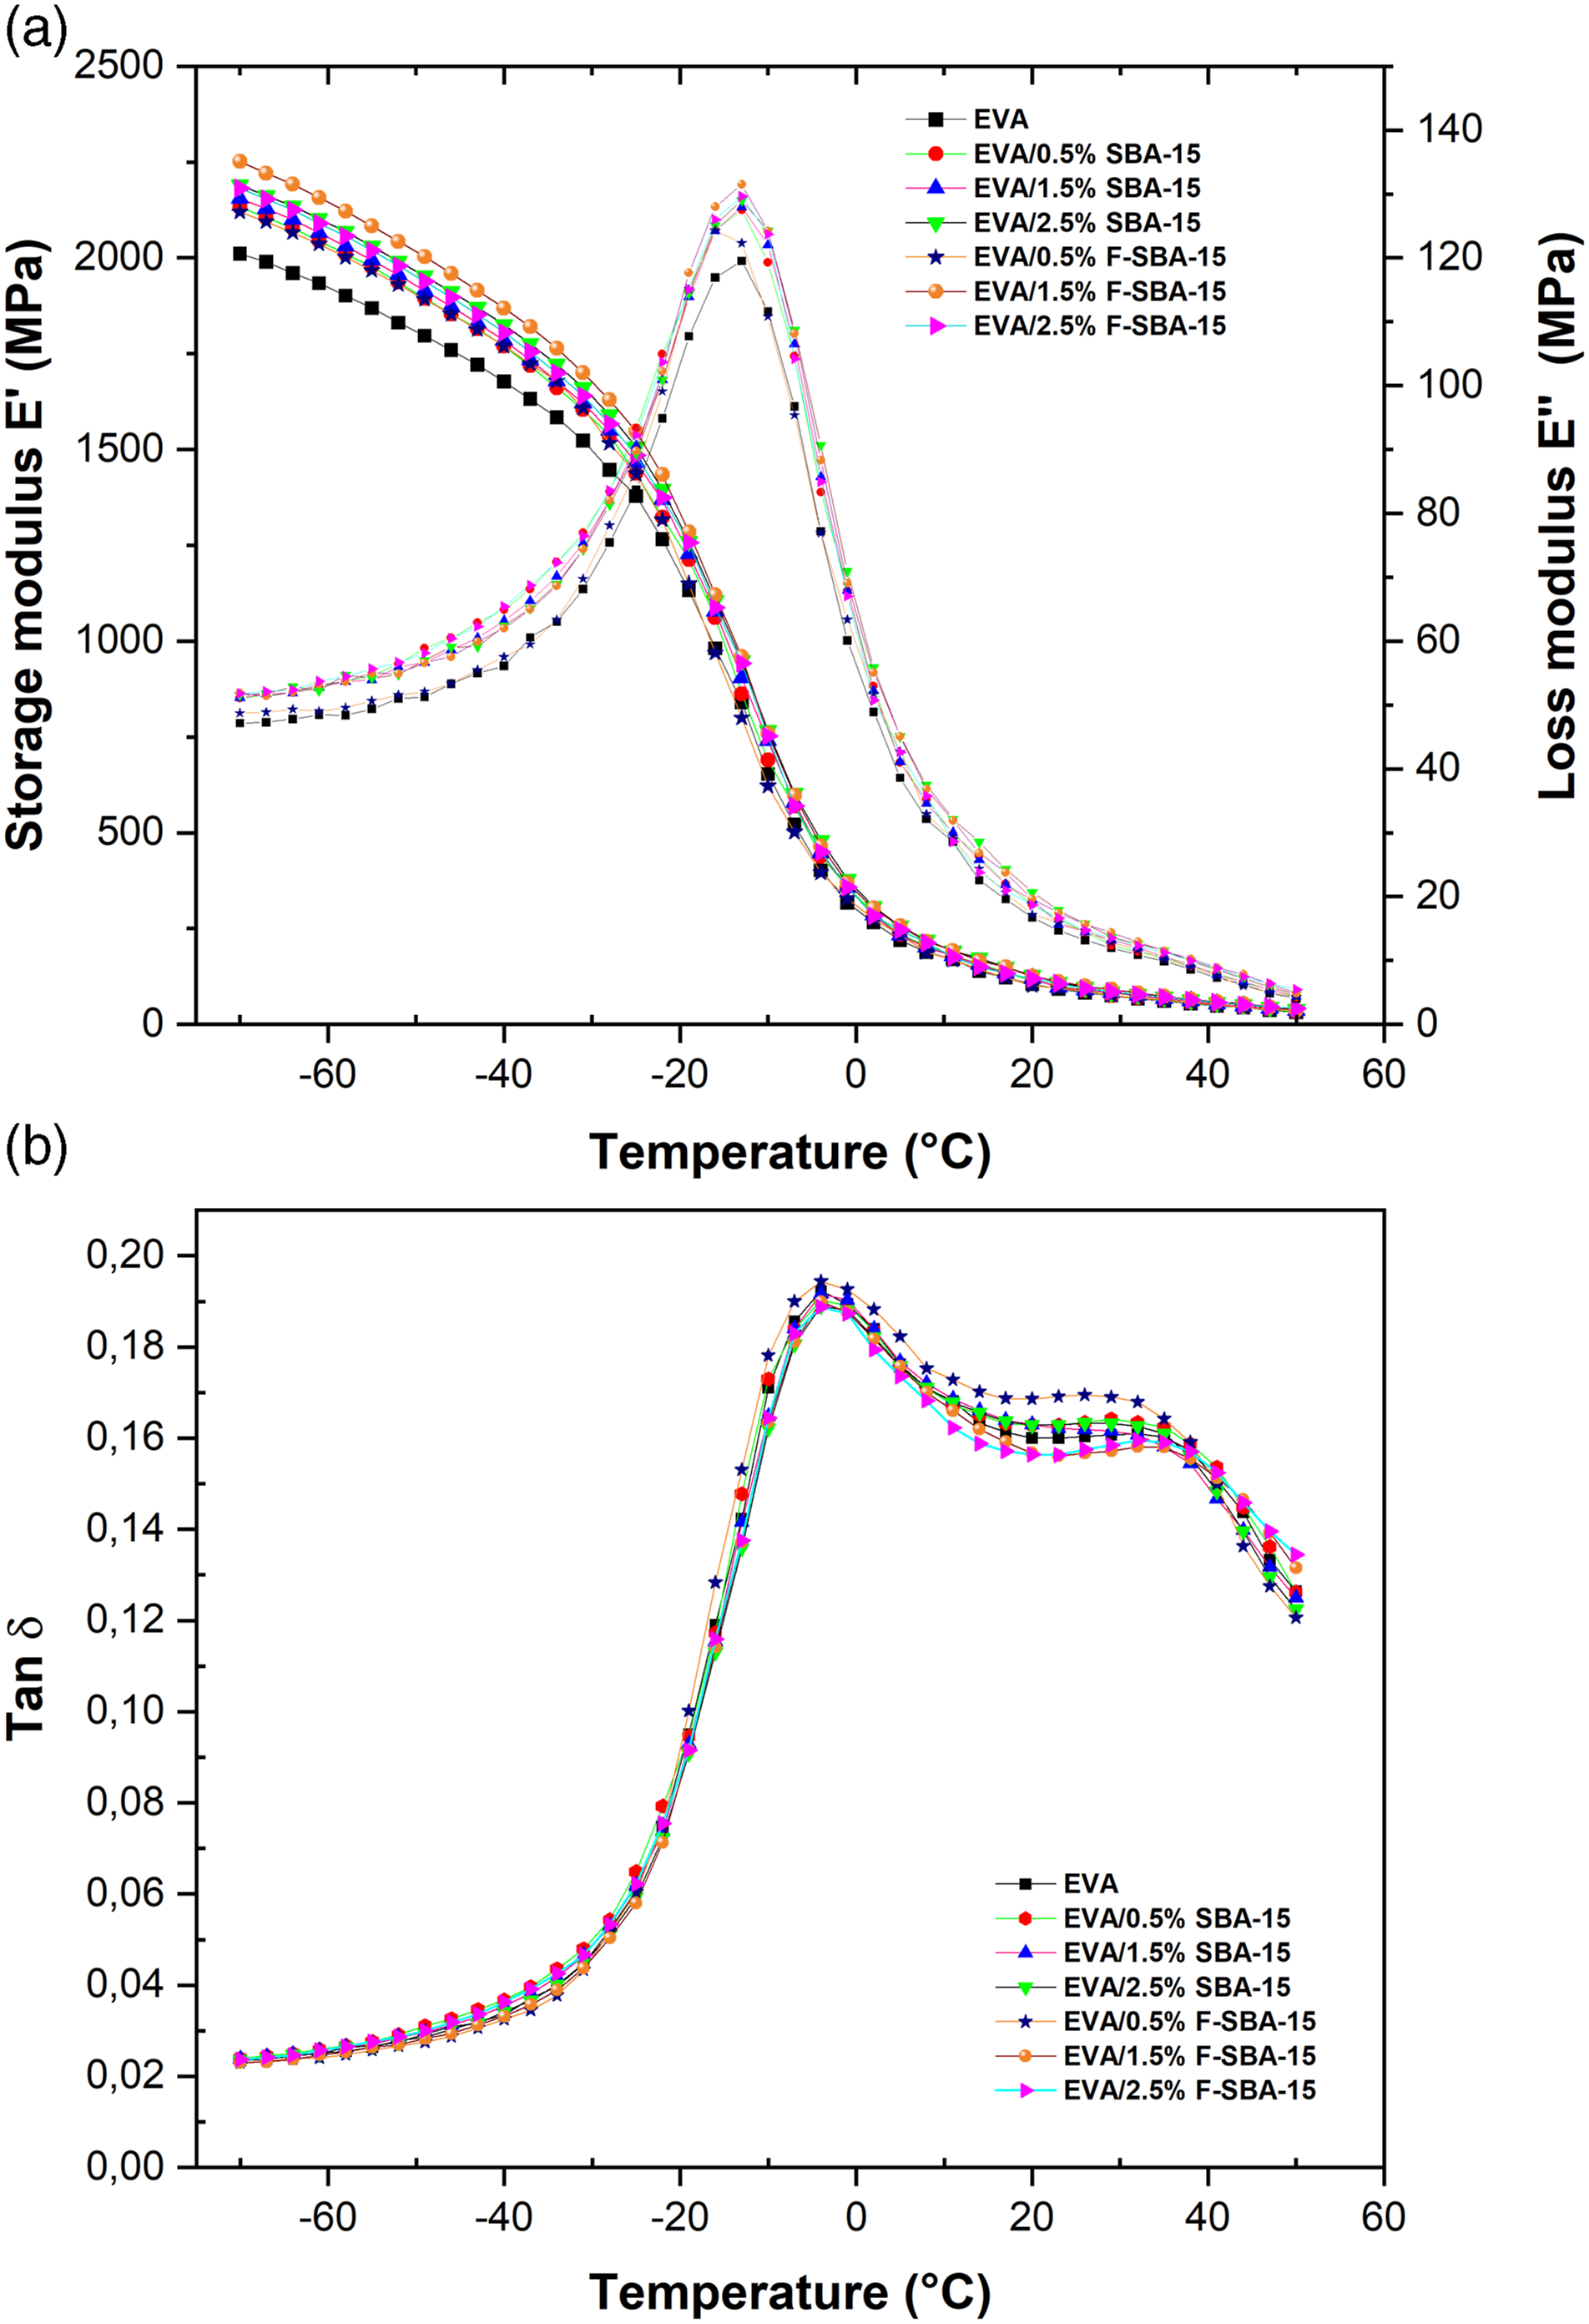
Loss modulus (E″)
Loss modulus E″, is regarded as a measure of a material’s capacity to dissipate energy under stress. 58 The dynamic loss modulus is habitually associated with internal friction and sensitive to different kinds of molecular relaxation processes and transitions. 62 The variation of loss modulus versus temperature of EVA copolymer and EVA nanocomposites is shown in Figure 6(a). From the E″ graph, the loss modulus apparently displays similar trend with the storage modulus E′. The incorporation of SBA-15 nanoparticles into the EVA matrix increases the loss modulus peak values. It should be noted that, as in the E′ plot, a higher E″ peak height was observed for the sample containing 1.5% F-SBA-15 with respect to the others nanocomposites, pointing out the better dispersion, absence of obvious aggregation of functionalized SBA-15, and stronger interfacial adhesions within the EVA (see Figure 3(g)). Relatively similar trends and agreements were reported by other researchers.63,64
The glass transition temperature is the point below which a polymer or other non-crystalline material changes from a glassy state to a rubbery or viscous state. The fact that polymer chains become more movable as the temperature rises causes this physical change. Dynamic mechanical analysis is one of the best techniques that can be used to measure Tg. It is an essential characteristic to understand how polymers behave and function. The glass transition temperature is recognized by a fall in storage modulus (E′), the maximum of β-relaxation in the loss modulus (E″), and the temperature at the maximum of tan δ curves. The loss modulus curve for EVA shows a transition peak at about −13°C, which is the result of the Tg in the EVA copolymer. This transition peak is associated with the motion of chain segments of methylene (-CH2) groups in the amorphous phase.
The maximum of β-relaxation is not influenced by the SBA-15 inclusions. Nevertheless, slight increases in β-peak’s intensity can be observed from the loss modulus (E″) plot (Figure 6(a)), which is clear evidence for the chain’s mobility reduction in the EVA. This may be related to the homogeneous dispersion of F-SBA-15 in the EVA matrix and the compatibility between the filler and polymer.
It was reported that Tg values obtained from the loss modulus were more accurate as compared to those obtained from the loss factor (tan δ). 60
Loss factor (tan δ)
Tan δ is defined as the ratio between loss modulus and storage modulus (E″/E′), and generally indicates the elastic or viscous response of a material; its peak height is related to the internal energy dissipation of the matrix-filler interphase. 65
Both pure EVA and nanocomposites display two tan (δ) peaks, one around - 4°C and the other in the range of 25–38°C. The appearance of two peaks in the tan δ curves designates the presence of two different segments in the EVA copolymer. 66 In literature, the fraction of vinyl acetate in the EVA copolymer influences the form and area of the peak of tan δ. The authors observe that at high levels of VA content (above 14%), the tan δ curve presents an additional peak around 45°C, which can be attributed to the high level of polyethylene in the EVA copolymer.24,67 The tan (δ) depends on the interfacial adhesion level between the filler and EVA matrix. Consequently, the strong filler-matrix bonding will be revealed in the lower values of tan δ. 68 The nanocomposites containing 1.5 wt% and 2.5 wt% F-SBA-15 exhibited slightly lower tan δ in the curves due to better interfacial connection with the EVA matrix.
Hence, the DMA results reveal good interfacial interactions between the EVA and SBA-15, and the addition of SBA-15 nanoparticles could be an alternative to enhance the mechanical properties of the nanocomposites. These results are in good agreement with the aforementioned mechanical properties results.
TGA of EVA and its nanocomposites
Thermogravimetric analysis is a thermal analysis technique which measures the weight loss of a material as a function of temperature. In this investigation, the TGA is employed to evaluate the effects of varying the content of unfunctionalized and functionalized SBA-15 on the thermal stability of EVA copolymer. TGA thermograms of EVA and its nanocomposites containing SBA-15 and F-SBA-15 were shown in Figure 7. The weight loss curve of EVA displays two-step thermal degradation profile. The pure EVA losses 5% of weight at 338°C, and declines by 15% around 400°C, which attributed to the de-acetylation process of the vinyl acetate groups in the copolymer, with formation of polyene along the EVA copolymer backbone and the production of gaseous acetic acid (CH3-COOH).24,69 Then, the weight of EVA losses over again by 50% at 462°C, and 90% at 484°C as a result of the allylic chains scission of the unsaturated backbone until reaching the entire thermal degradation at high temperature.
70
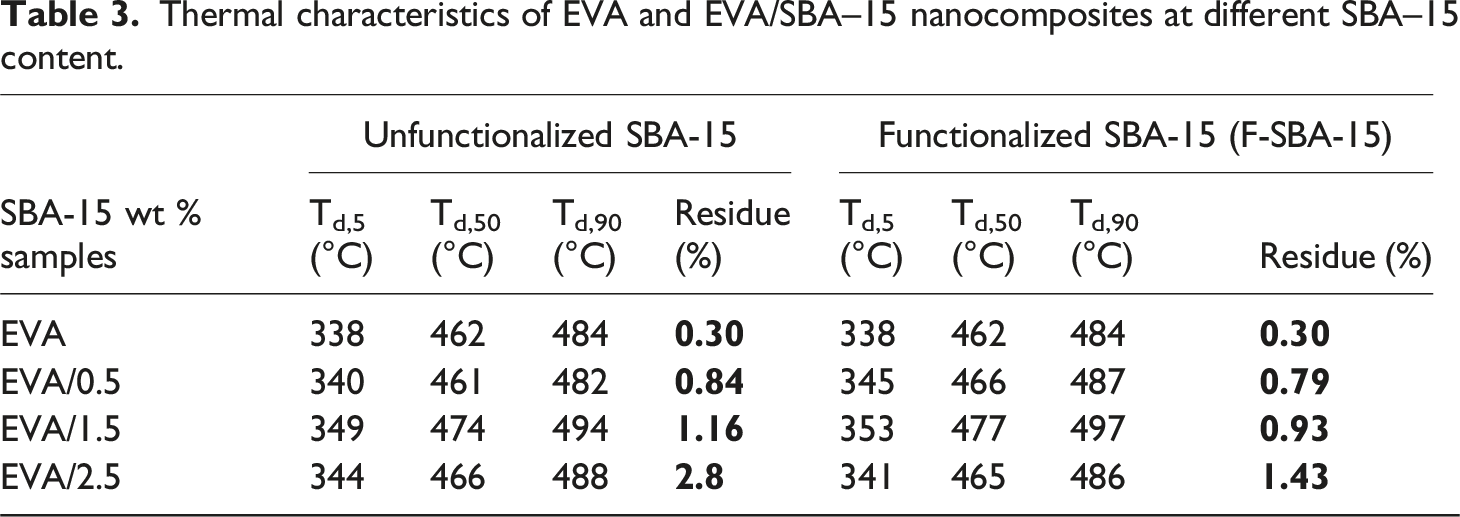
The TGA profiles of EVA nanocomposites are similar to that of EVA but shifted to higher degradation temperatures relative to the EVA matrix (see Table 3). For example, with the addition of 1.5 wt% F-SBA-15, Td,5, Td,50, and Td,90 increase to 353, 477, and 497°C, respectively, which are 15°C, 15°C and 13°C higher than that of neat EVA. TGA thermograms of EVA and its nanocomposites. Thermal characteristics of EVA and EVA/SBA–15 nanocomposites at different SBA–15 content.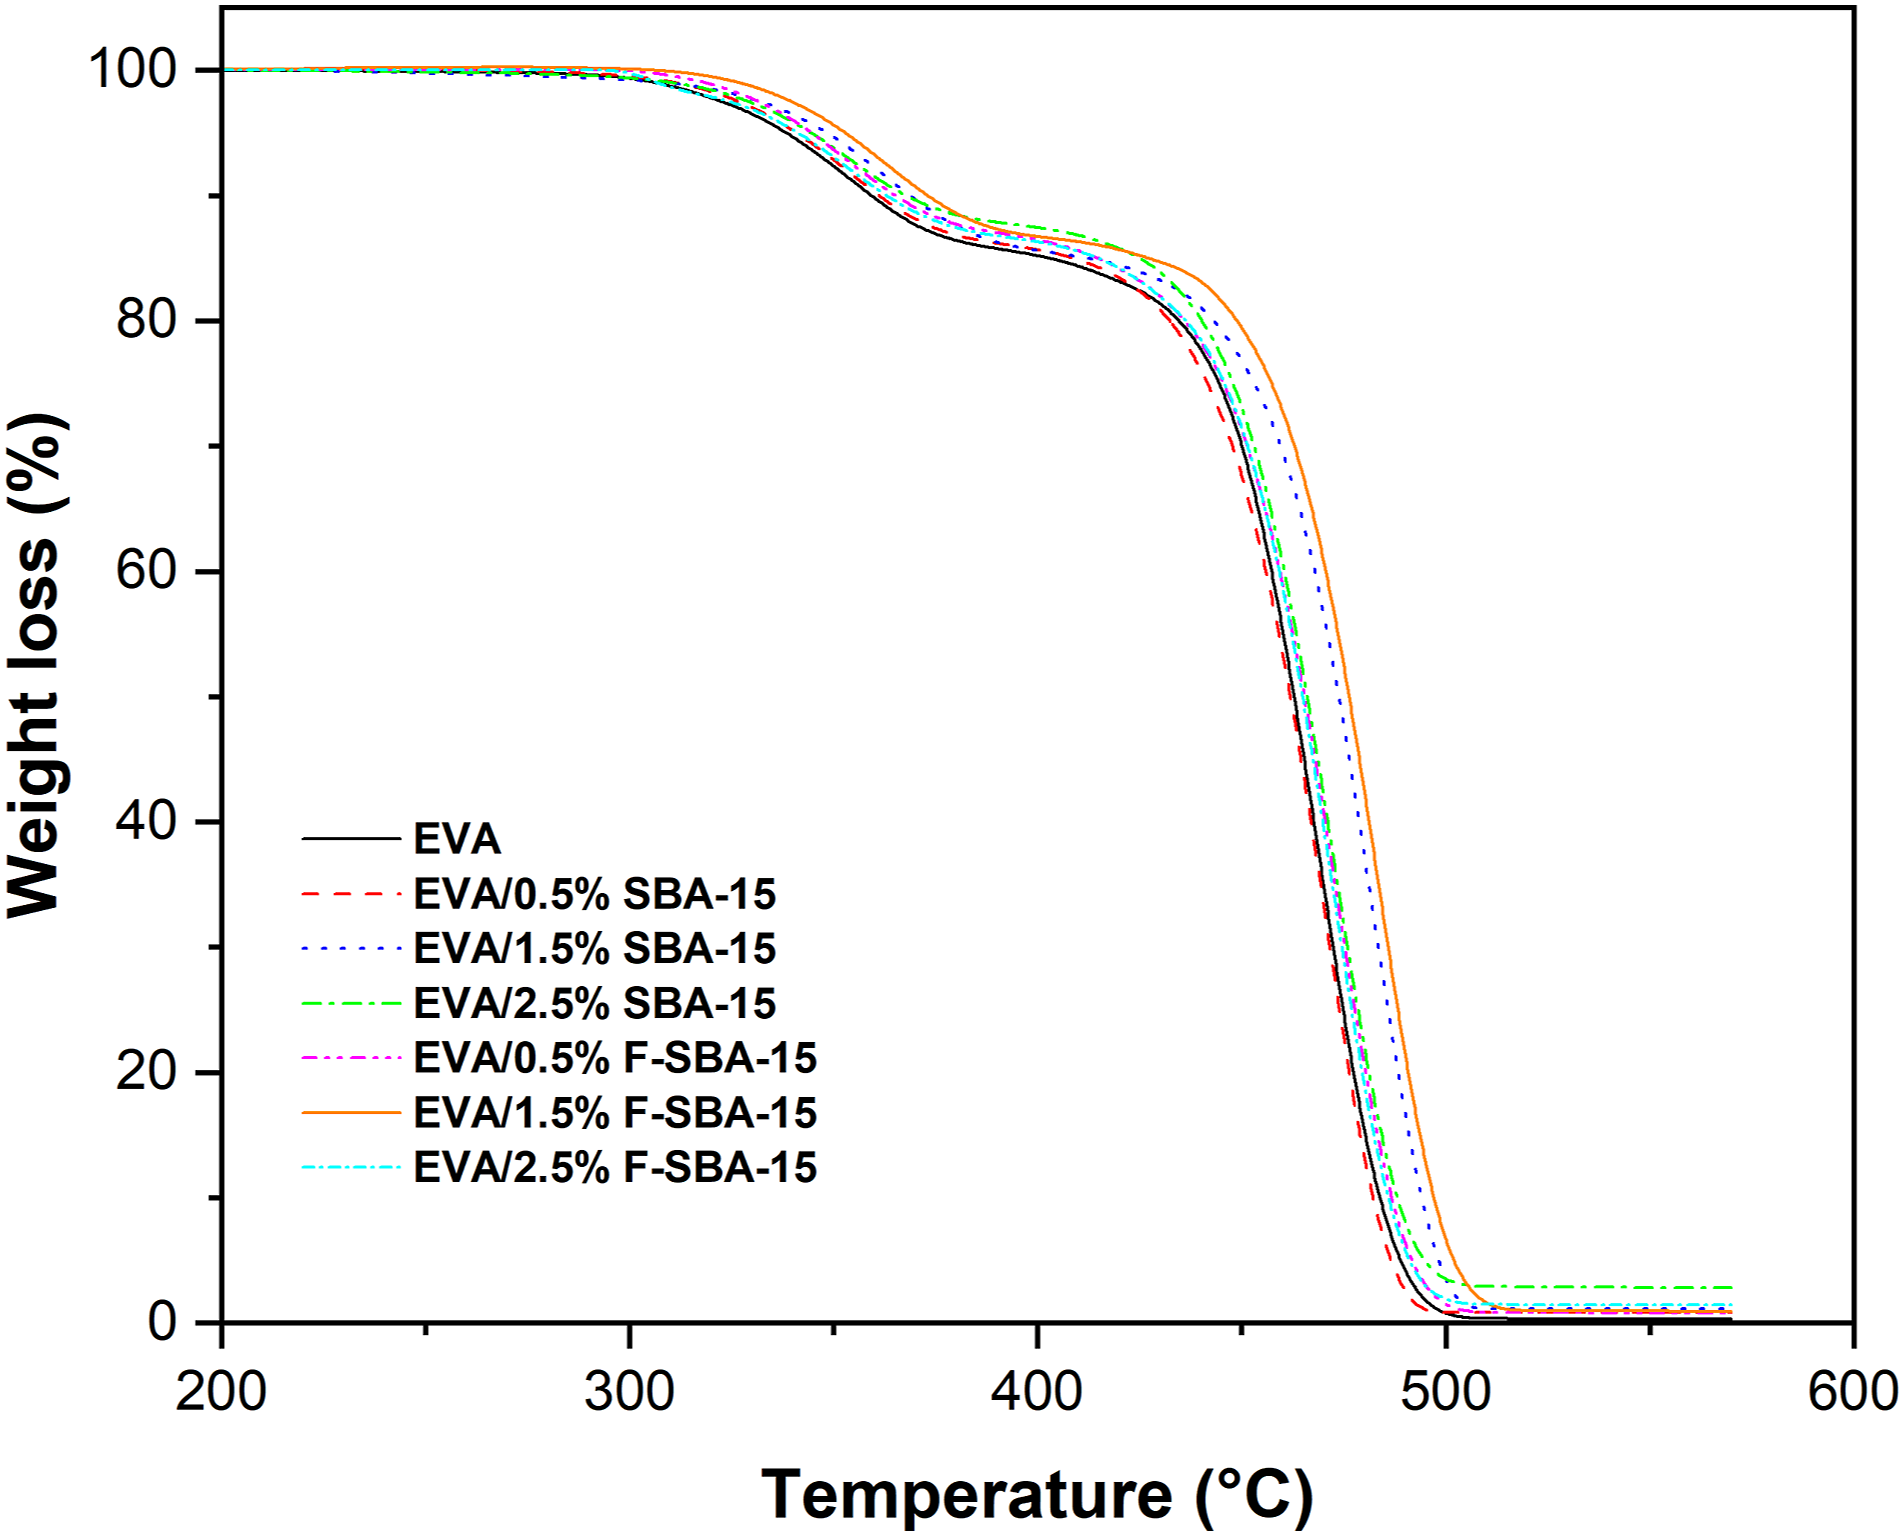
The obtained results suggest that the presence of either functionalized or unfunctionalized SBA-15 nanoparticles delays the pyrolysis process of the acetate group in the first decomposition step and brings significant thermal performance to EVA matrix.
Enhancement in EVA thermal performance is related to the presence of mesoporous particles, which possess high thermal stability and thick walls, and intensive interfacial adhesion between the EVA matrix and F-SBA-15 surface-modified with coupling agent. The presence of SBA-15 and the existence of EVA chains within their pores led to a postponement in the degradation of EVA chains. Barranco-Garcia et al. 36 reported that Isotactic polypropylene (iPP)/mesoporous SBA-15 silica composites, illustrating values of Tmax and T10% higher than iPP, enhancement in the iPP thermal performance related to the presence of mesoporous particles is dependent on pores diameter and their content.
Using two different types of silane coupling agents, such as triethoxyvinylsilane (A-151) and 3-aminopropyl-triethoxysilane (KH-550); Lu et al. 71 prepared a series of ethylene-vinyl acetate rubber/surface-modified mesoporous silica composites in the melting state, and they noticed that the composites’ thermal stability was increased.
The total weight loss of pure EVA was 99.70% and improved by the introduction of mesoporous silica, as shown in Figure 7. The residue material at 550°C is higher for the composites containing unfunctionalized fillers than those containing silane-functionalized fillers. Thus, it indicates the high thermal stability of the mesoporous silica and the finer dispersion into the whole bulk of the polymer matrix.
Dielectric study
The dielectric constant is an essential parameter in the choice of an insulating material. The frequency dependence of dielectric constant and dielectric loss of the pure EVA and its nanocomposites are shown in Figure 8. Frequency dependence of EVA and EVA/SBA-15 nanocomposites at 25°C, (a) the dielectric constant, (b) the dielectric loss.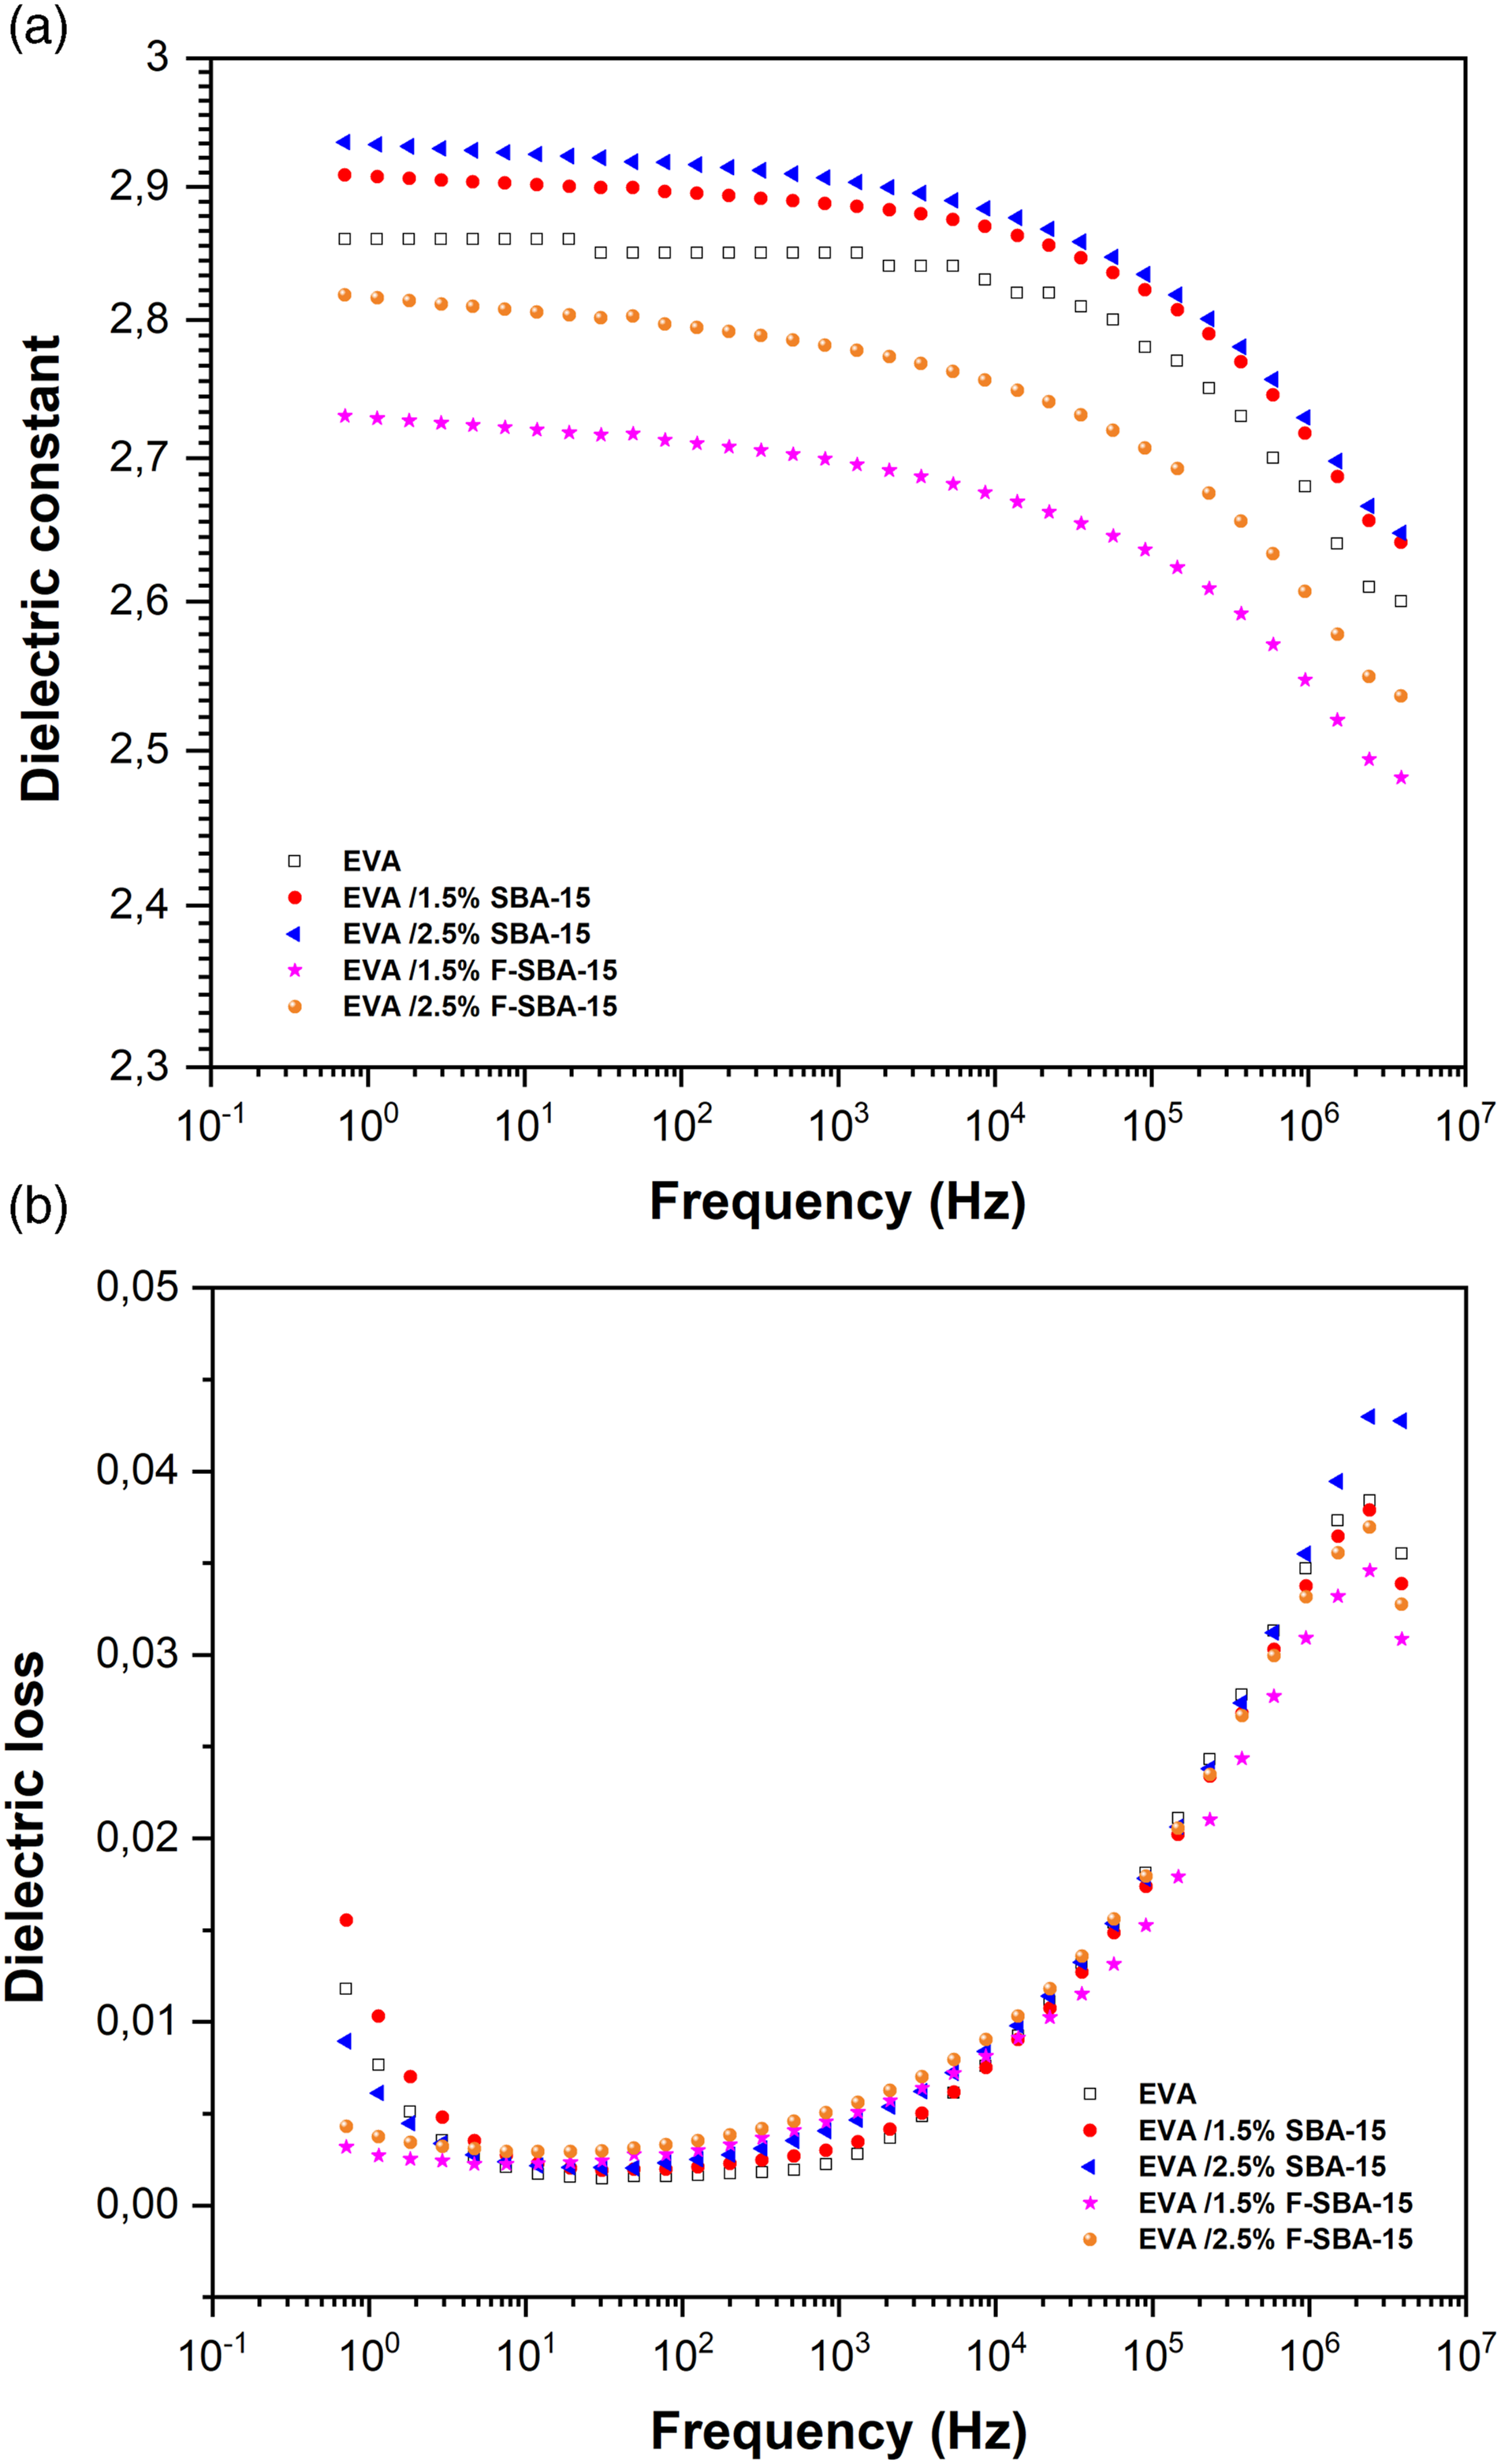
In the dielectric constants versus frequency plots of the pristine EVA and its nanocomposites (Figure 8(a)), it can be seen that the dielectric constants decrease gradually across the frequency range between (1 Hz ∼ 104 Hz) and reduced sharply at a frequency greater than 104 Hz. The decrease in dielectric constant may be due to the reduction in orientation polarization as the frequency rises. The orientation polarization depends on molecular arrangements and the uniform distribution of the filler inside the matrix. The orientation polarization requires much more time, and as the frequency increases, the polar molecules get less and less time to orient themselves in the direction of the alternating field, thus decreases the dielectric permittivity. 14 Dielectric constant increases when inorganic fillers were added to a polymer, and the main reasons for such increase have been attributed to the higher dielectric constant of inorganic fillers than the polymer matrix and interfacial polarization. 72 From the Figure 8(a) it was observed that the nanocomposites EVA/SBA-15 exhibits a higher dielectric constant compared to the unfilled matrix and increases with the increase of unfunctionalized SBA-15 loading as results of introducing high polarity SBA-15 nanoparticles, which increase interfacial polarization of the nanocomposites.
On the other hand, the addition of functionalized fillers (F-SBA-15) reduces the dielectric constant of the nanocomposites EVA/F-SBA-15. This reduction resulting from the fort interfacial adhesion restrained the orientation polarization of polar groups (acetate) and the presence of less polar nature (silanol groups) present in SBA-15 after surface functionalization. Lu et al. 71 ; were prepared a series of poly (ethylene vinyl acetate rubber/surface modified mesoporous silica composites (EVM/M-SBA-15) at molten state. To modify the SBA-15 surface, the authors were utilized two kinds of silane coupling agent; the triethoxyvinylsilane (A-151) and 3-aminopropyl-triethoxysilane (KH-550). The authors found that the dielectric constant of the composites decreased by loading a small amount of modified SBA-15 (0.5 phr).
Figure 8(b) shows frequency dependence of the dielectric loss of EVA and EVA/SBA-15 nanocomposites at room temperature. The same tendency of pure EVA and its nanocomposites was observed. The result showed that mesoporous silica did not change the frequency dependence of dielectric loss. The dielectric loss of EVA and its nanocomposites decrease slightly at low frequency region and reached their lowest point at a frequency of 30 Hz, then stared to elevate up from 102 Hz, until the fluctuation at a frequency of 106 Hz. At low frequency, the orientation polarization had sufficient time to keep-pace with electric field change, thus, the dielectric losses were very small (below 0.015). In contrast, orientation polarization couldn’t keep up with the frequency variation at a frequency range more than 103 Hz, resulting in a rapidly rise of dielectric losses. In conclusion, the dielectric losses of the fabricated EVA/SBA-15 nanocomposites with the frequency change from 100 Hz to106 Hz were maintained below 0.05 and according to previous studies,14,71,72 these materials can be used as an effective insulating material for electrical wire.
Conclusions
In this study, poly (ethylene-co-vinyl acetate)/SBA-15 nanocomposites were prepared by melt blending to investigate the effects of mesoporous silica SBA-15 content and surface functionalization on the physiochemical properties of EVA/SBA-15 hybrid materials.
The results revealed the successful synthesis and functionalization of mesoporous silica type SBA-15 by hexadecyltrimethoxysilane, as confirmed by the FTIR and SEM.
From FTIR analysis, physical interactions between the -OH surface groups of SBA-15 and -C=O groups of vinyl acetate in the EVA matrix were detected and strong hydrogen bond in EVA/F-SBA-15 nanocomposite.
The crystallinity of the EVA matrix was reduced with the addition of the fillers, more for the Functionalized SBA-15 than for the unfunctionalized SBA-15, a maximum of 26% decrease was found.
The reduction in the crystallinity did not influence negatively the mechanical properties of the nanocomposites, because the enhancement resulted by the effects of both SBA-15 content and surface functionalization of SBA-15 addition.
Overall increases in the elastic modulus with the filler content, whereas the elongation at break and the tensile strength increased or reduced slightly depending on the filler content and the surface functionalization. The nanocomposite containing SBA-15 functionalized with hexadecyltrimethoxysilane (HDTMS) showed an increase in all mechanical properties (modulus, tensile strength and elongation) compared to unfunctionalized SBA-15 and neat EVA matrix.
SEM images showed that the increase in mechanical properties was due to the enhanced interfacial adhesion of the filler surface with the matrix and the well-dispersion of F-SBA-15 nanoparticles, with a significant agglomeration of the particles at 2.5 wt%, leading to a decrease in the mechanical properties.
The incorporation of mesoporous silica improves the thermal stability of the nanocomposites with respect to the EVA matrix. The nanocomposite containing 1.5 wt% of functionalized mesoporous silica (F-SBA-15) shows an enhancement in thermal stability (Td, 50) of about 15°C compared to the unfilled EVA matrix.
The results from the dielectric study revealed that the dielectric constant of the nanocomposites could be reduced by loading F-SBA-15. It was found that the EVA/SBA-15 and EVA/F-SBA-15 nanocomposites are good electrical insulation materials.
This study highlights the importance that functionalized mesoporous silica applies to the confinement of EVA chains within the nanopores of mesoporous silica, with a subsequent effect on fundamental properties such as mechanical properties, thermal stability, and dielectric properties of the resultant materials. They can contribute to spreading out the already extensive application fields of the poly (ethylene-co-vinyl acetate).
Footnotes
Acknowledgements
The Authors acknowledge the Institute of sciences and polymers technology (ICTP) Madrid, Spain, for the technical assistance to accomplish this study.
Declaration of conflicting interests
The author(s) declared no potential conflicts of interest with respect to the research, authorship, and/or publication of this article.
Funding
The author(s) received no financial support for the research, authorship, and/or publication of this article.