
Abstract
The current investigation evaluates the compressive response of 3D-printed carbon fiber-reinforced PETG thermoplastics to optimize different infill parameters when loaded at high impact pressures (strain rates). The selected parameters for the 3D printing of different samples are the filling pattern (rectilinear and honeycomb) and the filling density (25%, 50%, and 75%). Compression-split Hopkinson pressure bars (SHPBs) combined with a high-speed camera were used to monitor the evolution of the mechanical behavior and damage kinetics of 3D-printed samples in real-time with the variation in strain rate. The results revealed a significant improvement in compressive strength and compressive modulus when the filling density was increased from 20% to 75% for both patterns. However, the combination of a honeycomb pattern with 75% filling presented the best compressive strength, stiffness and damage resistance, irrespective of impact pressure. In particular, the highest compressive strengths, ranging from 35.5 to 56.16 MPa for impact pressures of 1.4 to 2.4 bar, respectively, were obtained with this configuration (75% honeycomb pattern). This represents a substantial difference of 25 to 38% compared with the 75% rectilinear pattern, which showed values below 35 MPa. Another significant result was observed for the compressive modulus, which reached 2787.8 MPa for the honeycomb-filled samples, whereas this value remained below 2000 MPa for the rectilinear pattern.
Keywords
Highlights
• The study of the dynamic behavior of 3D-printed CF-PETG composites • Infill parameters can affect mechanical behavior and dynamic properties. • The honeycomb pattern resulted in higher strength, stiffness, and impact resistance. • The use of a honeycomb pattern effectively mitigates damage mechanisms.
Introduction
Currently, the manufacturing industry is facing additional pressure to find and use methods that can ensure design flexibility, small quantity production, and rapid product modifications with less cost because of the worldwide competition in mass fabrication and customization. Three-dimensional (3D) printing technology, or Additive Manufacturing (AM), is promptly becoming a common process of manufacturing engineering products for industries such as construction, aerospace, electronics, automobiles, healthcare monitoring, and medicine because of its exceptional ability to direct manufacture complex parts, reduce material waste, manufacturing time and costs, and produce small batch rapidly.1–4
Rapid improvements in AM technology have led to the creation of several 3D printing processes, including Fused Deposition Modeling (FDM), often known as Fused Filament Fabrication (FFF), which is swiftly gaining importance in several industries because of its easy scalability, good cost-to-size ratio, and material flexibility.5–8 However, this fabrication process faces issues that can influence the behavior and quality of the manufactured part, such as weak adhesion between the layers deposited on one another and the complexity of the process, which requires consideration of many process parameters. 9 The main restriction of this method is the distortion between the internal layers. 10 As a result, innovative and robust polymeric materials must be developed to expand this technology’s uses.11,12 Thermoplastic polymers are the most common matrix used in the FFF manufacturing process. These polymers offer significant advantages over traditional thermosetting polymers; they can be reheated and reformed without being permanently hardened.
Polyether Ether Ketone (PEEK), Acrylonitrile Butadiene Styrene (ABS), Polylactic Acid (PLA), and, more recently, Polyethylene Terephthalate Glycol (PETG) are the most frequently used thermoplastics.13–15 Nevertheless, PET-G copolymer, with its amorphous microstructure, combines the durability and strength of ABS with the biocompatibility, printing ease, and recyclability of PLA. 14 In addition, PETG exhibited more exceptional properties, including flexibility, chemical and impact resistance, ductility, toughness, thermoformability, and UV and weather resistance. 16 As a result, PETG has become an excellent choice for meeting the needs of 3D-printed polymeric components in specialized and innovative sectors such as automobiles, bioengineering, and robotics. 17
The behavior of 3D printed PETG polymers may be further enhanced with the incorporation of reinforcements, including carbon fiber,10,18 glass fiber, 19 carbon nanotubes, 20 graphene,21,22 organically modified montmorillonite (OMMT) nanoclay, 23 etc.
However, carbon fiber-reinforced thermoplastic composite materials are generally chosen because of their high specific density, specific strength, recyclability, ease of production, and lower material and manufacturing costs.
24
In addition, the incorporation of carbon fibers further reduces the risk of warpage, conferring PETG polymer with higher resistance and resilience, thus rendering it an excellent choice for automotive, aeronautics, and other industrial applications. The development and use of CF-PETG materials is helping to advance manufacturing technologies and create innovative, high-performance products in a variety of industries, especially those requiring a combination of strength, durability, and design flexibility
Different process parameters are frequently used to significantly reduce printing time as well as material consumption when manufacturing 3D printed carbon fiber (CF) reinforced PETG composite using the FFF technique, and it is difficult to understand how these variables may affect the behavior of the obtained parts. Consequently, the primary goal when using the 3D printing process is to identify the effect of different printing parameters on the properties of materials manufactured and develop methods for optimizing them in order to obtain enhanced characteristics. In the same context, using an ANOVA approach, Durgashyam et al. 25 examined the relative effects of process parameters including feed rate, fill density, and thickness of layer on the tensile as well as flexural strength of PETG (Polyethylene Terephthalate Glycol) polymer manufactured using the FDM technique, and suggested the set of parameters that confer PETG 3D printed samples with better mechanical properties. Srinivasan et al 16 only examined the consequences of changing the fill density on the mechanical surface roughness and tensile strength of PETG samples 3D printed using the FDM process (as specified by ASTM), and the results revealed a substantial effect on the mechanical properties of the printed components. Kumar et al. 26 examined and improved the tensile strength, flexural strength, and hardness of 3D printed CF-PETG specimens by optimizing the printing settings such as layer height, fill density, and printing speed. The optimal values for flexural strength, hardness, and tensile strength were obtained at a printing speed of 60 mm/sec, a fill density of 80%, and a layer height of 200 µ. Kichloo et al. 27 analyzed the impact of pattern, filling density, and layer thickness on the flexural and tensile strength as well as the tribological behavior of carbon fiber (CF)-reinforced PETG composite. The results showed that 20 wt% of CF in PETG with a triangular pattern exhibited the best results among all tested samples. Basurto-Vázquez et al. 28 demonstrated that the printing parameters, including layer printing orientation (edge, flat, and upright) and infill density (30%, 70%, and 100%), considerably affected the compressive behavior and energy absorption of honeycomb-patterned 3D-printed PETG samples. The structure printed in an upright direction with a 100% infill percentage showed less delamination and fracture delay with the higher energy absorption.
Significant efforts have been expended in identifying and optimizing a variety of printing parameters for the characterization of FFF 3D-printed CF-PETG composite specimens under static and quasi-static laoding conditions. However, the effects of the 3D-printing process parameters on the mechanical response of CF-PETG evaluated at high strain rates have not yet been sufficiently investigated, and even if any studies are mentioned, they are confined to strain rates of
Therfore, this research work has as its main objective the examination of the influence of the variation of infill parameters, including pattern (rectilinear and honeycomb) and density (20%, 50% and 75%), on the dynamic compressive response of CF-PETG material 3D printed by the FFF method. Experimental investigations have been conducted at numerous impact pressures (1.4, 1.7, 2, and 2.4 bar) using SHPB. Damage kinetics within the samples were monitored using a high-speed camera, and failure modes of 3D-printed CF-PETG composites were than analyzed and investigated. The optimal infill parameters that may provide a satisfactory dynamic response under various ranges of high strain rates will be determined by a comparative investigation. Furthermore, in order to more accurately predict the dynamic behavior of 3D composite structures under dynamic loading, empirical models based on the effect of strain rate variation on the various dynamic compression parameters have been developed.
Dynamic compression: split Hopkinson pressure bar technique
The dynamic in-plane compressive response of 3D-printed CF-PETG composite specimens was characterized by means of the split Hopkinson bar system (SHPB) under a range of strain rates. The SHPB device is composed of a striker, an incident (input), and a transmitted (output) bars made of high-strength Maraging steel of 20 mm diameter, Figure 1. To evaluate the mechanical response of the 3D composite materials, each specimen will be positioned without any attachments between the input and output bars to avoid measurement perturbations caused by additional interfaces
43
and solicited in the direction parallel to the layer plane by a striker bar at a given impact pressure. The values of the impact pressure of the projectile upon the input bar included 1.4 bar, 1.7 bar, 2 bar, and 2.4 bar. Therefore, a gas gun mechanism with a maximum pressure of 6 bar is used to adjust the velocity of the striker bar with which it will impact the input bar to produce a compressive strain pulse (incident wave εI(t)) that will travel the length of the incident bar. Once reaching the specimen surface, part of the wave is reflected (reflected wave εR(t)) due to the difference in material impedance, and the remainder propagates through the specimen and crosses the entire length of the output bar (transmitted wave εT(t)). These three pulses will be measured by strain gauges situated at the center of each bar, then registered by a digital oscilloscope and post-processed using the Fast Fourier Transform (FFT) method developed by Maple software. Stress versus strain and strain rate versus time were the dynamic parameters of CF-PETG 3D-printed samples studied using this experimental setup. The split Hopkinson pressure bar.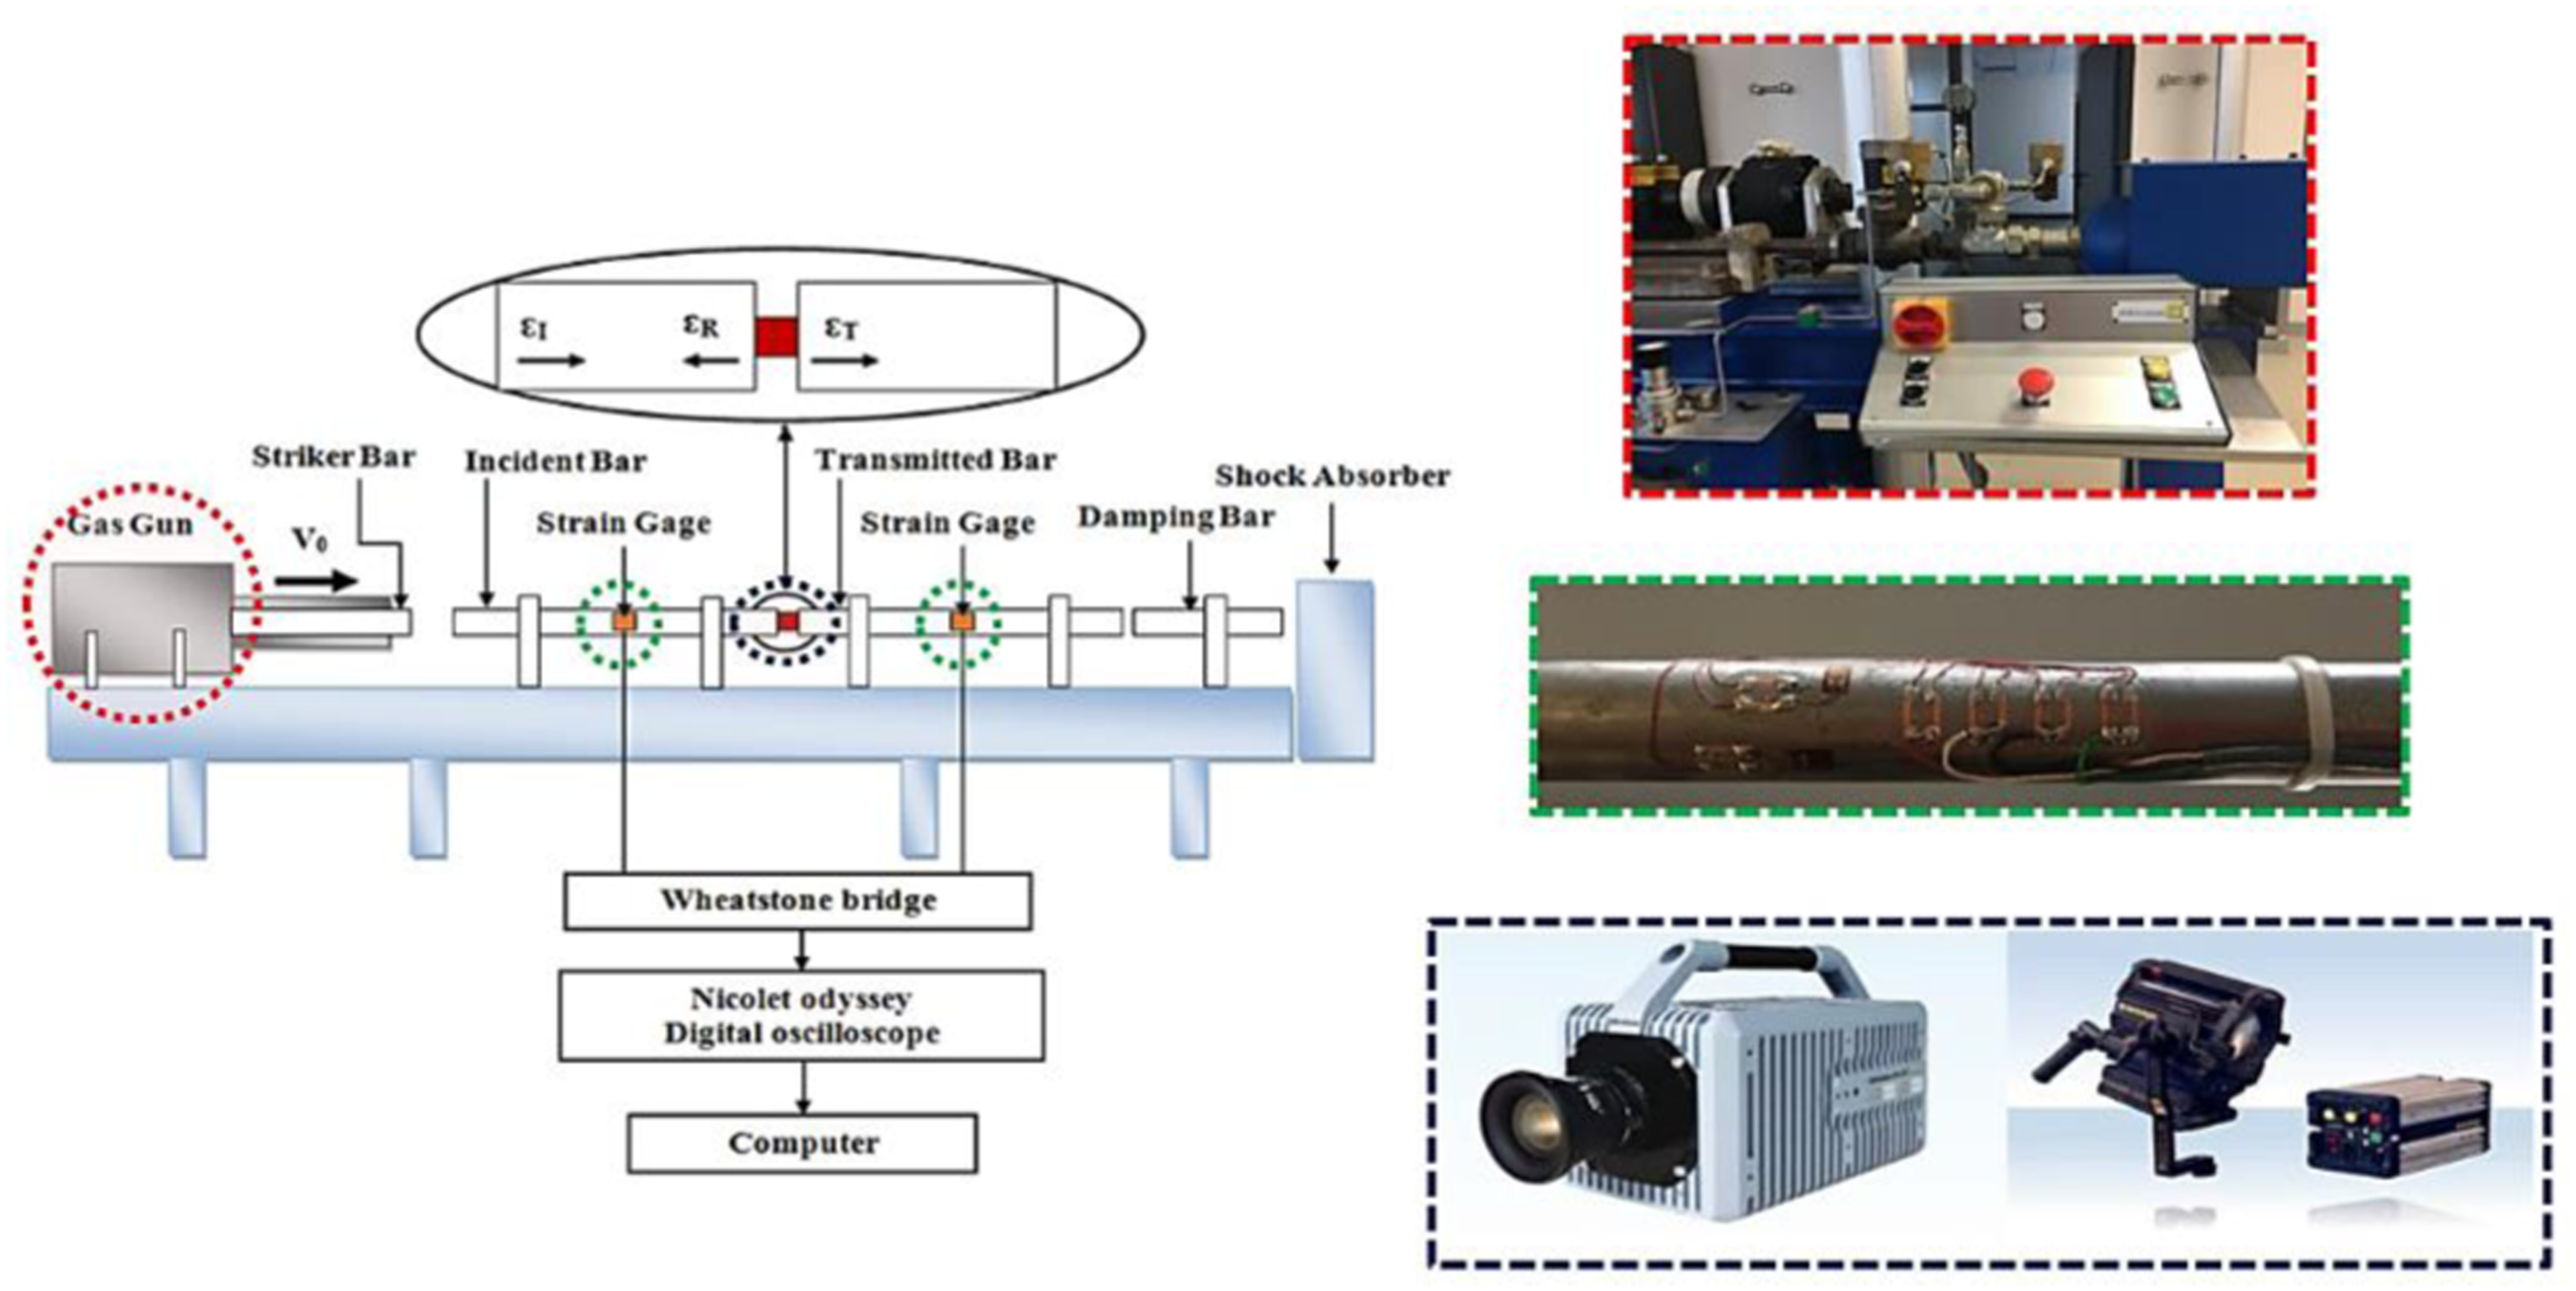
A high-speed camera was also included in the experimental setup to monitor the deformation progress and damage kinetics of CF-PETG when exposed to high strain rates, see Figure 1.
Materials selection and manufacturing process
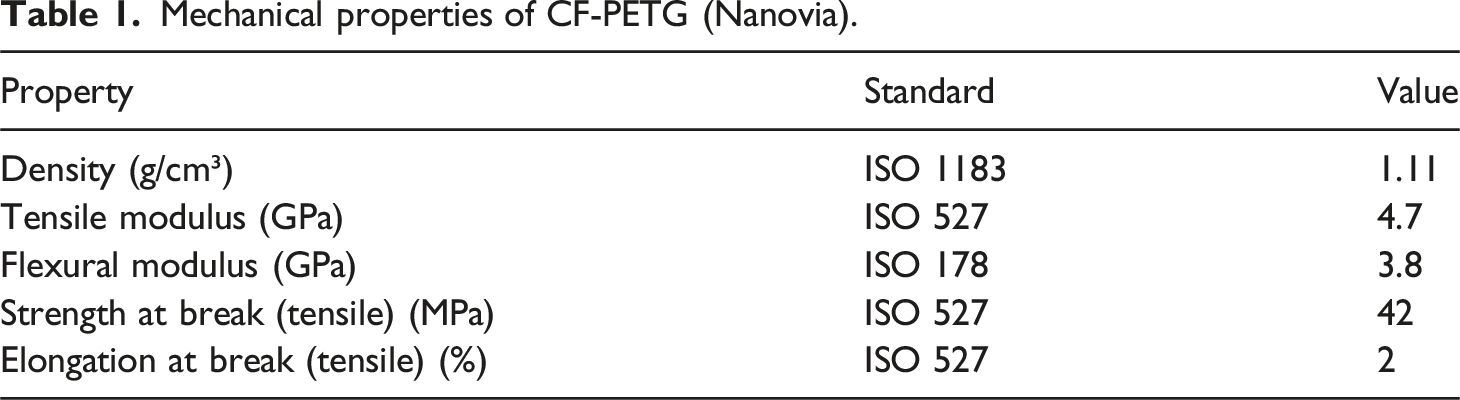
Material selection
Mechanical properties of CF-PETG (Nanovia).
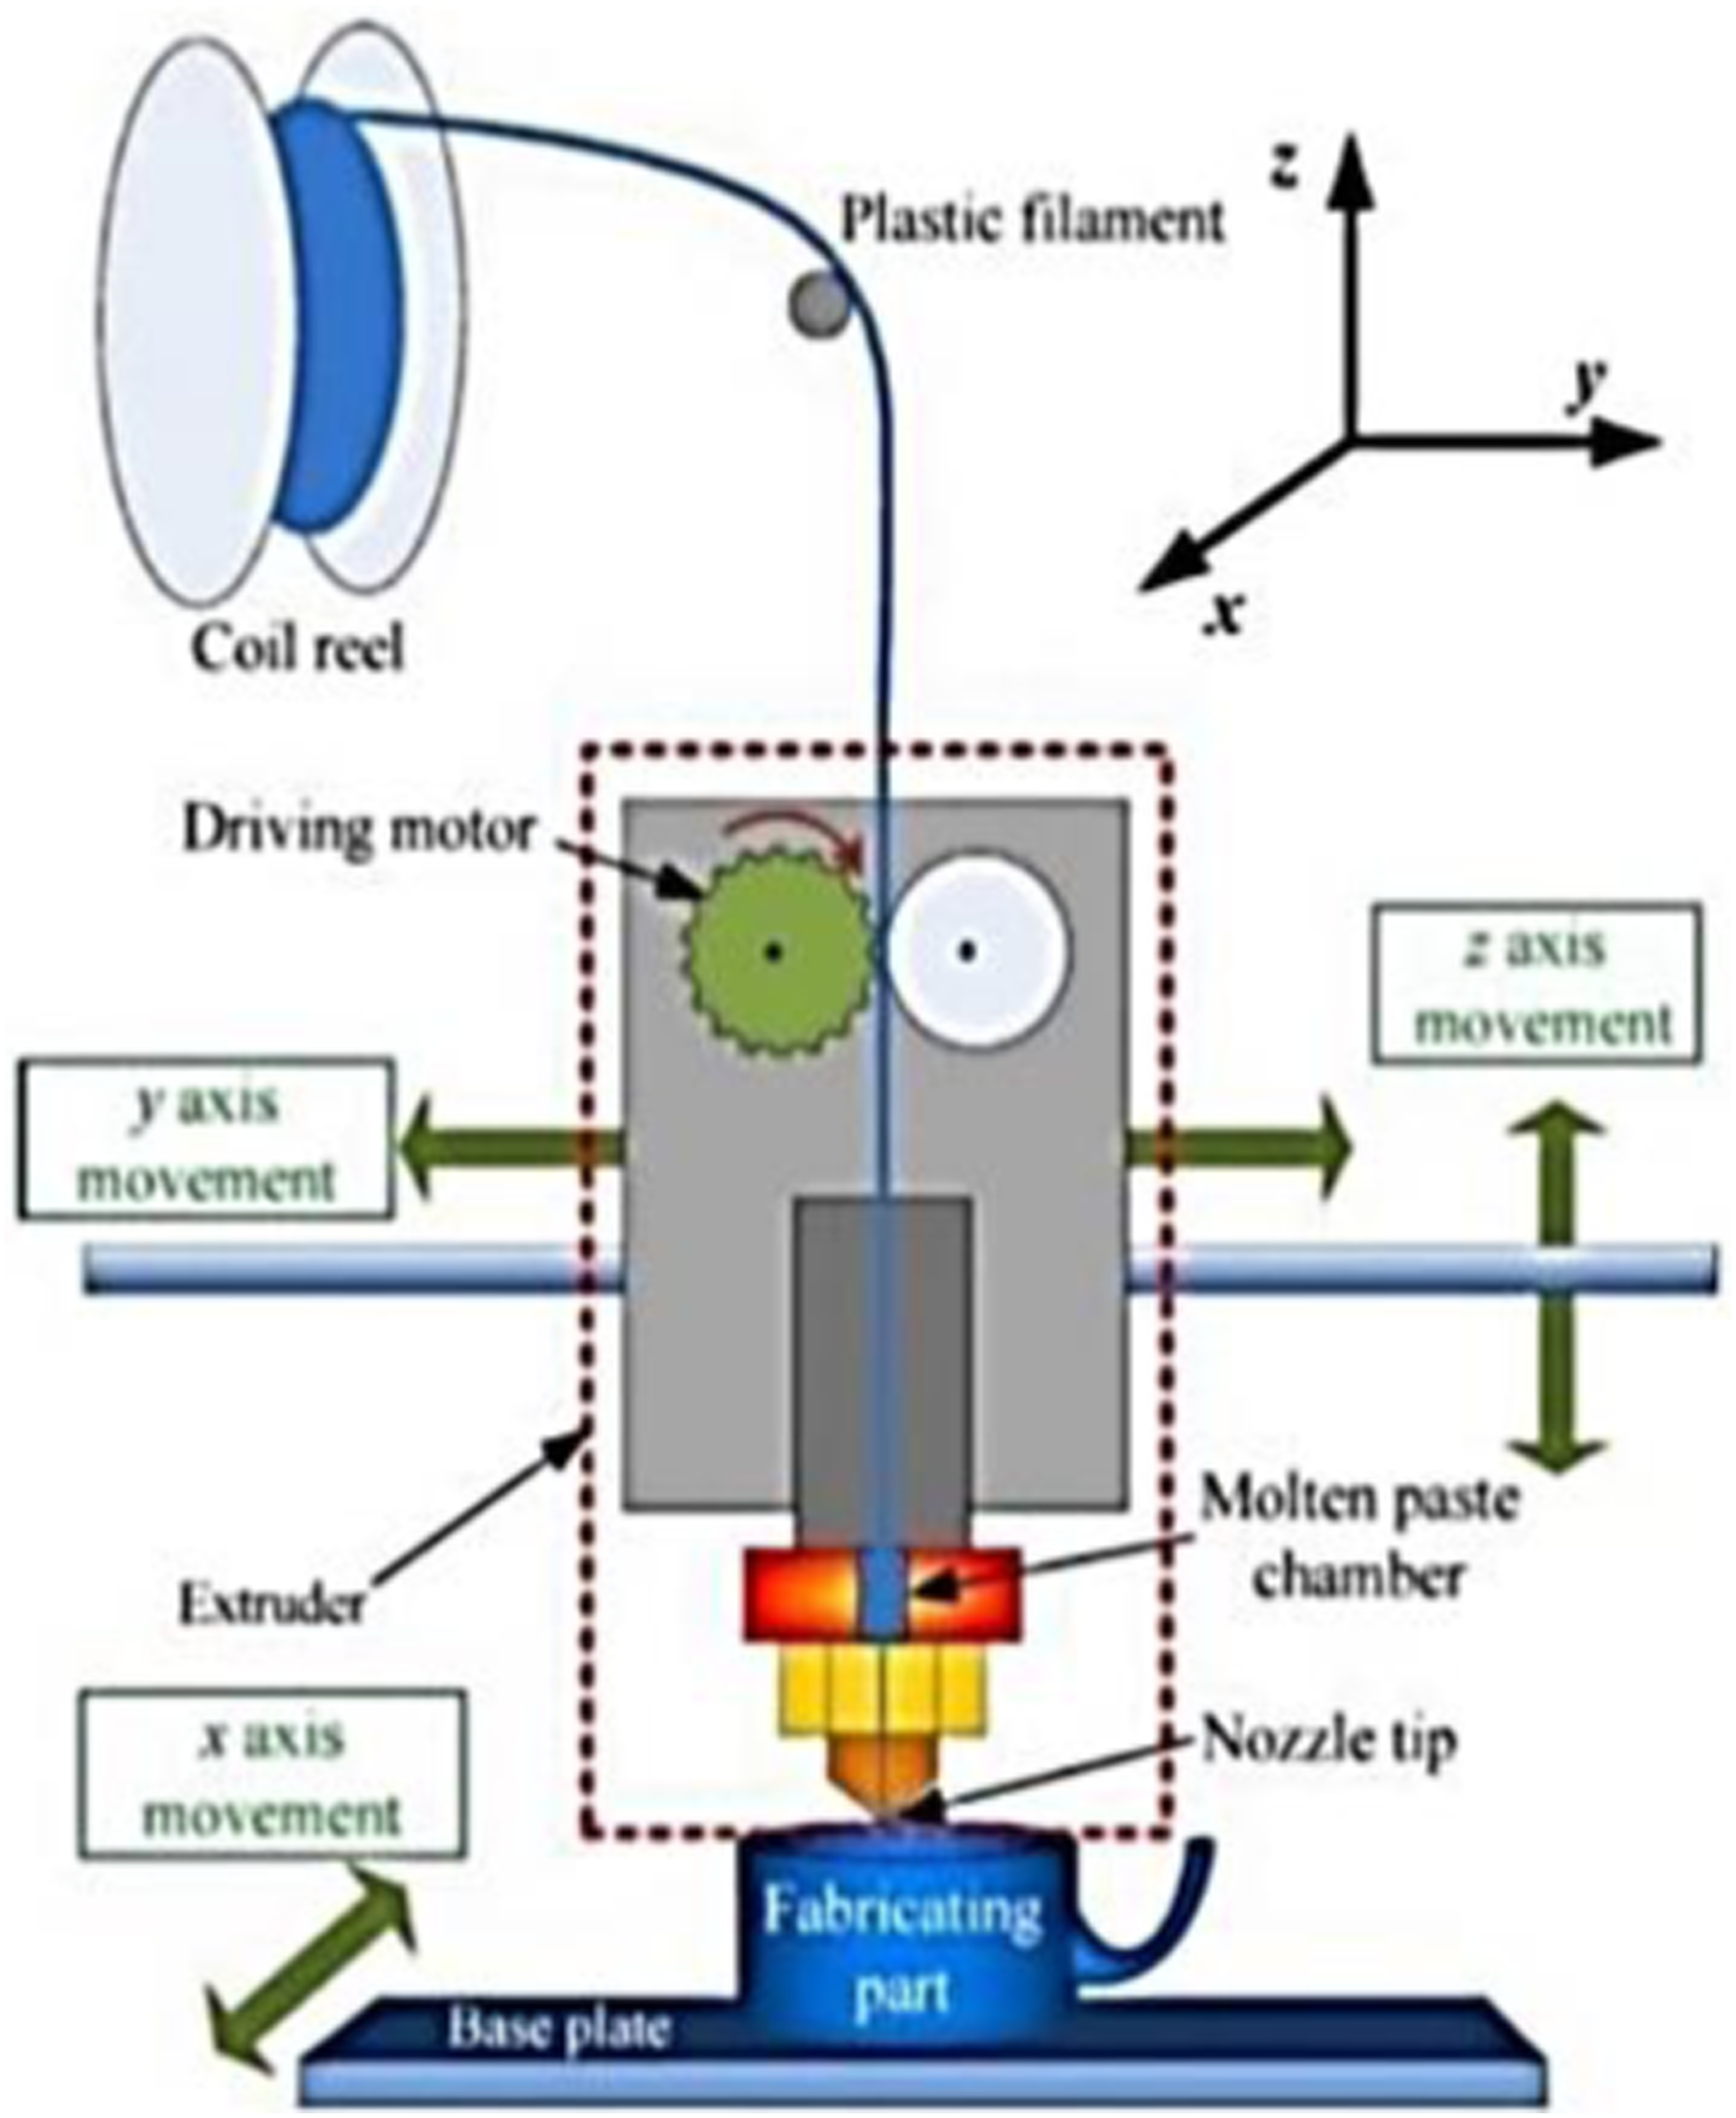
Fused filament fabrication process
The carbon fiber reinforced PETG specimens were manufactured using the Fused Filament Fabrication (FFF) method, as illustrated in Figure 2. Process of fused filament fabrication (FFF).
38
All samples were prepared using the same layer thickness, screen angle, air gap, and printing speed but with different densities and filling patterns, which were assessed for their impact on the material's mechanical performance when cost and printing time are key requirements. The choice of infill pattern is based on a combination of factors such as strength, material consumption, printing time and structural integrity. Honeycomb patterns are selected for their efficiency, strength and smoother surface finish, even though they require slightly more material. On the other hand, rectilinear patterns are chosen for their simplicity, speed and filament-saving features, but with possible compromises in terms of strength and material consumption.44,45 These considerations are crucial when it comes to generalizing the results to 3D-printed structures of complex shape, as the specific requirements of the application will determine the most appropriate filling pattern. Consequently, the specimens tested in this research were manufactured with rectilinear and honeycomb patterns with varying fill densities (20%, 50% and 75%).
After choosing the different filling parameters and in order to start the manufacturing process in a 3D printer, the specimens were first designed in CATIA software and then exported to the Slic3r program, which was responsible for converting the data into an STL file. Afterwards, the G-code file will be introduced to the controller of the 3D printer to start the fabrication process.
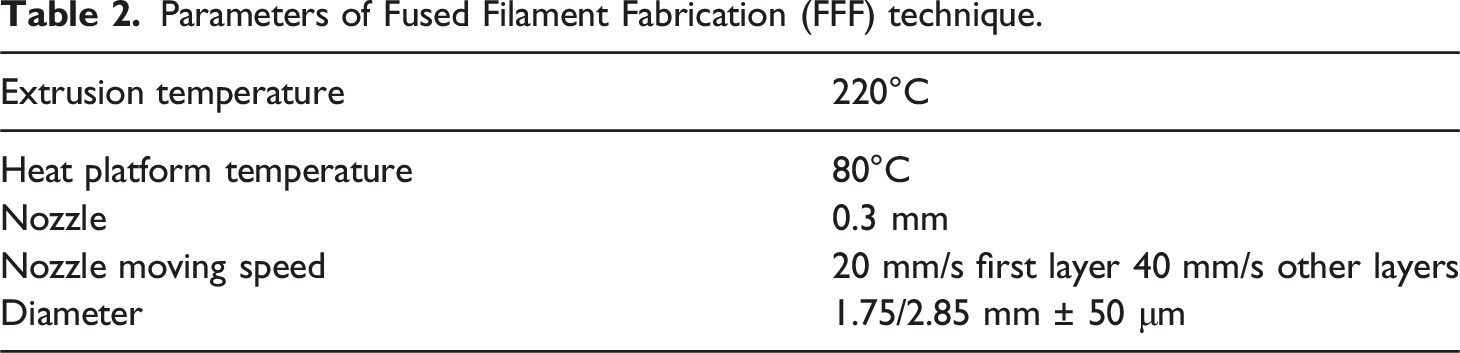
The principle of FFF is identical to that of any other type of additive manufacturing method, but it's a manufacturing and rapid prototyping technique that creates a final product by adding layer after layer of thermoplastic filament material. The detailed 3D printing process parameters used in the FFF technique are illustrated in Table 2. This procedure can be divided into three essential steps: • • • Parameters of Fused Filament Fabrication (FFF) technique.
The samples were printed in a 13-mm cube model for compressive dynamic testing purposes, and were classified based on filling pattern and density, including the honeycomb and the rectilinear cubic structure, with infill density values of 20%, 50%, and 75%, Figure 3(a)-(f). In this research work, two infill patterns are involved, and two labels are used to identify the specimens. The honeycomb design, for example, is labeled HON, and the rectilinear pattern is abbreviated as REC. Different configurations of short carbon-fiber-reinforced PETG composites.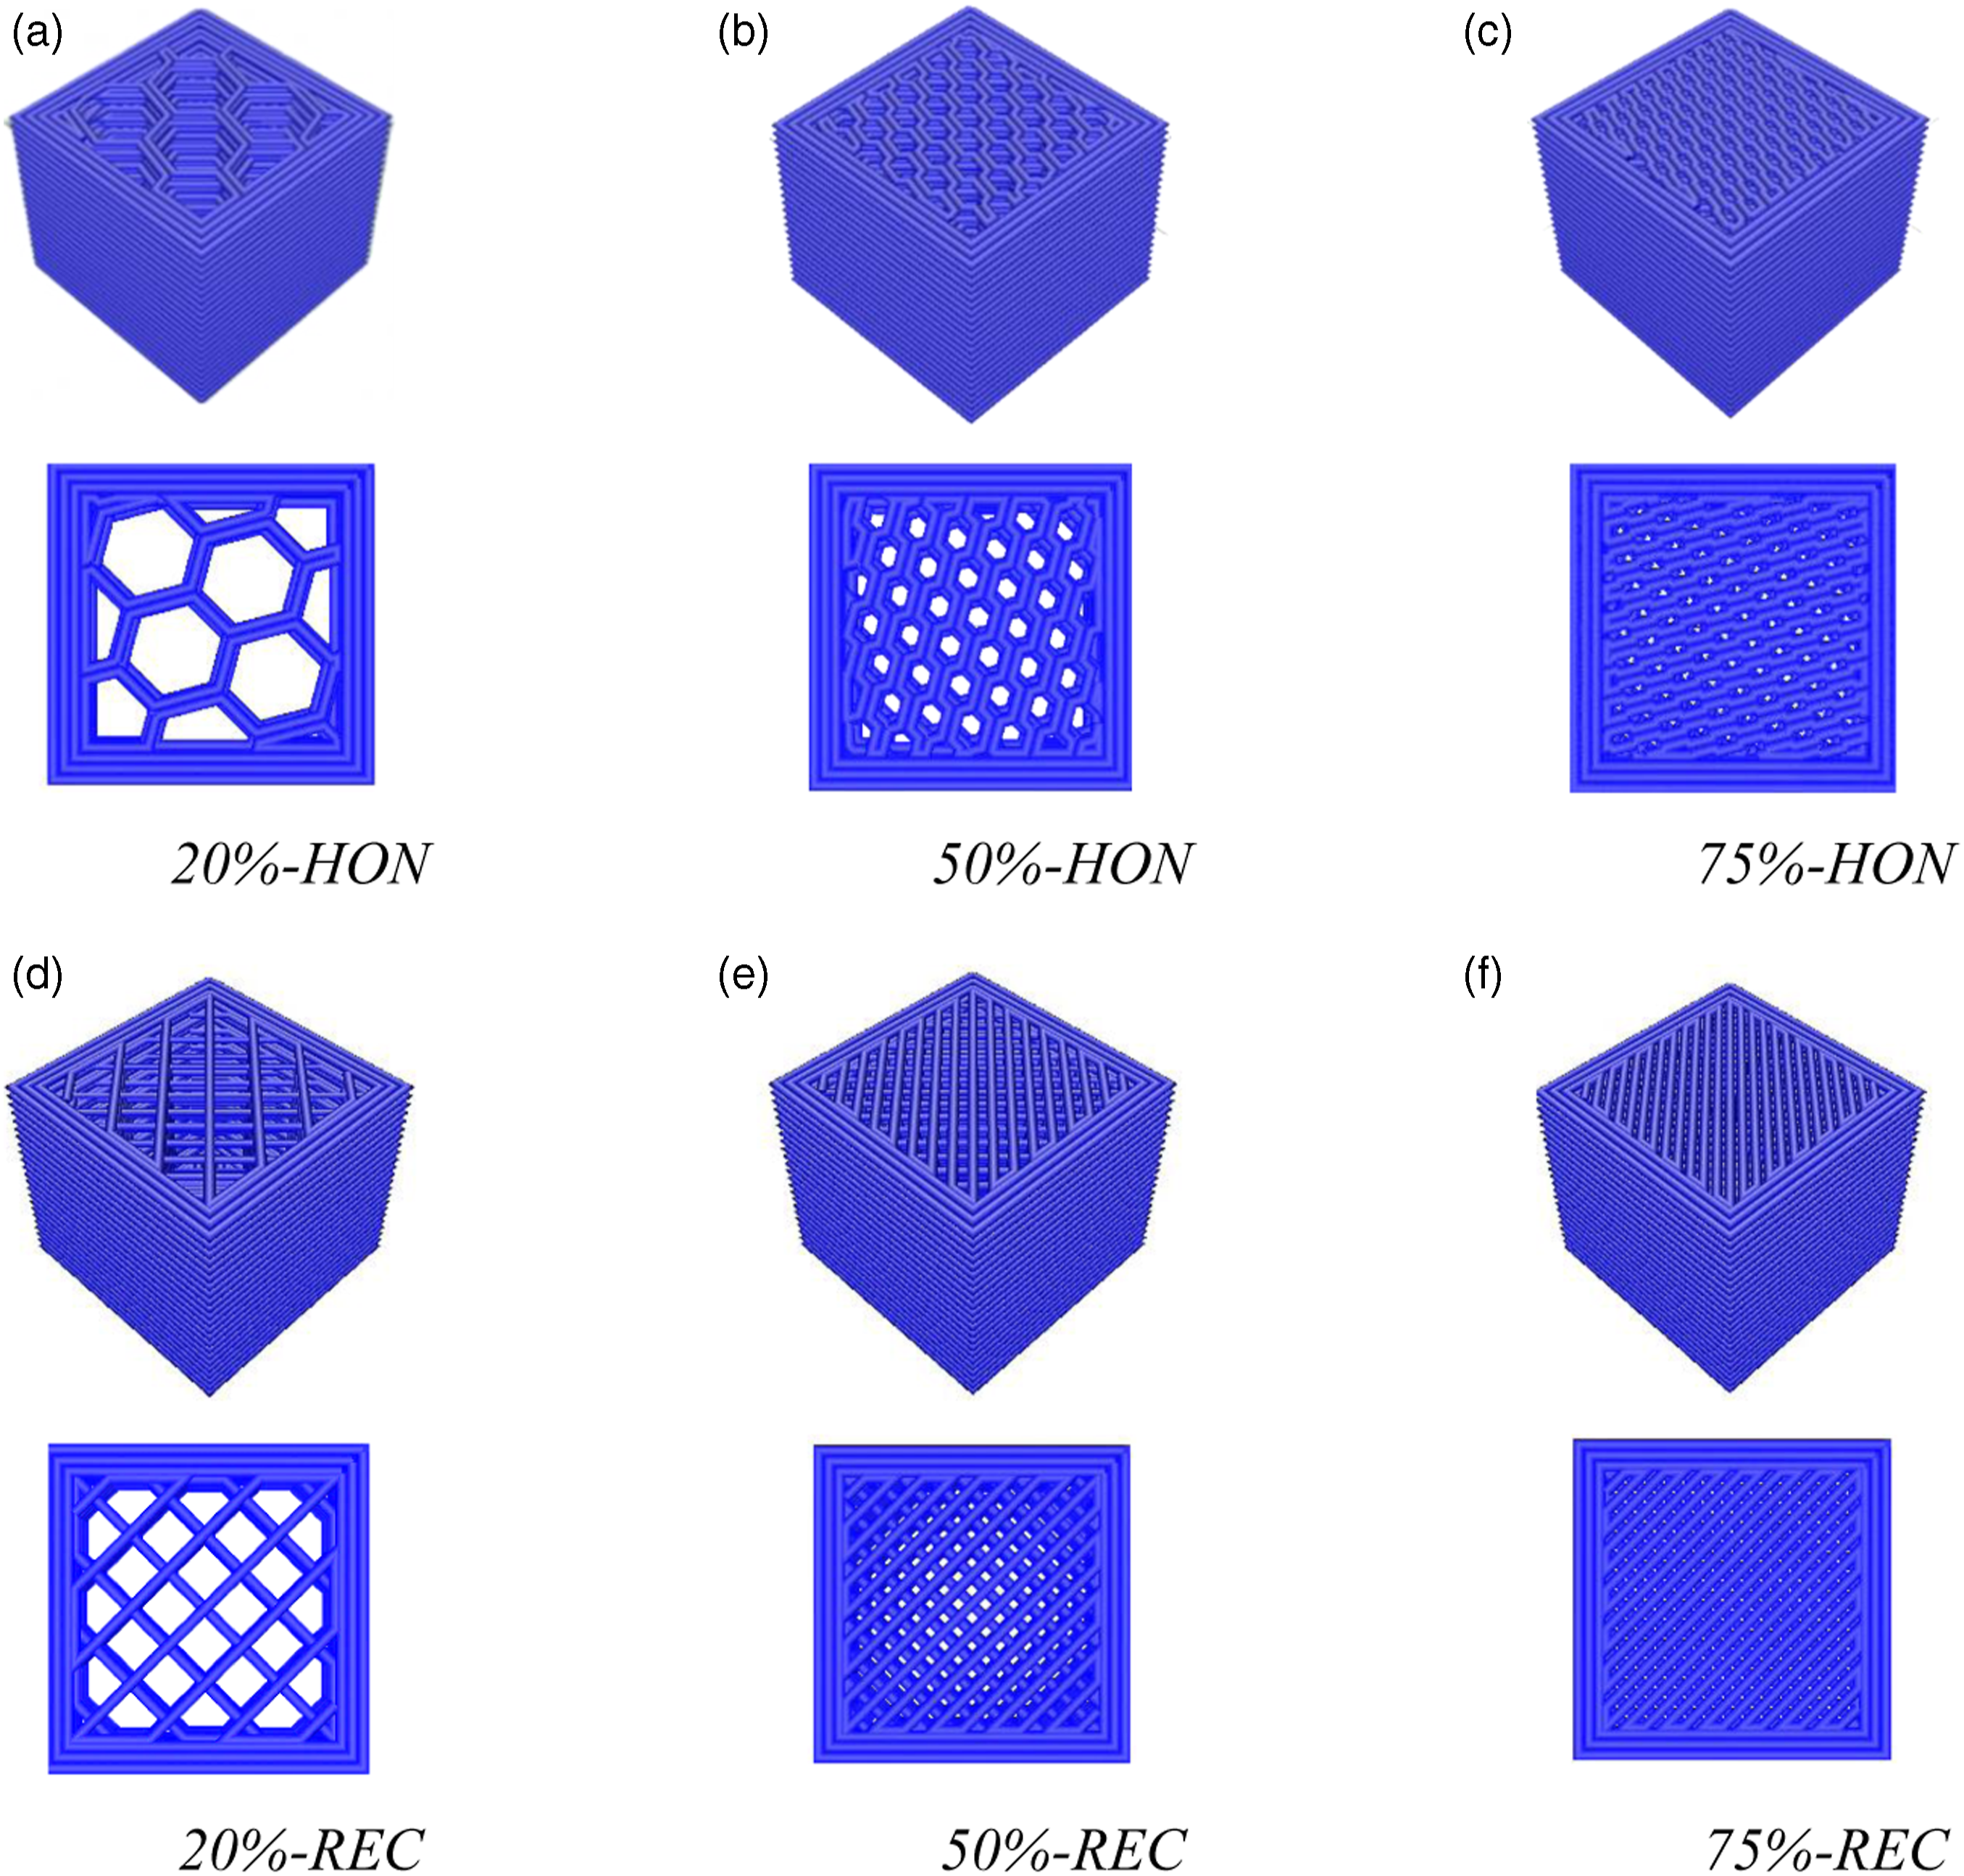
Results and discussion
Strain rate dependencies of mechanical properties
In order to assess dispersion and in compliance with the standard, a minimum of three CF-PETG cubic specimens of each infill density (20%, 50%, and 75%) and for both patterns, that is, honeycomb and rectilinear, were tested under each impact pressure of 1.4, 1.7, 2, and 2.4 bar to ensure high accuracy and repeatability in their behavior.
Figure 4 depicts typical signals obtained for CF-PETG cubic samples subjected to dynamic loading, including incident, reflected and transmitted waves, with each combination of filling parameters considered as a variable, all tested at 1.7 bar. The experimental results reported at this applied pressure not only confirm the accuracy and reliability of the SHPB method for assessing the behavior of various 3D-printed composites at high strain rates but also establish the significant influence of striker bar velocity on wave amplitudes. Moreover, wave superposition reveals that the reflected and incident waves have almost similar amplitudes, while the transmitted wave is nearly negligible. The relatively similar amplitudes of the reflected and incident waves indicated minimal energy loss during the reflection process and controlled dissipation of dynamic stresses within the material. In addition, the low amplitude of the transmitted wave showed that the material exhibits a considerable potential to hinder the transmission of dynamic stresses. This indicates that the 3D-printed CF-PETG material effectively attenuates and absorbs these stresses during the dynamic compression testing. However, distinct behaviors can also be observed for 3D printed samples with varied infill densities and patterns. For example, when compared to other evaluated samples, samples with fill densities of 20% honeycomb, 20% rectilinear, and 50% rectilinear displayed a second peak in the reflected wave, coupled with a reduced magnitude in the transmitted signal, Figure 4(a), (b), (d). These observations suggest the presence of macro-damage in particular in these specimens.
36
On the other hand, tests on specimens with 50% and 75% honeycomb and 75% rectilinear filling patterns revealed an elastic-plastic behavior that became more pronounced with increasing filling densities, leading to the conclusion that the specimen had not been damaged, Figure 4(c), (e), (f). The differences in damage/failure behavior found between specimens of various densities may be technically explained by considering the relation between material density, structural integrity, and load-bearing ability. The internal structure of the material is less dense with a filling density of 20%, leaving more voids and weak points that are prone to concentrate stresses. As a result, severe damage and fracture become apparent, as illustrated by the second significant peak in Figure 4(a) and (b). The internal architecture becomes more compact as filling density increases up to 50%, minimizing the possibility of stress concentration and reducing the severity of damaged regions. Furthermore, the material displays elastic-plastic behavior without macrodamage at 75% fill density, indicating a more uniform stress distribution and enhanced ability to withstand dynamic loads. Test reproducibility of strain evolution versus time for different tested CF-PETG specimens, p = 1.7 bar.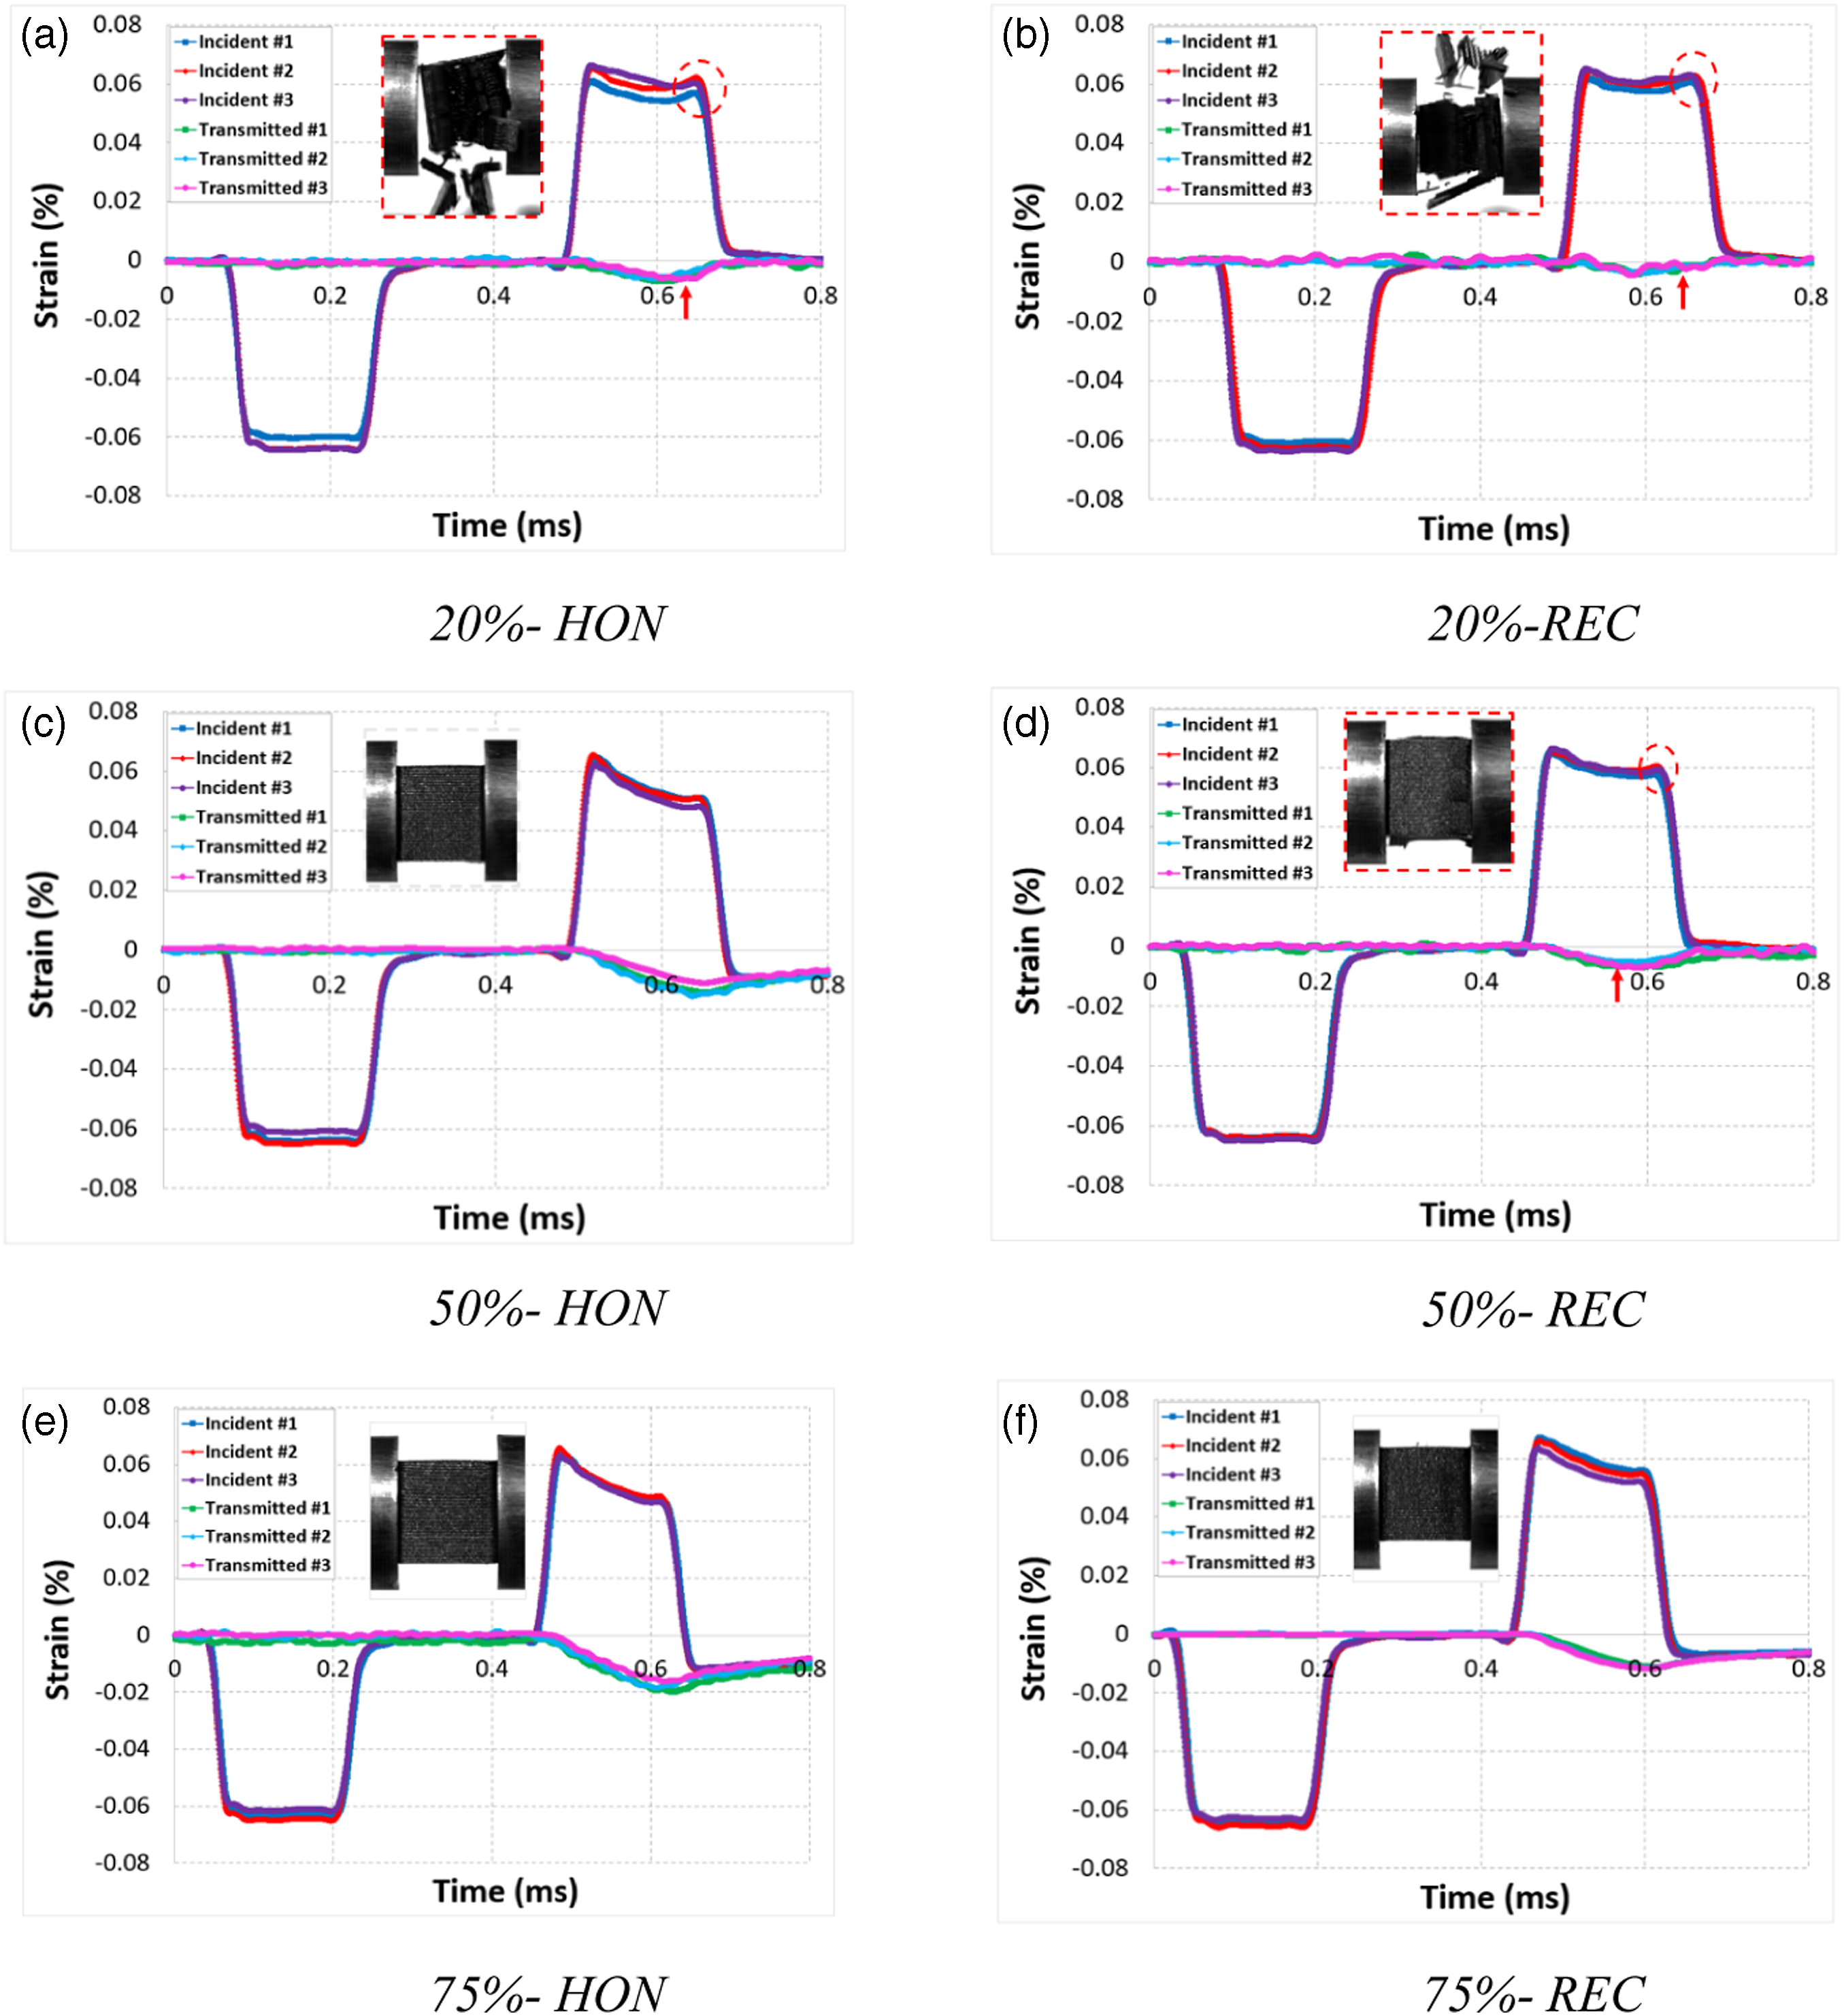
The dynamic compressive properties of the 3D-printed composite were also significantly influenced by variation in the filling pattern; it can be seen that the honeycomb pattern performed better than the rectilinear one in terms of resistance to macrodamage and permanent failure. This can be further clarified by evaluating the behavior of 3D-printed CF-PETG with 50% of both infill patterns subjected to the same loading conditions, Figure 4(c) and (d). Indeed, high-speed camera recordings revealed that, when subjected to 1.7 bar, the specimen with a rectilinear pattern showed macro-damage, while the one with a honeycomb pattern exhibited only elastic-plastic behavior, with no fractures or ruptures. The better behavior of a honeycomb design under dynamic loading can be explained by its specific geometrical advantages, including better energy dissipation and stress distribution, which reduces vulnerability to macro-damage. This proved that considering the infill pattern is essential when analyzing how effectively 3D printed materials perform when subjected to high strain rates.
The superposition of strain rate versus time curves corresponding to different tested 3D-printed CF-PETG samples and for each impact pressure (1.4; 1.7; 2; and 2.4 bar) is shown in Figure 5(a)-(d). The strain rate was found to be very sensitive to the impact pressure P, the filling pattern, and the filling density. Strain rate versus time for different 3D prints CF-PETG composites.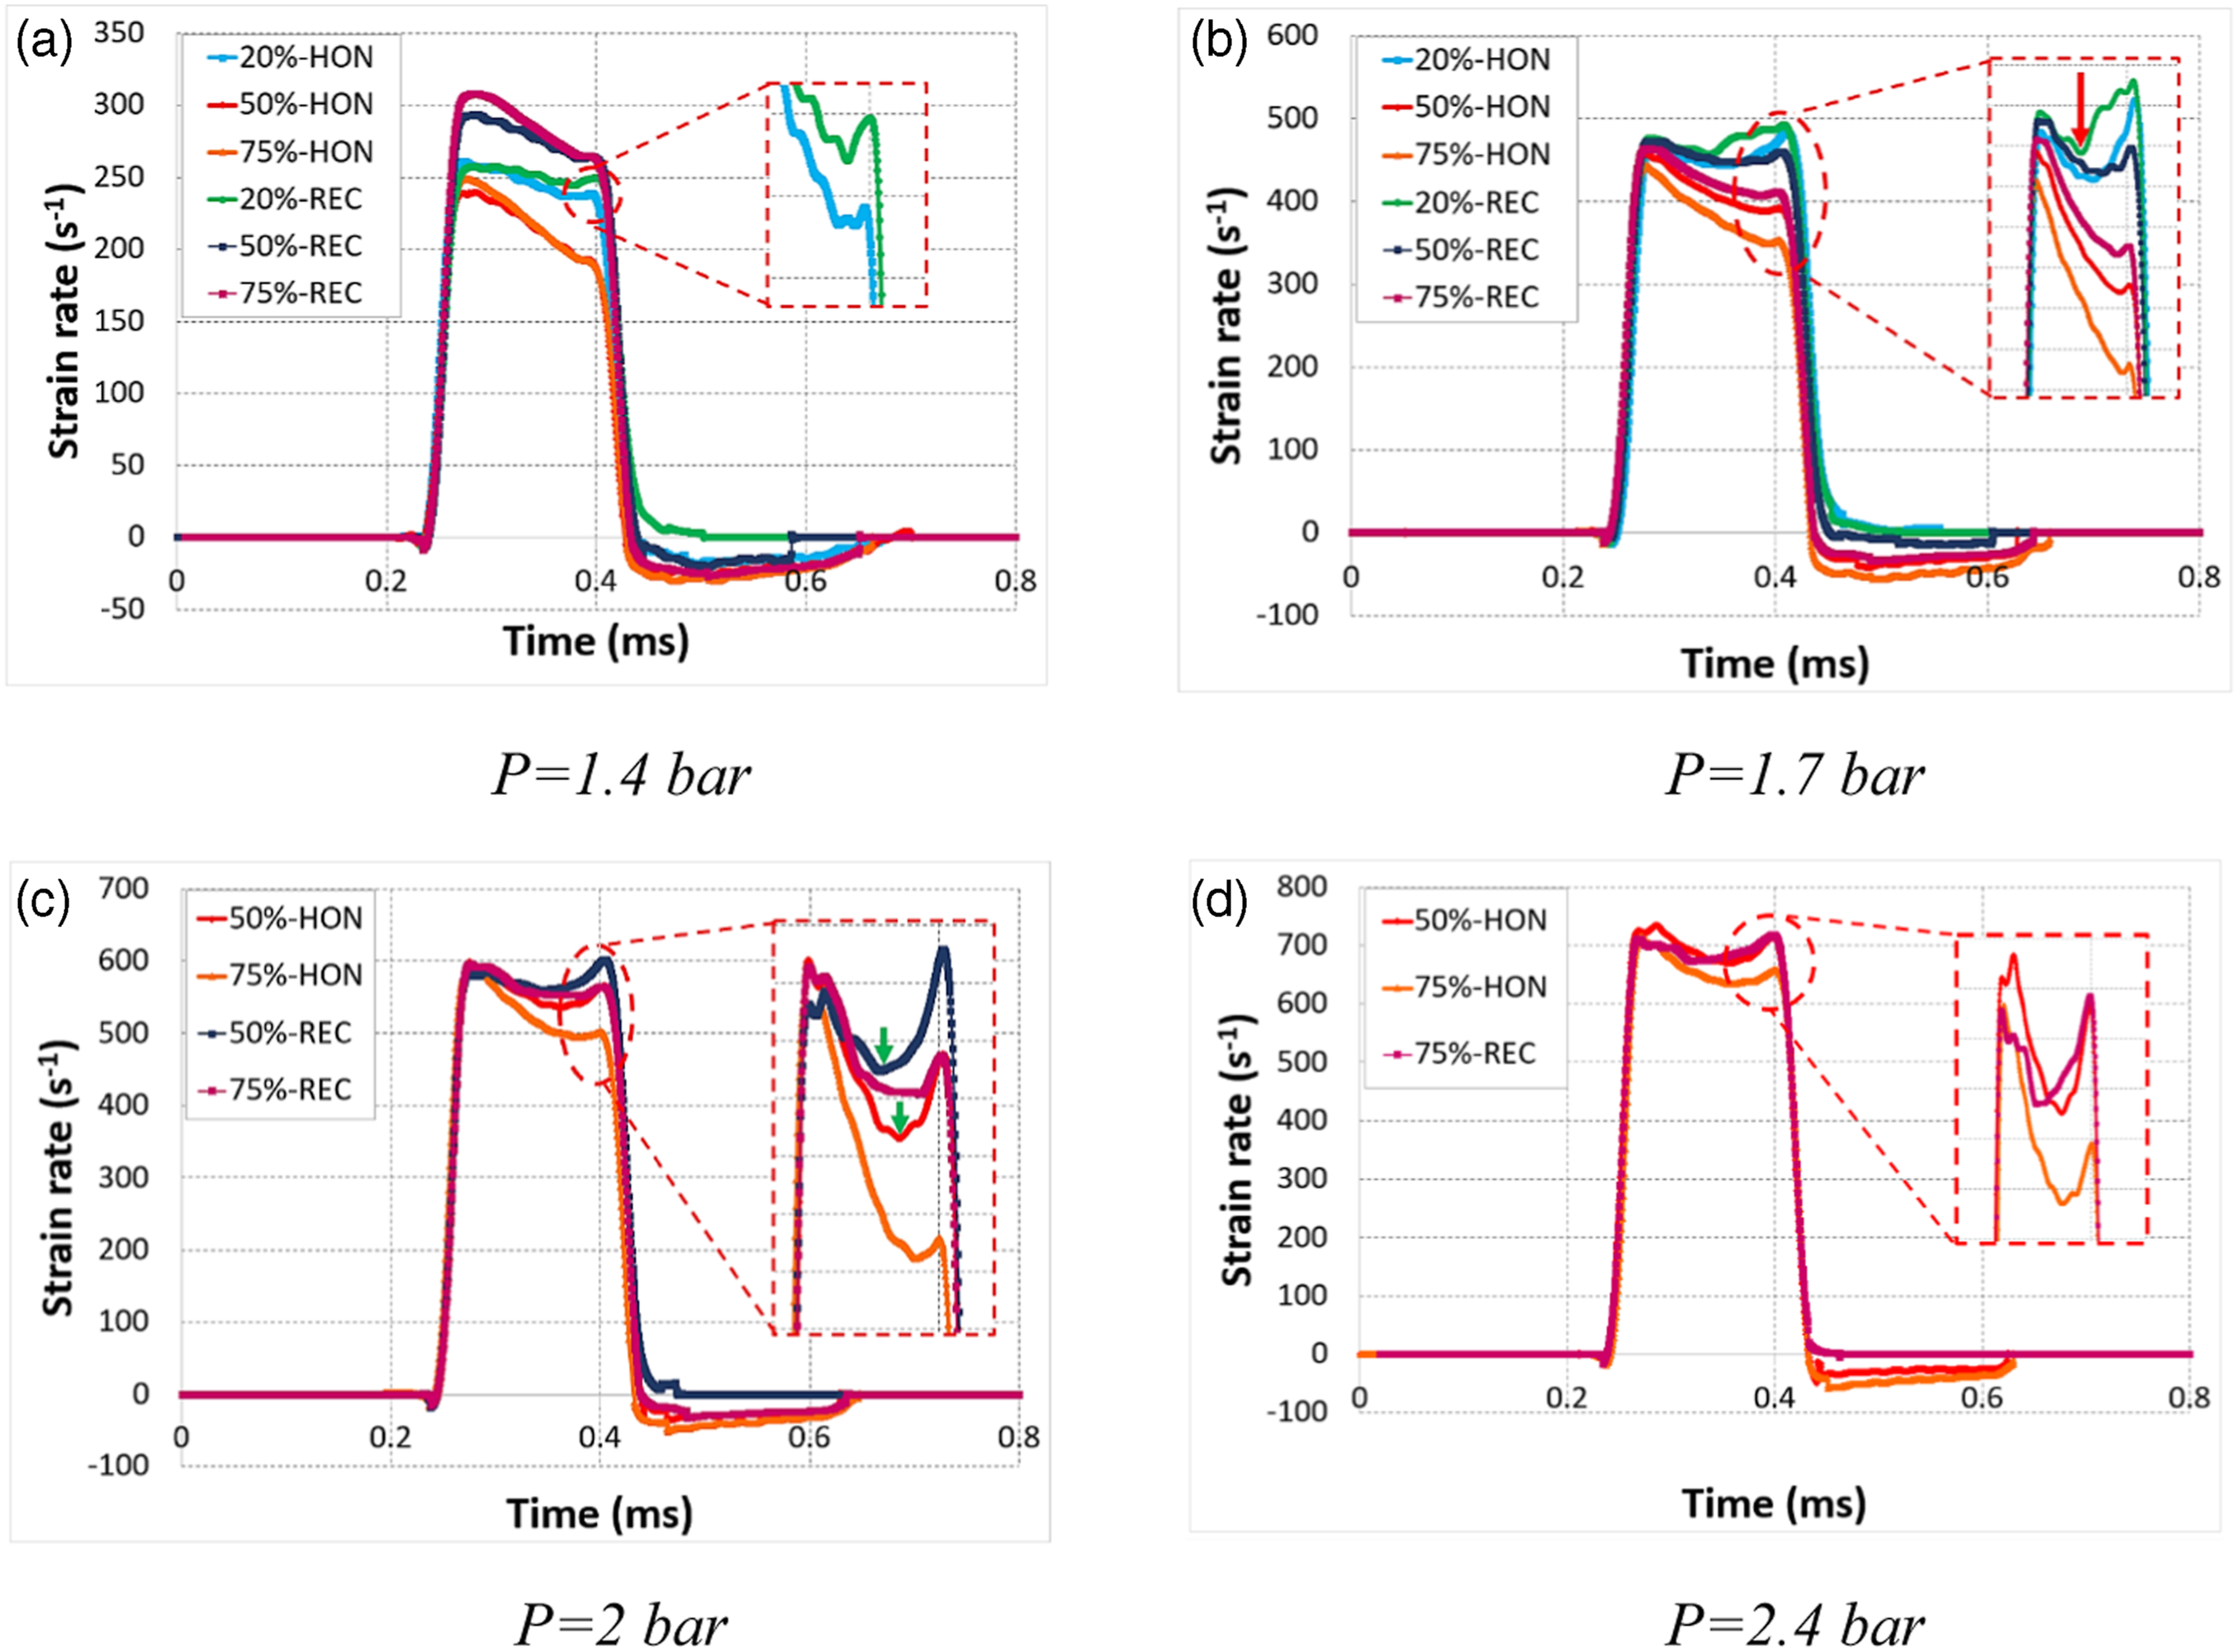
Although initially, it seemed that the different types of specimens were showing an overall similar response, it was observed that there was a notable difference in strain-time curves between the damaging and non-damaging tests. For instance, considering the example of different 3D specimens tested at 1.4 bar (Figure 5(a)). A detailed interpretation suggested that the observed strain rate behavior for both the 50% and 75% density samples is consistent with a plastic deformation, where the material exhibits both elastic and plastic phases without being damaged. The samples containing 50% and 75% density for both filling patterns showed a gradual increase in strain rate followed by a rapid decrease until achieving a negative value corresponding to spring back in the specimen which indicated energy dissipation and stress relaxation mechanisms within the material therefore, classified as confirming an elastic-plastic behavior without any permanent damage. Whereas, the 20% specimens demonstrated the existence of a second peak and strain rates tending towards zero values and were then categorized as macro-damaged or permanently failed. This revealed that as the infill percentage increased, dynamic characteristics such as strength and resistance to damage improved; for example, 75% infill percentage has the best damage resistance, followed by 50% infill percentage, and 20% infill density. This tendency can be explained by the increase in the specimen density and the heightening of bonding strength between the consecutive layers as a consequence of the reduction in the hollow structure, which can reinforce the material structure and minimize the risks of deformation. 27
The comparative study of the infill patterns also demonstrated that the specimen with a honeycomb design exhibits better mechanical performance and impact resistance under dynamic load conditions when compared to the rectilinear one, Figure 5. The critical impact pressure (Pc) at which the 50%-REC samples showed the presence of macro-damage was 1.7 bar, while the 50%-HON samples showed the appearance of initial damage when subjected to a higher pressure (2 bar), Figure 5(b) and (c). On the other hand, the 75%-REC samples showed the presence of a second peak, that is, macro-damage, at impact pressure of 2 bar, while the 75%-HON samples only displayed elastic-plastic deformation even under the highest strain rate (2.4 bar), Figure 5(c) and (d). In addition, another interesting phenomenon can be considered by comparing the strain rate curves of the damaging tests for both patterns, namely the delayed beginning of the second peak and also the reduction of its area for honeycomb specimens (Figure 5(b)–(d)), which confirmed the delayed initiation of the permanent macro-damage as well as the less important failure, respectively. 46 The superior behavior of the honeycomb pattern can be attributed to the better performance of its hexagonal structure, which leads to better stress distribution, resulting in significantly higher impact resistance and energy absorption capacity than specimens with a rectilinear pattern, even though there was macro damage. 47
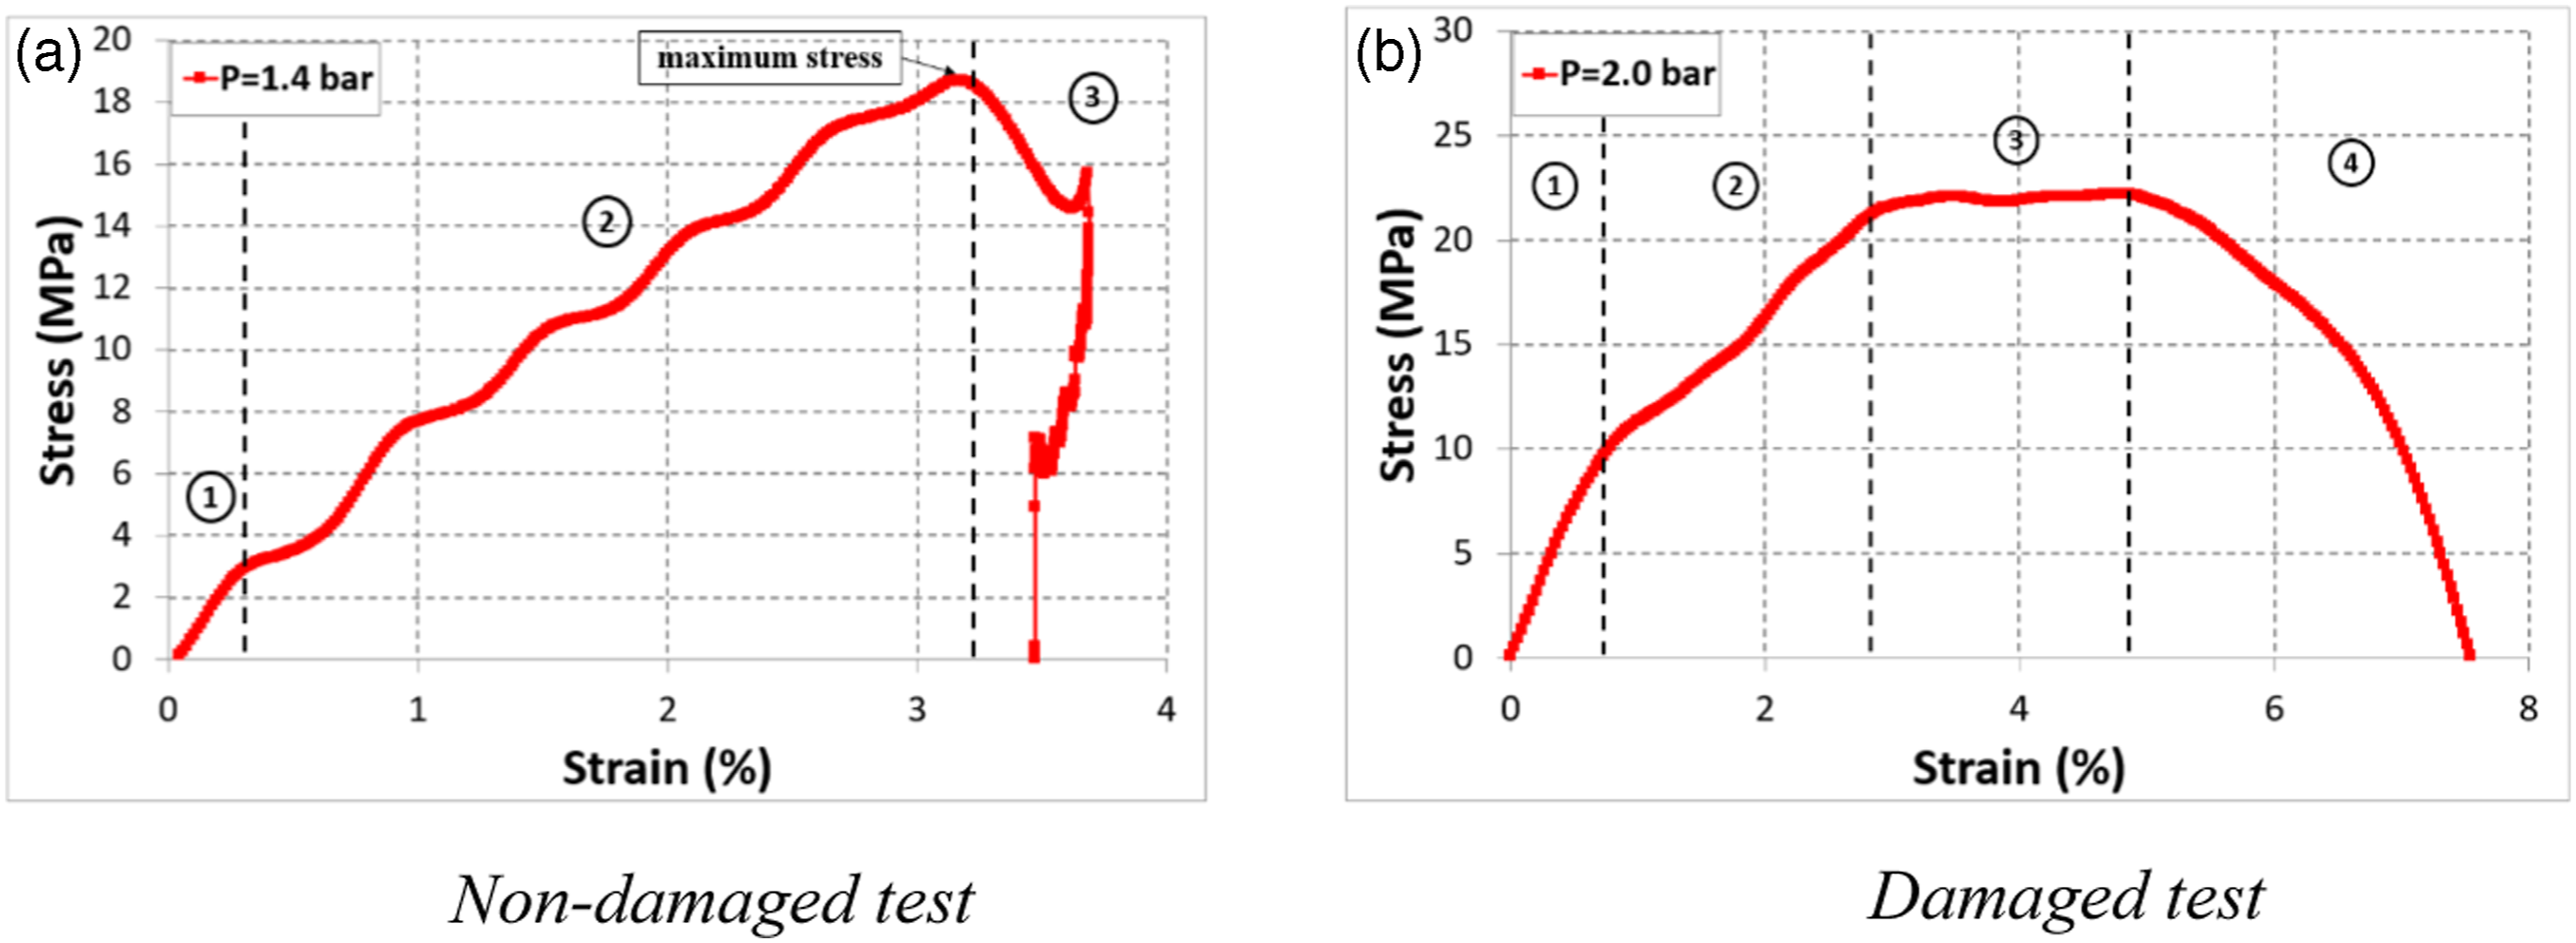
The stress-strain curves obtained at strain rates of 298 s−1 and 614 s−1, respectively, are shown in Figure 6(a)-(b). The strain rate was seen to have an important effect on the stress-strain response of the 3D-printed CF-PETG. The comparison of the curves for the tested samples revealed different behaviors with respect to strain rate. On the one hand, for non-damaged tests (1.4 bar), all stress-strain curves showed almost the same trend with only an elastic-plastic response. The stress-strain response was nearly linear at the beginning before becoming almost non-linear until the maximum stress was reached. Finally, the composite samples exhibited the unloading region, in which the impacted material showed a tendency to recover its initial state with a low plastic deformation, Figure 6(a). Nevertheless, for the damaged tests (2 bar), the dynamic compressive stress-strain behavior can be almost divided into four regions, Figure 6(b): • The elastic deformation region: where stress increases approximately linearly with strain. • The beginning of the plastic deformation region: where stress started to increase nonlinearly with strain and the slope of the curve decreased. • The plastic instability deformation zone: when the increase in stress slows down and almost begins to present a constant average value, the sample has entered the plastic instability deformation zone in which a local stress concentration occurs within the sample and it exhibits permanent deformation.
48
This region was more prominent in the case of rectilinear pattern, confirming that the presence and propagation of cracks were more significant. • The unloading region: when the stress begins to drop sharply due to the final failure of the specimen. A stress-strain curve example for (a) non-damaged and (b) damaged testing.
To better understand the strain rate influence on the mechanical characteristics of the CF-PETG composites, the stress-strain curves resulting from dynamic compressive testing at different impact pressures for different impacted 3D composites are depicted in Figure 7. It was clear that the compressive characteristics of the 3D-printed CF-PETG were very sensitive to the applied strain rate. It was found that by increasing the strain rate, the initial linear region of the curves became considerably more prominent and the stress gradually increased, demonstrating the rate-dependence as well as the stiffening properties, which may be related to the important applied stress and the larger energy consumption of a specimen under high strain rate load conditions.
49
Stress versus Strain for different infill densities and patterns subjected to different impact pressures.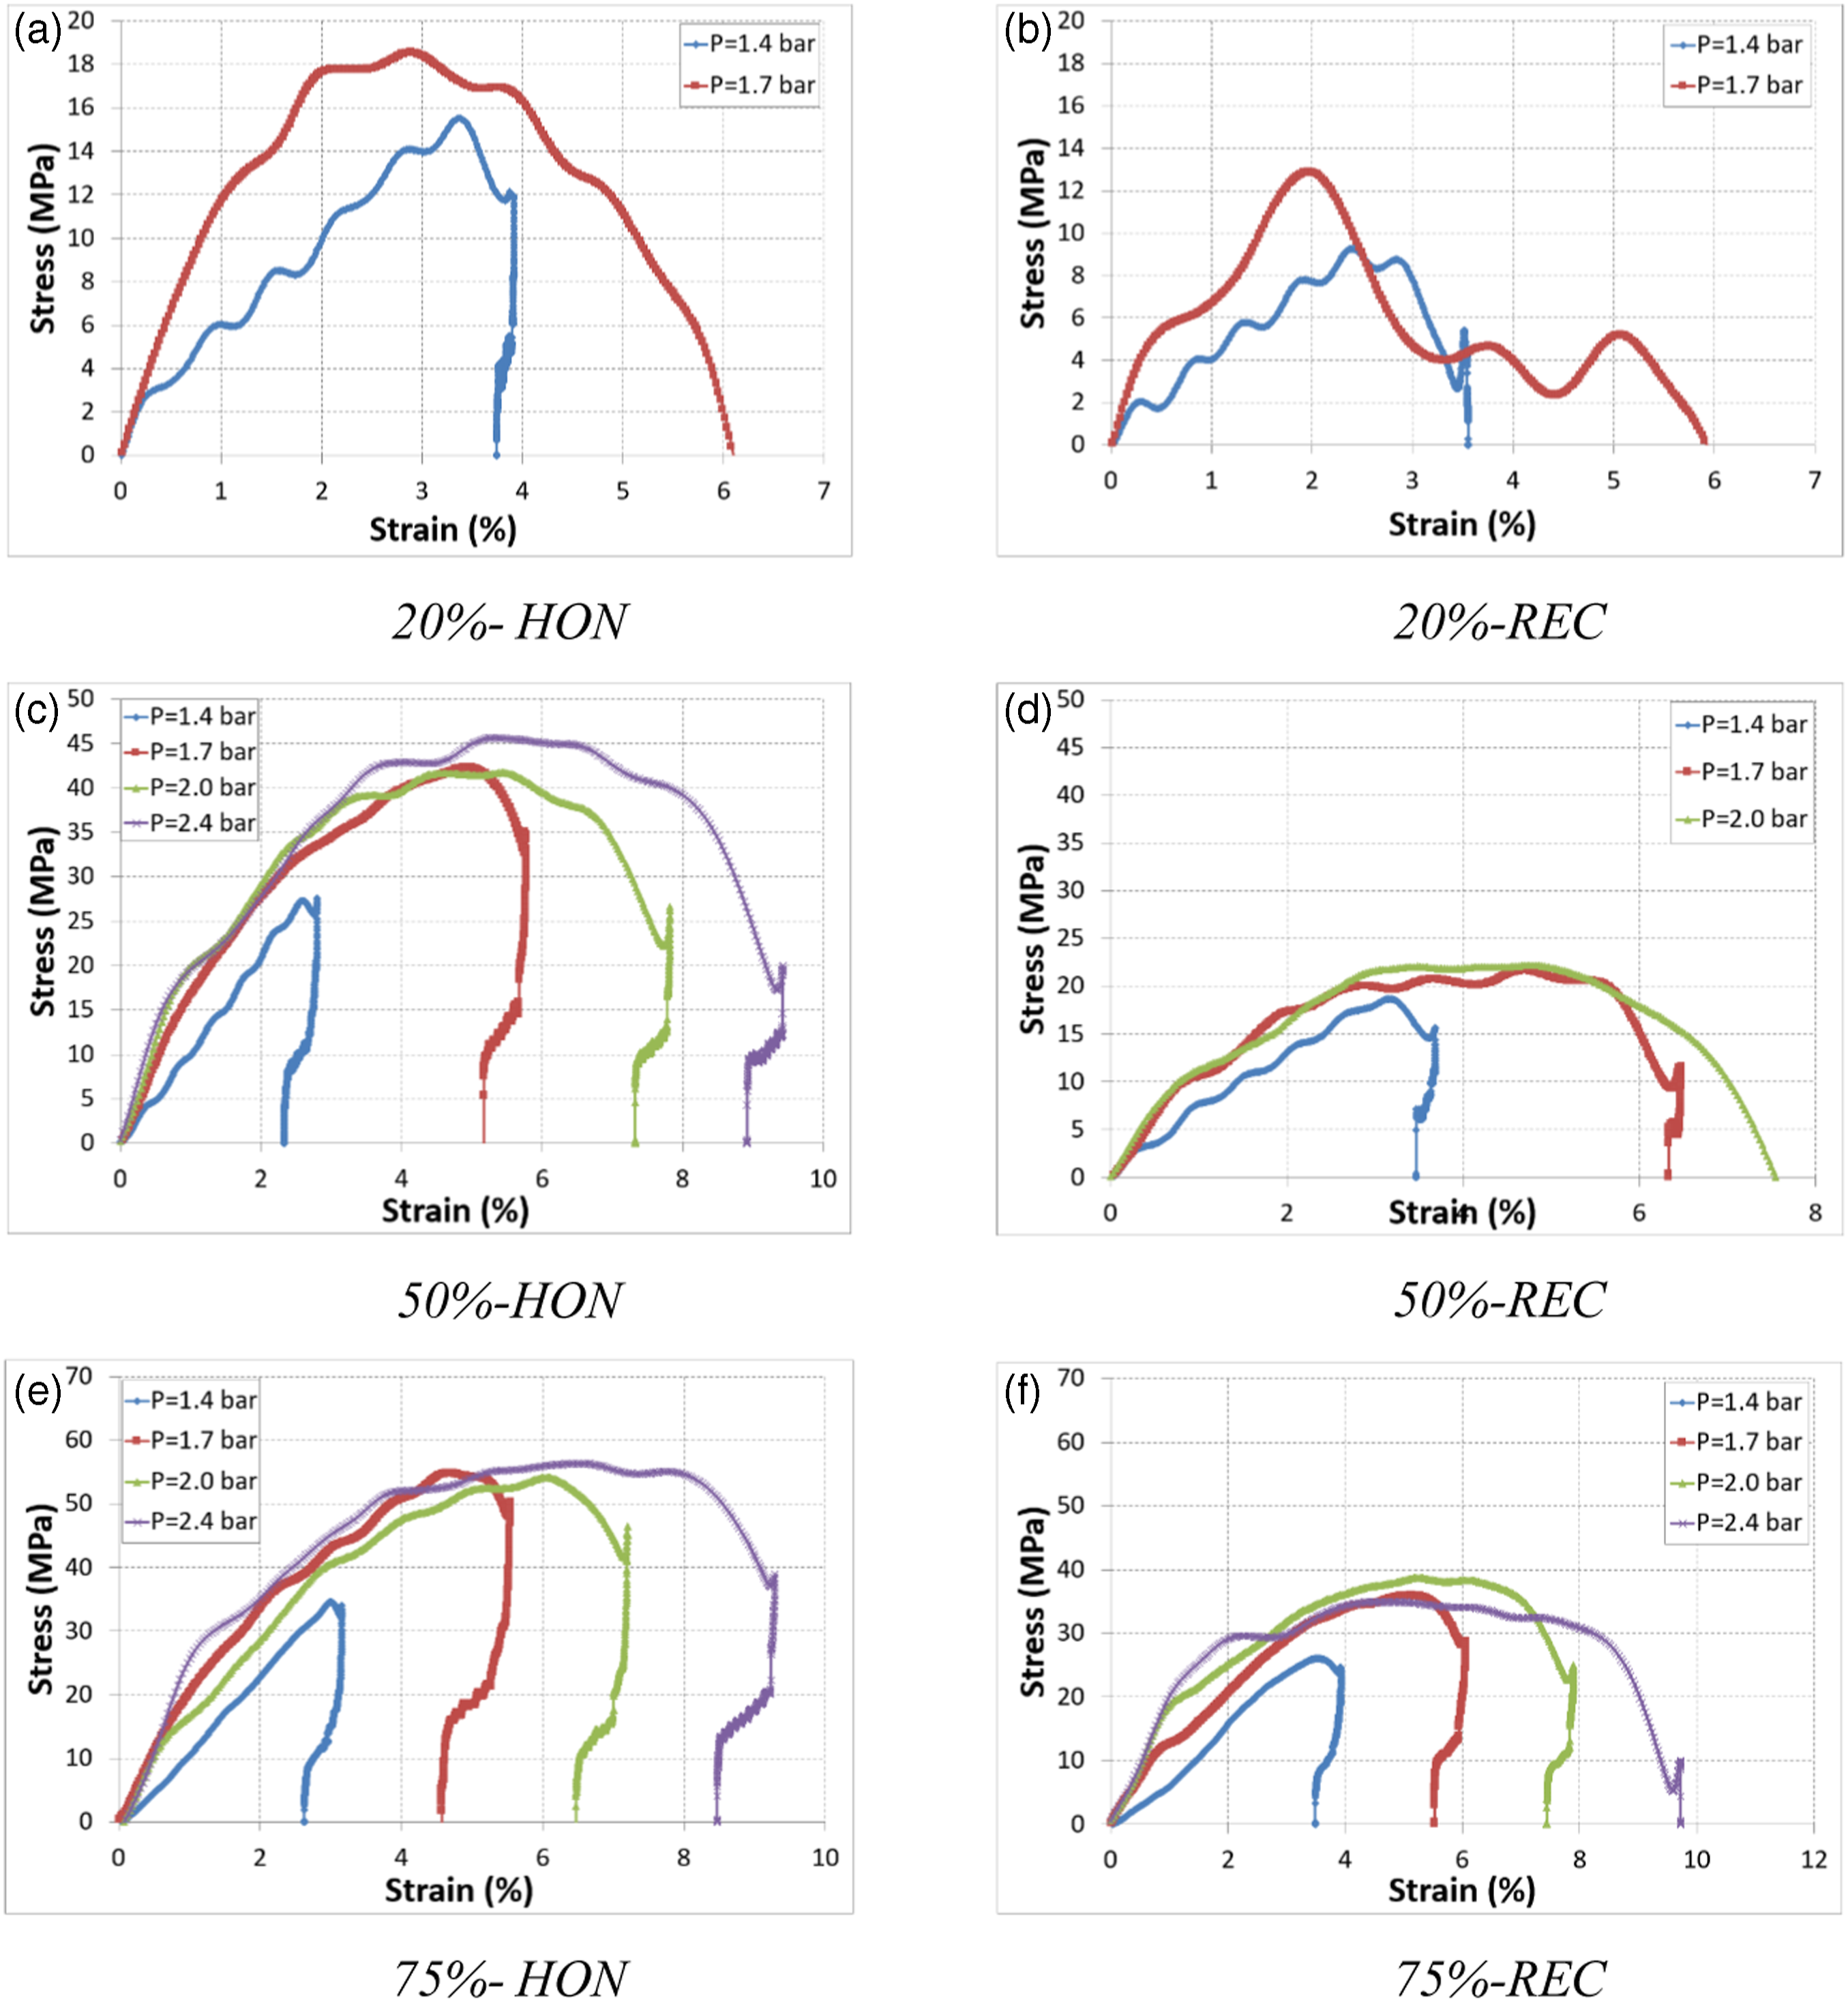
Furthermore, it can be noticed that the stress-strain behavior is strongly affected by the different 3D infill parameters. Regarding the influence of the different patterns, the honeycomb design demonstrated a better stress-strain behavior. A comparison of stress-strain curves revealed that the honeycomb model showed a steeper, more pronounced linear elastic region, underlining its superior elasticity. It also showed a less pronounced plastic deformation region, suggesting a more controlled response of the material to high strain rates. This structure also exhibited a much higher maximum stress, reaching almost twice that obtained with the rectilinear pattern regardless of the pressure applied and density considered, underlining the material's superior overall strength. Conversely, the rectilinear pattern showed a more prominent plastic instability region, implying a higher susceptibility to the development and propagation of cracks, Figure 7.
In addition, increasing the fill density has enhanced the strength and stiffness of the tested specimens, irrespective of the filling pattern. Accordingly, by using higher filling densities, the stress-strain response of 3D printed CF-PETG materials under each pressure can be improved by enhancing elastic strain recovery and reducing plastic deformation (for non-damaged tests), Figure 7(c)–(e) or by attenuating the macro-damage (damaged tests), Figure 7(d)–(f).
The results underline the crucial role of both filling pattern and density in determining the dynamic mechanical behavior of 3D-printed CF-PETG composites. Nevertheless, the results showed that, despite the influence of filler density, the pattern parameter proves to be the most important factor involved. The geometric arrangement of the filling structures has a very pronounced effect on the dynamic mechanical response of the 3D-printed sample, emphasizing the need for careful consideration of the choice of filling pattern to optimize material performance under dynamic loading conditions.
The experimental results were carefully examined to ascertain the influence of infill parameters (density and pattern) on the mechanical response of the 3D printed CF-PETG samples during dynamic compression tests. We were interested in the evolution of the ultimate strength (σm??) and the compressive modulus (E) obtained by considering and evaluating the elastic zone of the stress-strain curve of the respective test.
Both honeycomb and rectilinear patterns demonstrated an improvement in compressive strength with increasing fill density (Figure 8(a)). For example, the compressive strengths of honeycomb CF-PETG samples tested at 1.7 bar were 17.94 MPa, 44.89 MPa, and 55.07 MPa for the percentages of 20%, 50%, and 75%, respectively, while rectilinear CF-PETG specimens tested at the same pressure showed compressive strengths of 13.04 MPa, 21.68 MPa, and 35.85 MPa for fill densities of 20%, 50%, and 75%, respectively. Indeed, samples with lower fill densities exhibited a significant gap between printed lines and layers; the bond was not strong enough to withstand the higher compressive loads, resulting in a loss of compressive strength.
45
Higher percentages of infill density minimized gaps between 3D printed lines, so that each layer was strongly bonded to the next. As a result, the printed layers would be able to deform and absorb stresses before a break in the bonds between them occurred, which enhanced the compressive strength of the specimen.
50
However, comparison of the infill patterns showed that the 3D printed CF-PETG samples with a honeycomb infill pattern demonstrated a vastly higher mechanical strength at all percentages and impact pressures and that 75%-HON exhibited the best compressive strength, ranging from 35.5 to 56.16 MPa for impact pressures of 1.4 to 2.4 bar, respectively. This represents a substantial difference of 25 to 38% compared with the 75% rectilinear pattern, which showed values below 35 MPa. (a) Ultimate strength versus Infill density and Infill patterns for different impact pressures. (b) Compressive modulus versus Infill density and pattern for different impact pressures.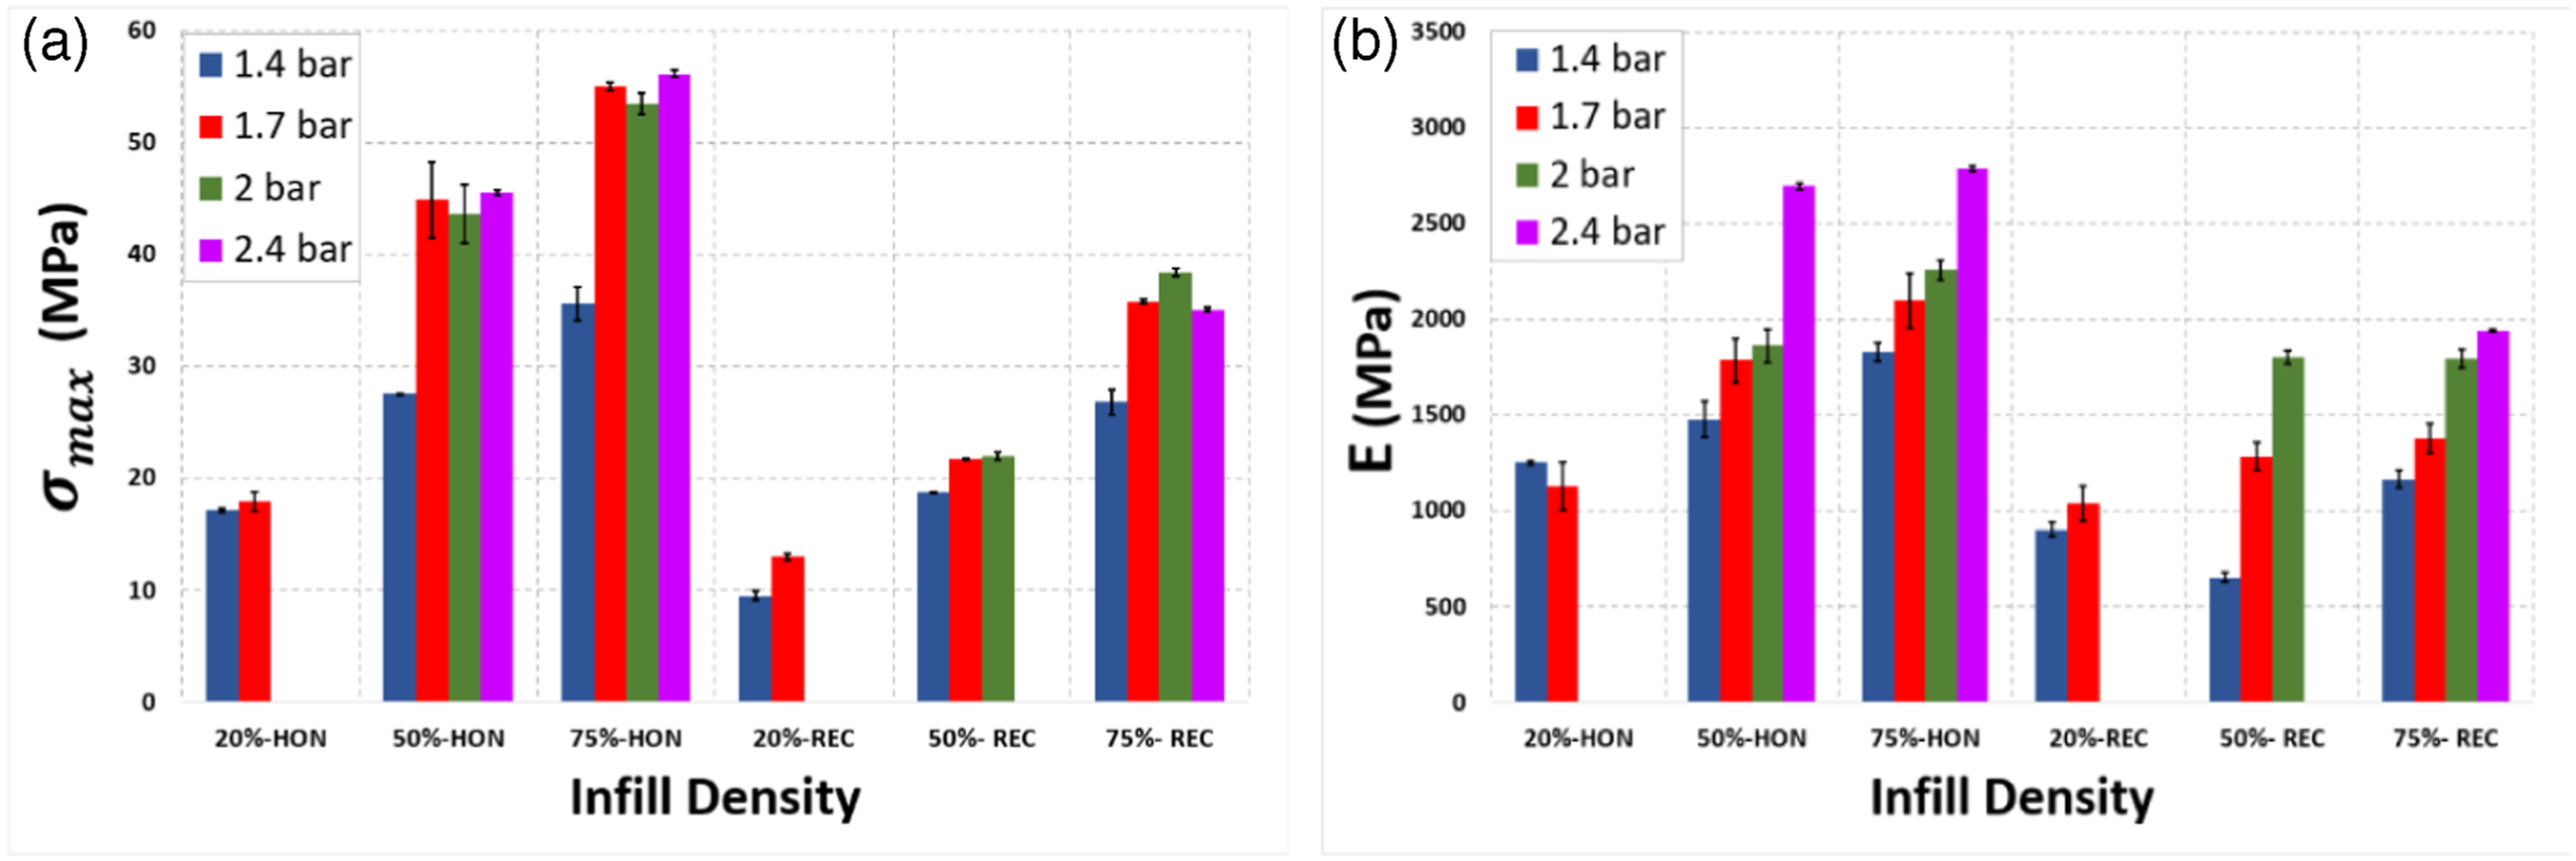
As for the variation in compressive modulus, Figure 8(b) shows that CF-PETG specimens with a honeycomb pattern showed an increase in compressive modulus as a function of filling density. The comparison revealed that between 20% and 75% infill density, a maximum of 46% increase in stiffness was observed. This tendency may be explained by the fact that, when the filling density has increased, the bonding between the layers will be strengthened with less hollow area and more filler material, resulting in improved stiffness and reduced deformation potential. Furthermore, 3D printed samples with a rectilinear pattern revealed an increase in compressive modulus proportional to fill density. For example, when the fill percentage varied from 20% to 75%, the compressive modulus increased by 22.5% and 24.5% for pressures of 1.4 and 1.7 bar respectively.
Honeycomb and rectilinear infill both display anisotropic mechanical behavior, but this anisotropic nature can manifest differently depending on the complex geometry of the printed object when printing complex shapes. The orientation and arrangement of fill patterns in complex structures are likely to interact with the overall shape, which can lead to variations in mechanical performance by varying the fill pattern. For example, it can be noted that an exceptional increase in modulus was observed when the honeycomb fill pattern was used at all fill densities and impact pressures. The combination of a honeycomb pattern with 75% fill showed the highest compressive modulus value, reaching 2787.8 MPa, whereas this value remained below 2000 MPa for the rectilinear pattern at the same fill density. The hexagonal walls of a honeycomb structure have six walls and a complex arrangement, which offers better resistance to impact loading due to good stress distribution, whereas in a rectilinear structure, a simple linear arrangement of adjacent walls is used, which could lead to bending of the walls at higher impact loads. It is therefore essential to understand the behavior of infill patterns in various geometric configurations.
A thorough review of the literature has shown that, due to the scarcity of reliable experimental data, no empirical models characterizing the impact of strain rate on the dynamic properties of 3D printed composites have been presented. Nevertheless, the effect of strain rate on the mechanical parameters of composites51–54 and nanocomposites55,56 when subjected to dynamic load conditions had recently been proposed. As a result, empirical laws defining the the sensitivity to high strain rates of the mechanical characteristics of the 3D printed CF-PETG were established in this work. However, for impact pressures of 1.4 and 1.7 bar, samples with 20% infill density for both honeycomb and rectilinear patterns demonstrated dynamic failure, and the same phenomenon was observed for 50%-REC subjected to 2 bar. This means that above these impact pressures, these samples will fail to resist and absorb the kinetic energy. Therofore, these percentages were not selected to establish empirical laws, as sufficient experimental data is required to obtain reliable results. Consequently, empirical models will be established using only the results of the 50% and 75% honeycomb (50%-HON and 75%-HON) and the 75% rectilinear (75%-REC).
Varying impact pressure or strain rate had a substantial effect on the dynamic compressive strength of 3D printed CF-PETG materials, Figure 9(a). The maximum stress increased proportionally with strain rate for the 50%-HON and 75%-HON samples, while a threshold effect was evidenced by the 75%-REC samples, where increasing strain rate resulted in an increase in dynamic compressive stress up to a maximum value obtained at 587 s−1. Then, due to thermal softening generated by heat dissipation during plastic deformation and the appearance of the first damage modes, the trend was reversed.
57
This behavior can be attributed to the hollow structure of the hexagonal cells in the honeycomb pattern, which favors energy dissipation, whereas this phenomenon is absent in the case of the rectilinear pattern. (a) Maximum stress versus Strain rate, (c) Compressive modulus versus strain rate.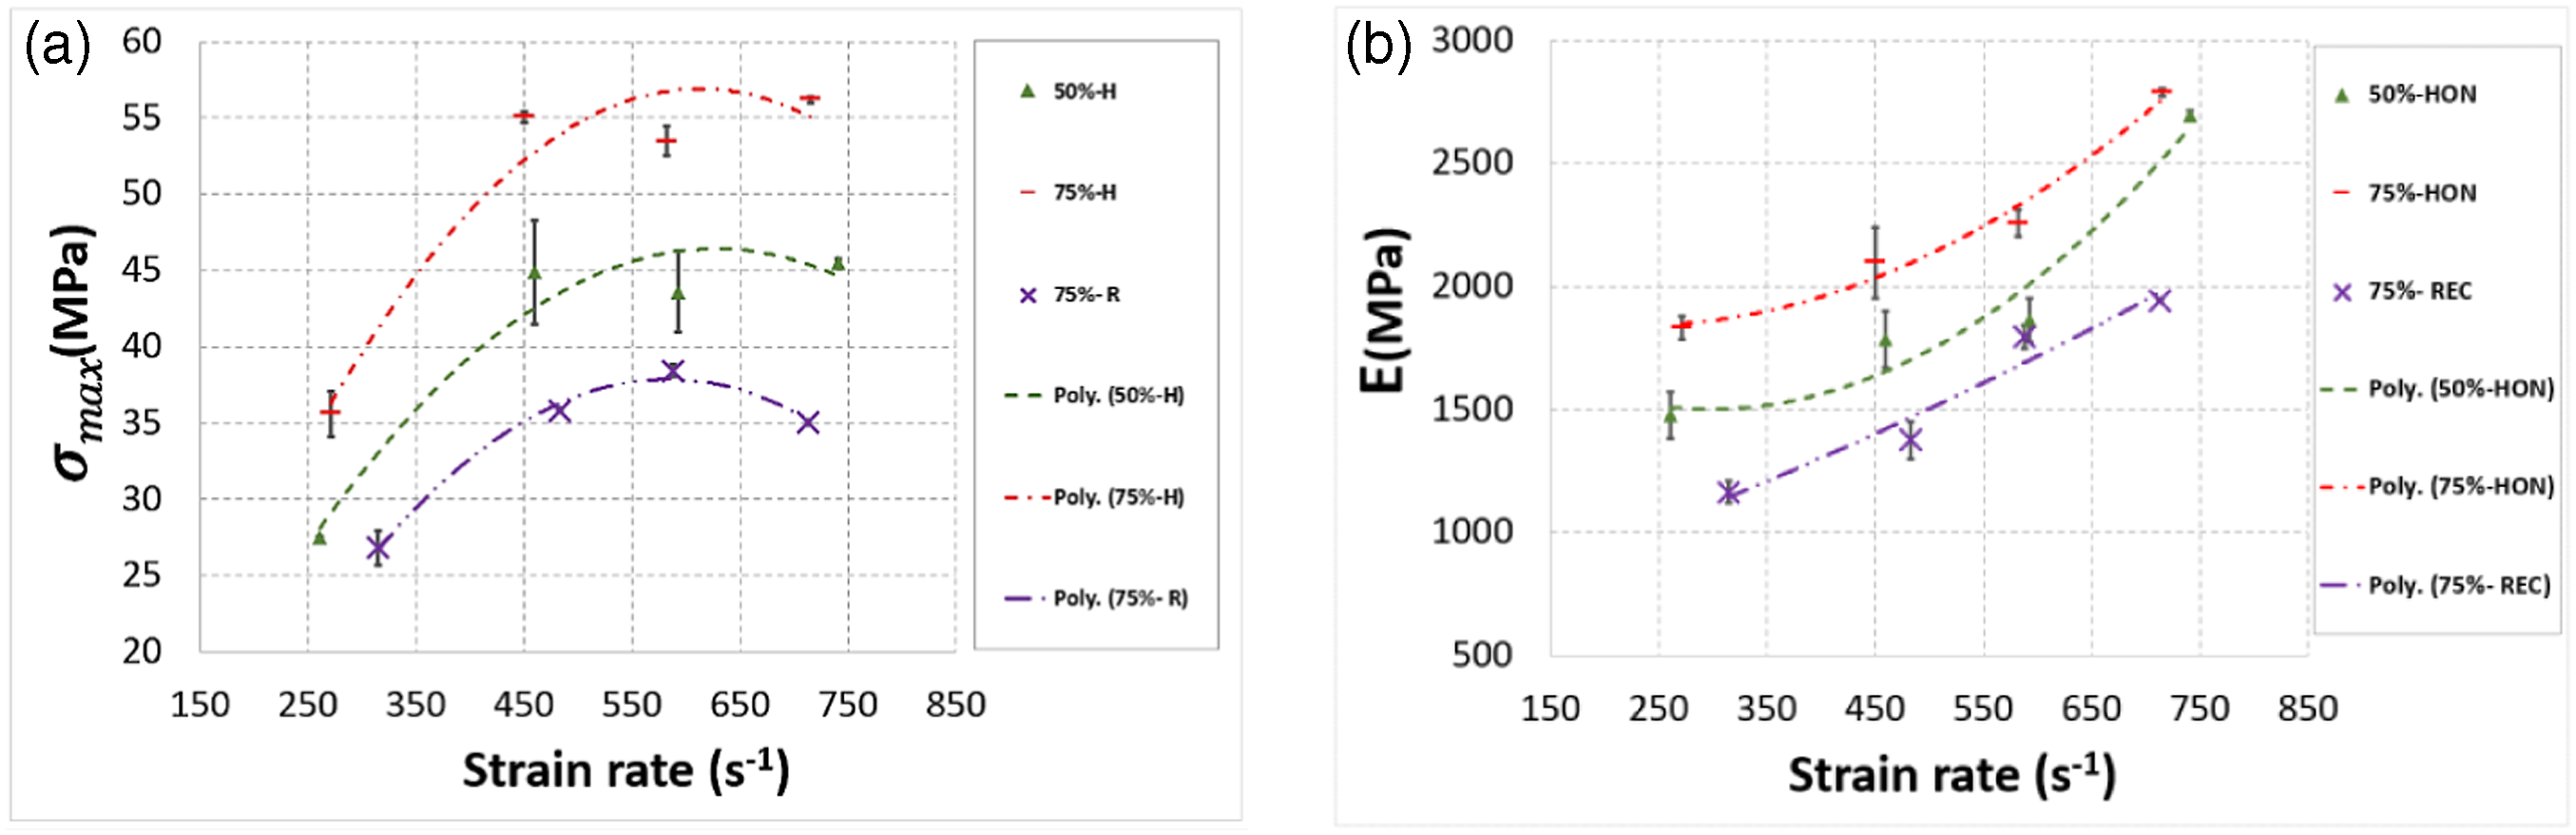
The corresponding empirical models resulting from fitting experimental data are listed hereafter:


Similarly, the dynamic compressive modulus of different 3D-printed composites was significantly affected by the variation in impact pressure or strain rate, Figure 9(b). The results clearly showed that two main trends were noted for the evolution of the compressive modulus during in-plane testing. First, both percentages of honeycomb infill patterns, that is, 50% and 75%, demonstrated a convex behavior starting with intrinsic and thermal strain softening, followed by strain hardening. 58 However, for the 75%-REC samples, the compressive modulus gradually increased with strain rate, revealing a hardening phenomenon up to values of 713 s−1.
The following polynomial empirical models were used to fit the compressive modulus data as a function of strain rate:


Kinetics of damage under dynamic compression
As damage resistance and failure tolerance are essential features for the use of composite materials in cutting-edge technological fields, considerable interest has been devoted to monitoring and studying the damage behavior of composite components. As a result, on the basis of images captured by a fast camera during each test, the deformation, failure mechanisms, and damage kinetics seen during in-plane dynamic compression testing of 3D-printed CF-PETG composites will be examined in further detail in this part.
In order to highlight the final state of the specimen after dynamic loading (elastic response, plastic deformation, or macro damage), Figures 10(a)-(c) and 11(a)-(c) present the fast camera photos for samples with 20%, 50% and 75% fill density for both honeycomb and rectilinear patterns, respectively, evaluated at varied impact pressures. The high-speed camera photographs indicated that the 3D printed CF-PETG composite samples with 20% infill density for both infill patterns demonstrated macro damage and final fracture even at low impact pressures, that is, 1.4 and 1.7 bar, Figures 10(a) and 11(a). By increasing the infill density, the damage performance of the CF-PETG composite was improved, and 50%-REC, 50%-HON and, 75%-REC samples presented macro damage at an impact pressure of 2 bar, Figure 10(b) and Figure 11(b)-(c), while 75%-HON didn’t show macro damage at all used impact pressures, Figure 10(c). Images from high-speed camera of tests conducted at different impact pressures for different filling densities of the honeycomb pattern. Images from high-speed camera of tests conducted at different impact pressures for different filling densities of the rectilinear pattern.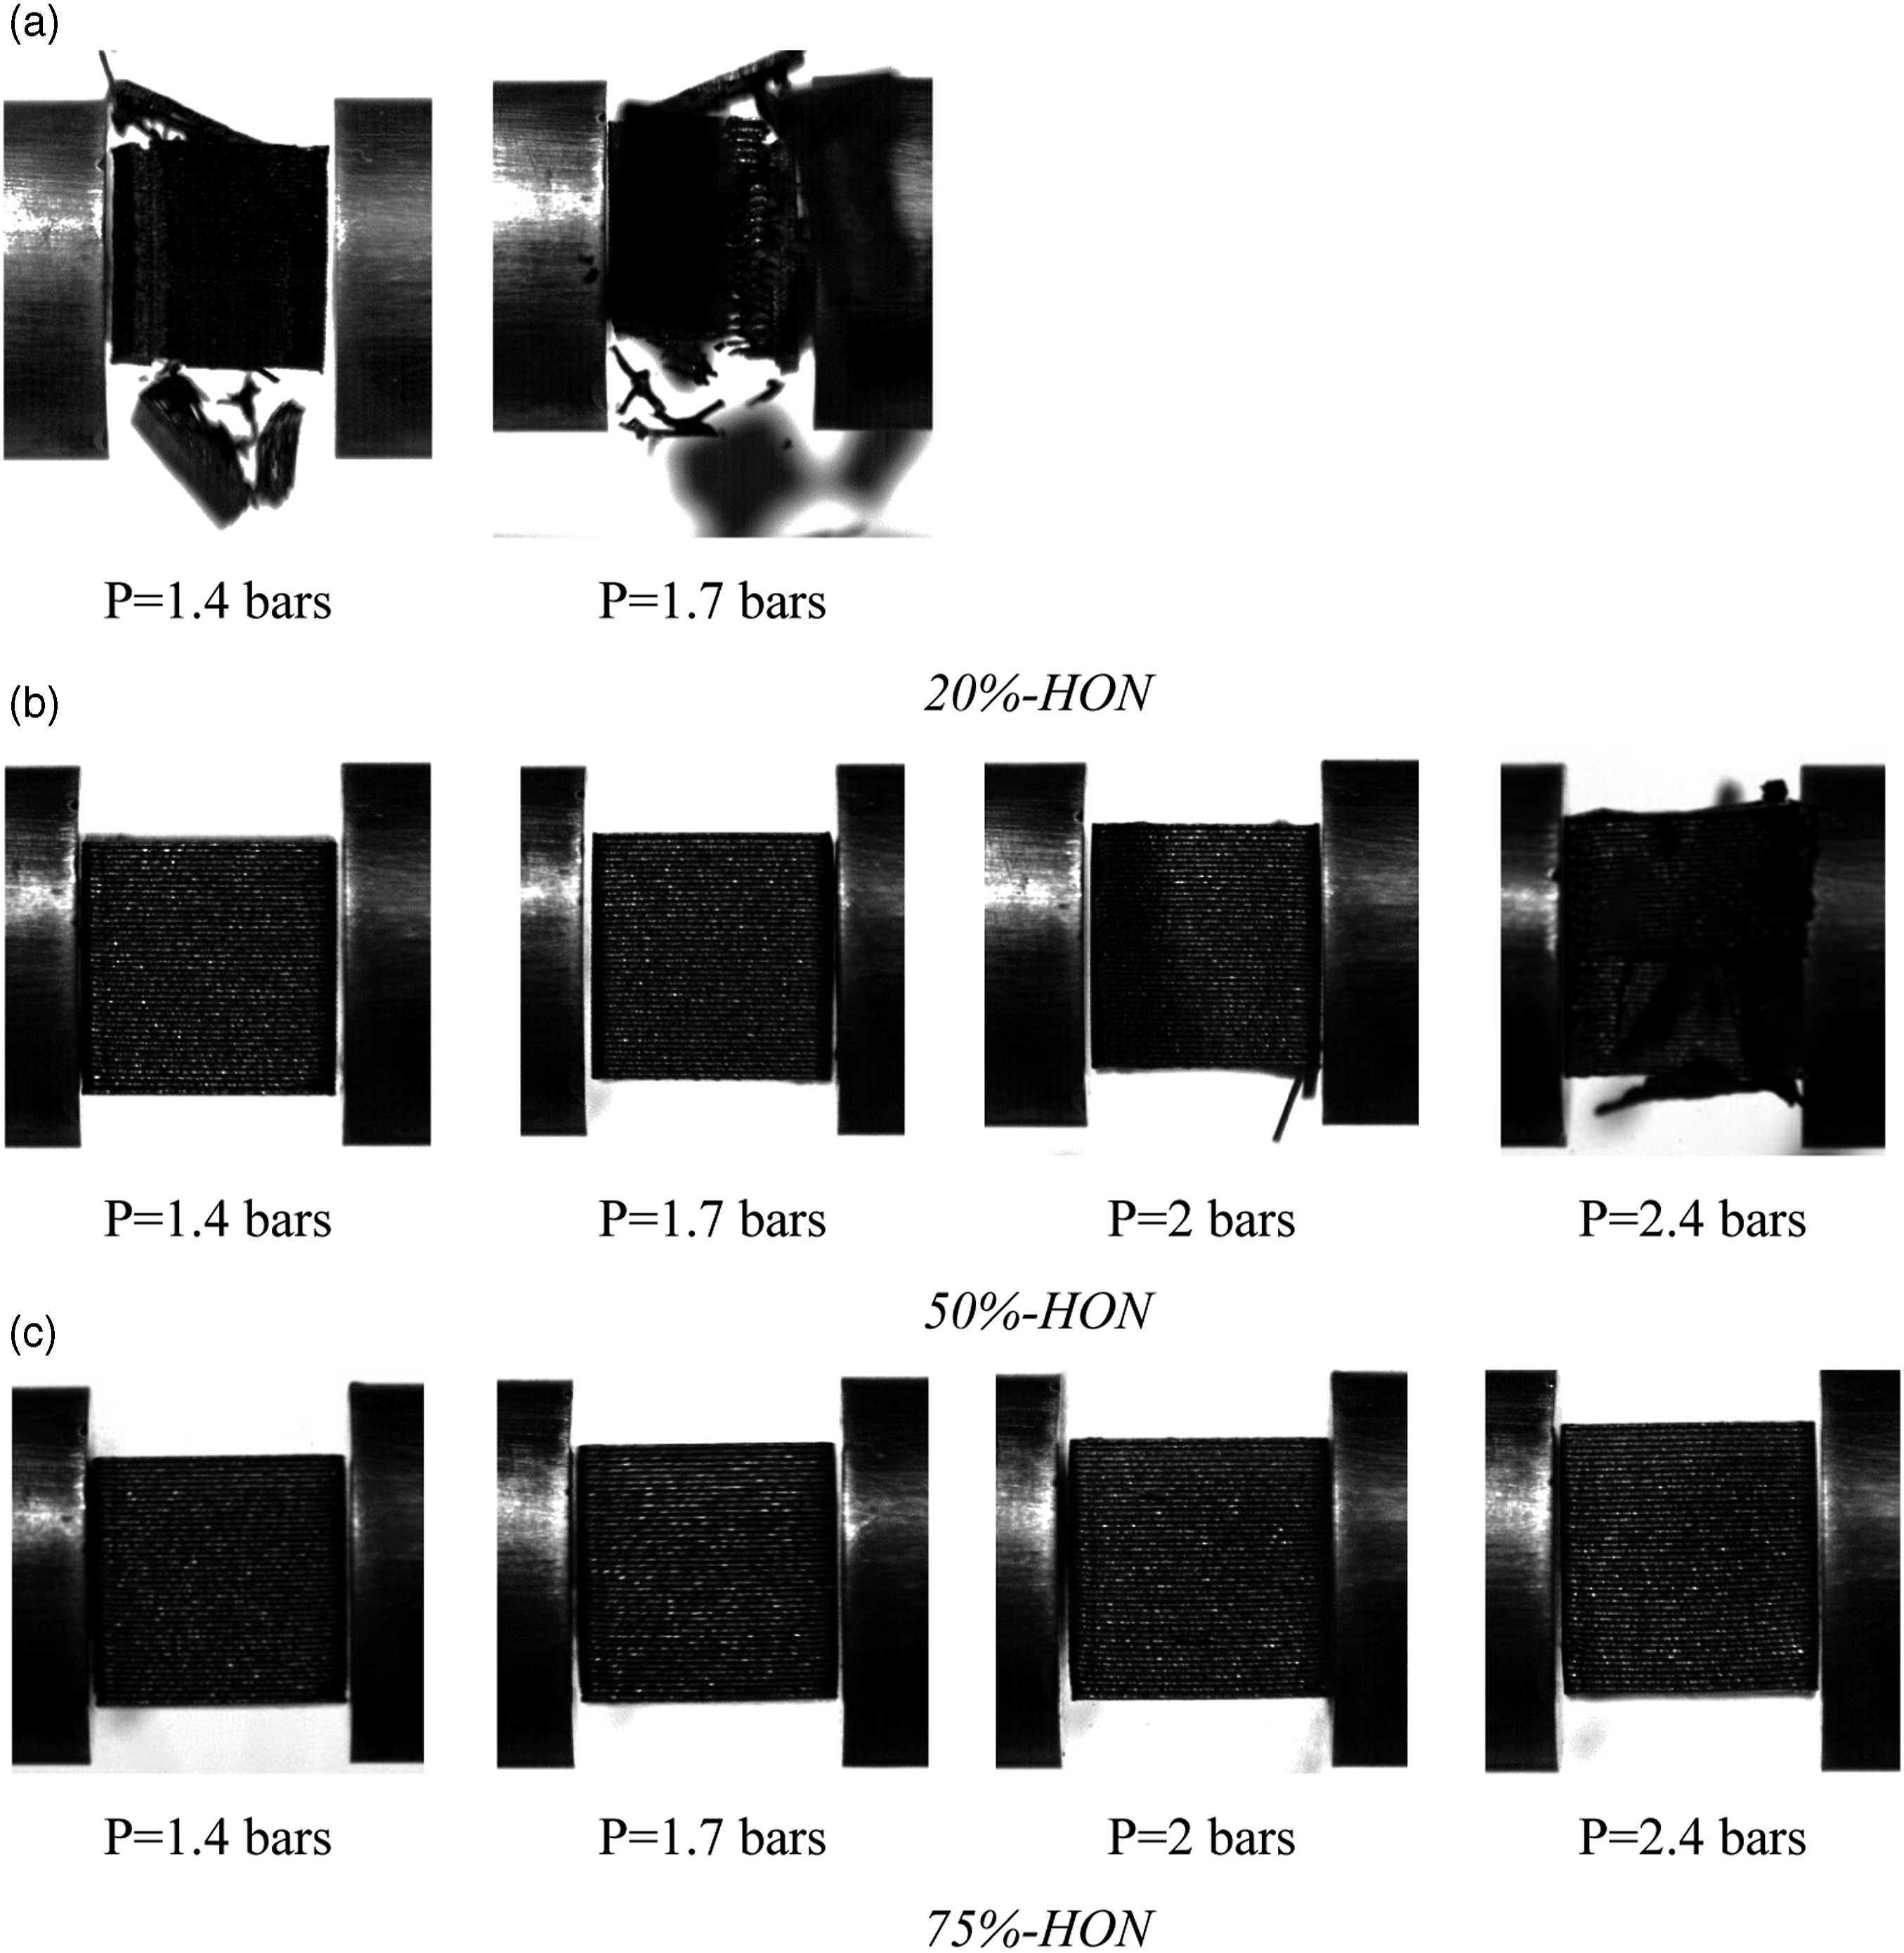
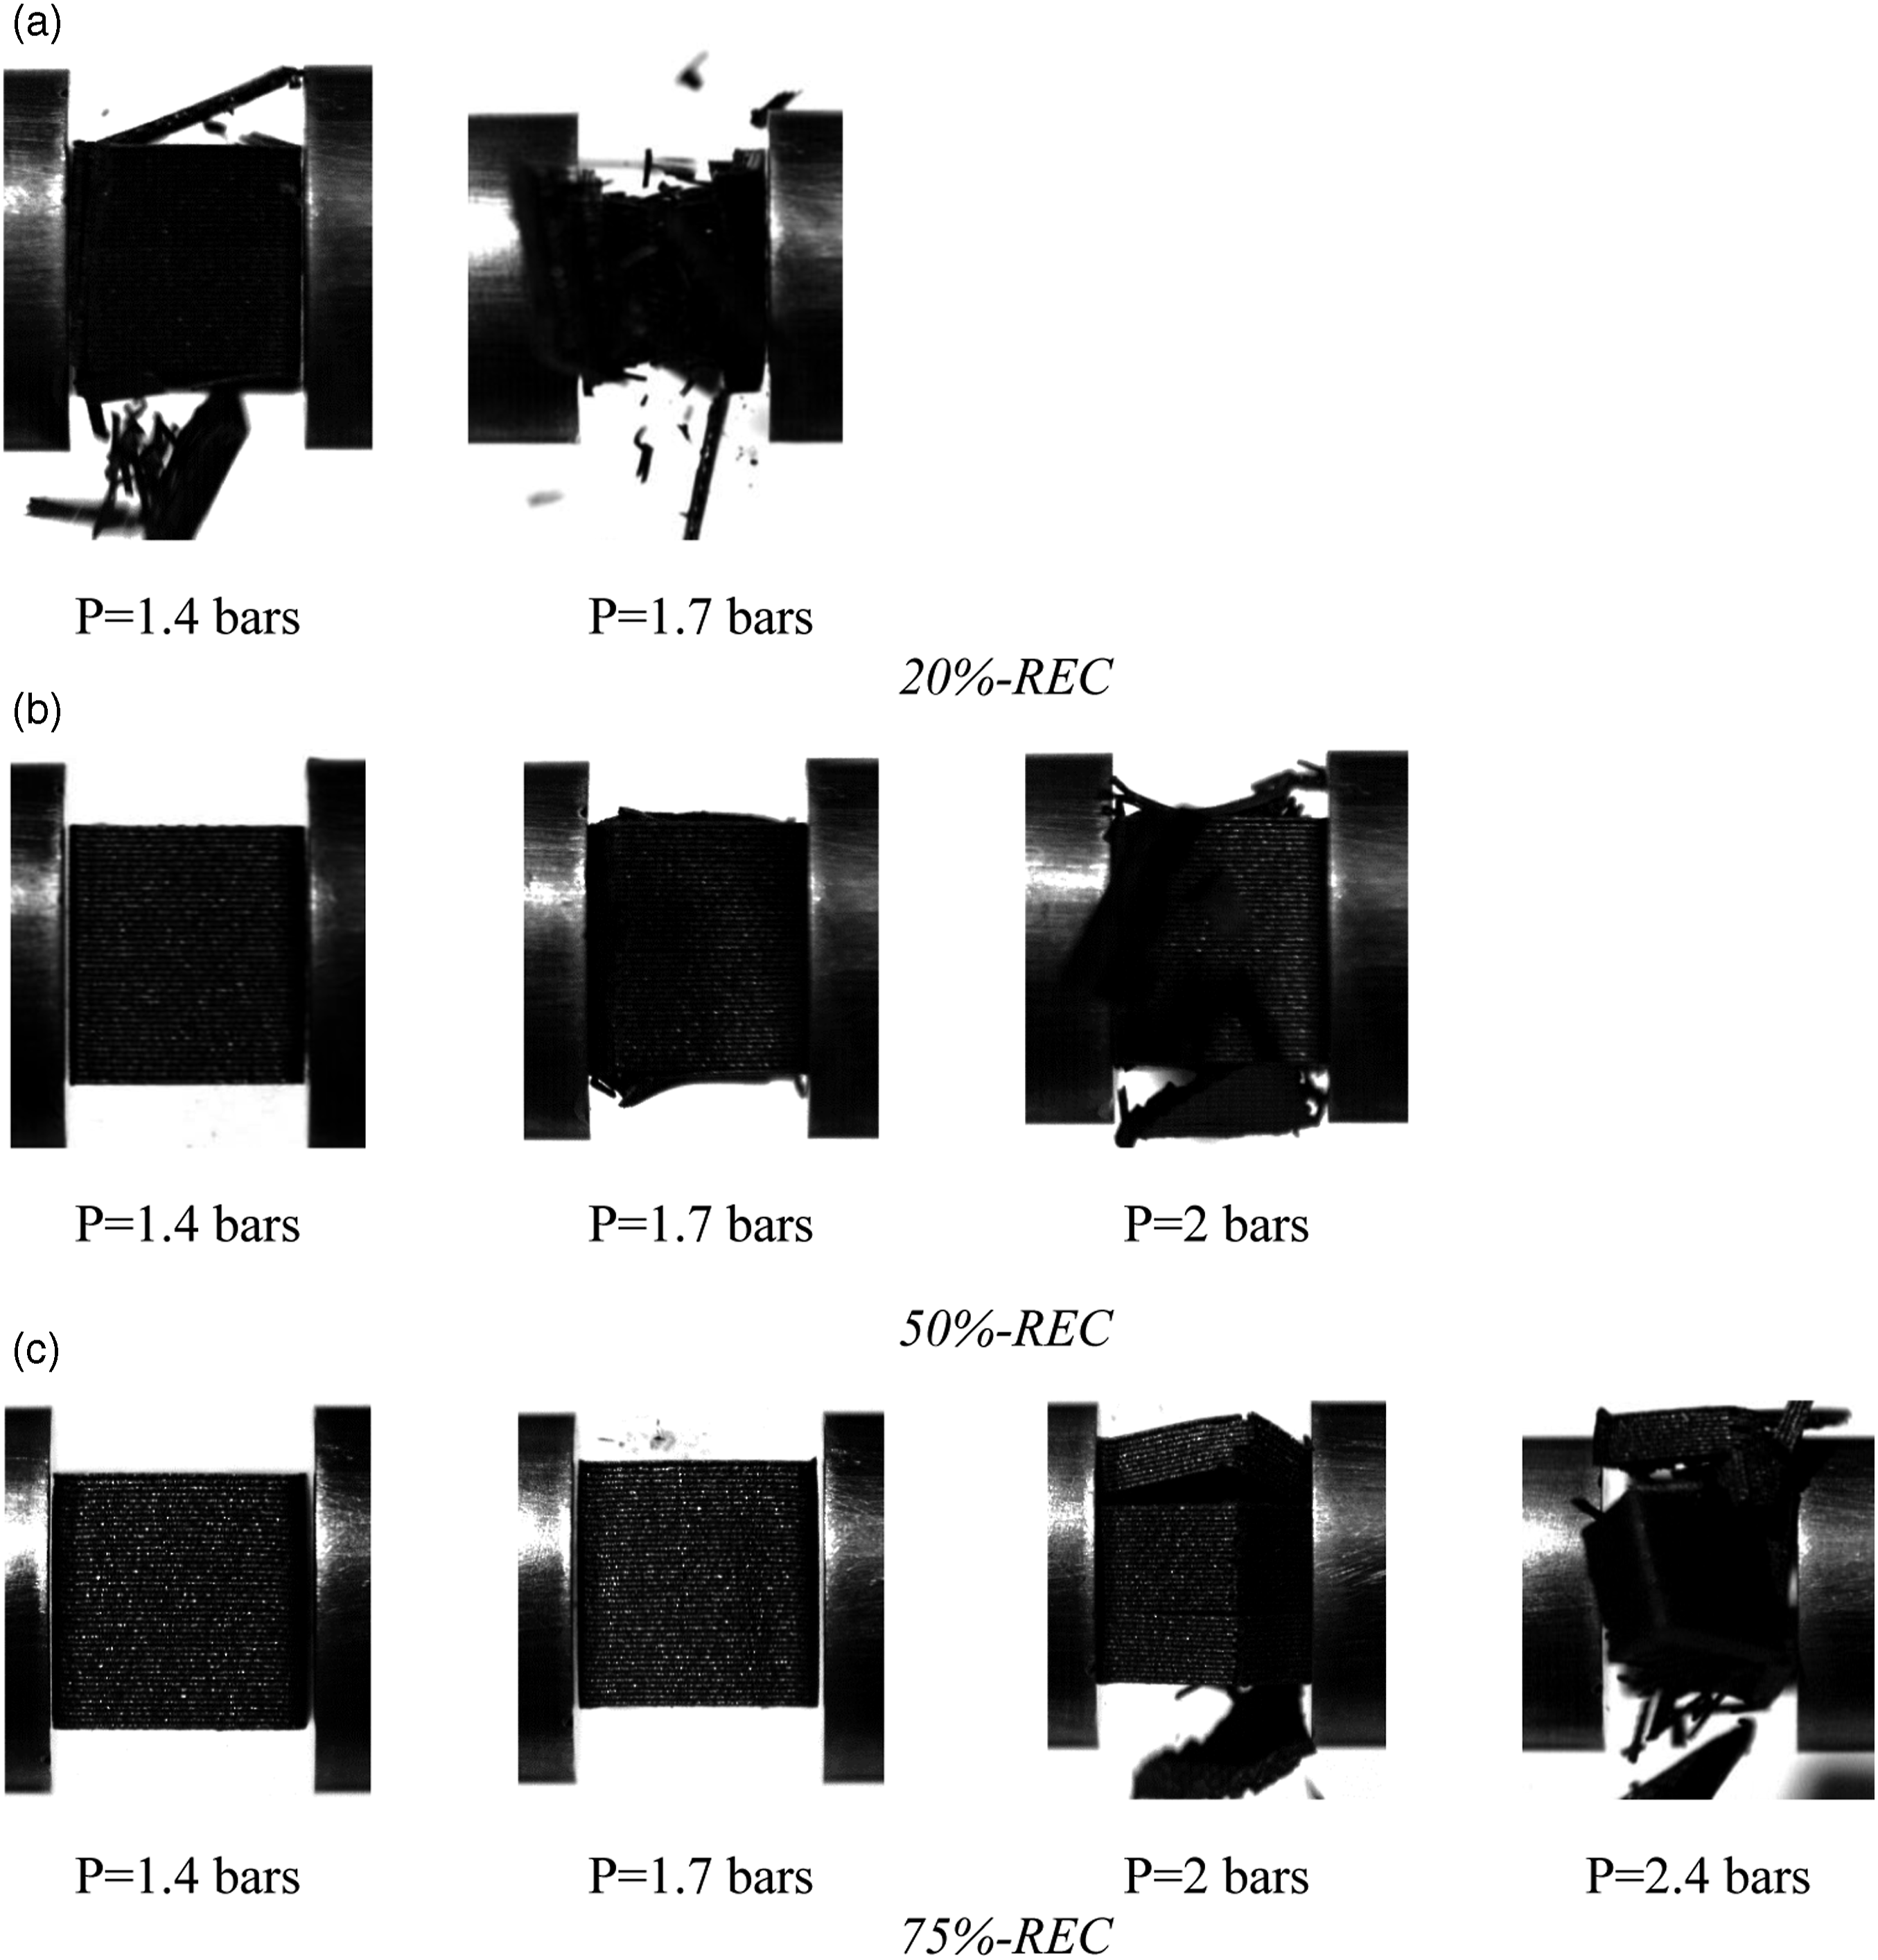
Thus, the comparative analysis demonstrated that the employment of the honeycomb pattern has enhanced the damage resistance of the 3D printed tested specimens irrespective of the fill density at each impact pressure. In addition, the honeycomb samples revealed less crack propagation and delamination among the layers, as well as an attenuation of the severity of the final macro-damage, confirming the improved cohesion between the various layers. The comparative analysis showed that for the different impact energies applied, the extent of macro-damage was considerably reduced, and the dynamic properties of the CF-PETG materials were much improved when the honeycomb pattern was employed due to their hexagonal hollow cell structure.
The detected shrinkage or reduction in sample volume in cases of undamaged samples demonstrated the absorption of the impact energy under compressive loading. This implies that the hollow structure of these 3D-printed samples, whether honeycomb or rectilinear, is susceptible to reducing or even absorbing impact energy. The hexagonal structures of honeycomb cells and the straight lines of a rectilinear pattern can be deformed to absorb impact energy, which is then released as strain energy. Yet, when this energy reaches a material-specific threshold or limit value, the cohesion of adjacent layers will be broken, resulting in the final failure.
As previously stated, the occurrence of the second peak in the strain rate versus time curves could also indicate the occurrence of macro damage in the material. The second peak in these graphs is linked to the drop-in sample stress. These phenomena will be further described in more detail by overlapping the stress and strain rate evolution of 75%-HON (non damaged), and 75%-REC (damaged) specimens subjected to 2.4 bar and showing the various zones corresponding to different behaviors of 3D printed CF-PETG composites, Figure 12(a)-(b). Evolution of the stress and strain rate versus time curves for (a) 75%-HON and (b) 75%-REC under IP dynamic tests, P= 2.4 bar.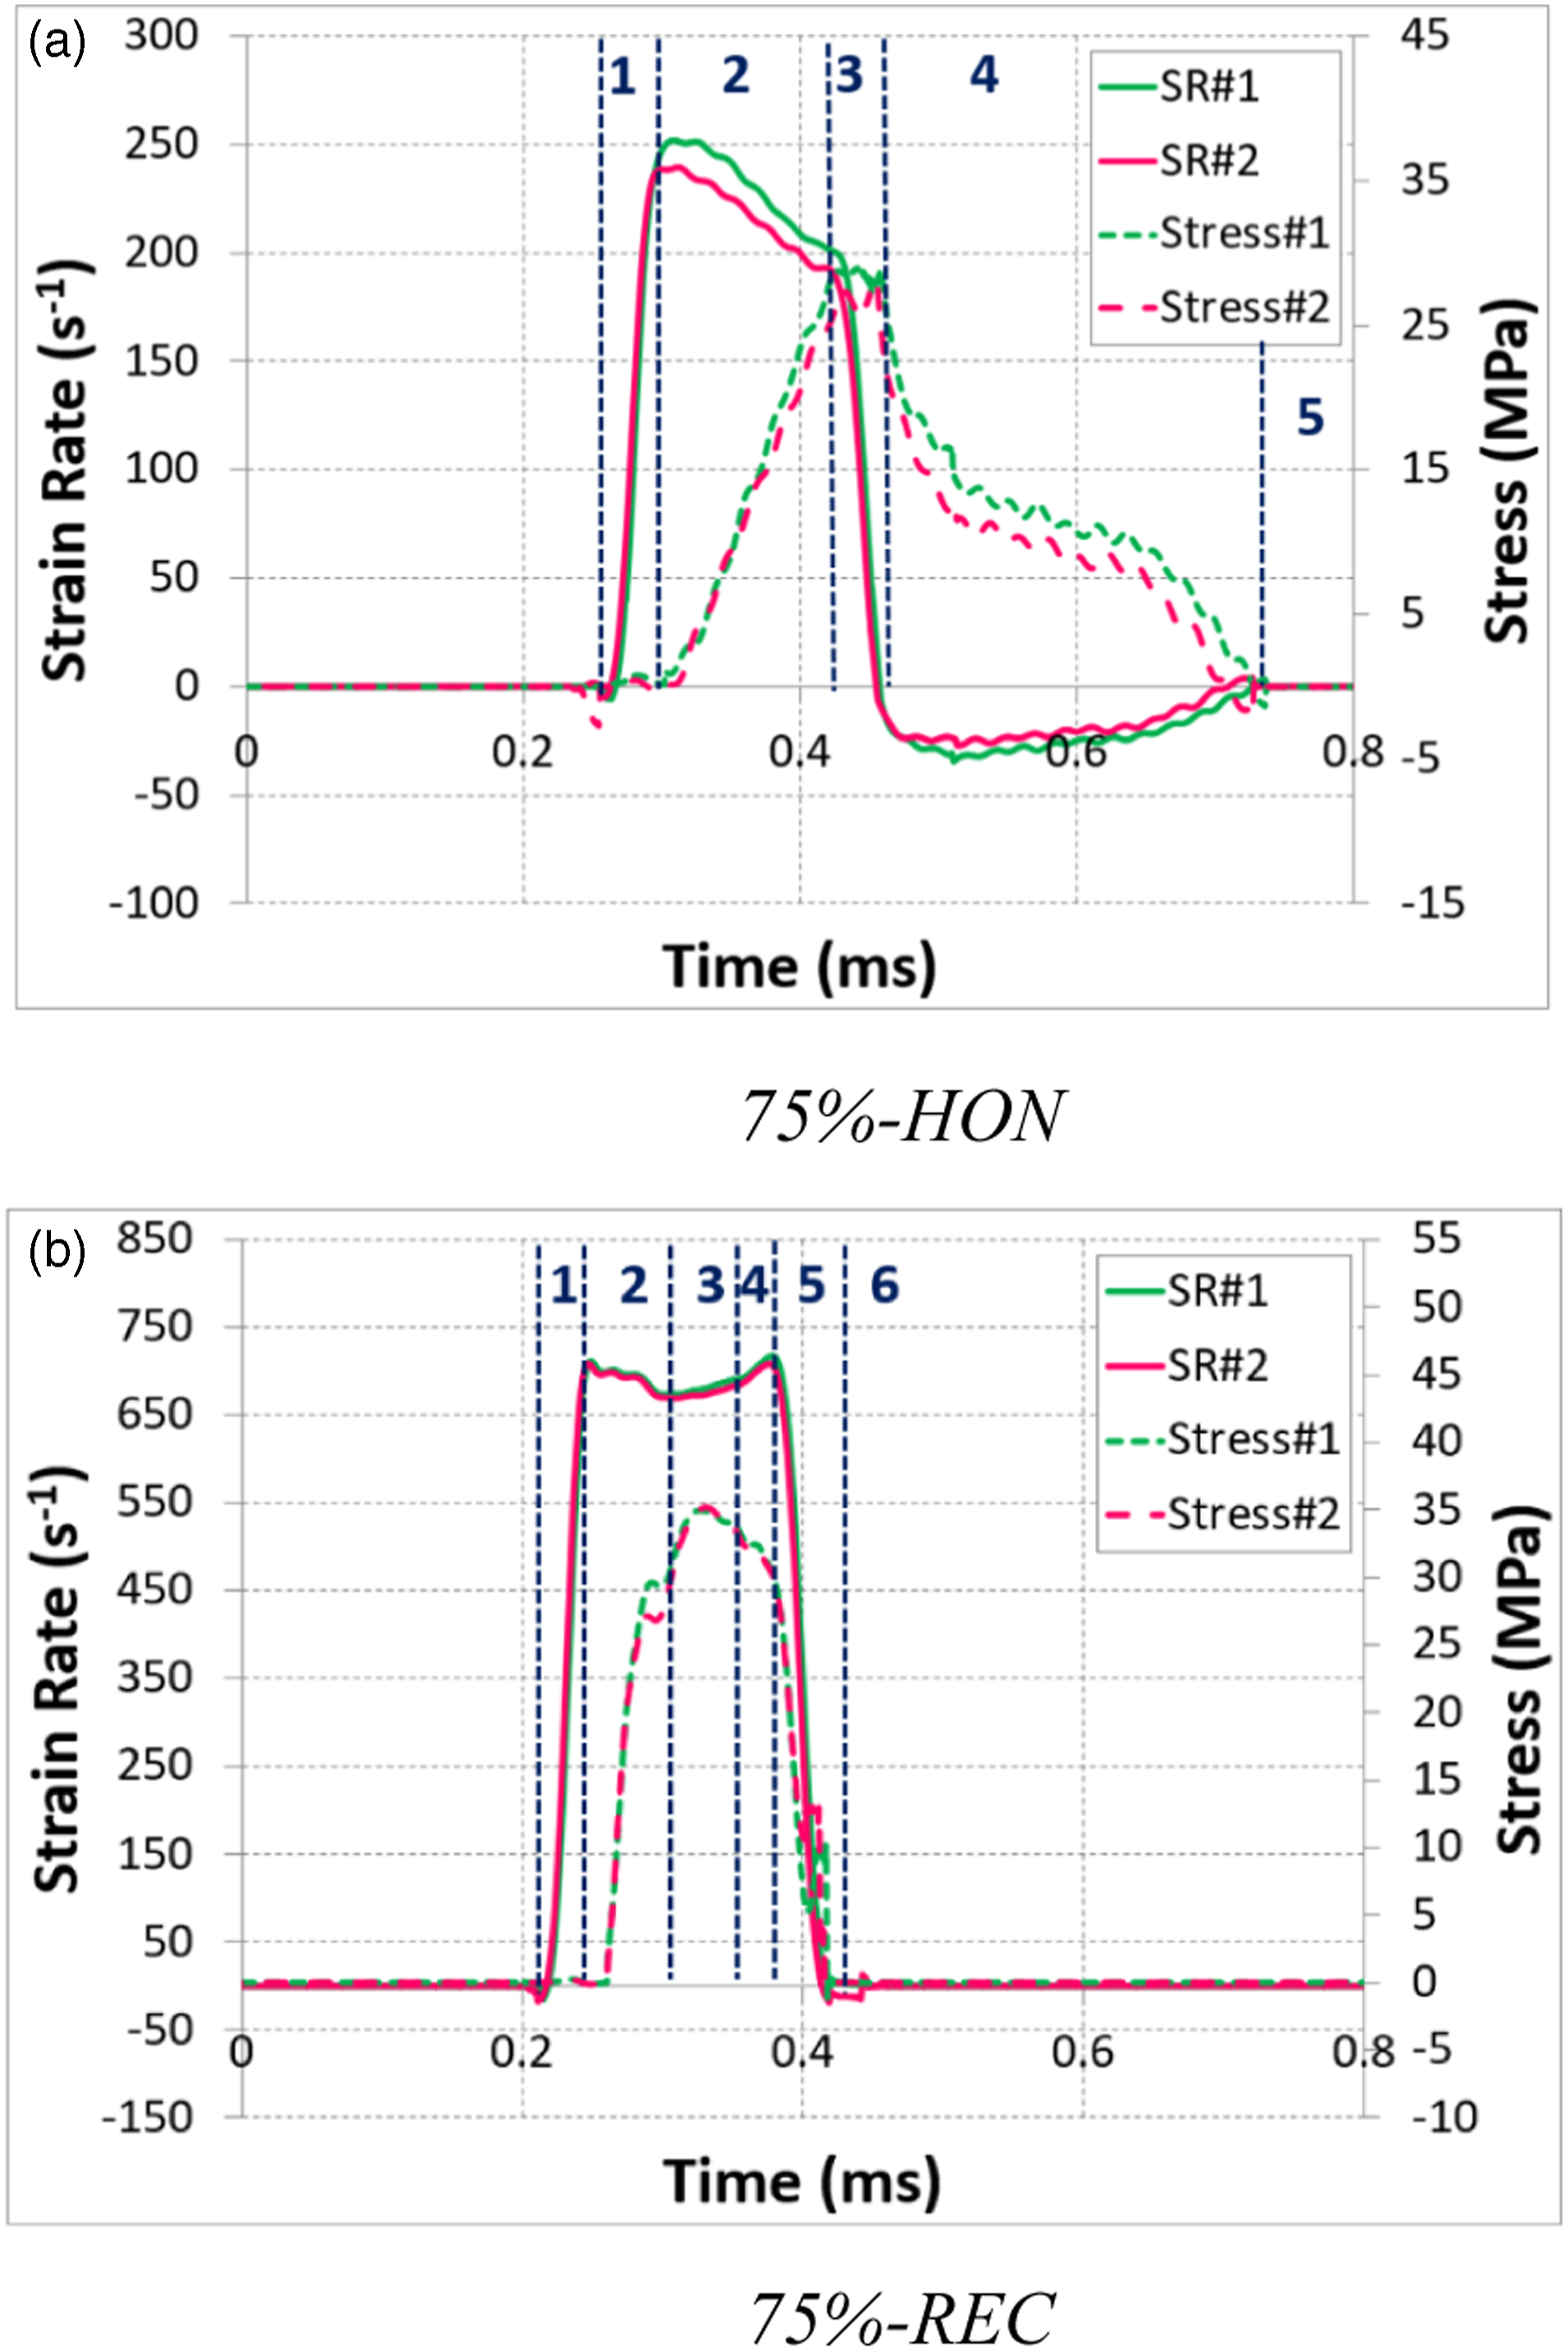
In contrast to samples with elastic-plastic deformation, which showed only five areas, specimens with the second peak, or macro damage, displayed six regions.
For non-damaged tests
- Region 1: The deformation rate was initiated and rapidly evolved, justifying the self-positioning of the specimen between the bars. However, the parallel contact between the facets of the specimen and the two bars was not 100% assured, which may explain the nearly zero stress in this region. - Region 2: Once almost perfect contact was guaranteed; the strength of the materials caused the strain to decrease and the stress to increase. - Region 3: Once the stress attained its maximum value, it remained constant over an interval of time during which the strain rate continued to decrease until it reached zero value, confirming that the specimen has reached the maximum elastic compression strain at maximum stress because of the onset of the damage on a microscopic scale which can be explained by the micro-cracks of the thermoplastic matrix. - Region 4: In this zone, the strain rate and the stress decreased simultaneously until reaching negative and zero values, respectively, confirming the spring back action where the specimen demonstrated the tendency to return to its initial state. - Region 5: The elastic strain deformation rate was restored in this region, and it returned to zero value.
For damaged tests
- Region 1: The deformation rate was initiated and rapidly evolved, justifying the self-positioning of the specimen between the bars. However, the parallel contact between the facets of the specimen and the two bars was not 100% assured, which may explain the nearly zero stress in this region. - Region 2: S Once almost perfect contact was guaranteed; the strength of the materials caused the strain to decrease and the stress to increase. - Region 3: The stress evolution represented dynamic compression with a maximum value and both parameters (stress and strain rate) are stabilized for a certain period; while, the duration of the stress zone was less compared to the undamaged tests, which can be attributed to the occurrence of more microscale damage. - Region 4: The strain rate increased progressively in this region, and the second peak was generated and rapidly evolved as the maximum stress began to decrease, indicating that macroscopic damage had occurred in the specimen. - Region 5: After reaching the maximum peak, the strain rate began to gradually decrease until it became zero and the maximum stress continued to decrease, confirming the total failure of the sample. - Region 6: The stress and strain rate returned to their initial zero values.
Conclusion
As the demand for recent technologies and innovative materials increases, researchers and scientists are challenged to develop products, materials, and processes that offer fast and reliable solutions, such as additive manufacturing (AM). AM is an innovative technology because it has several advantages over conventional methods of manufacturing, such as the ability to manufacture complicated geometries, simplify the supply chain, save time, have mass control, reduce material waste, and eliminate or reduce assembled parts. In this study, the aim was to evaluate the effects of printing infill parameters, such as density and pattern, on the dynamic response of 3D-printed CF-PETG composite specimens made using FFF technology. Cubic specimens fabricated using rectilinear and honeycomb patterns with various fill densities, namely 20%, 50%, and 75% (for each pattern), were submitted to dynamic impact tests using the SHPB device coupled with a high-speed camera to investigate their dynamic behavior in terms of strain rate, stress-strain characteristics, and resistance to damage. The experimental analysis has shown that the strength and toughness of 3D-printed composites are highly sensitive to strain rate, and that there is an important increase in the dynamic characteristics while the strain rate increases. As a result, empirical laws were derived based on the experimental data for linking the dynamic characteristics of 3D printed CF-PETG composites with strain rate.
Furthermore, it was noted that an increase in filling density enhanced the sample's stiffness and strength, as well as its resistance to deformation. The dynamic properties have been significantly enhanced for both infill patterns at 50% and 75% infill densities. However, the results showed that the honeycomb pattern exhibited the highest mechanical properties and shock resistance, even at low filling densities. For example, samples with a 50% honeycomb filling pattern showed improved mechanical response compared to samples with a 75% rectilinear filling pattern. In addition, the best properties of all evaluated materials were obtained by the sample with a 75% honeycomb filling pattern.
Another significant difference between honeycomb and rectilinear patterns is the late appearance of the second peak and subsequent reduction in its size, indicating a delayed beginning of permanent macro damage and a reduction in its intensity, respectively. This behavior justified that the impact resistance and energy-absorbing capacity of samples with honeycomb infill pattern was better than the samples with the rectilinear pattern even though, there was macro damage, because of the efficient hexagonal configuration that provided better compressive characteristics. Additionally, photos recorded by the fast camera showed that the honeycomb design enhanced the 3D-printed samples' damage resistance and failure behavior at each impact pressure, independent of fill density. The honeycomb design reduced the degree and extent of damage mechanisms, and specimens demonstrated less crack propagation and delamination between the different print layers, indicating improved adhesion and cohesion.
This study will enable scientists and engineers to better comprehend the effects of filling pattern and density on the dynamic mechanical behaviour of 3D-printed composite materials. It also consolidates interest in 3D printing diverse materials for a range of technical applications that go beyond static or quasi-static loading conditions to also encompass high strain loading circumstances.
Footnotes
Acknowledgements
The authors of this would like to express their gratitude to NANOVIA (Louargat, France) for providing the characterization materials.
Declaration of conflicting interests
The author(s) declared no potential conflicts of interest with respect to the research, authorship, and/or publication of this article.
Funding
The author(s) received no financial support for the research, authorship, and/or publication of this article.