
Abstract
Polyvinyl alcohol (PVA) concrete is a new green building material. In order to make it more widely used, this study used butylbenzene emulsion (SBL) to modify PVA fiber concrete. The enhancement mechanism of SBL on the PVA/cement interface was systematically investigated at multiple scales, including macroscopic mechanical properties, microstructural characteristics, nano-interface interactions. On a macro scale, the addition of SBL and PVA fibers can significantly improve the shear strength and flexural strength of composite concrete at 7 and 28 days, and SBL can make up for the decrease in compressive strength caused by PVA. On a micro scale, the corresponding polymer cement concrete was tested by scanning electron microscopy (SEM), X-ray diffraction (XRD) and Fourier transform infrared spectroscopy (FT-IR). It was observed that some gels and polymers filled the interfacial gap and effectively repaired the interfacial defects. The SBL brought the two interfaces closer together and described its bonding effect at the micro-interface. On the nano scale, SBL/PVA/C-S-H is modeled by molecular dynamics method. Binding energy, Relative concentrations, Radial distribution function, Mean-square displacement and Time correlation function were analyzed and calculated. The results show that SBL reduces the interfacial effect, enhances the interfacial hydrogen bond, van der Waals interaction, Ca-H coordination bond and stability, improves the interfacial adhesion, and further enhances the weak interfacial bond between organic polymer (PVA) and inorganic silicate (C-S-H).
Keywords
Introduction
The use of polyvinyl alcohol (PVA) fibers to manufacture fiber-reinforced concrete is considered to be a technological revolution in the concrete construction industry due to its superior mechanical properties. 1 The addition of PVA improves the performance of ordinary concrete, mainly because it not only improves the mechanical properties of cement 2 and concrete, 3 such as flexural and tensile strength, but also can improve durability and impermeability.4,5 However, due to the lack of necessary physical and chemical affinity between PVA fiber and cement and the weak interfacial bonding strength, the compressive strength of concrete is reduced. Yang Z et al. 6 found that there was hydrogen bond connection between PVA and cement, but due to the low stability of intermolecular or intramolecular hydrogen bond, PVA could not be stably adsorbed on the interface, which further indicated that the interface bond between PVA and cement matrix was low. Therefore, in order to further optimize the strengthening and toughening effect of PVA fiber on concrete, it is urgent to improve the interface performance between PVA and cement body.
In order to improve the performance of PVA concrete, experts and scholars have invested a lot of research on the modification and strengthening of PVA concrete. Daniel R et al. 7 used a SCA to modify the interface between PVA fiber and concrete. They found that SCA can significantly improve the compressive and shear strength of PVA fiber concrete. Ao Z et al. 8 found that SCA could enhance the bond strength of the fiber-cement matrix composite interface and improve the compressive and tensile strength of the test blocks. A lot of tests show that the use of admixtures can improve the mechanical properties of PVA concrete. Therefore, this study introduced styrene butadiene latex to modify PVA concrete.
Styrene butadiene latex (SBL) is a kind of polymer concrete admixture. Because of its mature production process, abundant raw materials, low cost and excellent comprehensive properties, SBL is often used as a cementing material in polymer modified concrete. Murat MM et al. 9 found that styrene butadiene latex can significantly improve the load bearing capacity and ductility of the specimens. BA. K. et al. 10 studied styrene butadiene latex and different surface roughness methods to enhance the bond efficiency between overlay layer and base concrete, and found that styrene butadiene latex can increase the bond strength of concrete. Dong et al. 11 measured the flexural strength, bending toughness and impact toughness of styrene butadiene latex modified cement concrete, and the results showed that when the cementing ratio increased from 0 to 60%, the flexural strength, bending toughness and impact toughness all increased first and then decreased. Many studies have shown that adding SBL into concrete can effectively improve its mechanical properties.
Although the above tests demonstrate that the separate action of SBL and PVA can improve the mechanical properties of concrete, there are few studies on the change of concrete properties under the combined action of the two. Most of the research on the interface is only carried out at the macro level, and the potential mechanism at the molecular level is still limited, which is supplemented by the introduction of multi-scale analysis.12,13 In recent years, molecular dynamics (MD) simulation techniques have been used to characterize the microstructure and microscale properties of polymer-cement-based materials. This provides an opportunity literature to further understand the interfacial bonding behavior between polymer and cementitious materials and to better explain the physicochemical behavior between them.
14
Lijuan L et al.
15
used the method of combining experiment and simulation to reveal the modification mechanism by molecular dynamics method, and verified the macro and micro test effects. Han Q et al.
16
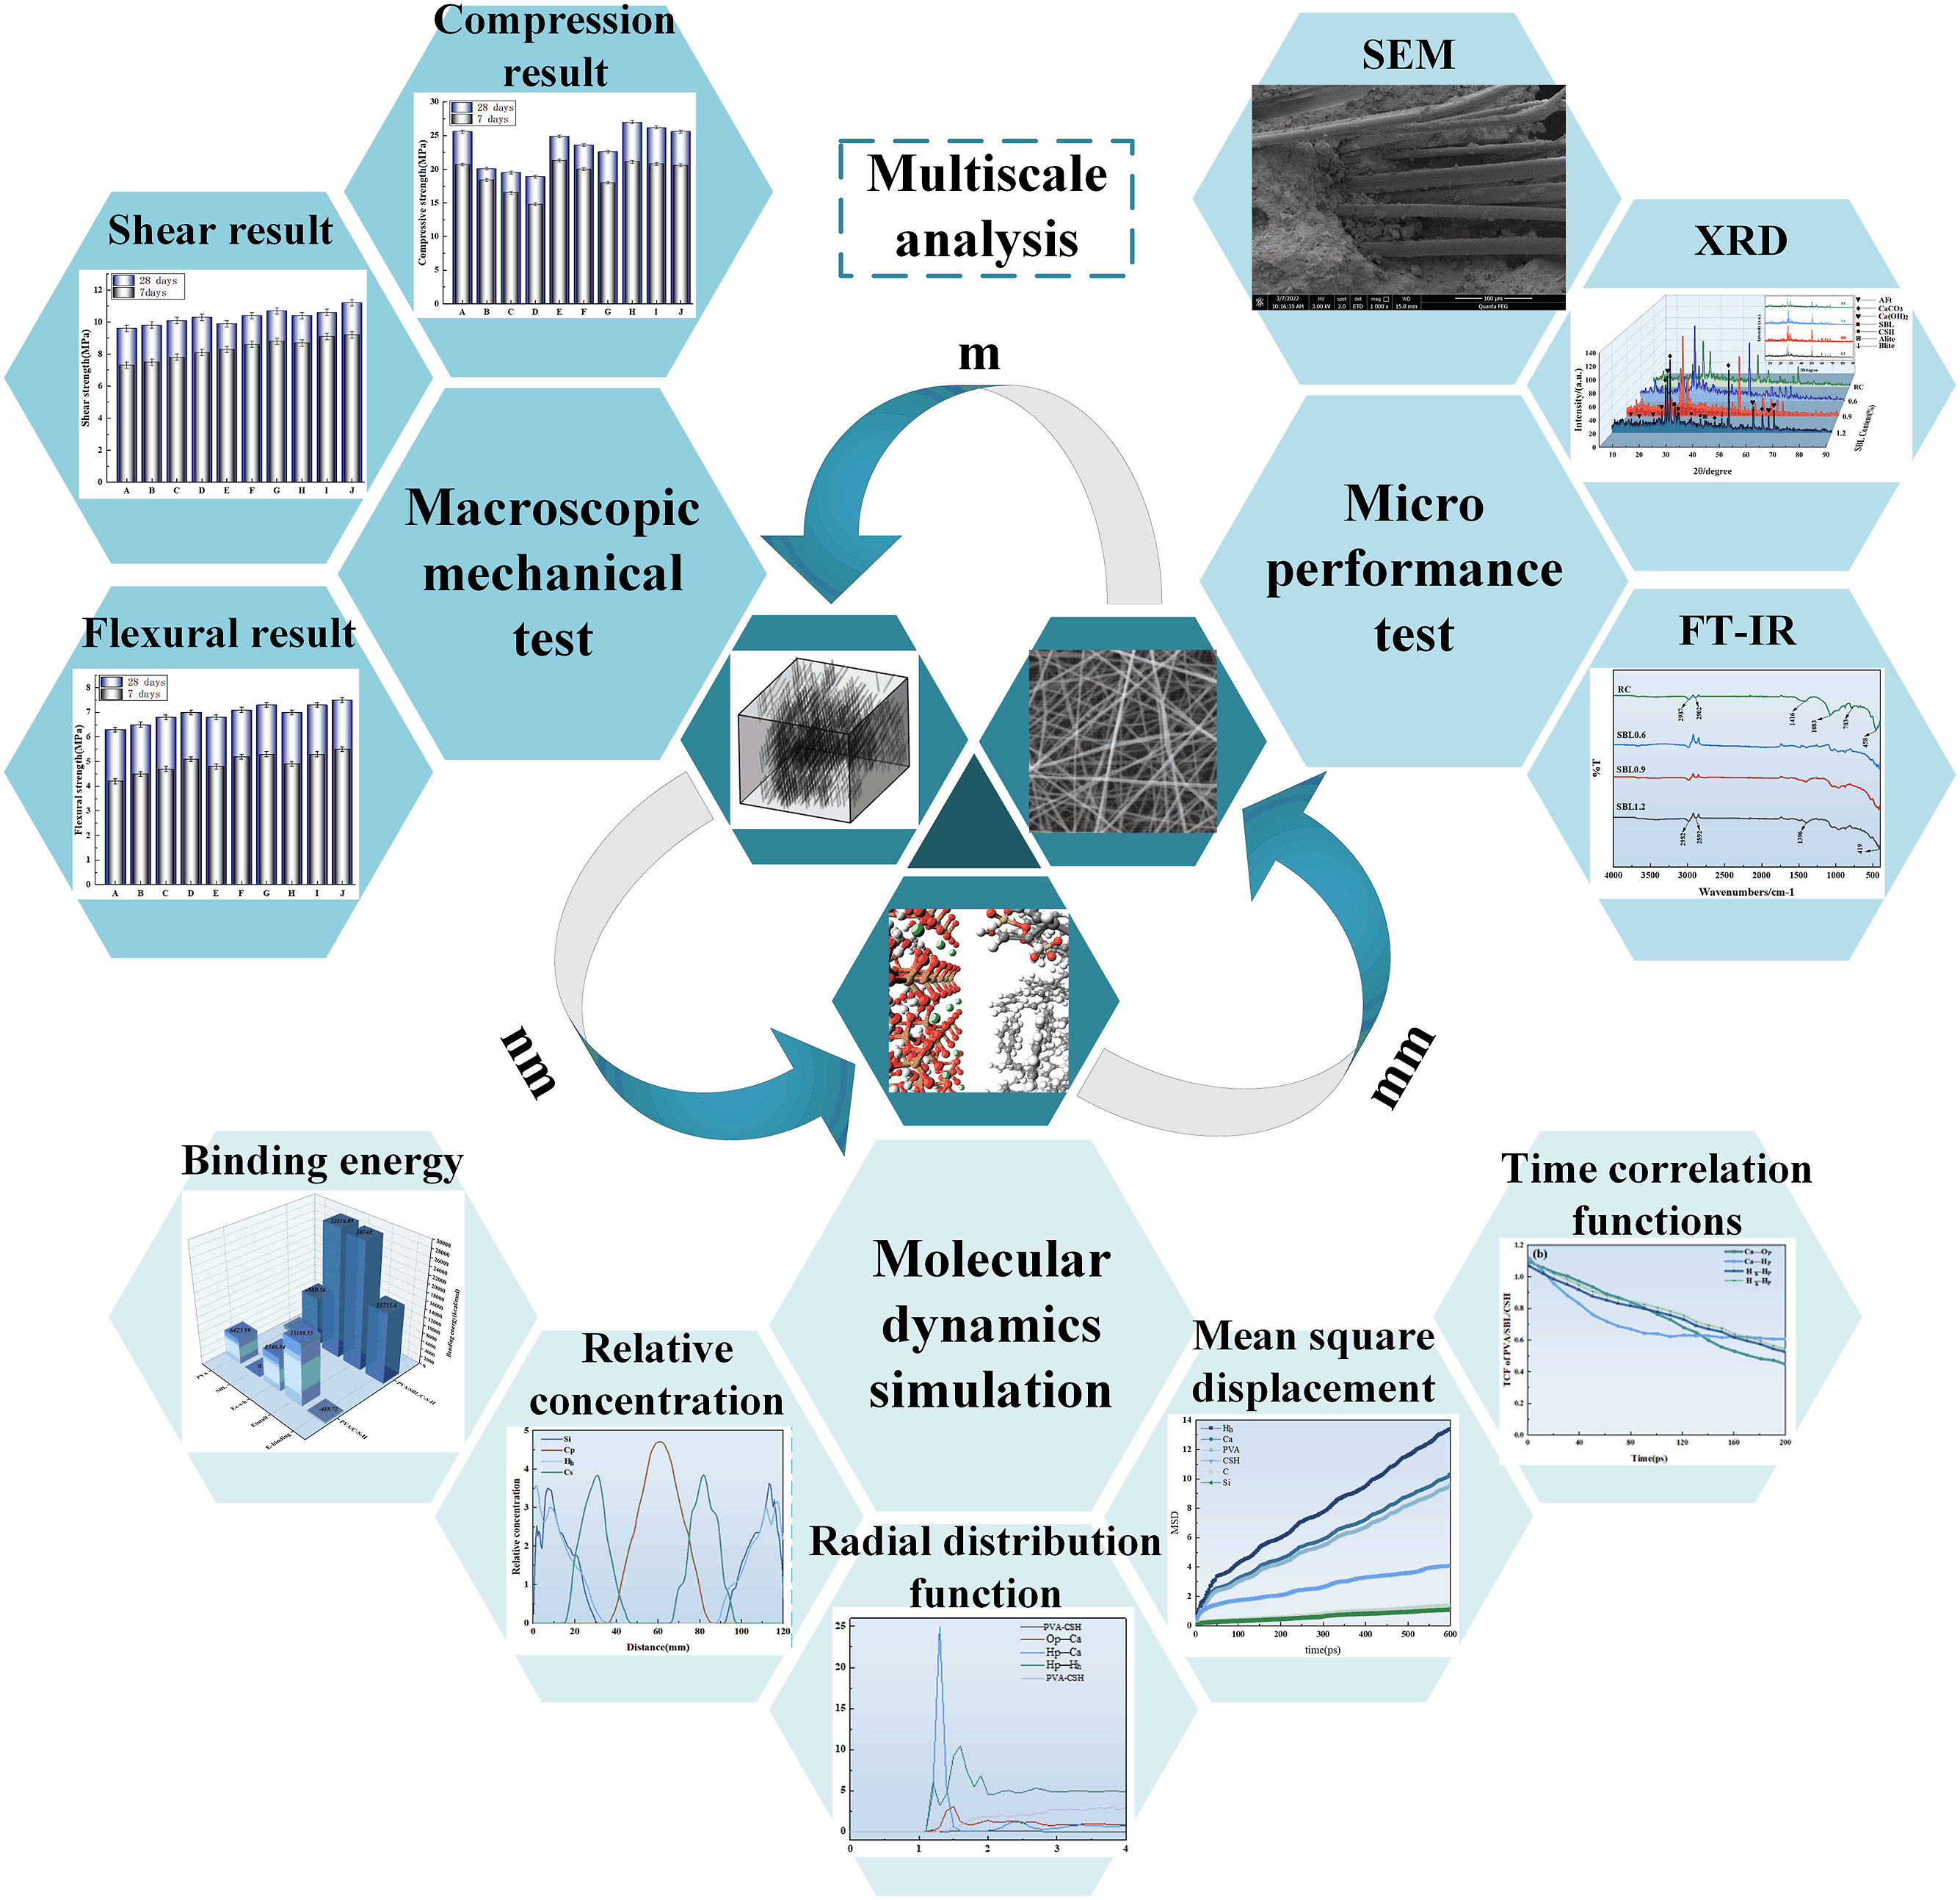
proposed a novel surface treatment method using PVA to improve the hydrophilicity of scrap rubber and investigated the strengthening mechanism of the interface between PVA and scrap rubber/cement slurry by MD. In this study (Figure 1), PVA concrete was modified by SBL to test the mechanical properties of organic composite concrete. Secondly, the interfacial structure between PVA fiber and cement-based material was characterized by scanning electron microscopy (SEM), and the effect of chemical composition on the reaction products was measured by X-ray diffraction (XRD) and Fourier transform infrared spectroscopy (FT-IR). Finally, the enhancement mechanism of SBL on the interface properties of PVA concrete is analyzed from molecular scale, which provides a theoretical reference for the development of high-performance fiber reinforced concrete. Multiscale analysis.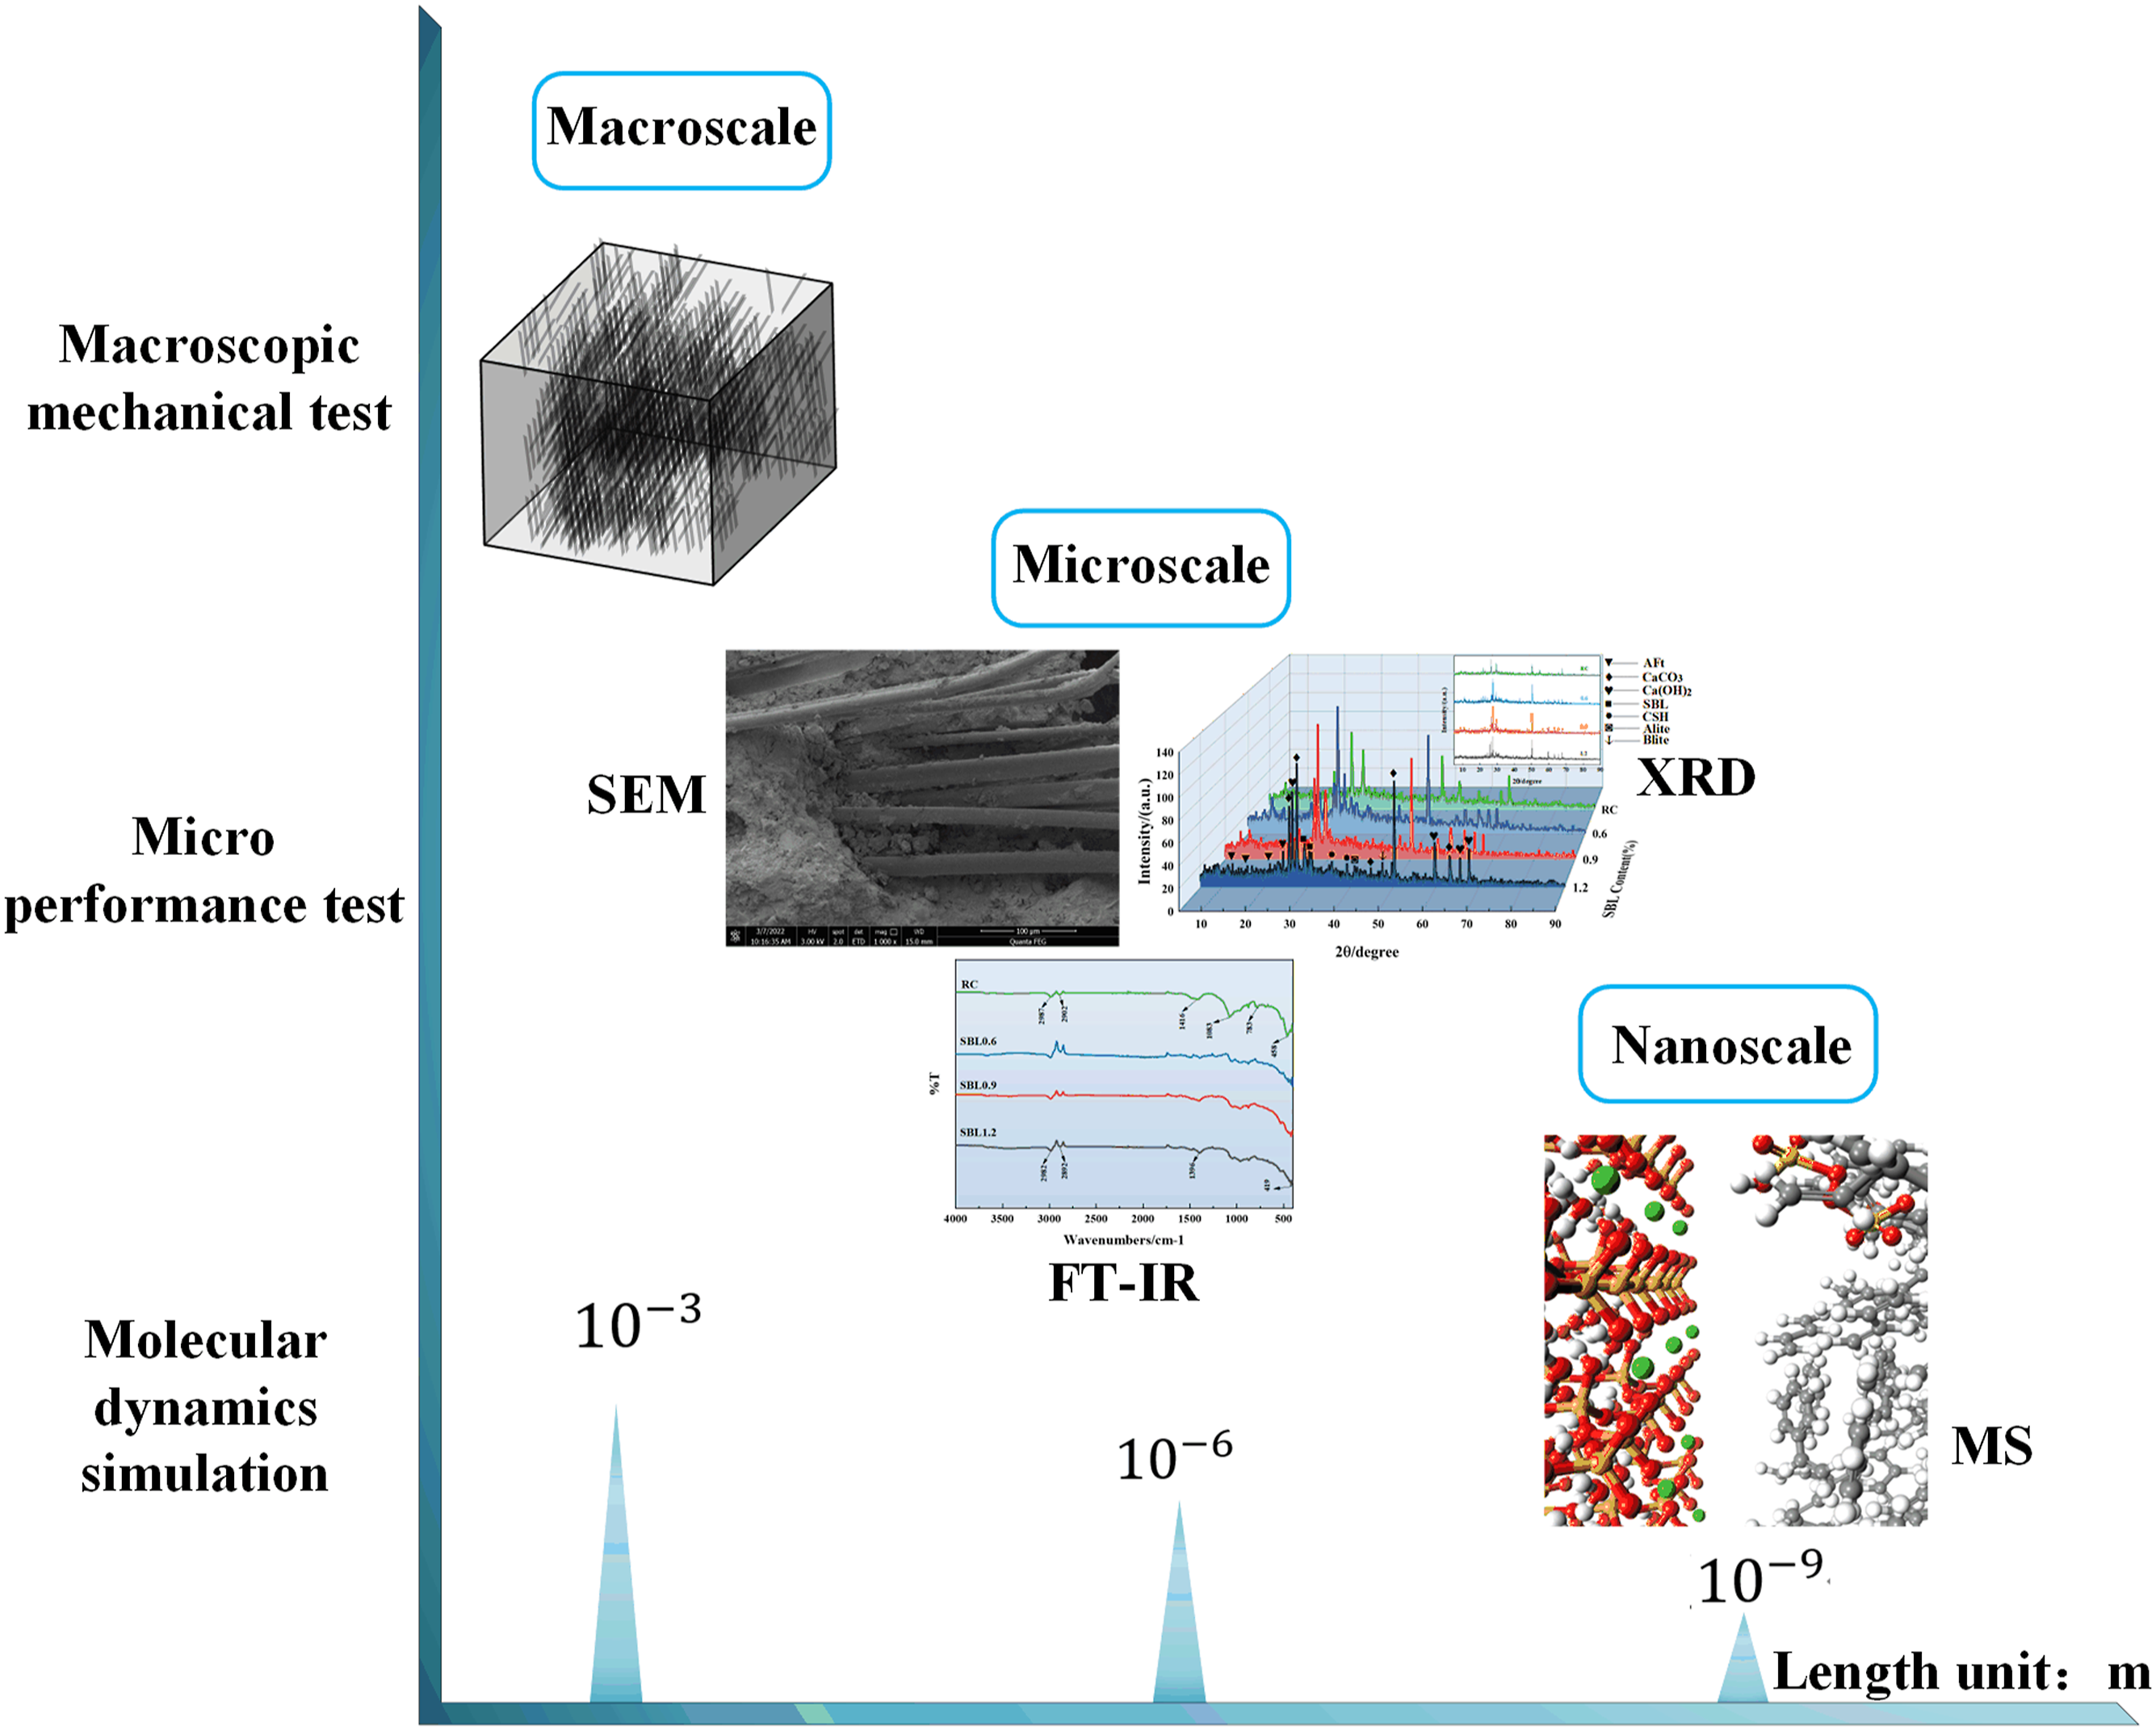
Method
Main materials
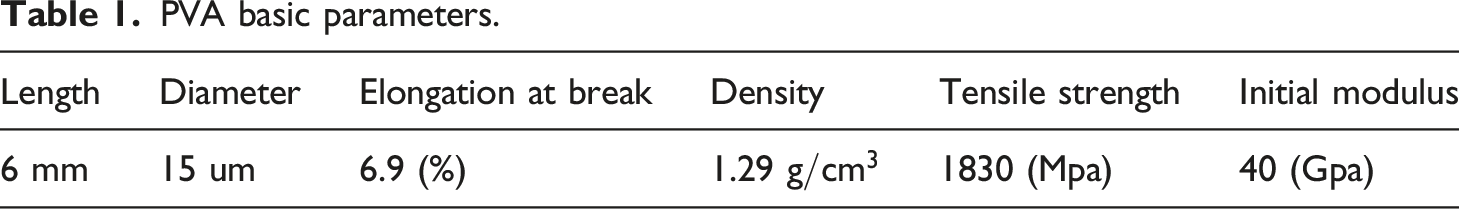
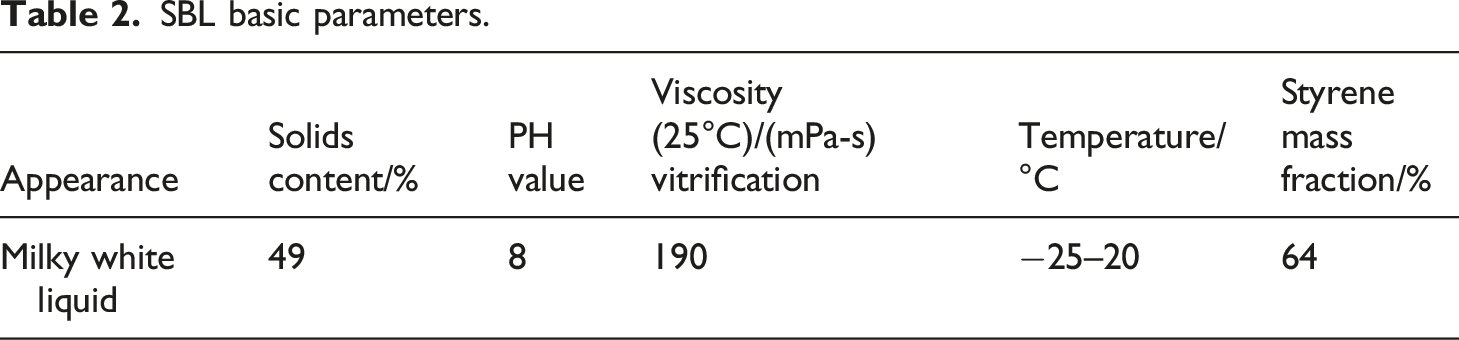
The Portland cement (PO 42.5) used in this study was provided by Zhonglian Cement Co, LTD, Hebei, China. The fine aggregate is river sand, as shown in Figure 2(a). The fineness modulus is 2.6 and the particle size ranges from 0.25 mm to 0.4 mm. The coarse aggregate is gravel, as shown in Figure 2(b), with a maximum particle size of 19 mm and a specific gravity of 2.6. As shown in Figure 2(c), the high-strength and high-mode PVA fiber is provided by Shanghai Chuangke Chemical Technology Co., LTD. The basic parameters are shown in Table 1. As shown in Figure 2(d), the styrene butadiene latex (SBL) used in this study was provided by Shenzhen Yoshida Chemical Co., LTD, which was prepared by styrene, butadiene, ammonium persulfate and acrylic acid in a ratio of 62:30:4:4. Basic parameters are shown in Table 2. Main materials for the experiment. PVA basic parameters. SBL basic parameters.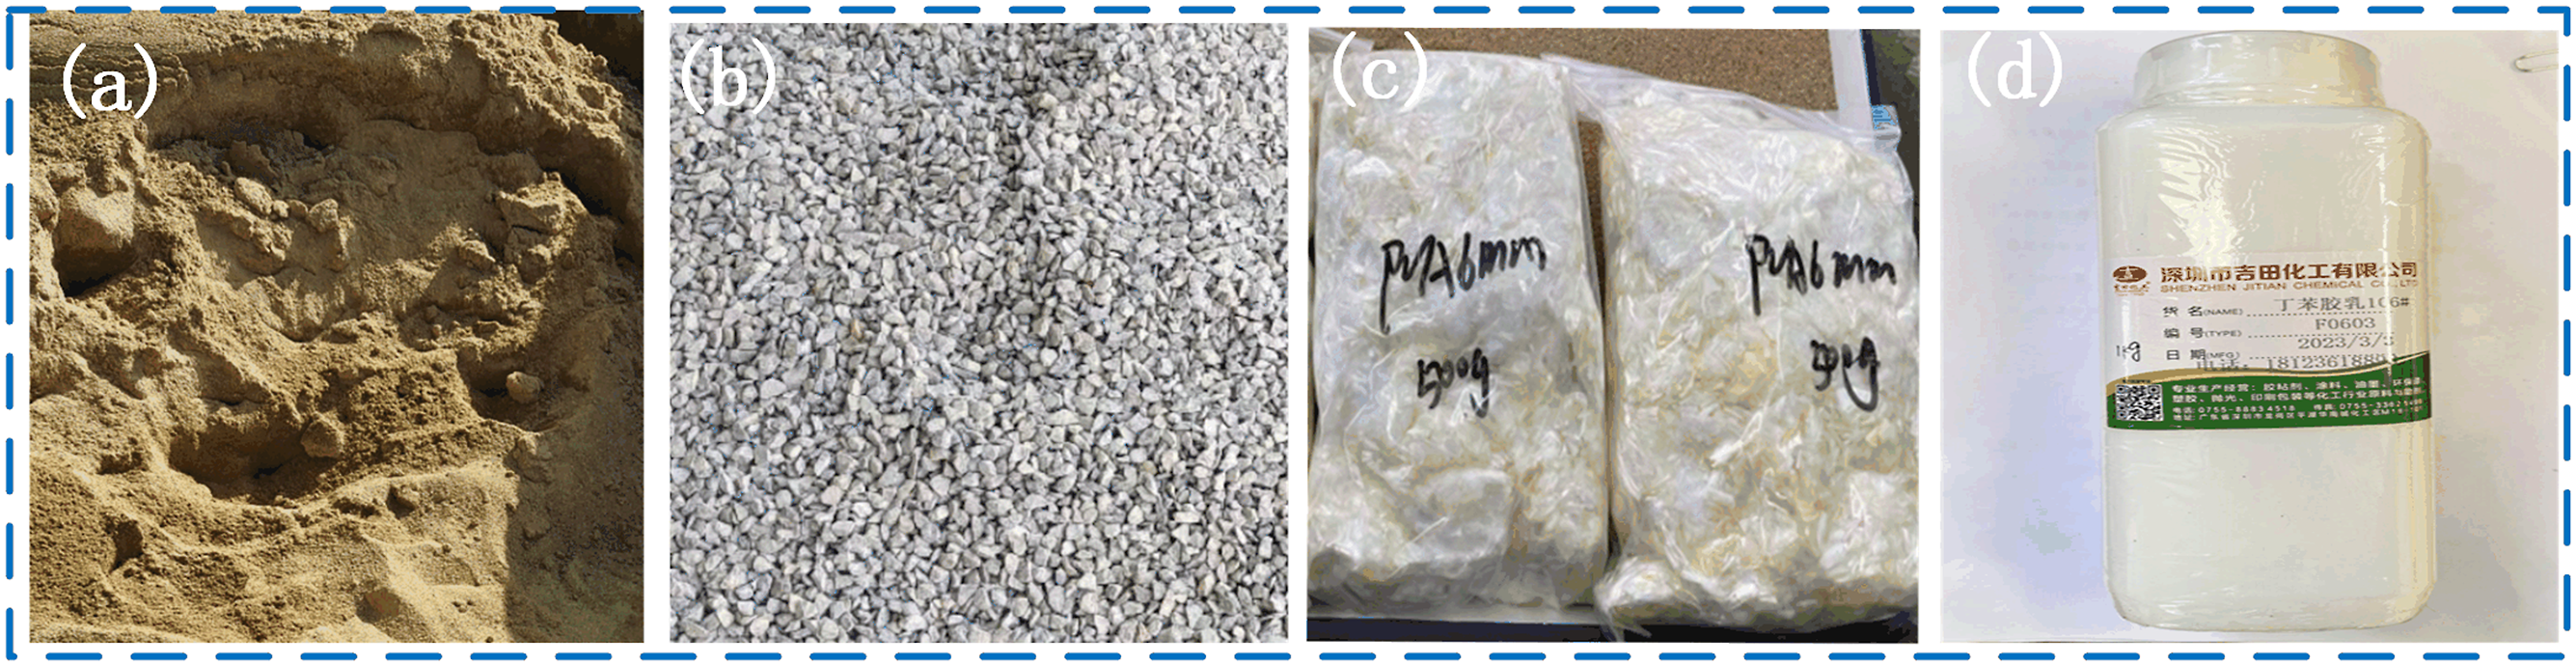
Treatment method and mechanism
As shown in Figure 3, PVA has a high water absorption, so the PVA fiber should be treated, the PVA fibers were cleaned with sodium hydroxide solution to remove impurities on the surface of the PVA fibers, then rinsed with deionized water to pH = 7, placed in a drying oven at 45°C for 12 h, placed at 20°C for 6 h, filtered and cooled to room temperature, dried at 40°C to a fixed weight for use. PVA fiber treatment process.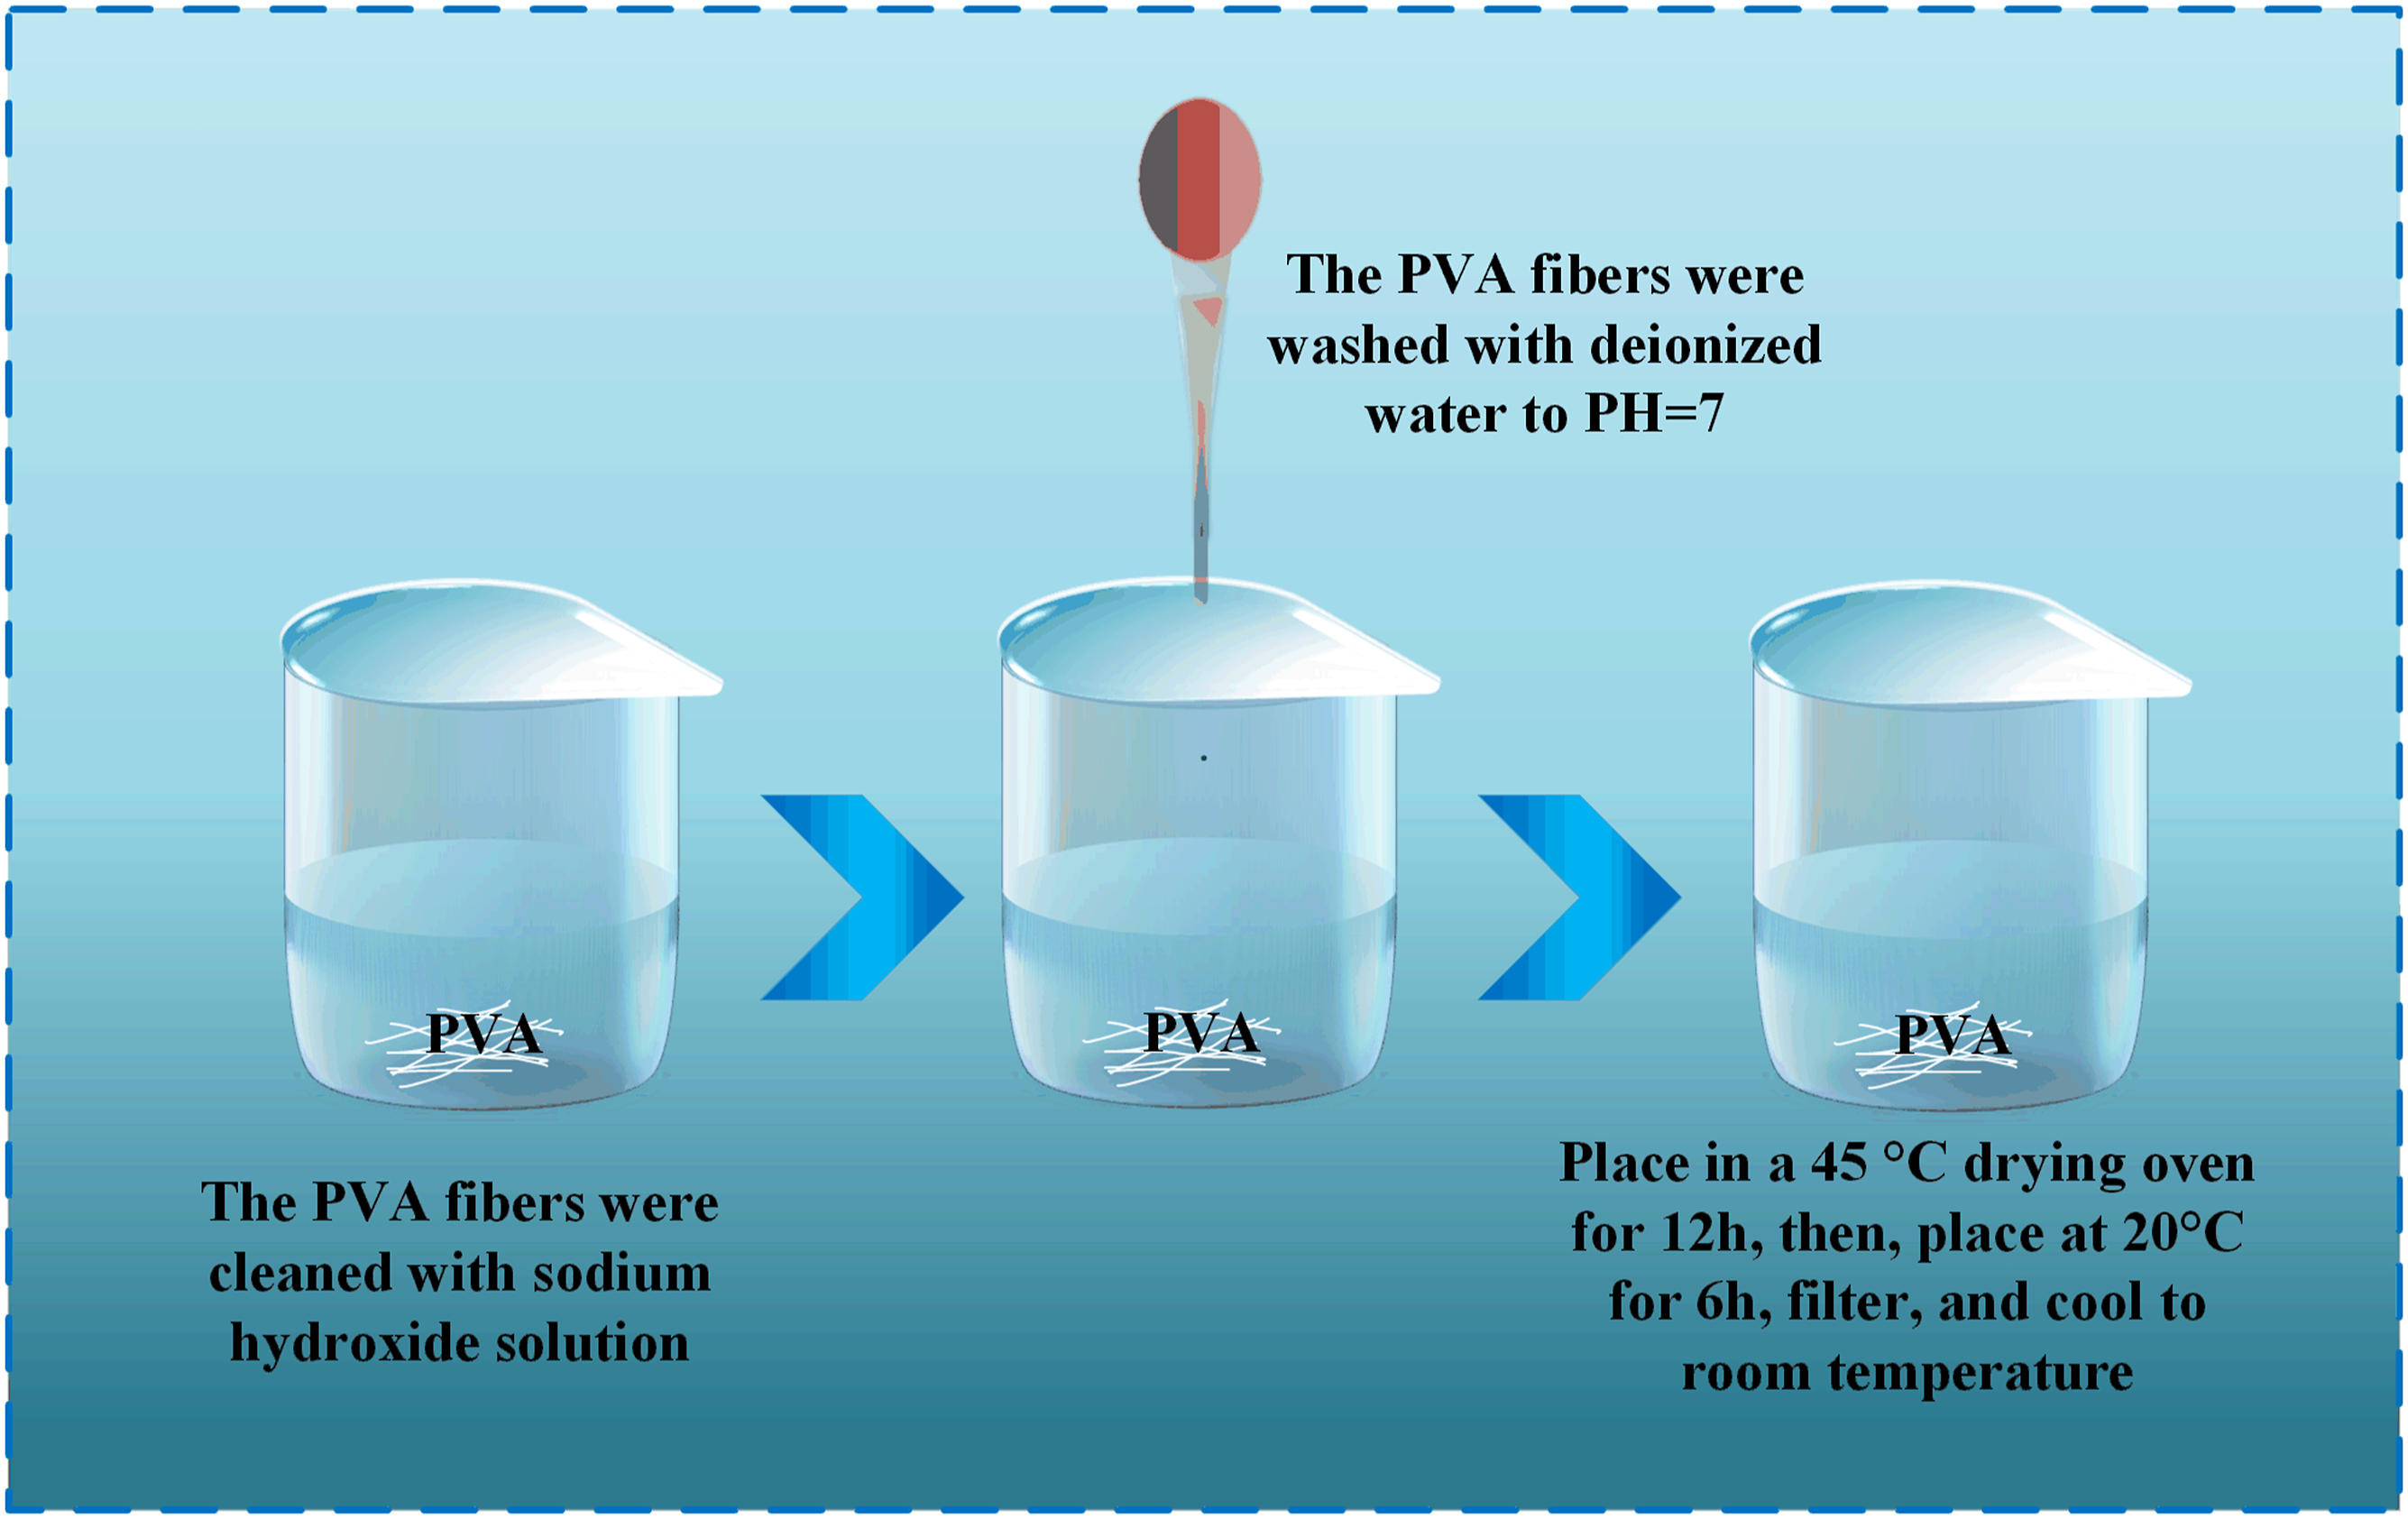
Compound design
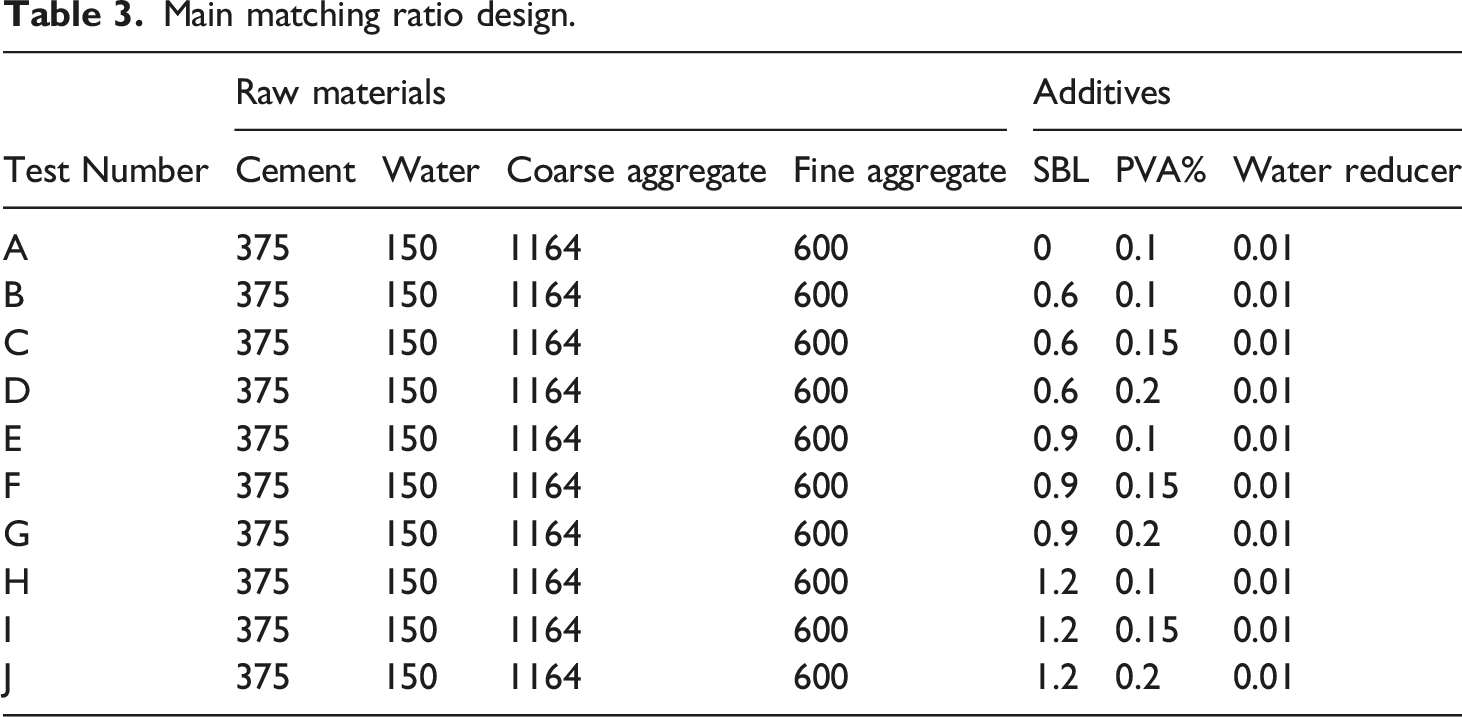
The purpose of this paper is to study the effects of SBL on the mechanical properties and microstructure of PVA fiber reinforced concrete, and analyze the results. The cement, water, coarse aggregate, fine aggregate, styrene butadiene latex admixture and PVA fiber admixture are the main parameters.
Main matching ratio design.
Specimen preparation
Verify the effect of SBL on the macroscopic mechanical action of PVA concrete. In this study, nine kinds of SBL/PVA concrete with different parameters were prepared. Prepare three identical test blocks for each target sample to obtain an error value. In the preparation of SBL/PVA composite concrete, the corresponding proportional weight of SBL was first mixed with 2.2 kg of water for use, and then 11.6 kg coarse aggregate and 5.9 kg fine aggregate were put into the HJW-60 uniaxial laboratory concrete mixer as shown in Figure 4(a) for mixing for 1min, and then 4.5 kg cement was added for mixing for 2min. Then pour half of the styrene butadiene latex mixture and stir for 1min. It is worth noting that in order to prevent the PVA fiber from caking, the treated PVA fiber is added three times during the mixing process, stirring for 1min each time. Finally, add the remaining water and styrene butadiene latex mixture, stir for 2min, and then put into the mold coated with coating agent. Vibrate on the shaking table for 1min while smoothing the surface. All concrete test blocks were cured at room temperature for 24 h before being removed and then placed in a standard curing chamber for 28 days. Part of the test block is prepared as shown in Figure 4(b). Part of the test equipment and test block pouring.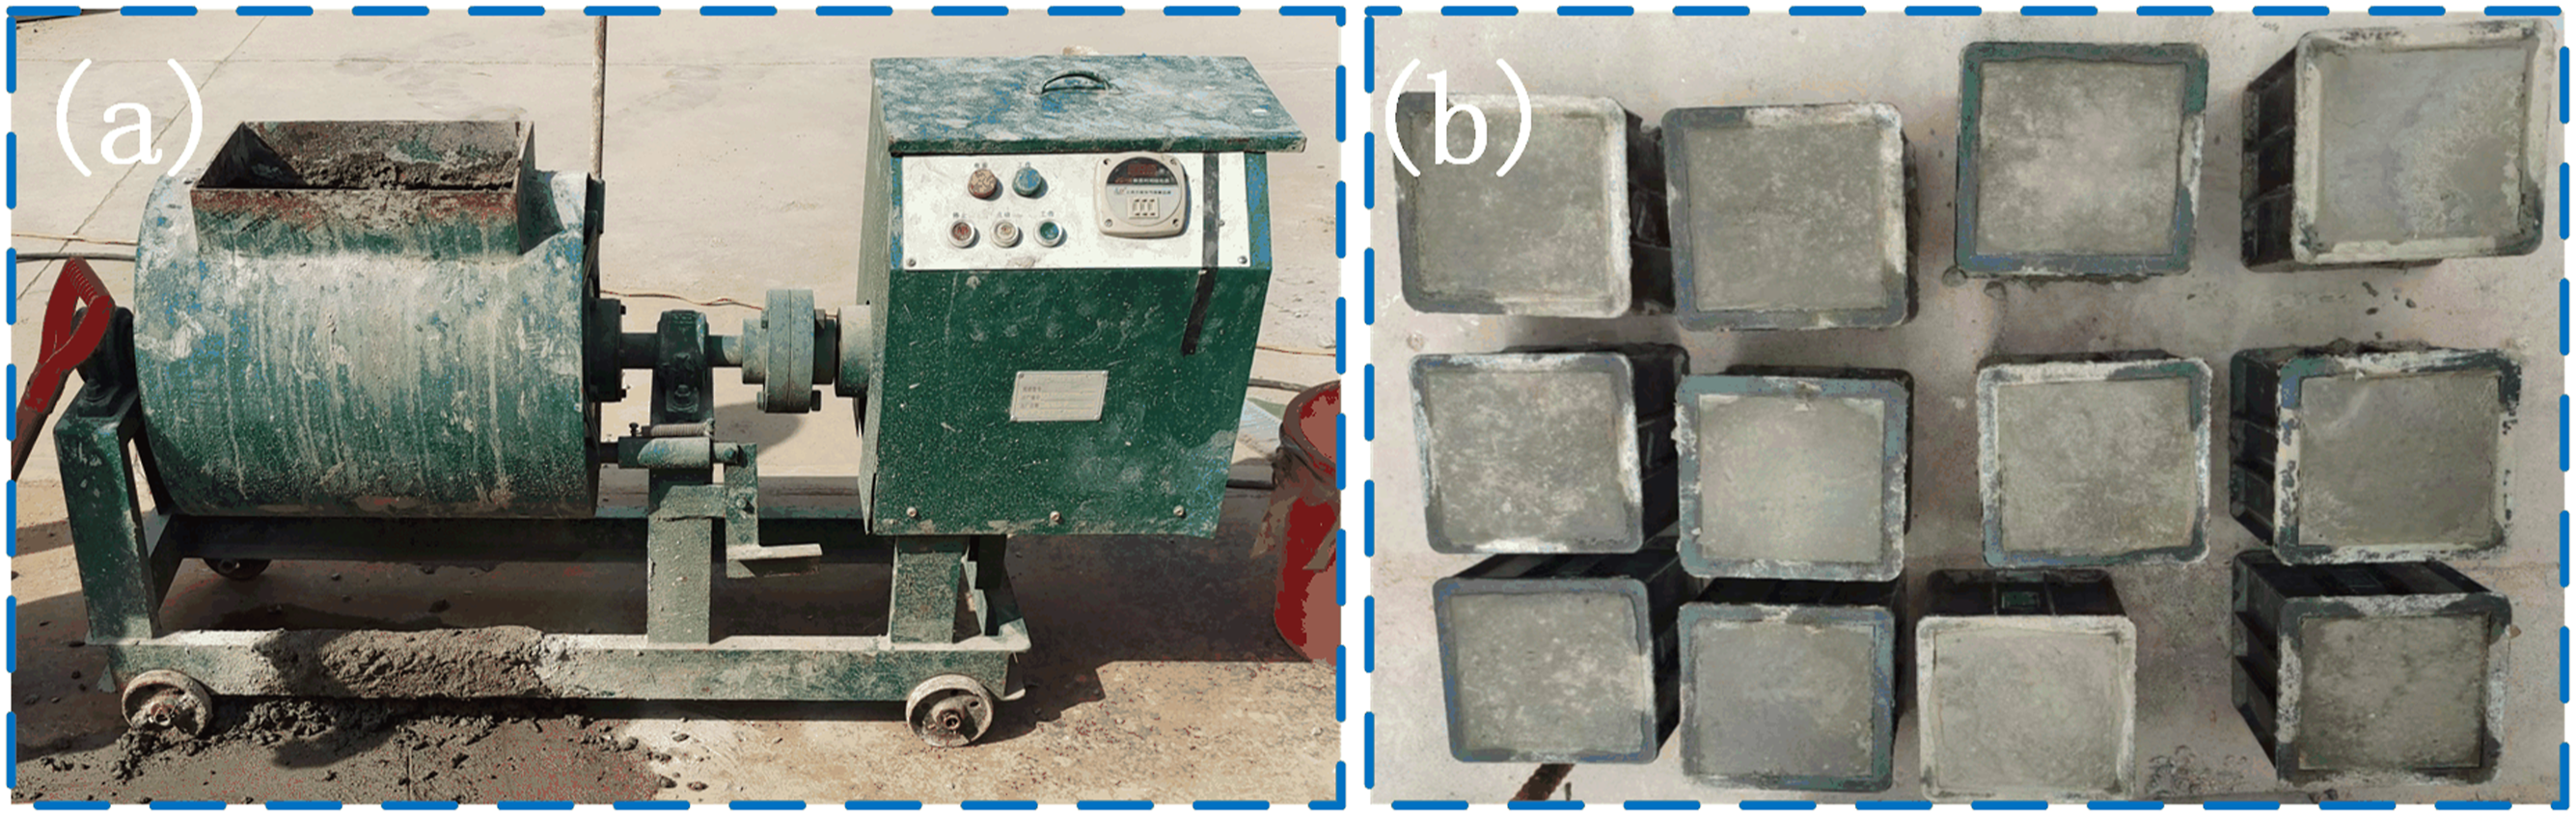
Macroscopic test
In order to understand the influence of the mechanical properties of SBL/PVA composite concrete, compressive, shear and flexural tests were carried out on the composite concrete samples that reached the curing target period (7 days and 28 days). The relevant mechanical property tests were conducted according to the standard “Test Methods for Physical and Mechanical Properties of Concrete” (GB/T50081-2019). As shown in Figure 5(a), Y250 digital electric stress type direct shear instrument was used for the cube compressive strength test, and the size of the test block was 100 mm × 100 mm × 100 mm. As shown in Figure 5(b), DKZ-5000 electric bending testing machine was used to test the shear strength of concrete, and the test block size was 150 mm × 150 mm × 150 mm. As shown in Figure 5(c), the folding strength of the test block adopts DKZ-5000 electric bending testing machine, the size of the test block is 40 mm × 40 mm × 160 mm, and the working principle of each instrument has been reflected in Figure 5. Macroscopic mechanical properties test of test block.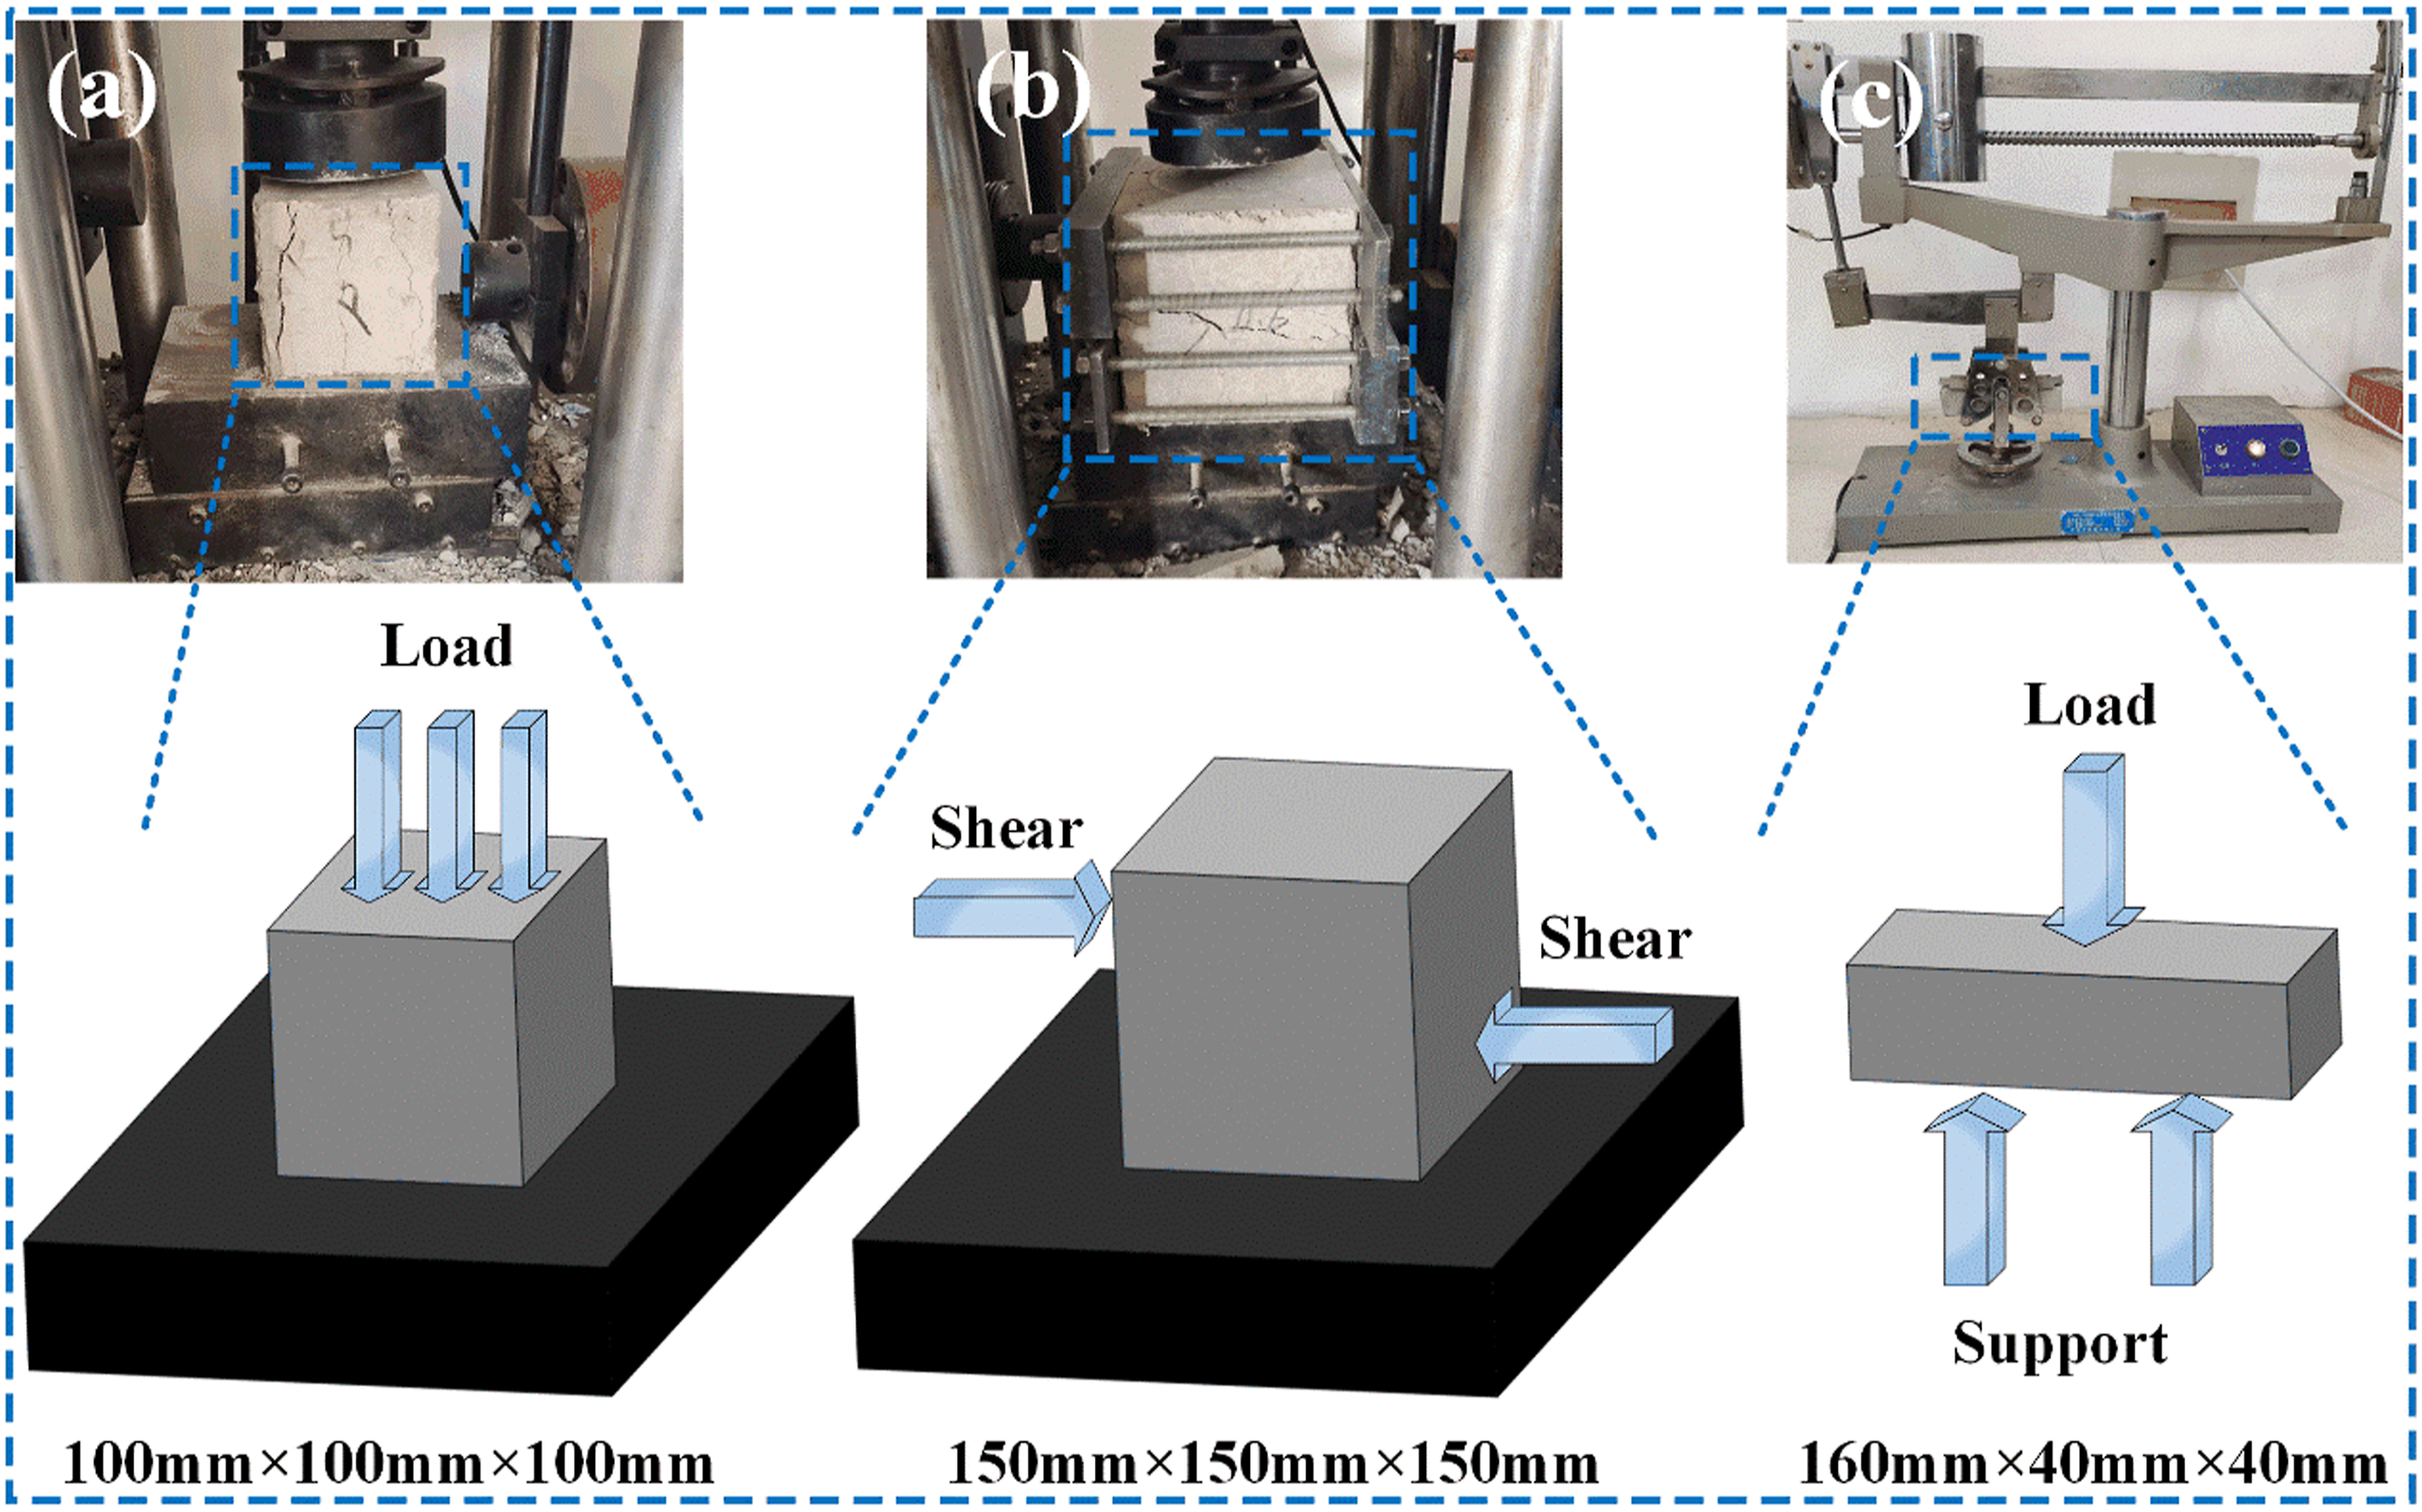
Microscopic analysis
Scanning electron microscope (SEM)
Cut the sample that has not cured to the specified time into 10 mm × 10 mm × 10 mm cubes. After that, the samples were polished with 2000 mesh sandpaper and soaked with anhydrous ethanol to terminate the hydration reaction. Then the samples were dried in a vacuum drying oven at 40°C for 24 h and filtered by wind. Finally, the samples were fixed on the sample table for vacuum gold-plating. The interface morphology of SBL/cement and PVA fiber/cement substrate was observed by SEM. The equipment was a quantum FEG series scanning electron microscope produced by Beijing Jotun Technology Co.
X-ray diffraction (XRD)
In order to determine the phase composition and content of SBL and PVA composites, XRD analysis was performed on the samples stored for 28 days. The non-directly stressed PVA concrete (PC), PVA0.15/SBL0.6, PVA0.15/SBL0.9, PVA0.15/SBL1.2 chips were placed in anhydrous ethanol for 48h to terminate the hydration. The soaked chips were ground into powder suitable for diffraction experiments, and dried in a vacuum drying oven at 50°C for 24 h, and the sample powder was made into a 15 mm × 15 mm flat test piece. Finally, the sample was put into a scientific Miniflex 600 desktop X-ray powder diffractometer of Hangzhou Lemay Technology Co.
Fourier transform infrared spectroscopy (FT-IR) test
The addition of SBL will produce a series of reactions with the hydration products of cement, and the chemical action of SBL in the hydration process of cement needs to be further analyzed. The damaged test blocks of PVA concrete (PC), PVA0.15/SBL0.6, PVA0.15/SBL0.9 and PVA0.15/SBL1.2 were respectively ground into tiny powder, dried in vacuum for 24 h, and then put into the equipment for observation. The device is the PerkinElmer PE Spectrum Two infrared spectrometer.
Molecular simulation
Computational model
All models were simulated using materials studio 2020 software. Calcium silicate hydrate (C-S-H) gel, as the main cementing phase of concrete materials, accounts for 70% to 70% of the hydration products of cement, and is the source of the gelling force of concrete materials, which has an important impact on the performance of cement and concrete.
19
The Tobermorite molecular structure model can match the actual C-S-H parameters well,
20
and it has been demonstrated that the model can well predict the physical and mechanical properties of C-S -H physical and mechanical properties.21,22 Therefore, we first derived the initial model of 1.1 nm Tobermolite from the inorganic crystal library. The nanopore is then cut, expanded, and combined along the crystal face [0 0 1], and one side of the C-S-H substrate is about 11.0 Å thick. As shown in Figure 6(i), it was placed in a lattice with dimensions a = 20.20 Å, b = 20.20 Å, c = 11.00 Å, τ = 90°, and τ = 90°, and the thickness of the upper vacuum layer is 0 Å. The gel hole was constructed as a cement substrate model using this plane. The five PVA monomers were built polymer as shown in Figure 6(e) to form the molecular chain as shown in Figure 6(f), each molecular chain has 30 monomers, and then Amorphous cell was formed as shown in Figure 6(h), with dimensions of a = 20.20 Å, b = 20.20 Å, c = 20.87 Å, and τ = 90°. The SBL model selected an amorphous cell with a density of 1.01 g/cm3. The styrene monomer as shown in Figure 6(a), butadiene monomer as shown in Figure 6(b), ammonium persulfate monomer as shown in Figure 6(c) and acrylic monomer as shown in Figure 6(d) carried the Amorphous cell as shown in Figure 6(g) according to 62:30:4:4, with dimensions of a = 20.20 Å, b = 20.20 Å, c = 20.87 Å, and τ = 90°. In order to compare and analyze the effect of SBL on the adsorption behavior of PVA/C-S-H at the interface, two initial models were constructed: the initial model of undoped SBL and the initial model of doped SBL. The initial model of undoped SBL was built layers by PVA as shown in Figure 6(h) and C-S-H as shown in Figure 6(i) to form PVA/CSH6 model as shown in Figure 6(j). The initial model of doping SBL was built layers by SBL as shown in Figure 6(g), PVA as shown in Figure 6(h) and C-S-H as shown in Figure 6(i) to form SBL/PVA/CSH model as shown in Figure 6(k). Modeling of the PVA/C-S-H(j) interface Model and PVA/SBL/C-S-H(k) interface Model.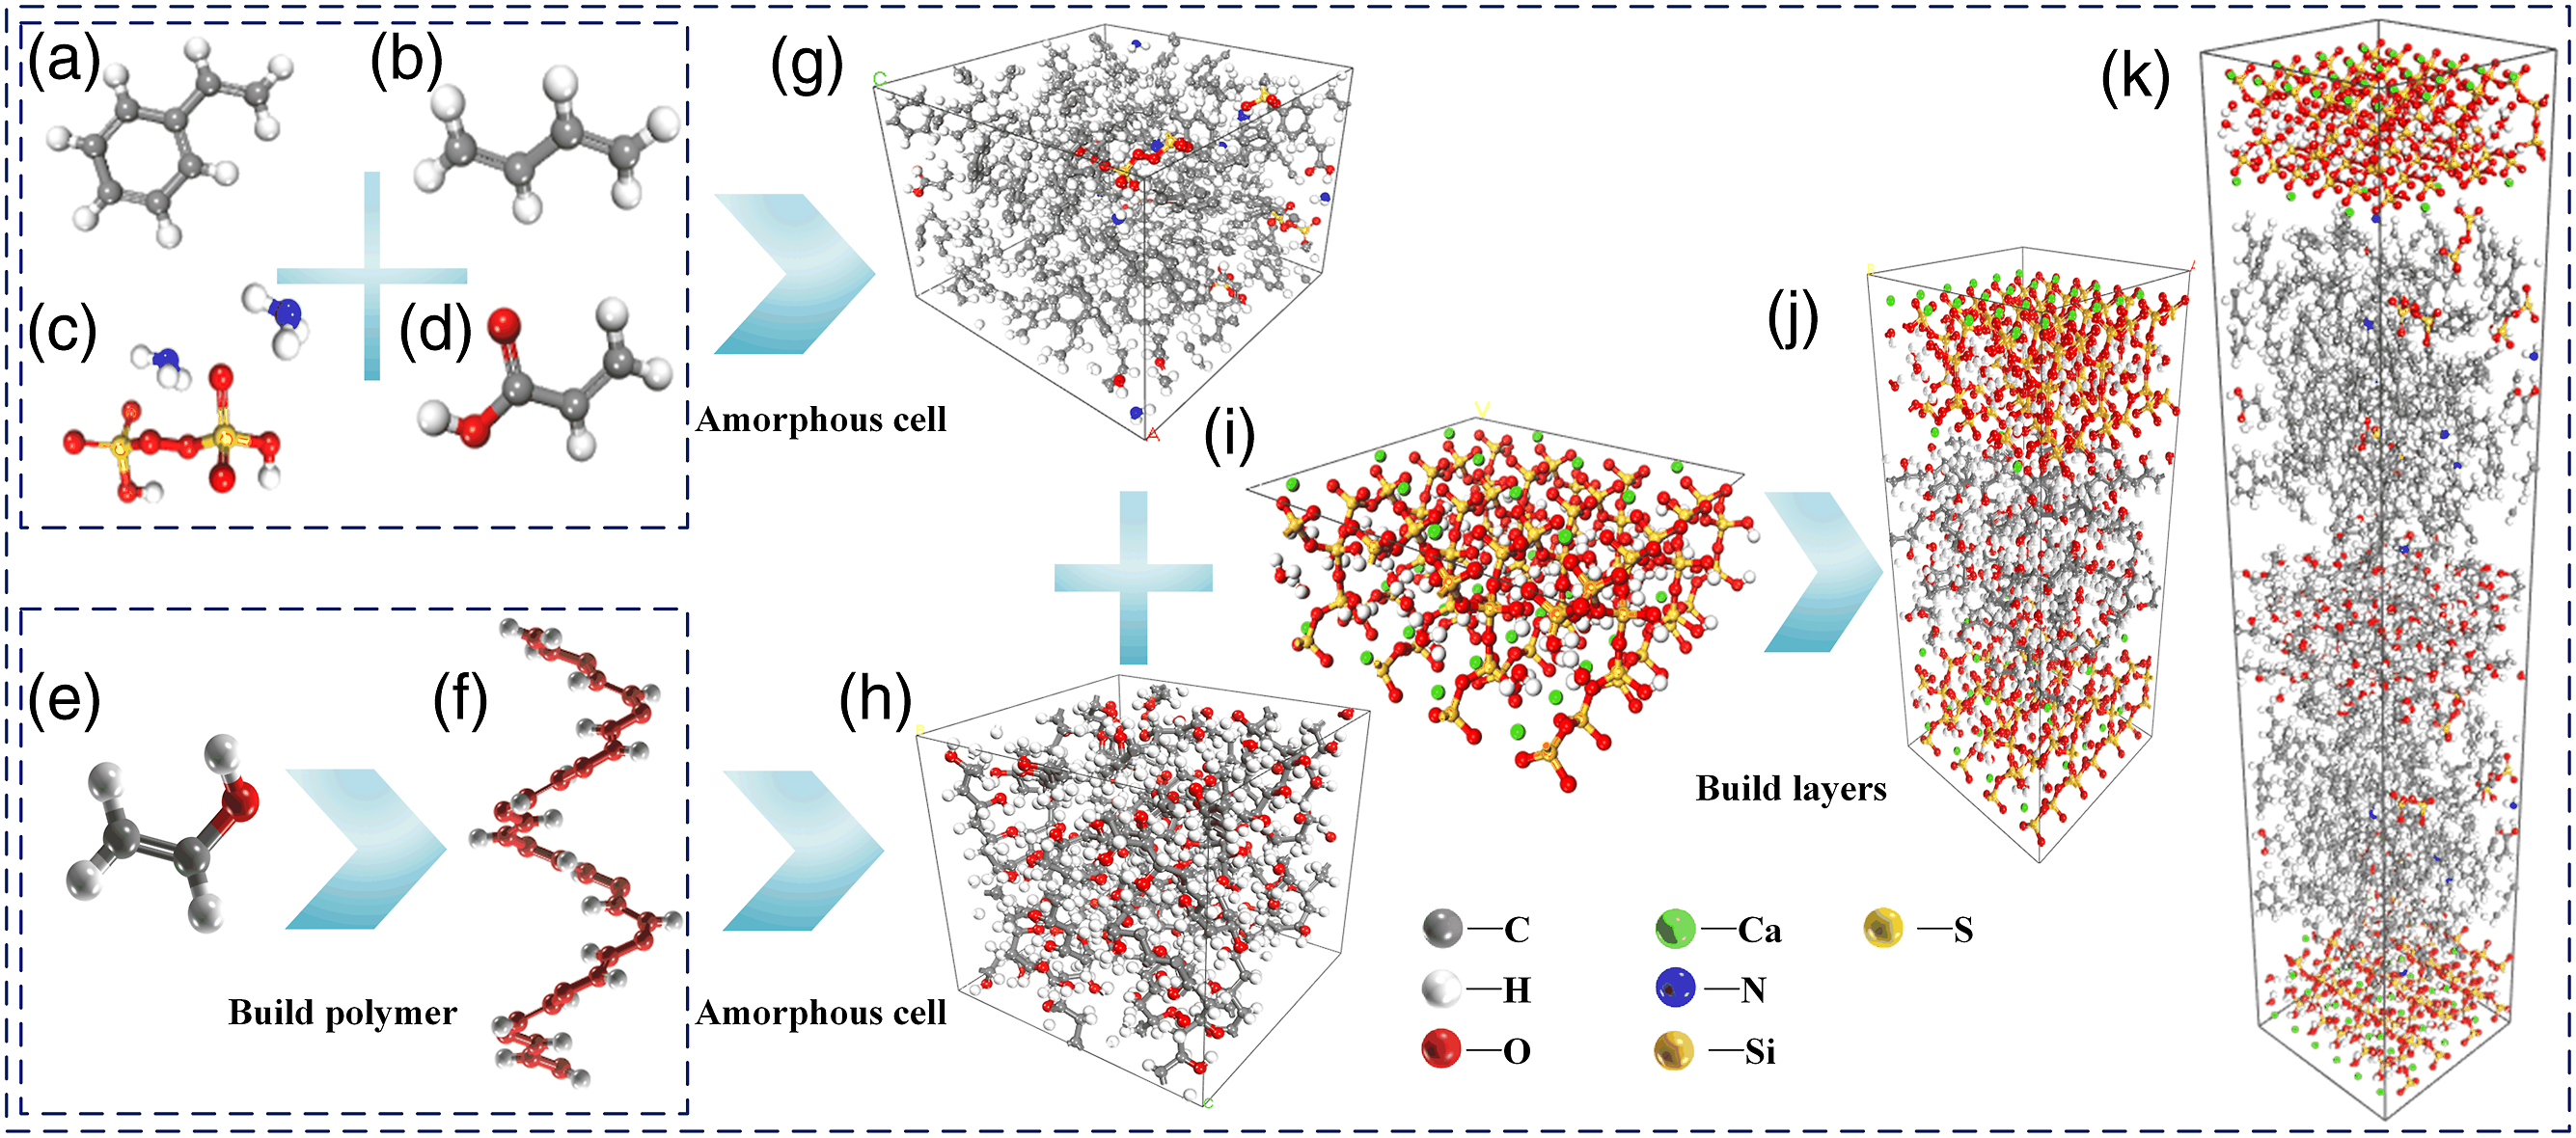
Force fields and simulation details
As COMPASS force field has been widely used in C-S-H gel model, experiments have proved that COMPASS force field is in good agreement with experimental data and can be applied to the simulation of cement hydration products. 23 Therefore, COMPASS force field is used in this molecular dynamics experimental model. 24 In this study, three interface models are simulated. Isothermal and isobaric (NPT) balanced operation with 200ps and 1fs time steps allows the system to move from the initial state to a more balanced state, achieving stable density and volume at the target temperature. Then another molecular dynamics experiment was carried out by constant volume temperature measurement (NVT) with relaxation time of 1ns, and dynamic simulation with time step of 1fs and total time of 1ns was performed. The target volume is reduced, the system reaches a steady state close to the real density, and the final trajectory file is obtained. During this process, Nose-Hoover Langevin (NHL) and Andersen are used to maintain the target temperature and pressure in the system. Notably, temperature and density reached stable values during NPT and NVT, proving that the relaxation time was sufficient.
Simulation calculation
The stability of the interface structure depends not only on the material properties of each component, but also on the interaction of each component at the interface. In order to understand the interaction mechanism of the interface model, the binding energy, relative concentration, radial distribution function, mean square displacement and time correlation function of the interface were calculated.
Results and discussion
Macroscopic mechanical properties
In order to study the mechanical properties of specimens with different mix ratios, a group of blank control PVA concrete (PC) and nine specimens with different mix ratios were set up for macroscopic mechanical tests to ensure that the test results were generally representative. The test results are as follows.
Figure 7 shows the failure results of compressive tests for 7 days and 28 days of concrete with different contents of SBL/PVA. The statistical results of compressive properties of concrete with different contents of SBL/PVA were compared with those of PC group. It can be found that under the same SBL parameter, the 7-days and 28-days compressive strength of concrete decreases obviously with the increase of PVA parameter. However, under the same PVA parameters, the compressive strength of PVA concrete increases obviously with the increase of SBL parameters. It shows that the addition of SBL can make up for the defect of PVA concrete compressive strength reduction. When PVA parameter is 0.1 and SBL parameter is 1.2, the compressive strength of the specimen increases most obviously, which increases by 3% at 7 days and 5.6% at 28 days. Compressive strength at different mix ratios.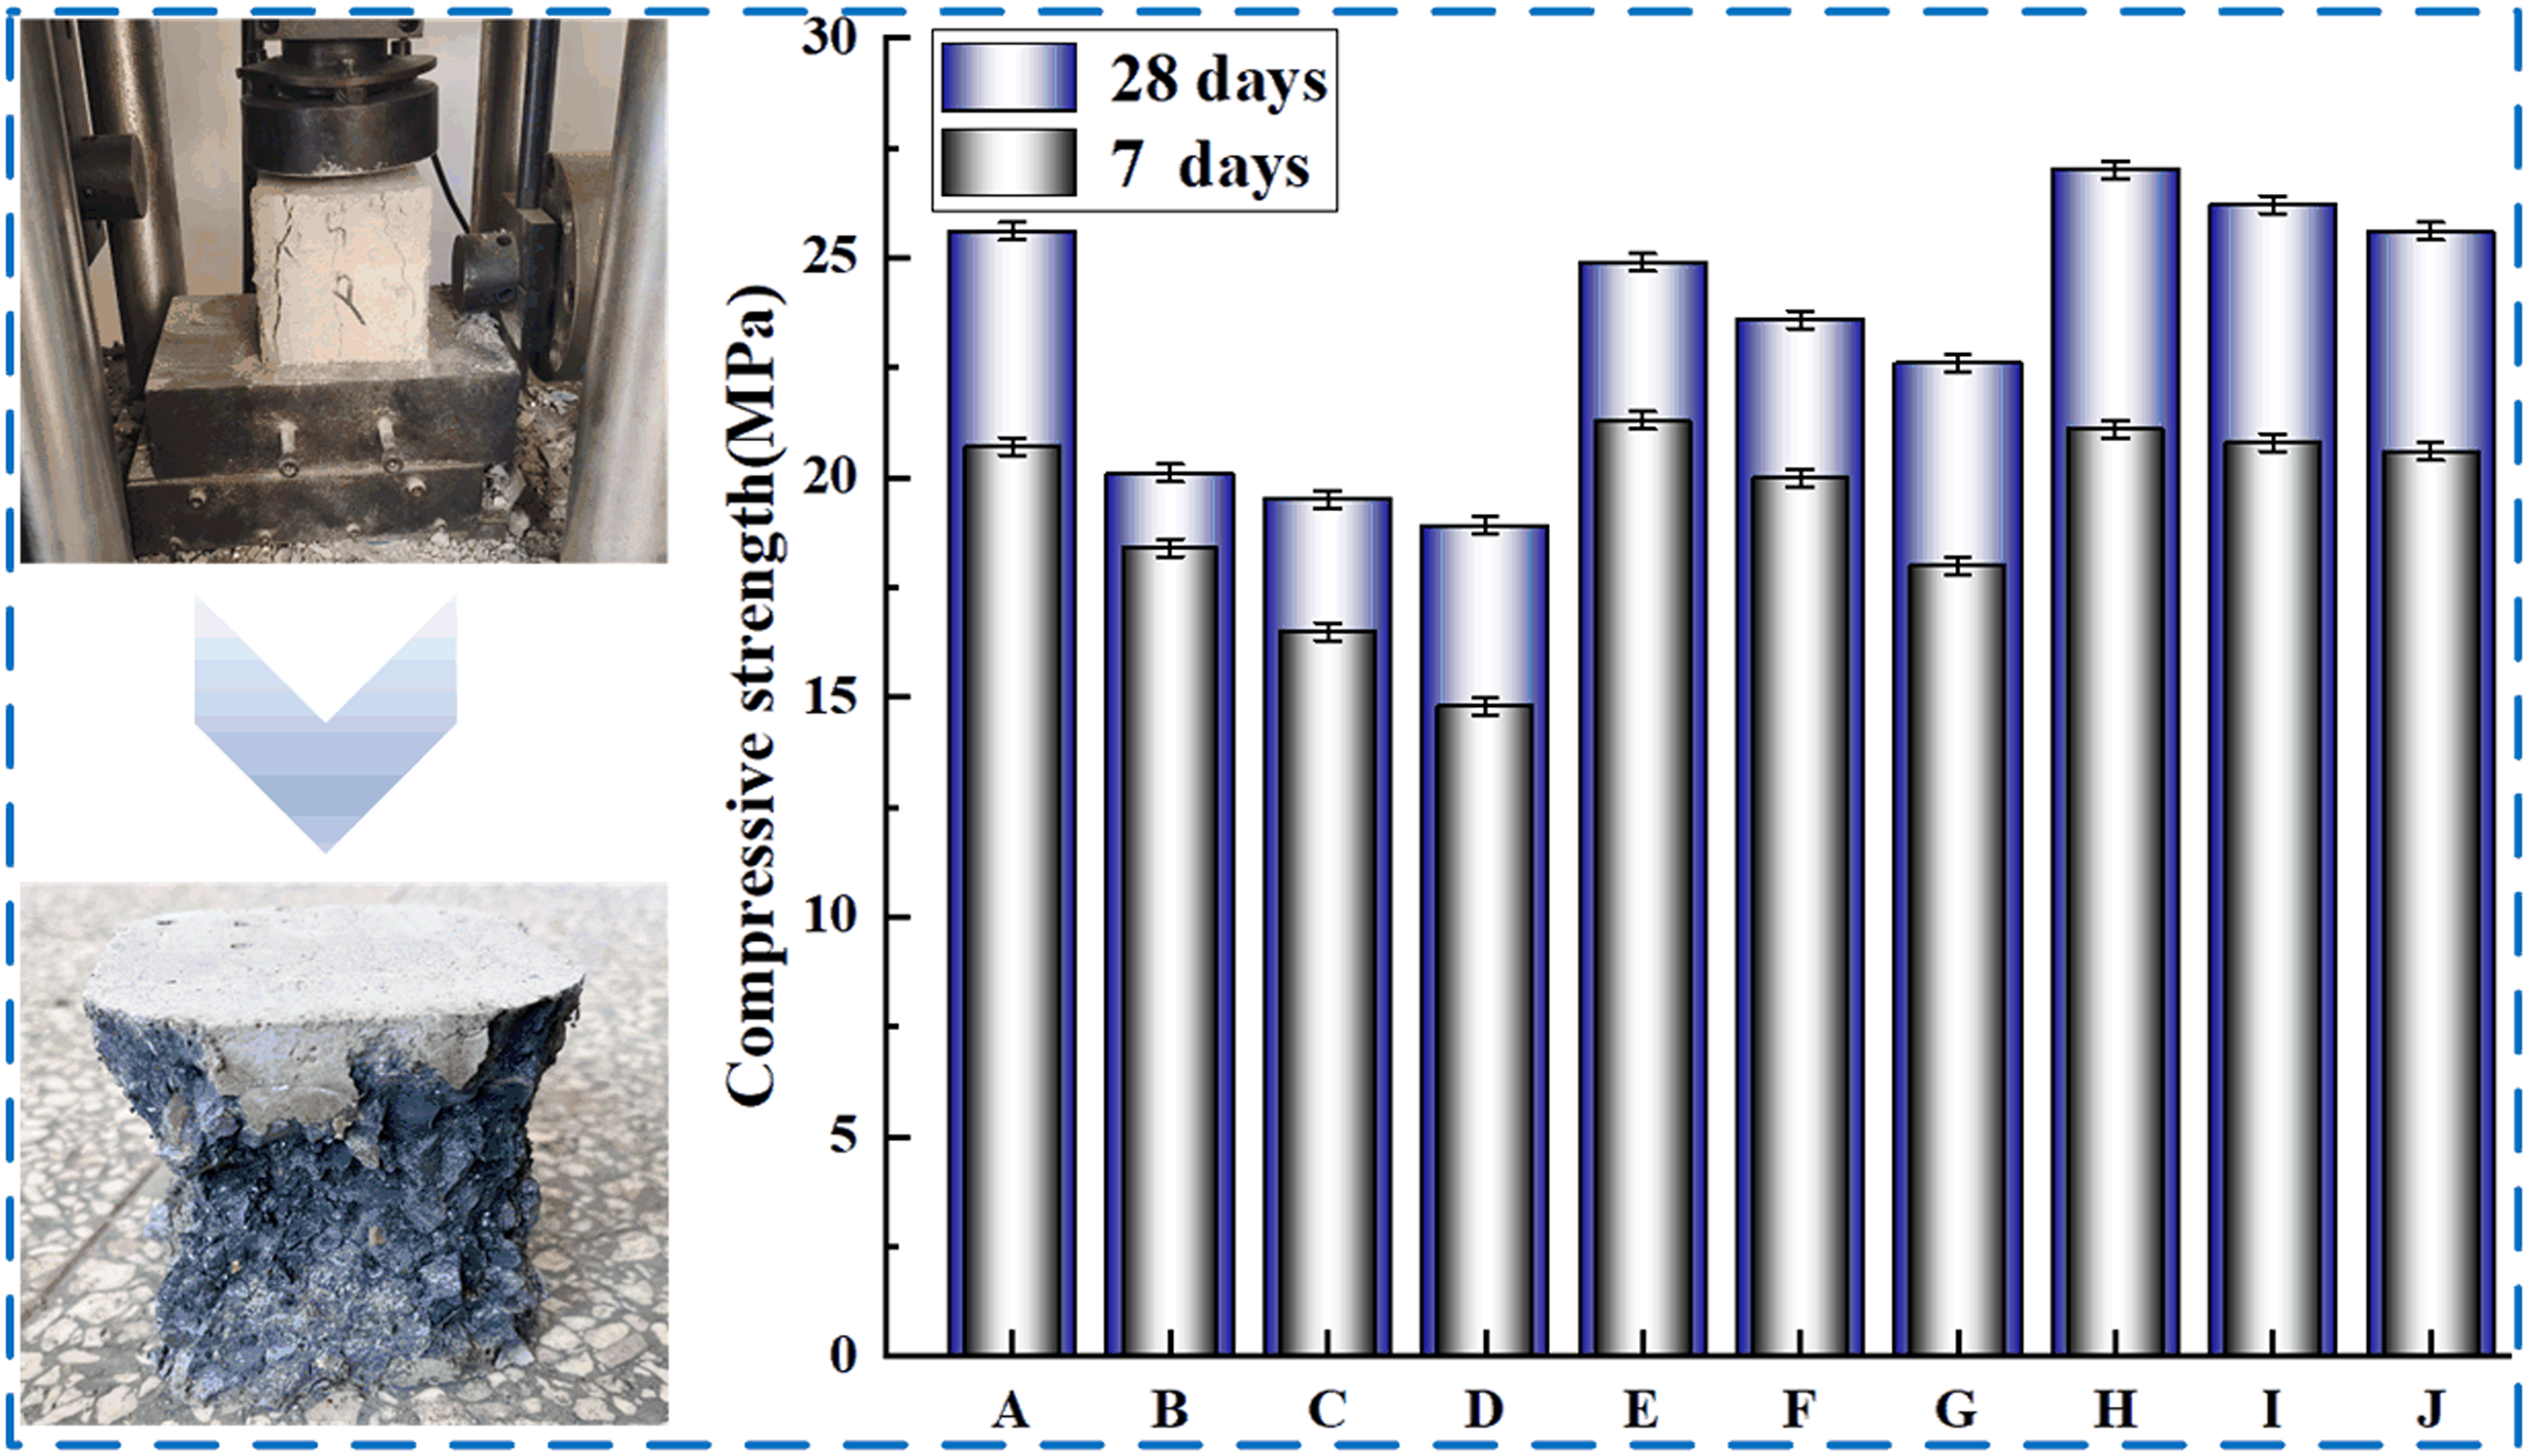
The shear test results of SBL/PVA concrete at 7 and 28 days are shown in Figure 8. Compared with PC group, it can be found that the higher the parameter of PVA, the more the 7-days and 28-days shear strength of concrete increases. Similarly, with the increase of SBL parameters, the shear strength of PVA concrete will continue to increase. It shows that the addition of SBL can further improve the shear resistance of PVA concrete. When PVA parameter is 0.2 and SBL parameter is 1.2, the 7-days and 28-days shear strength of concrete is increased by 23% and 16%, respectively. Shear strength at different mix ratios.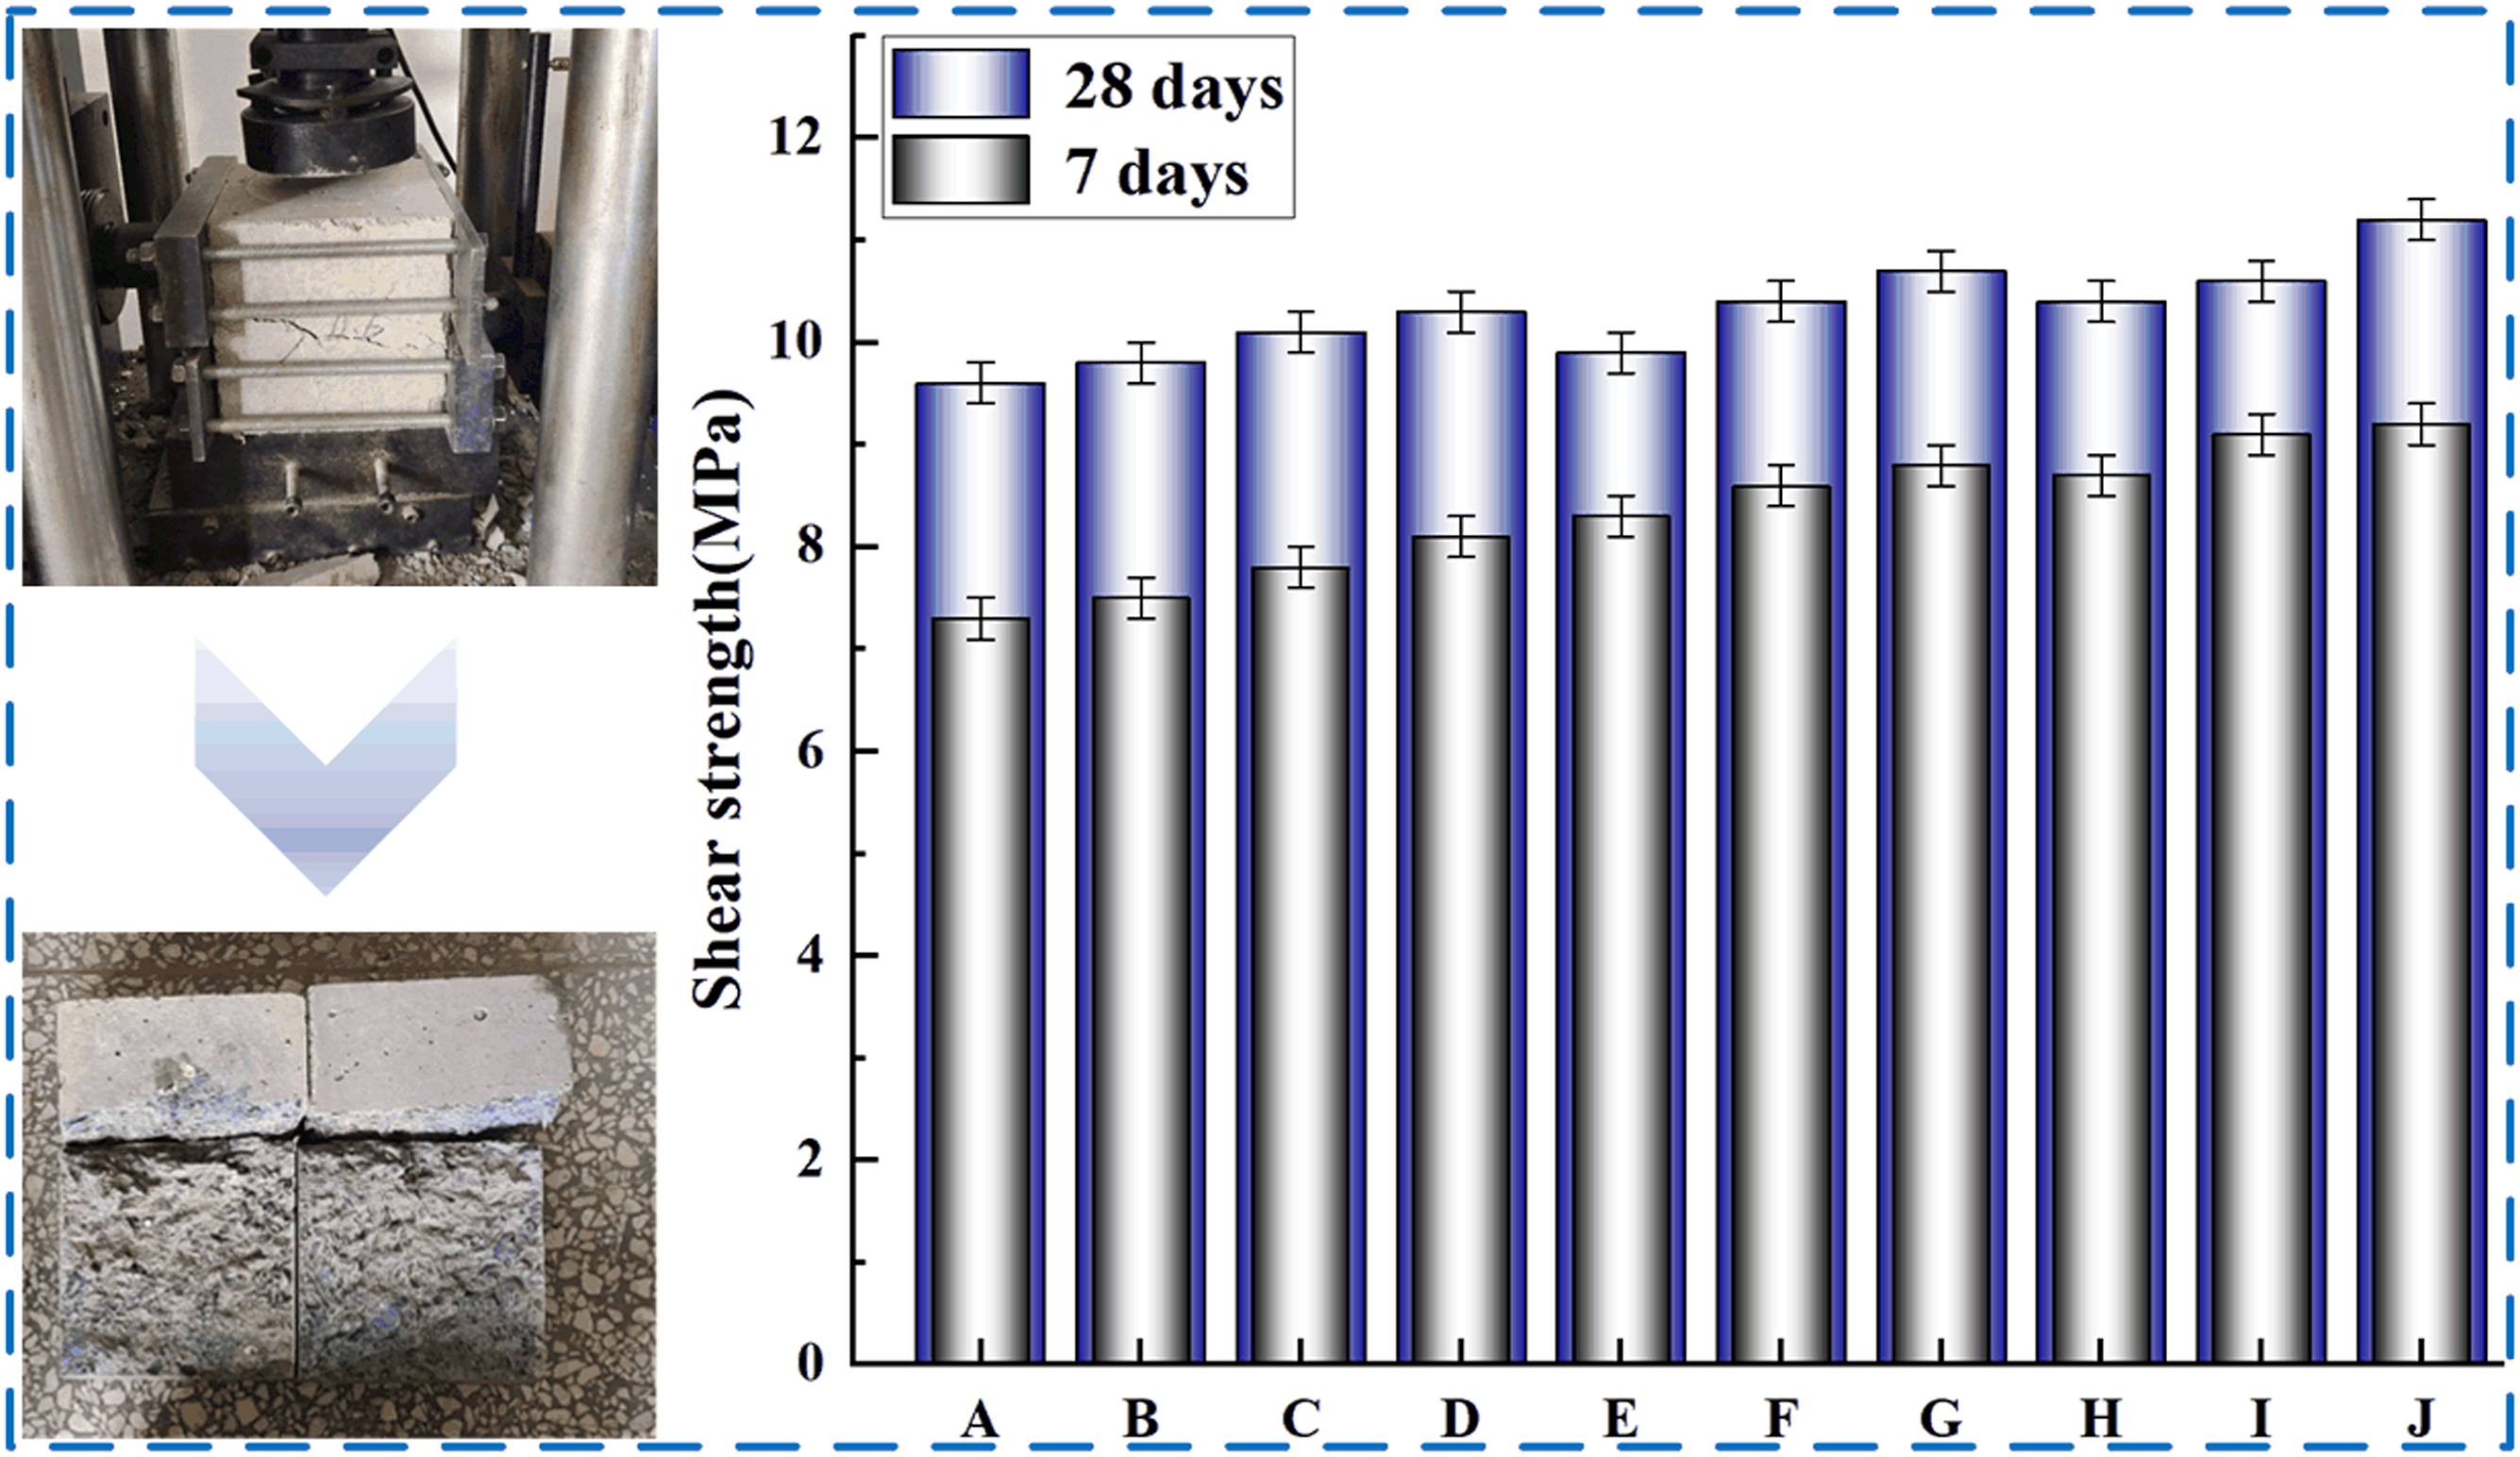
The flexural test results of SBL/PVA concrete at 7 and 28 days are shown in Figure 9. Similar to the results of shear test, the higher the parameter of PVA, the greater the 7-days and 28-days flexural strength of concrete. Similarly, with the increase of SBL parameters, the flexural strength of PVA concrete will continue to increase. It shows that the addition of SBL can further improve the flexural performance of PVA concrete. When PVA parameter is 0.2 and SBL parameter is 1.2, the 7-days and 28-days shear strength of concrete is increased by 24% and 19%, respectively. Flexural strength at different mixing ratios.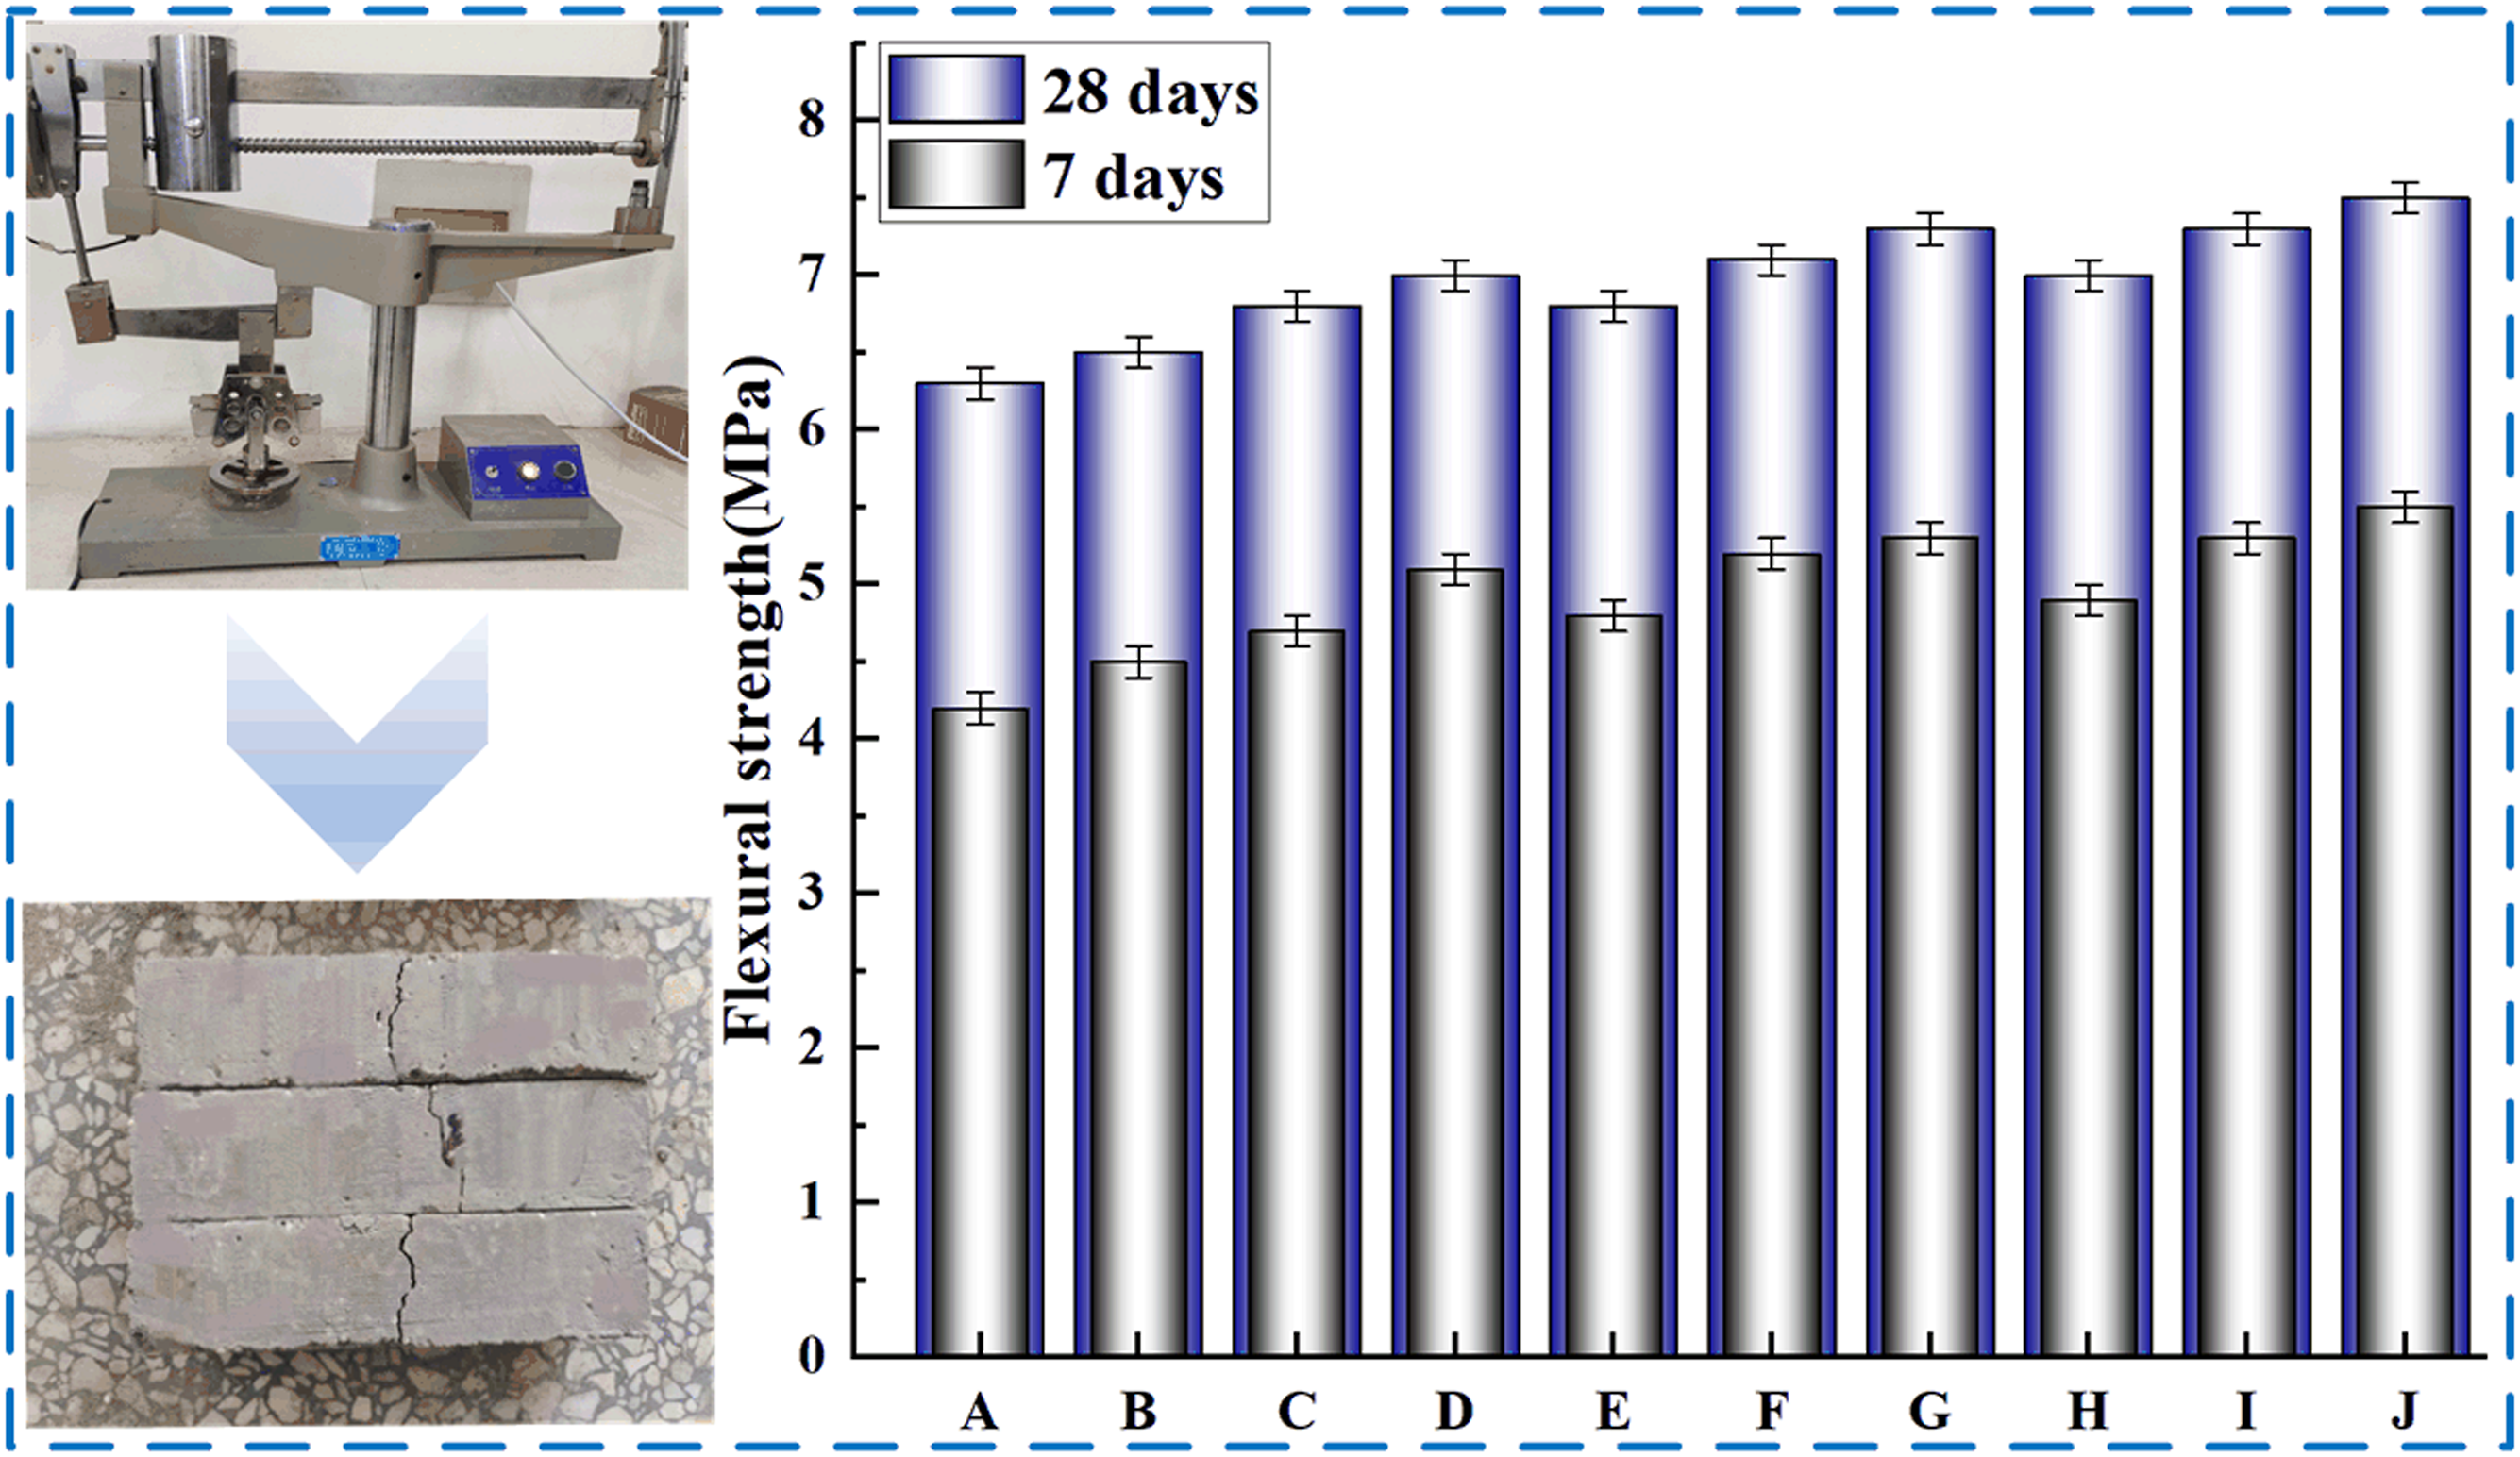
According to the above test results, the comprehensive mechanical strength of PVA concrete increases with the increase of SBL parameters. It is worth noting that the compression, shear and flexural properties of PVA concrete added with SBL are significantly improved. It is proved that SBL can reduce the brittle damage of PVA concrete and improve its toughness. In addition, it can be found that SBL improves the weak interface transition zone between PVA and cement matrix, and improves the mechanical properties of composite concrete. This hypothesis will be tested by SEM, XRD, FT-IR and MS simulations in the following chapters.
Microscopic test result
Scanning electron microscopy (SEM)
As shown in Figure 10(a), PVA traces left by PVA concrete with low parameter SBL after damage are smooth, and the interfacial gap between cement-based fiber and PVA fiber is larger. In contrast, as shown in Figure 10(b), after the PVA concrete with high parameter SBL is damaged, the PVA fibers are all embedded in the concrete and the surface is obviously rough. This shows that SBL and PVA fibers can form a close bond with cement base, which indirectly leads to the improvement of their mechanical properties. The results show that the adhesion between PVA fiber and cement slurry is improved by adding SBL. Scanning electron microscopy of the specimen with or without SBL.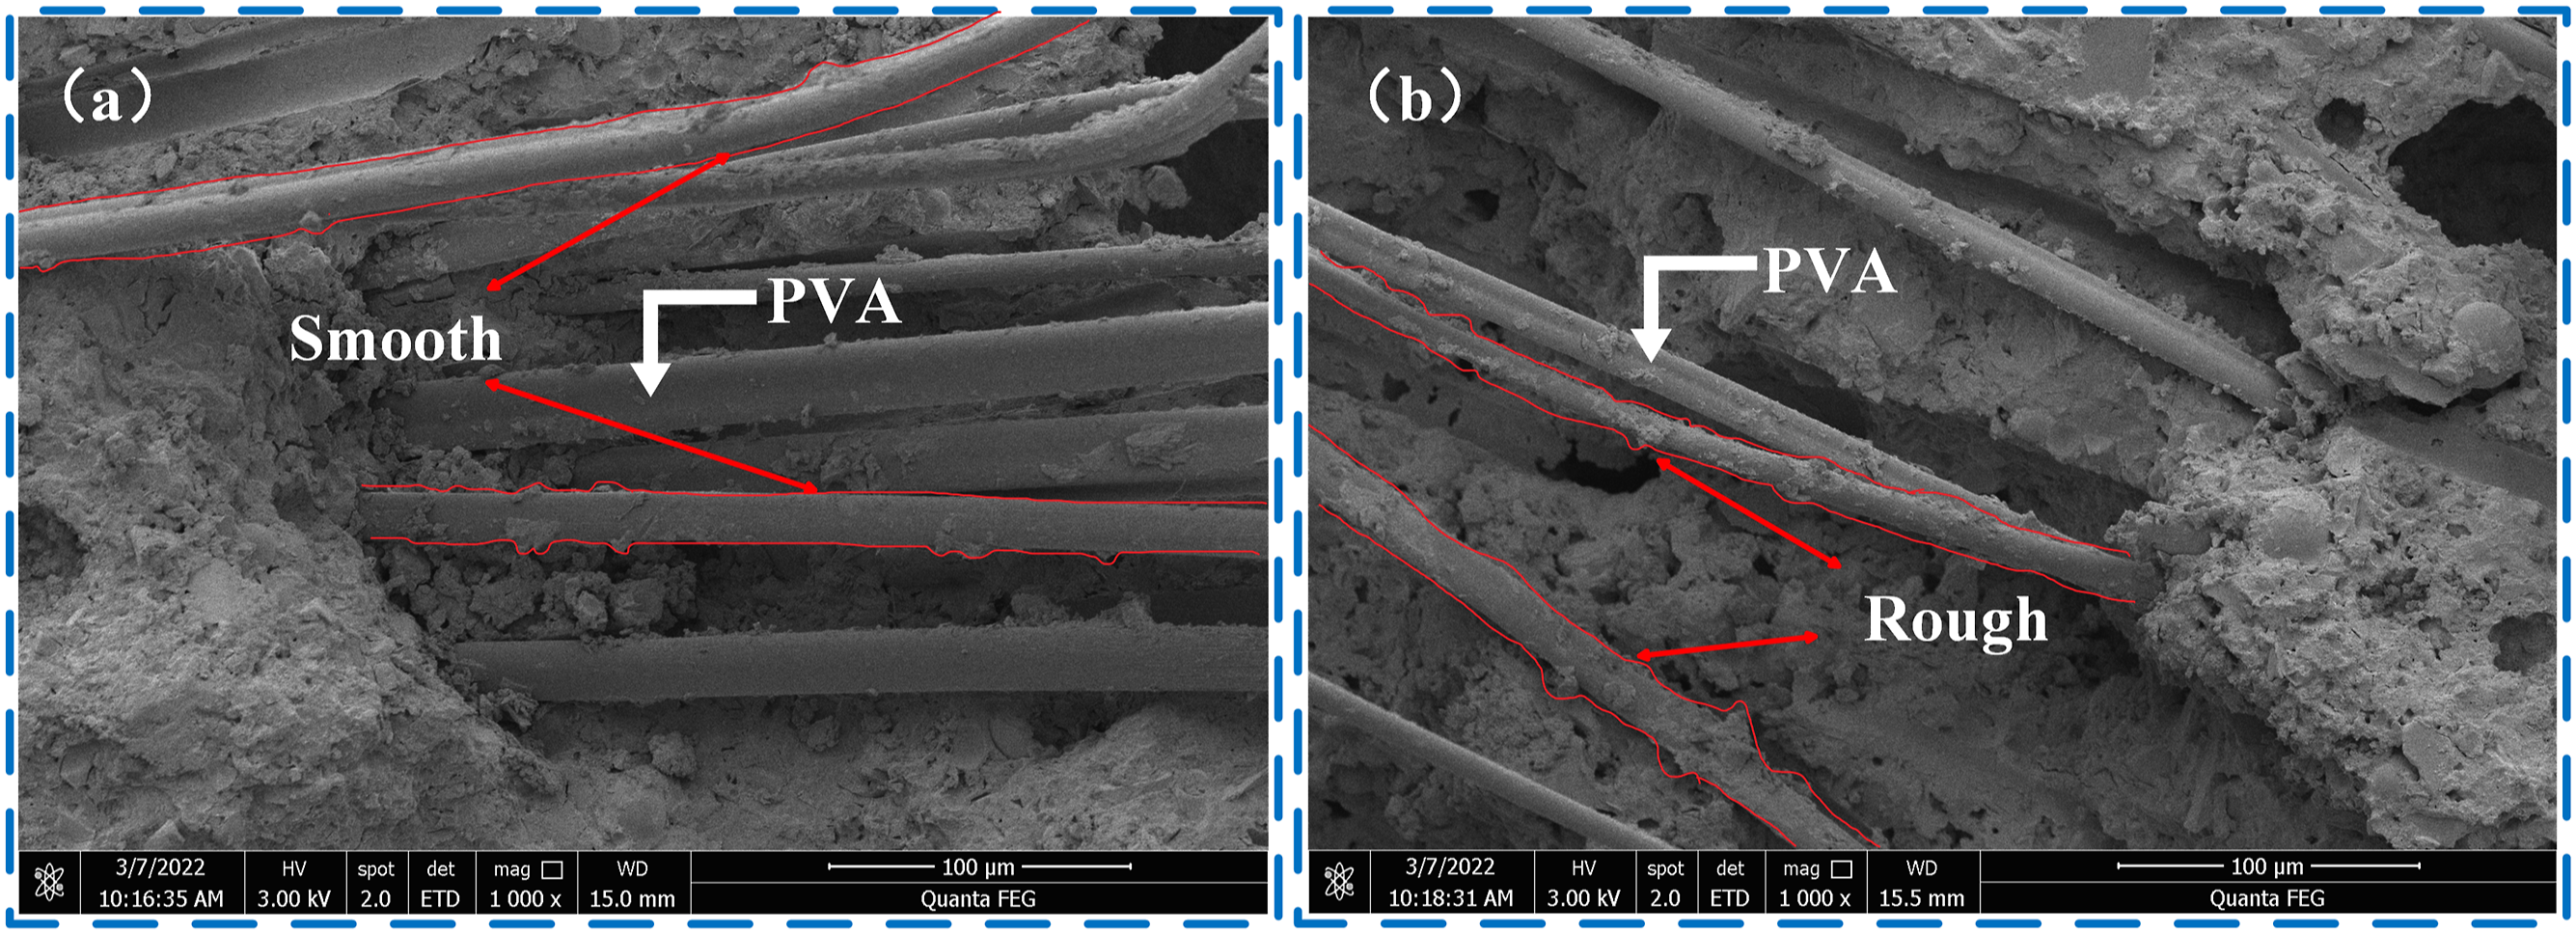
X-ray diffraction (XRD)
The presence of SBL at the cementing interface can be further verified by X-ray diffraction. As can be seen from Figure 11, after the addition of SBL, the short peak appears around 28°, and the absorption peak shape is similar to that of other parts, except that the intensity of the peak changes, indicating that SBL probably does not change the type of hydration products of the composite material, but only affects the content and crystallization of hydration products. It can also be seen that in the powder mixed with SBL, the characteristic peaks of hydrated homogeneous minerals (Alite, Belite) are higher, indicating that SBL delays the chemical reaction of cement. A short peak appears at 37°, which may be C-S-H gel with low crystallinity, indicating that the addition of SBL increases the amount of C-S-H gel, thereby increasing the interfacial density and optimizing the PVA/CSH interfacial strength, thereby increasing the mechanical properties of concrete. X-ray diffraction patterns of specimens with different fit ratios.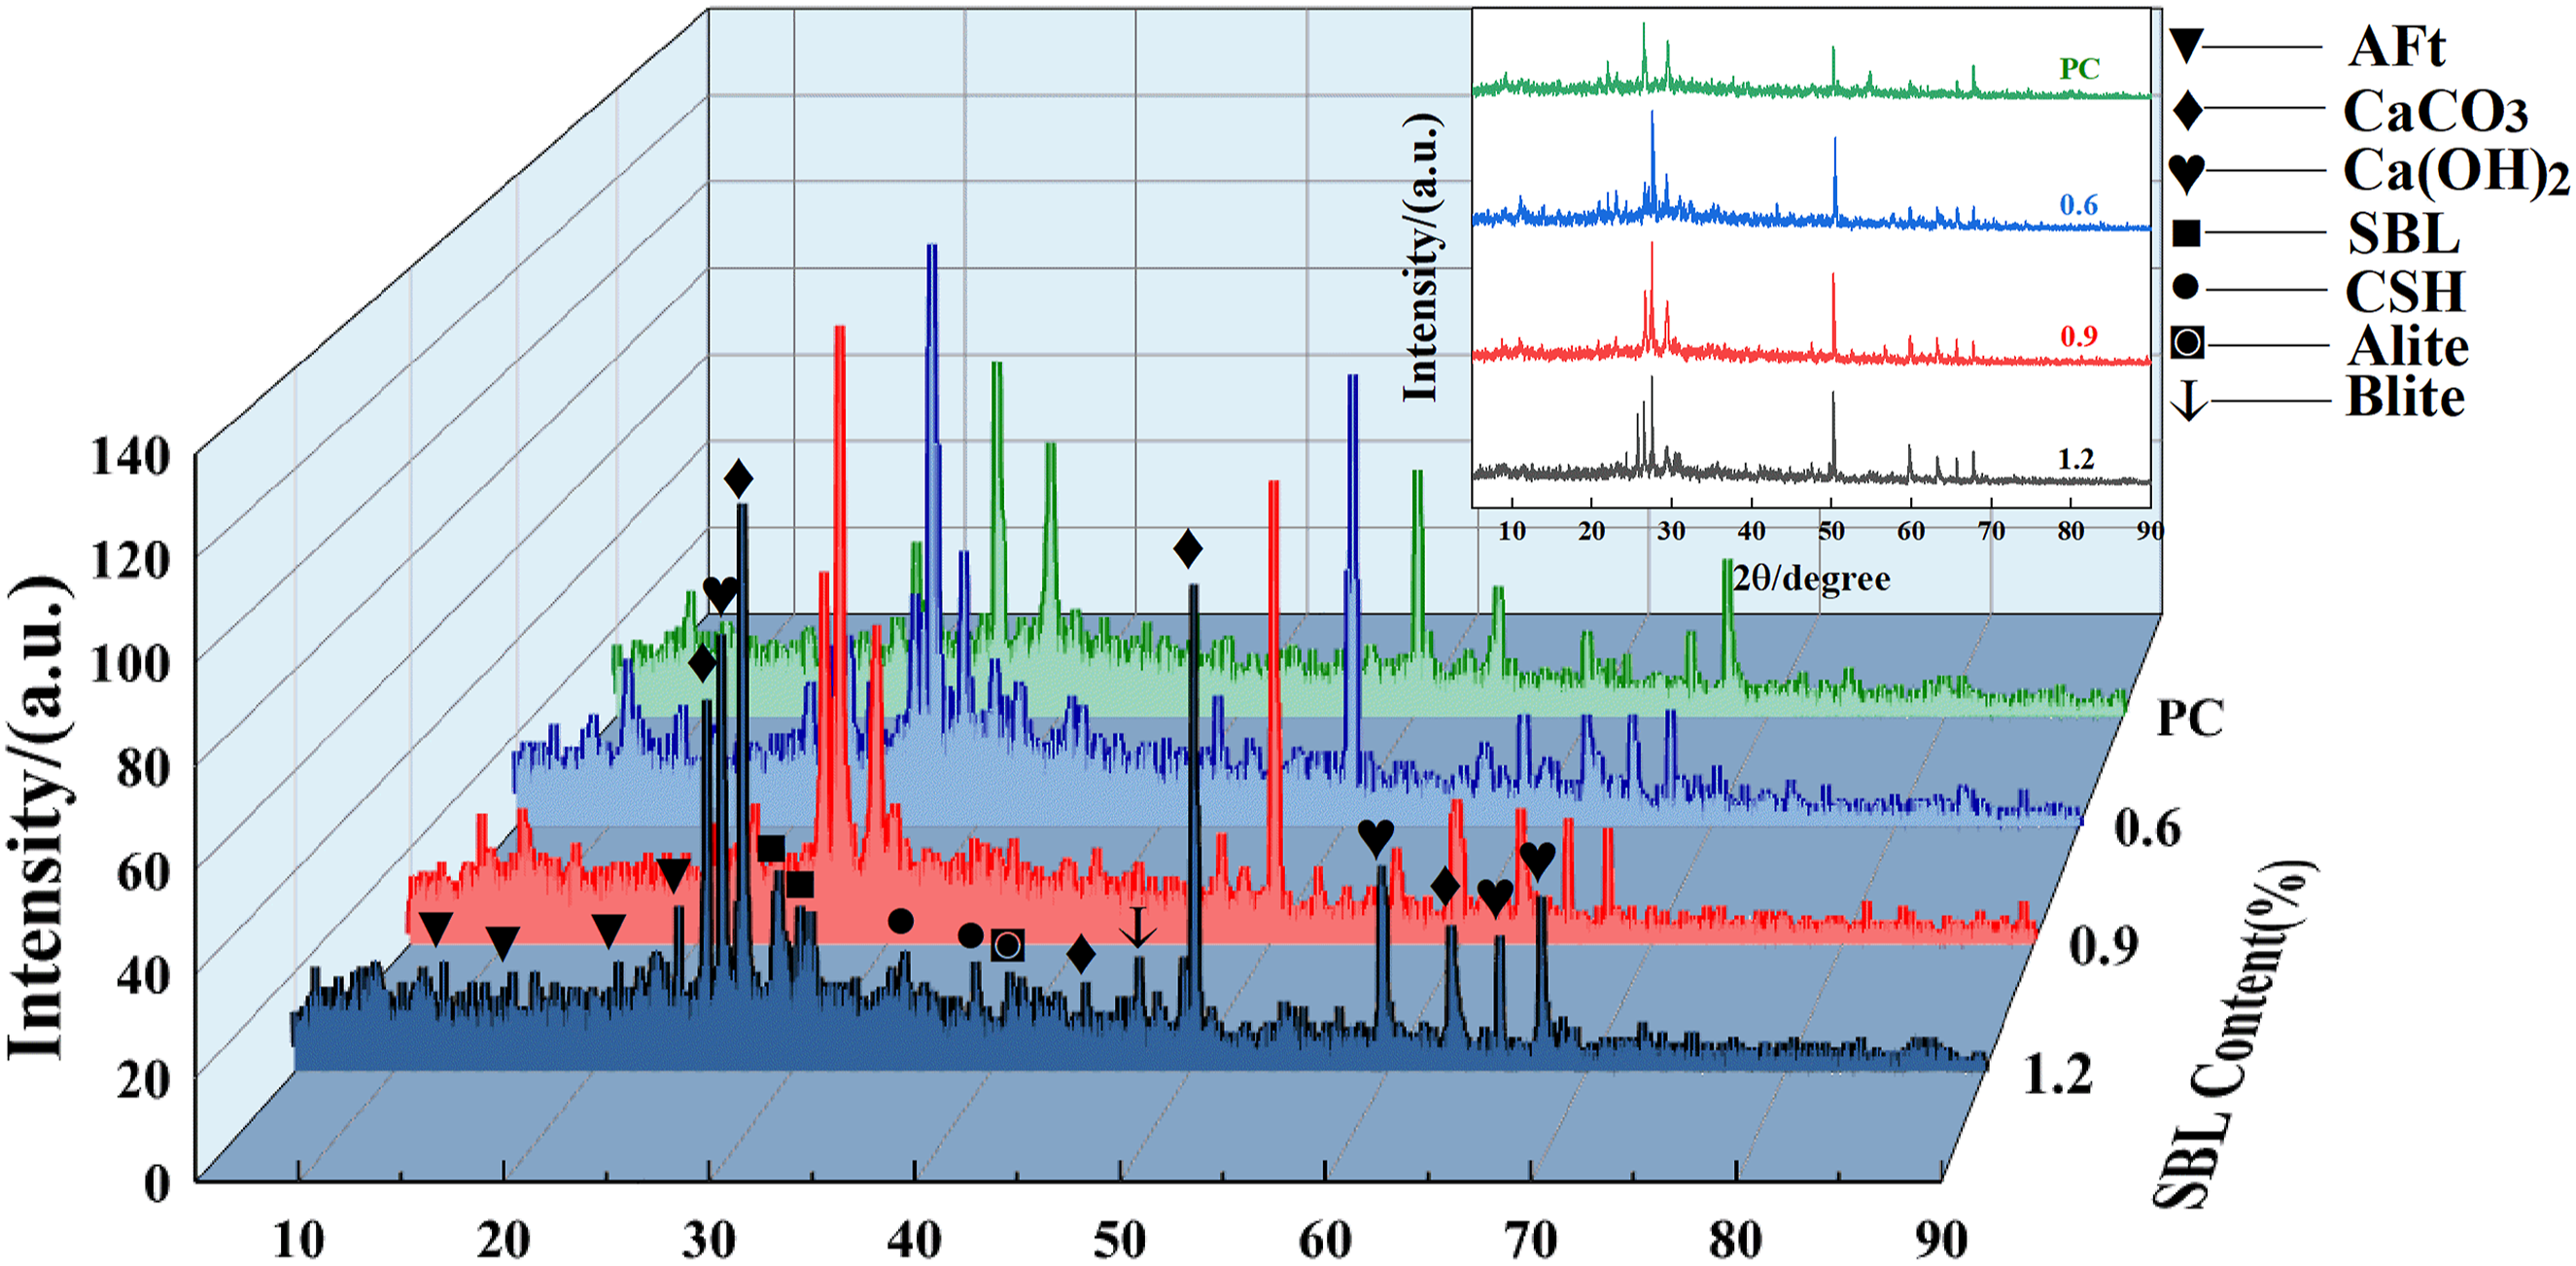
Fourier transform infrared spectroscopy (FT-IR)
It is not difficult to see from Figure 12 that the infrared spectral curves of PC and SBL/PVA with different parameters are similar, indicating that there is no chemical reaction between the addition of SBL and PVA at this time. It is worth noting that with the increase of SBL content, the vibration band of 2857 Infrared spectrum of the specimen with and without SBL.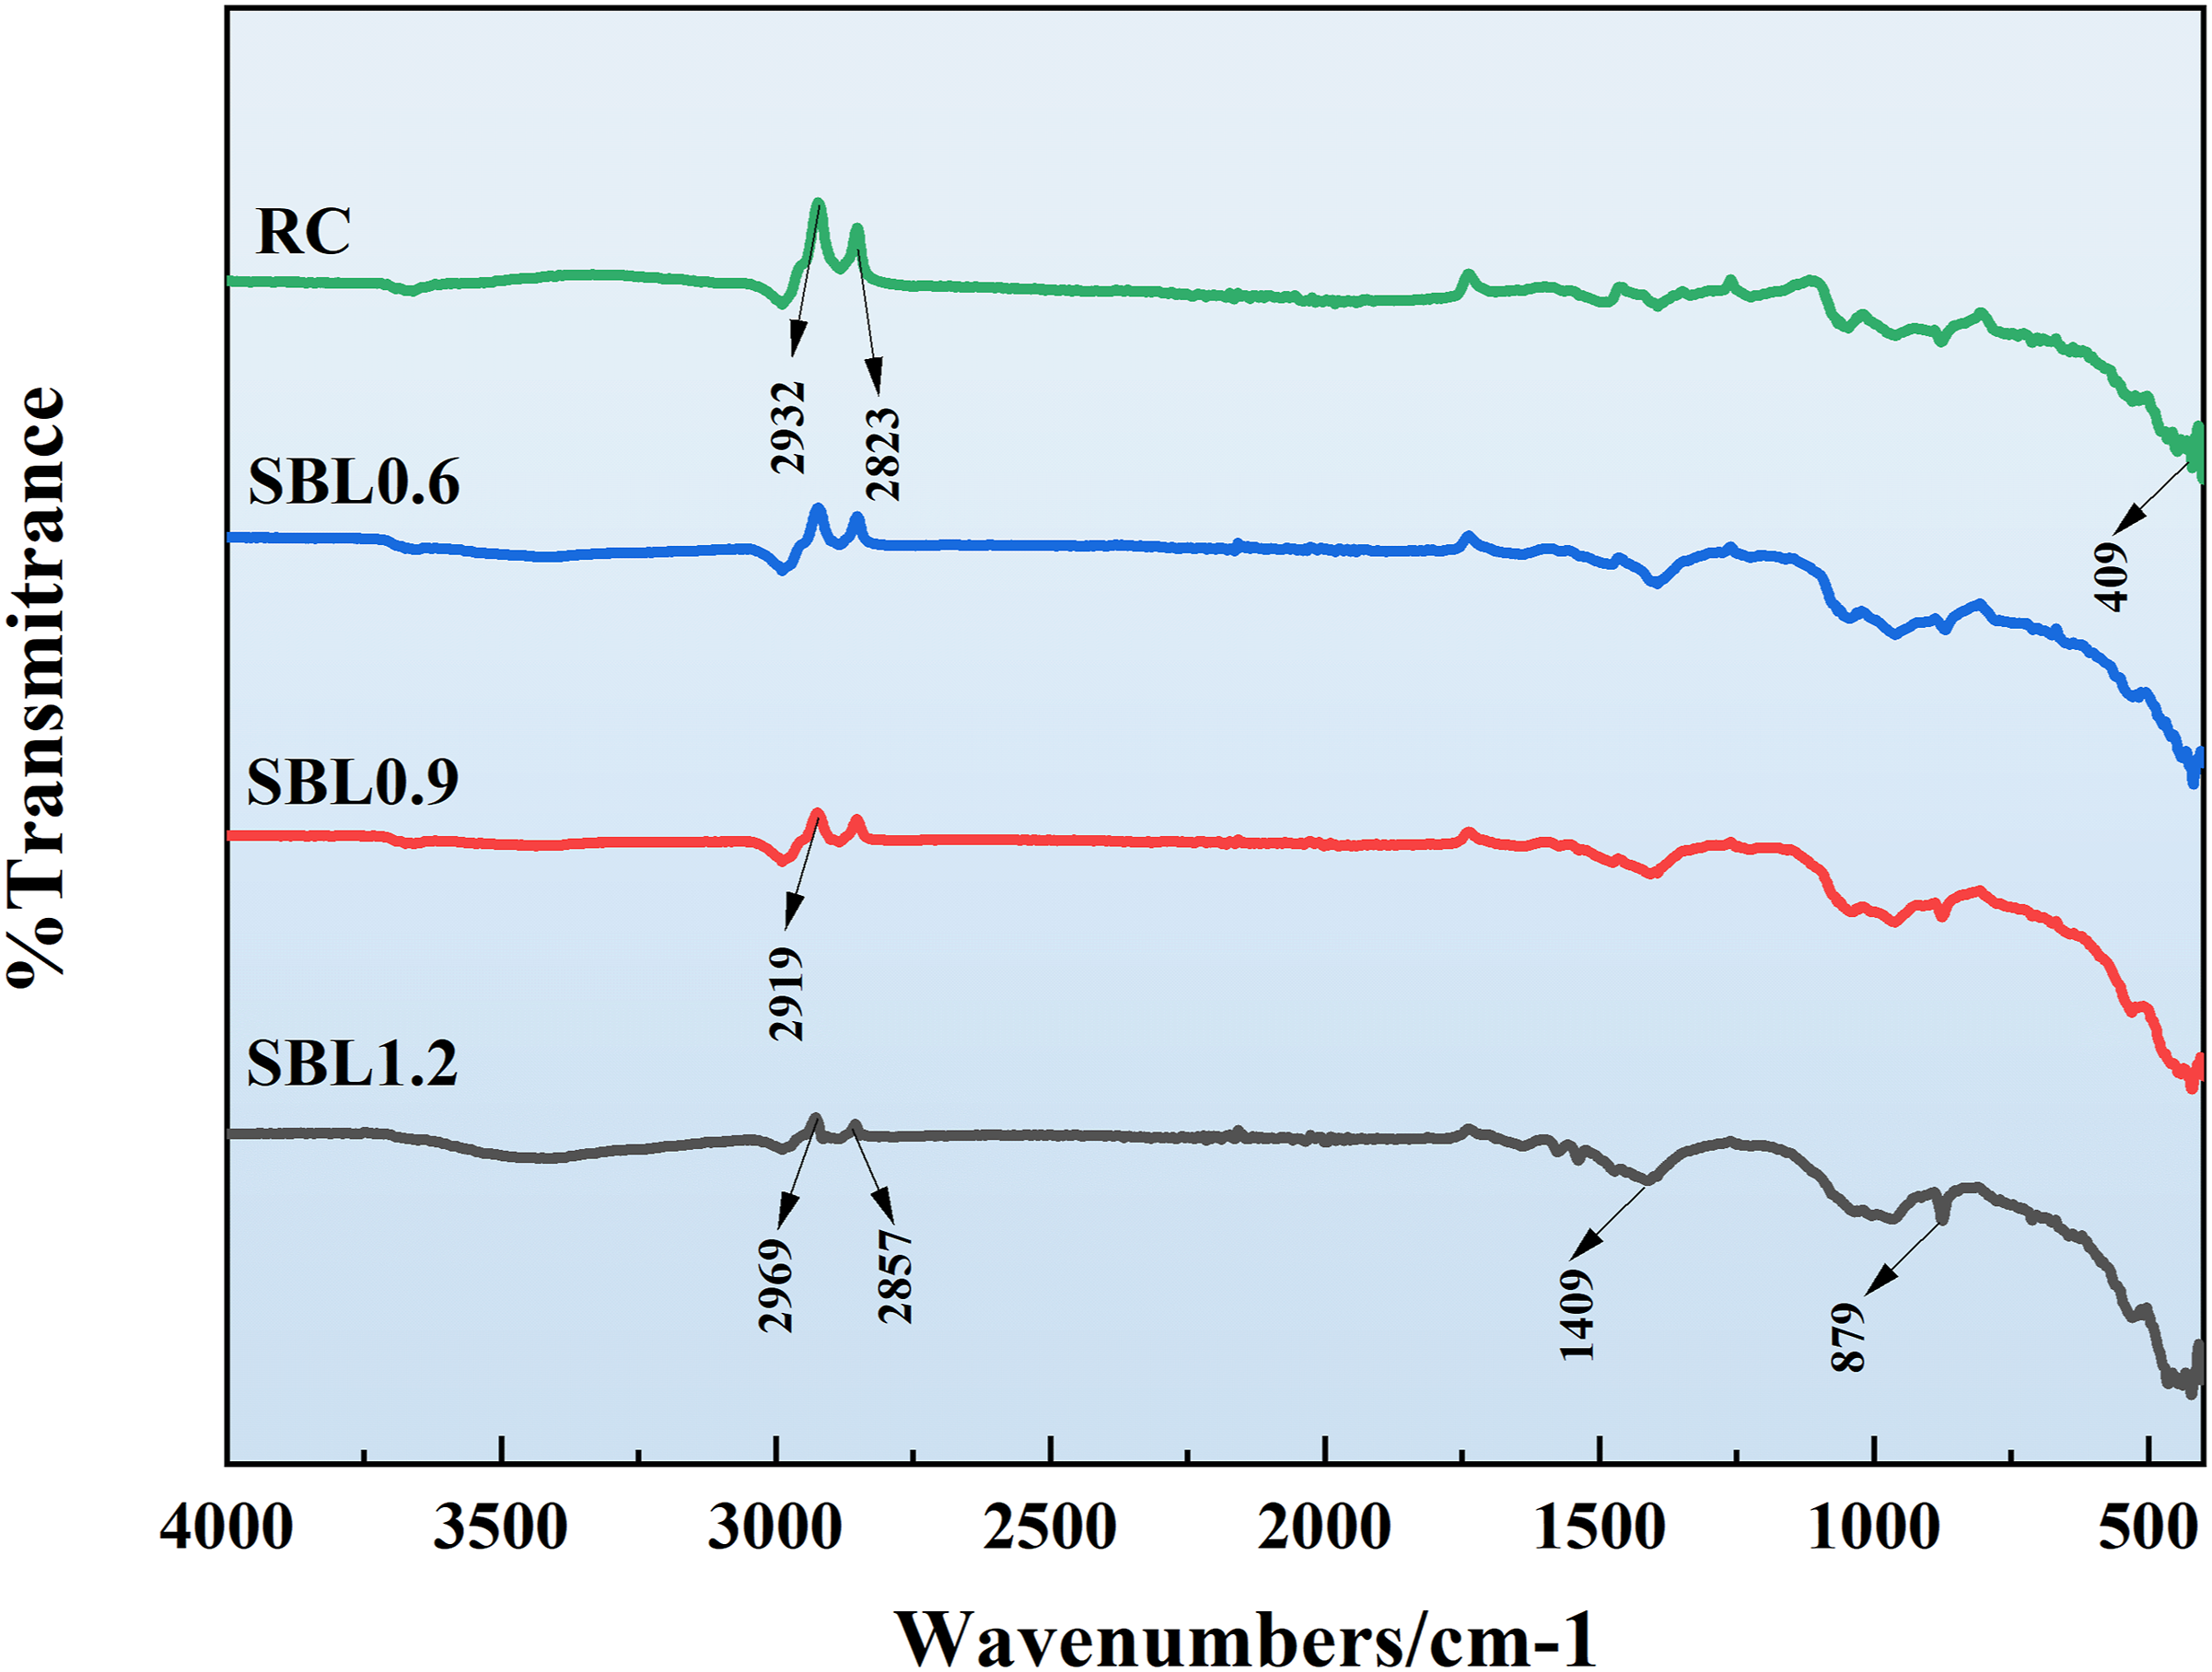
Molecular simulation
Binding energy
Binding energy is the energy difference between the total energy of the system and the energy of the two parts, which is used to evaluate the interaction strength between the different components in the interface model. It is not only an important parameter to reflect the interface interaction, but also a key index to measure the interface adsorption strength. 25 If the binding energy is positive, the two systems are attracted to each other. If the binding energy is negative, the two systems maintain each other. 26 The greater the absolute value of the binding energy, the stronger the interaction between the two systems and the more stable the system. 27
In this study, for the PVA/C-S-H model, Force module was used to calculate the binding energy of PVA, C-S-H and PVA/C-S-H models respectively, and the calculation results were brought into equation (1). The PVA/C-S-H binding energy is −418.719 kcal/mol.
For the PVA/SBL/C-S-H model, Force module was used to calculate the binding energy of PVA, SBL, C-S-H and PVA/C-S-H models respectively, and the calculation results were brought into equation (2). The PVA/C-S-H binding energy is calculated as 17,219.604 kcal/mol.
It can be found that the absolute value of the binding energy increases significantly with the addition of SBL, which indicates that the structure is more stable. The calculated results are shown in Figure 13. Interaction of PVA/C-S-H, and PVA/SBL/C-S-H interfaces.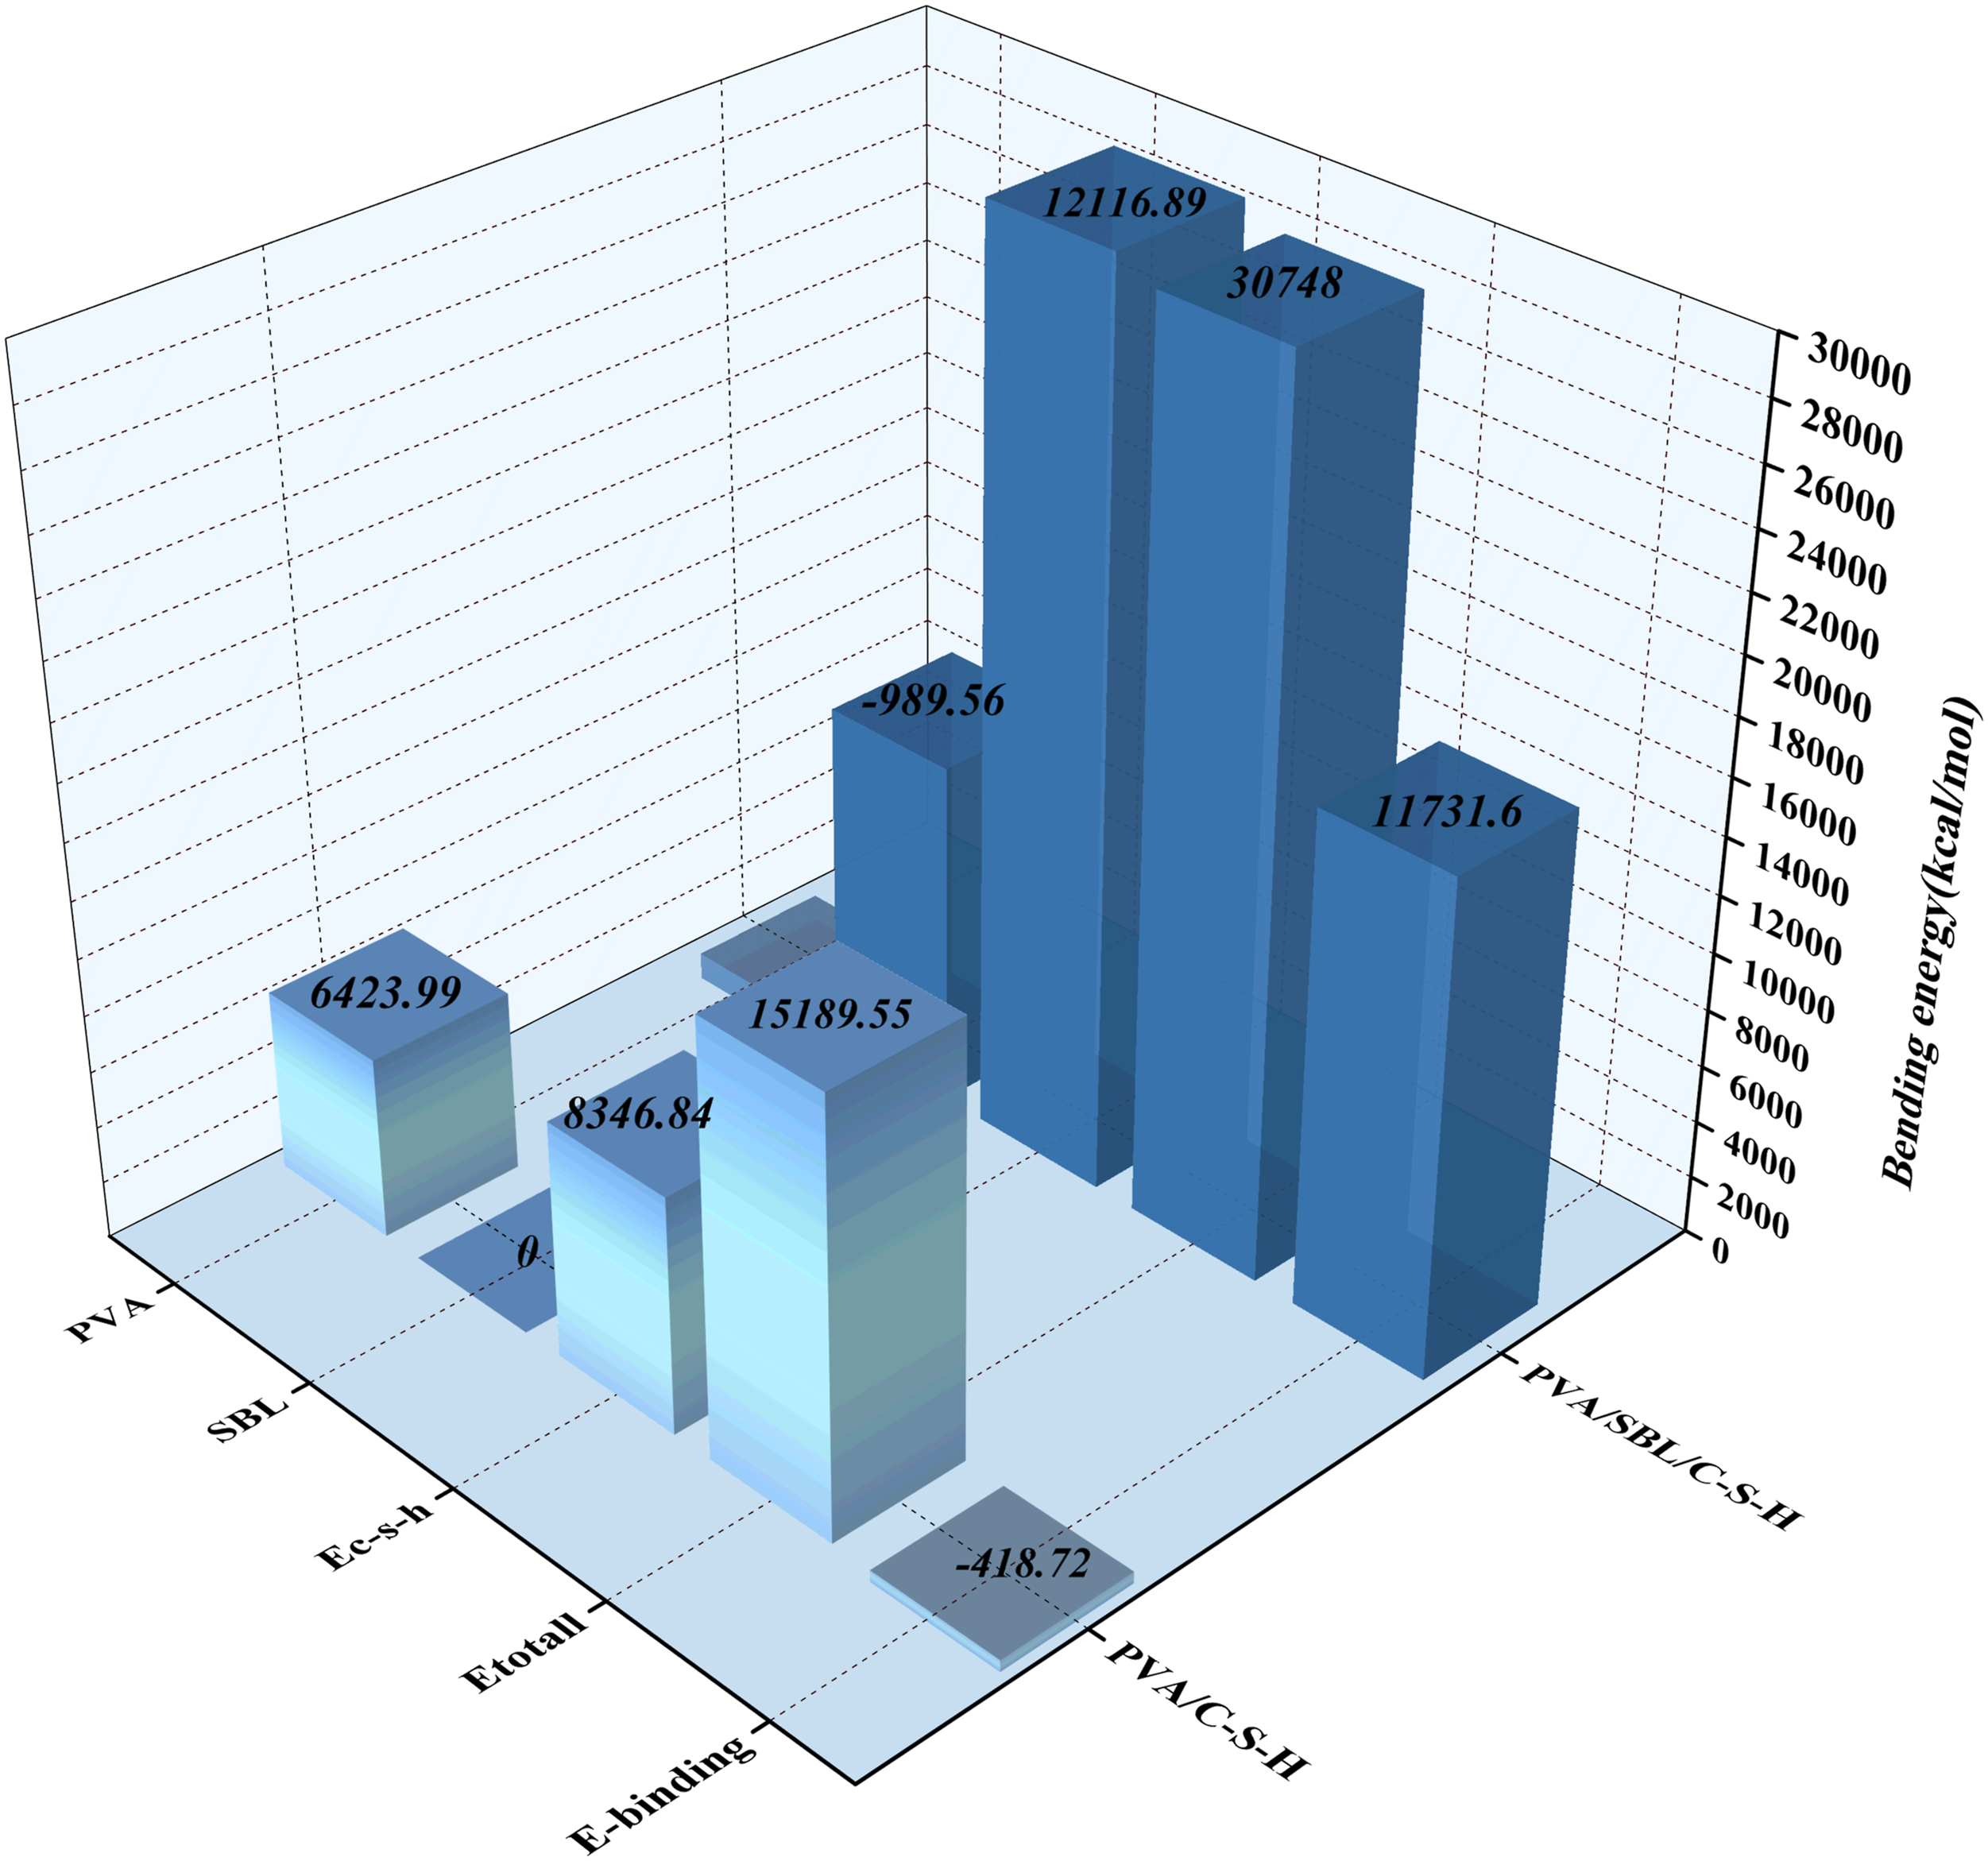
Relative concentrations (RC)
The concentration distribution curve reflects the distribution of atomic density along a specific direction.27–29 It can be used to evaluate the spatial location of key molecules in the interface model and to characterize the molecular states. Considering the limitations of modeling directions and periodic boundaries, in this paper the bottom of the model is defined as the starting point (0 distance) and only the concentration in the Z-direction is analyzed. The calculation is divided into boxes along the Z-direction of the model and the relevant atoms are counted. The relative concentrations can be calculated from equation (3).
Figure 14 shows the distribution of major atomic densities of PVA/C-S-H and SBL/PVA/C-S-H systems in the Z direction before and after the addition of SBL. When calculating the relative density distribution, Si is chosen to denote the C-S-H molecular system, H denotes the water molecular system, C denotes the PVA molecular system, and C denotes the SBL molecular system. That is, Distribution and relative density of Si, H, and C elements in the (a) PVA/C-S-H system, (b) PVA/SBL/C-S-H system (subscripts h, p, and s represent water molecular system, PVA system, and SBL system respectively).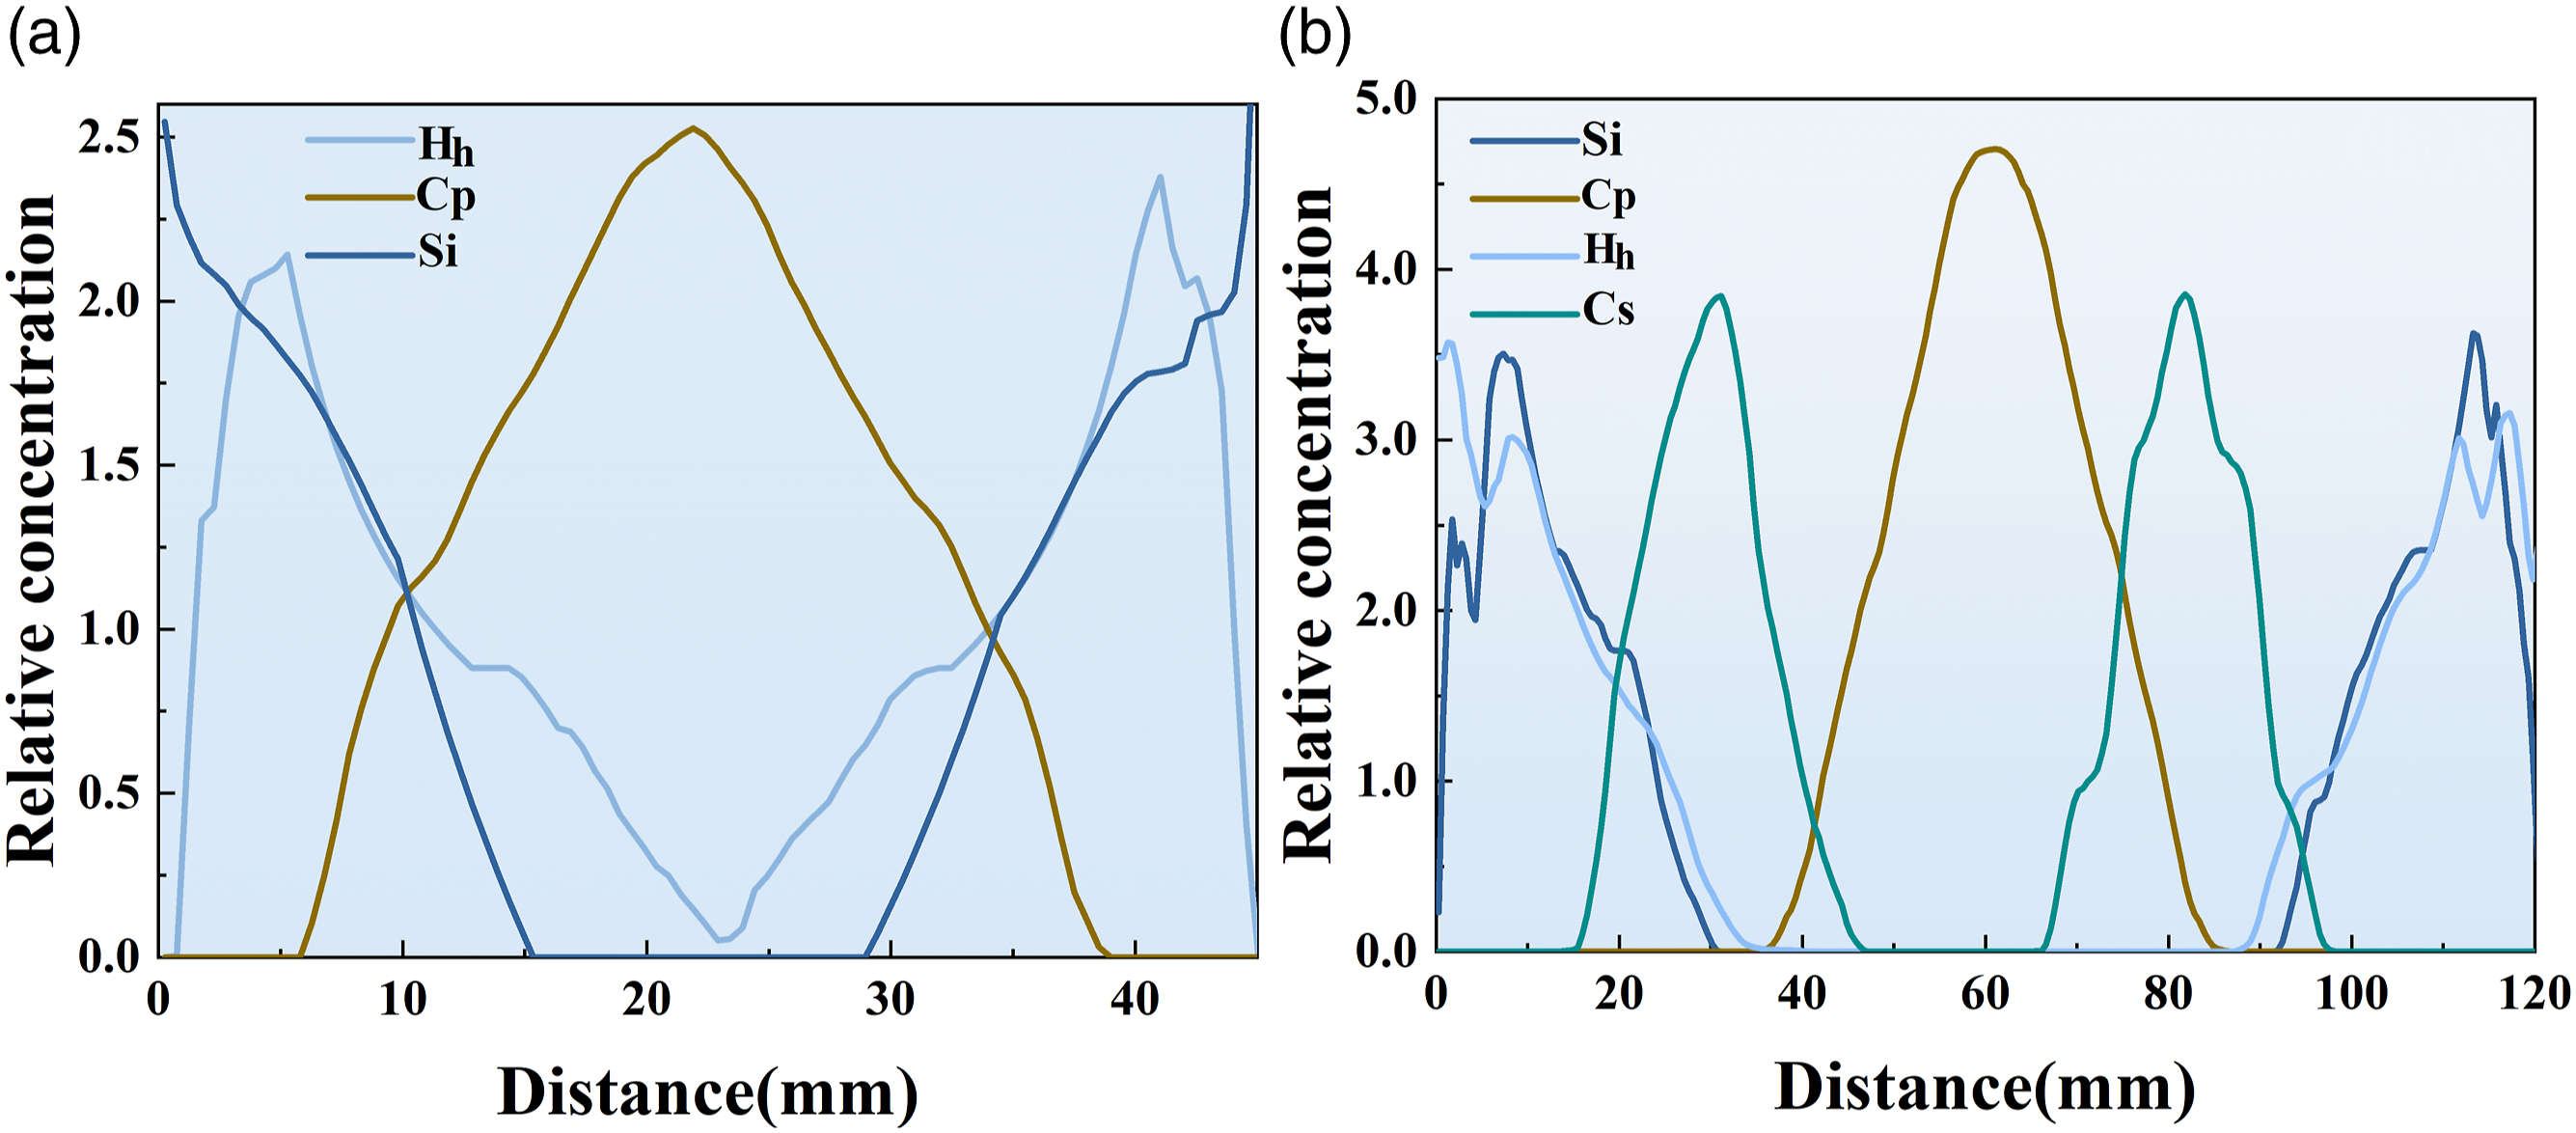
It can be found that the addition of SBL makes Figure 14(b) have better symmetry than Figure 14(c), which indicates that the introduction of SBL can make different systems evenly distributed at the interface, that is, make the interface interaction more uniform. In the PVA/C-S-H nanochannel without SBL (15.2∼ 27.3 nm), the relative density of Si is 0, and the distribution range is small, concentrated on both sides of the channel, which confirms that C-S-H has a stable crystal layer structure.
It can also be found from the figure that the RC values of Si, H and C elements present an obvious rising and falling trend on both sides of the channel. This indicates that there are fewer water molecules and C-chain systems in this range, and there may be nanogaps. Compared with Figure 14(b), the disorder of
Radial distribution function (RDF)
In order to understand the structure and interaction pattern of the polymer-matrix interface, it is necessary to calculate the radial distribution function, abbreviated as RDF. It can be calculated from equation (4), which describes the distance between one particle and another as a function of the distance between reference particles as a probability.30–32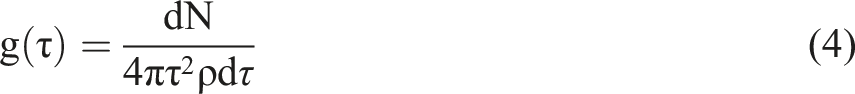
As can be seen from Figure 15(a) and (b), the interface interaction mode is mainly vdW interaction. The peaks of (a) RDF of PVA-C-S-H, Op-Ca, Hp-Ca, 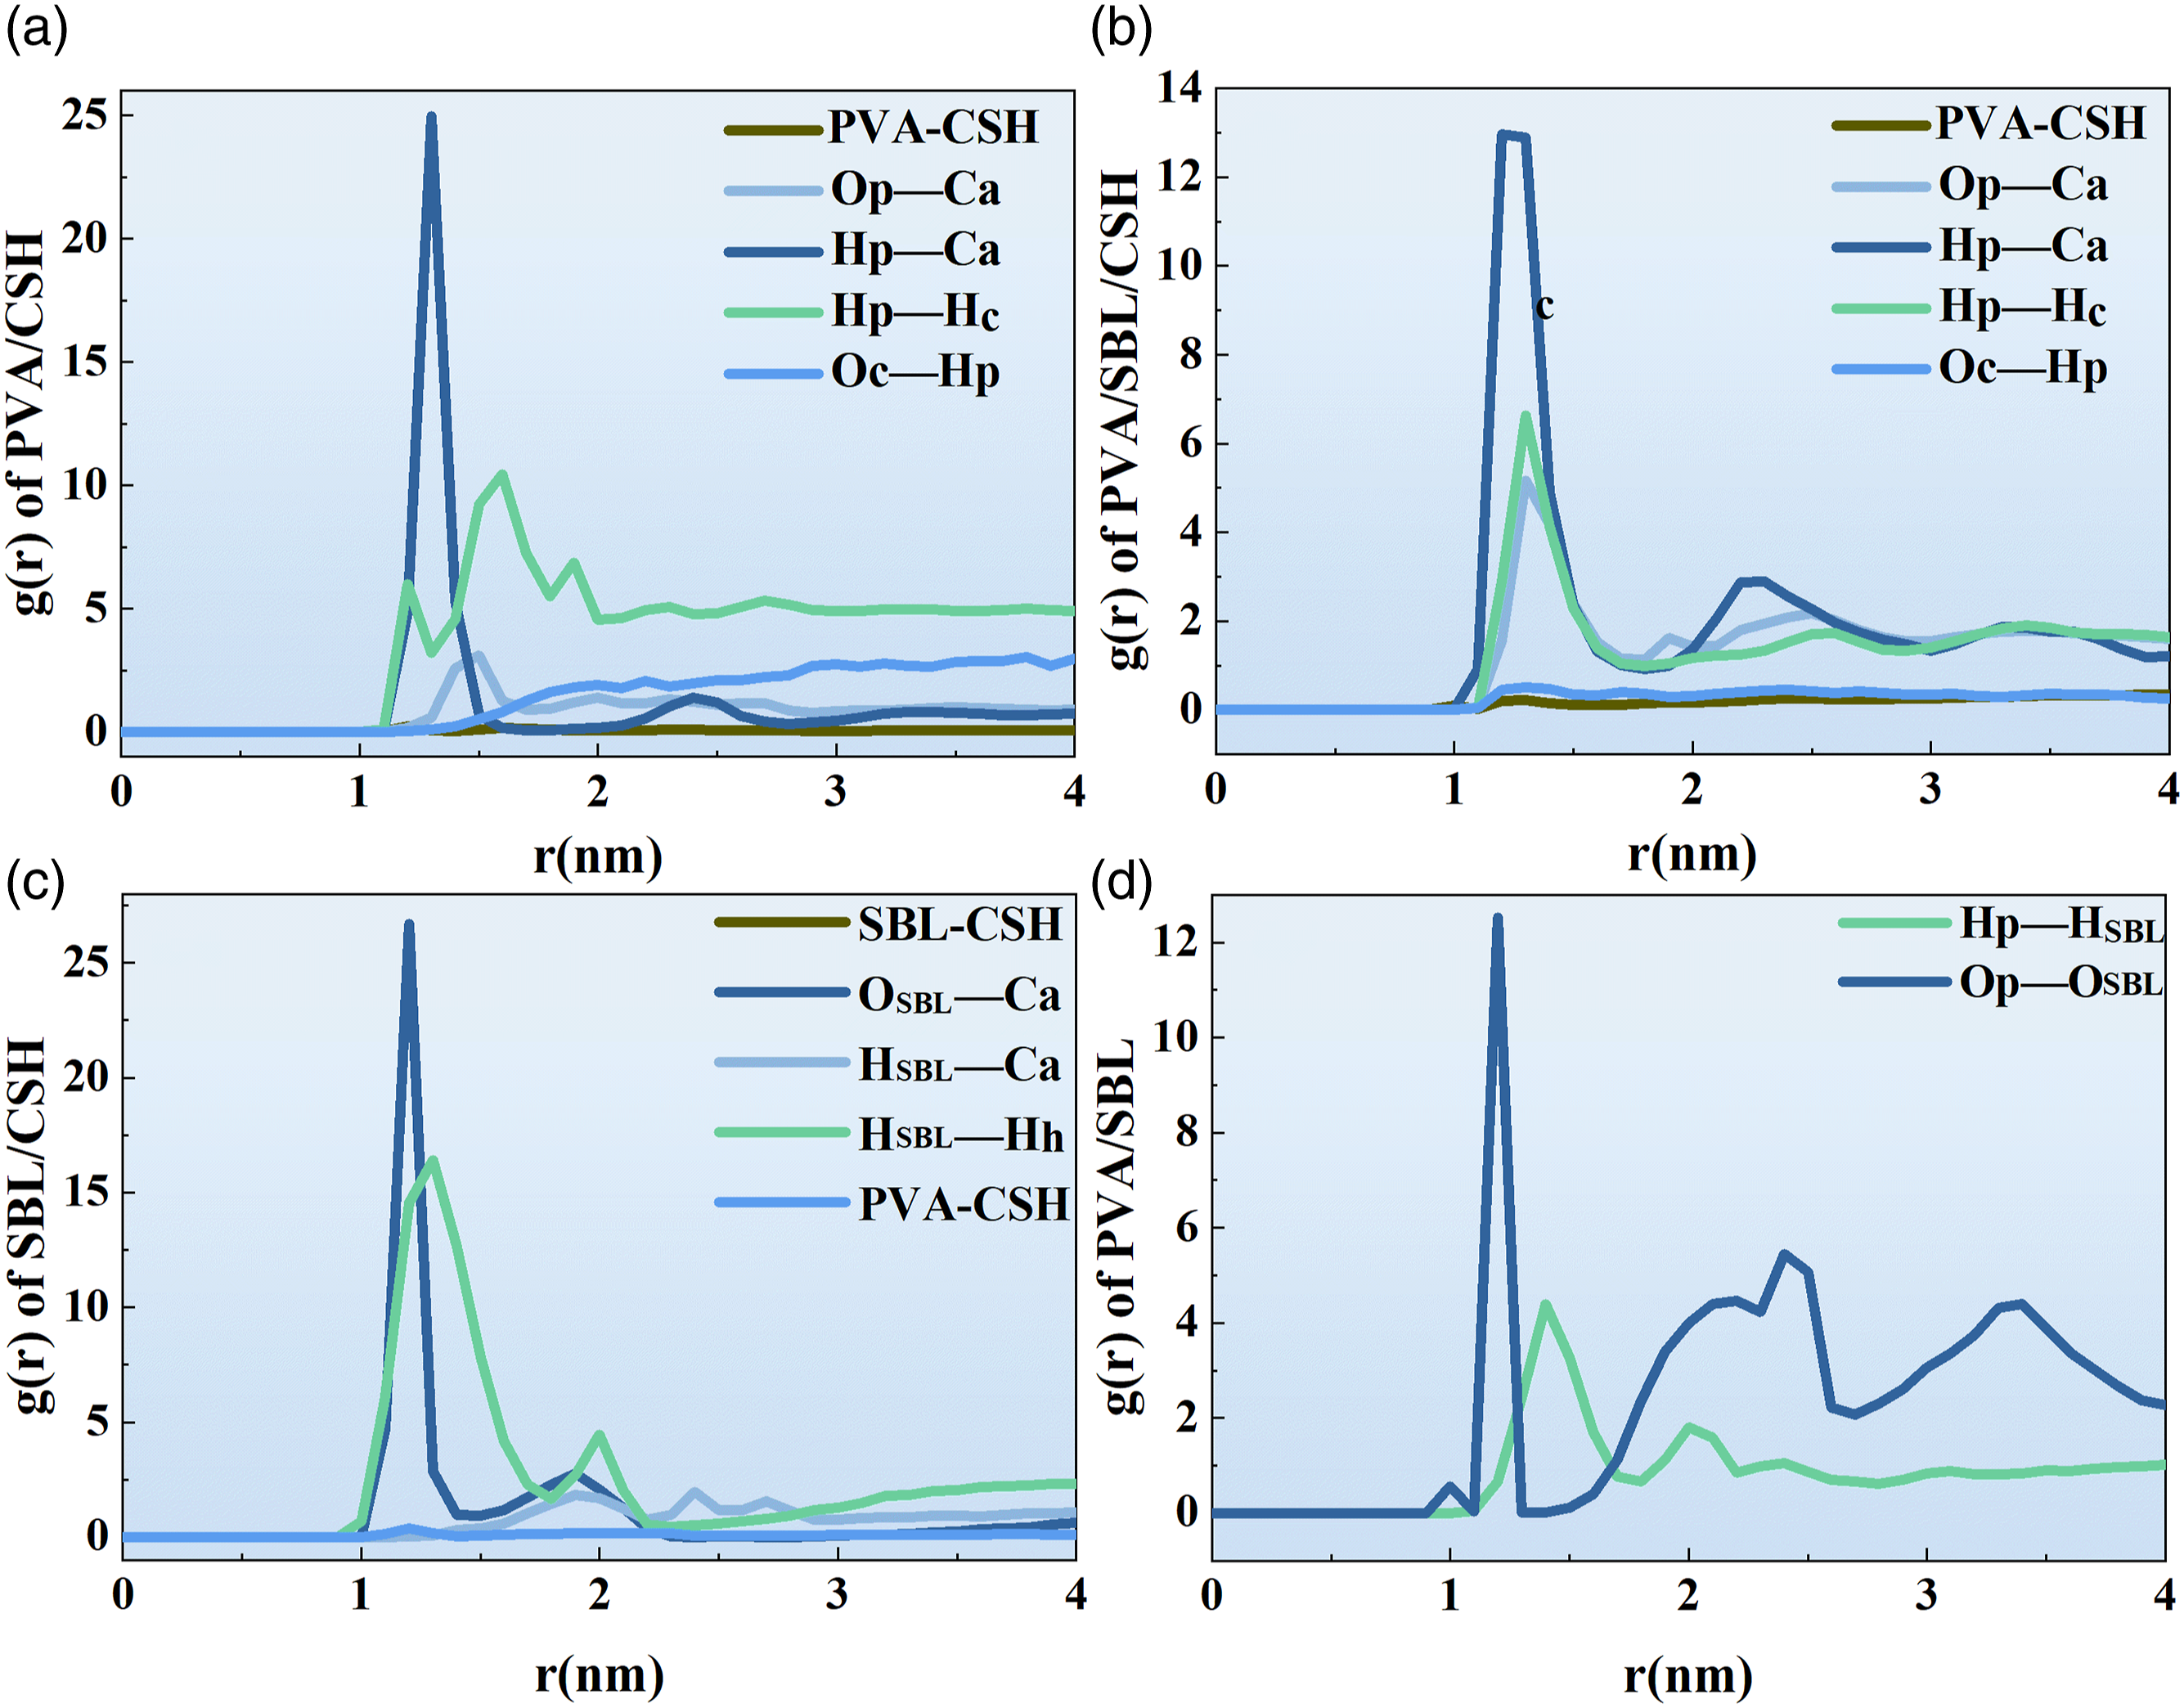
Mean square displacement (MSD)
The mean square displacement (MSD), which assesses the kinematic properties of atoms, is the average of the squared particle displacements and is an important parameter in kinetic analysis. The larger the slope of the MSD curve, the larger the molecular diffusion coefficient.33,34 It can be calculated from equation (5).
Figure 16 shows the MSD values of two systems (PVA/C-S-H, PVA/SBL/C-S-H) during MD simulation. Comparing Figure 11(a) with Figure 11(b), the MSD value of CSH is lower than that of PVA, which indicates that C-S-H has a more stable structure than PVA. In addition, the MSD curve of The mean square displacements of (a) 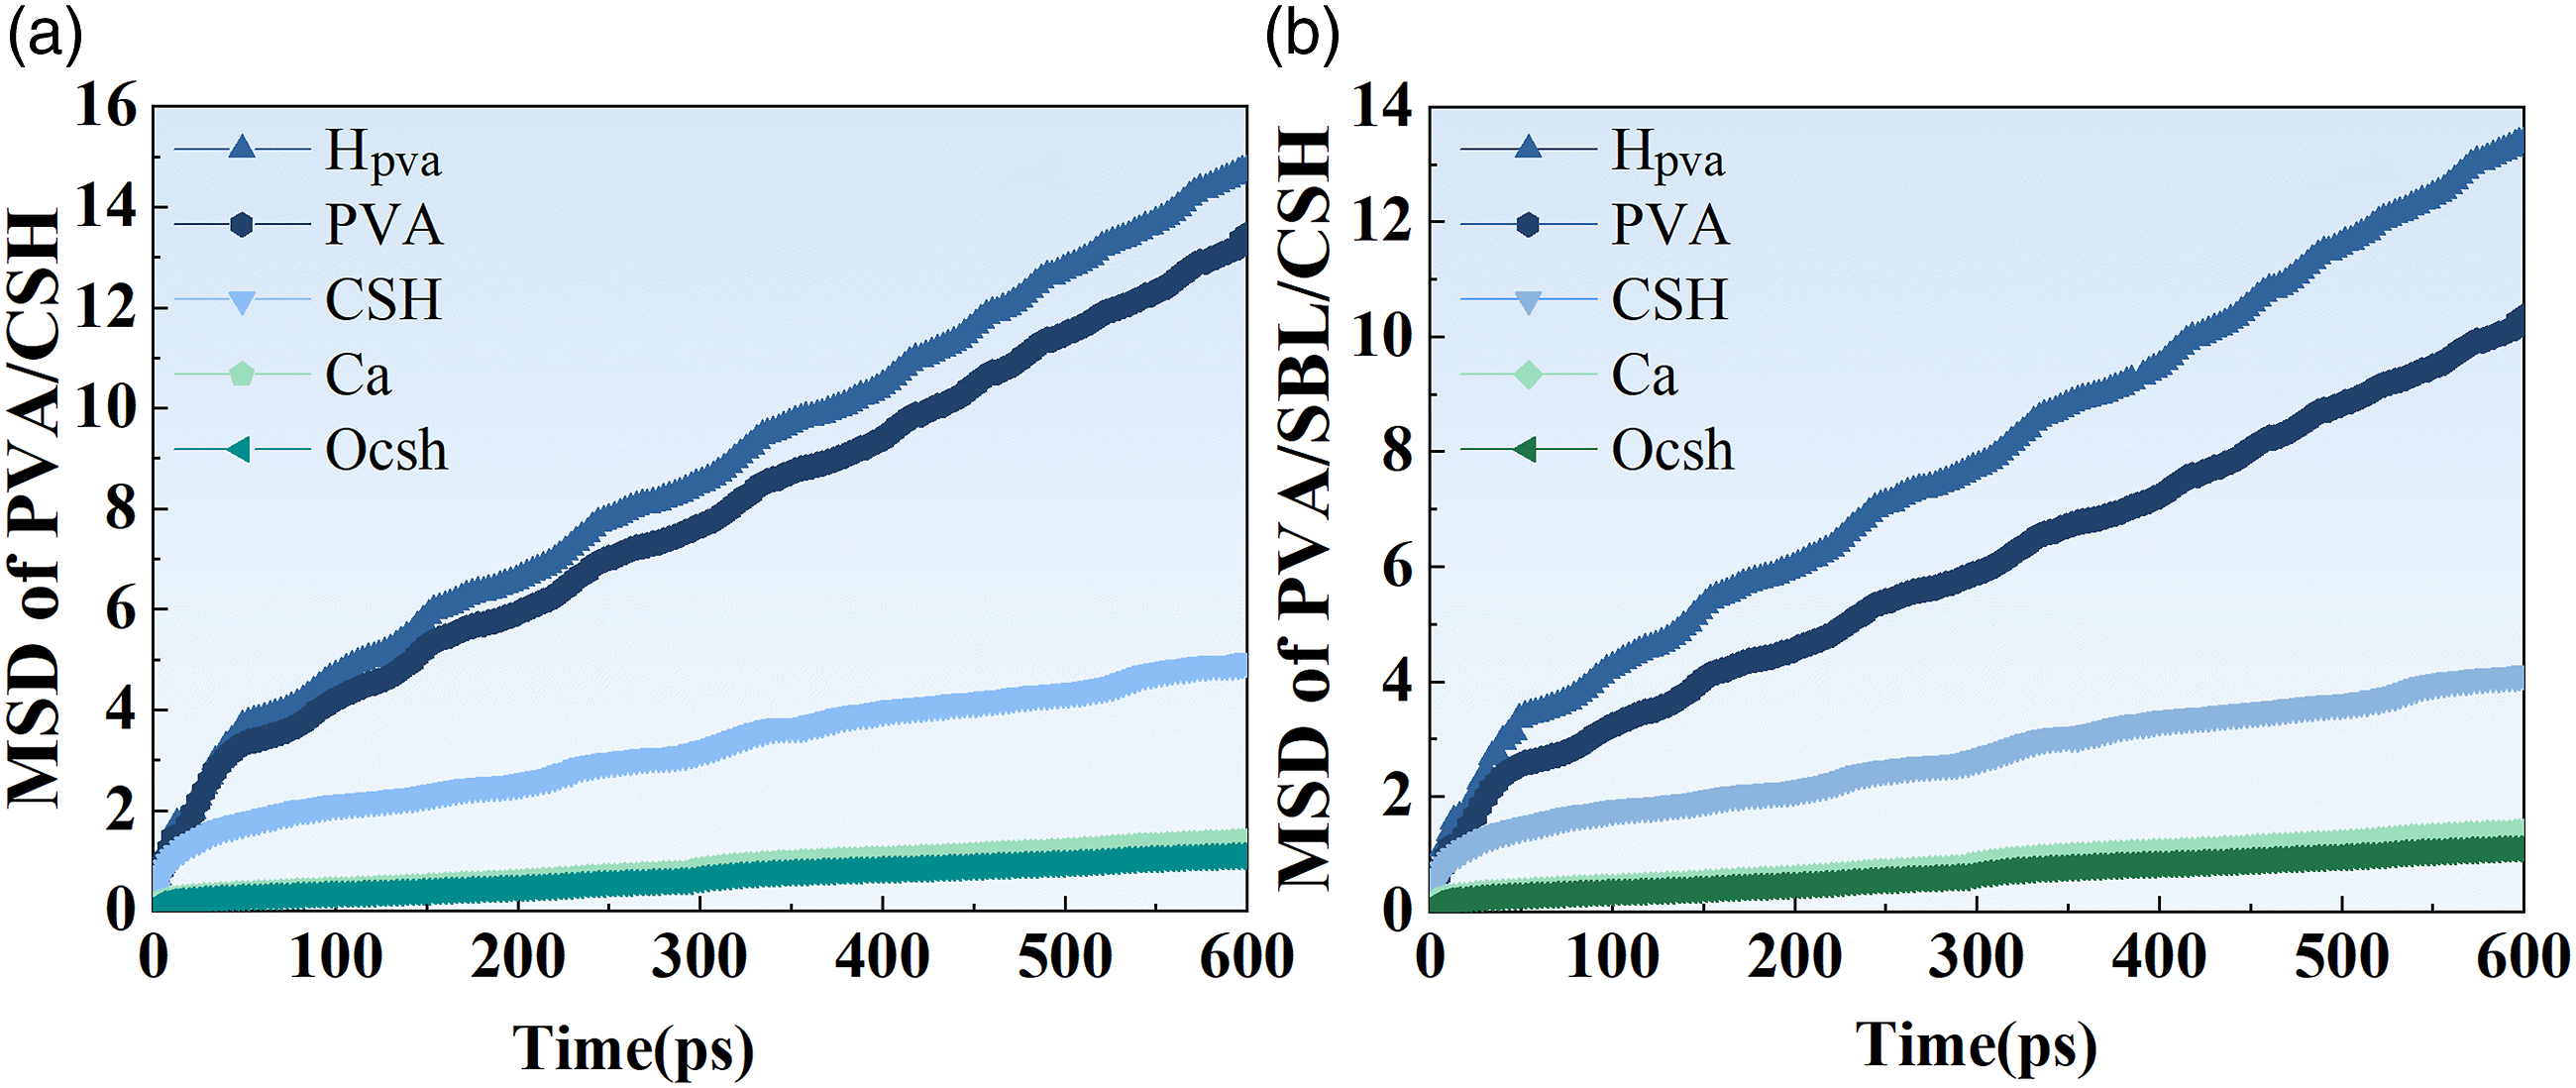
Time correlation function (TCF)
In order to further evaluate the stability, strength and dynamic performance of the above interfacial connections, the time correlation function (TCF) is introduced to qualitatively describe the stability of the critical chemical bonds at the interface. It can be calculated from equation (6).
35
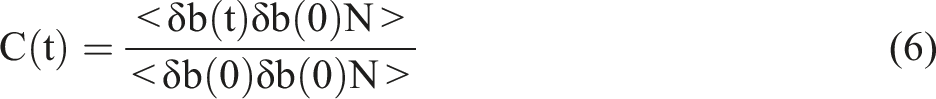
Over time, if the connections between all pairs of atoms are stable, the TCF is constant at 1. If the connection is lost or equal to 0, it directly indicates that the TCF value is unstable. Therefore, the degree to which the TCF value deviates from one can reflect the connectivity stability and strength of the atom pair. The greater the TCF deviation, the greater the possibility of the connection breaking.
Figure 17 describes the TCF evolution of major atomic pairs at the cement-based interface of the composite at 200ps. With or without SBL, it can be used to describe the stability, strength and dynamics of atomic pairs in interface models. It can be found that the variation trend of H-H and O-H in the two models is almost the same, indicating that the oxygen atom and hydrogen atom in the water molecule have the same activity characteristics, which verifies the rationality of the model. It is worth noting that the hydrogen bond effect in Figure 17(a) shows a downward trend before 120ps, after which it stabilizes at around 0.19 for a long time. The TCF curve of the hydrogen bond in Figure 17(b) decreases slightly at the beginning, and then stabilizes around 0.55 or 0.6. This indicates that SBL enhances the surface hydrophilicity of PVA fibers. In addition, by comparing the TCF values of Time correlation functions of (a) Ca-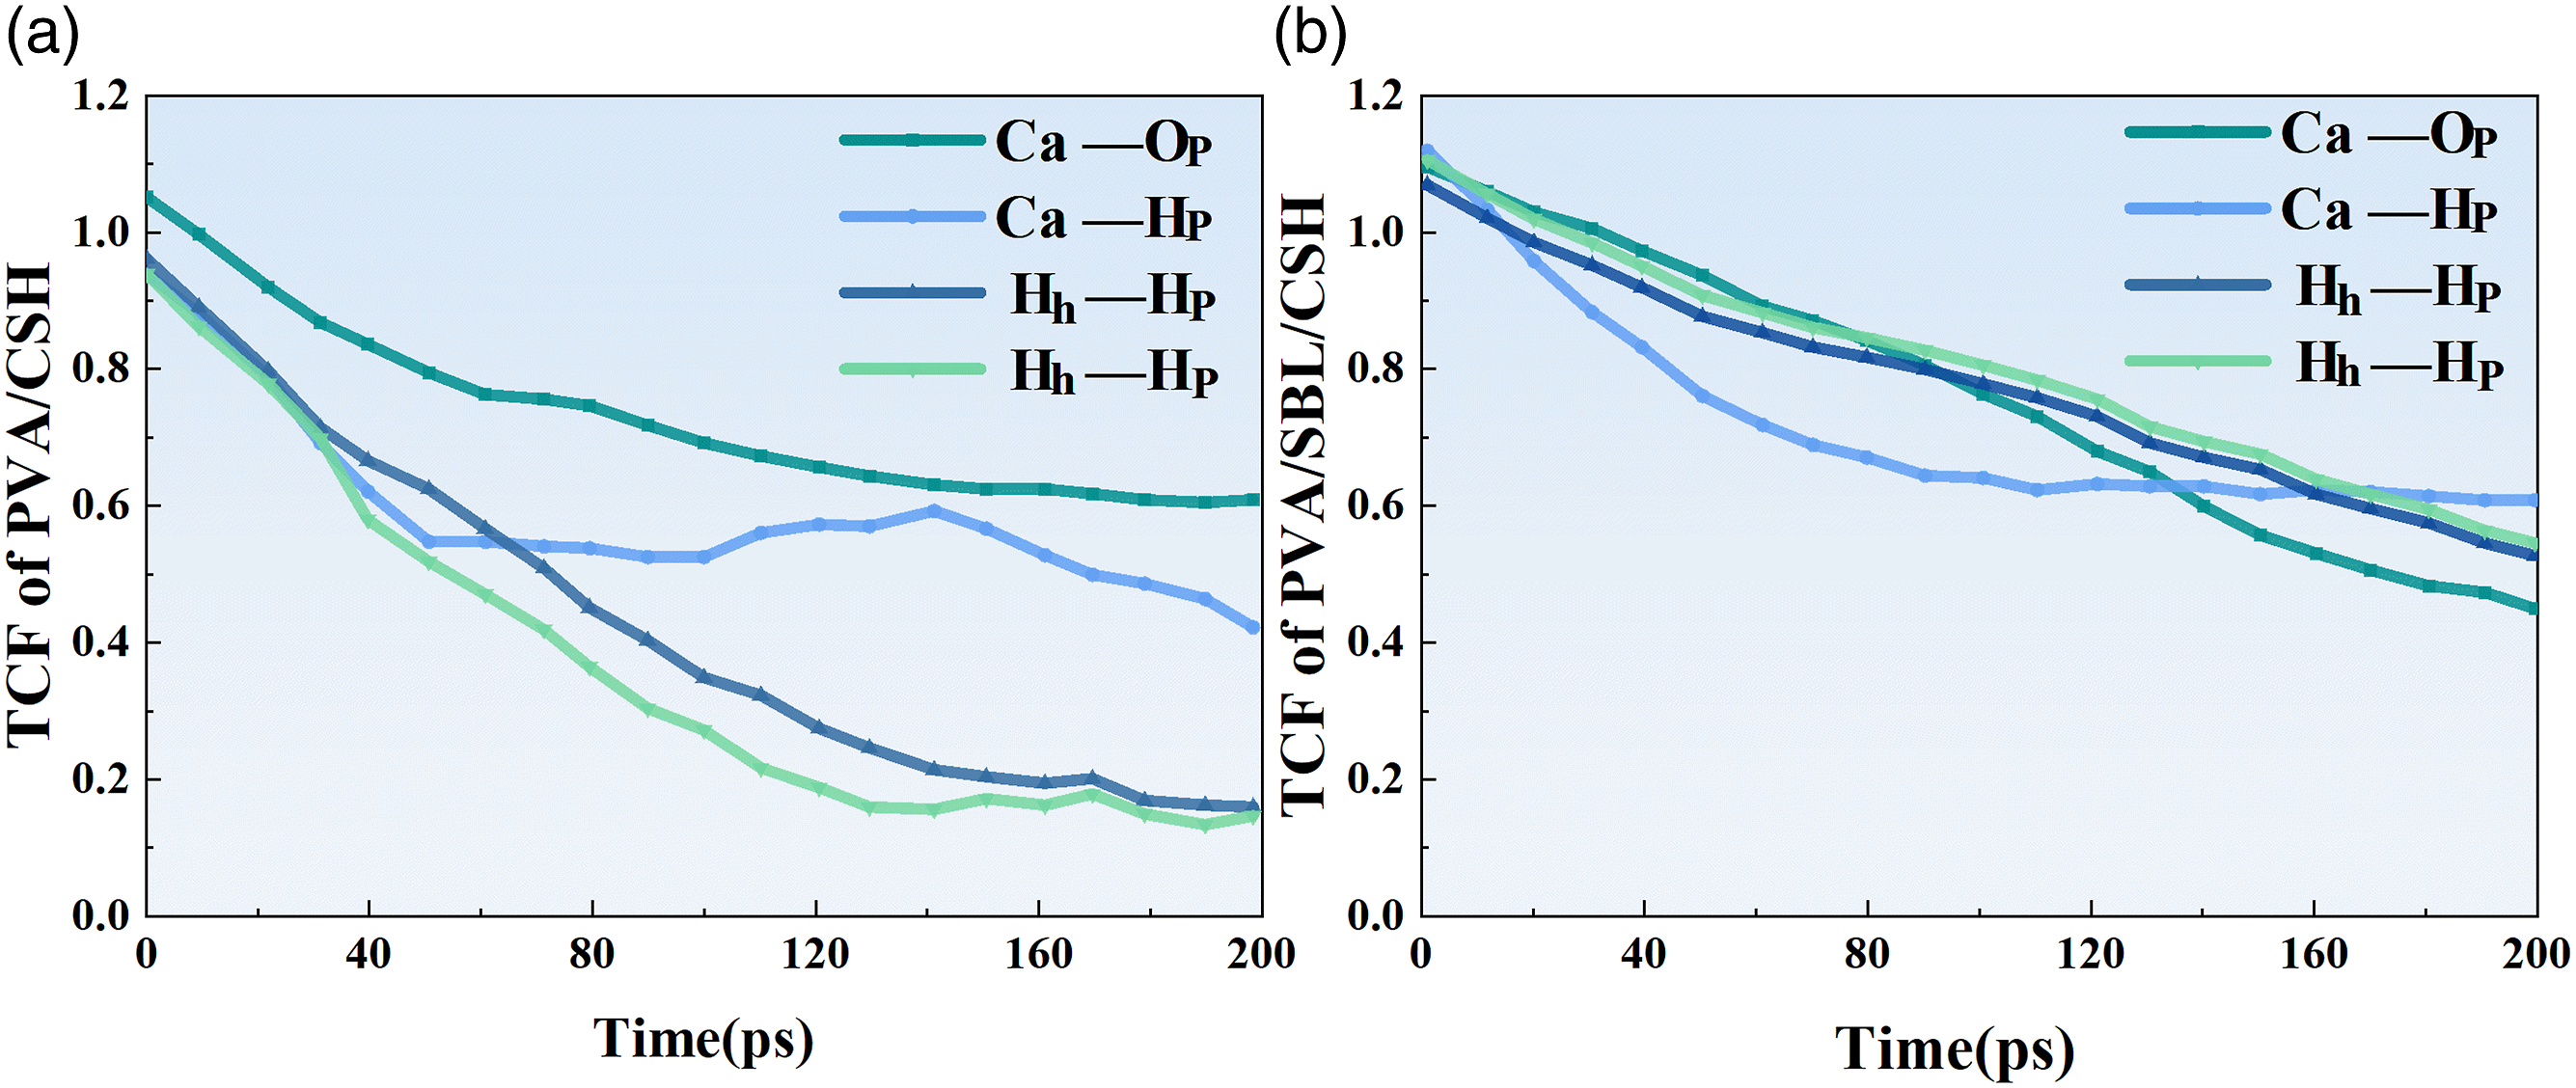
Multiscale analysis
Macroscopic improvement mechanism
According to the composition characteristics of PVA concrete, PVA is simplified into a linear object as shown in Figure 18. Considering different test loading methods, the action mechanism of SBL in PVA concrete was analyzed respectively. Failure mechanism diagram of different macroscopic test blocks.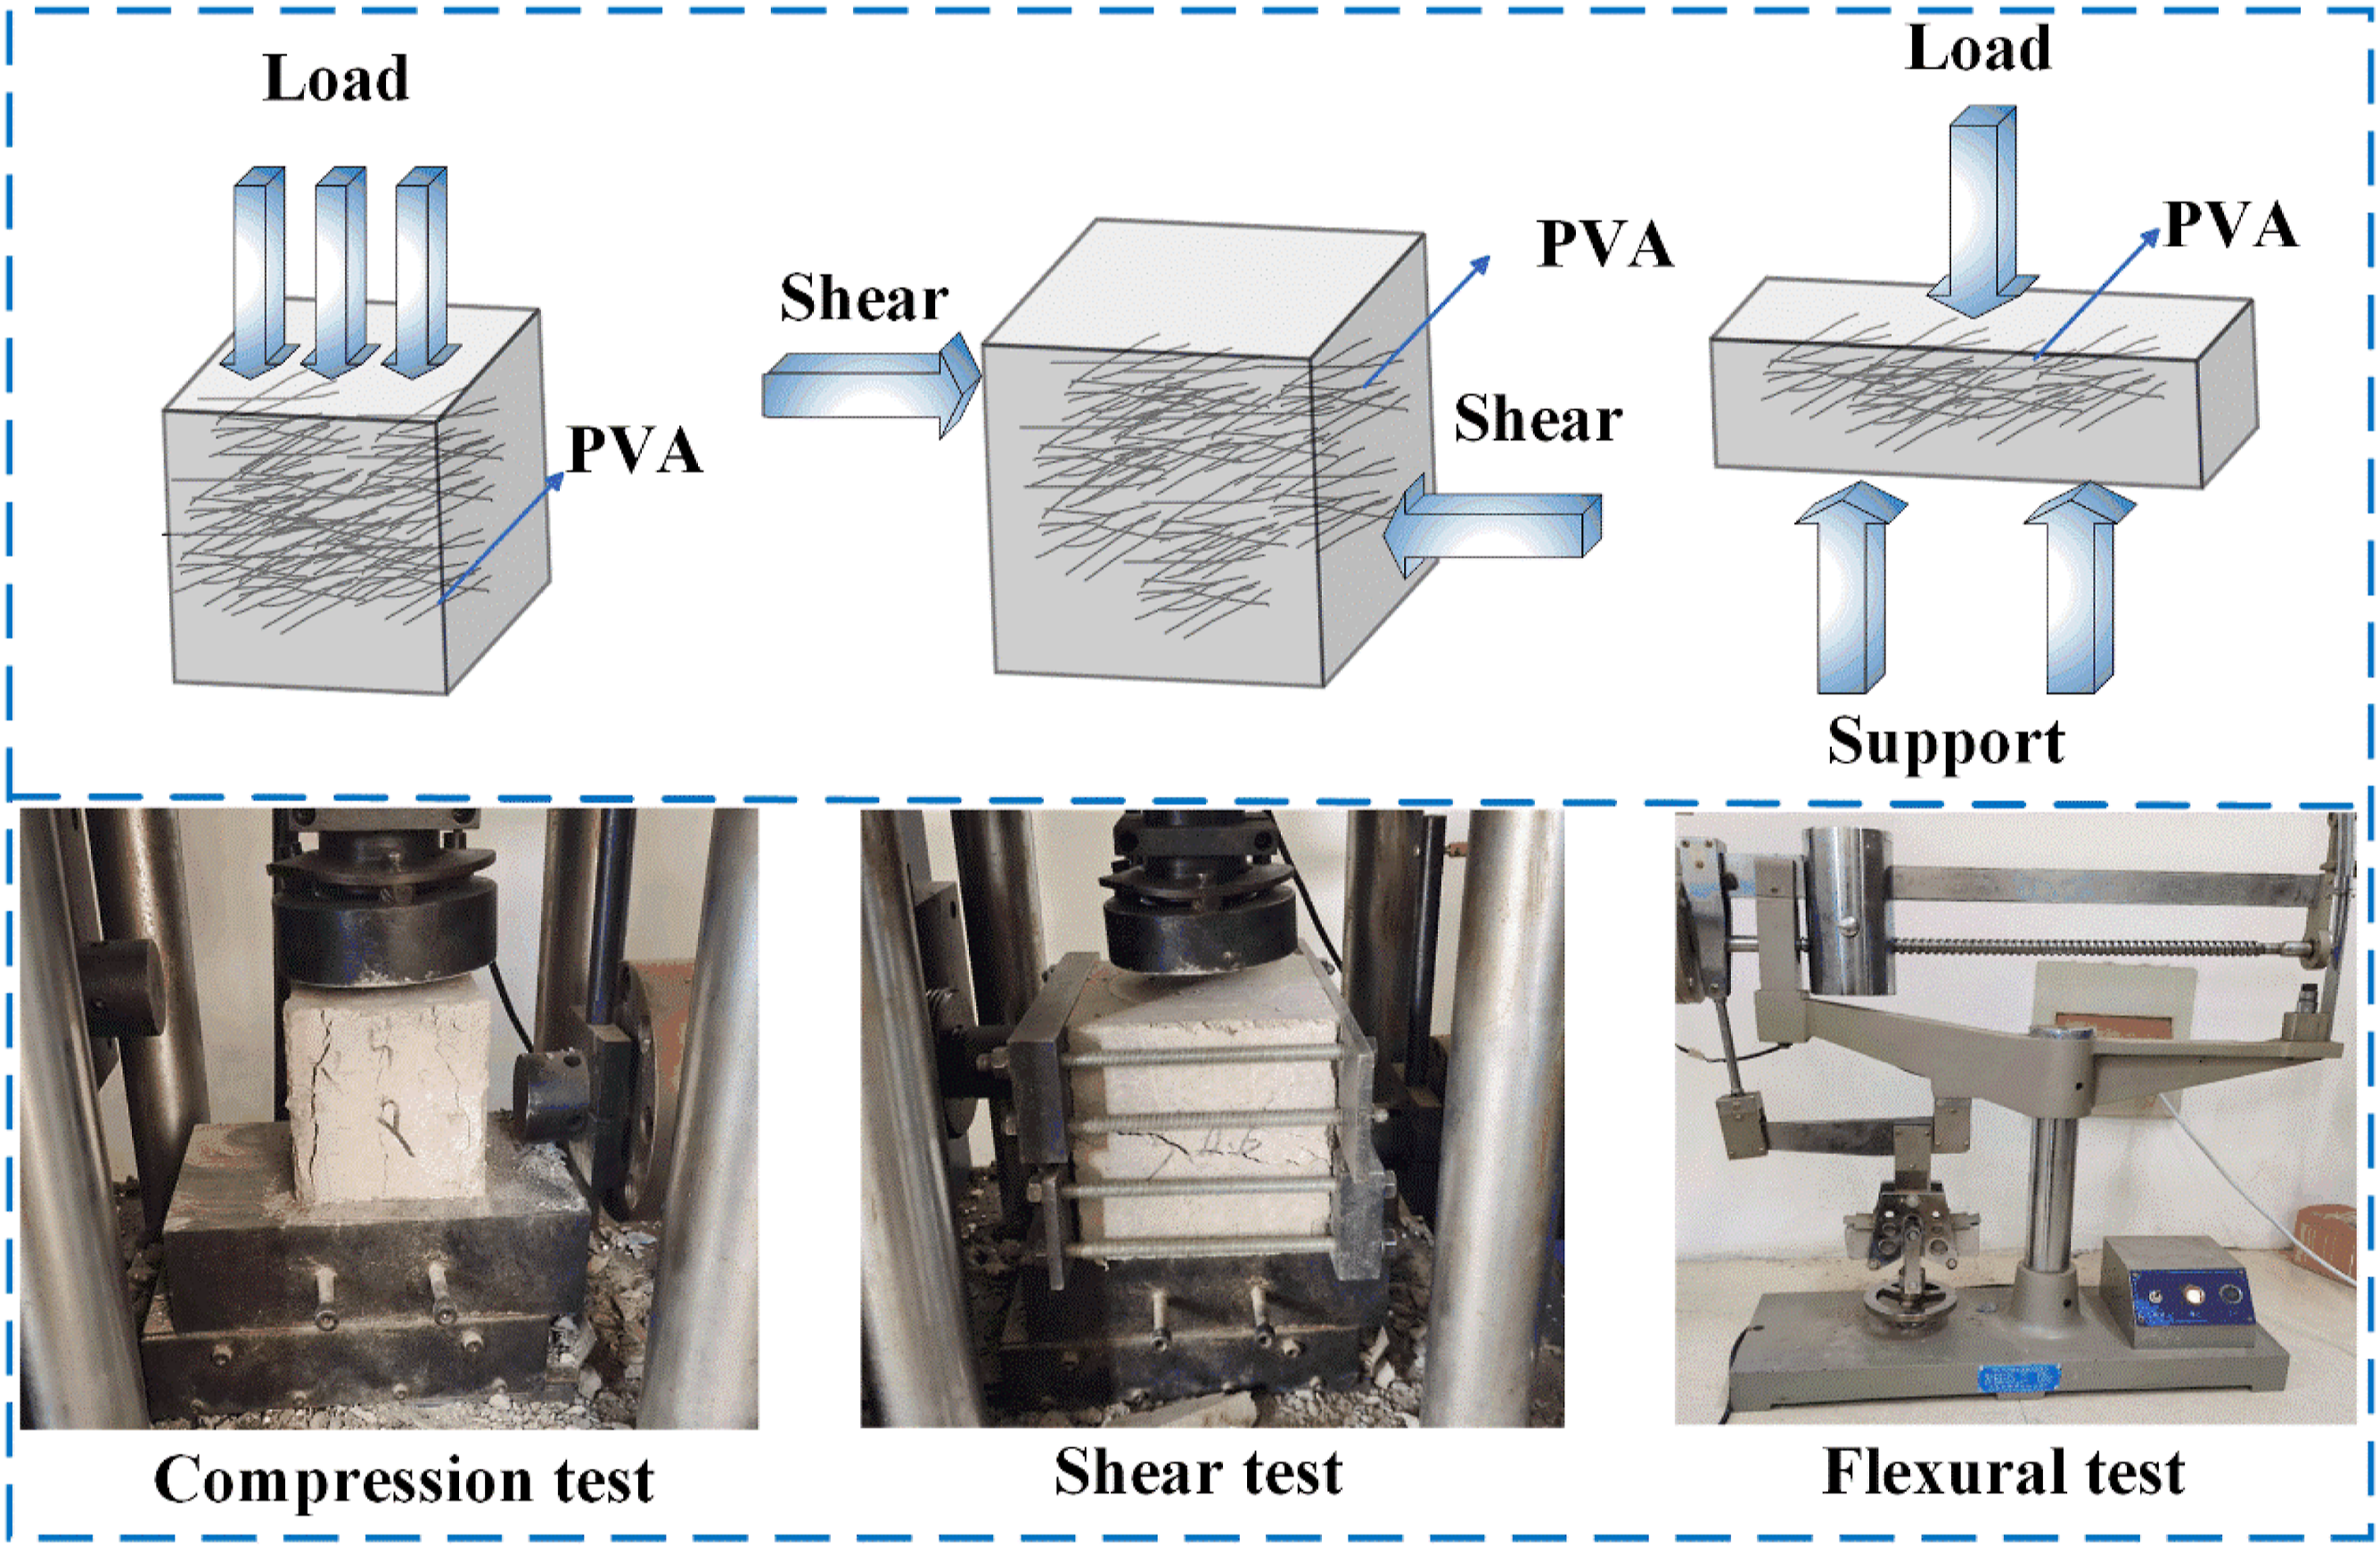
Whether the concrete material is under pressure, shear or flexural test. There exists chemical adhesion between mortar and mortar and between mortar and coarse aggregate, and its effect is mainly related to the composition characteristics of mortar. When the concrete cracks, PVA takes part in the force. Because PVA has good tensile properties, the test block shows good shear and flexion properties. However, due to the relatively weak adhesion between PVA and mortar, the mechanical performance of PVA concrete decreases with the increase of PVA fiber, and the deformation ability gradually increases. At this time, SBL is added as a reinforcing agent to enhance the interface bond between PVA and cement, reduce the void ratio, and improve the density and bonding force. Finally, the mechanical properties of PVA concrete specimens are improved.
Microscopic enhancement mechanism
As shown in Figure 19, SEM images combined with the interaction between PVA and C-S-H and the results of macroscopic mechanical experiments show that SBL plays a crucial reinforcing role. The introduction of SBL greatly increased the direct interaction between PVA and cement, and improved the strength of composite materials. Correspondence between microstructure and mechanical properties.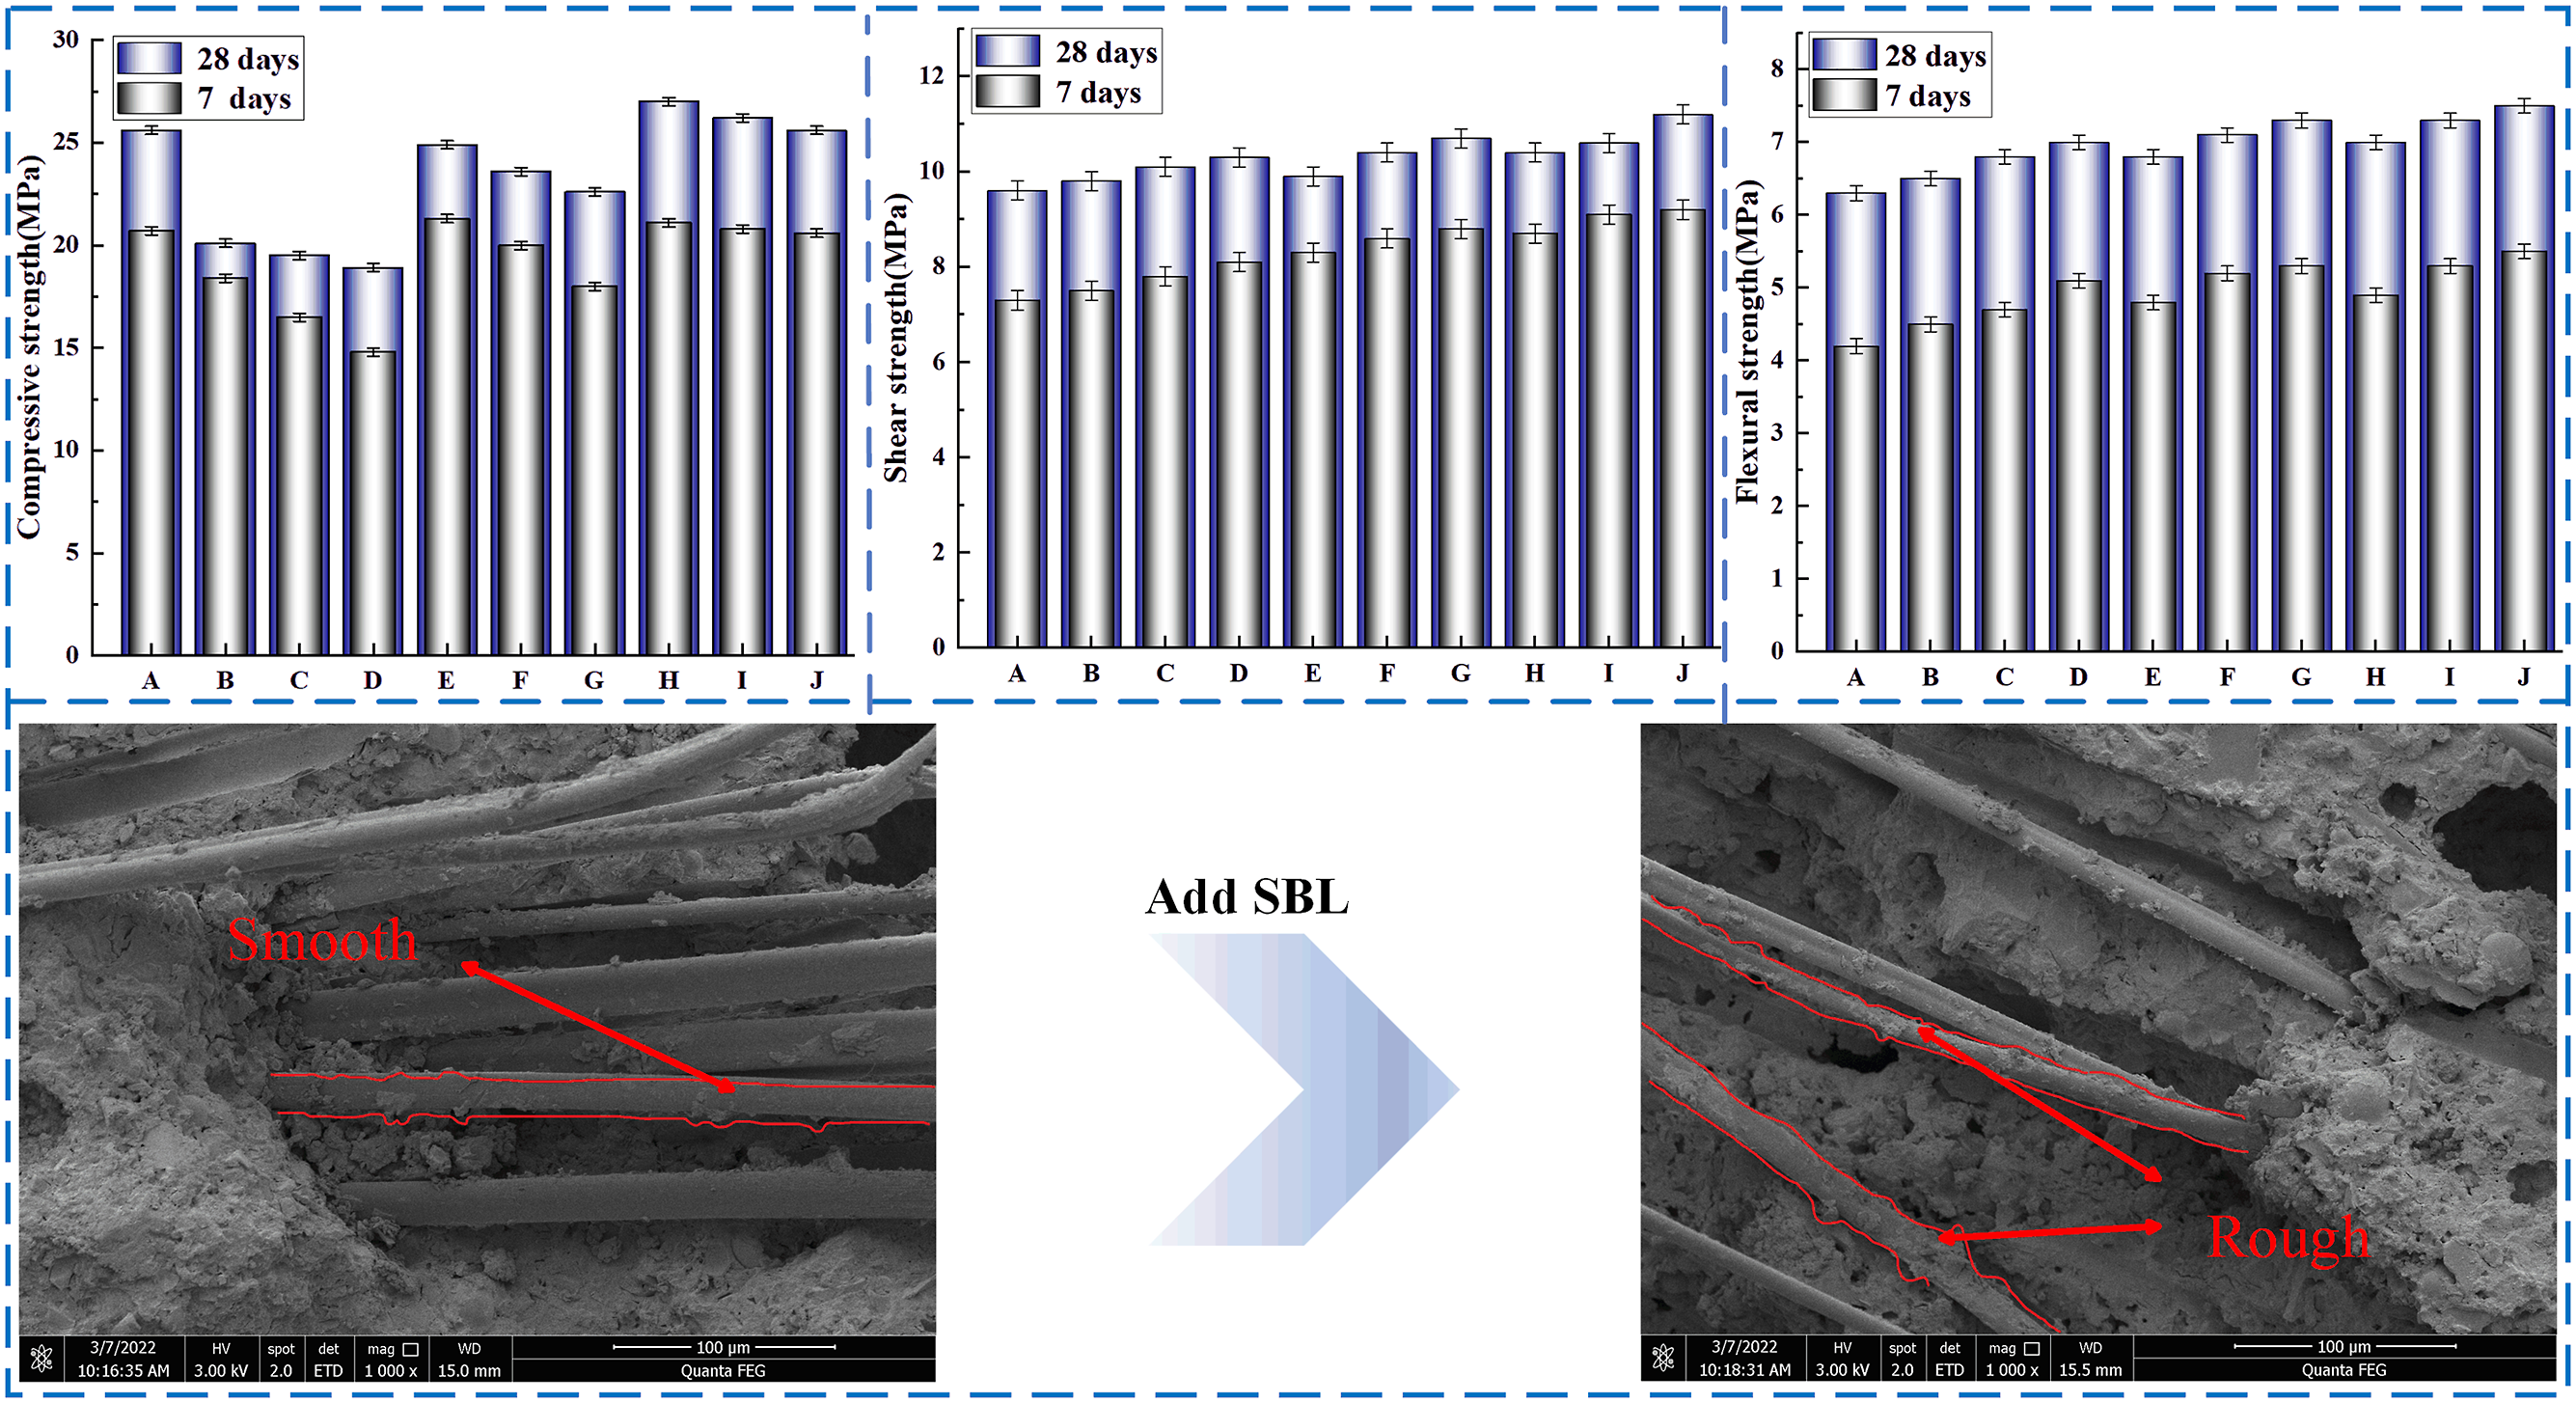
Nano enhancement mechanism
The ionic bond formed by hydrogen bonds with Ca is considered to be the key bond between C-S-H gels and the different polymers at the interface.
36
In this study, molecular dynamics analysis showed that the addition of SBL made the H atom of PVA form a stable hydrogen bond with the Ca atom of CSH. As shown in Figure 20, the formation of hydrogen bond increases the interface strength between PVA and CSH, and improves the mechanical properties of PVA concrete. Nano enhancement mechanism.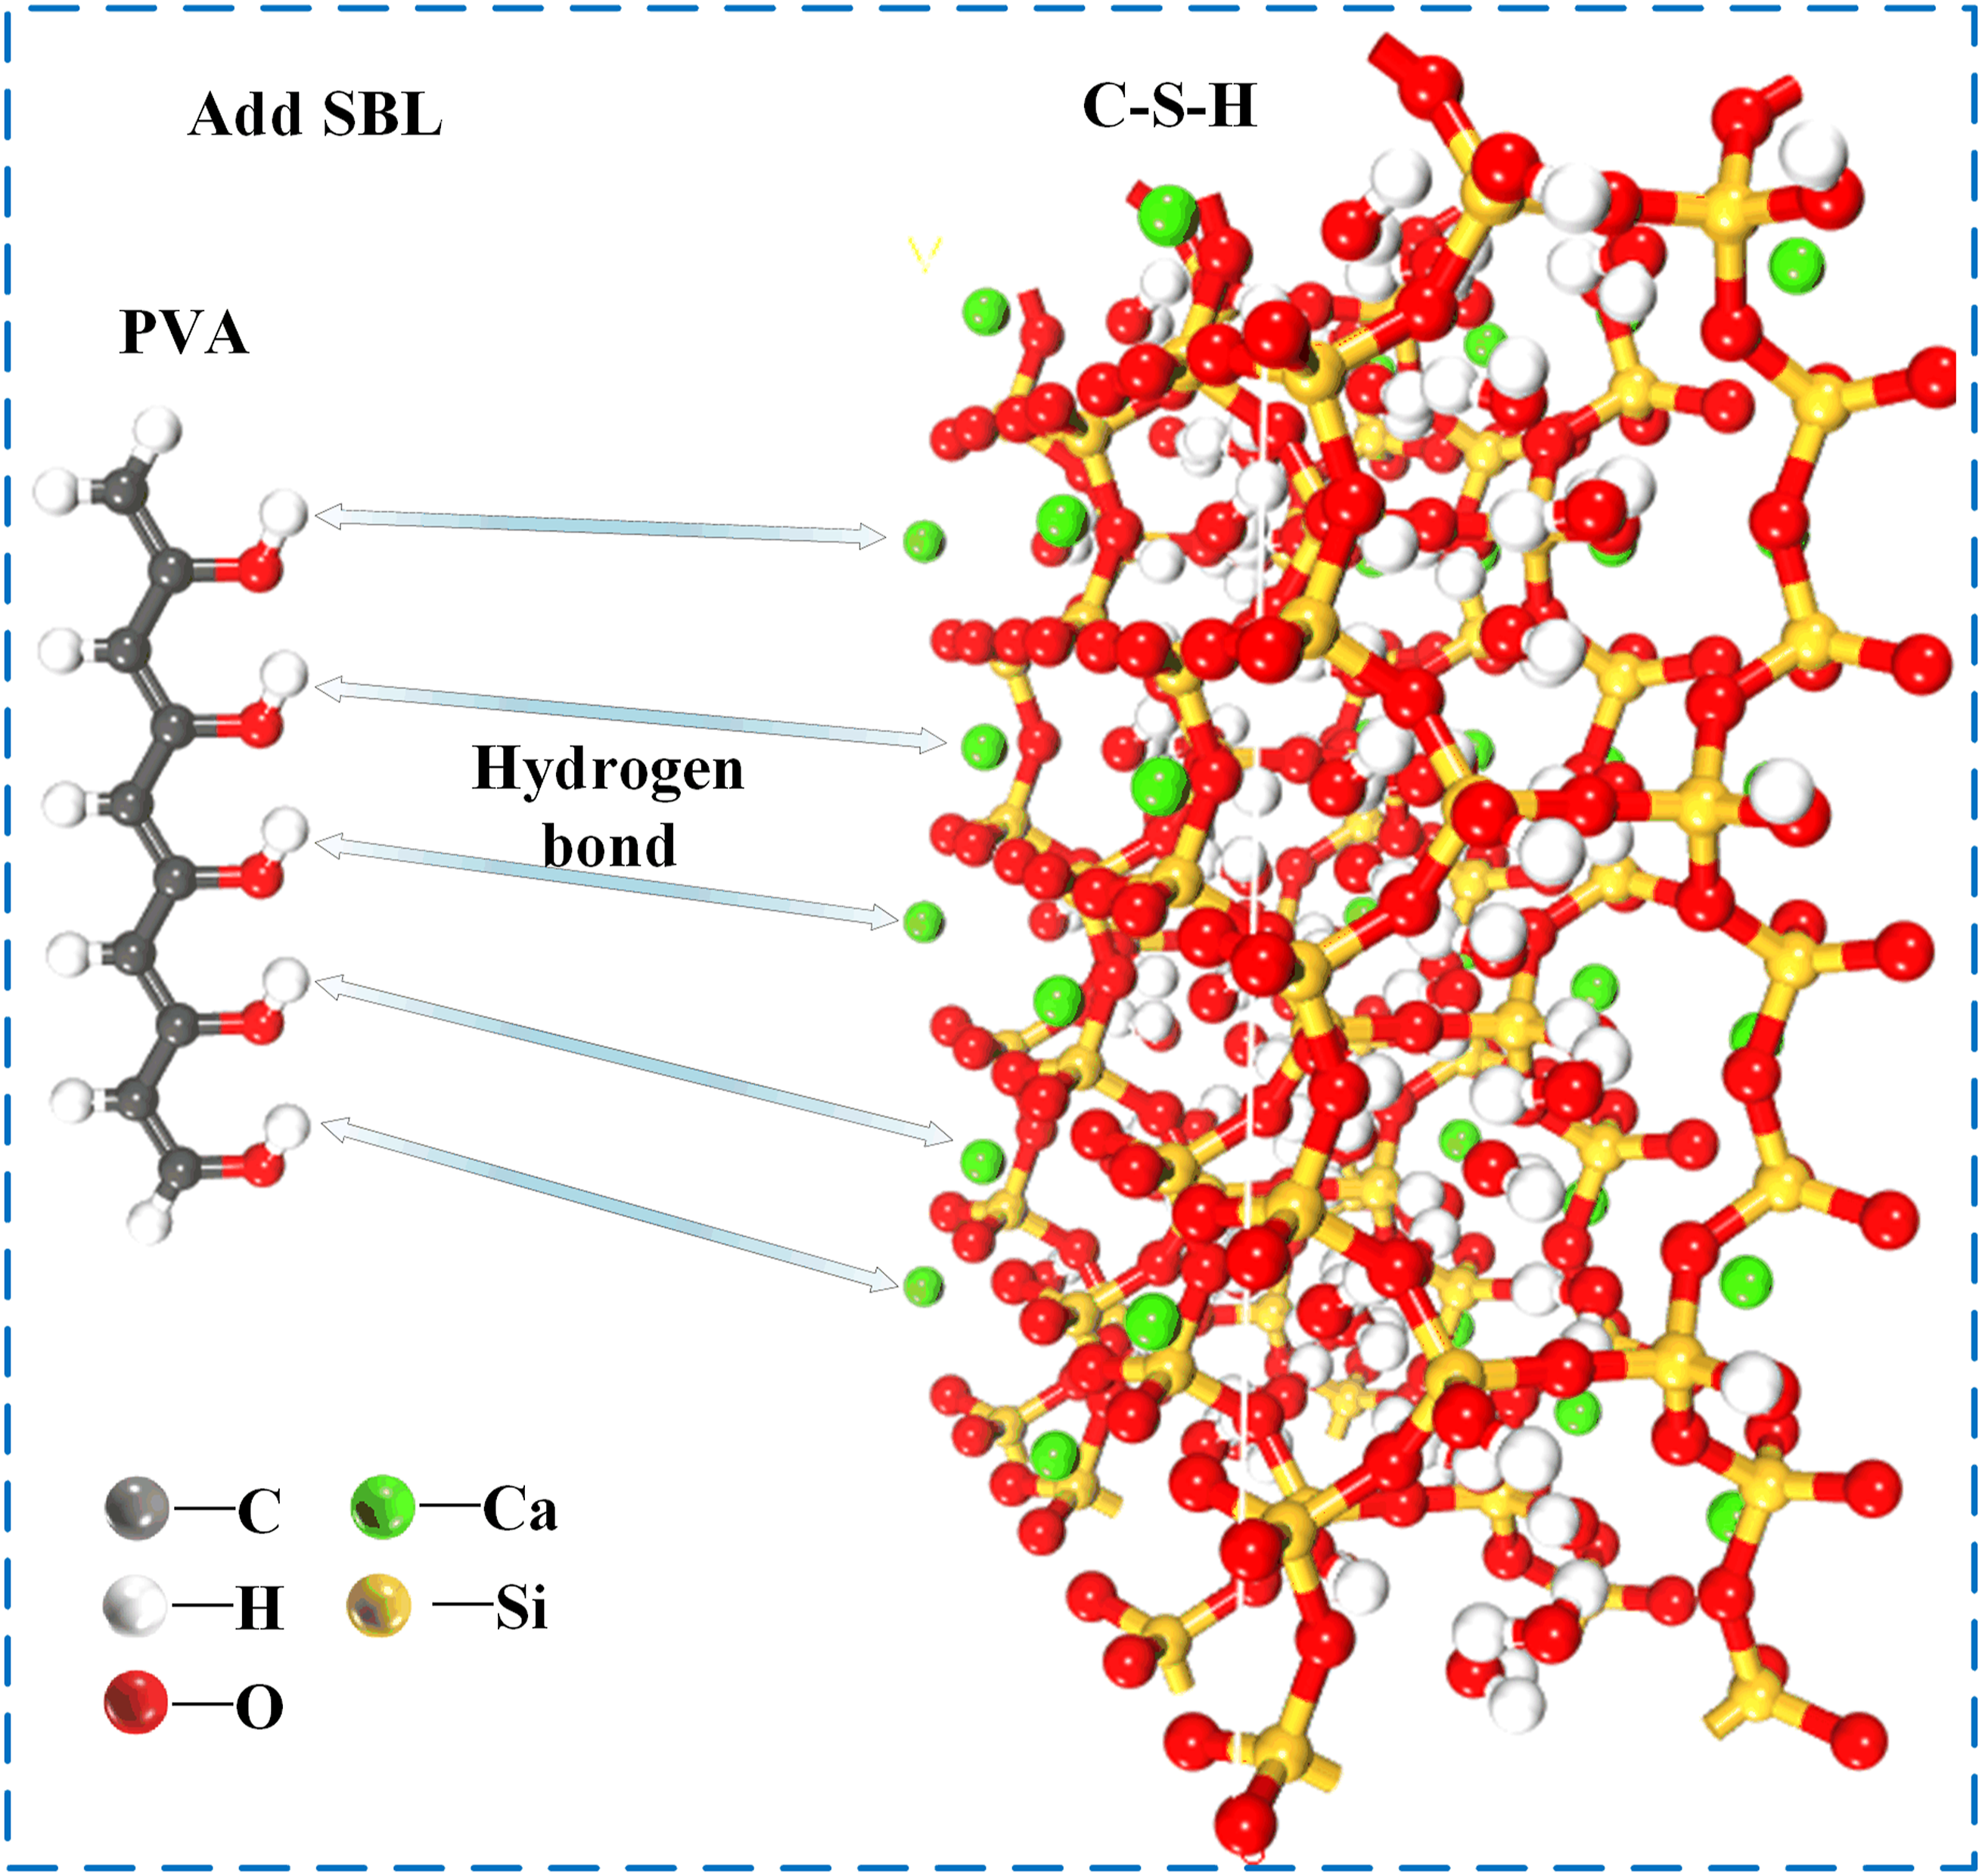
Conclusion
In this study, the synergistic strengthening effect of SBL on PVA concrete was tested. The effects of SBL on the microstructure of PVA were observed by SEM, and the changes of hydrate and functional groups on the surface of PVA were characterized by XRD and FTIR. The dynamic structure and static structure of the interface were analyzed by molecular dynamics. The multi-scale analysis draws the following conclusions: • The results of macroscopic mechanical tests show that SBL improves the weak interface transition zone between PVA and cement matrix, significantly improves the shear and flexural properties of PVA concrete, and makes up for the reduction of concrete compressive properties of PVA. • SEM observation shows that the addition of SBL improves the adhesion between PVA fiber and cement slurry, thus improving the mechanical properties of concrete. • XRD and FTIR analysis showed that the addition of SBL delayed the hydration of cement, increased the amount of hydrated calcium silicate gel, and optimized the composition of interfacial cement hydration products. • Through molecular dynamics simulation analysis, it was found that SBL could form stable hydrogen bonds between water molecules in PVA and C-S-H. Through the interaction between Ca ion and PVA, PVA fiber is effectively connected to C-S-H matrix, and the interface bonding strength is improved. • In this study, SBL has greatly improved the compressive, shear and flexural strength of PVA concrete, and has better compactness. This means that they can be used in concrete and mortar with high durability and performance.
Footnotes
Declaration of conflicting interests
The author(s) declared no potential conflicts of interest with respect to the research, authorship, and/or publication of this article.
Funding
The author(s) disclosed receipt of the following financial support for the research, authorship, and/or publication of this article: This research was funded by the Henan Province Science and Technology Research Project (232102320173), Funds Plan of Henan University of Technology (2020ZKCJ21), Zhengzhou Collaborative Innovation Project (21ZZXTCX09) and the Young Backbone Teacher Project of Henan University of Technology (2019).