
Abstract
Polyetheretherketone (PEEK), with good biocompatibility and similar mechanical properties to natural bone, is extensively employed in the manufacture of prostheses. However, the precision and mechanical properties of current implants are major challenges for clinical applications. In this study, the effect of pore size, raster angle and printing temperature were investigated on length, width, thickness, material consumption, compressive strength and Young’s modulus. Taguchi design of experiment method was used to reduce the number of experiments and optimize the printing process parameters. Finally, predictive analysis was exploited to give the optimal set of process parameters. Experimental results indicated that the approach applied in this work provided more accurate predictions and control of the response variables. The maximum compressive strength and compressive modulus of PEEK scaffolds reached 43.4 MPa and 253.3 MPa, respectively. Therefore, the methodology of present work has the potential to meet the demand of design precision and manufacture of customized bone substitutes.
Introduction
Compared to SLS technologies, fused deposition modeling (FDM) has been widely used in diverse application fields, such as medicine, automotive, electronics, construction and other fields.1–4 Simple operation, inexpensive machines, and durable parts 5 result in FDM being the most accessible and extensively used rapid prototyping (RP) technology 6 with its ability to build prototypes of complex and intricate shapes shorting production cycles and reducing cost. 7 Polyether ether ketone (PEEK), with excellent biocompatibility and high temperature resistance, similar density and mechanical properties to natural bone tissue,8,9 has been used as replacement for mental in some industrial fields.10,11 However, the mechanical properties and dimensional accuracy of PEEK-printed parts to meet the requirements of orthopedic applications are still a hot topic.12,13
Researchers have studied the impact of 3D printing parameters on FDM metrics in order to improve the condition of parts and guarantee reliable structural performance by maximizing mechanical properties.14,15 Three-point bending of the specimens printed horizontally was examined. 16 The effects of the printing path and printing speed on the mechanical properties of PEEK samples were evaluated.17,18 The maximum strength of PEEK (74.2 MPa) was achieved with a printing speed of 30 mm/s and a printing raster angle of ±15°. Using the Taguchi method for experimental design, it was concluded that a decent Young's modulus could be obtained by setting the nozzle temperature, printing speed and bed temperature to high levels and setting the layer thickness and radiation temperature to low levels. 19 Experiments were conducted on cylindrical parts fabricated by nanocomposite deposition to examine the influence of build orientation on compressive strength. The results indicated that the oblique specimens possessed the greatest compressive strength compared to the axial specimens. 20 Nozzle temperature and layer height were the process parameters that significantly influenced the resultant roughness as well as the elastic modulus measured by using the Taguchi method along with the analysis of variances. 21 The new fractal structure improved the first cracking strength and residual bearing capacity in the three-point bending test. 22 Different FDM process parameters: printing speed, layer thickness, printing temperature and extrusion width were carried out by Taguchi method and the tensile strength of the specimens was improved.23–25 The best comprehensive mechanical properties were achieved for pure PEEK fabricated along the horizontal zero-degree direction. 26
Lot of studies have focused on the effect of printing speed, layer thickness, nozzle temperature, infill pattern, and infill density on the tensile or flexural properties of FDM-3D printed specimens using the Taguchi DOE method.27–29 However, less attention is paid to the printed parts’ attributes (e.g., dimensional accuracy, weight and compressive properties), which results in printed parts that do not meet the needs of the clinical application. The mismatch in properties contributes to the loosening or dislodging of implants. To a certain extent, a solution to such a problem is urgently required. Customization to achieve the demands of the application is becoming a practical mainstream. The objective of the present study was to optimize the process parameters by employing the Taguchi DOE method to seek the best combination of each response variable to meet different needs. The process parameters were pore size, infill angle and printing temperature. Analysis of variance (ANOVA),30,31 S/N ratio and means plots were used to help determine the optimal level of each process parameter. Predictive analysis was exploited to define a set of parameters.
Experimental
Preparation of Filaments and Scaffolds
Polyetheretherketone (PEEK 550G, Jilin Joinature Polymer Co., Ltd; China) was selected as the building material. Prior to preparing filaments, PEEK was dried at 120°C overnight to remove any moisture before the extrusion. The dried PEEK pellets were performed in a twin-screw extruder (SJZS-10B, Wuhan Ruiming Experimental Instrument Co., Ltd; Wuhan, China), from which printed filaments for fused filament fabrication (FFF) with a diameter of 1.75 ± 0.1 mm were extruded and wound with a micro traction winder (Wuhan Ruiming Experimental Instrument Co., Ltd; Wuhan, China). Before printing, the filaments were put into the oven at 120°C for 2 h to remove moisture. A 3D model of a cubic porous scaffold sample (Figure 1) of 10 mm in length, width and thickness was modeled using Solidworks software and exported in STL format. The import file was converted to the G-code by slicing software (IEMAI 3D EXPERT). Finally, the prepared PEEK filament was printed using a high-performance 3D printer (MAGIC-HT-M, Imai Intelligent Technology Co., Ltd; Dongguan, China) to produce the scaffolds at a print speed of 30 mm/s with 0.2 mm layer thickness. The schematic drawing of 3D printing process.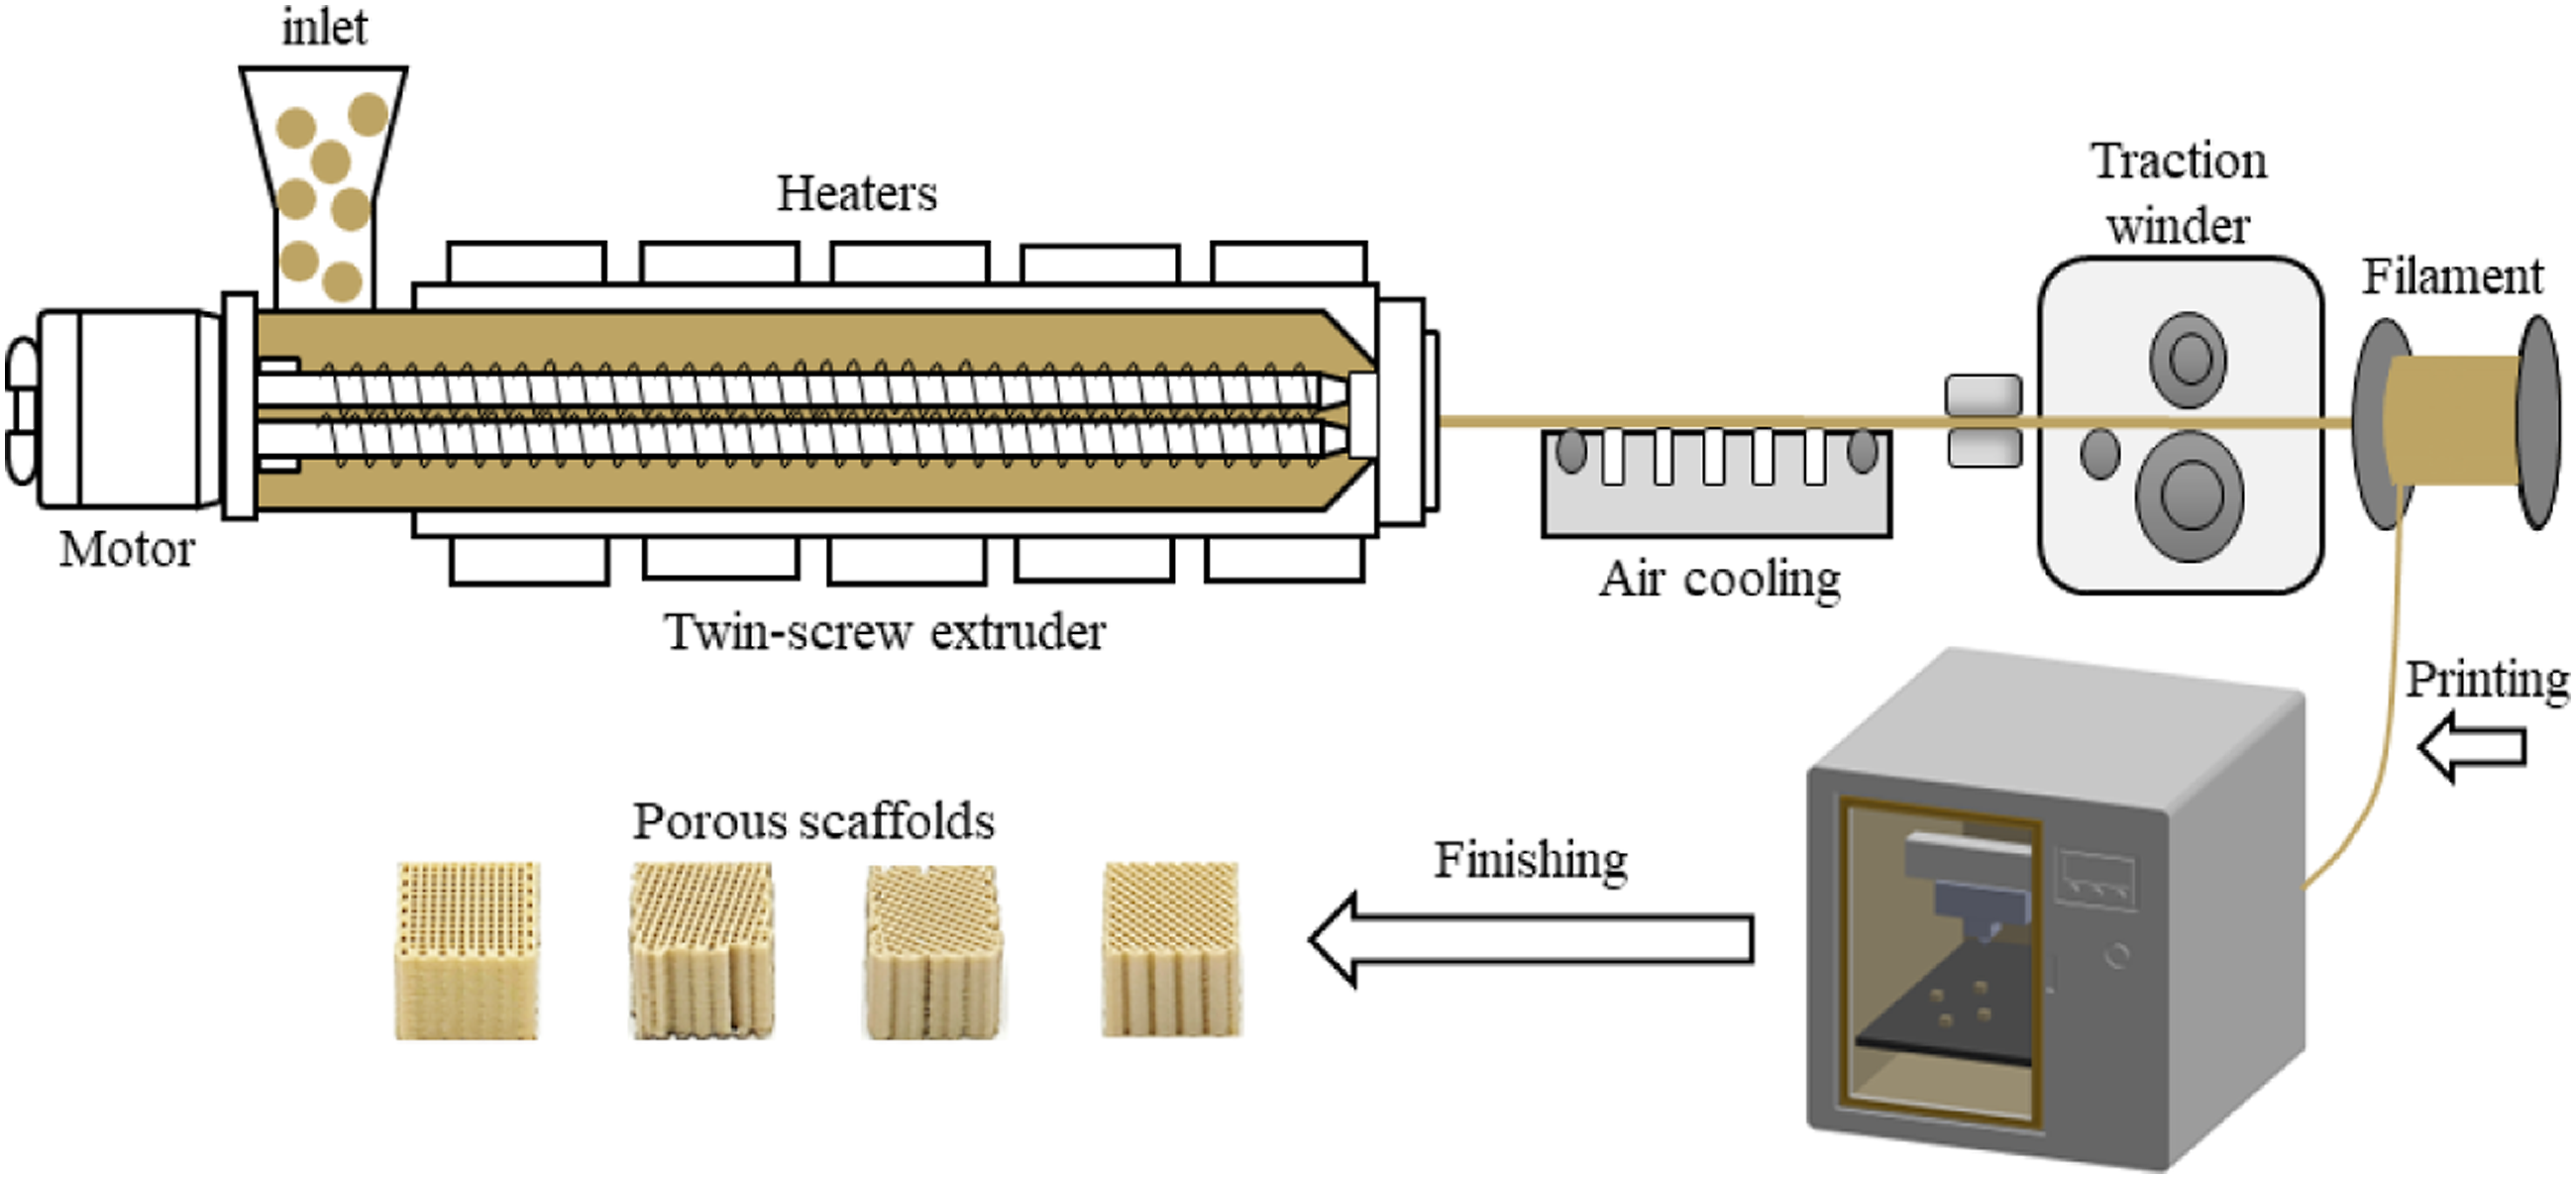
Variable printing parameters
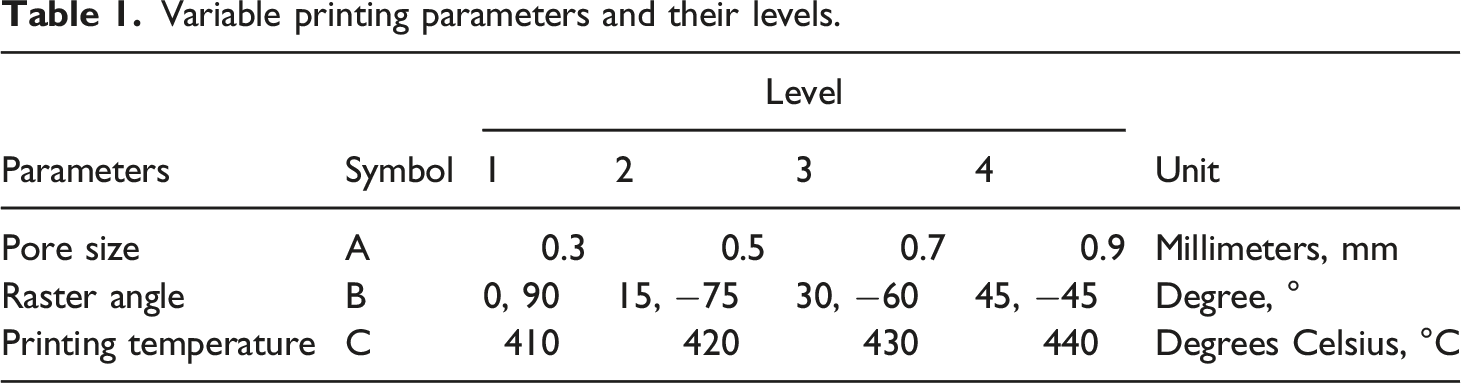
Variable printing parameters and their levels.
Mechanical properties and measurement accuracy
For the purpose of evaluating the effects of pore size, raster angle, and printing temperature on the mechanical properties and material consumption of the scaffolds, a caliper with an accuracy of 0.01 mm was used to estimate the length (L), width (W) and thickness (T) of the scaffolds (n = 5). Three measurements were taken for each of the dimensions as shown in Figure 2(a), and they were averaged. In addition, dimensional measurement accuracy was calculated using equation (1).
32
3D model of porous scaffolds and testing method of mechanical properties: measurement positions of the scaffolds (a) and scaffolds compressed along X or Z-axis direction (b).
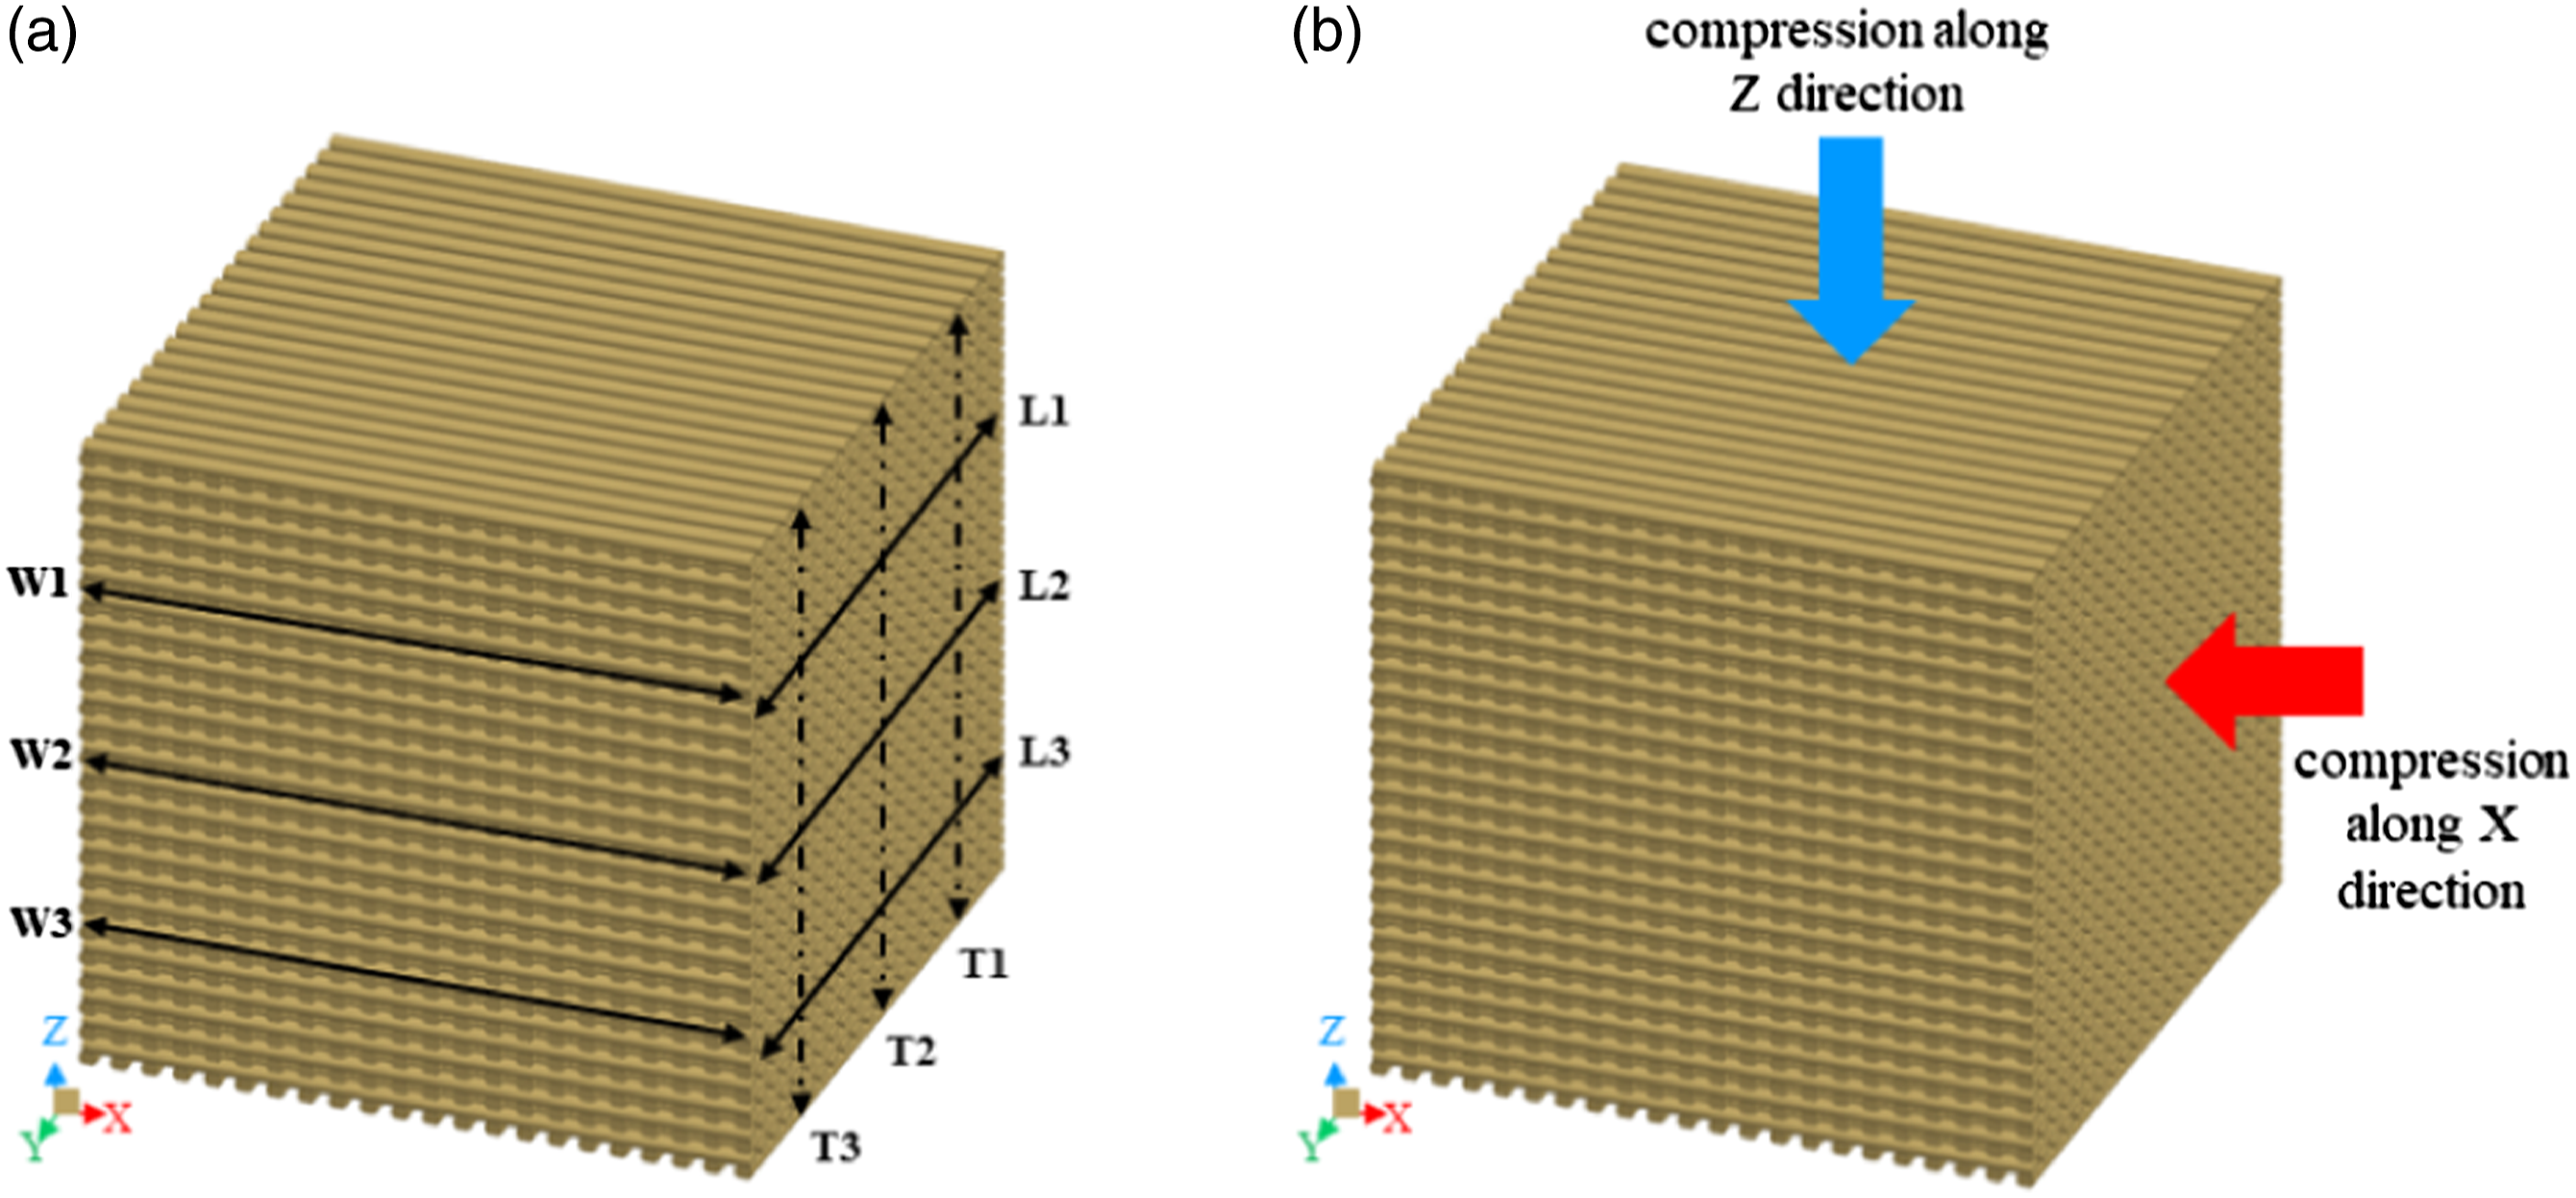
The material consumption of the scaffolds (n = 5) was quantified by the weight of the scaffolds and weighed by electronic balance (FA-2104, Shanghai Sunny Hengping Scientific Instrument Co., Ltd; Shanghai, China) with an accuracy of 0.1 mg. Besides, the scaffolds (n = 5) were compressed parallel along the X-axis printing direction and vertically along the Z-axis printing direction (Figure 2(b)), respectively, with a compression speed of 1 mm/min. The compressive test of the samples employed an electronic universal testing machine (UTM-4204, Shenzhen Sansi Zongheng Technology Co., Ltd; Shenzhen, China). The data obtained from the test were pre-processed using the Excel software to calculate the values of compressive strength and modulus for each scaffold.
Design of experiments
To analyze the effect of printing parameters on the response variables, the L16 orthogonal array was adopted. For each unique combination of the 16 trials included in the design, five replications were performed in a randomized order. The S/N ratio has three types, including nominal is the best, larger the better, and smaller the better. According to the principle that the variability decreases when the S/N ratio reaches a maximum, the weight of the scaffold and the dimensional accuracy were analyzed using the criterion of the S/N ratio smaller the better. For the compressive strength and modulus, the tendency was to select the S/N ratio larger the better, because these variables should be maximized for enhancing the mechanical performance of the part. The S/N ratio “larger the better” was obtained using equation (2).
33
“Smaller the better” was calculated through equation (3).
33


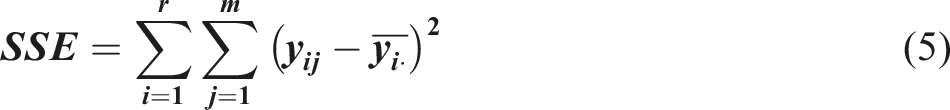
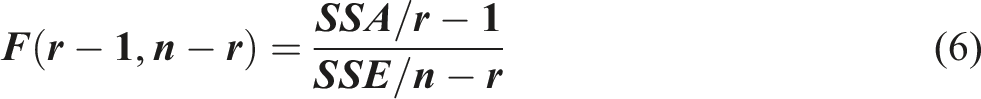
ANOVA was used to estimate the significance of each parameter, determine the percentage contribution of each process parameter and determine the percentage contribution of the error. In the analysis process, 0.05, the significant level, was used. The equations (4)–(6)
33
are required in the ANOVA calculation as follows.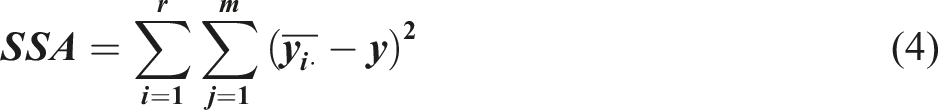
Results and discussion
DOE plays a critical role in the whole quality control process. The Taguchi method is the most common quality engineering technique, 34 which has been widely used in various process optimization and product design studies. 35 The method involves the use of an orthogonal array for performing experimental trials, a signal-to-noise ratio plot for reducing process variability, and a means graph for tuning the process to the desired values, which chooses the control level combination of the parameters. In this case, the Taguchi method was selected to reduce the number of experiments required as well as to obtain the significance and sensitivity of the parameters. 36
Experimental results of Taguchi’s L16 orthogonal array.
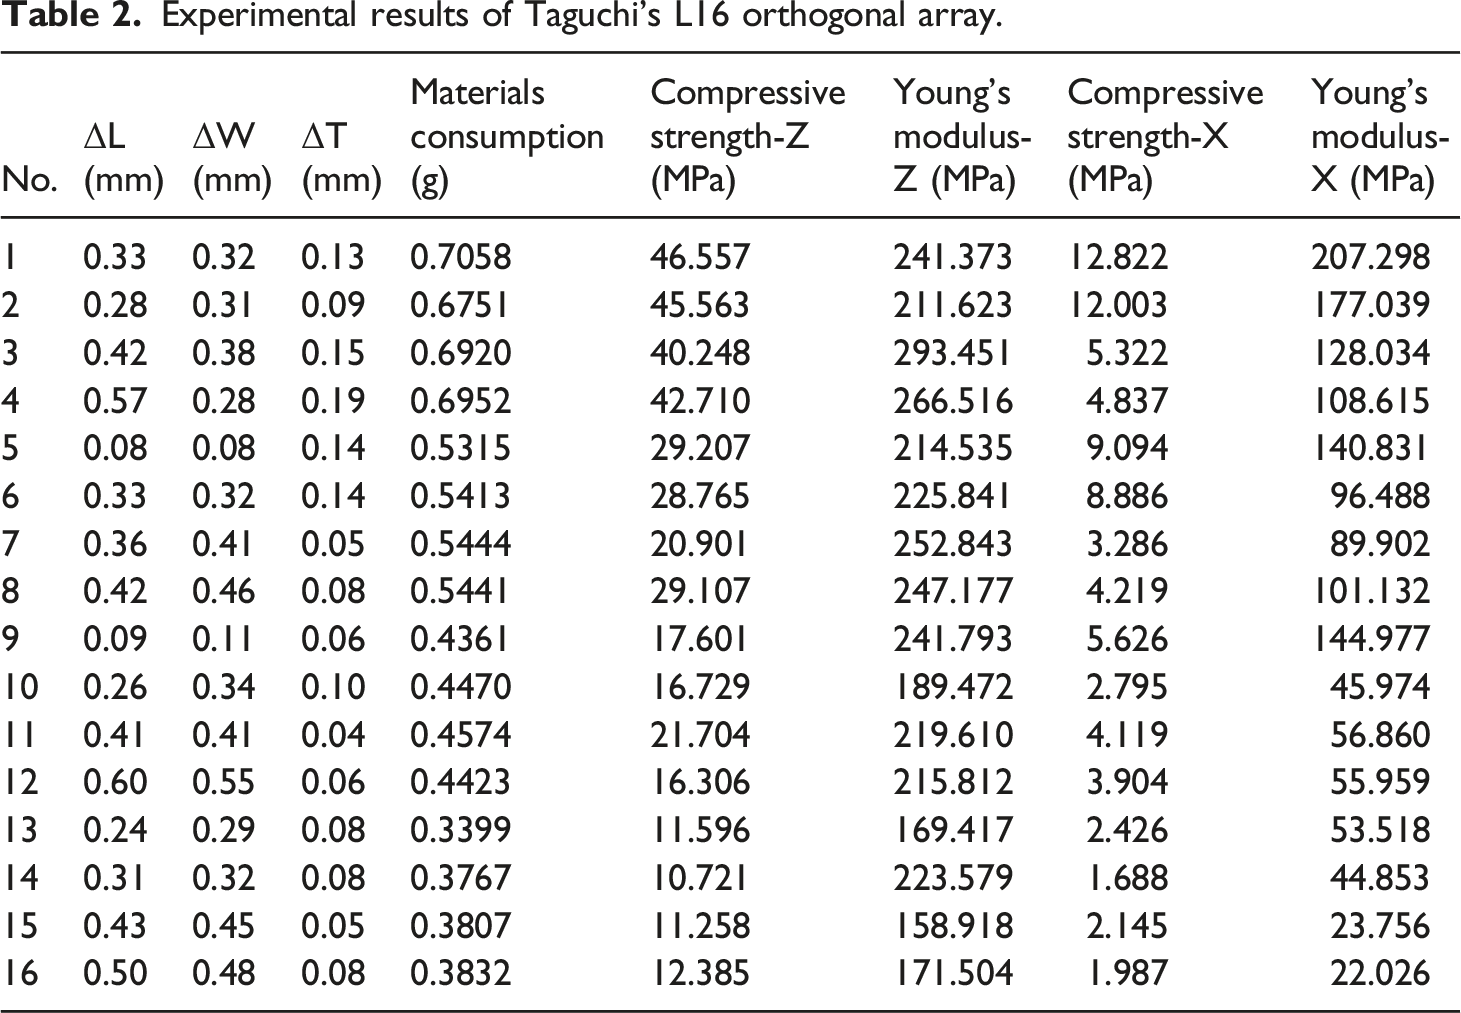
To eliminate the impact of the scaffolds variation on experimental results, five scaffolds were printed for each trail to repeat the experiment. Hence, Figure 3 presented only one of stress-strain curves from the 16 experiments listed in Table 2. As observed from Figure 3 and Table 2, sample one shown the maximum compressive strength when compressed along the Z-axis and X-axis, respectively. The maximum modulus for compression along Z-axis was sample 3, while the largest modulus could be obtained for X-axis compression by sample 1. The sample 14 also exhibited minimal compressive strength whether along the Z direction or X direction. With compression along Z-axis, the minimal modulus was found from sample 15, whereas sample 16 shown the minimum modulus for compressing along X-axis. And the failure process could be acquired in Figure 3. Stress versus strain curve. (a) Compression along Z-axis. (b) Compression along X-axis.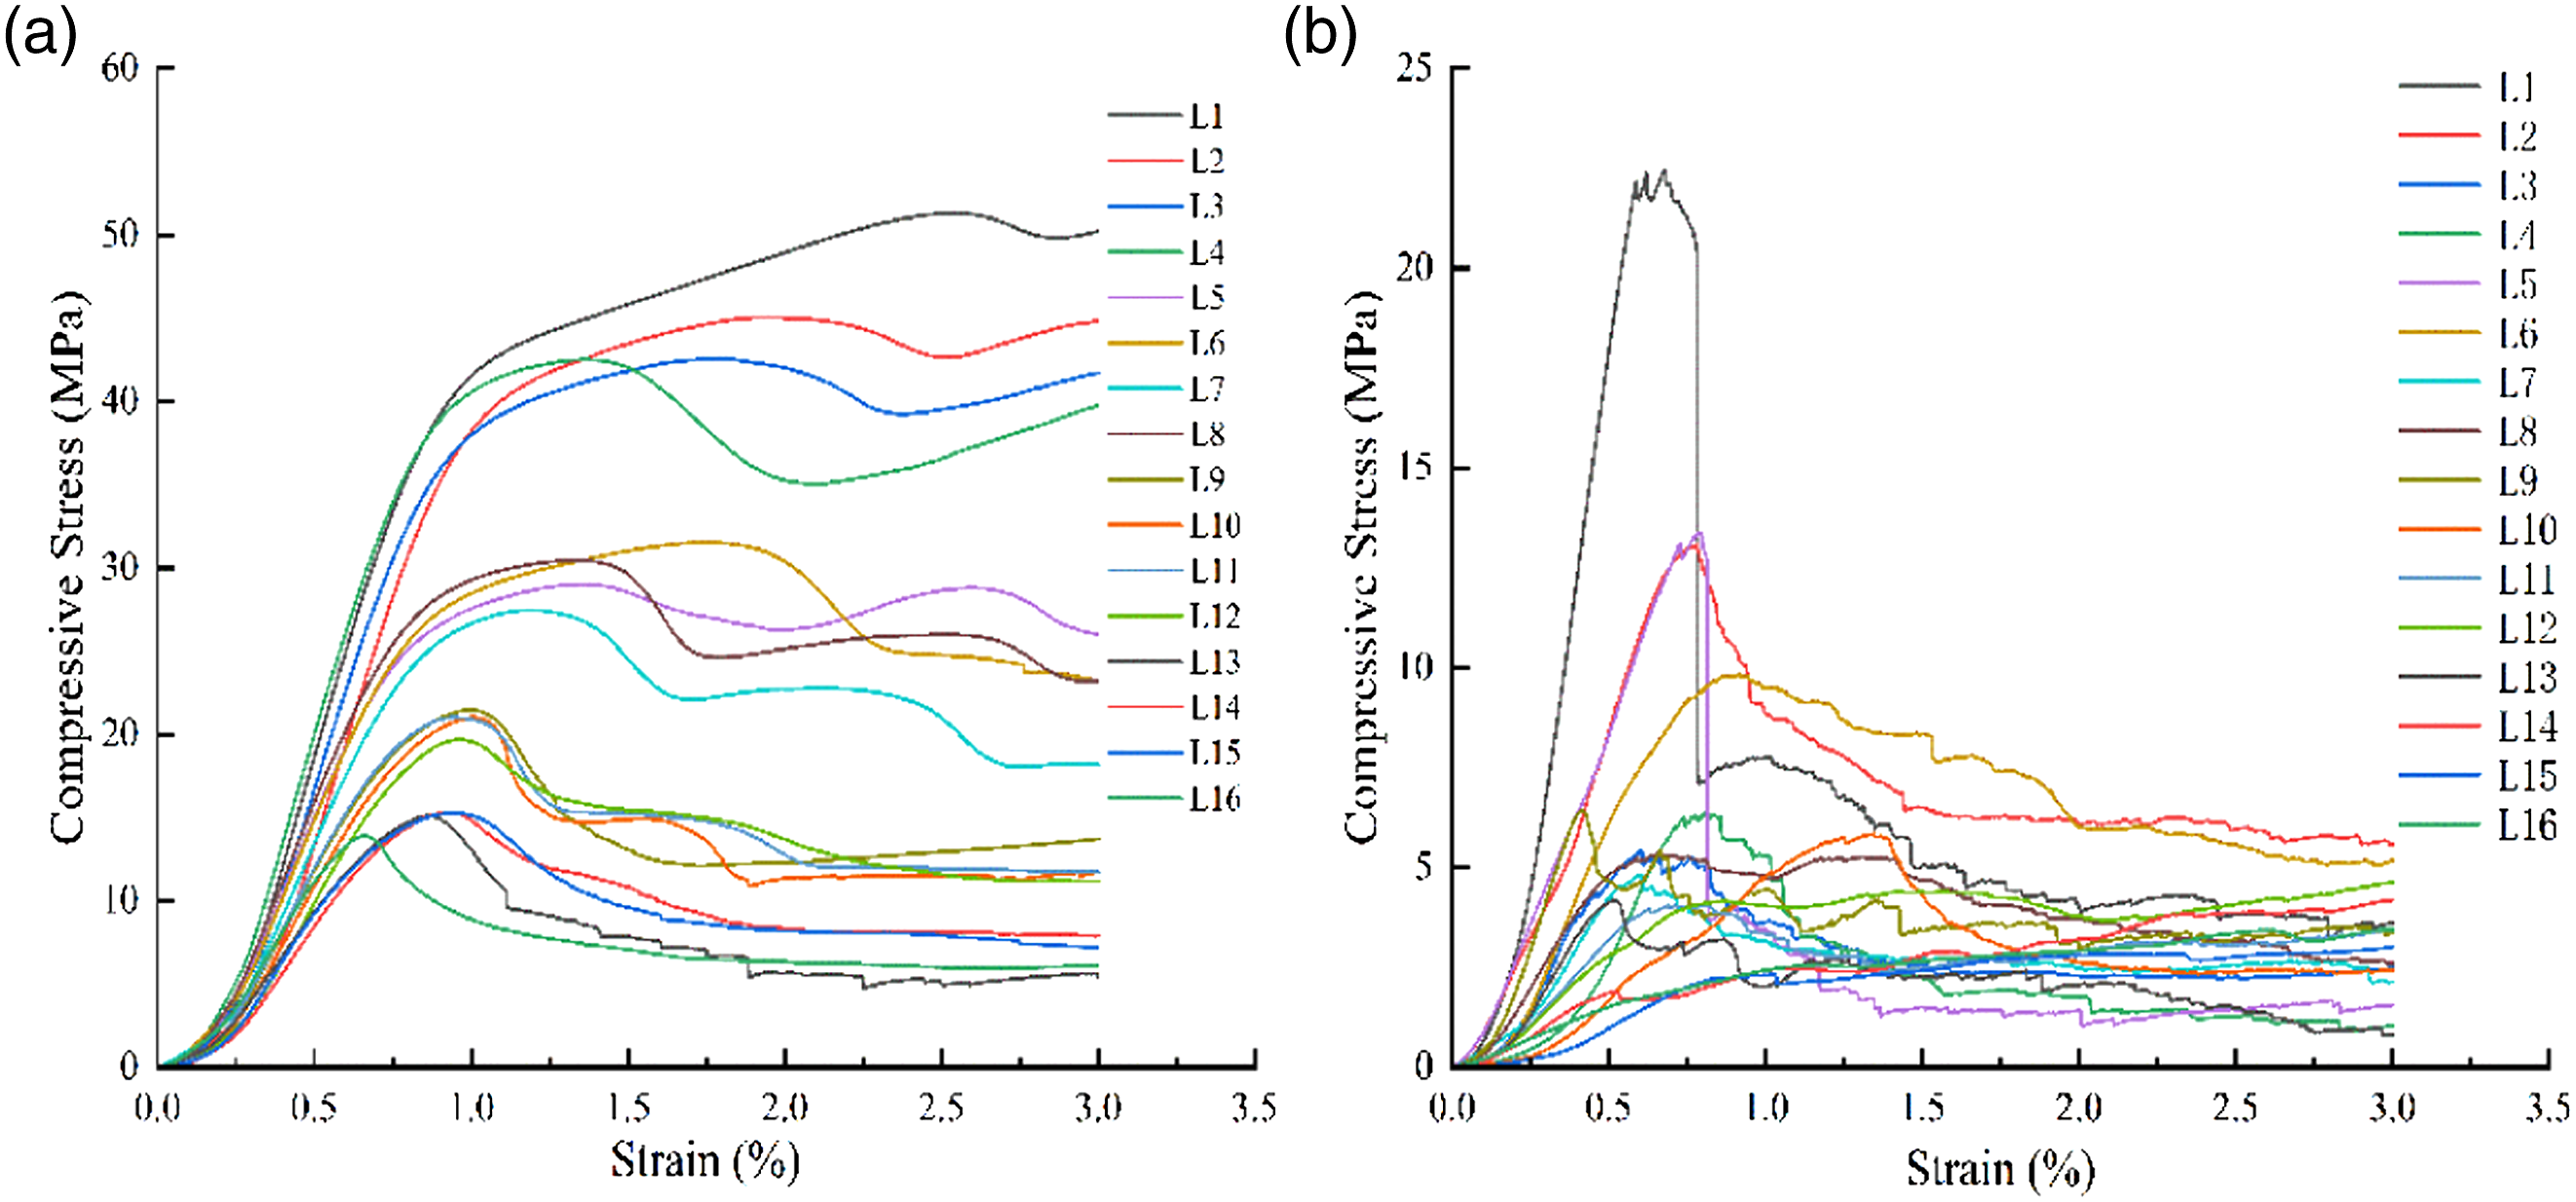
Mian effect plots of means and S/N ratio
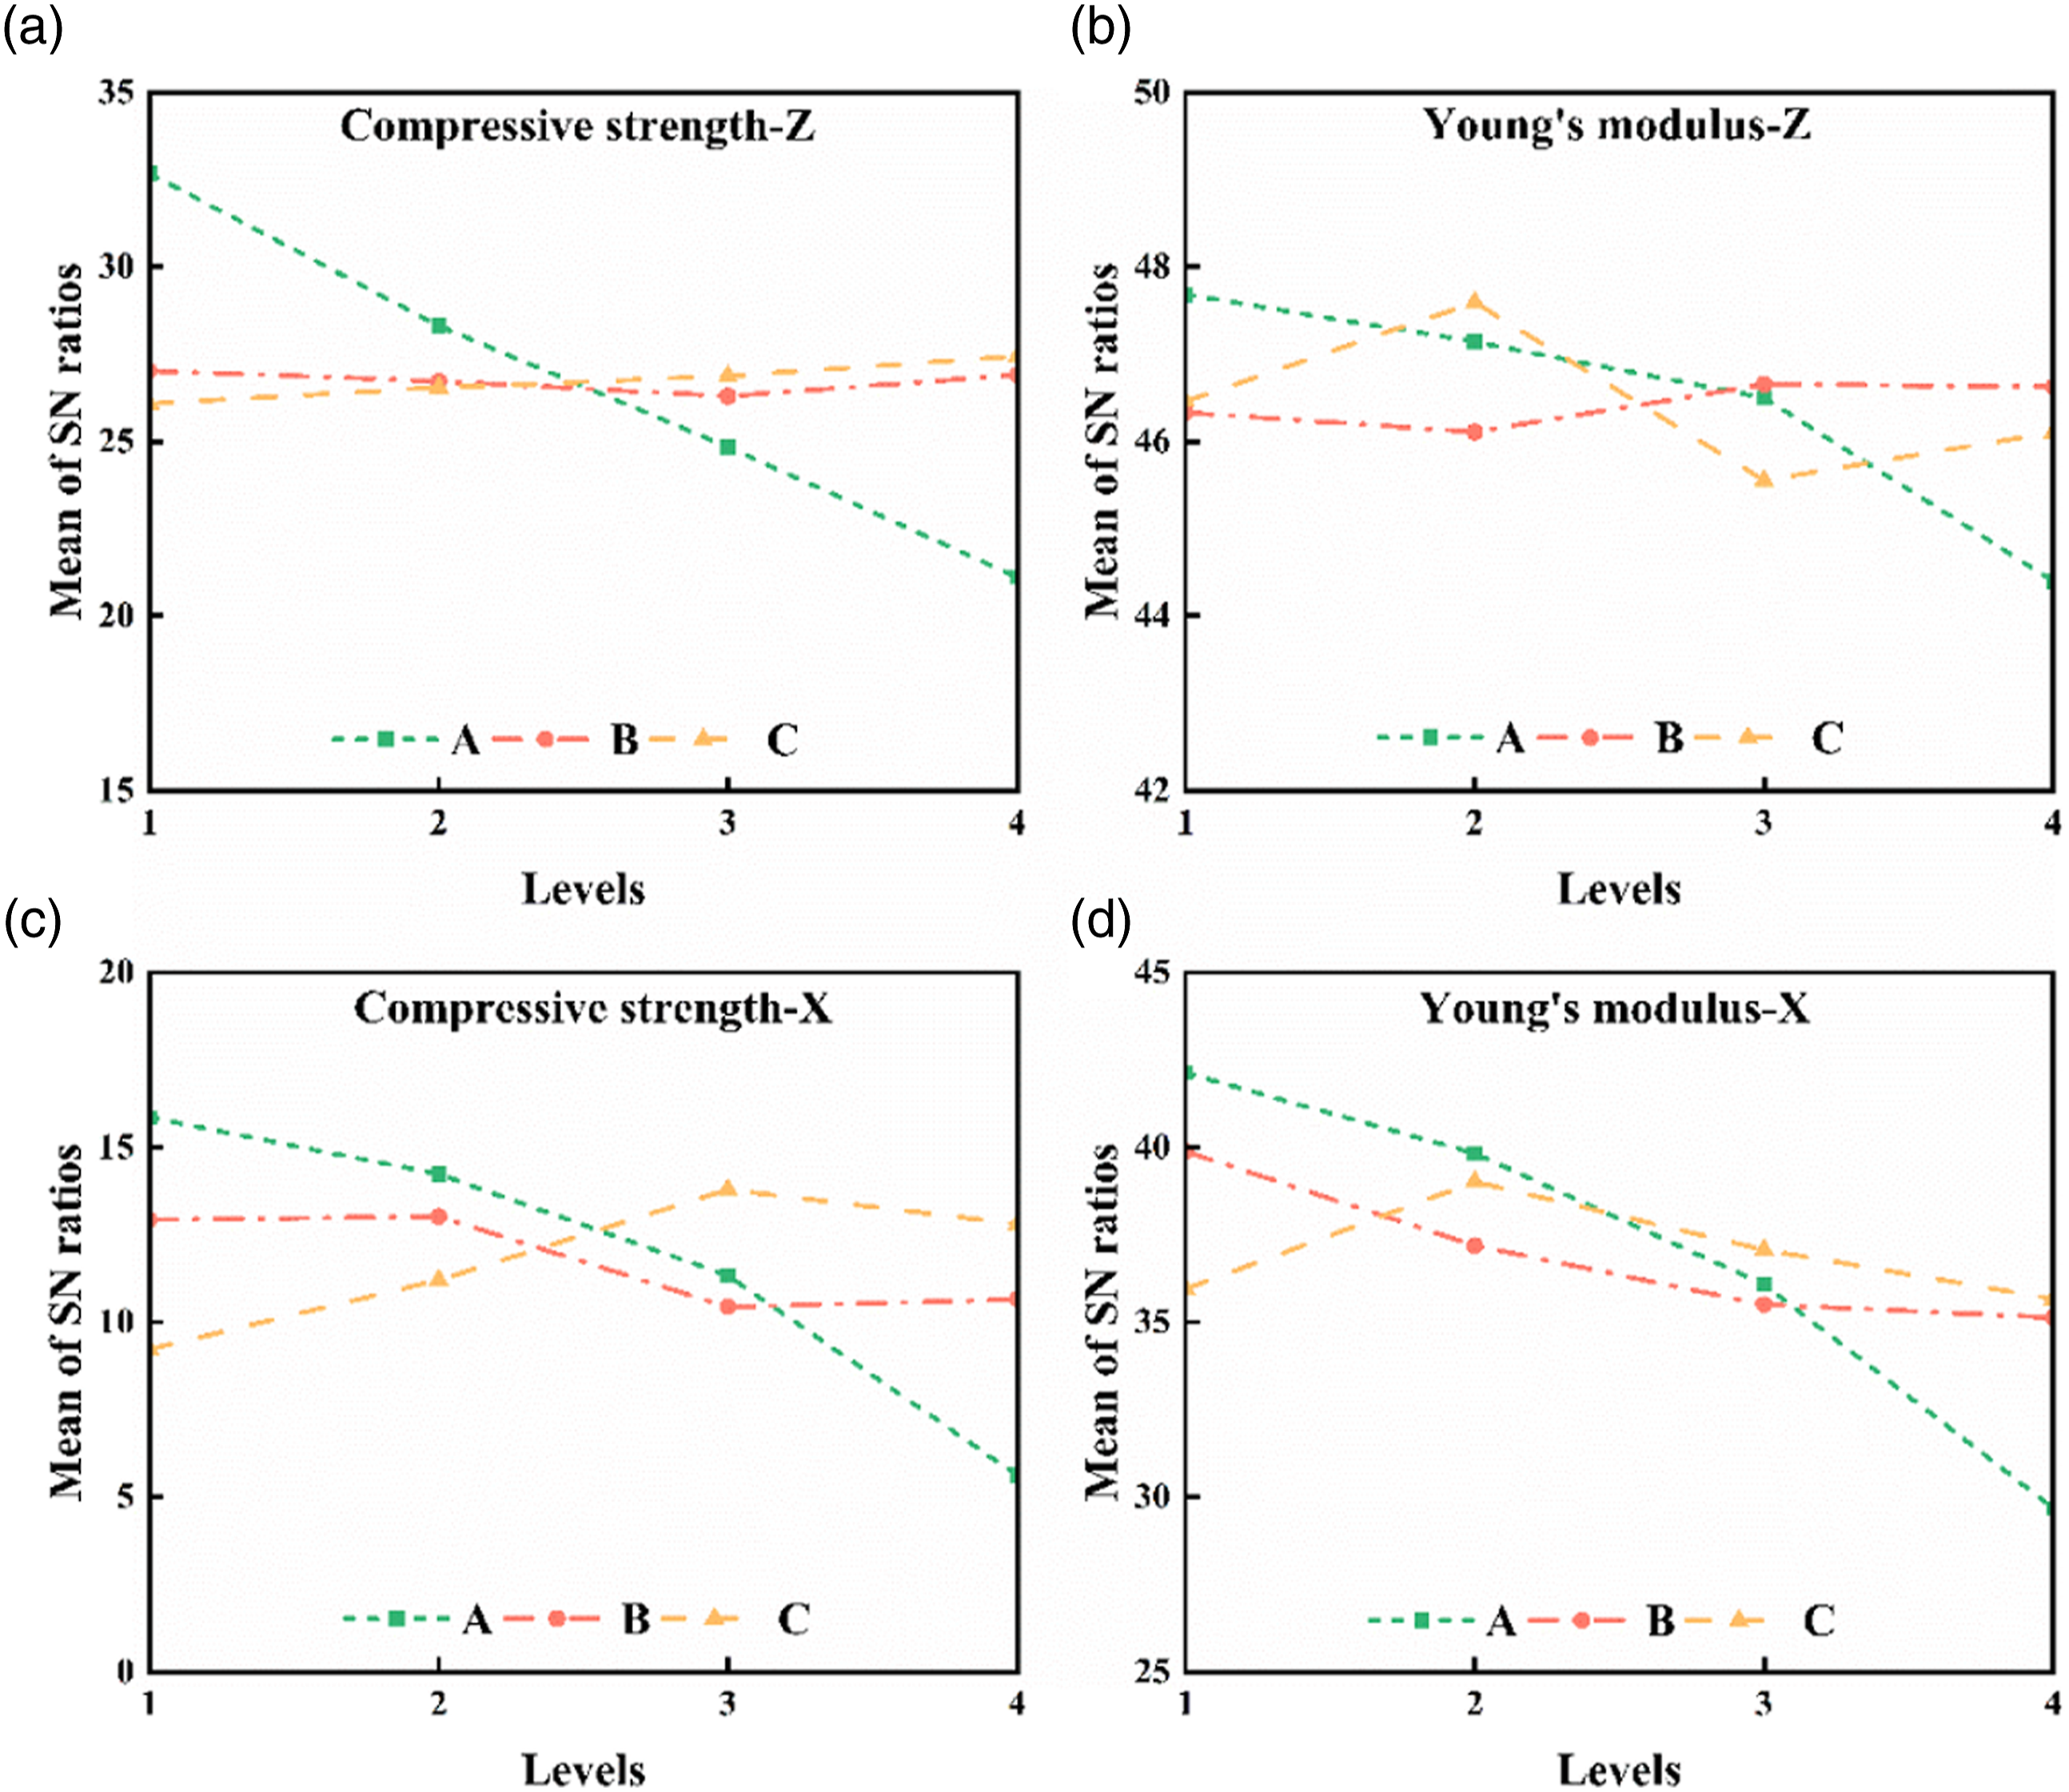
The means analysis and the S/N ratios graphs for each level of each variable correspond to the Figures 4 and 6 and Figures 7 and 8, respectively. Mean effect plot. (a) 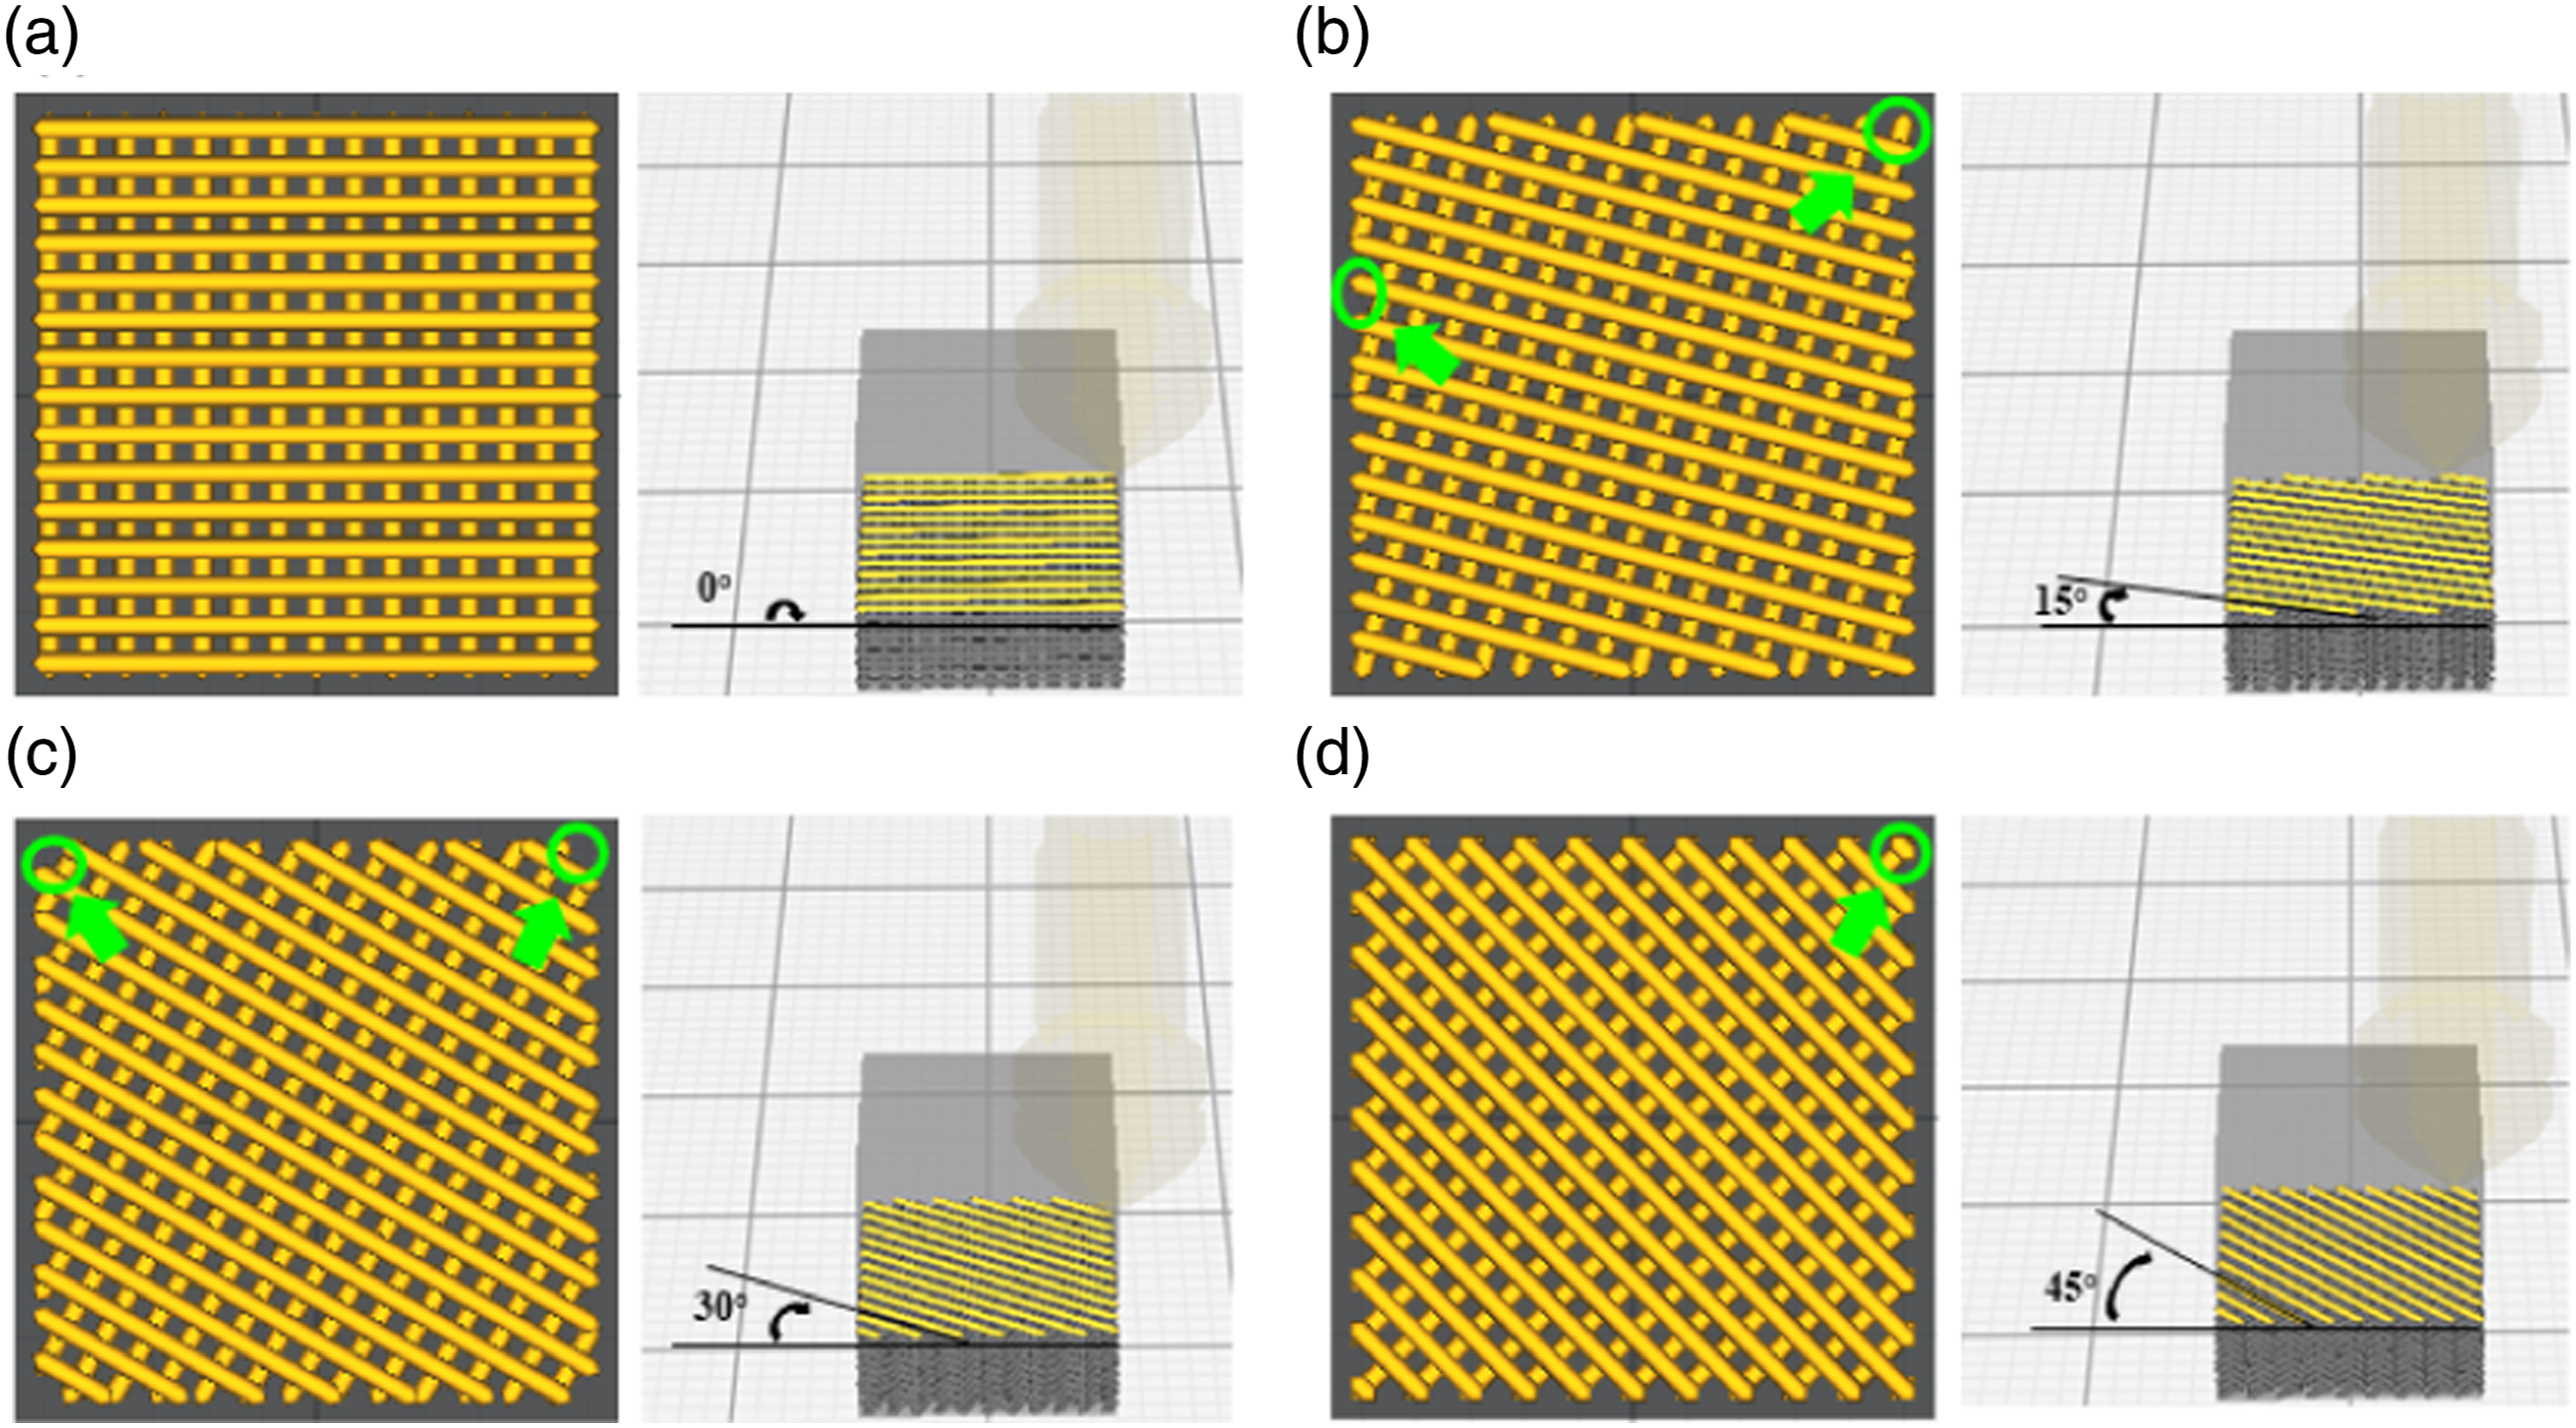
At the printing temperature of 420°C, the smallest deviation in dimensional accuracy about Schematic diagram of infill angle.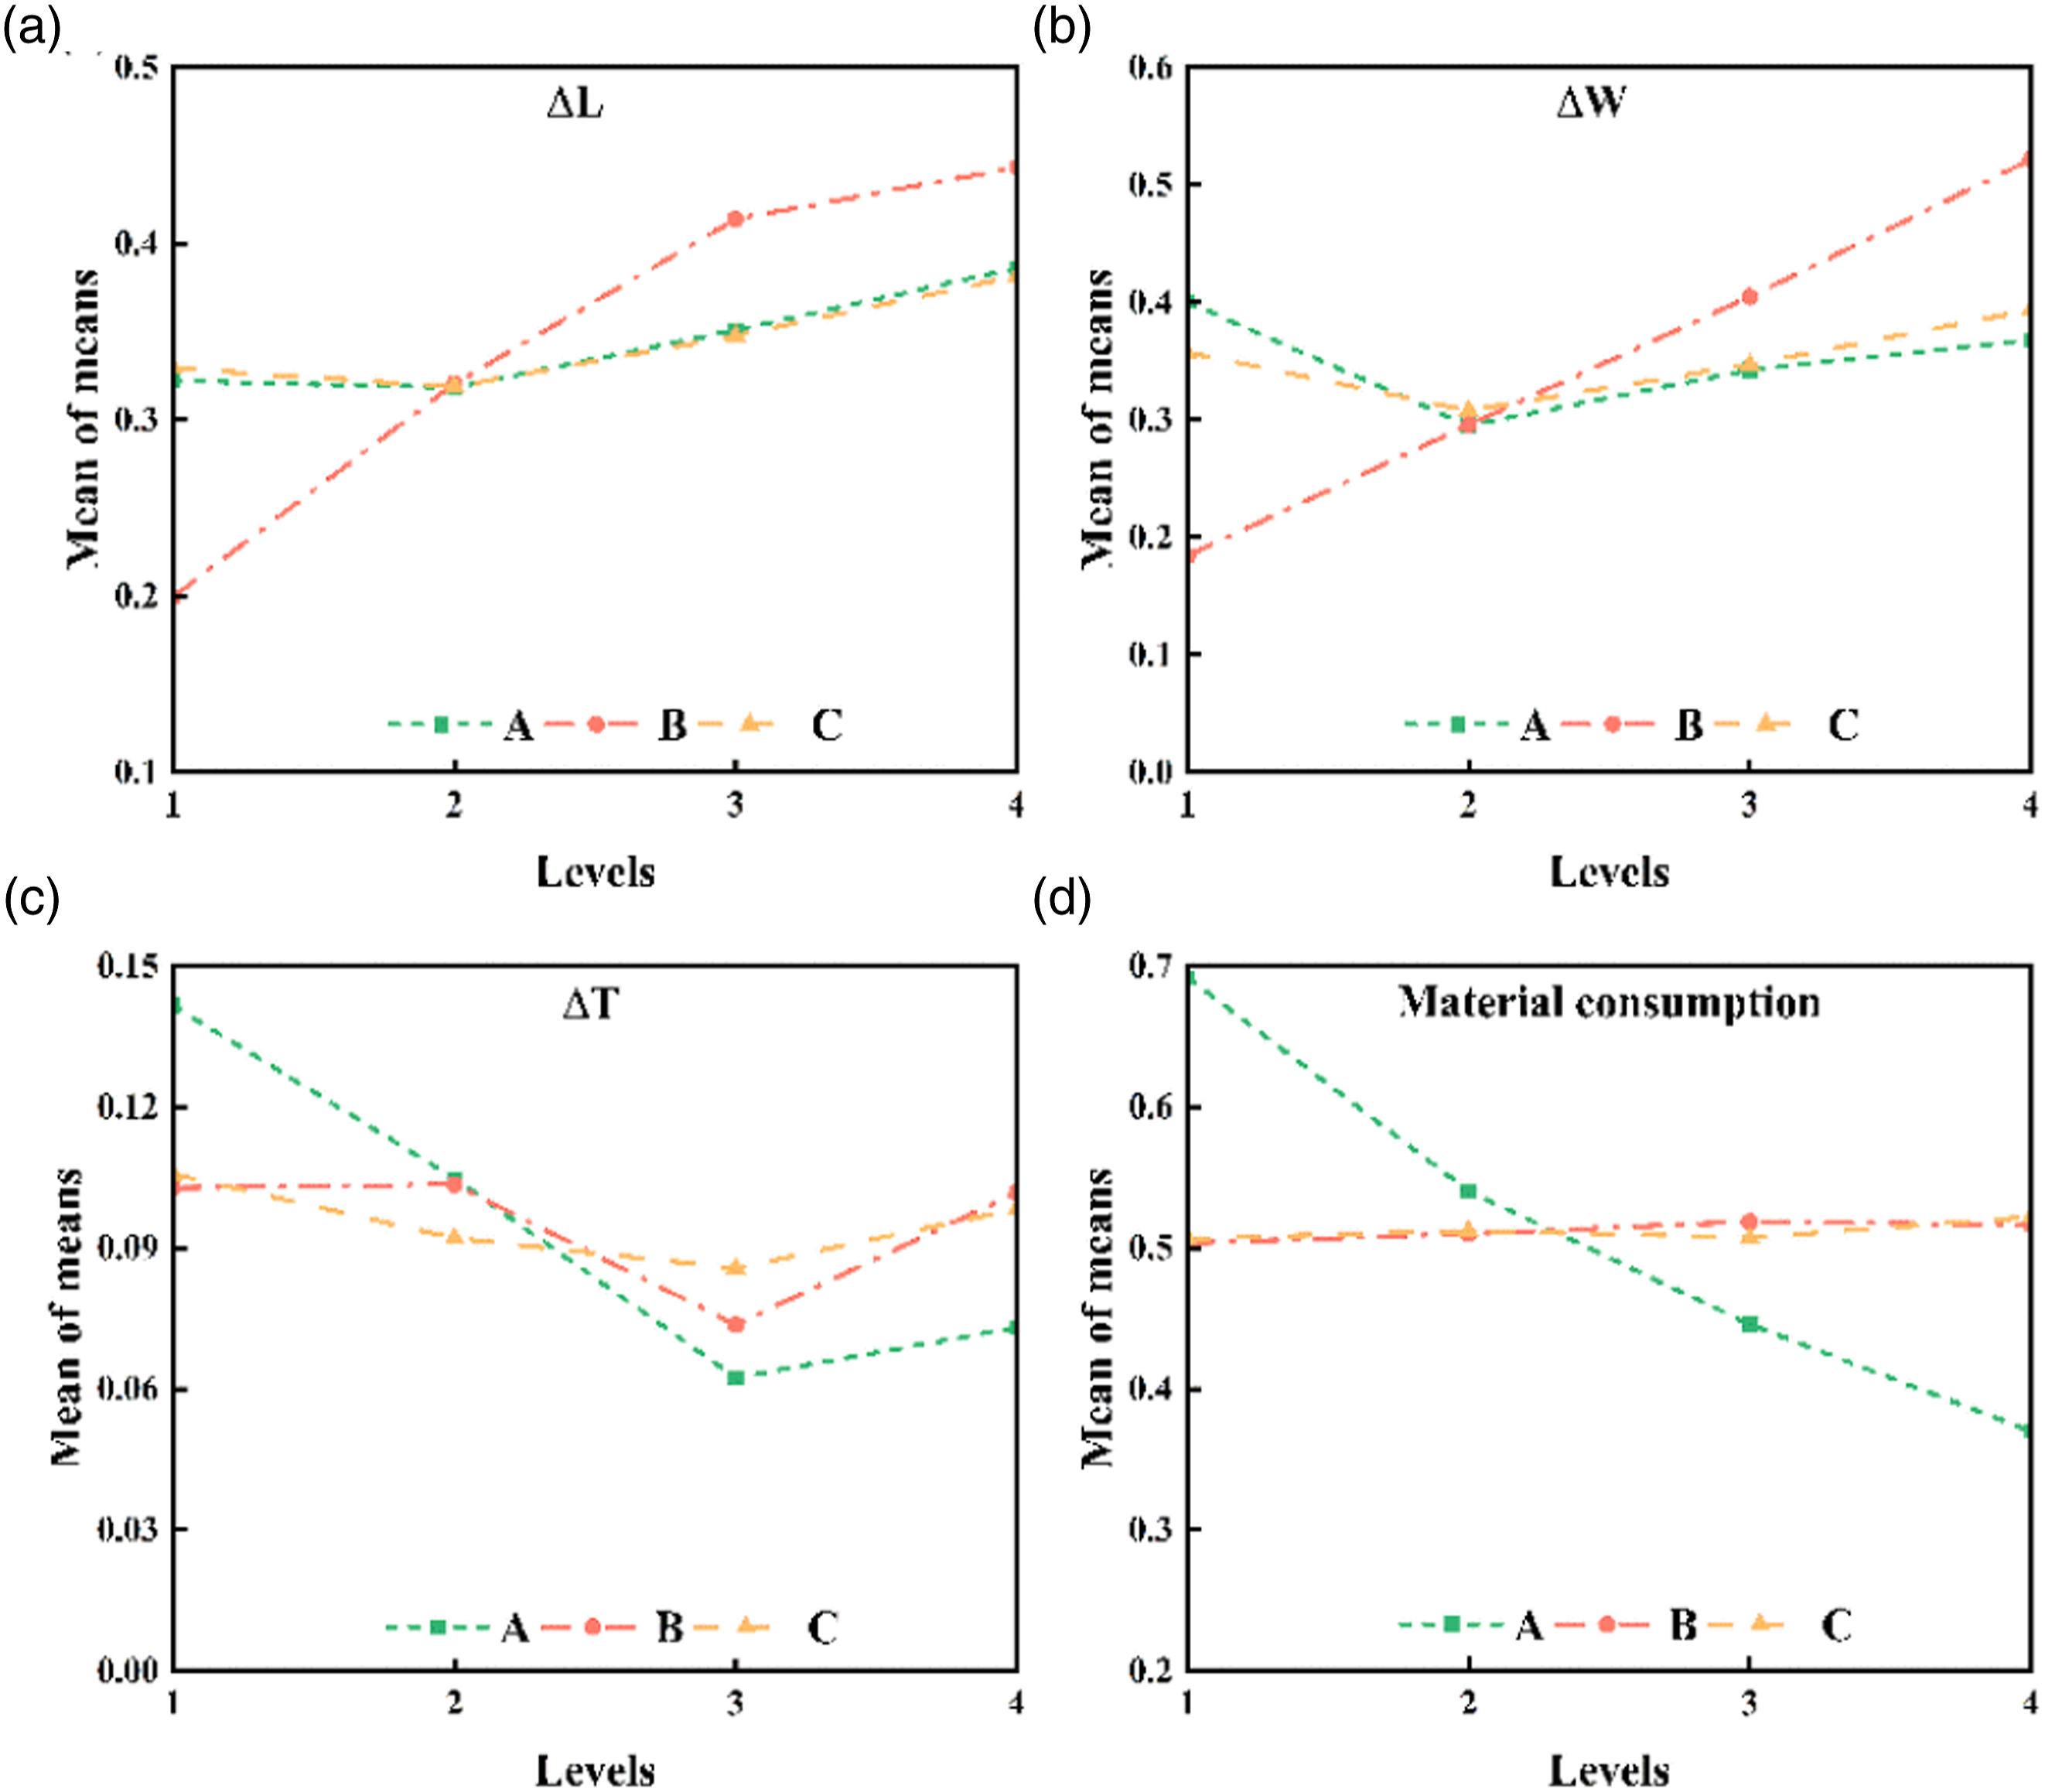
The dimensional deviation corresponding to
The effect diagrams of compressive strength and the modulus were shown in Figure 6. On the compressive strength of the scaffolds compressed along the Z and X axes respectively, the compressive strength was maximum at the lowest values of pore size and infill angle, with the printing temperature of 440°C. The compressive strength compressed along Z and X direction decreased from 43.4 MPa to 11.5 MPa and from 8.8 MPa to 2.1 MPa as the pore size enlarged from 0.3 mm to 0.9 mm. Young’s modulus along the Z-axis was significantly higher than that of scaffolds along the X-axis with the same pore size. The Young’s modulus of the scaffold ranges from 253.3 MPa to 36.1 MPa. To some extent, the printing temperature would affect the compressive strength. Compared to the X-axis, the increase in compressive strength in the Z-axis was smaller as the printing temperature increases. The mechanical properties obtained for the scaffolds were similar to those of natural bone at all factor levels upon compression along the x-axis, unless the mechanical properties of the scaffolds with pore sizes of 0.7 mm and 0.9 mm and infill angles of 30° and 45° were less satisfactory. Mean effect plot. (a) Compressive strength-Z. (b) Young’s modulus-Z. (c) Compressive strength-X. (d) Young’s modulus-X.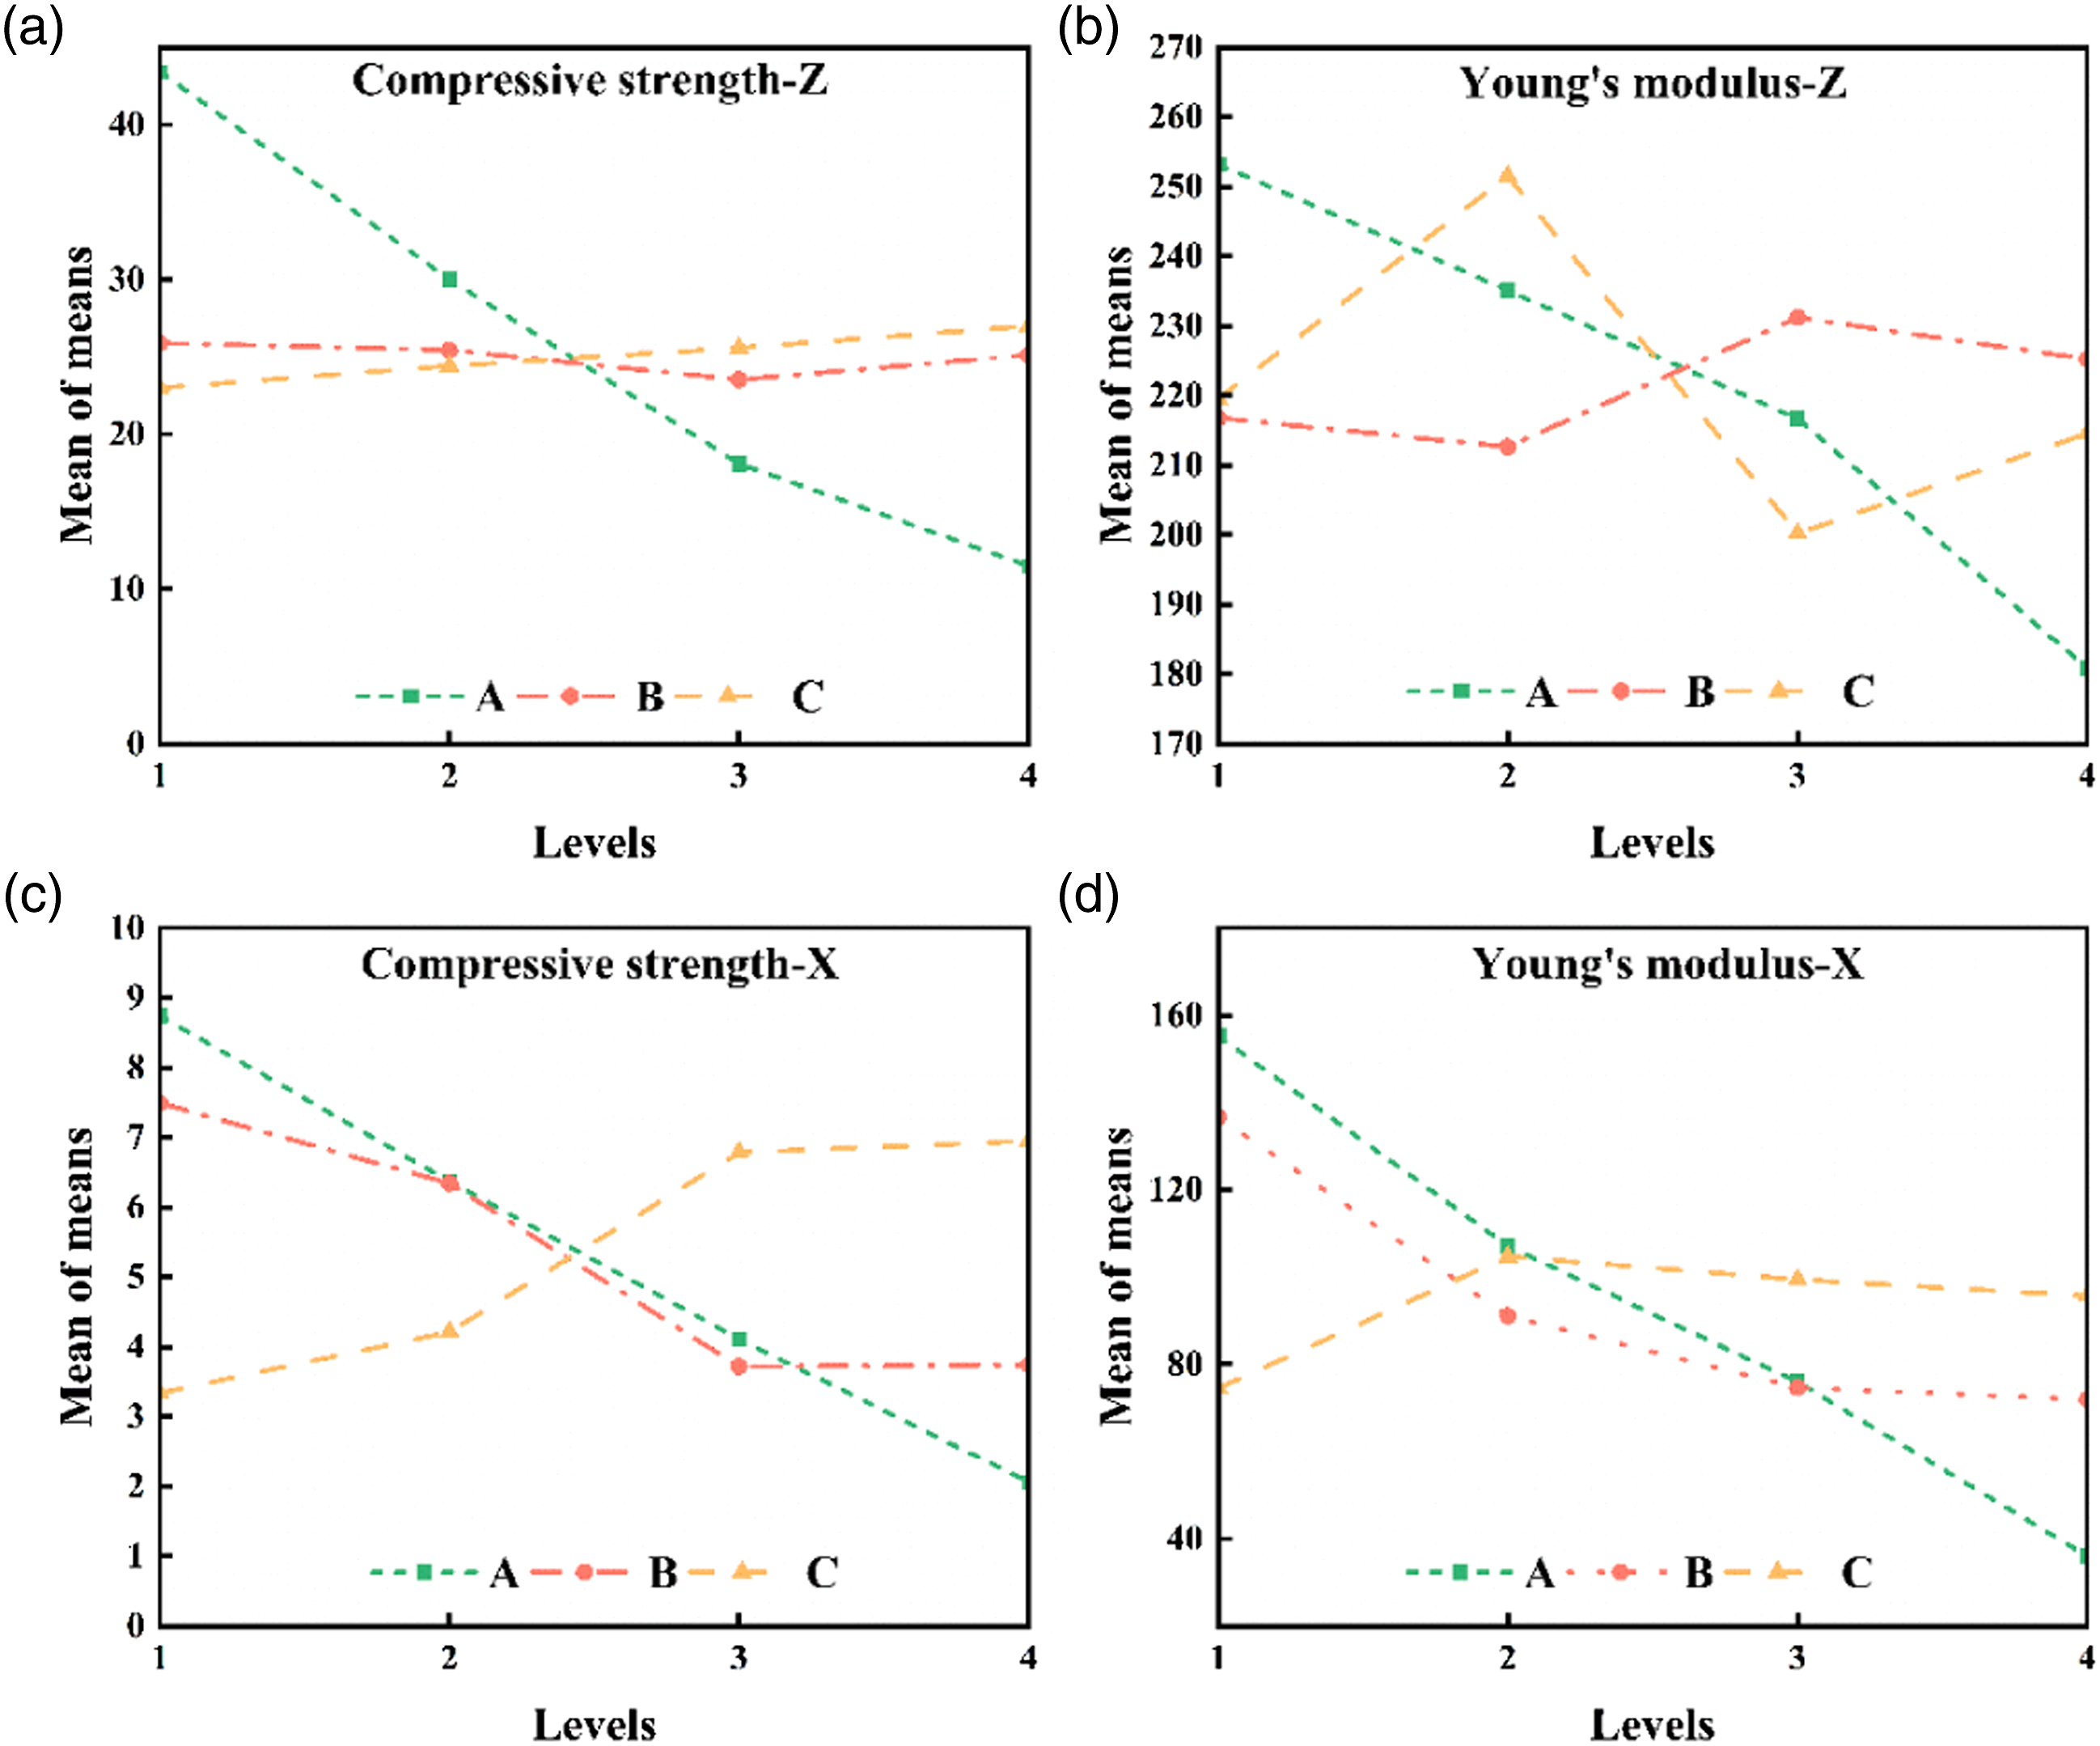
Figures 7 and 8 showed the main effect plots of all the different levels of the three parameters on the S/N ratios of the response variables. The degree of process parameters of the optimization variables was equivalent to the reduction of process variations and enhancement of mechanical properties values, which applied to the materials consumption, compressive strength and modulus, dimensional accuracy of the scaffold’s length, width and thickness. From Figure 8, the trends of compressive strength were and Young’s modulus along the Z and X axes were approximately the same. S/N ratio plot. (a) S/N ratio plot. (a) Compressive strength-Z. (b) Young’s modulus-Z. (c) Compressive strength-X. (d) Young’s modulus-X.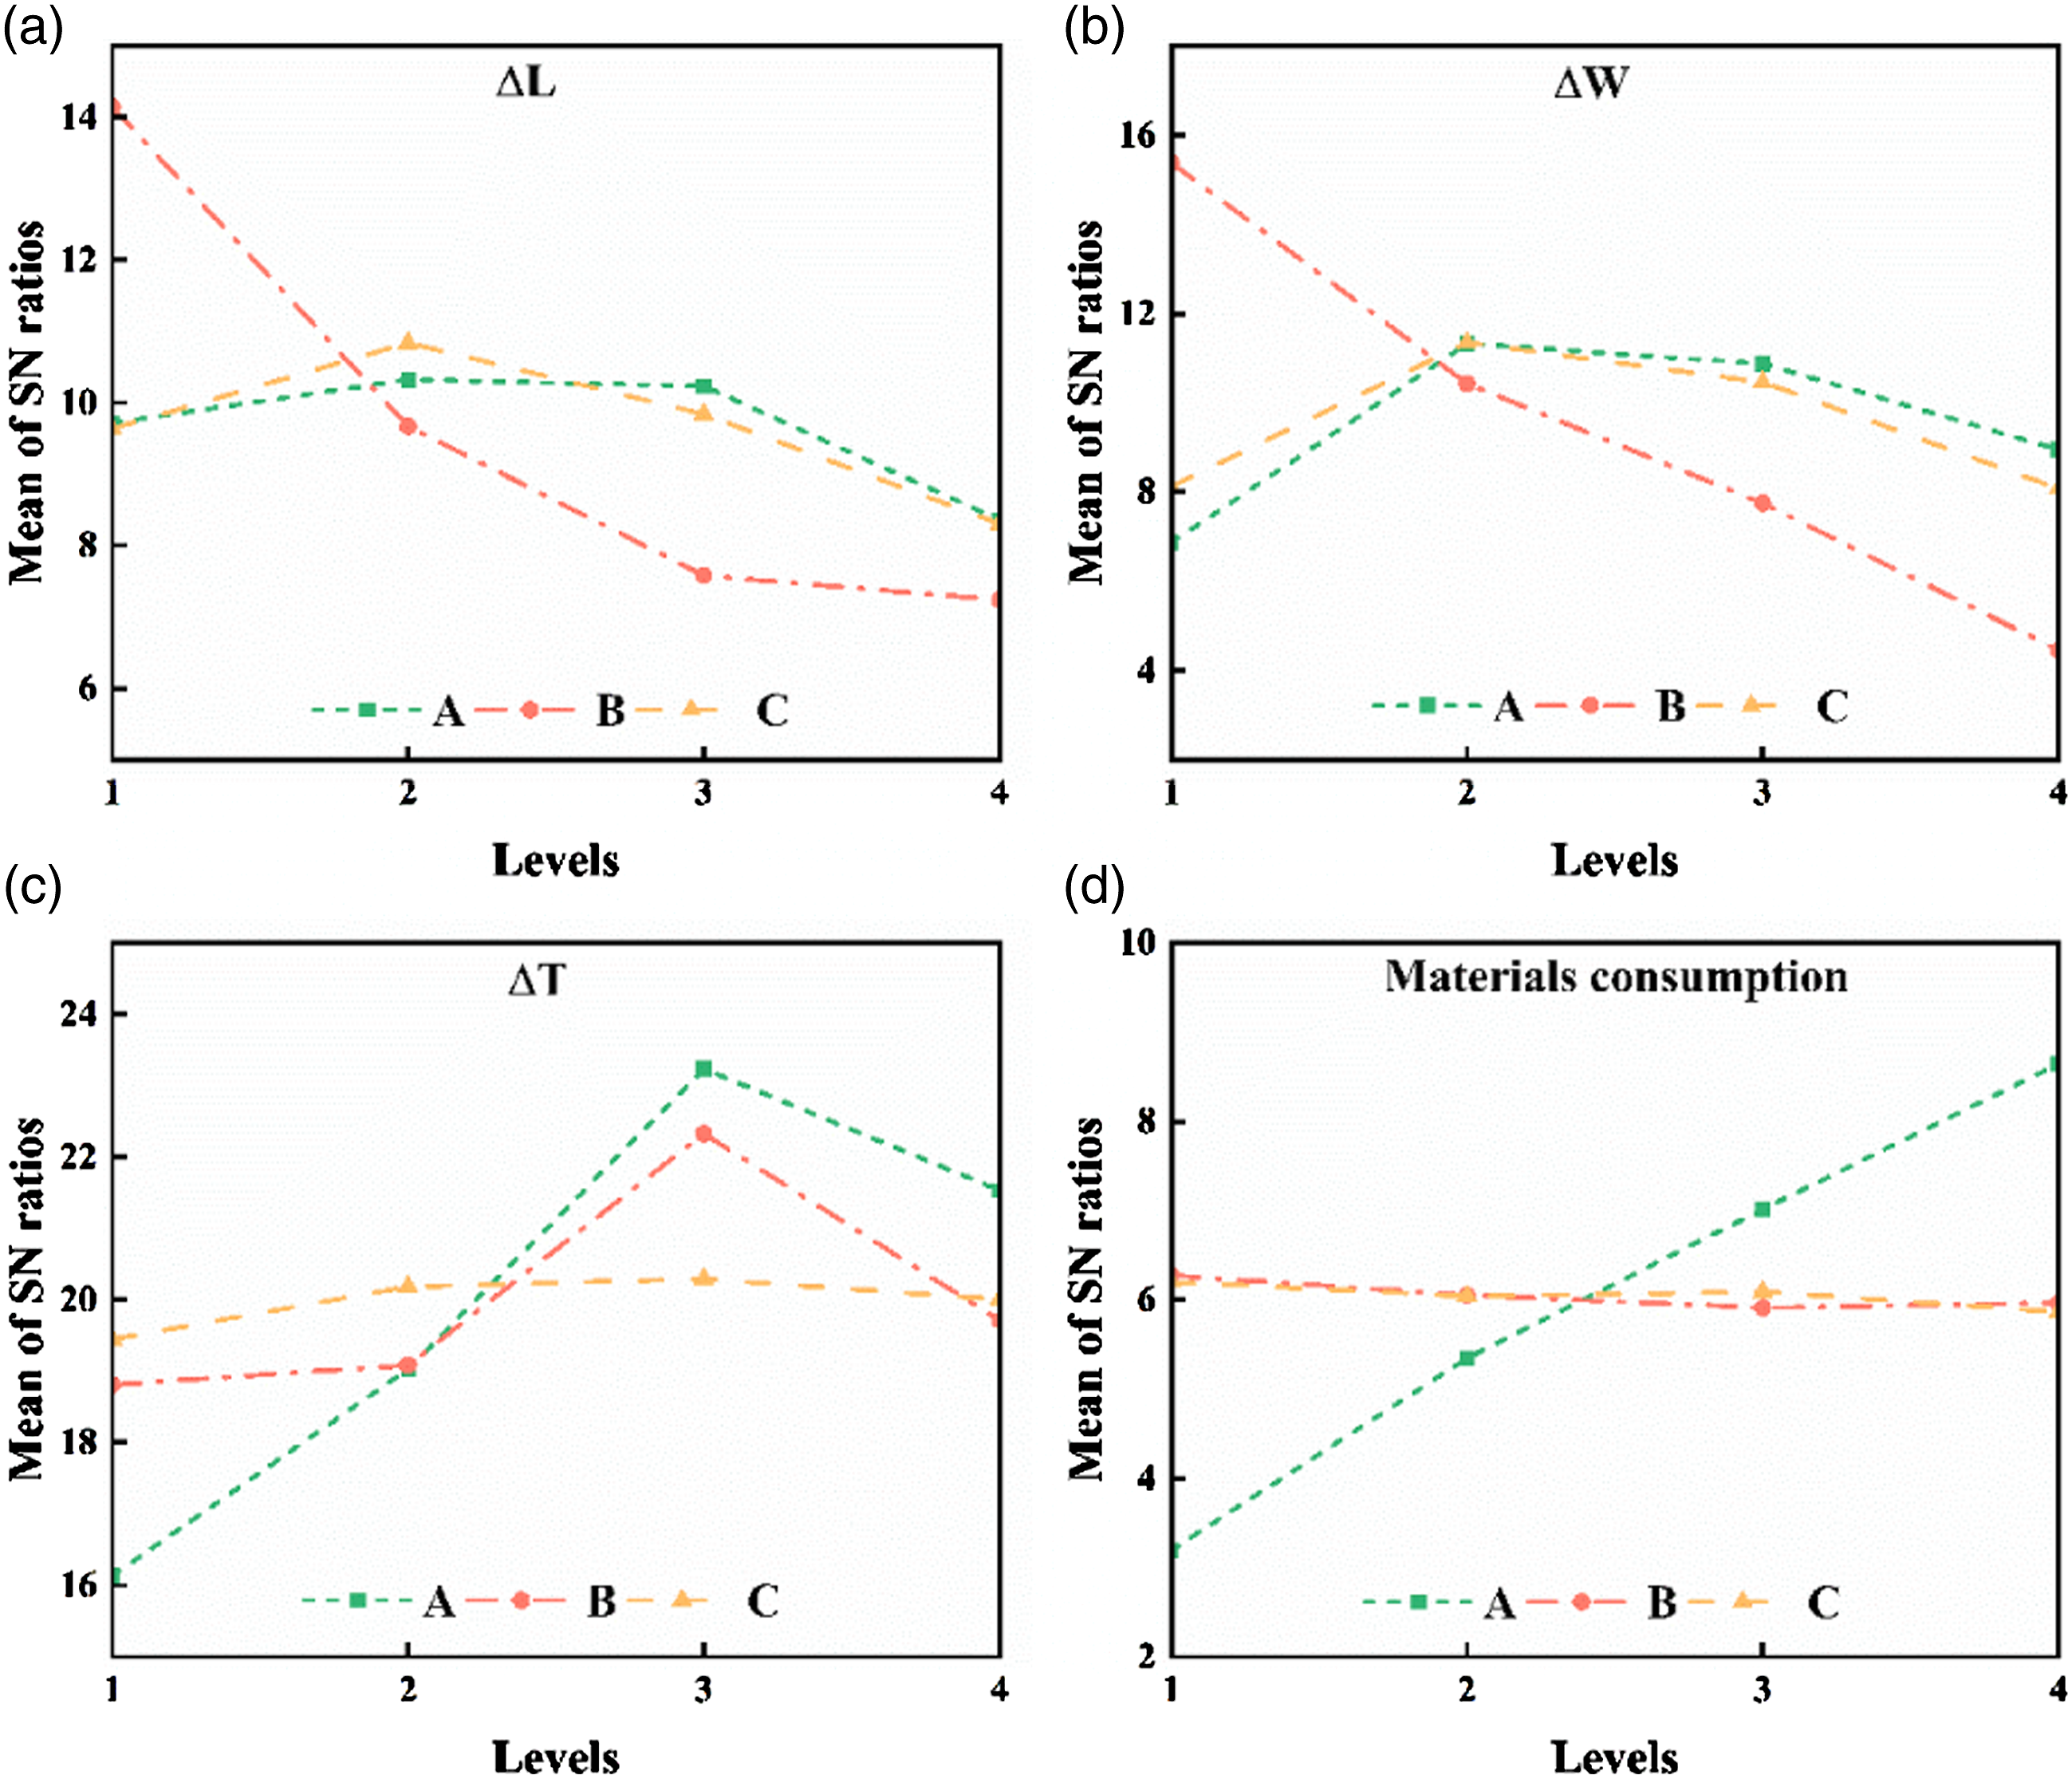
Results of analysis of variance
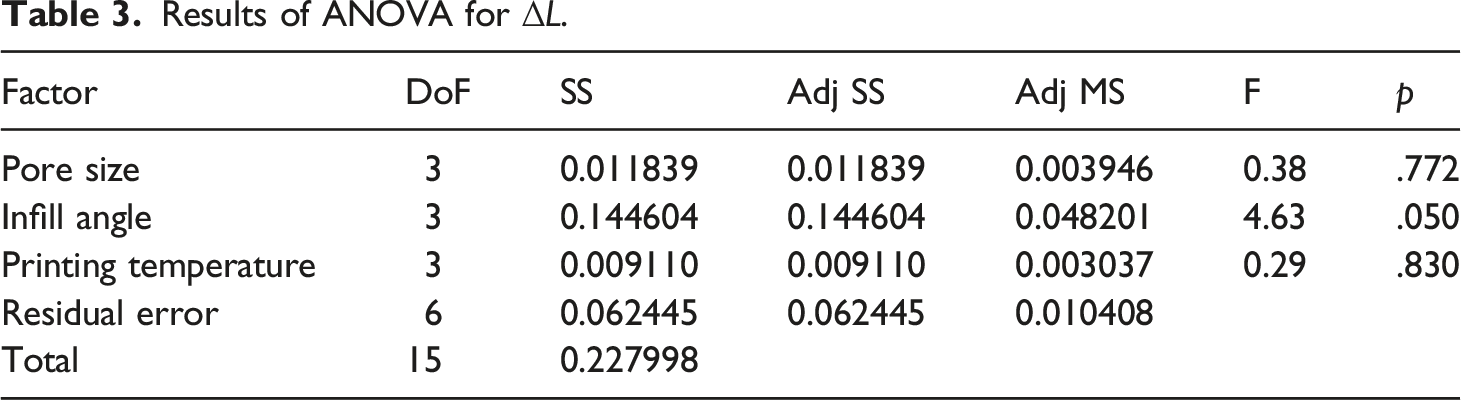
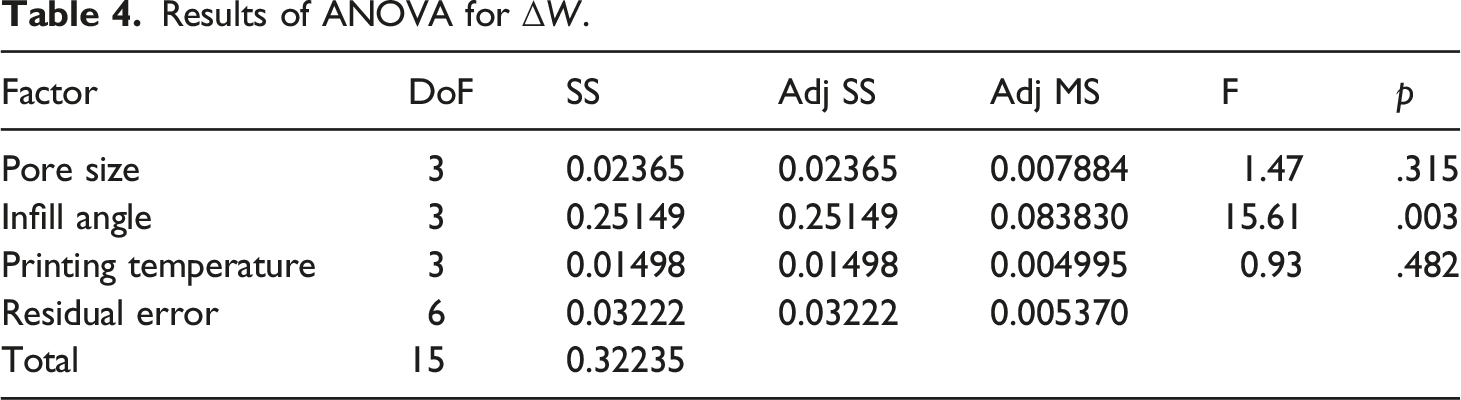
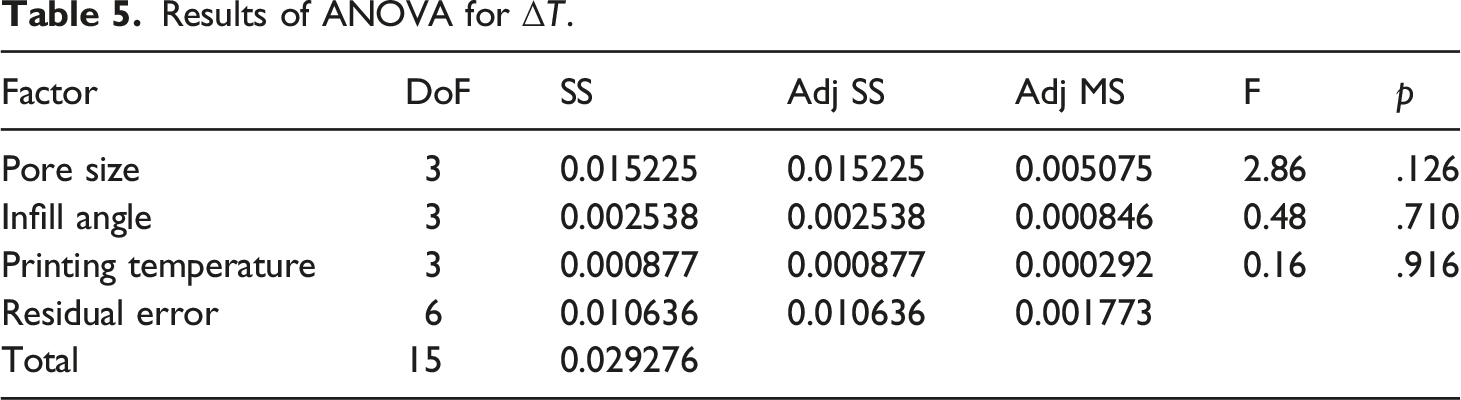
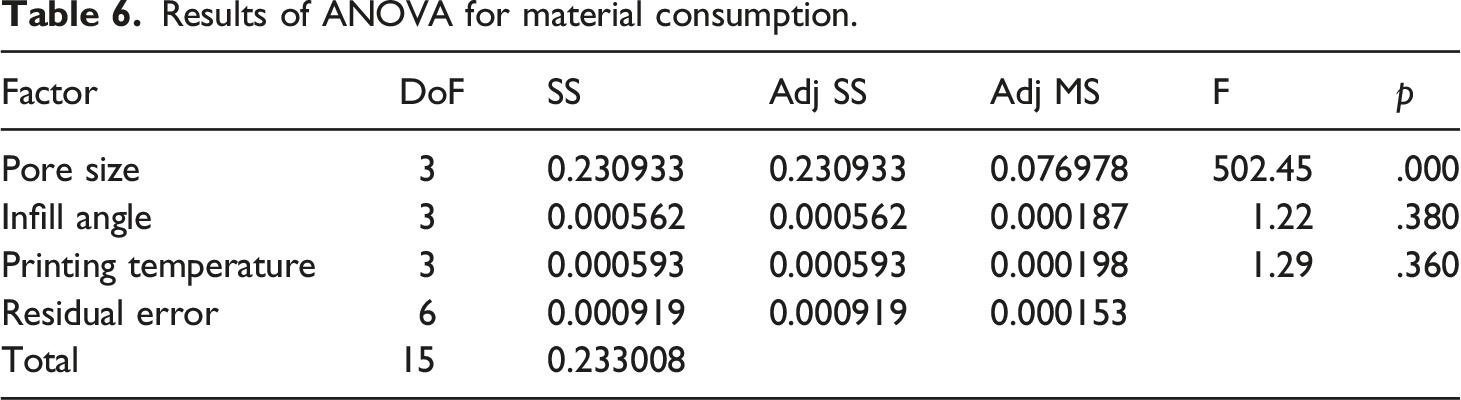
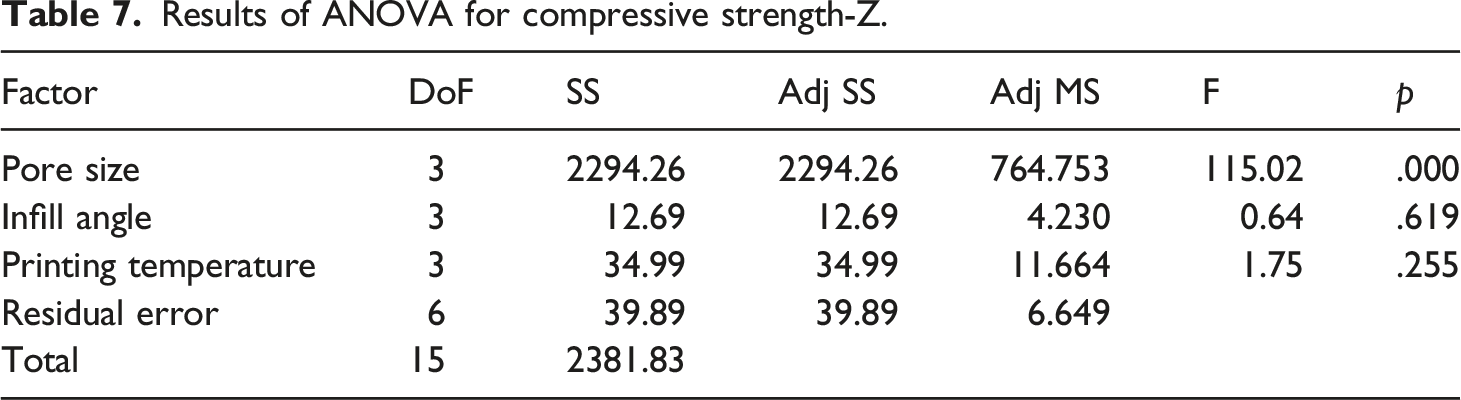
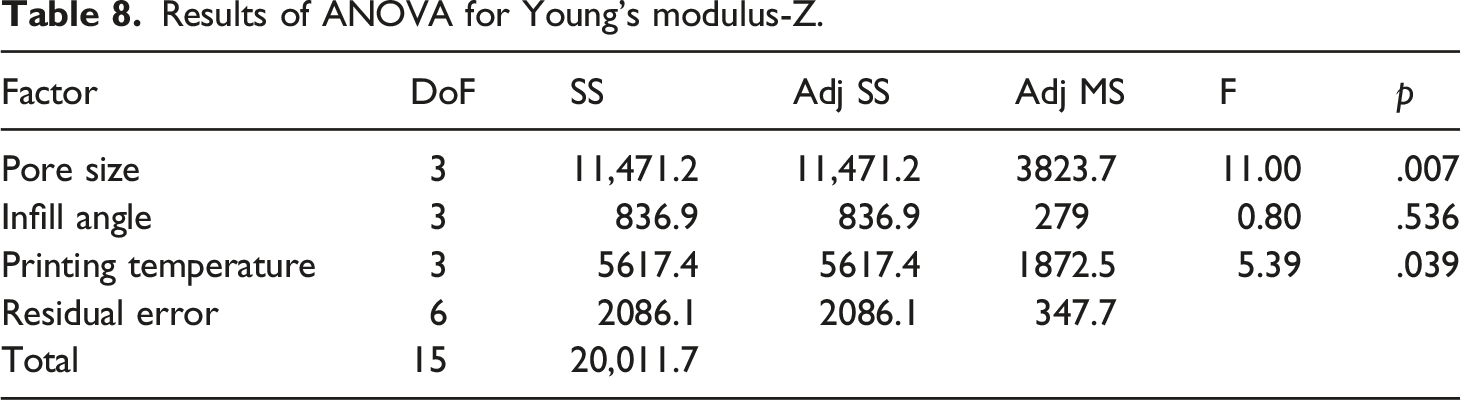
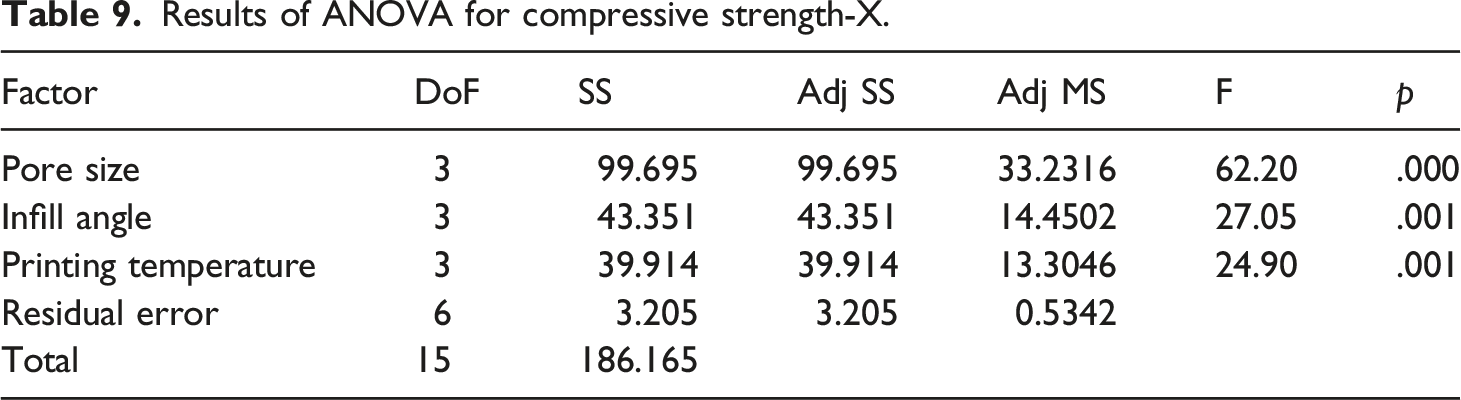
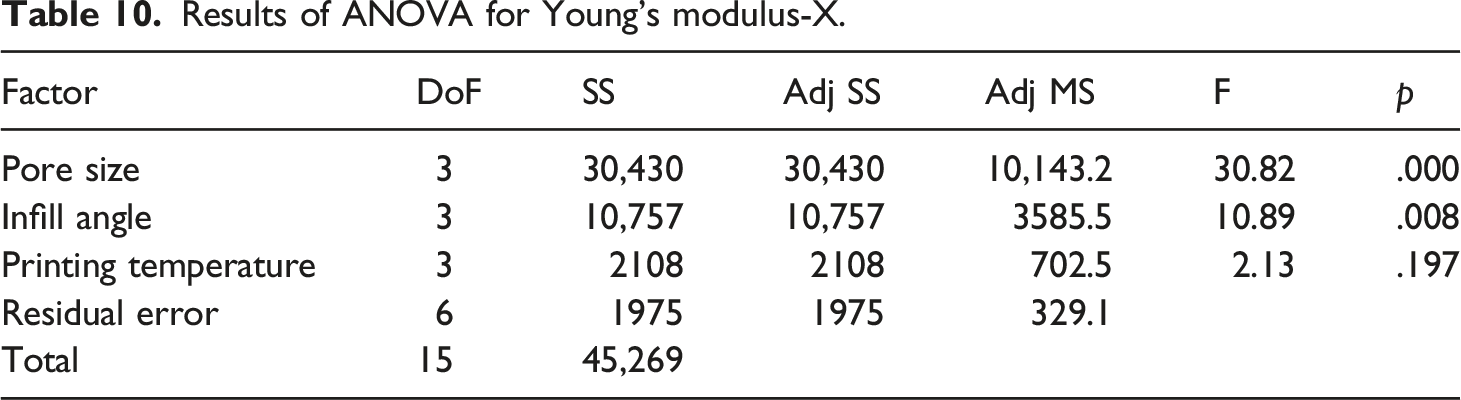
To investigate whether different levels of the factors have significant effect on the response variables, ANOVA, a significance test method, was carried out. In the test, the significance level, α, was set as 0.05.
Results of ANOVA for
Results of ANOVA for
Results of ANOVA for
Results of ANOVA for material consumption.
Results of ANOVA for compressive strength-Z.
Results of ANOVA for Young’s modulus-Z.
Results of ANOVA for compressive strength-X.
Results of ANOVA for Young’s modulus-X.
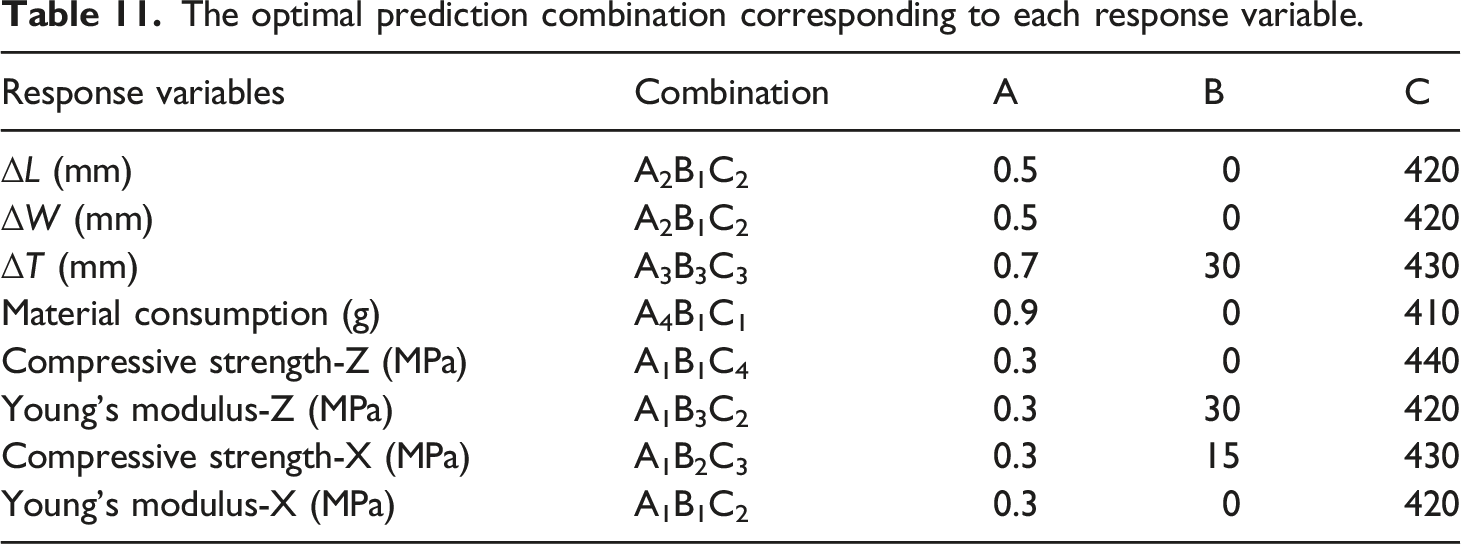
Prediction and verification analysis
The optimal prediction combination corresponding to each response variable.
Comparison between prediction and verification.
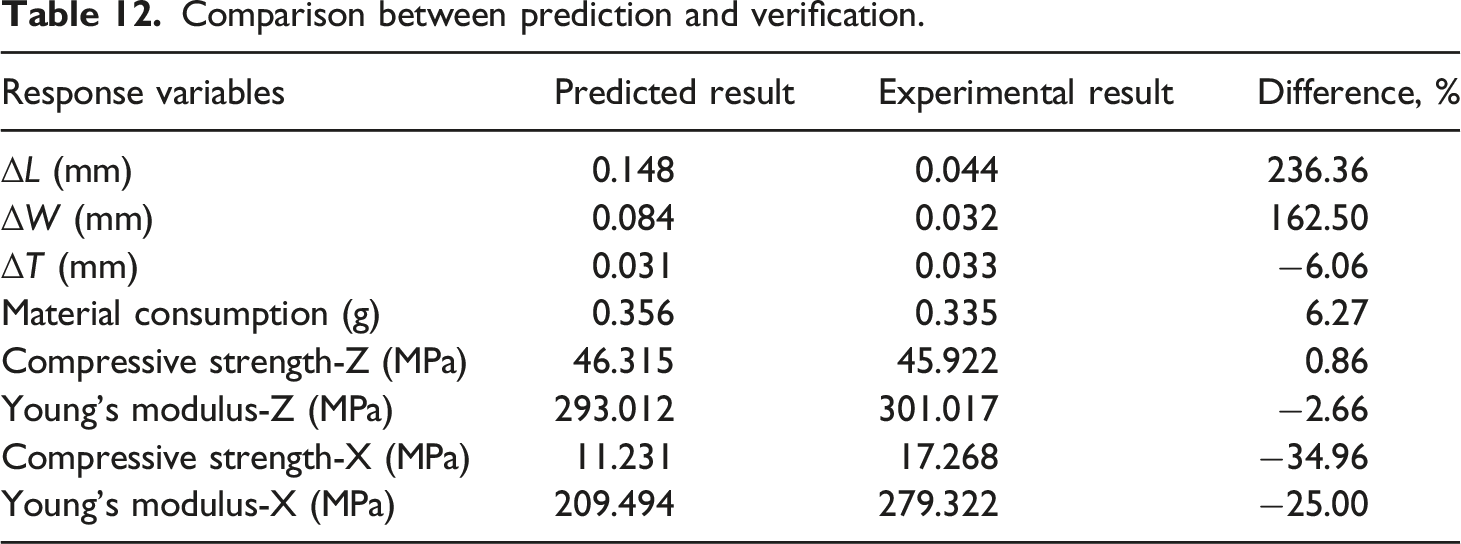
The experimental values of
Conclusion
In this study, three process parameters of pore size, infill angle and printing temperature were chosen for they were the parameters that deserve to pay attention to. Several response variables regarding length, width, thickness, material consumption, compressive strength along the Z and X directions, and Young’s modulus along the Z and X directions of the parts of PEEK were optimized using Taguchi method. The optimal process parameters for length and width were A2B1C2. The deviation of thickness achieved a minimum in A3B3C3. Compared to other settings, fabricating with a pore size of 0.9 mm, infill angle of 0°and 410°C printing temperature results in minimal material consumption. According to the “the larger, the better” criterion, the optimum conditions for compressive strength along the Z and X axes and the Young’s modulus along the Z direction could follow the parameters setting of trials 1, two and three in L16 orthogonal array respectively. Young’s modulus along the X direction could be obtained as the maximal value using A1B1C2. The predictive analysis in Taguchi's method predicts other experiments not listed in the orthogonal array with high accuracy. The mechanical strength and Young’s modulus of the porous scaffolds obtained from the L16 orthogonal array and verification array in this paper were similar to natural bones. The printing parameters were optimized to achieve the application demands on cost, dimensional precision, weight or mechanical properties. Therefore, this research had the potential to be extended to other fields as a reference such as customized bone repair.
Footnotes
Declaration of conflicting interests
The author(s) declared no potential conflicts of interest with respect to the research, authorship, and/or publication of this article.
Funding
This work was financially supported by the Guangzhou Science and Technology Plan Project (SL2022B03J01173), Nanning Local Scientific Research and Technology Development Plan Project (20213122), IER Foundation 2021 (IERF202103), the University Teachers Innovation Research Project (2021SWYY04) are gratefully acknowledged.