
Abstract
The rapid prototyping technique has been developed over several decades. As the application becomes more widespread, the qualities of the parts produced by a rapid prototyping system must be considered. The area-forming rapid prototyping system is an emerging technology. This system has the advantage of a short build time but displays a weakness in the dimensional accuracy and surface roughness. To improve these weaknesses and simultaneously maintain a short build time, this study optimizes the process parameters using the grey relational Taguchi method. From the results, the best combinations of process parameters both for each quality and for multiple qualities are discovered. The optimization of process parameters is verified using the extra samples.
Keywords
Introduction
Rapid prototyping (RP) systems automatically build parts from three-dimensional computer-aided design (CAD) models with a layer-by-layer fabrication. Compared with traditional manufacturing, the RP technique reduces the build time, builds complicated parts with a simple procedure, and reduces the operational training of the operator. These advantages can decrease the tangible and intangible costs in part fabrication and product development. Therefore, the RP technique is widely applied in many different industries. Currently, numerous RP technologies are available, including the stereolithography apparatus (SLA), fused deposition modelling (FDM) and selective laser sintering (SLS).1–3
With the growth in applications of RP technologies, the qualities of the parts must be considered. 4 The dimensional accuracy, which is one important quality of a part, influences the tolerance and assembly between a part and other components. Therefore, improving the dimensional accuracy of the parts is an important research for RP technologies. 5 Onuh and Hon 6 improved the part accuracy for industrial applications on stereolithography (SL) process. Equbal et al. 7 predicted the dimensional accuracy of a part on the FDM process using fuzzy logic. Wang et al. 8 investigated part shrinkage and improved the dimensional accuracy of the part on the SLS process. Kechagias 9 researched the influence of process parameters on the dimensional accuracy on the laminated object manufacturing (LOM) process. Moreover, the surface quality affects the optical properties, micro-fluid flow, and mechanical assembly of the parts. 10 Therefore, a part with a poor surface roughness indicates that a post-processing step for the parts is necessary, which will increase the total processing time. Sachdeva et al. 11 researched the surface roughness of parts on the SLS process. Martinez et al. 12 modelled the surface quality of FDM parts. Kechagias 13 analysed the factors that primarily affected the surface roughness of parts on the LOM process. Sui and Leu 14 investigated the surface roughness of products on a rapid freeze prototyping (RFP) system. Ahn et al. 15 studied the effect of process parameters for the surface roughness of a product on an expandable polystyrene (EPS) foam sheet RP system. All of these studies signify the importance of the surface roughness of the parts on the RP technologies.
Moreover, shorter build times and higher efficiencies allow the RP system to fabricate more products simultaneously. The initial purpose of developing the RP technique is to reduce the build time of prototypes. Therefore, reducing the build time of RP parts is also an objective. Nezhad et al. 16 studied the optimal part orientation for the optimum build time in RP technologies. Pham and Wang 17 investigated the influences of factors such as the roller travel speed, build height, laser scan speed, scan area, and part volume to predict and reduce the build time in the SLS process. The above studies indicate that the dimensional accuracy, surface roughness, and build time of the parts are important quality characteristics for RP technologies.
The area-forming RP system, also known as mask projection SL, is an emerging RP technique derived from the SL process. 18 Instead of using a laser beam in the SL process, in the area-forming RP system, a digital light processing (DLP) projector is utilized to generate a dynamic photo mask to cure a layer of the photopolymer at the same time. Therefore, the build time of the parts can be considerably reduced compared with the SL processes. 19 Compared with other RP processes, the area-forming RP process has the advantages of structurally simple, short build time and high precision. The area-forming RP process is excel in fabricating the products with small productions and precise part. The main application of this technique is to build biocompatible/biodegradable products.20,21
Figure 1 shows the area-forming RP system developed by Chiu et al.’s. 22 In this system, the DLP projector is controlled by a computer to generate the photo mask with visible light which passes through lenses, a shutter, an aperture, and a reflector and then cures the photopolymer to construct a layer of a three-dimensional part. The lenses are used to adjust the focus point of the DLP projector. The shutter is turned on/off to control the visible light. The aperture controls the illumination of the light projected on the photopolymer.
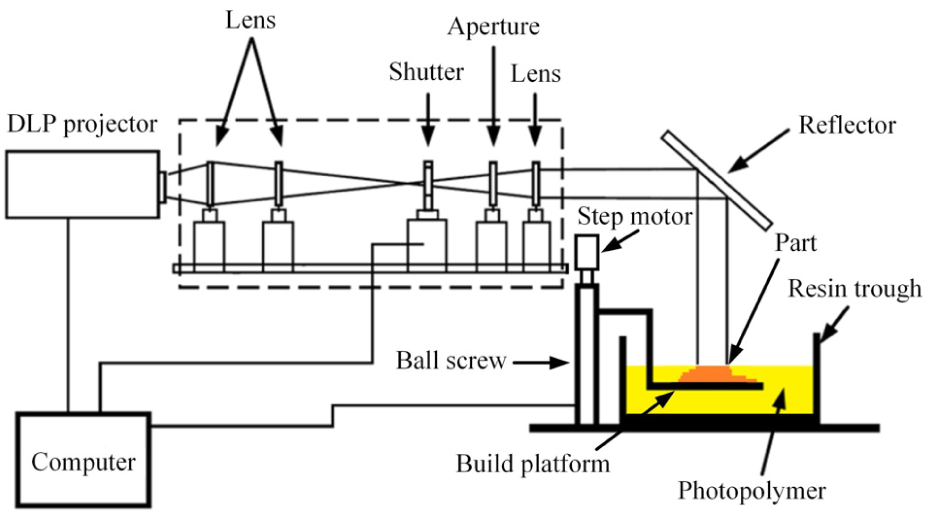
Sketch of the area-forming RP system. 22
The procedures of the area-forming RP system are shown as follows:
Fill the resin trough with photopolymer.
Adjust the build platform to the identical level of the photopolymer.
Control the DLP projector to generate the photo mask of a single layer.
Turn on the shutter.
Wait a few seconds (curing time) until the resin is cured.
Turn off the shutter.
Lower the build platform and wait for the resin to cover over the cured material.
Repeat step 3 to step 7 until the part is finished.
Although the area-forming RP system has the advantage of a short build time, the quality of the part such as the dimensional accuracy and surface roughness must be improved. The Taguchi method is an efficient and powerful approach to improve the quality performance with few experiments. 23 In a RP system, the build time of a part is approximately a few hours. Therefore, employing the Taguchi method is a suitable approach for reducing the experimental time. This method has been successfully utilized to optimize the process parameters on many different RP technologies. Lee et al. 24 utilized the Taguchi method to optimize the elastic performance of the parts on the FDM process. Cheng et al. 25 improved the dimensional accuracy of the parts on the SLS process using the Taguchi method. Chen et al. 26 investigated the process parameters appraisal on the SL process for fabricating ceramic parts using the Taguchi method. Chockalingam et al. 27 used the Taguchi method to optimize the process parameters for the part strength on the SL process. Dingal et al. 28 studied the influence of the process parameters on the SLS process using the Taguchi method. Sood et al. 29 optimized the process parameters for the FDM process using the Taguchi method. However, the Taguchi method can only analyse a single quality once. Therefore, the studies combined the Taguchi method with the grey relational analysis theory to analyse multiple qualities simultaneously.30–32 This approach was also utilized to optimize multiple qualities of RP technologies. Wang et al. 33 analysed the optimum process parameters for the tensile strength, dimensional accuracy, and surface toughness on the FDM process. Sood et al. 34 investigated the optimization for the four dimensions (length, width, thickness, and diameter) on the FDM process.
As an emerging RP technique, the area-forming RP system has the advantage of a short build time. However, this technique has weaknesses in the dimensional accuracy and surface roughness. No studies have focused on improving these two weaknesses. To improve these two weaknesses and simultaneously maintain the short build time, this study utilizes the grey relational Taguchi method to optimize the process parameters for an area-forming RP system. In this study, the factors that possibly influence the qualities are discussed, and the value of the levels of each factors is also selected. A suitable orthogonal array is selected in accordance with the number of factors and the number of levels. After executing the experiment, the signal-to-noise ratio (S/N ratio) is utilized to evaluate the quality of the parts fabricated with the designated combination of process parameters. The best combination of process parameters for each single quality is then determined. The grey relational analysis theory is employed to integrate the S/N ratio of the three qualities into the grey relational grade. The grey relational grade is evaluated by calculating the S/N ratio, and the best combination of process parameters for the three qualities is determined. Moreover, extra samples are fabricated to verify the result of the optimization.
Method
Taguchi method
In this study, the Taguchi method is utilized to evaluate the quality characteristic of the parts for each combination of process parameters. In the area-forming RP system, there are some factors could affect the qualities of the parts. Figure 2 shows these factors that cause the qualities to deviate from the ideal value. The factors are classified into four parts: software setting, hardware setting, preparing the photopolymer and environmental interference.
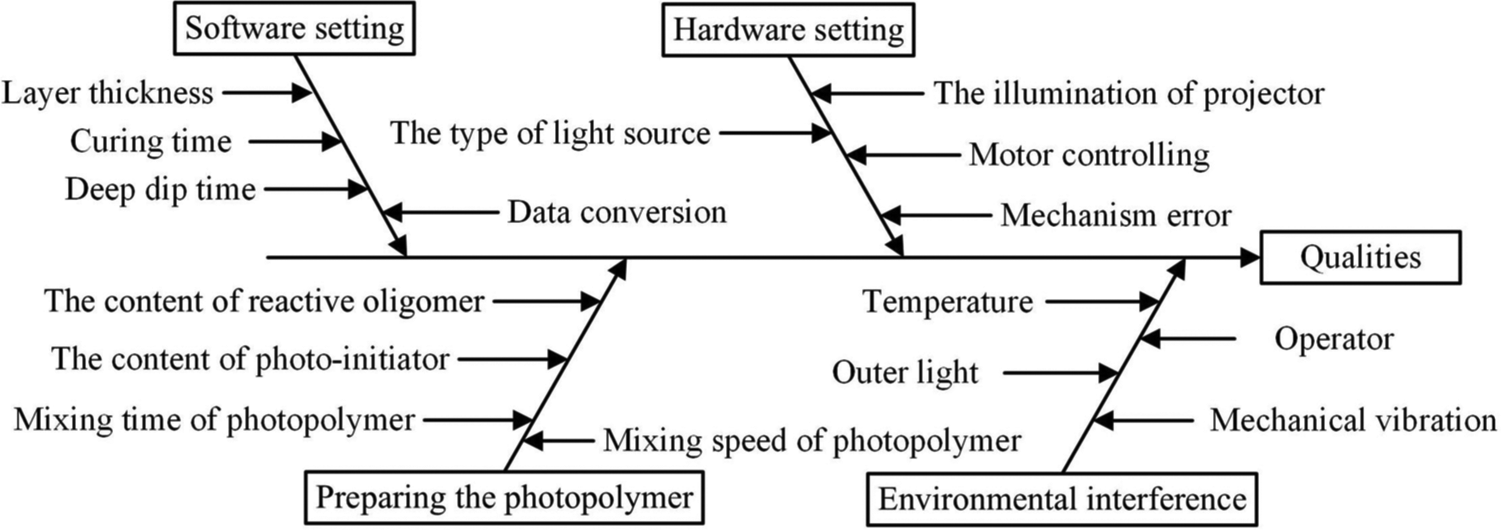
Bone-fish diagram of the area-forming RP system.
The process parameters represent the controllable factors. The factors that are not controllable, such as the temperature, operator, outer light, mechanical vibration, motor controlling, mechanical error, and data conversion, are not considered process parameters. Moreover, the mixing speed of the photopolymer is fixed to avoid mixing bubbles into the photopolymer. Therefore, the remaining factors, the type of light source, curing time, the content of reactive oligomer, deep dip time, layer thickness, the content of photo-initiator, and the illumination of the projector are selected as the control factors.
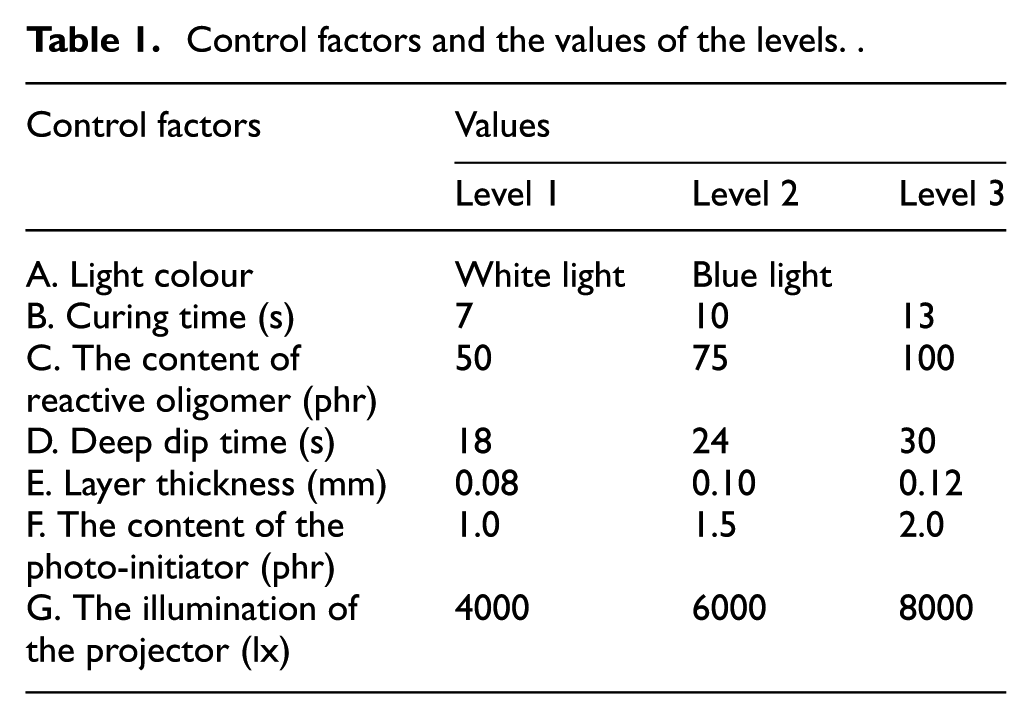
The initial values of the control factors are listed below: white light for the type of light source, 10 s for curing time, 75 phr for the content of reactive oligomer, 24 s for the deep dip time, 0.1 mm for the layer thickness, 1.5 phr for the content of the photo-initiator, and 6000 lx for the illumination of the projector. The higher and lower value of each control factor is suitably set to optimize the process parameters. For the type of light source, the projectable light of the DLP projector is limited to visible light. However, the light source is limited by the absorbable wavelength of the photo-initiator. Therefore, the blue light is set as another level for the type of light source. For the curing time, the minimum requirement is 7 s for each layer. Therefore, the values of the curing time is set to 7 and 13 s by adding 3 s to and deducting 3 s from the initial value (10 s). With respect to the content of reactive oligomer, the value must be set between 50 and 100 phr for the suitable viscosity. For the deep dip time, the minimum requirement is 18 s to fabricate a fine part. Therefore, the values of the deep dip time are set to 18 s, 24 s (initial value), and 30 s. The maximum value of the layer thickness (0.12 mm) is limited by the maximum penetration of the projected light. Therefore, the values of the layer thickness are set to 0.08 mm, 0.1 mm (initial value), and 0.12 mm (0.1 ± 0.02 mm). For the content of the photo-initiator, the values are set between 1.0 and 2.0 phr for fine qualities of the part. For the illumination of the projector, the values of the levels are limited between the maximum available (8000 lx) and minimum available (4000 lx) of the projector. The control factors and the values of the levels are shown in Table 1.
Control factors and the values of the levels.
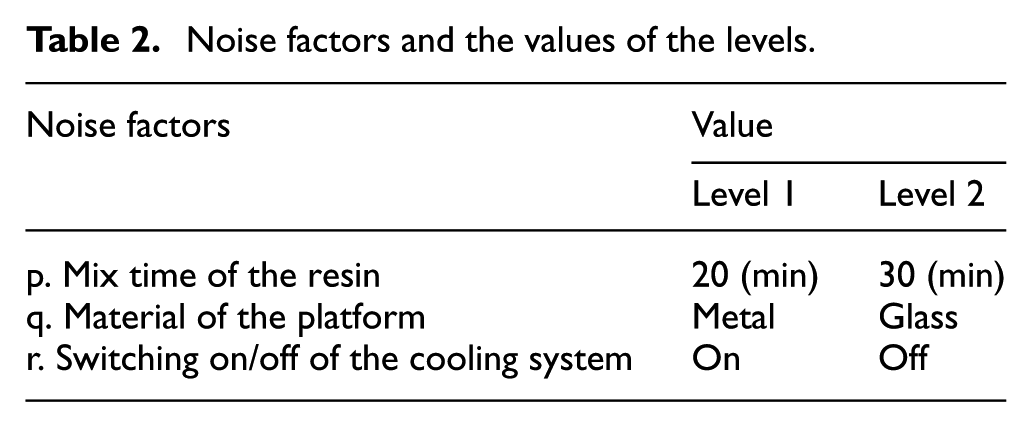
To obtain the process parameters with noise immunity, the experiments are repeated using noise factors. The factors powerless to affect qualities or difficult to precisely control are selected as the noise factors. The mix time of the photopolymer, material of the platform and on/off switch of the cooling system are selected as the noise factors. The noise factors and their value of each level are shown in Table 2.
Noise factors and the values of the levels.
After deciding the control factors and noise factors, a suitable orthogonal array is selected to conduct the experiments. The L18 orthogonal array is selected for the control factors and the L4 orthogonal array is selected for the noise factors. The L18 and L4 orthogonal arrays are put into the inner and outer array, respectively. Hence, the L18× L4 orthogonal array is employed to conduct the experiment.
To evaluate the quality of the parts, the S/N ratio is employed. The calculation of the S/N ratio depends on the type of quality characteristics. 35 In this research, the nominal-the-best type is employed to grade the dimensional accuracy and grey relational grade, and the smaller-the-better type is employed to grade the surface roughness and build time. The calculations of the nominal-the-best and smaller-the-better are shown as follows:
Nominal-the-best
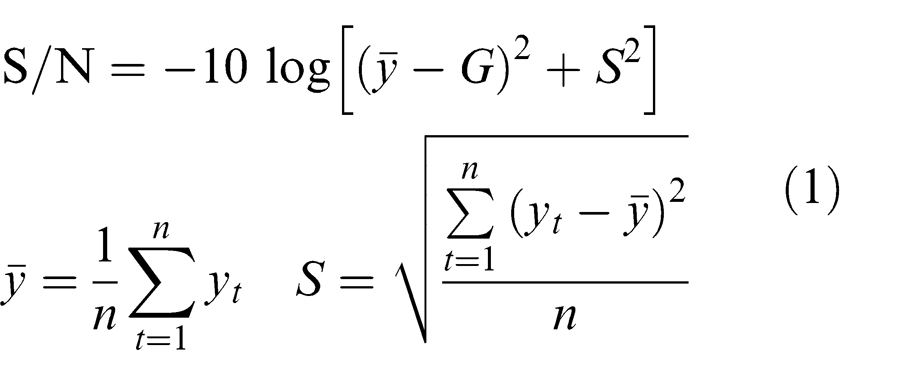
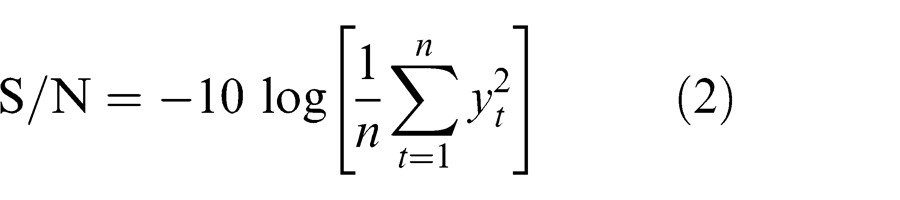
Smaller-the-better
where
Grey relational analysis
Grey relational analysis is employed to analyse and integrate the S/N ratio of the three qualities. The grey relational analysis uses the following steps: grey relation generating, calculating the grey relational coefficient, calculating the entropy weighting for each data sequence, and calculating the grey relational grade with entropy weighting. 33
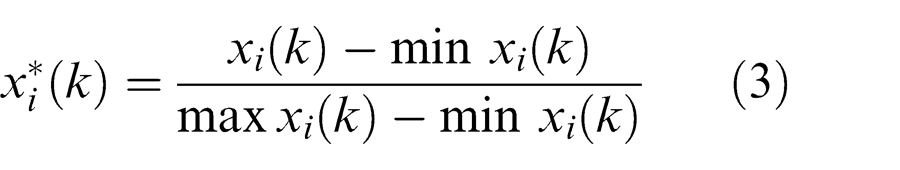
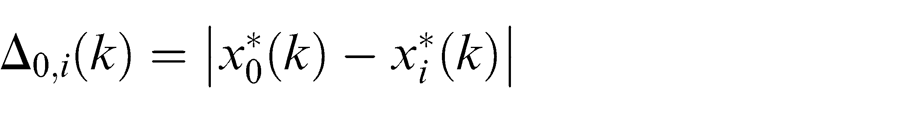
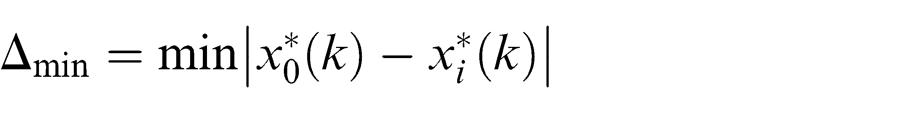
To satisfy the rule of the grey relational analysis theory, the data sequence (quality characteristic or attribute) must be normalized using the grey relation generating. 34 Depending on the different types of data sequences, the grey relation generating is calculated using the corresponding equation. The data sequence is categorized into three types: nominal-the-best, smaller-the-better, and larger-the-better. In this study, the grey relation generating is calculated from the sequences of S/N ratios of the three quality characteristics. The S/N ratio is a larger-the-better type value, and the grey relation generating is calculated using equation (3) 34
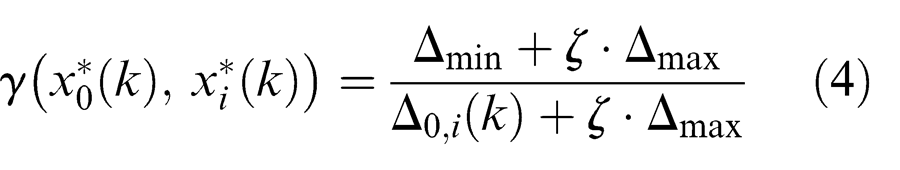
The grey relational coefficient

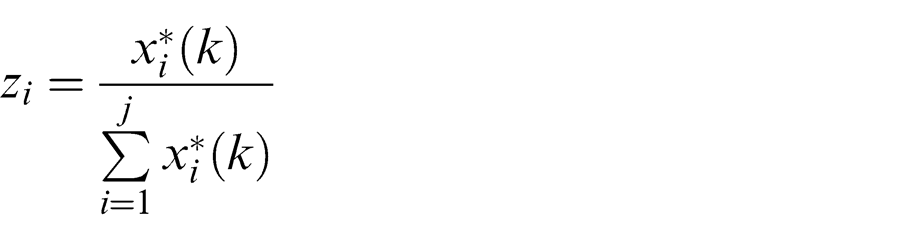
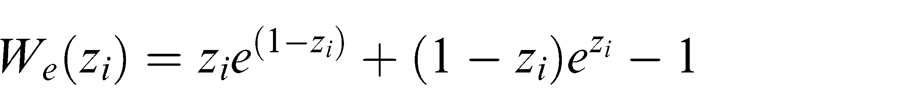
The entropy weighting
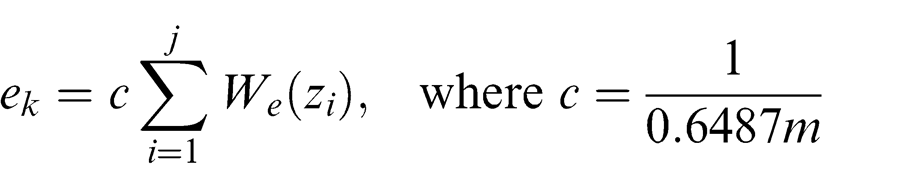
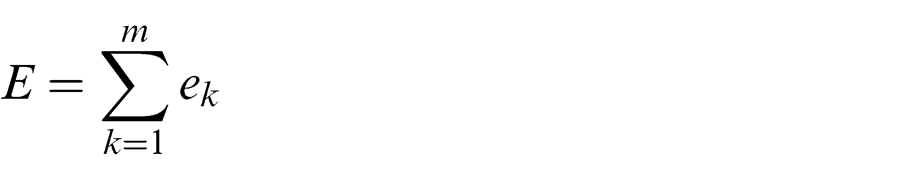
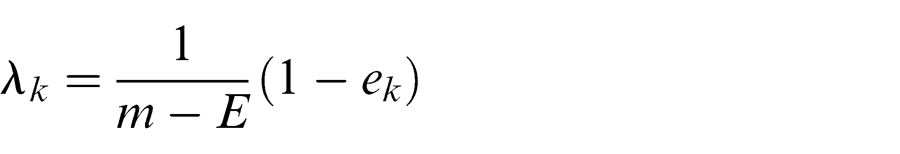
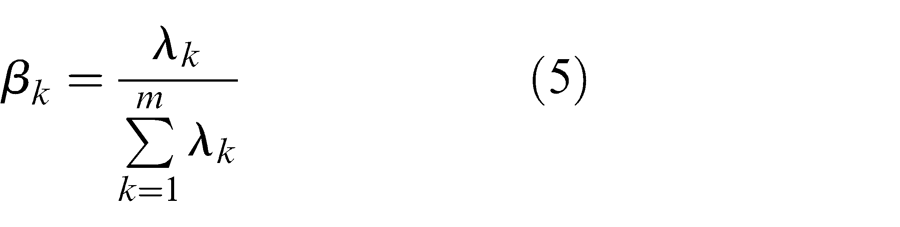
where
Experiments and results
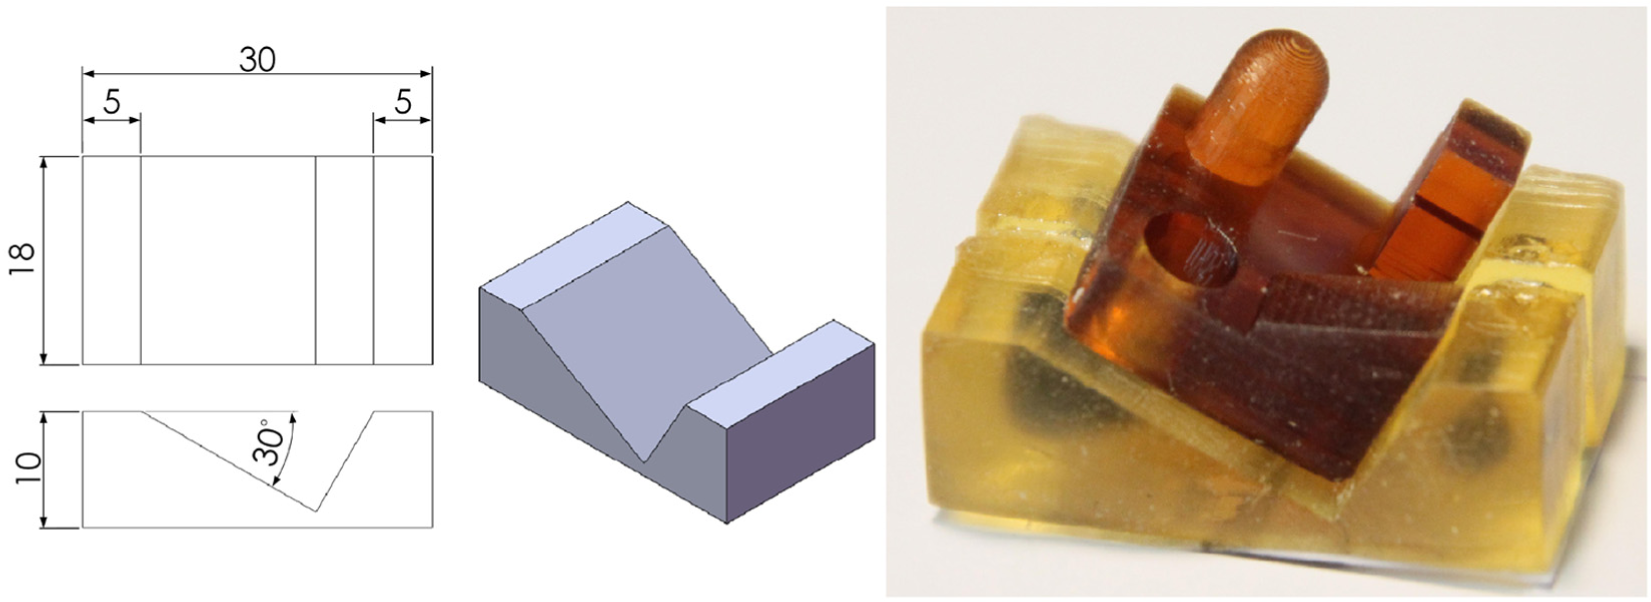
In order to easily and accurately measure the quality of the sample, the shape of the sample must be designed as simple as possible. The sample designed to measure the dimensional accuracy, surface roughness, and build time is shown in Figure 3.
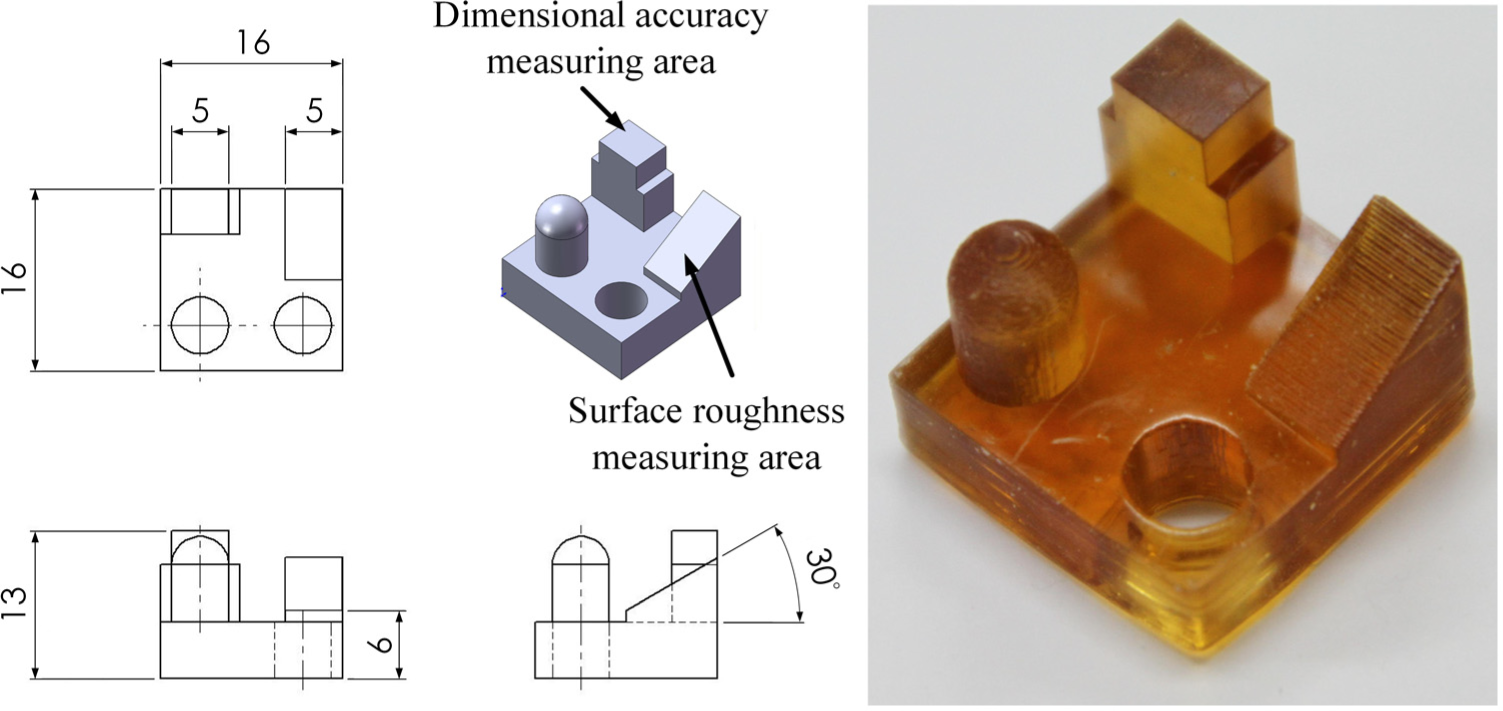
Design and photograph of the sample.
The measuring areas for the dimensional accuracy and surface roughness are noted in Figure 3. The ideal value of the dimension is 5 mm. Since the dimensional accuracy on X and Y directions are the same in the area-forming RP system, the dimensional accuracy is only measured on one direction. Moreover, the curved and circular dimensions are composed of the dimensions on X and Y direction. Therefore, the dimensional accuracy of curve or circle can be also estimated from the dimensional accuracy of one direction. Because of the step error, the area which has the worst surface roughness is always on the slope. Therefore, the surface roughness measuring area is a
This sample is produced using a photopolymer consisting of a reactive oligomer, reactive monomer, and photo-initiator. The reactive oligomer, tetrafunctional polyester acrylate (TPA) (photomer 5430), and the reactive monomer, 1,6-hexanediol diacrylate (HDDA) (photomer 4017), are produced by Henkel. The photo-initiator, IRGACURE 784, is produced by Ciba.
The experiment is then executed in accordance with the
Results of dimensional accuracy testing.
S/N: signal-to-noise.
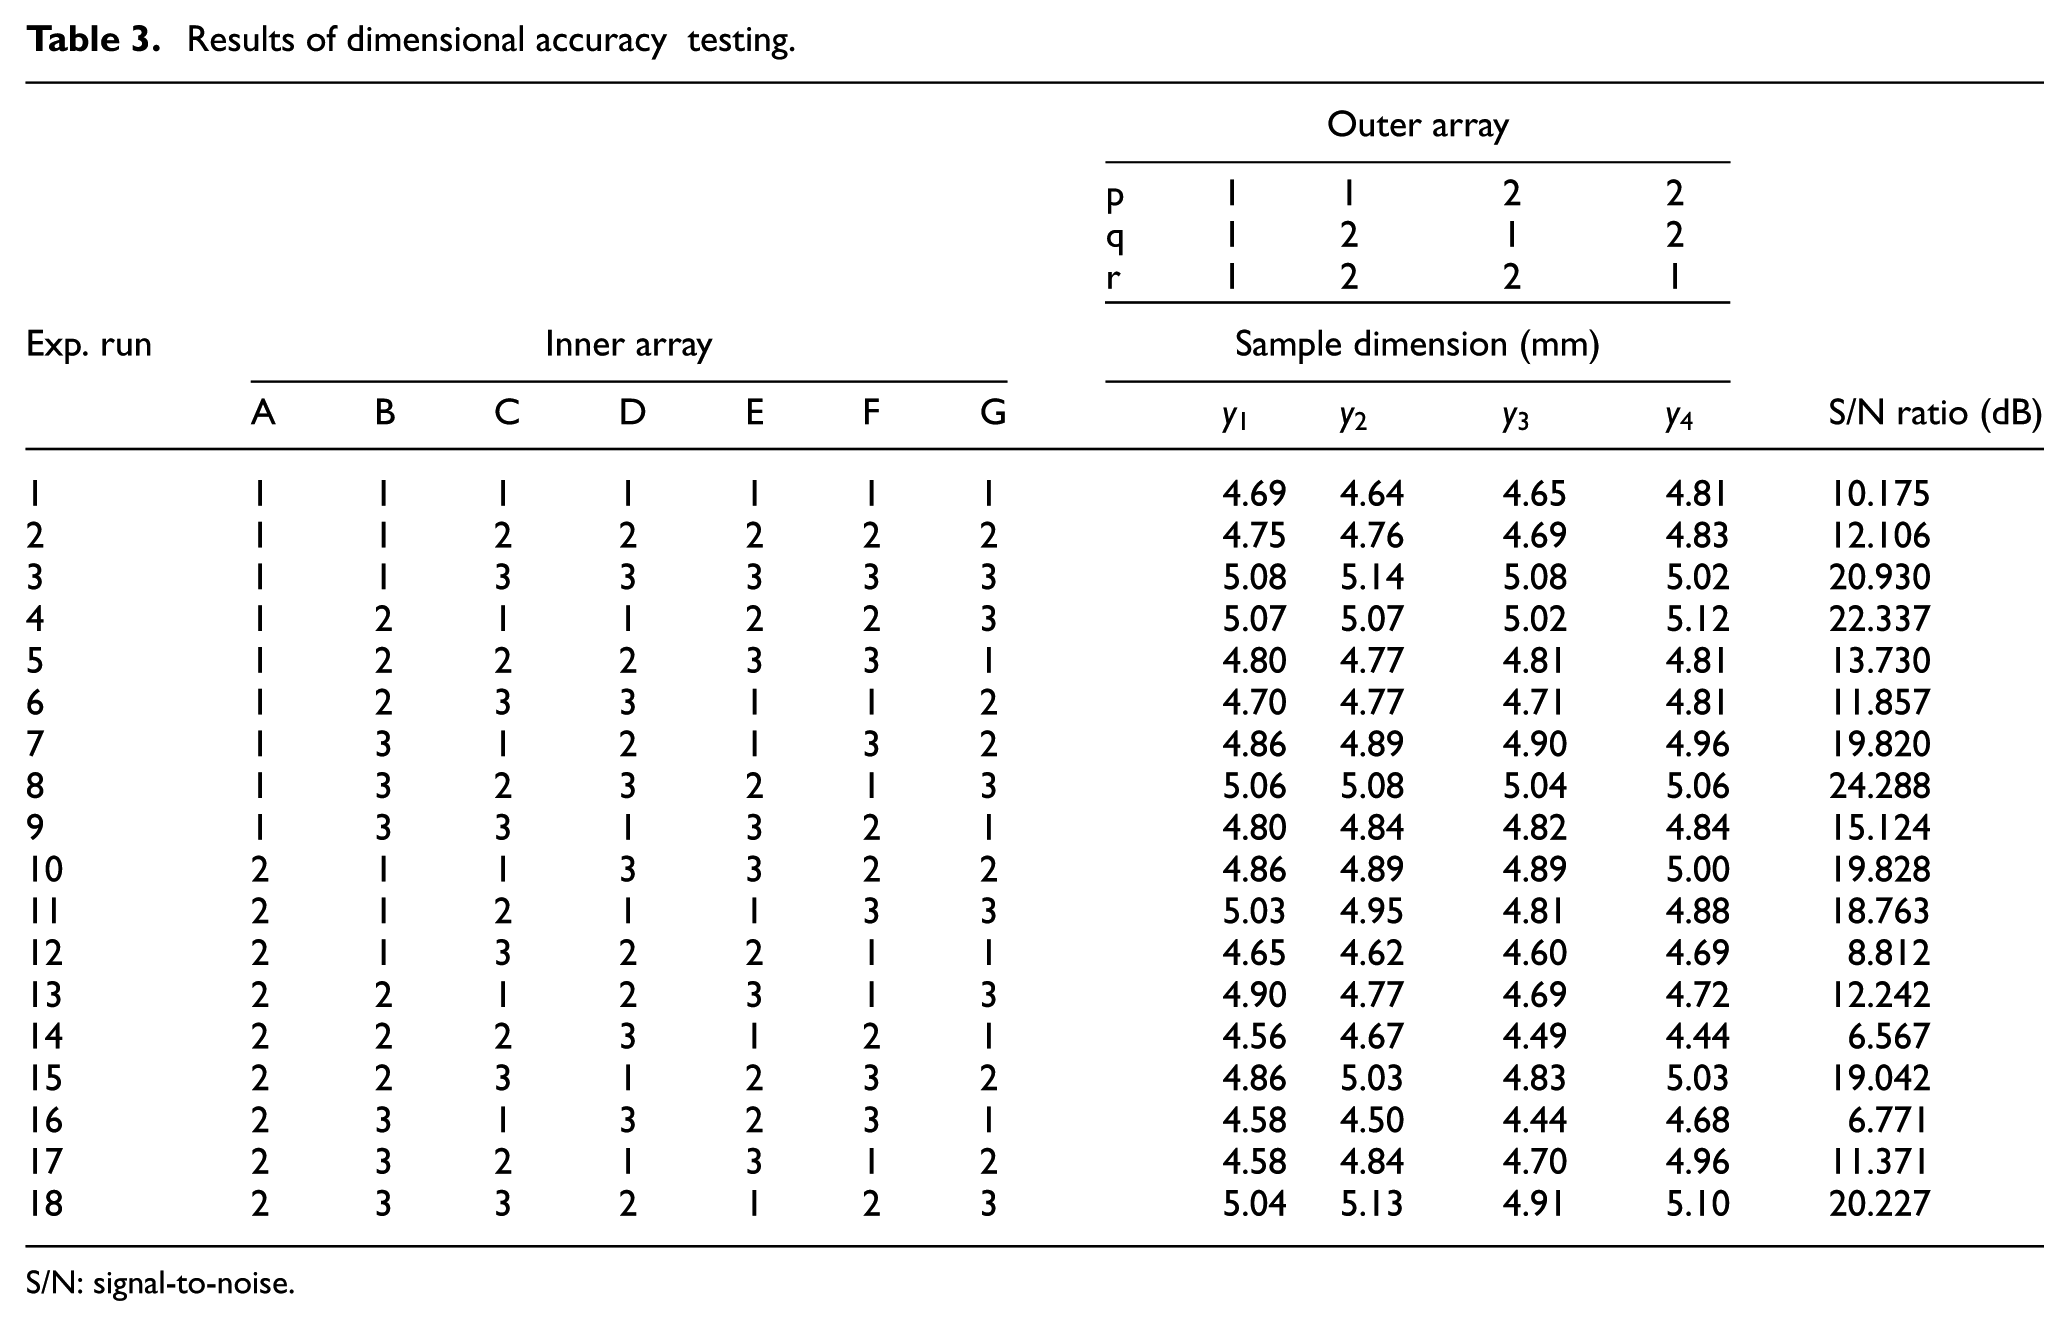
To optimize the process parameters for dimensional accuracy, the average of each factor level is calculated. The effect of the control factors for dimensional accuracy is shown in Figure 4. In Figure 4, the best combination of process parameters, A1, B3, C3, D1, E2, F3, and G3, can be observed from the highest S/N ratio value of each level in these factors. The effective factor can also be discovered from the disparity between the highest value of the S/N ratio and the lowest value of the S/N ratio in each factor. Therefore, the effective factors are G (illumination of the projector), A (light colour), and F (content of photo-initiator).
Effect of the control factors on the dimensional accuracy.
When measuring the surface roughness, a
Design and the photograph of the sample holder for surface roughness measurements.
The surface roughness of the sample is measured using a HommelWerke T400 roughness measurement with a TKL 300/17 probe on the midline of the slope. The arithmetic average roughness,
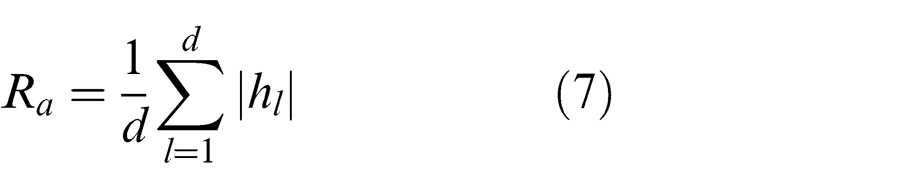
where
Results of surface roughness testing.
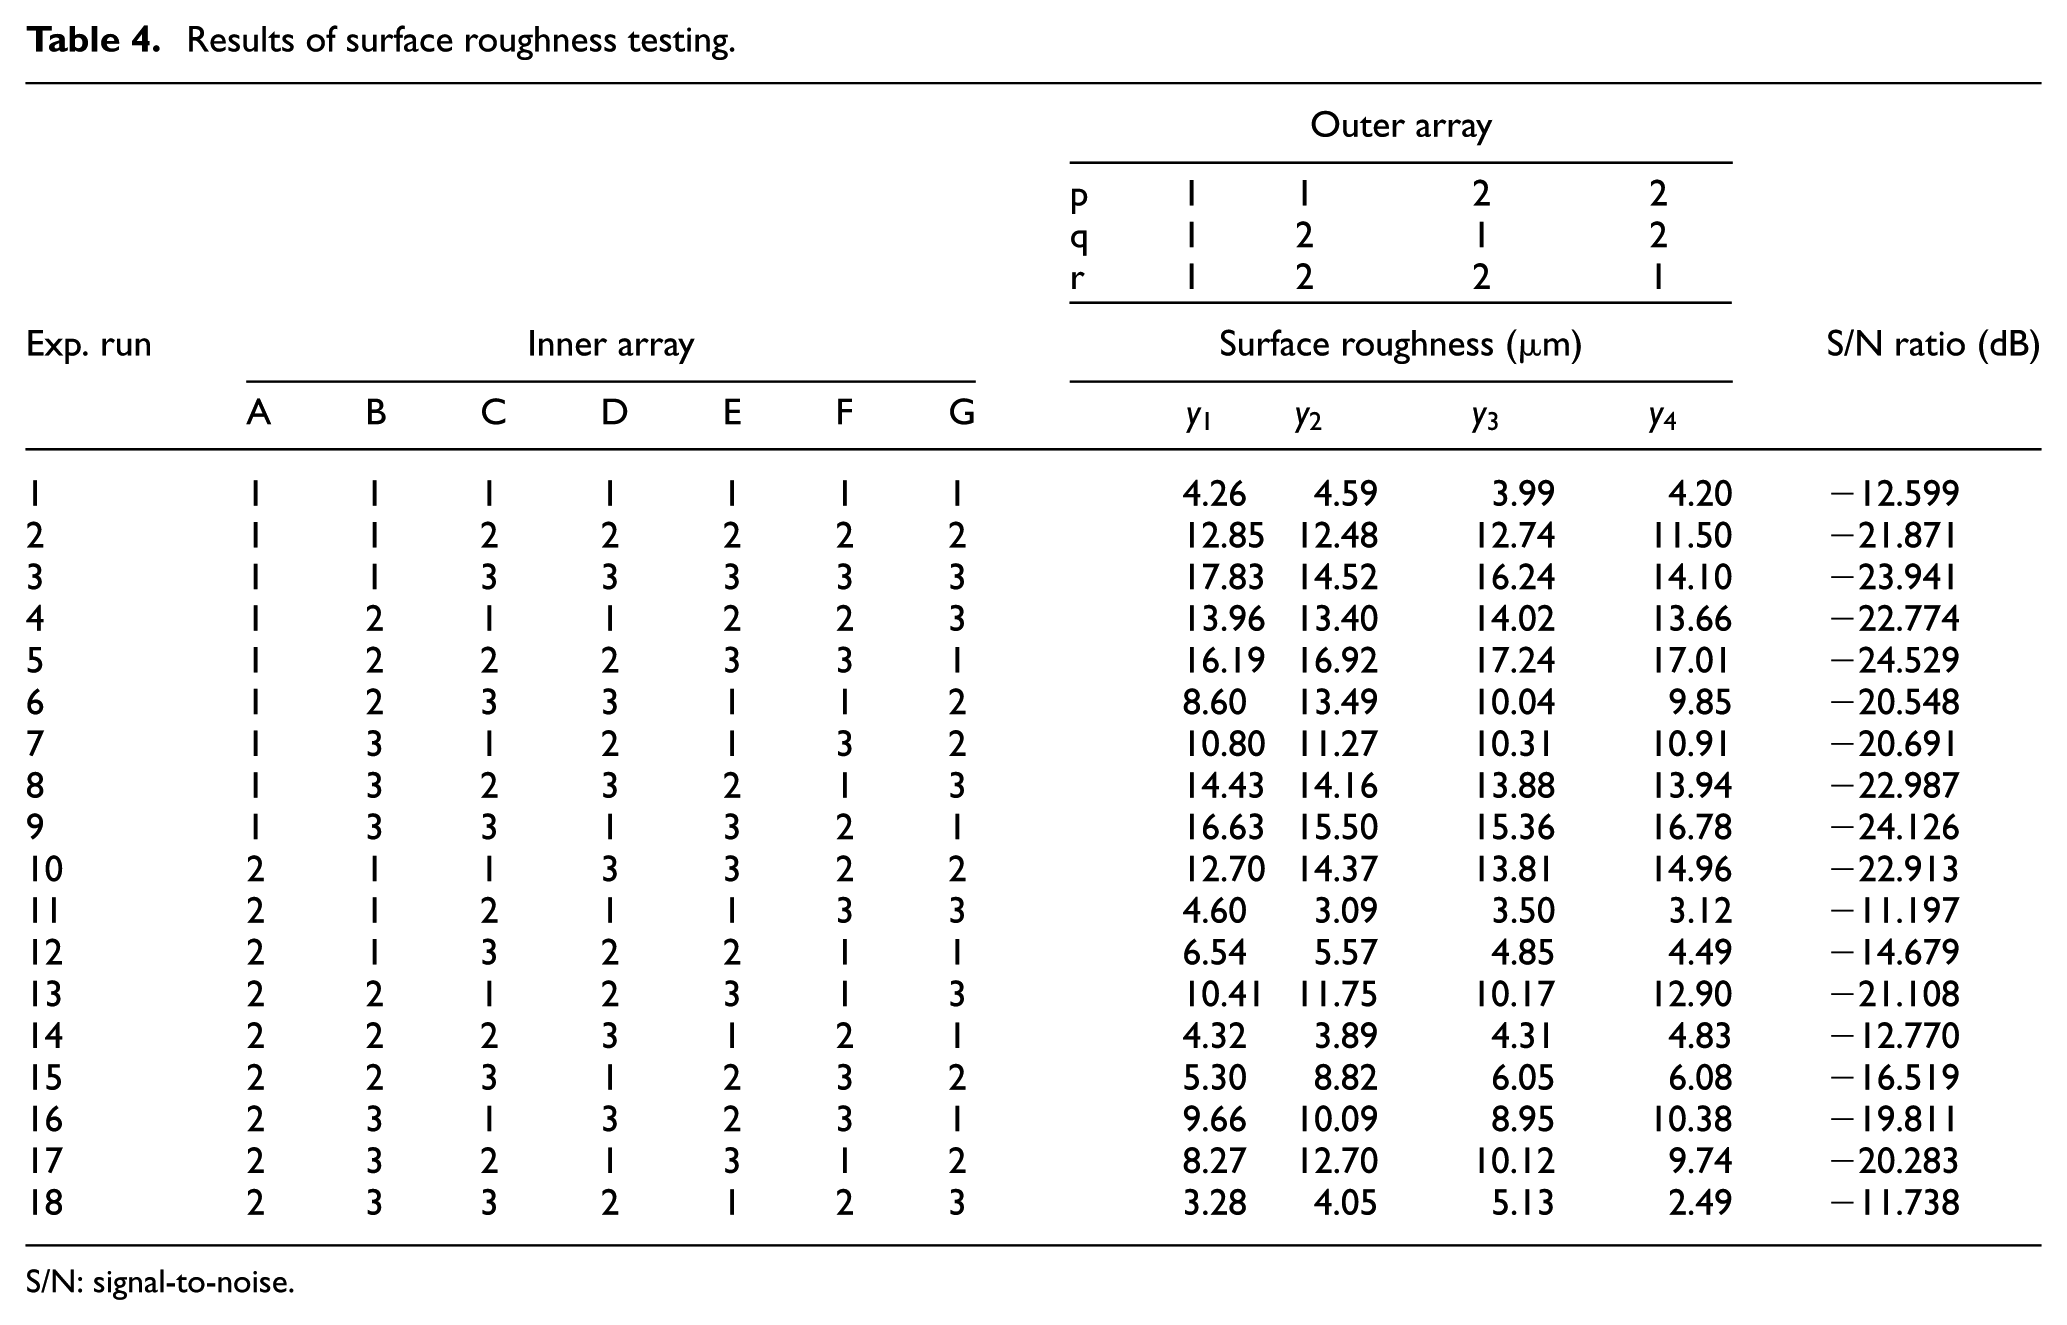
S/N: signal-to-noise.
The effect of the control factors in the surface roughness test is shown in Figure 6. The most effective factor for the surface roughness is E (layer thickness), and the second effective factor is A (light colour). The best combination of process parameters for surface roughness is A2, B1, C3, D1, E1, F1, and G1.
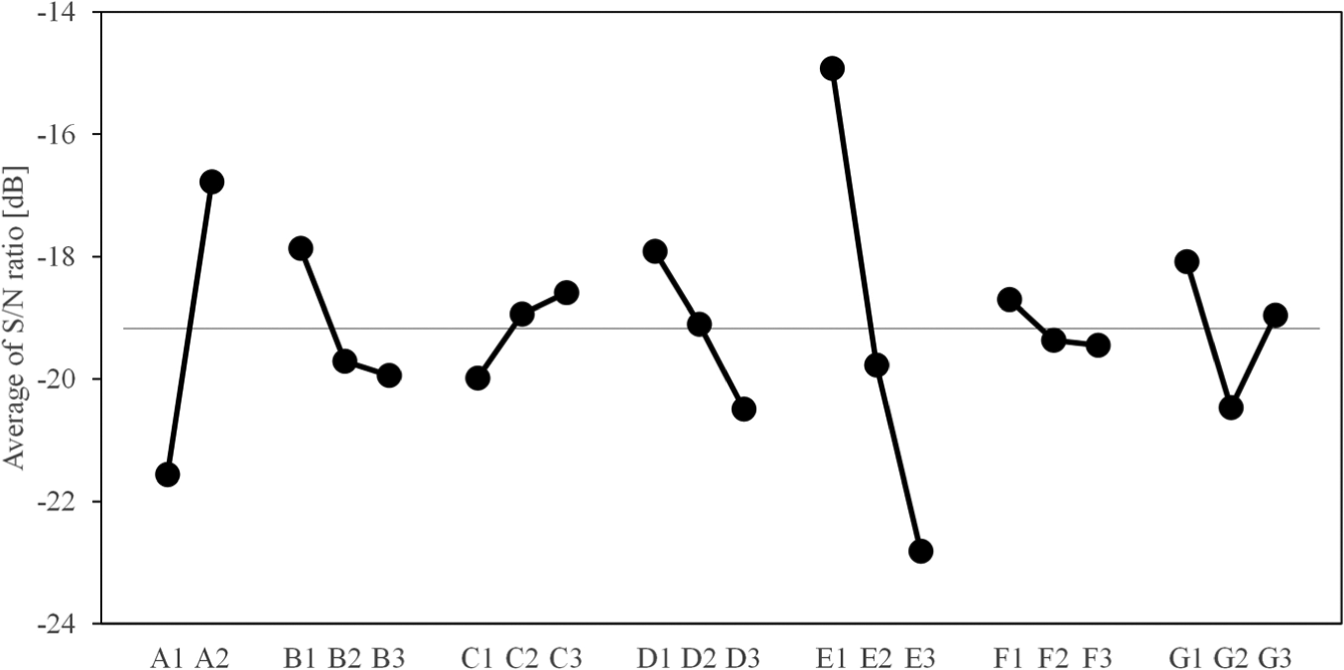
Effect of control factors on the surface roughness.
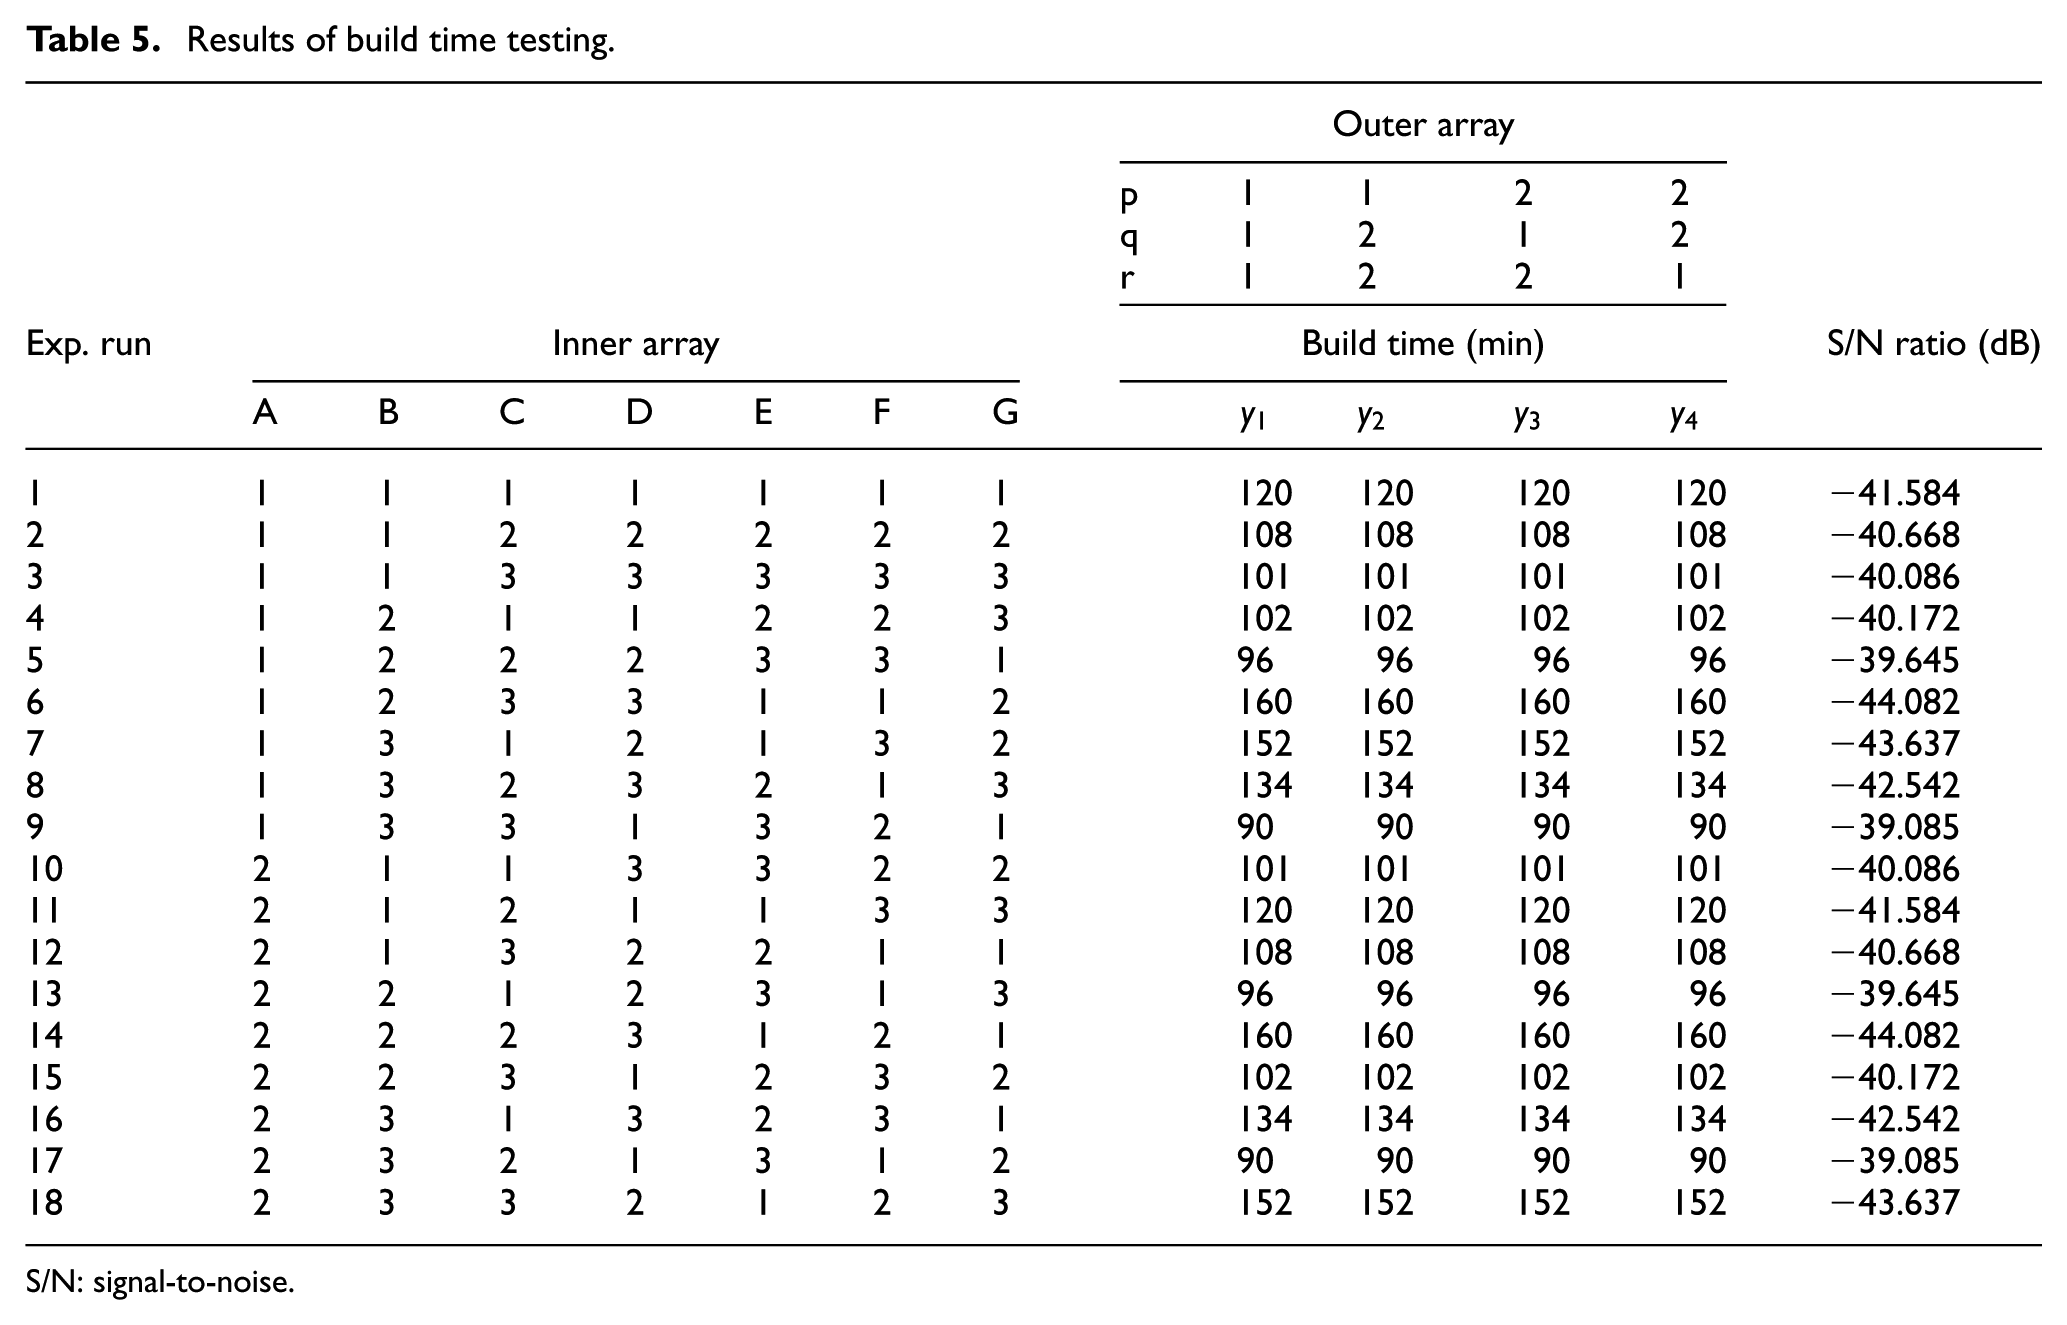
The build time of the sample is recorded using the PC in the area-forming RP system. The results of the build time test are shown in Table 5. The build time is a smaller-the-better quality characteristic. Therefore, the S/N ratio is calculated using equation (2). In the area-forming RP system, only the curing time, deep dip time, and layer thickness could affect the build time. The best combination for the shortest build time is a 7-s curing time, 18-s deep dip time, and a 0.12-mm layer thickness. The effect can also be observed in Figure 7.
Results of build time testing.
S/N: signal-to-noise.
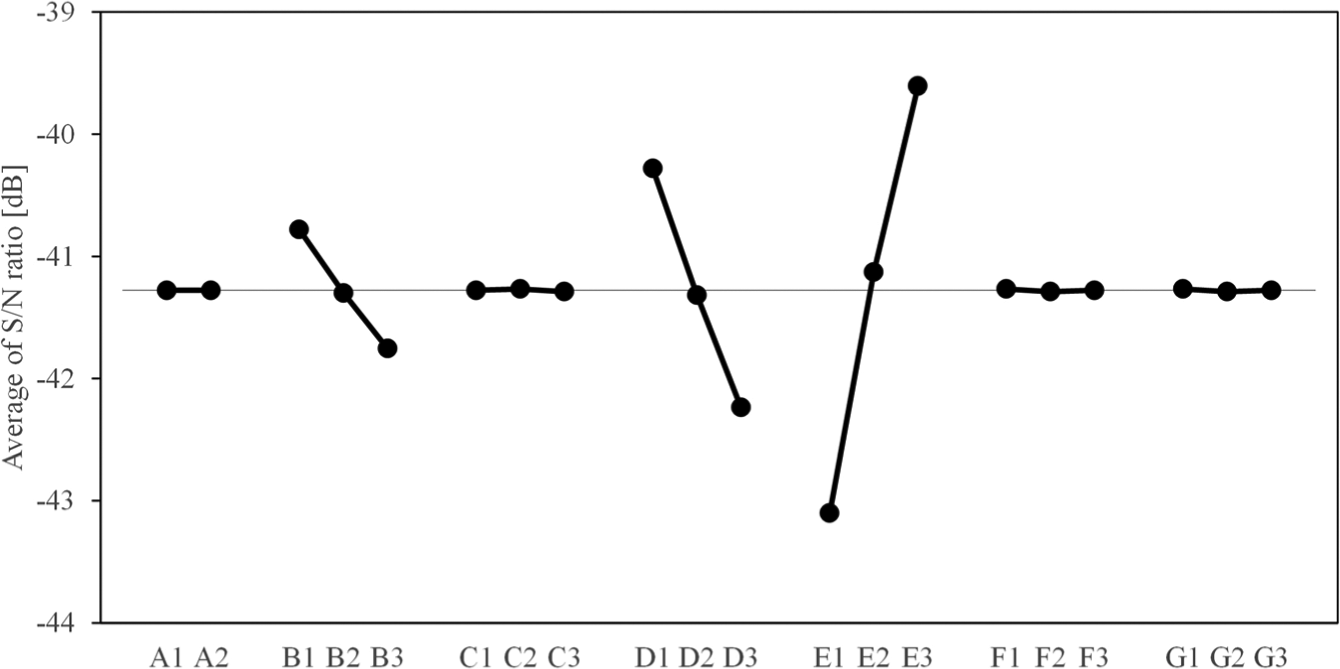
Effect of the control factors on the build time.
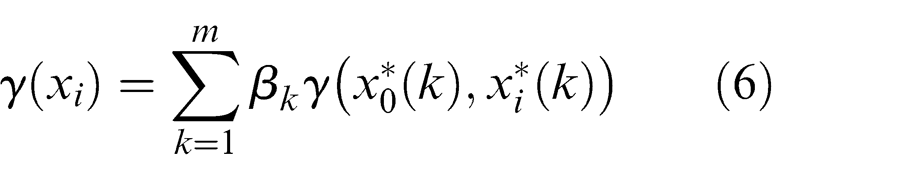
The S/N ratios of the three qualities are then integrated using a grey relational analysis. The results of the grey relational analysis are shown in Table 6, in which DA, SR, and BT represent the dimensional accuracy, surface roughness and build time, respectively. Because the S/N ratio is a larger-the-better data sequence, the grey relation generating of these three quality characteristics is calculated using equation (3). The grey relational coefficients and grey relational grade are calculated using equations (4) and (6), respectively. For the grey relational grade, the three evaluations are combined into one grade. Because the ideal value of the grey relational grade is one, the nominal-the-best type S/N ratio is calculated for the grey relational grade using equation (1).
Grey relational analysis for multi-quality characteristics.
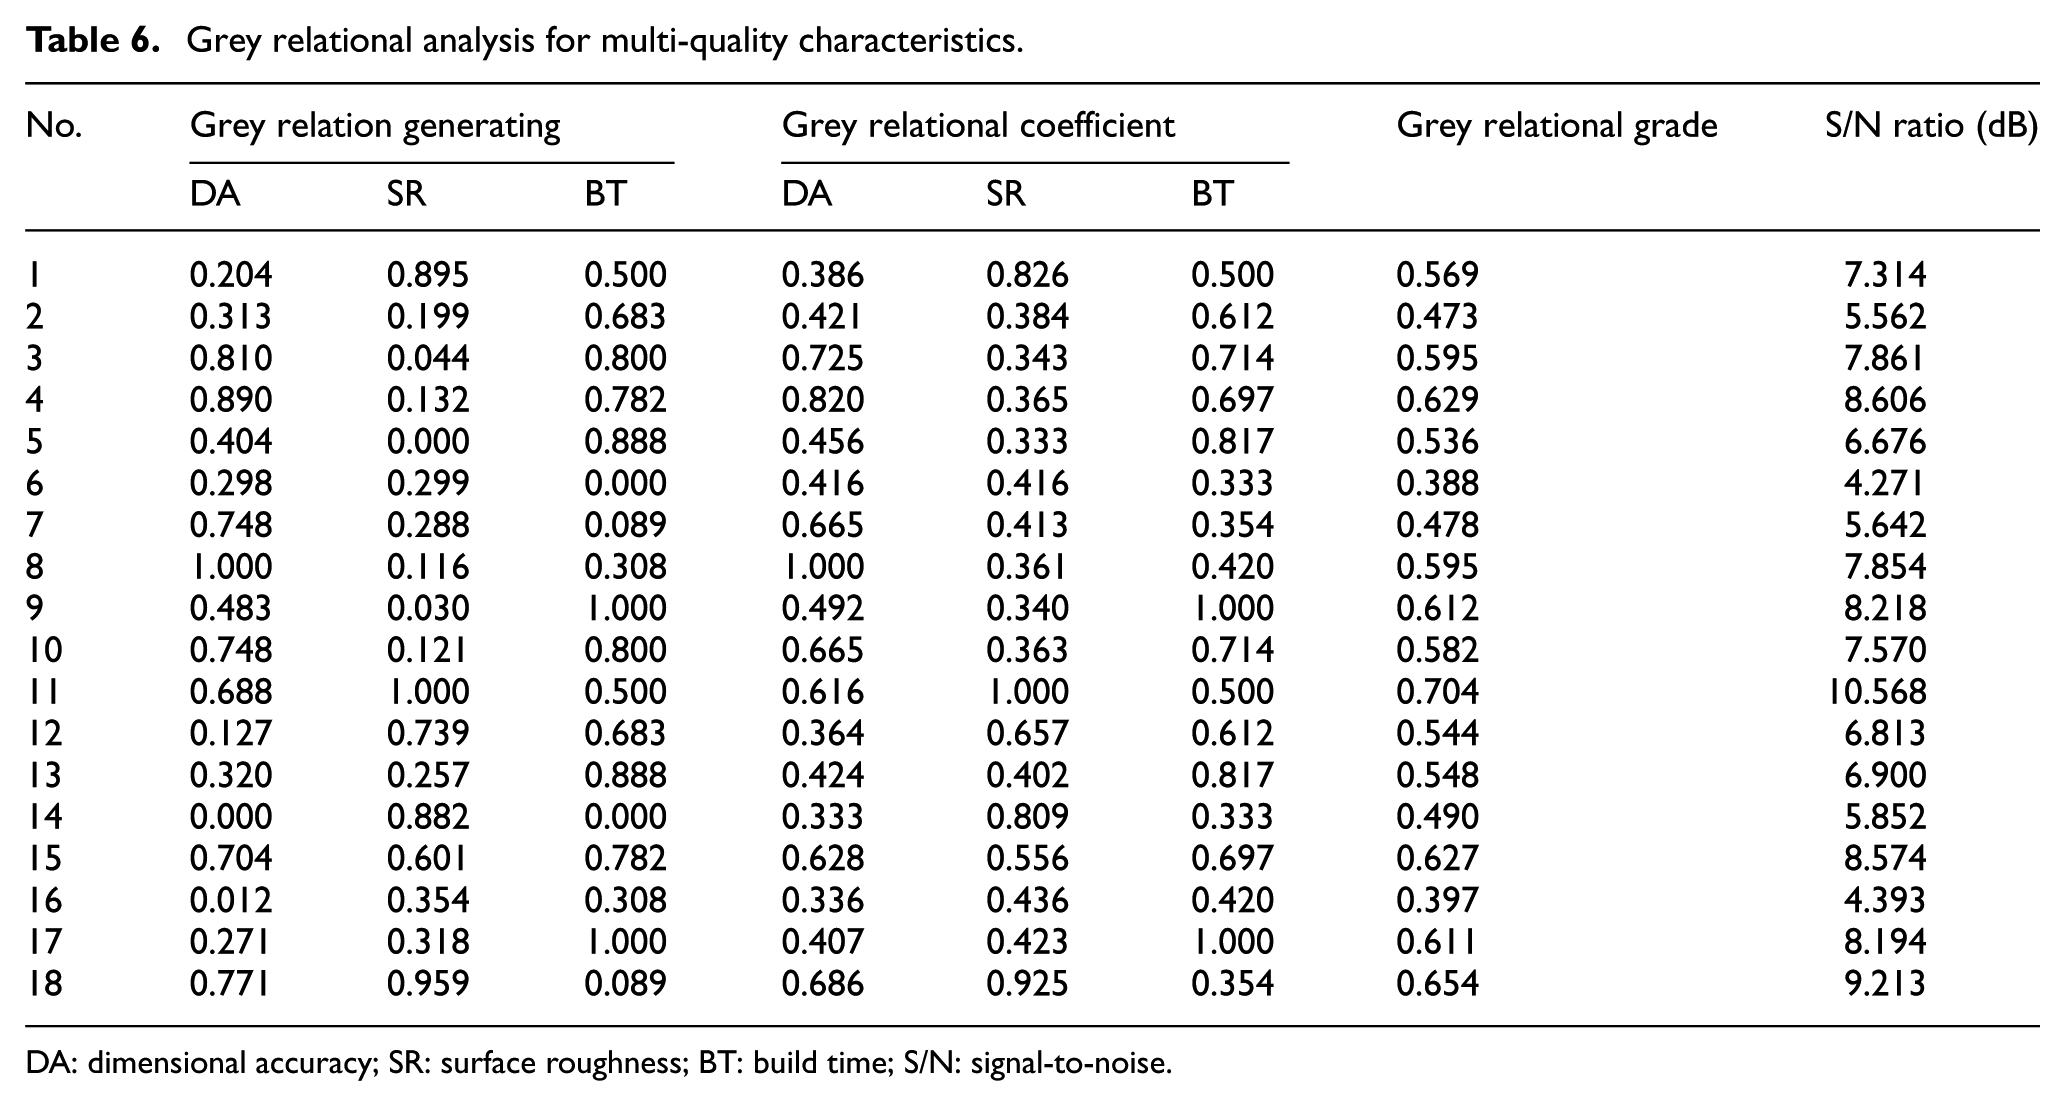
DA: dimensional accuracy; SR: surface roughness; BT: build time; S/N: signal-to-noise.
The S/N ratio of each factor and level is averaged to optimize the process parameters. From Figure 8, the best combination of process parameters (A2, B1, C3, D1, E3, F2, and G3) is selected from the level with the highest S/N ratio in each factor.
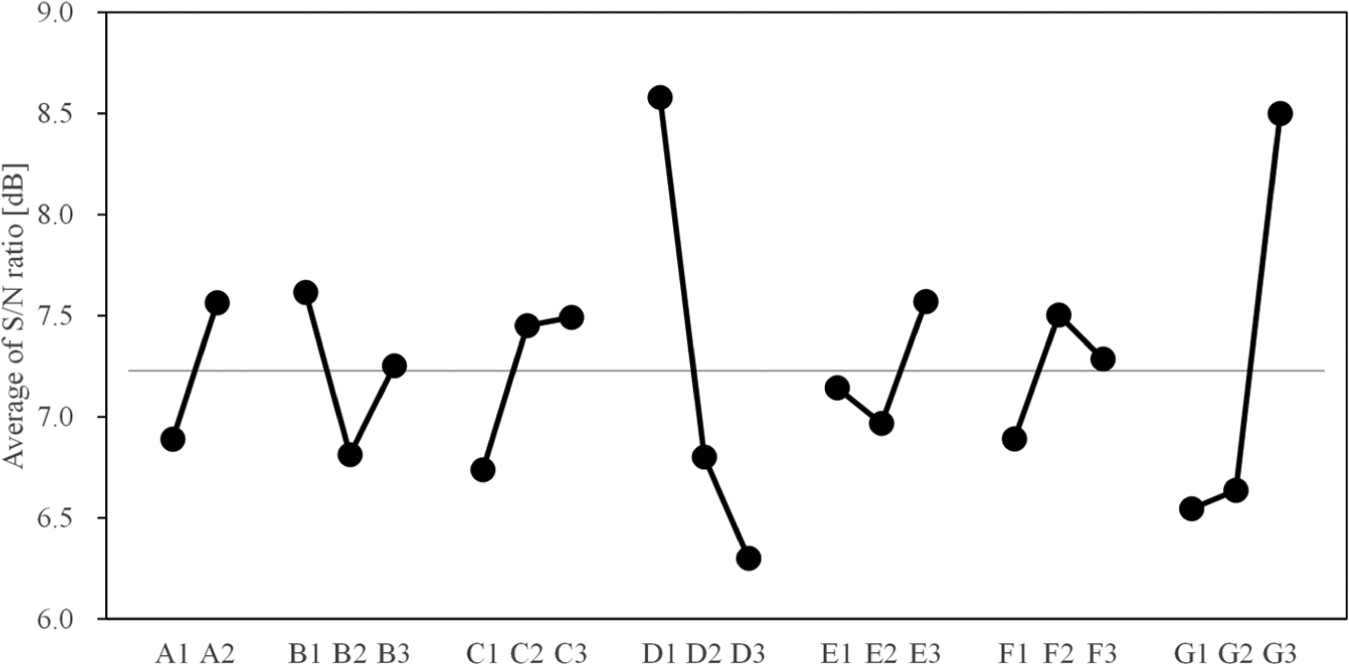
Effect of the control factors on the multi-quality.
The sensitivity analysis for different distinguishing coefficient is conducted and shown in Figure 9. The best combination of the process parameters is the same by setting distinguishing coefficient from 0.5 to 0.9. This combination is different to other combinations generated by setting distinguishing coefficient from 0.1 to 0.4 on factors B and C. However, the factors B and C are not the mainly effective factors on each quality characteristic. Moreover, the parameters B1 and C3 which are derived by setting distinguishing coefficient as 0.5 lead the best quality on the build time and the surface roughness. Therefore, the value 0.5 is a suitable value for distinguishing coefficient in this study.
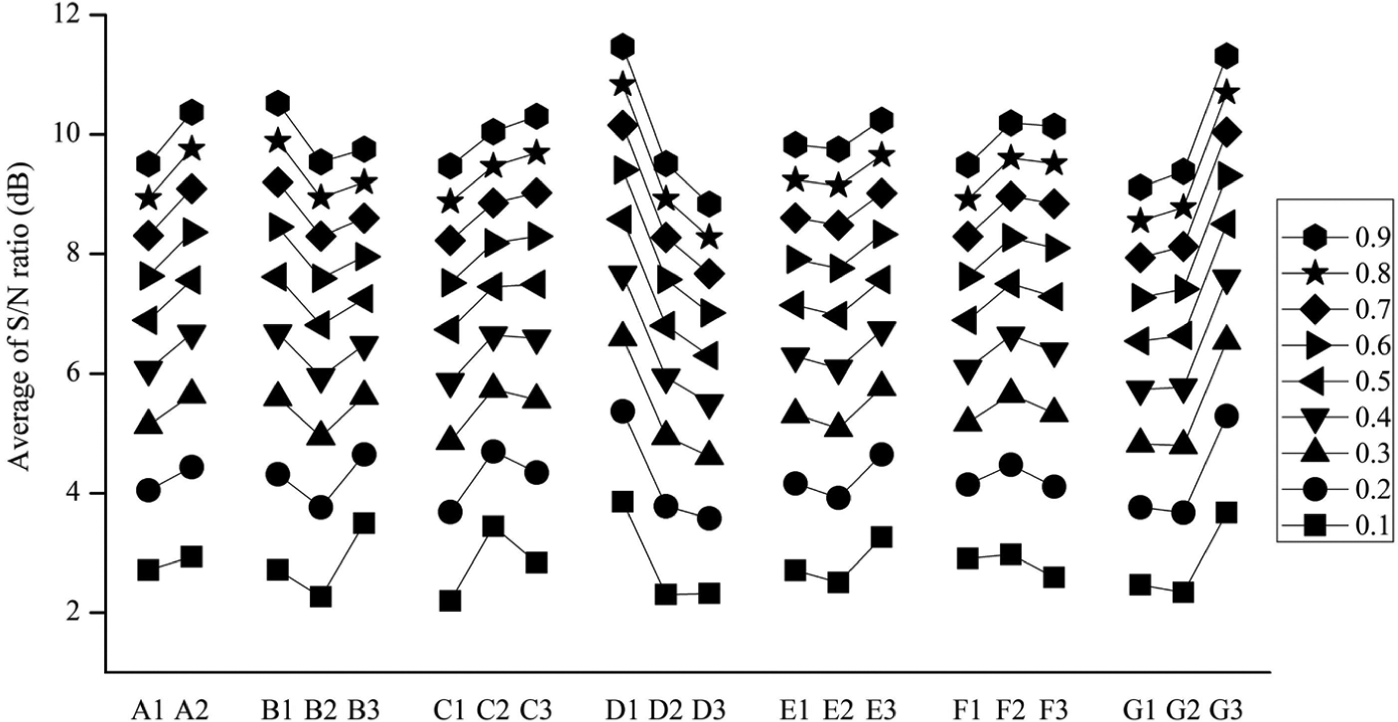
Sensitivity analysis of different distinguishing coefficients.
In addition, extra samples are fabricated with the best combination of process parameters. The quality characteristics of the extra samples are measured using the identical apparatuses, and the results are shown in Table 7. The S/N ratio of the three qualities of the extra samples is also calculated. The grey relational grade of the data sequence with the extra samples is then calculated, and the results are shown in Table 8. In Table 8, the value of the grey relational grade of the extra samples is the largest value. This result confirms that the combination of process parameters for fabricating the extra samples is the best combination.
Observed values and the S/N ratio of the extra samples.
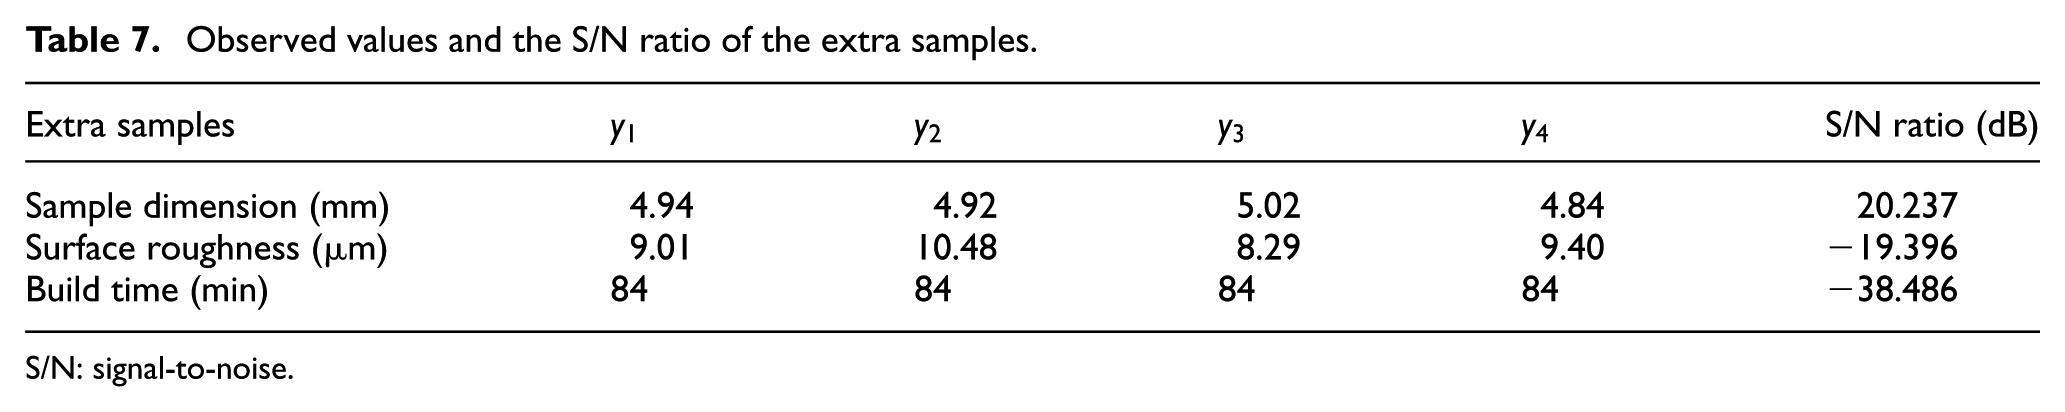
S/N: signal-to-noise.
Grey analysis and the rank for the data sequence with the extra samples.
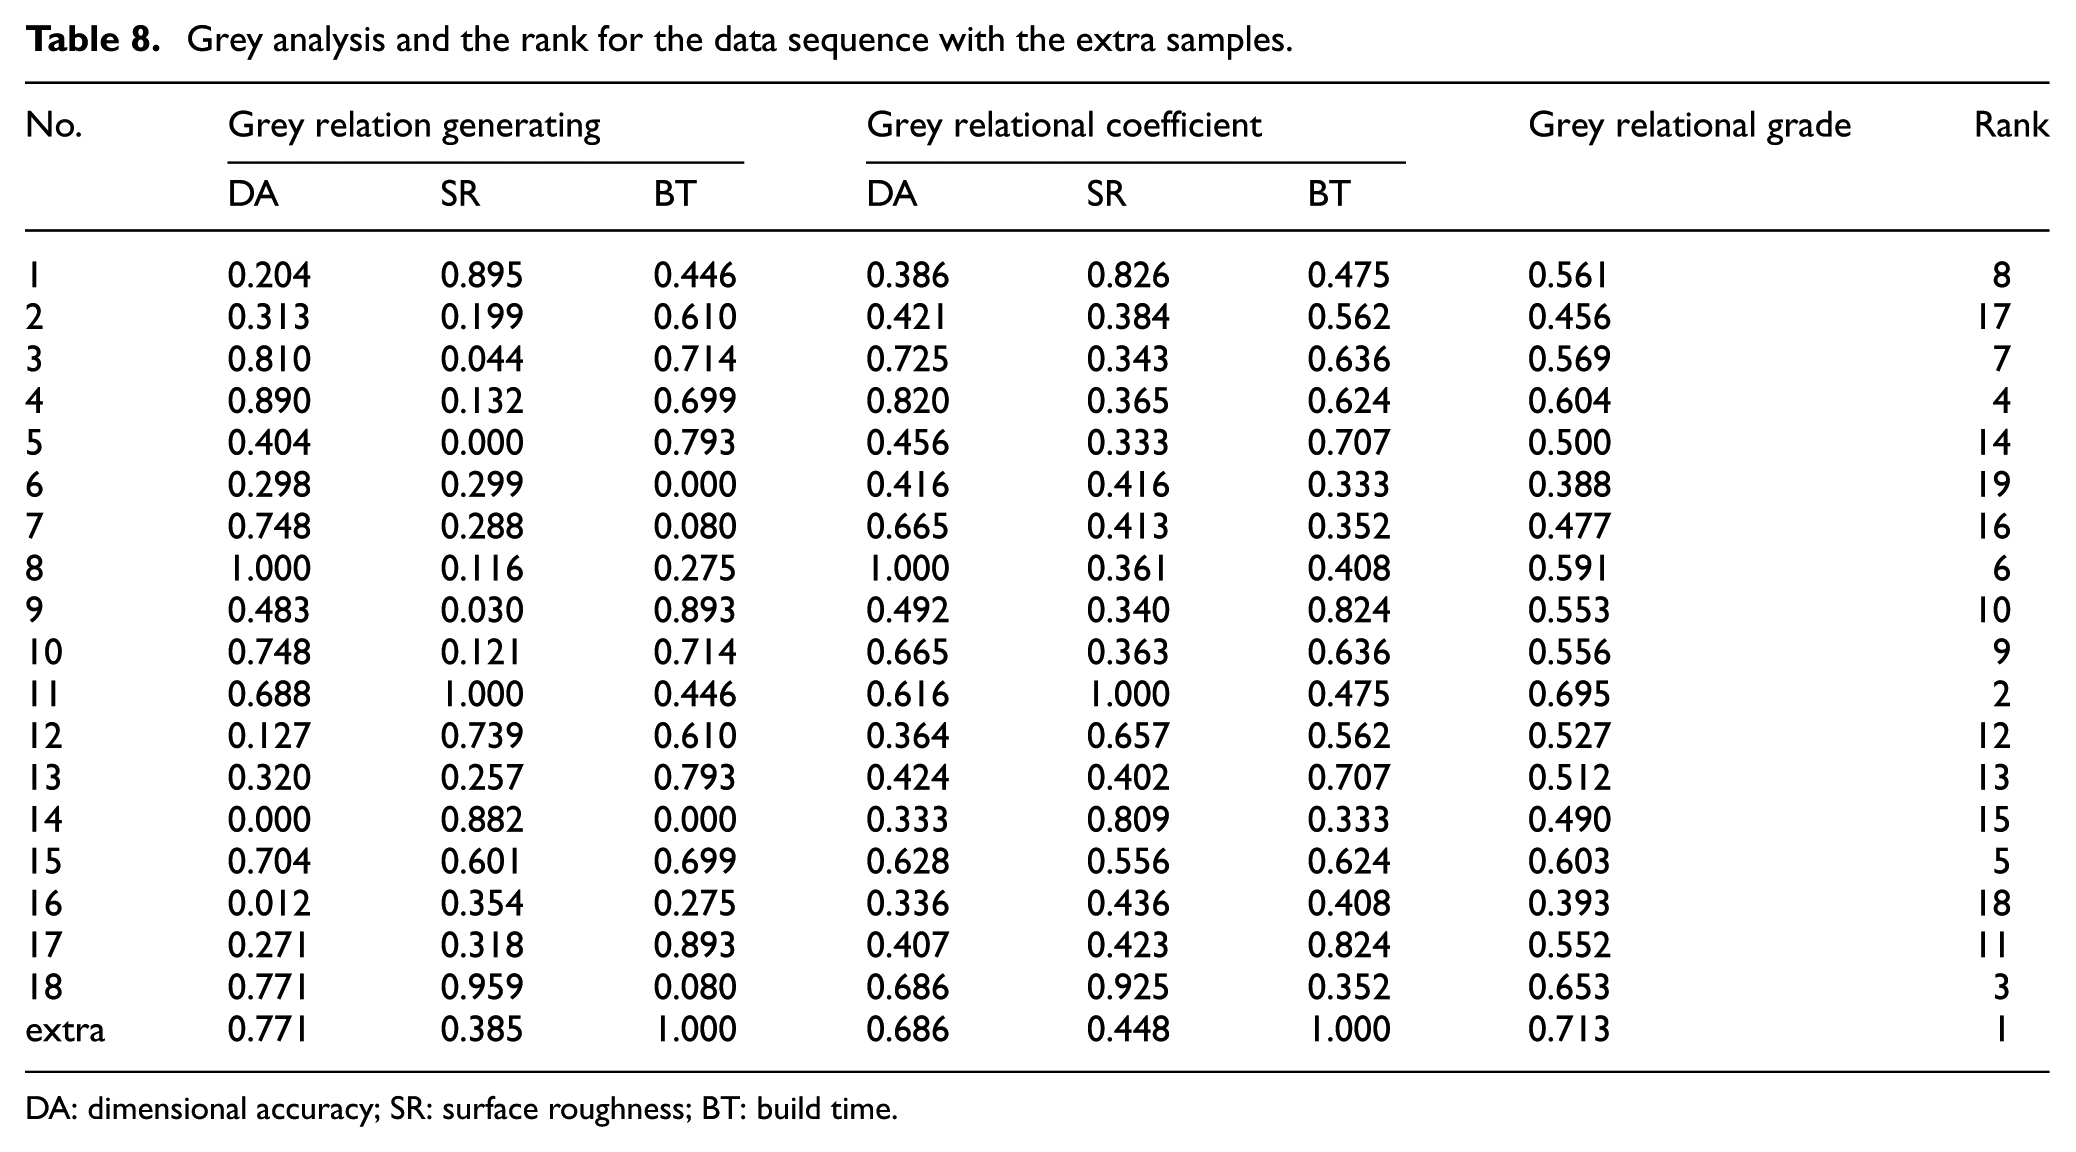
DA: dimensional accuracy; SR: surface roughness; BT: build time.
Conclusion
As the experiment results have shown, this study determined the optimal set of process parameters for dimensional accuracy, surface roughness, build time, and the multi-quality for an area-forming RP system. In addition, this study determined the effects of control factors on these quality characteristics.
The Taguchi method is employed to optimize the process parameters for each single quality.
For dimensional accuracy. The best combination of process parameters is white light for the light colour, 13 s for the curing time, 100 phr for the content of reactive oligomer, 18 s for the deep dip time, 0.10 mm for the layer thickness, 2.0 phr for the content of photo-initiator, and 8000 Lux for the illumination of the projector. The most effective factor is the illumination of the projector.
For surface roughness. The best combination of process parameters is blue light for the light colour, 7 s for the curing time, 100 phr for the content of reactive oligomer, 18 s for the deep dip time, 0.08 mm for the layer thickness, 1.0 phr for the content of the photo-initiator, and 4000 Lux for the illumination of the projector. The most effective factor is the layer thickness.
For build time. The best combination of process parameters is 7 s for the curing time, 18 s for the deep dip time, and 0.12 mm for the layer thickness. The other control factors do not affect the build time of the parts.
The process parameters for the multi-quality are optimized using the grey Taguchi method.
The best combination of process parameters is blue light for the light colour, 7 s for the curing time, 100 phr for the content of the reactive oligomer, 18 s for the deep dip time, 0.12 mm for the layer thickness, 1.5 phr for the content of the photo-initiator, and 8000 Lux for the illumination of the projector. The best combination of process parameters was verified using the extra samples.
Footnotes
Appendix 1
Declaration of conflicting interests
The author(s) declared no potential conflicts of interest with respect to the research, authorship, and/or publication of this article.
Funding
The author(s) disclosed receipt of the following financial support for the research, authorship, and/or publication of this article: This study was financially supported by the National Science Council of the Republic of China, Taiwan under Contract No. NSC 100-2221-E-011-041.