
Abstract
The importance of polymer-polymer thermoplastic composites is increasing due to ease of recycling. This work investigates the effects of remolding temperature and thermal annealing on the properties of polyethylene (PE) composites containing PA6 and GO/PA6 electrospun nanofibers. Nanocomposite samples were prepared by sandwiching several layers of PA6 or GO/PA6 electrospun mats and PE films in a hot press and subsequently were remolded at varying higher temperatures in a range of 180 to 210°C. Furthermore the remolded samples at 200°C were then annealed at 100°C for 10 h. SEM and DMTA results of the developed samples showed that the application of higher remolding temperatures, close to the melting point of PA6, improves wettability and interfacial strength in the composites. The DSC results of the samples revealed a slight increase in PE crystallinity due to the induced crystallization on the surface of nanofiber mat. It was also observed that an increase in the remolding temperature increases the tensile properties of the composites with the best properties obtained at a remolding temperature of 200°C. Increasing the remolding temperature beyond 200°C decreases the tensile properties of the composites due to melting and geometry degradation of the nanofibers. The results revealed that the annealing of the samples at 100°C for 10 h increases the degree of crystallinity and tensile properties. The highest yield strength, 16.4 MPa, and modulus, 277 MPa, were obtained for the composite containing 10.5 wt% of pure PA6 nanofibers. The elongation and toughness of this composite compared to those of pure matrix were increased by 61% and 83%, respectively. In the remolded and annealed nanocomposites, a crystalline region, as thick as 20 microns, grown on the surface of the nanofiber mat or nanofiber rich region, so called transcrystalline region, was observed by polarized reflected light microscopy.
Keywords
Introduction
Polymer-polymer thermoplastic composites where, both matrix and fiber are thermoplastic materials are increasing in demand and interest due to their important advantages such as ease of processing and molding in large scale at low cost, ease of recycling and a polymer type interface between matrix and fiber which could be more compatible than polymer-mineral type interfaces in traditional polymer/carbon fiber or polymer/glass fiber composites. Fibrous composites take up an important part of polymer-based composites. With the development of nanomaterials in recent years, fibers with nanoscale diameters have also attracted growing interest.1–6 The idea behind nanocomposite fabrication is that a small decrease in the filler size brings about a large increase in interfacial area of the matrix and filler particles. This can lead to enhanced composite properties, provided that adhesion between matrix and nanofiber is adequate.7–12 As a result, fiber diameter reduction with the aim of further enhancement of its effectiveness is an interesting field of research. The most prevalent method of obtaining sub-micron fibers is electrospinning. Electrospinning is driven by an electrical force and follows a “bending instability” thinning mechanism. This unique thinning mechanism creates fibers with diameters approximately two to three orders smaller than natural or conventional spun fibers and subsequently provides larger specific surface areas.1–6 Electrospun fibers can be used to modify mechanical, electrical, and thermal properties of composites, on the condition of strong adhesion to the matrix. Many studies have focused on the use of electrospun glass/carbon nanofibers in polymer matrices.9–14 However, the use of electrospun polymer nanofibers as reinforcement in polymer matrices is still in its infancy. Therefore, fundamental studies of such composites can be useful in enhancing the properties of polymer matrices with the objective of developing new applications or increasing lifetime or performance.
To this day a lot of polymers have been successfully electrospun and the resulting nanofibers were employed as reinforcements in different polymeric matrices.10,15–27 According to these studies, the properties of the polymer matrices can be improved by incorporation of electrospun polymer nanofibers. In general, the most common reason for using nanofibers in polymer matrices is not to enhance the mechanical properties of the polymer matrix, but to improve optical, electrical, and chemical properties. For example, nanofibers are used as property enhancers in transparent composites to maintain the transparency of the original matrix.19–21 They are also used to improve biodegradability efficiency in biodegradable composites.23,24 There are also cases that indicate the use of nanofibers with the aim of improvement or preservation of the flexibility and toughness of the polymer matrices.25–27
In our previous research, 27 we employed a hot press method to fabricate composites with PE as the matrix and electrospun PA6 nanofibrous mats as reinforcement. The melt processing method was selected due to its eco-friendliness and easy processability, being the potential method for the large-scale production of polymer composites. In general, maleated compatibilizing agents are commonly used in polyolefin-PA systems to improve compatibility. 28 Therefore, PE grafted maleic anhydride (PE-g-MA) was used in our research as the matrix so that an assured adhesion between PA6 nanofibers and PE could be obtained. Therefore, in this work when PE is mentioned it means PE-g-MA. We also incorporated graphene oxide (GO) nanoplates into PE via insertion into PA6 nanofibers. In fact, nanofibers were utilized as graphene nanoplates carriers. Eventually, both the effect of the presence of the pure PA6 nanofibers and GO/PA6 composite nanofibers on the properties of the PE matrix were investigated. The SEM micrographs affirmed that the applied procedure was efficient for impregnating the electrospun nanofibers with PE-g-MA matrix and making a good adhesion between them. The crystallinity of PE was influenced by the presence of both, nanofibers as well as GO nanoplates, due to their nucleation effects. Presence of nanofibers improved the elastic modulus and yield strength of PE by 120% and 33%, respectively. Although presence of the nanofibers, decreased the ductility, the yield phenomenon was maintained.
Properties such as morphology, crystallization, and mechanical performance of polymers are affected by their thermal history. 29 Also in polymer composites containing porous fillers or nanofiberous mats which are considered porous, the mechanical properties of the composites largely depends on the residual pores of the added porous fillers or mats. Increasing molding pressure is an efficient and routine method to force drive the polymeric matrix into pores.30,31 Another strategy is to increase molding temperature so that polymer chains with higher mobility and lower viscosity can penetrate into the pores. The effects of molding temperature and thermal annealing treatment on the properties of polymer fibrous composites have been rarely studied. Dasdemir et al., 32 investigated the effect of molding temperature on the interfacial adhesion of (PA6 microfiber)/((PE+SEBS-g-MA) matrix) composites. According to their findings, the interfacial adhesion increased with temperature after 170°C. Since increase of temperature provides more mobility for polymer chains and therefore enhances the diffusion of the compatibilizer to the interface region, more compatibilizer undergoes reaction/interaction with PA6. Also, it could suggest that reactive compatibilization of composite during composite fabrication can be possible with temperature over 170°C which is much lower than the peak melting temperature of PA6 (220°C). This was ascribed to the relatively long processing time (30 min) which helped the reaction to spread in time at lower temperatures and resulted in considerable improvement of adhesion between PA6 and PE + SEBS-g-MA.
To our knowledge, the effect of molding temperature and thermal annealing treatment on the properties of polymer nanofibrous composites has not been reported so far. Therefore, in the current research, we remolded the hot-pressed composites containing PE-g-MA as a matrix and pure and GO-incorporated PA6 nanofibers as reinforcement, in an oven, to study the effect of molding temperature as well as thermal annealing on their properties for the first time. The properties of the resulting composites were studied by Scanning electron microscopy (SEM), transmission electron microscopy (TEM), wide-angle X-ray diffraction (WAXD), differential scanning calorimetry (DSC), fourier transform infrared spectroscopy (FTIR), dynamic mechanical analysis (DMA), reflected light microscopy, and tensile test.
Experimental section
Materials
Polyamide 6 [PA6, Volgamide 27, KuibyshevAzot], acetic acid [AA, 96%, Merck], formic acid [FA, 98%, Merck], and GO [10–20 nm thickness, United Nanotech Innovation Pvt. Ltd] were used to produce nanofibers through electrospinning. Maleic anhydride grafted polyethylene [PE-g-MA, ME0420, MA% ˷ 0.15, Borealis] was also used to fabricate PE-based nanofibrous composites.
Nanofiber production and composite fabrication
PA6 and GO/PA6 nanofibers were produced by electrospinning PA6/(AA/FA) and PA6/(AA/FA)/GO solutions [12 wt% of PA6 dissolved in AA/FA co-solvent (50/50; w/w) and 2.5 wt% of GO dispersed in PA6], at room temperature. Optimum electrospinning conditions were 20 kV, a feeding rate of 0.3 mL hr−1, a spinning distance of 25 cm, and a collector speed of 1500 rpm. The electrospinning product was a porous mat including electrospun nanofibers with a thickness range of 30 microns. The average diameter was 146 ± 28 nm, for the pure PA6 nanofibers, and it was 157 ± 54 nm, for the 2.5 GO/PA6 nanofibers. The thickness of the mats was in a range of 30–50 microns measured with an accuracy of 1 micron with a thickness measuring device. 27 More details are given in our previous study. 27 The areal weight is about 0.015 g for a mat of 5 by 7 cm2 and thickness of 40 microns. From these values an approximate density of 0.11 g/cc is obtained for the mat which is much lower than the solid density of PA6 that is 1.14 g/cc. Therefore the mat approximately contains 90% porosity or free space. The spacing between the nanofibers ranges from 0 for sticking nanofibers to usually 5 microns. 27
The PE-based nanofibrous composites were fabricated by impregnation of PA6 and GO/PA6 electrospun nanofibrous mats with molten PE-g-MA via a hot-pressing method, described previously.
27
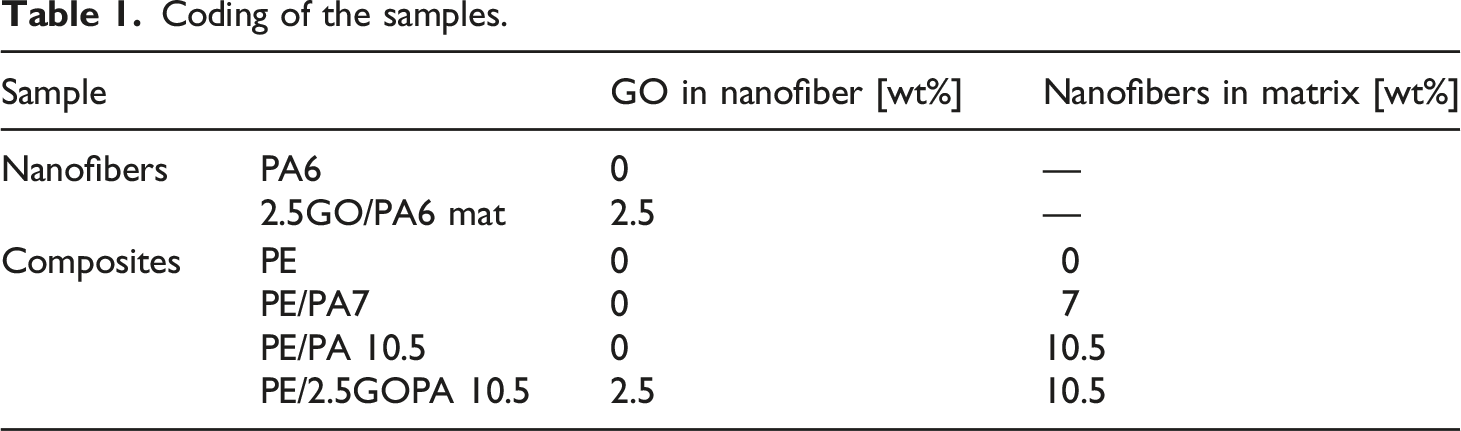
Thin PE-g-MA films of about 30 microns in thickness were prepared by hot pressing PE-g-MA granules at 200°C and 200 bar. Then, the nanofibrous mat was sandwiched between two PE-g-MA films, and this set was heat pressed at a moderate temperature of 180°C, between the melting points of PE and PA6. Thus, PE-g-MA was melted and penetrated into the pores of the mat, and a continual phase of the matrix was created in which the nanofibers were dispersed. The samples were cooled to room temperature by a water cooling system. Fibrous content in the matrix was controlled by the number of nanofibrous mats incorporated between the matrix film. Therefore, nanocomposite films containing 7 and 10.5 wt% of the electrospun nanofibers were obtained. Figure 1 shows the profile of temperature and pressure with time in hot press, and Table 1 gives the codes of the fabricated samples based on the content of the nanofibers in the matrix and the content of the GO in the nanofibers. The profile of temperature and pressure with time in the hot press. Coding of the samples.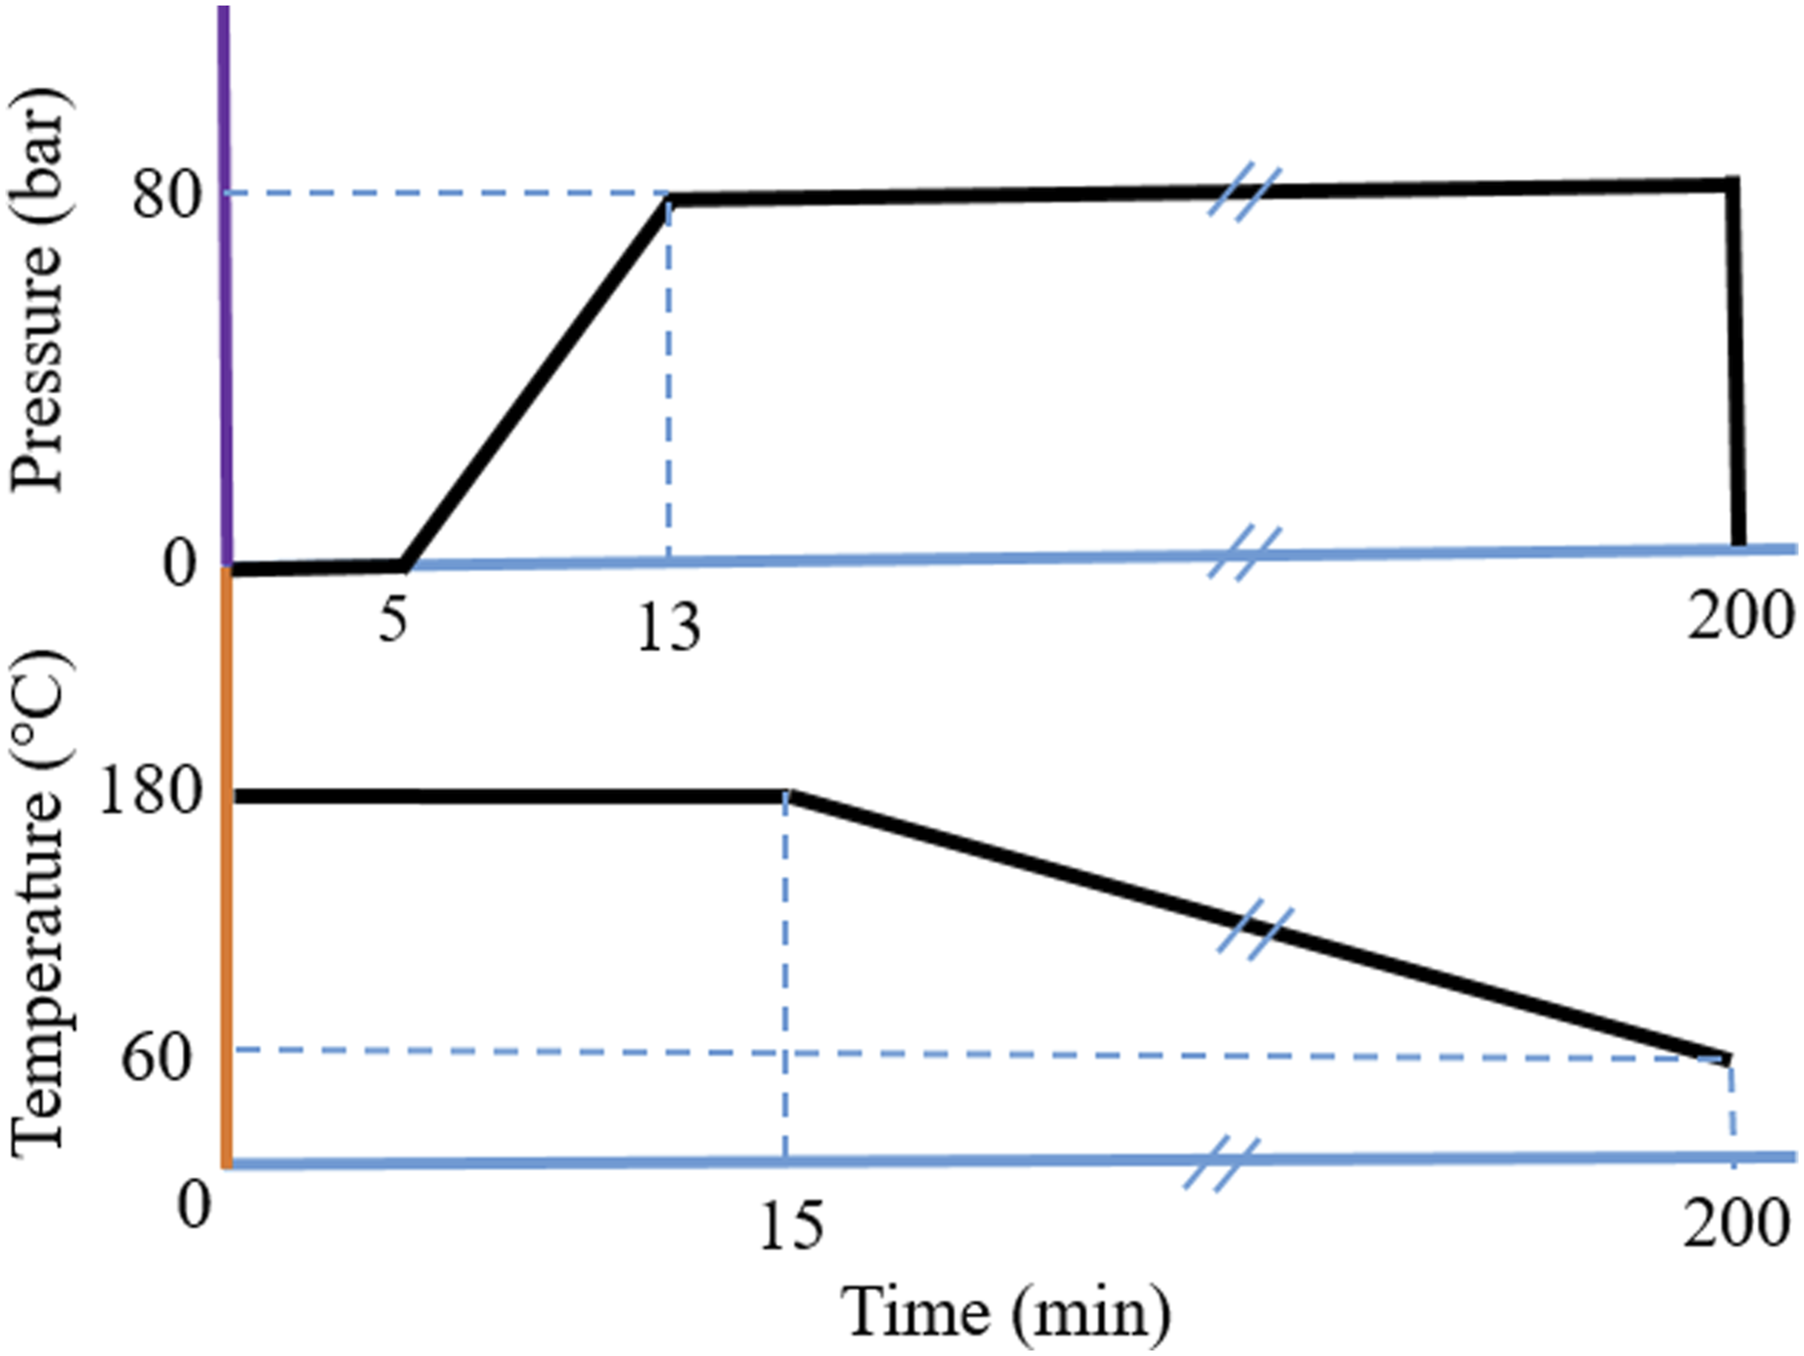
Remolding hot-pressed composites at a higher temperature
In order to remold nanofibrous composites at different temperatures, samples of hot-pressed nanofibrous composite films were placed between two metal plates separated by two Teflon sheets, and this set with a weight of 2.5 kg on it, was placed inside an oven. In order to accurately adjust the temperature applied to the sample, a digital thermometer sensor was placed between the metal plates, and the oven temperature was adjusted according to the temperature indicated by this sensor. After reaching the desired temperature, the sample was kept in the oven for 15 more minutes. Then, by leaving the oven door slightly open, the oven temperature gradually dropped to 60°C. In this way, the composite samples were heat-treated one more time (after the initial hot press).
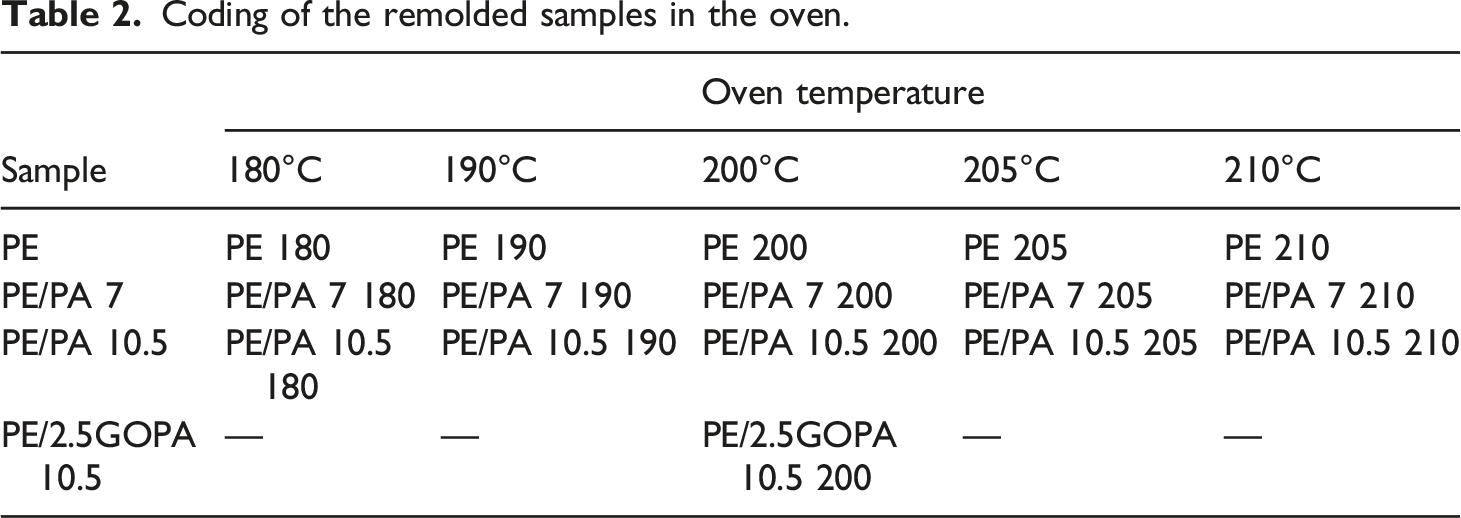
One purpose of this study is to investigate whether a partial surface melting of fibers can impact the properties of composites. The key issue here is to increase the molding temperature without significant relaxation of the polymer chains in the bulk of the fibers or melt the surface of the fibers too much. Therefore, we increased the molding temperature from 180°C to higher temperatures up to around the starting melting point of the nanofiber. Therefore, 180°C, 190°C, 200°C, 205°C, and 210°C (±2.5) were chosen as set points for this research. Figure 2 shows the profile of the molding temperature with time each sample was kept in the heating oven. Table 2 elaborates how the samples were codded accordingly. The profile of the remolding temperature over time. Coding of the remolded samples in the oven.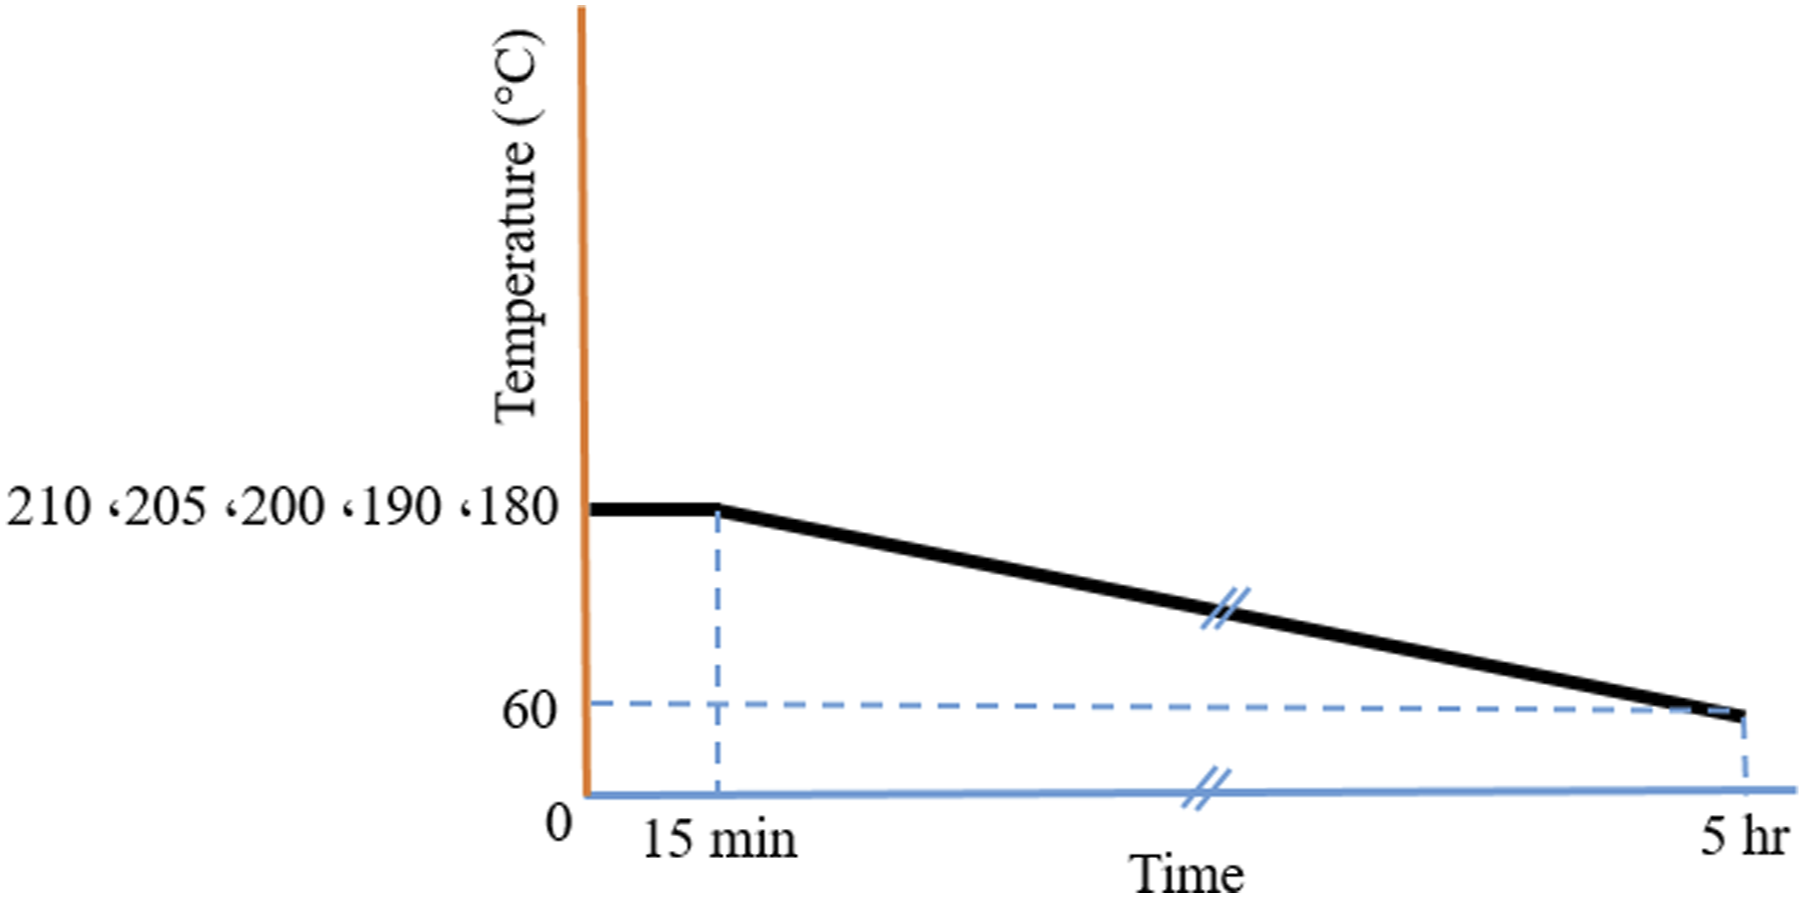
In the next step, in order to investigate the effect of thermal annealing on the properties of nanofibrous composites, the hot-pressed samples were first remolded at 200°C in the oven and then slowly cooled down to 100°C. Then, the temperature was kept constant at 100°C (±2.5), and the samples were subjected to thermal annealing at this temperature for 10 h. The selected temperature for thermal annealing of the samples was selected based on the crystallization temperature of the pure PE-g-MA matrix (range 95°C–110°C). The reason for choosing a low temperature (i.e. 100°C) is to prevent the adverse effects of thermal annealing, which is more likely to occur at higher temperatures. Finally, the oven temperature was slowly cooled to 60°C. Annealed samples include PE 200, PE/PA 7 200, PE/PA 10.5 200, PE/2.5GOPA 10.5 200. Annealed samples were labeled with the letter A at the beginning; For example, A PE 200. The time-temperature profile during thermal annealing is shown in Figure 3. The time-temperature profile for thermal annealing.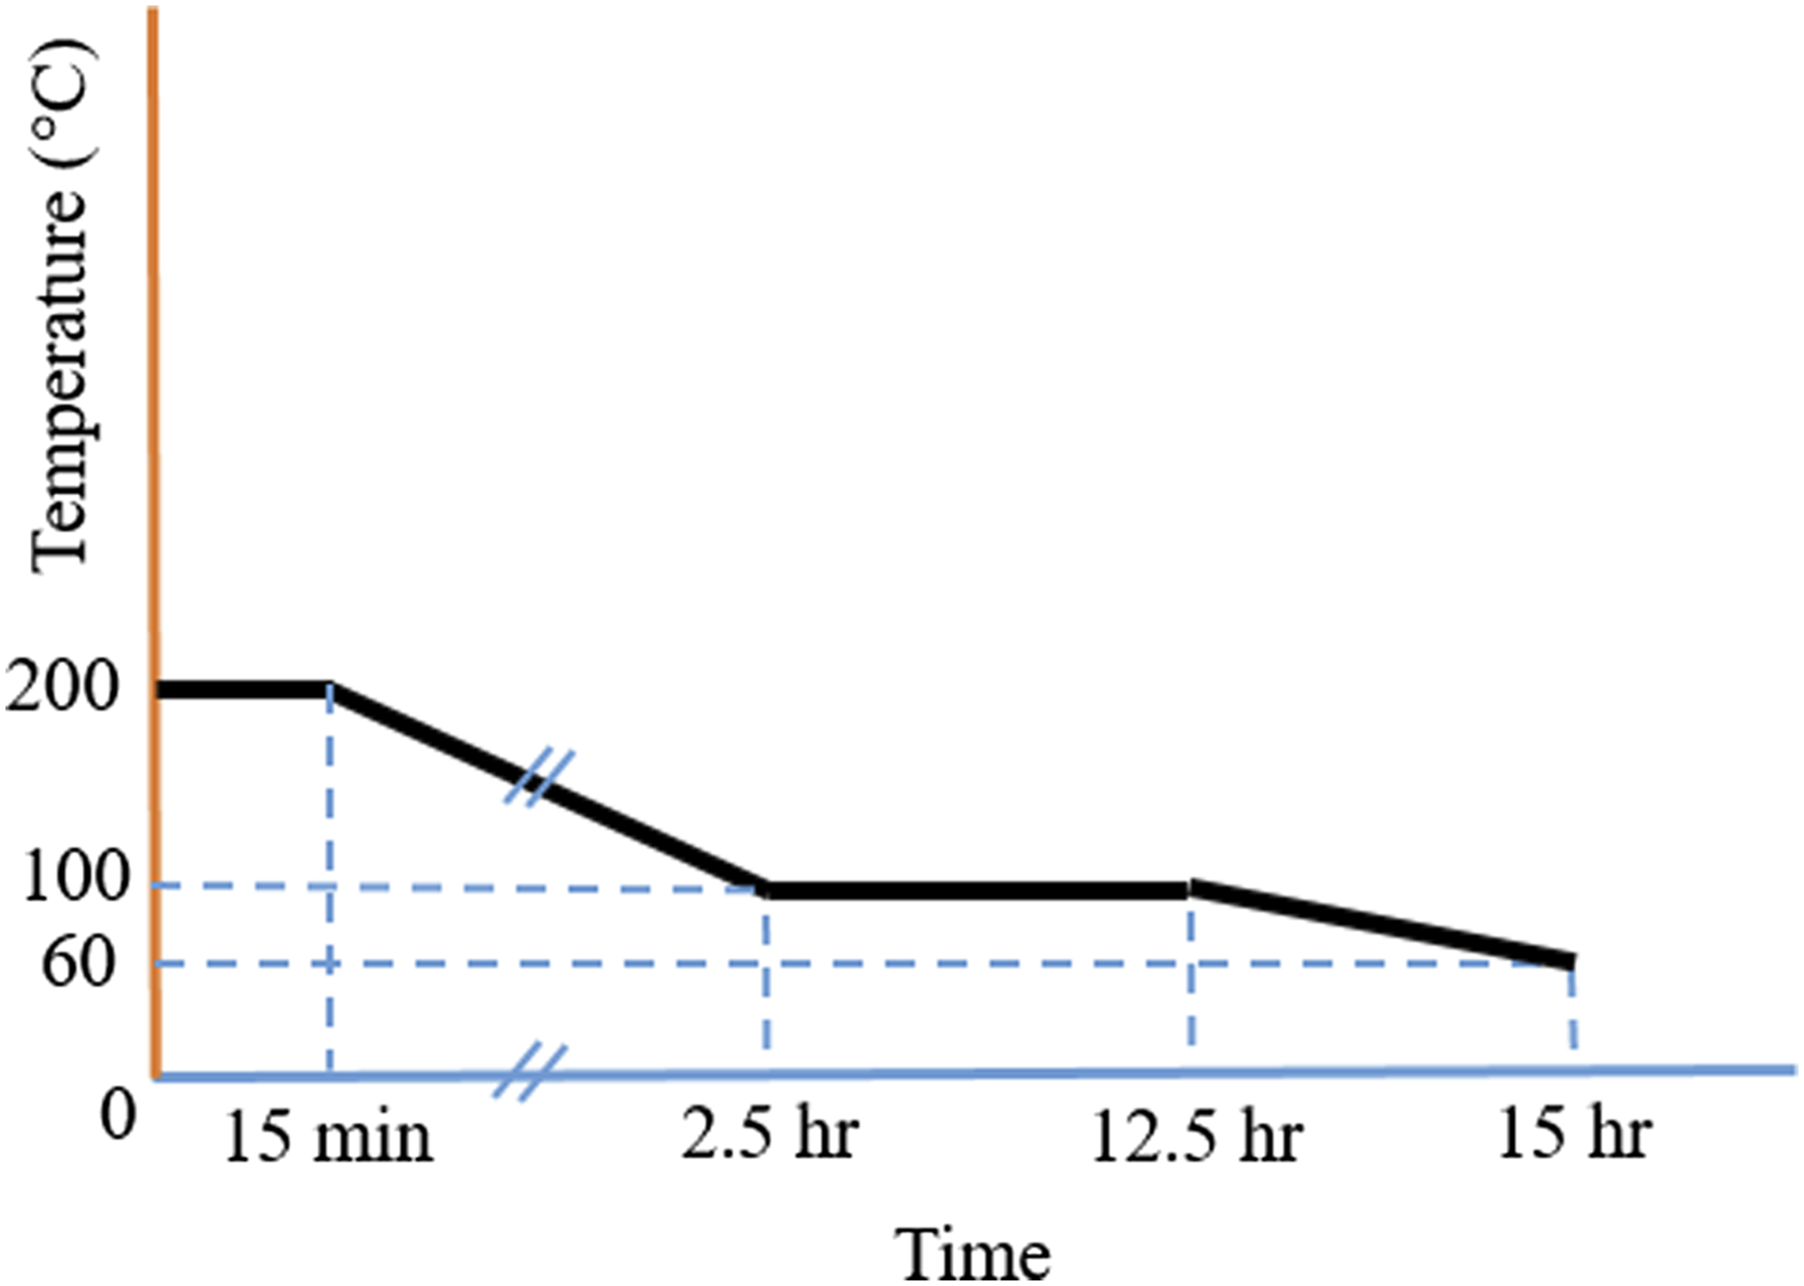
Characterization
Field emission scanning electron microscopy [FESEM, NOVA NanoSEM 450, America] was applied to study the morphology and microstructure of cryo-fractured nanofibrous composites.
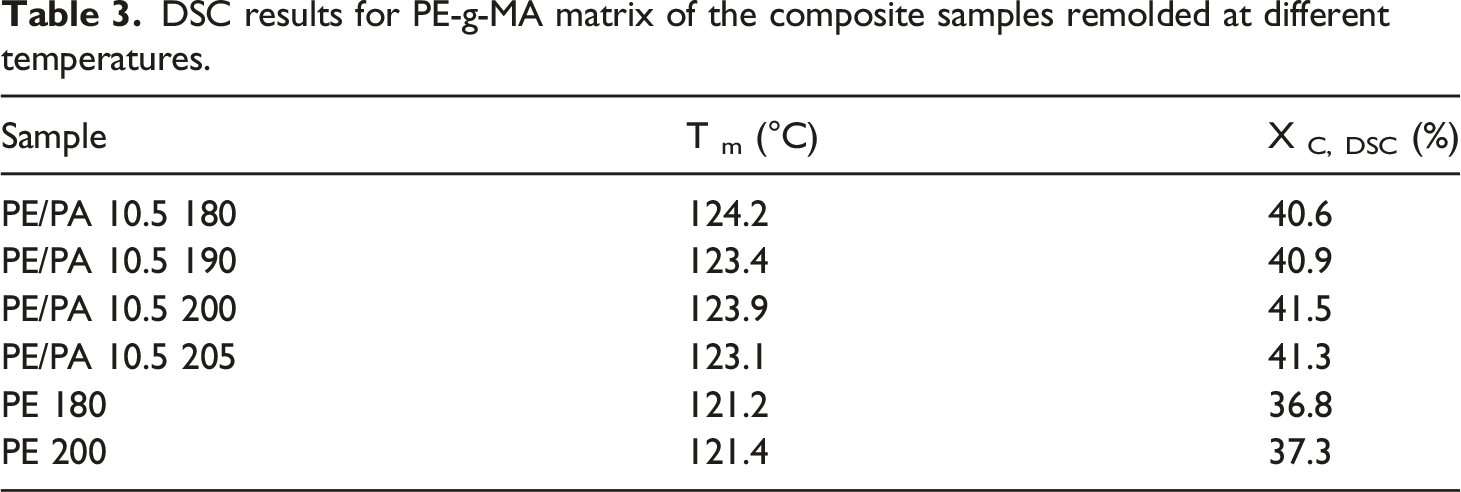
To specify the melting and crystallization behavior of nanofibrous composites, DSC analysis [Mettler-Toledo, Switzerland] was done at temperatures from room temperature up to 160°C, in the presence of nitrogen gas. The degree of crystallization (X c, DSC) was obtained from (ΔH m /ΔH control )/w ratio, that ΔH m is the melting enthalpy, ΔH control is the theoretical melting enthalpy of a fully crystalline polymer, that is 293 J g−1 for PE, 33 and w is the weight fraction of the filler.
To specify the crystallization behavior of composites, wide angle X-ray diffraction analysis [WAXD, D8-Advance, Bruker AXS, America] was also done. The crystallographic parameters are calculated as follows; Inter-plane distance of lattice (d) in Å was calculated using Bragg’s equation; nλ = 2d sinθ, where λ is the wavelength of incident X-ray [1.54 Å for Cu] and n is its number, θ is diffraction angle of the incident X-ray. The degree of crystallization (X c, WAXD ) was obtained from A crystal /A whole ratio, that A crystal is the space of the crystalline peaks and A whole is the whole space of the peaks (crystalline + amorphous).
Dynamic mechanical thermal analysis [DMTA, DMA 242c, Nietzsche, Germany] was performed in a tensile mode in the presence of nitrogen gas to specify the storage modulus (E’) and loss modulus (E”) of the composites at a temperature range of −70°C to 100°C, scanning rate of 5°C min−1, a strain amplitude of 0.1% and a frequency of 1 Hz.
A 2-ton Universal Testing Machin, type XWW-20, JinJian Testing Co., China, was used to measure the tensile properties of the nanofibrous composites with a load-cell of 50 N and a cross-head speed of 5 mm/min−1. Rectangular-shaped specimens [40 mm long and 4 mm wide] were cut from about 60 micron-thick composite films. At least three specimens for each sample were tested and their average was reported.
Conventional light microscope [R200, Nikon, Japan] and reflected light microscope [MA200, Nikon, Japan] were used to investigate the morphology of the annealed composites particularly for crystallization and transcrystallization. The nanofibers (around 0.2 microns in diameter) can not be observed by light microscope. Therefore a nanofiber mat of about 40 microns was placed between two thick PE films of about 200 microns and melt compression molded similar to other samples. During this process the mat was squeezed off and its thickness extremely decreased due to its high level of porosity. Therefore what will be seen in the optical microscopy images of the fractured cross sectional area of the composite is not a single nanofiber but a squeezed off nanofiberous mat.
Results and discussion
Effect of remolding temperature on the morphology of composites
Figure 4, shows SEM images of cross-sections of composite films cryo-fractured in liquid nitrogen related to PE/PA 10.5 composites processed in the oven, at temperatures of (a) 180°C, (b) 190°C, (c) 200°C, (d) 205°C and (e) 210°C. According to these images, the composites processed at 180°C, 190°C and 200°C show a similar structure. However, with increasing temperature from 180°C to 190°C, less fiber separation, and fiber protrusion is observed. With further increase of temperature to 200°C, the fiber-matrix resolution difference decreases, and it can be clearly seen that the fibers are wetted by the matrix and the separation and protrusion of the fibers is almost invisible. As a result, increasing the molding temperature from 180°C to 200°C can cause more wettability of the fibers and increase the adhesion of the matrix to the surface of the fibers. SEM images of PE/PA 10.5 composites processed in the oven, at different temperatures.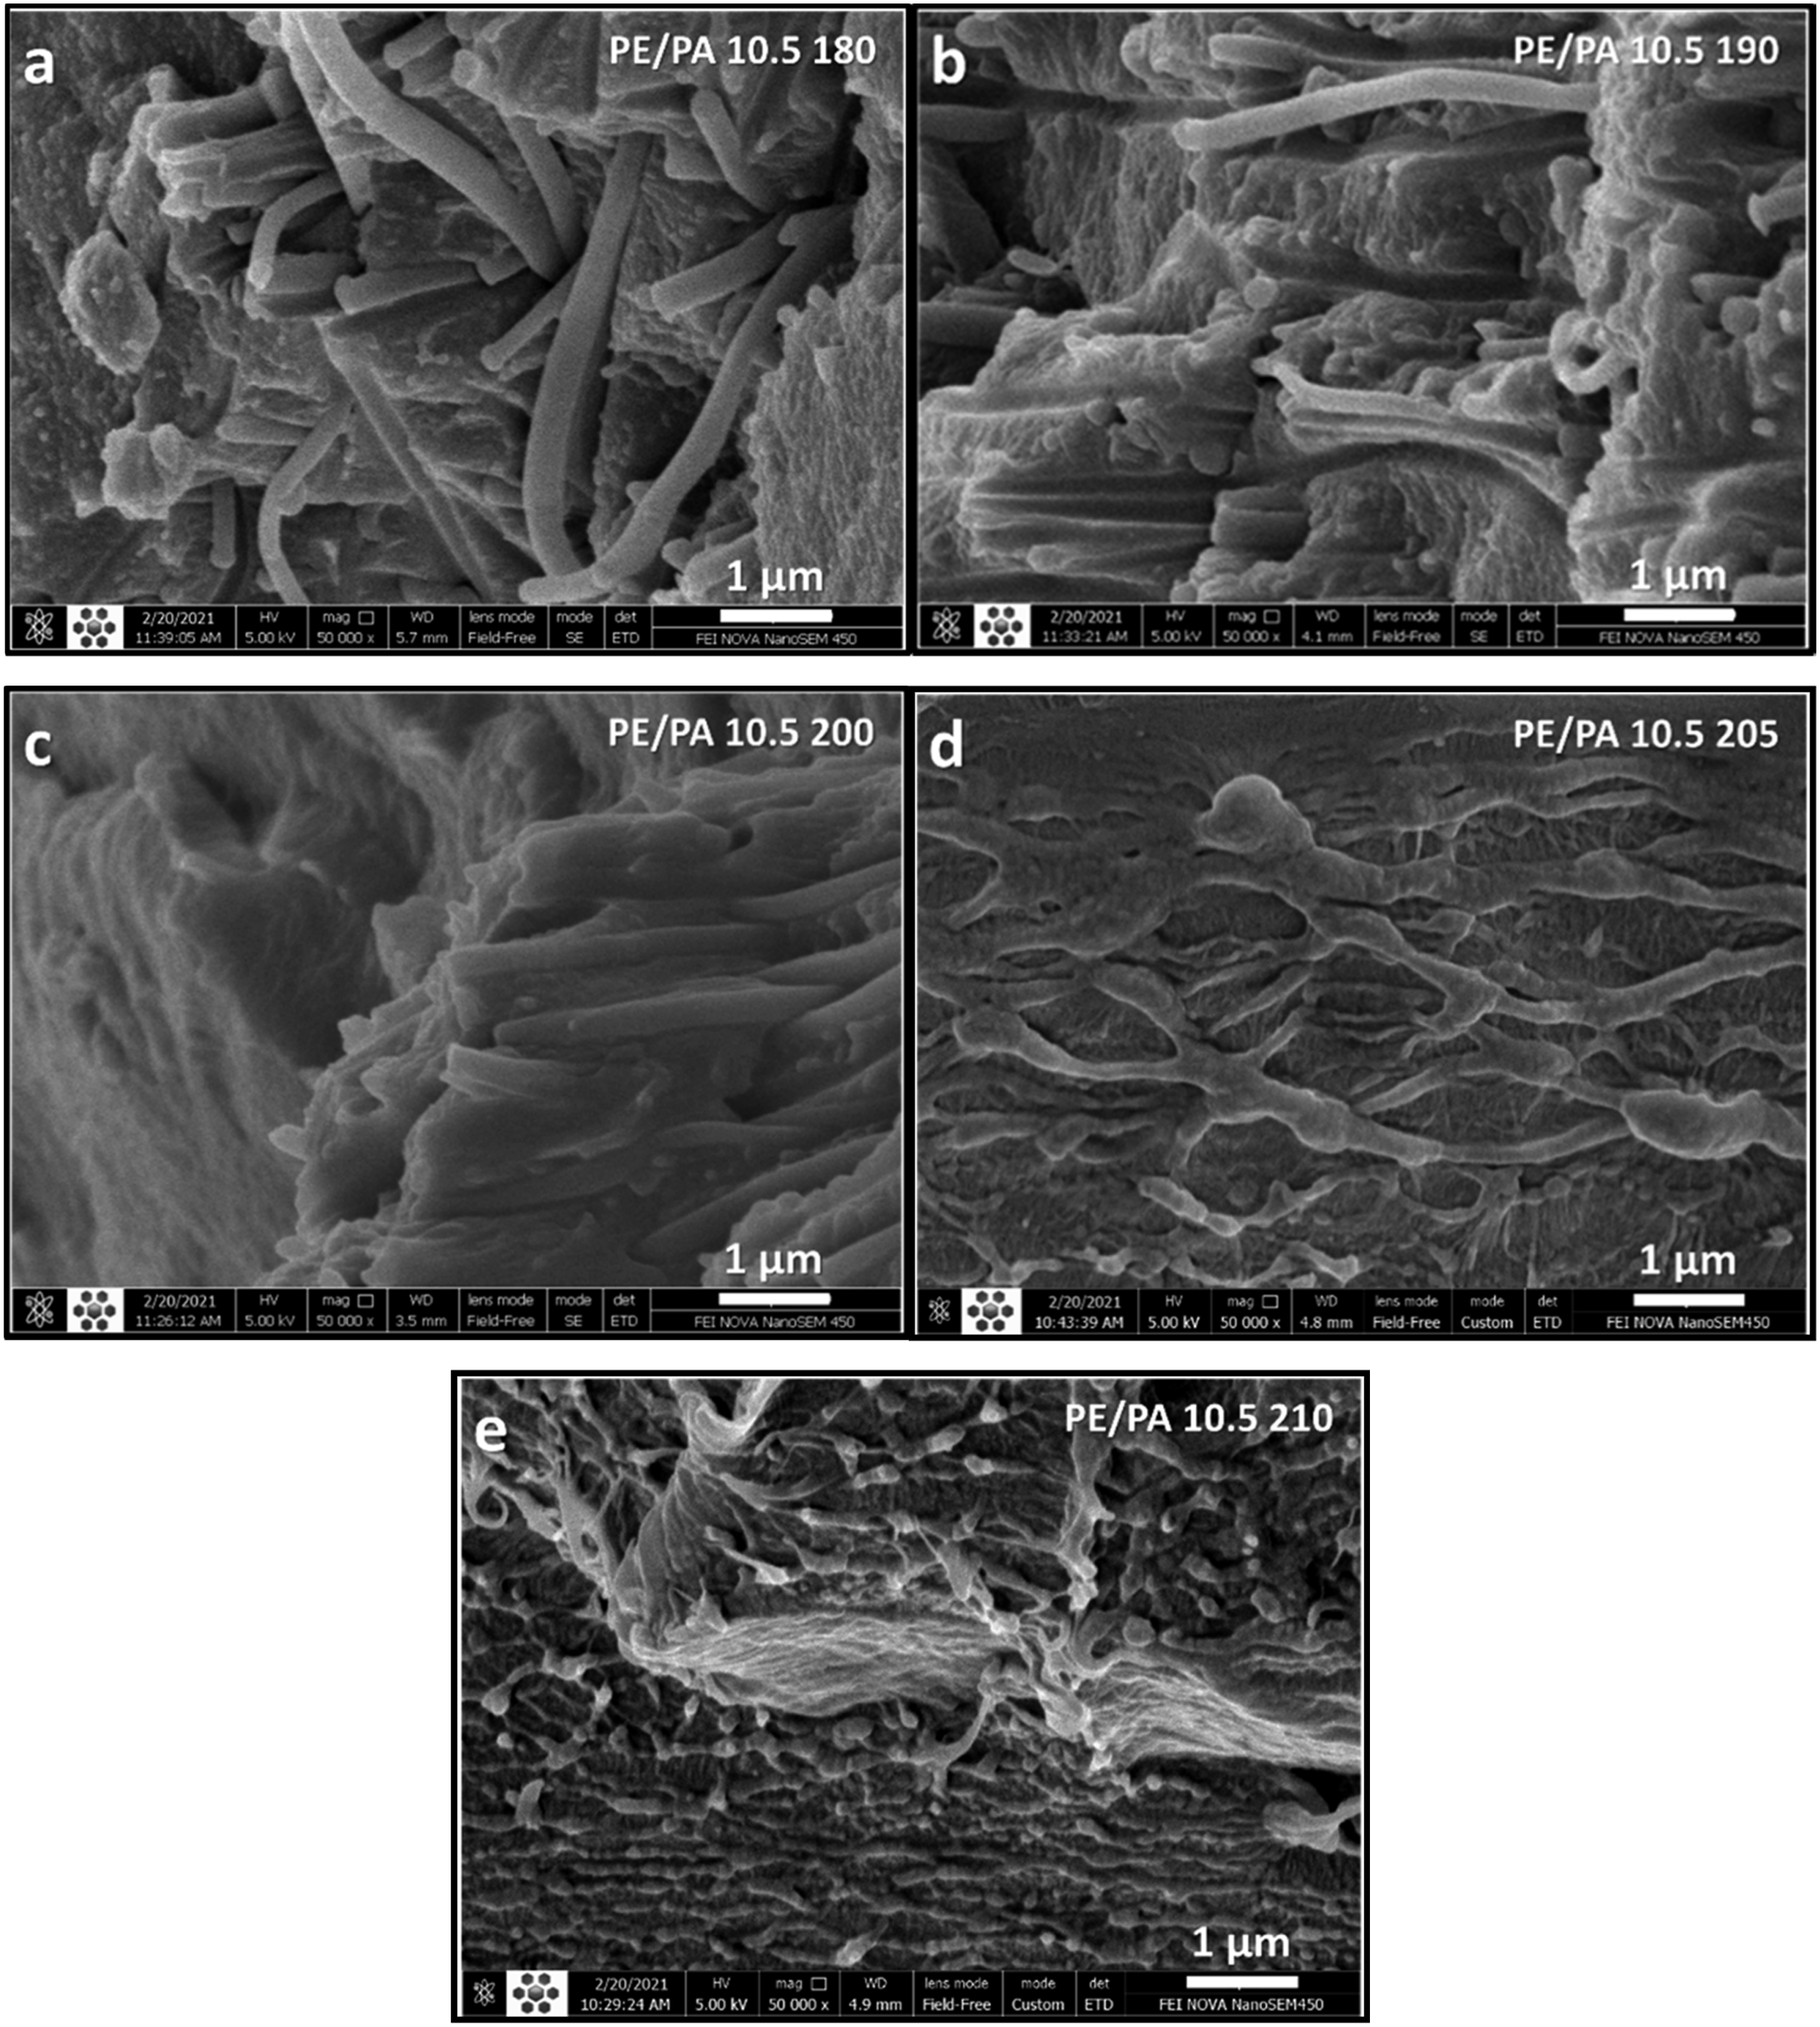
The starting range of melting for PA6 is about 205°C–210°C. Therefore, with increasing temperatures to 205°C and 210°C, the fibers are not clearly visible, indicating superficial or deeper melting of the nanofibers. In fact, at these temperatures, the composite gradually turns into an alloy and the effects of continuous morphology and even droplet-matrix are observed.
The effect of molding temperature on the interfacial interaction of the fiber-matrix is related to physical and chemical effects. Firstly, as the temperature increases, the viscosity of the matrix decreases, and thus the physical penetration of the matrix between the nanofibers and the wettability of the nanofibers by the matrix improve. Secondly, the PA6 fiber and the PE-g-MA matrix both have abundant polar groups. Specifically maleic or carboxylic acid of PE-g-MA and amide groups of PA6 can form hydrogen bonds which provides an interface with good wetting and adhesion. On the contrary, it is shown if instead of PE-g-MA, PE is used as matrix, severe debonding, pull-out and residual pores are observed for PE/PA6 composite due to the lack of effective interactions between nonpolar PE chains and polar PA chains. 27 Therefore, increasing the temperature causes better wettability, and consequently, the number of hydrogen bonds or other intermolecular forces at the interface of the two polymers increases. Partial melting of the outer shell of PA6 fibers can also strengthen the bond at the interface of matrix-fiber.
The wetting and adhesion of PE-g-MA melt preferable and strongly occurs at amporphous areas of PA6 nanofibers rather than crystalline areas [Shi et al; Xia et al]. Therefore when partial melting of PA6 nanofibers occur more chains of PE-g-MA form stronger bonds into the nanofibers.
Effect of remolding temperature on storage modulus and loss modulus
Figure 5 shows the storage modulus (E’) and dissipation modulus (E”) curves of the pure PE-g-MA matrix and PE/PA 10.5 composites processed at 180°C and 200°C. As can be seen, the storage modulus values of the pure matrix samples processed at 200°C are slightly higher than those of the processed samples at 180°C. This difference in E’ values is more noticeable in the case of composite samples processed at two different temperatures. The E’ values of the composite processed at 200°C are significantly higher than the E’ values of the composite processed at 180°C over a wide temperature range. This can be attributed to the more reinforcing effect of PA6 nanofibers in the PE-g-MA matrix at 200°C molding temperature, which occurs due to better wettability and stronger interaction of nanofibers with PE-g-MA chains at this molding temperature. The above explanations also apply to the trend of loss modulus changes in samples. In addition, considering the loss modulus curves, the β-relaxation peak for samples processed at higher temperatures occurred at higher temperatures, indicating stronger intermolecular bonds at higher temperatures. Storage modulus (E’) and dissipation modulus (E”) curves of the pure PE-g-MA matrix and PE/PA 10.5 composites processed at 180°C and 200°C.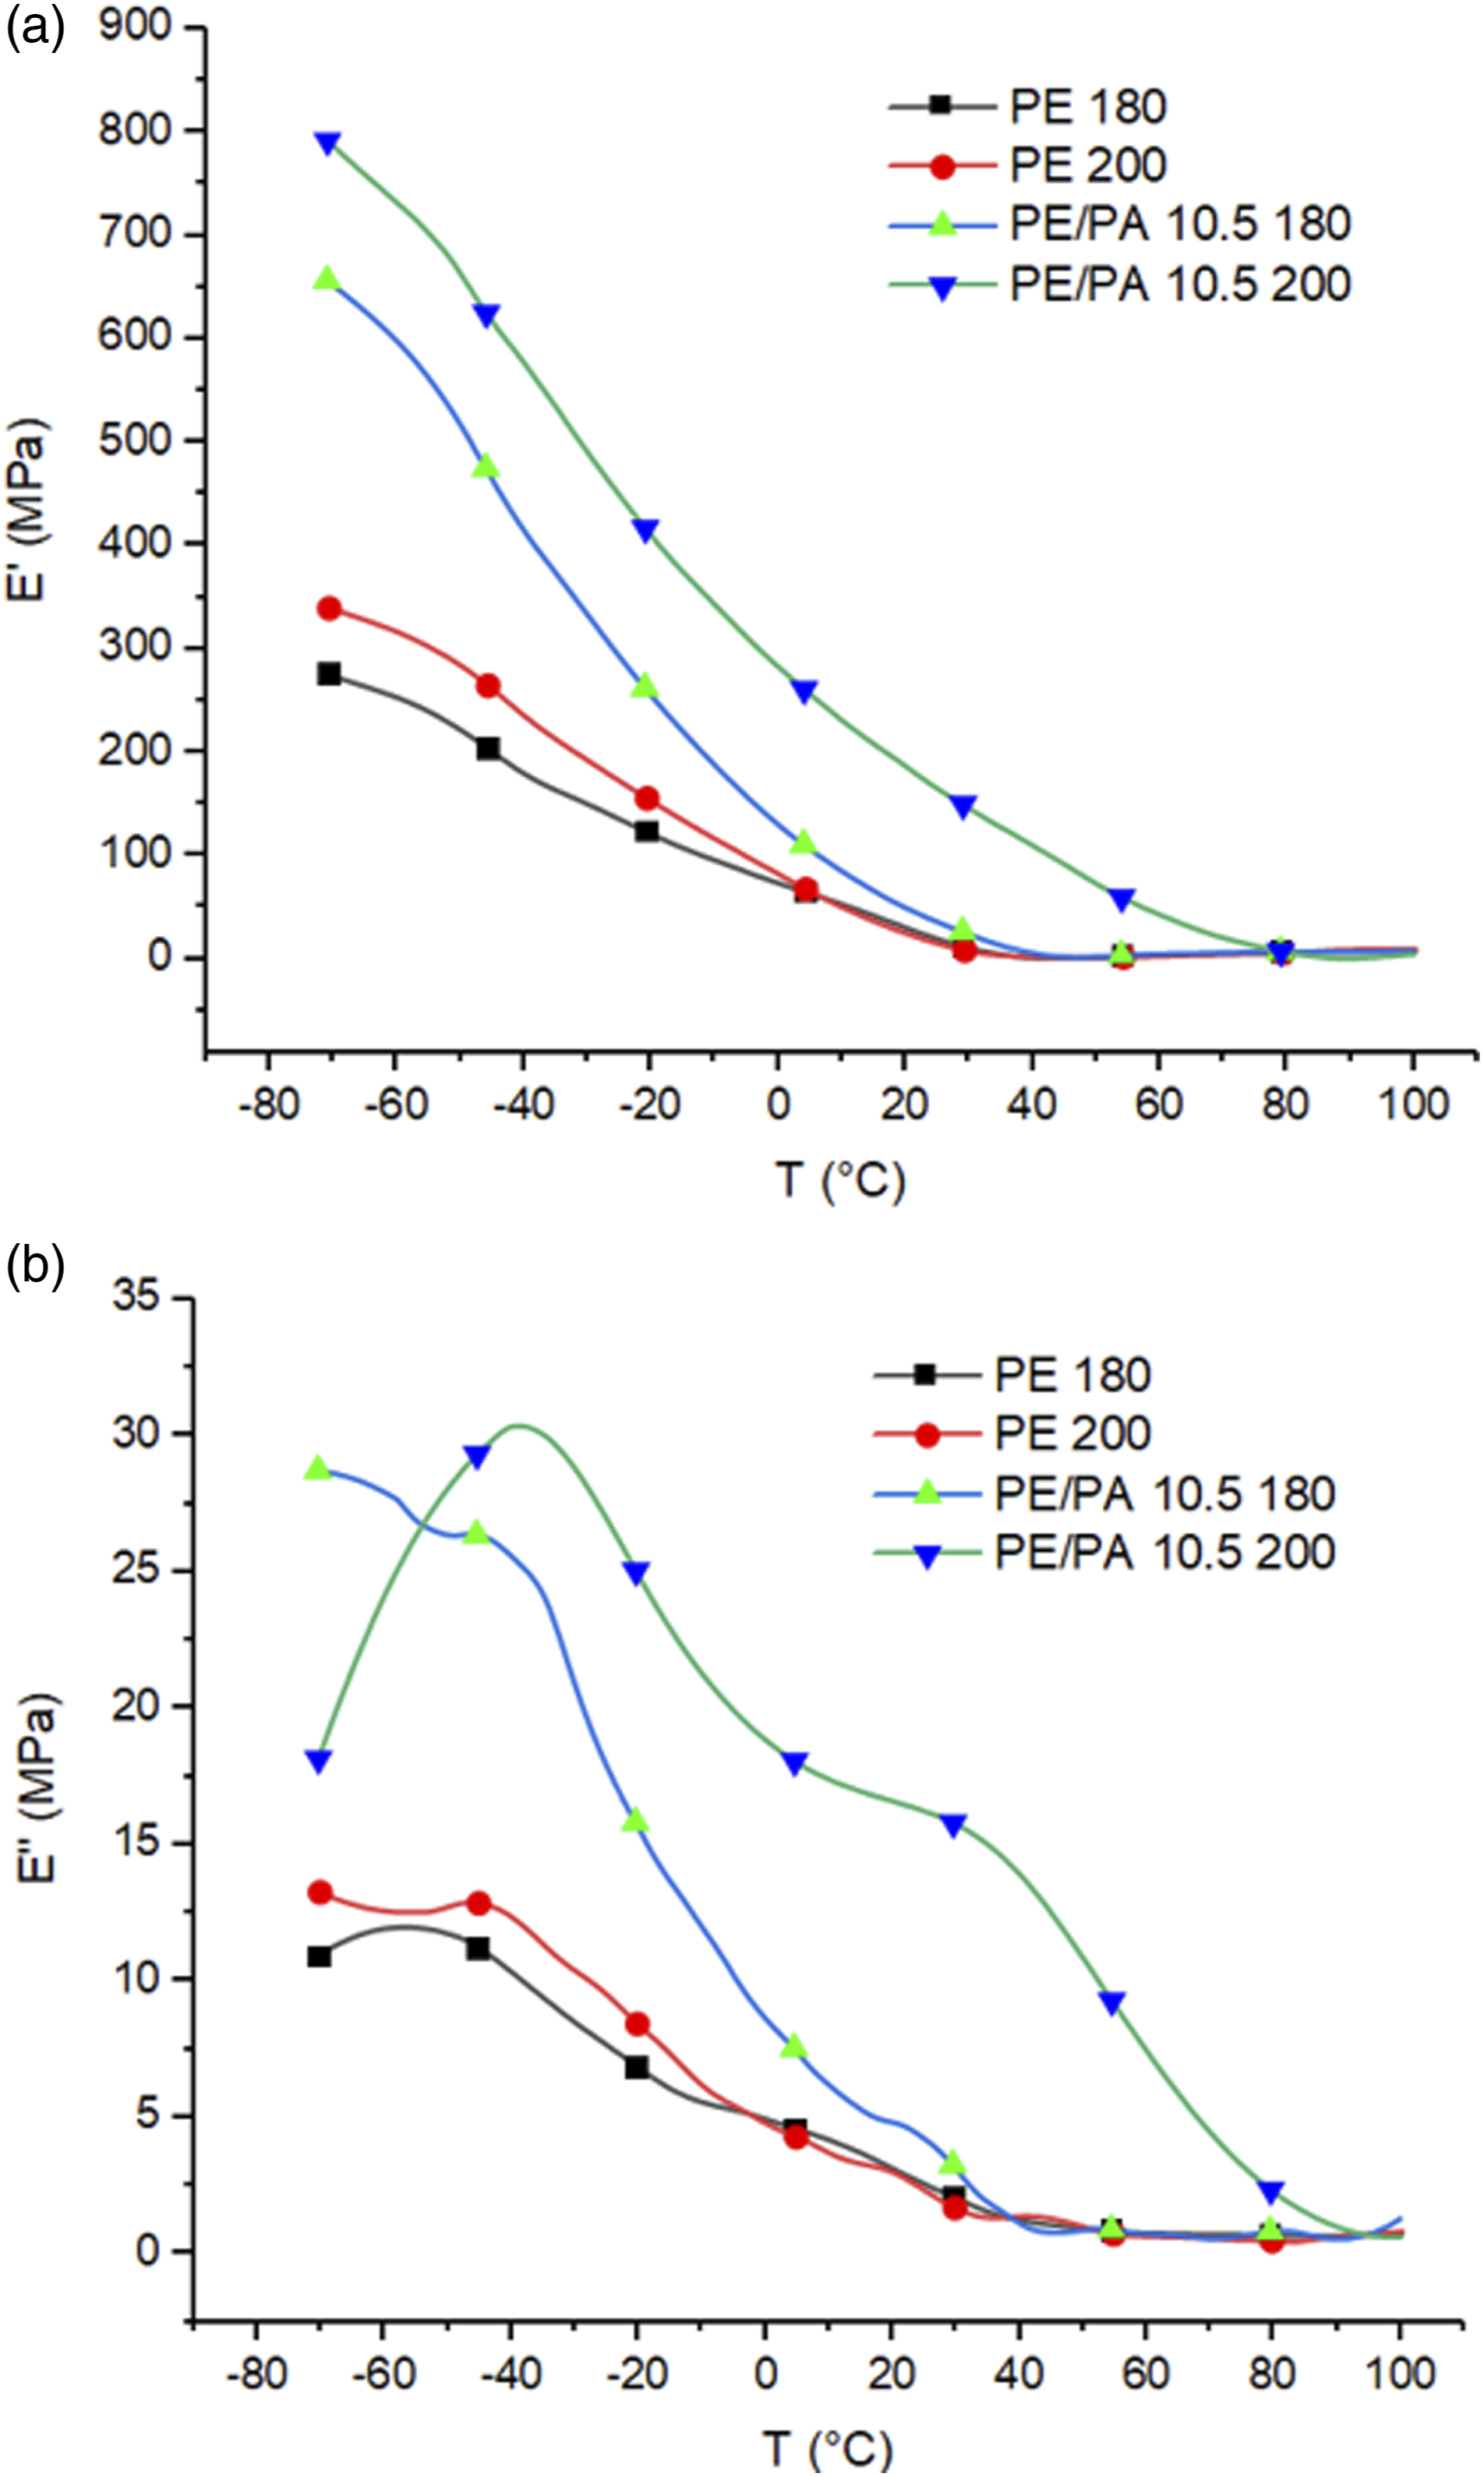
Effect of remolding temperature on melting behavior and crystallization
Figure 6 shows the first DSC heating scan curves for (a) pure PE-g-MA processed at 180°C and 200°C and (b) PE/PA 10.5 composites processed at 180°C, 190°C, 200°C, and 205°C. Table 3 also presents the data obtained from these curves. Based on Table 3, it is observed that in general, the melting temperature of composites is higher than the pure matrix, which is attributed to the movement restrictions created for polymer chains of the matrix by nanofibers and strong hydrogen bond or other intermolecular forces between the matrix and the nanofibers. Also, the degree of crystallization of the samples processed at higher temperatures is slightly higher than the samples processed at lower temperatures. This trend is more noticeable in the case of composite samples which can be attributed to better penetration of the matrix within the nanofibers and the increase of nucleation of the matrix on the surface of the nanofibers. The melting peak is wider towards the lower temperature by applying a higher molding temperature, which can be due to the formation of different crystals (crystal size or crystal type). DSC heating scan curves for (a) pure PE-g-MA processed at 180°C and 200°C and (b) PE/PA 10.5 composites processed at 180°C, 190°C, 200°C, and 205°C. DSC results for PE-g-MA matrix of the composite samples remolded at different temperatures.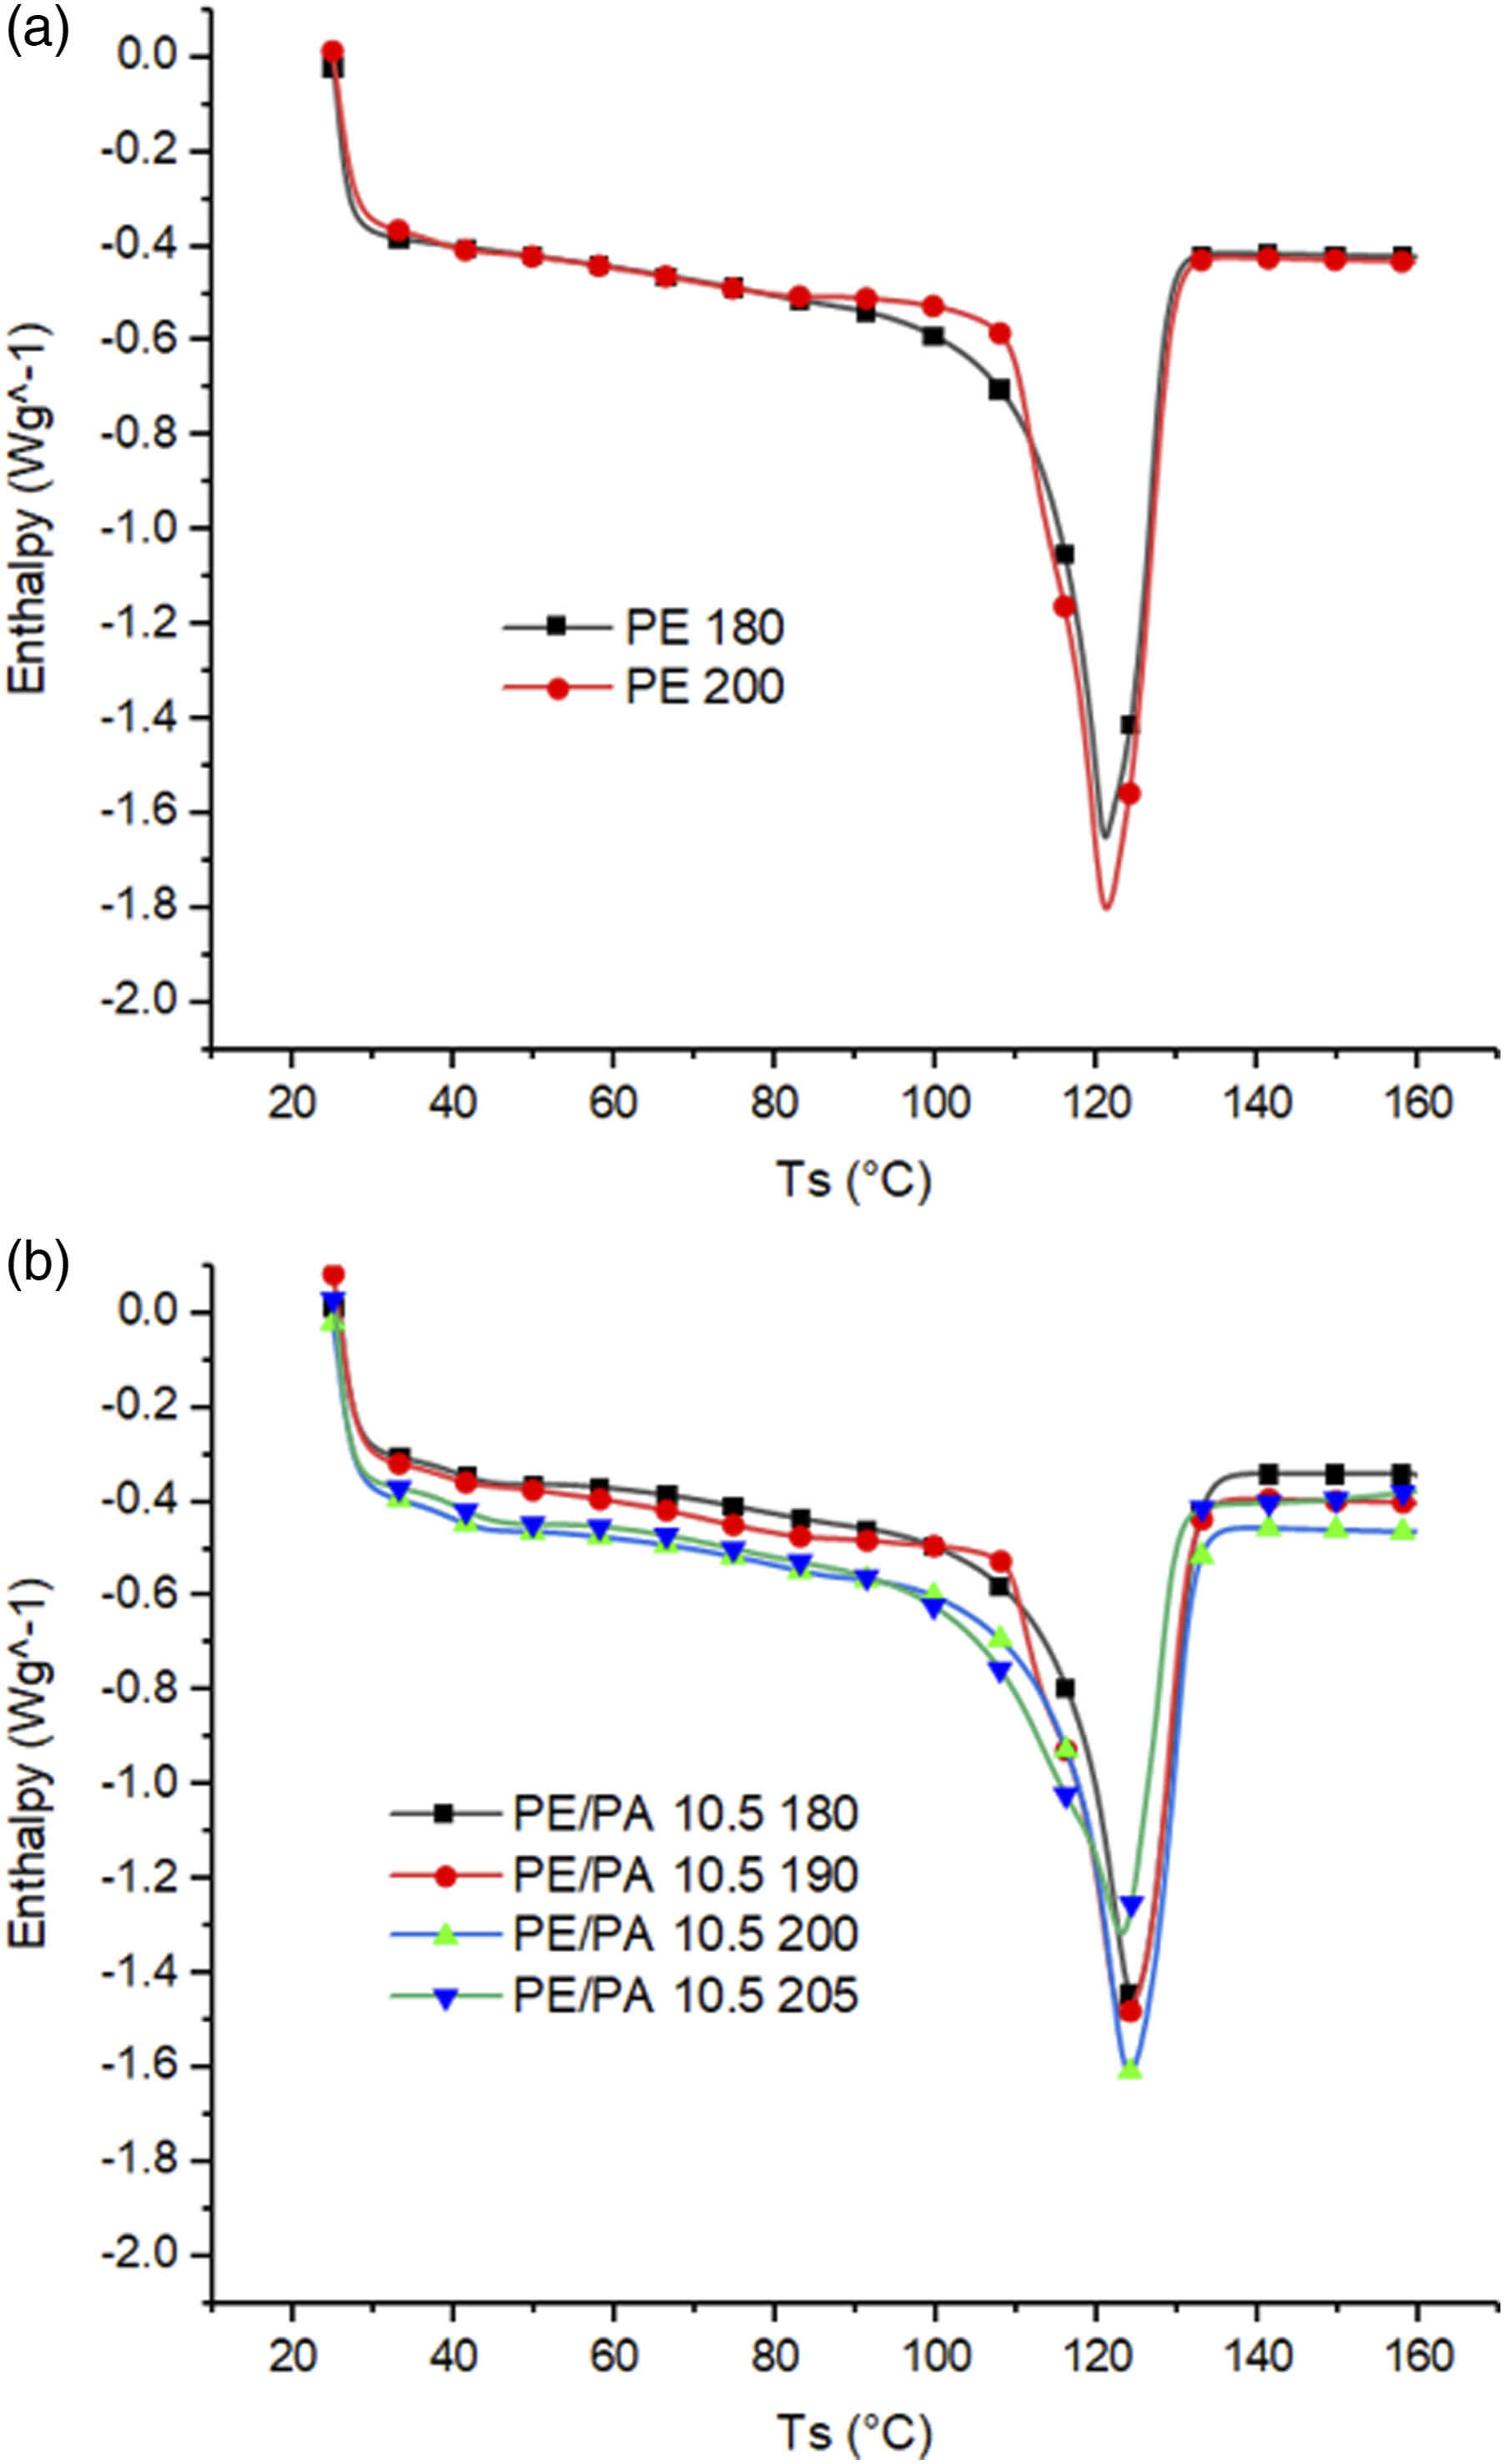
Effect of remolding temperature on the tensile properties
In Figure 7, the tensile stress-strain curves of the pure PE-g-MA matrix and the PE/PA 7 and PE/PA 10.5 composites processed at four different temperatures are shown in a, b and c, respectively. The yield strength and elastic modulus values obtained from these curves are also presented in Table 4. The failure mode was ductile without necking for all composite samples. Tensile stress-strain curves of the pure PE-g-MA matrix and the PE/PA 7 and PE/PA 10.5 composites remolded at four different temperatures. The yield strength [σy, MPa] and elastic modulus [MPa] of samples remolded at varying higher temperatures.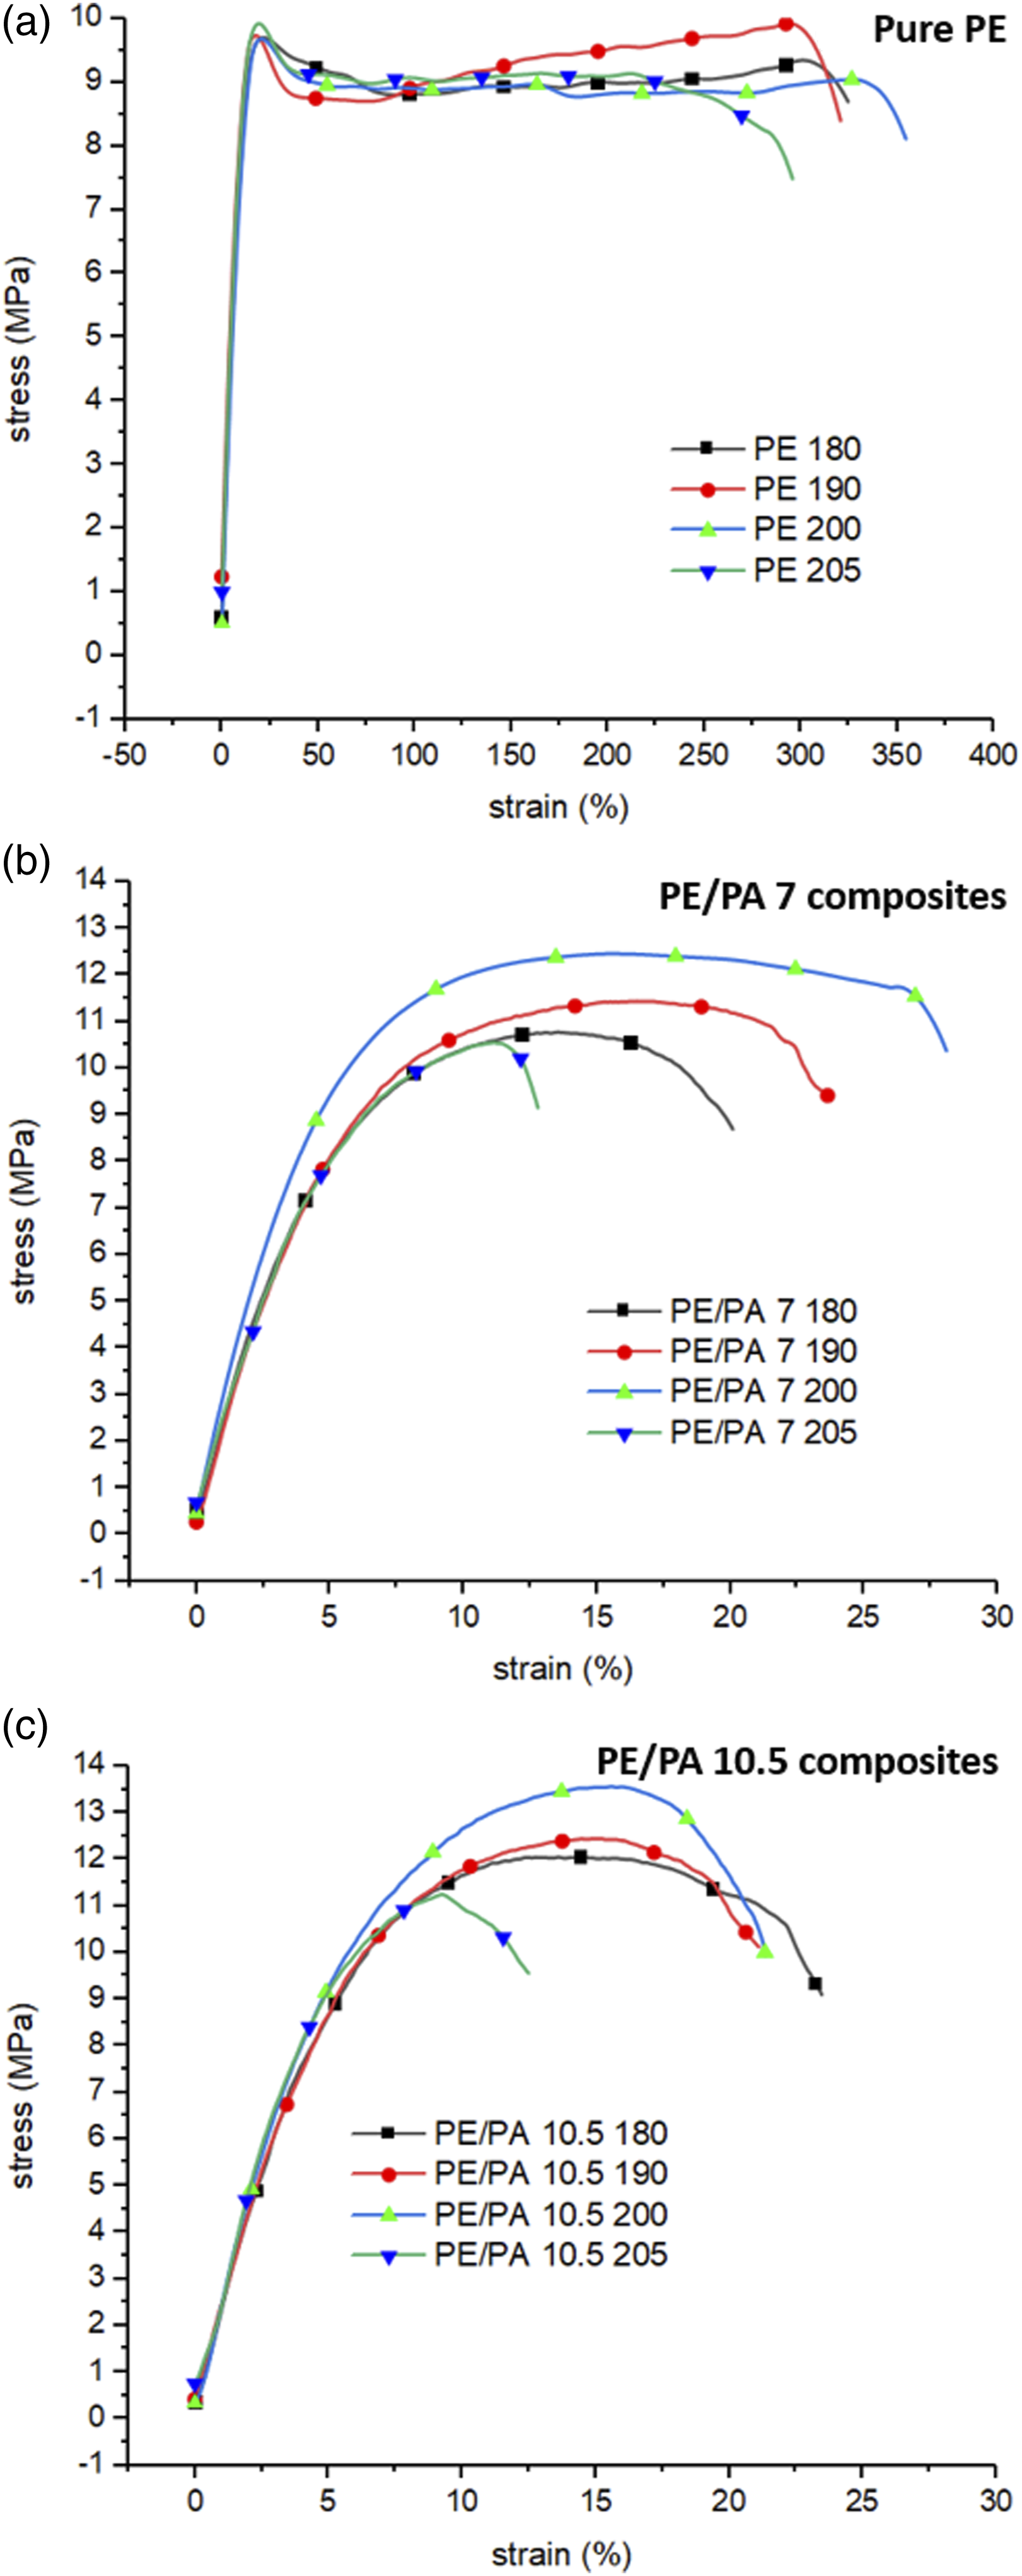
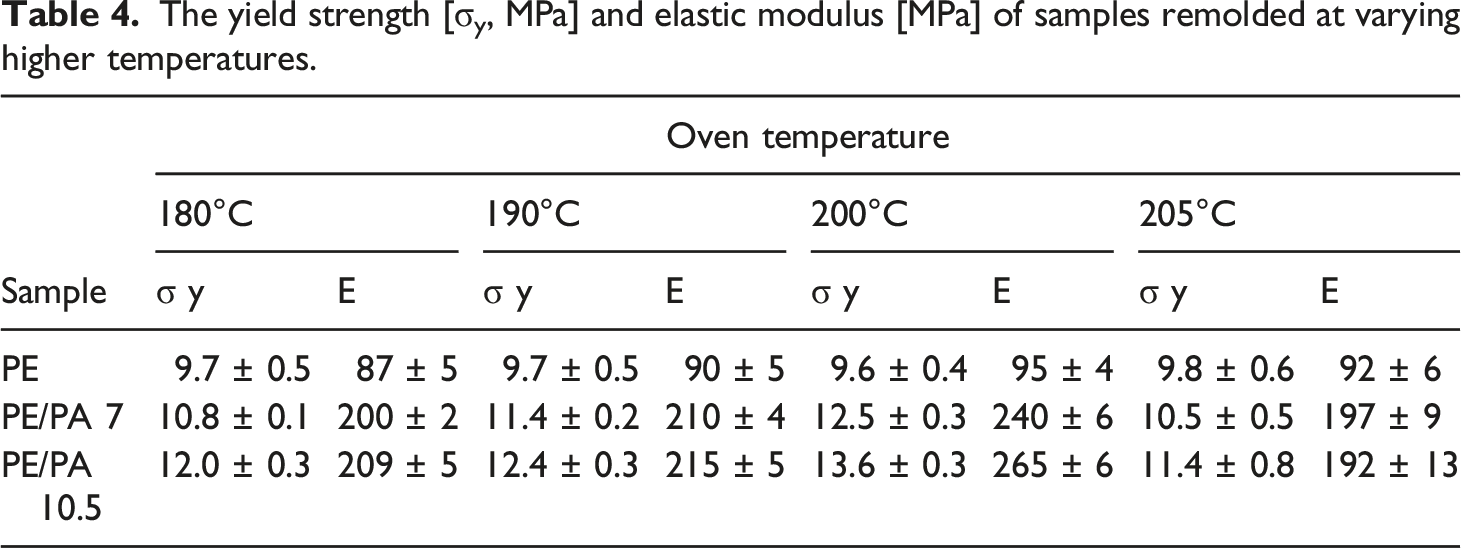
According to the data obtained from the curves, it is observed that with increasing the molding temperature from 180°C to 200°C, the pure PE-g-MA modulus increases (by 9%), but its yield strength does not show a significant change, with the change in molding temperature.
In the case of composites (PE/PA 7 and PE/PA 10.5), as the molding temperature increases from 180°C to 200°C, both yield strength and modulus increase. For PE/PA 7 composite, the yield strength increased from 10.8 MPa to 12 MPa (11% improvement) and the modulus increased from 200 MPa to 240 MPa (20% improvement), and for PE/PA 10.5 composite, the yield strength increased from 12 MPa to 13.6 MPa (13% improvement), and the modulus increased from 209 MPa to 265 MPa (27% improvement). However, in the work of Dasdemir et al., the tensile modulus of PE composites containing PA microfibers was improved (up to 20%) with increasing the temperature (from 180°C to 200°C) while the tensile strength, strain at break and energy to break values were decreased gradually. They ascribed this to the annealing effect promoted at different temperatures, which lead to composite structure became stiffer and therefore tensile failure shifted from ductile to brittle. 32 In our work, the improvements in tensile properties can be attributed to the better wettability of nanofibers with matrix and the stronger fiber-matrix adhesion at samples processed at higher temperatures. However, other factors such as degree of crystallinity, crystallization on the surface of the fibers, etc. can also be effective.
At the molding temperature of 205°C, a drop in the tensile properties of the composites is observed. The diminution in tensile properties of the processed samples at 205°C is most likely related to the melting of PA6 reinforcing nanofibers by processing at a temperature close to its melting temperature range (205°C–210°C). However, at this molding temperature, the yield strength and modulus are still higher than the yield strength and modulus of the pure PE-g-MA matrix, which is due to the presence of a polyamide phase with better mechanical properties in maleated polyethylene. Also, according to some reports, when the fibers are subjected to processing at temperatures close to their melting temperature, their modulus and strength decrease. 34 In general, strength and modulus of fibers are much higher than their bulk polymers due to high orientation of polymer chains parallel to the fiber axis. Reduction of modulus and strength arising from changes in fiber morphology (molecular arrangement and crystallization) occurs due to relaxation of polymer chains arising from heating and partial melting of the fiber. Therefore, it is necessary to avoid heat-induced degradation in the mechanical properties of the fibers as much as possible during the composite fabrication process.
According to the data Table 4, the highest tensile properties (elastic modulus, yield strength, and elongation at break) is observed at the molding temperature of 200°C. Therefore, at this temperature, the wettability of the fibers and the adhesion of the fiber-matrix are better and the thermal damage to the fibers is less. Optimal tensile properties at 200°C can also be justified based on the statements of Mead and Porter. 34 Their statements suggest that the occurrence of optimal mechanical properties at a given molding temperature could be due to the effect of two simultaneous competitive processes. One is the process of annealing fibers near their melting point, which is expected to provide relaxation and reduced properties; And another, is the induction of crystallization in the fiber-matrix interface at higher molding temperatures, which can lead to increased fiber-matrix adhesion.
Adhesion and wetting of polymer matrix on polymer fiber occurs more efficiently in amorphous areas rather than crystalline areas of the nanofibers.35,36 Hydrogen bonding and strong interactions can occur between PE-g-MA chains and PA6 chains but due to the considerable improvement in the adhesion by increasing remolding temperature it is revealed that PE-g-MA chains in melt state cannot make interactions and adhesion with the crystalline part of the nanofibers as good as what they make with the amorphous part. When remolding temperature increases and partial melting of PA6 nanofibers occurs more PE-g-MA chains can make strong interactions with PA6 melted/amorphous chains. The other factor effecting wetting is the melt viscosity of the matrix. As the temperature increases melt viscosity of the matrix reduces and therefore penetration of PE-g-MA chains into the pores is facilitated.
Effect of thermal annealing on melting behavior and crystallization
Figure 8(a) and (b) show the DSC heating scan curves for the pure PE-g-MA matrix and the PE/PA 10.5 and PE/GOPA 10.5 composites processed at 200°C before and after the annealing process, and Table 5 also presents the data taken from these curves. DSC heating scan curves (a) pure PE-g-MA matrix and (b) PE/PA 10.5 and PE/GOPA 10.5 composites processed at 200°C before and after annealing. Data taken from DSC and XRD curves of samples, before and after annealing.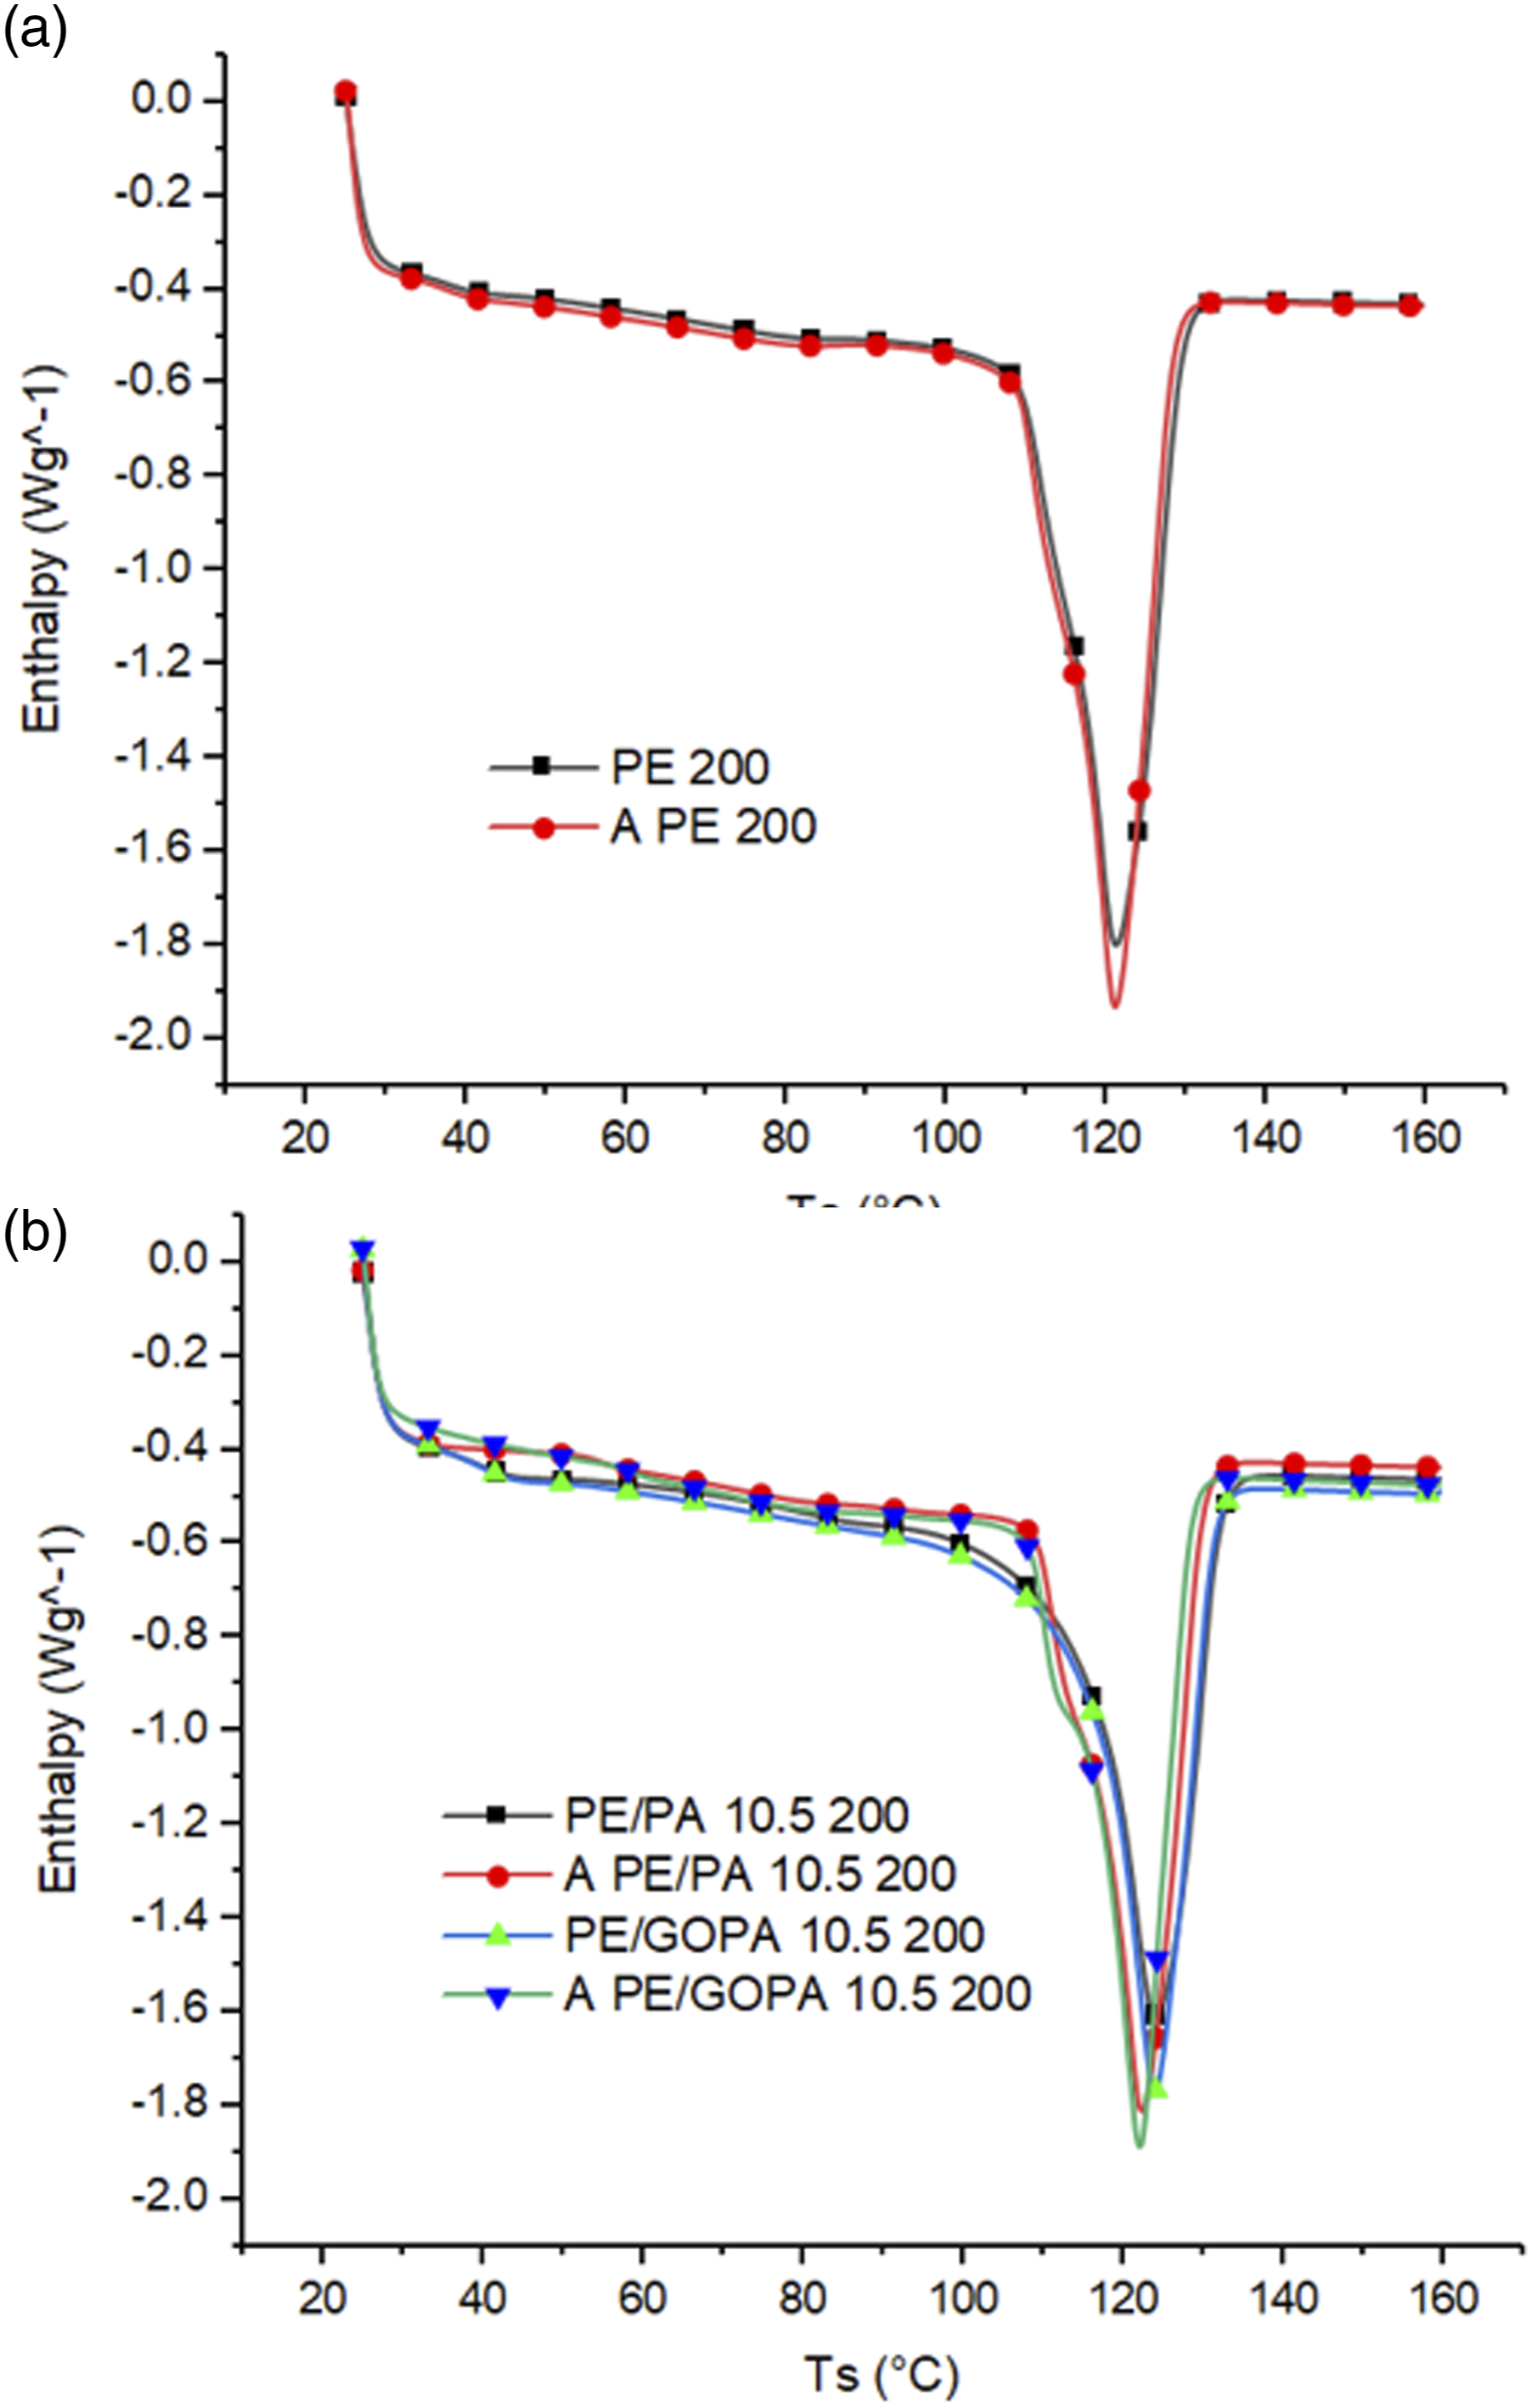
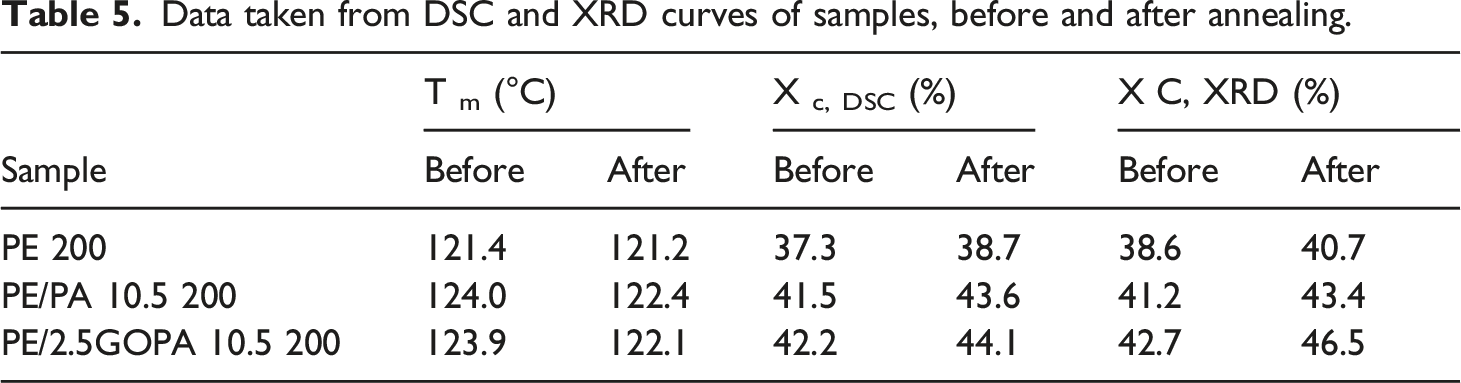
The degree of crystallization of the pure matrix increased slightly after the annealing process. However, the degree of crystallization of the composites showed a further increase after annealing. Given this result, the hypothesis of using nanofiber surfaces as nucleation sites of the polymer matrix is strengthened.
The lower melting temperatures of samples after annealing can be due to increased molecular network defects after annealing. According to a report, although the size of crystals can be significantly increased by annealing, this increase occurs at the expense of increasing the defects in the molecular network in the hexagonal phase. 37 The parameter that determines the quality of the molecular network is the density of semi-permanent and non-covalent connection points such as hydrogen bonds. Physical entanglements in amorphous and crystalline regions lead to an increase in the amount of these bonds, which varies depending on the grade of the polymer and the morphology of the polymer material. The probability of decreasing the density of these bonds increases with increasing lamellar size. 38
In the case of annealed composite specimens, a small shoulder is observed on the left of the main melting peak. Since crystal type conversion does not occur in PEs, the presence of the shoulder for annealed composites can be related to differences in the thickness distribution of the crystals. Isothermal crystallization leads to successive processes of partial melting of the crystal, recrystallization, and completion of the crystal. This process can lead to the formation of crystals with different thicknesses and therefore the presence of shoulder in the thermal scan curves of annealed samples. 39 The main melting peak at higher temperatures is attributed to the melting of more complete PE crystals (with greater thickness) and the shoulder peak at lower temperatures is attributed to the melting of more incomplete crystals (less thickness). According to the studies of Shan et al., 40 if thermal annealing occurs on samples with low initial crystallinity (i.e. quenched samples), multiple melting peaks (due to lamellar thickness distribution) occur, and if semi-crystalline samples are subjected to thermal annealing (as in the present study), the behavior of multiple melting peaks does not occur and only a single melting peak is observed with or without a shoulder.
Investigation of crystallization of annealed nanofibrous composites by XRD
Figure 9 shows the XRD curves for the pure PE-g-MA matrix and the PE/PA 10.5 and PE/GOPA 10.5 composites processed at 200°C before and after the annealing process and in the 20°–25° angle range, and Table 5 shows the degree of crystallization of the whole system (matrix + nanofibers) obtained from these curves. PE provided two diffraction peaks at 2θ = 23° and 23.5°, related to the crystal plates (110) and (200) of the PE orthorhombic phase, and the plate spacing (d-spacing) 44.1 and Å 3.7, respectively.
41
The above parameters were obtained using X’Pert software. XRD curves for pure PE-g-MA matrix and PE/PA 10.5 and PE/GOPA 10.5 composites processed at 200°C before and after annealing.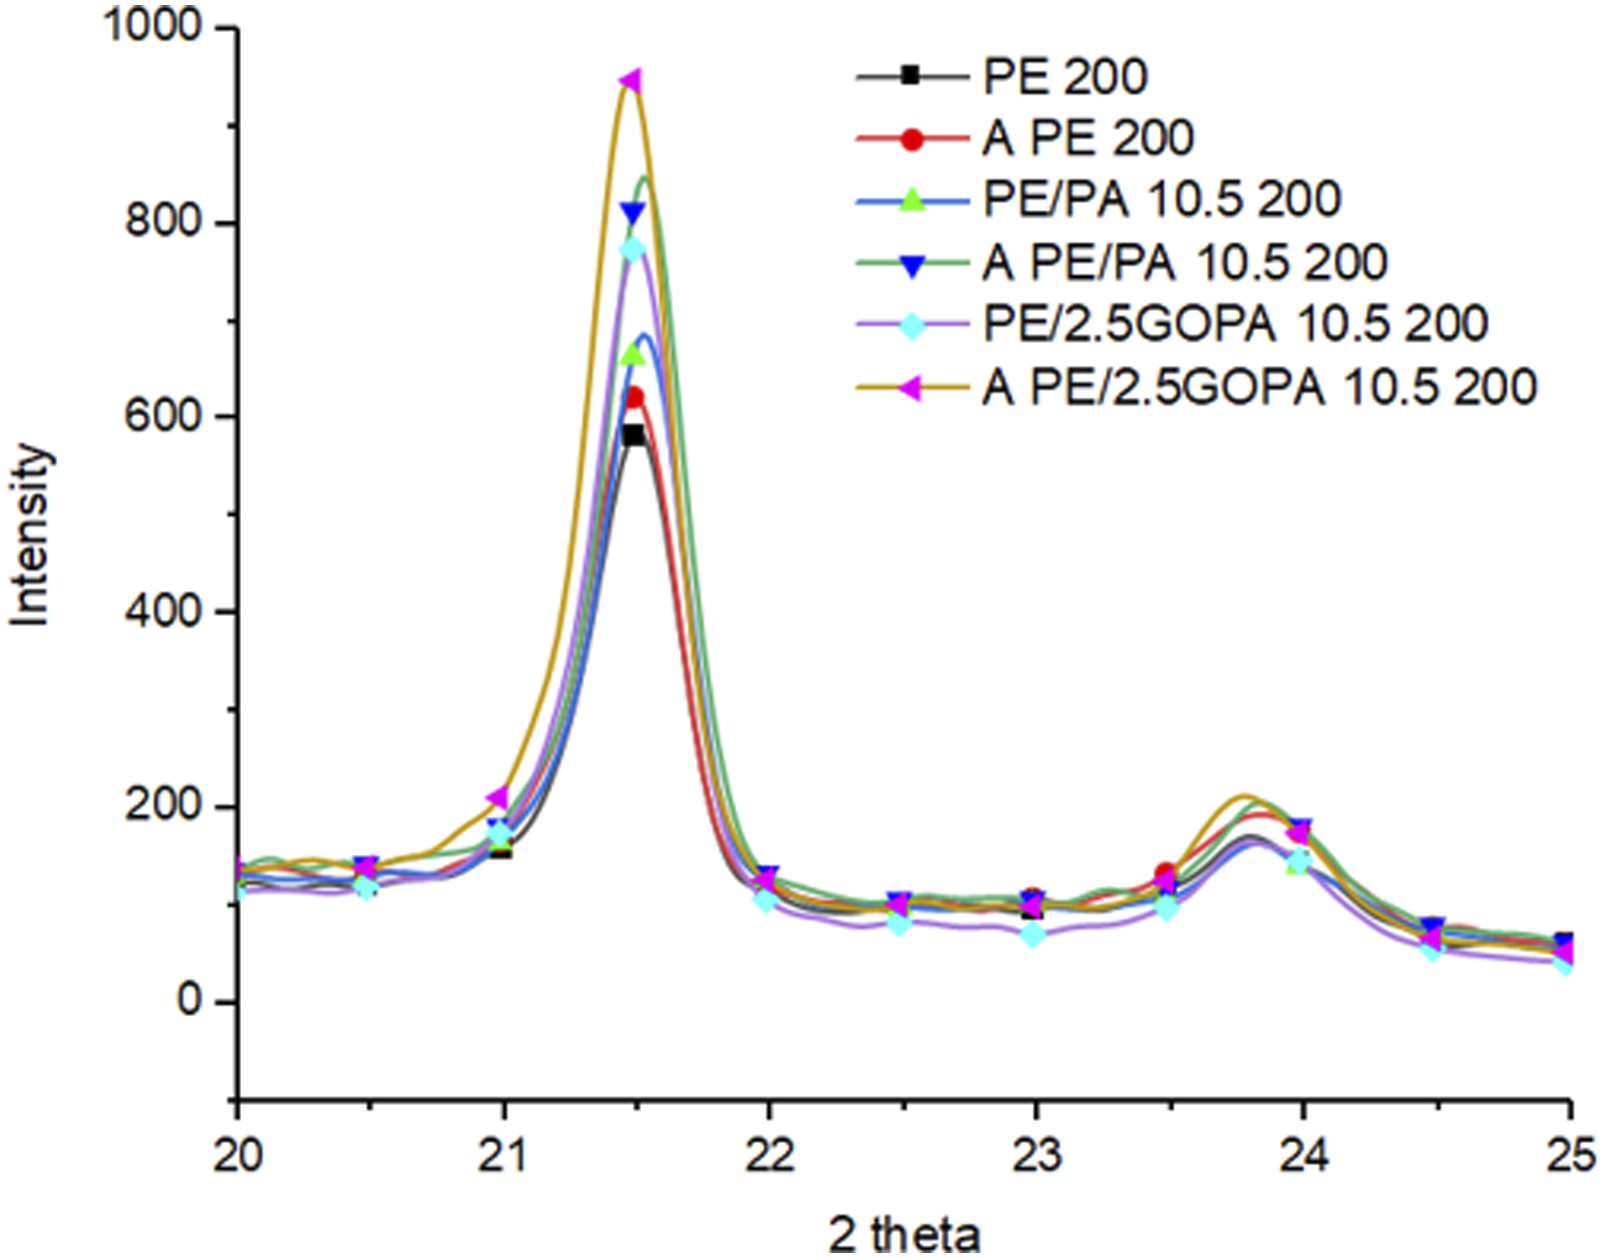
Due to the very close overlap of PA6 electrospun nanofibers diffraction peak (at 2θ = 21.7°) and PE diffraction peak (2θ = 21.5°), it is not possible to separate PE and PA6 peaks with acceptable accuracy. Hence, we calculate the degree of crystallization of the whole system (matrix + nanofibers) and use it for the means of comparison. According to the obtained data, the difference in crystallization before and after the annealing process is greater in composite samples than in pure matrix samples. This difference is also more pronounced in the case of PE/2.5GOPA 10.5 composite.
Effect of thermal annealing on the tensile behavior of nanofibrous composites
Figure 10 shows the tensile stress-strain curves of samples remolded at 200°C before and after thermal annealing. Table 6 also present the values of yield strength, elastic modulus, percentage of elongation at break, and toughness obtained from these curves, respectively. Stress-strain curves of samples processed at 200°C before and after annealing. Yield strength, elastic modulus, elongation at break and area under stress-strain curve of samples, before and after annealing.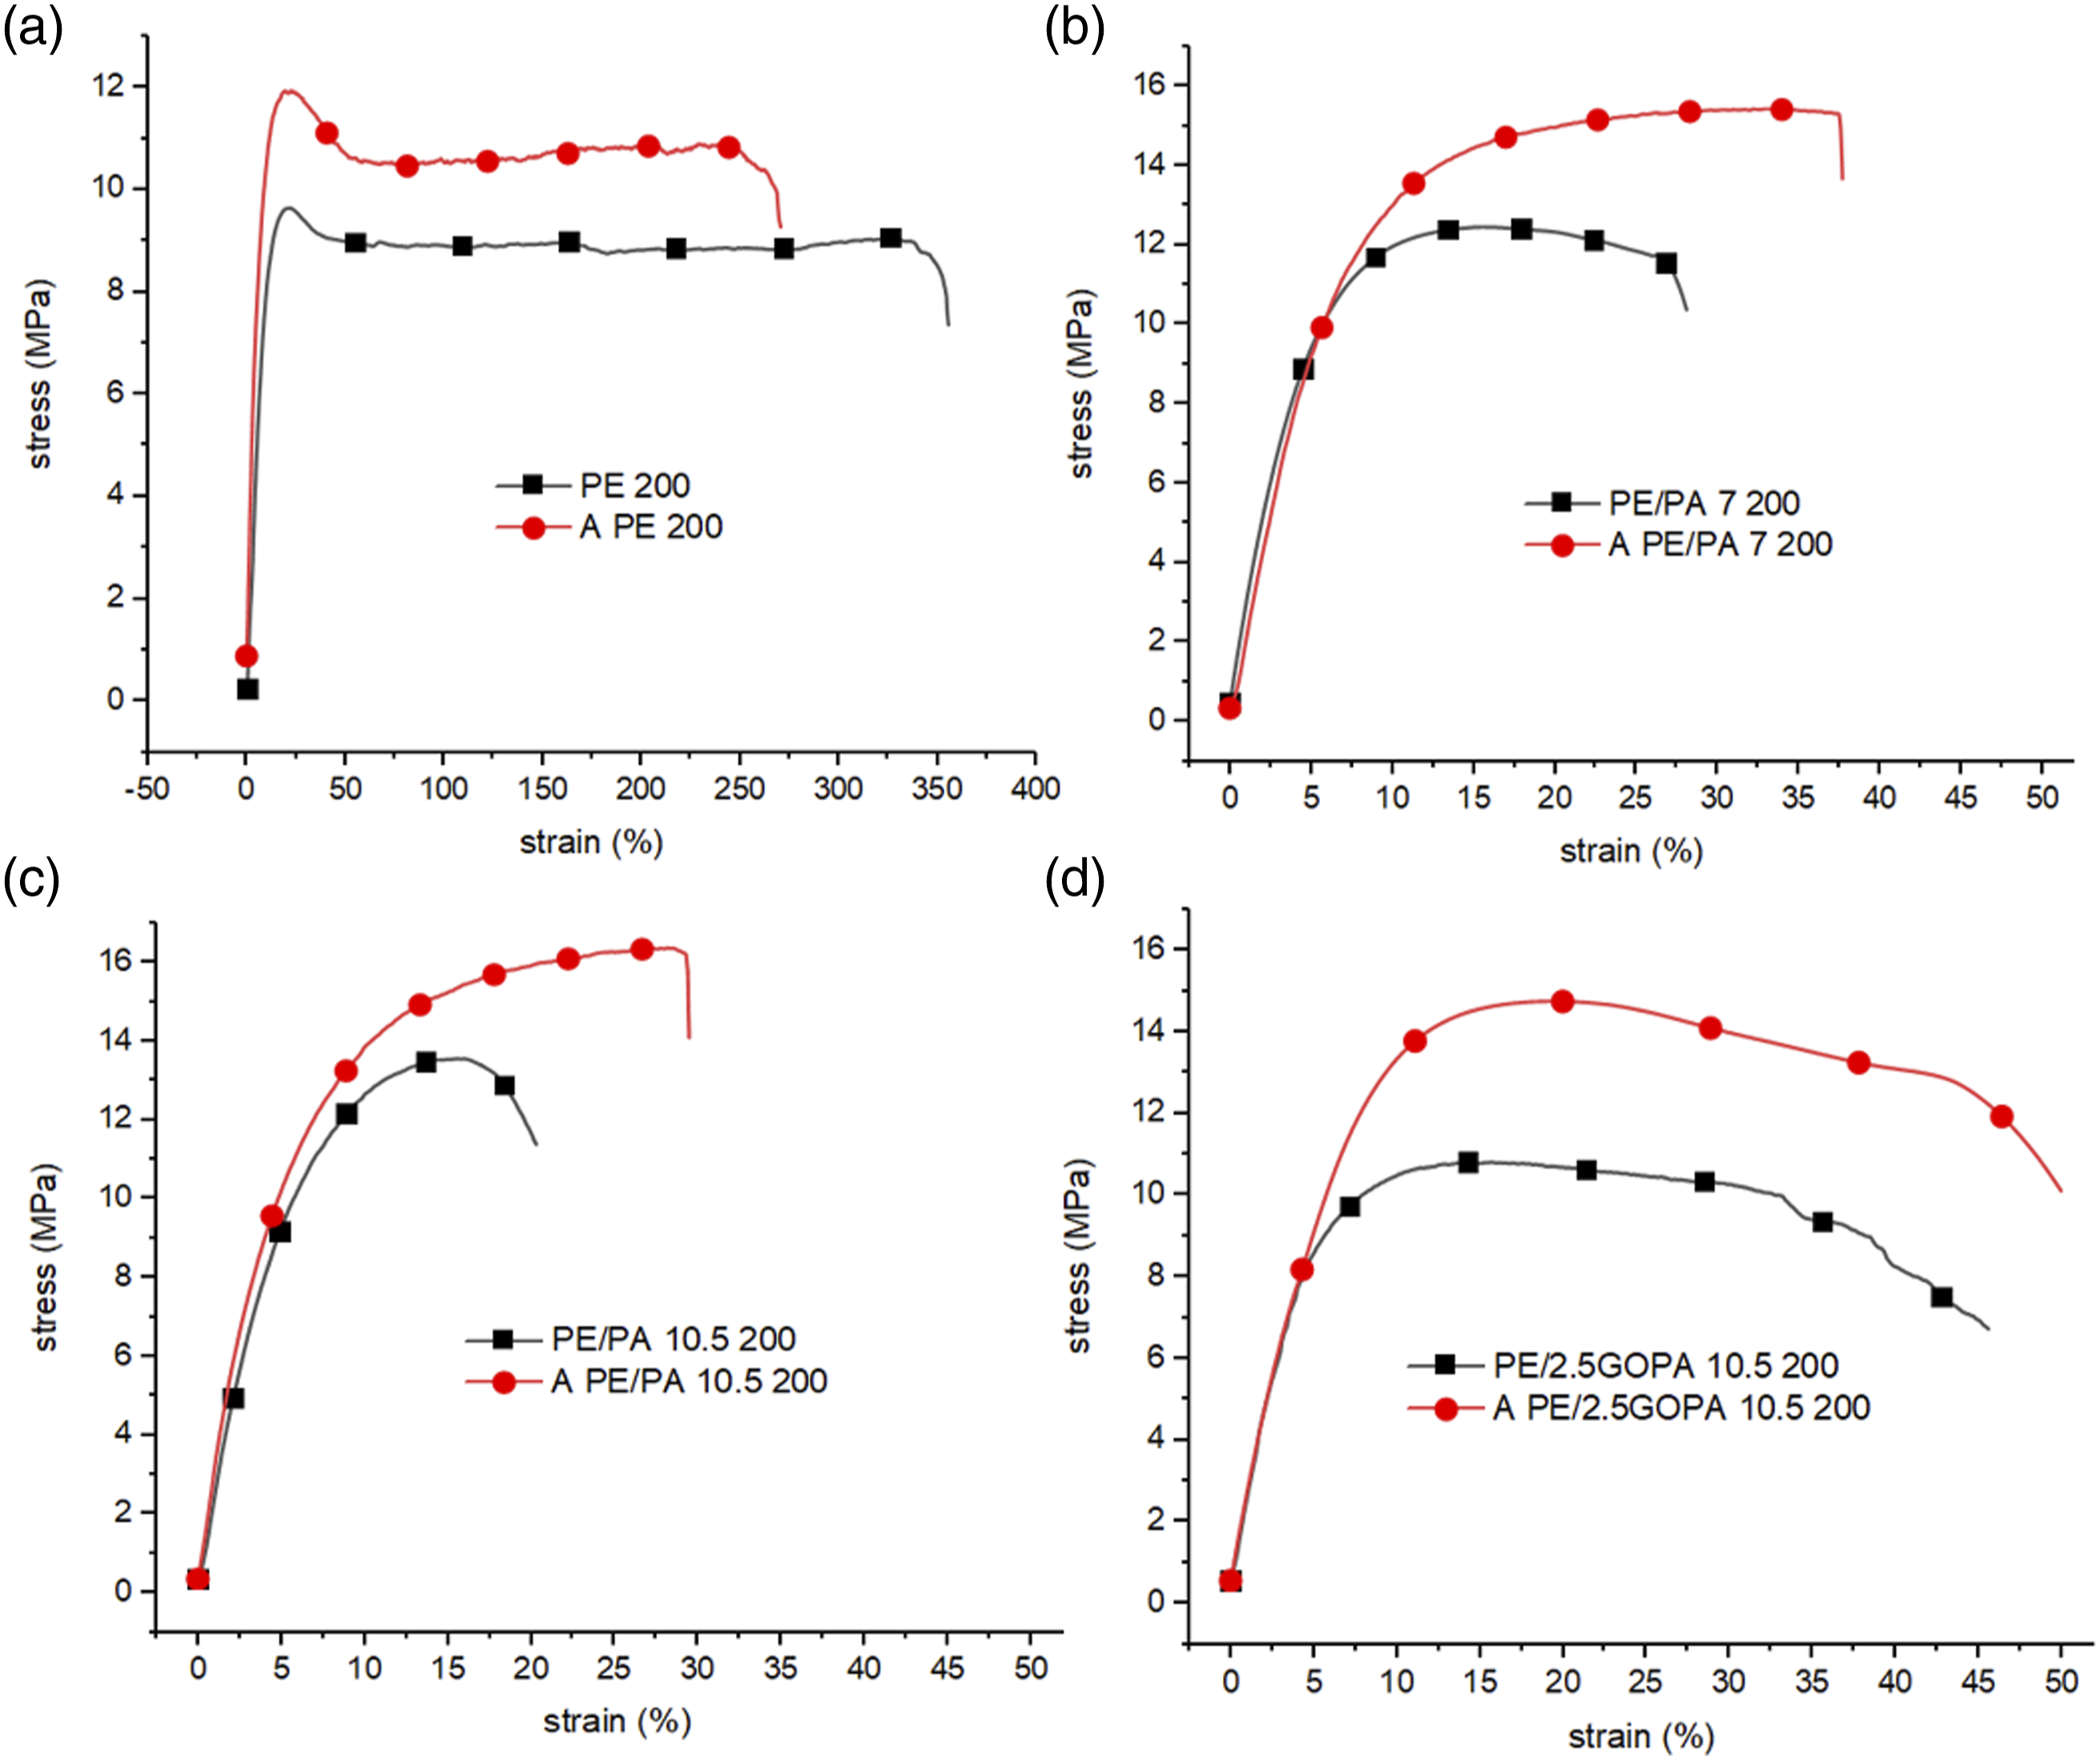
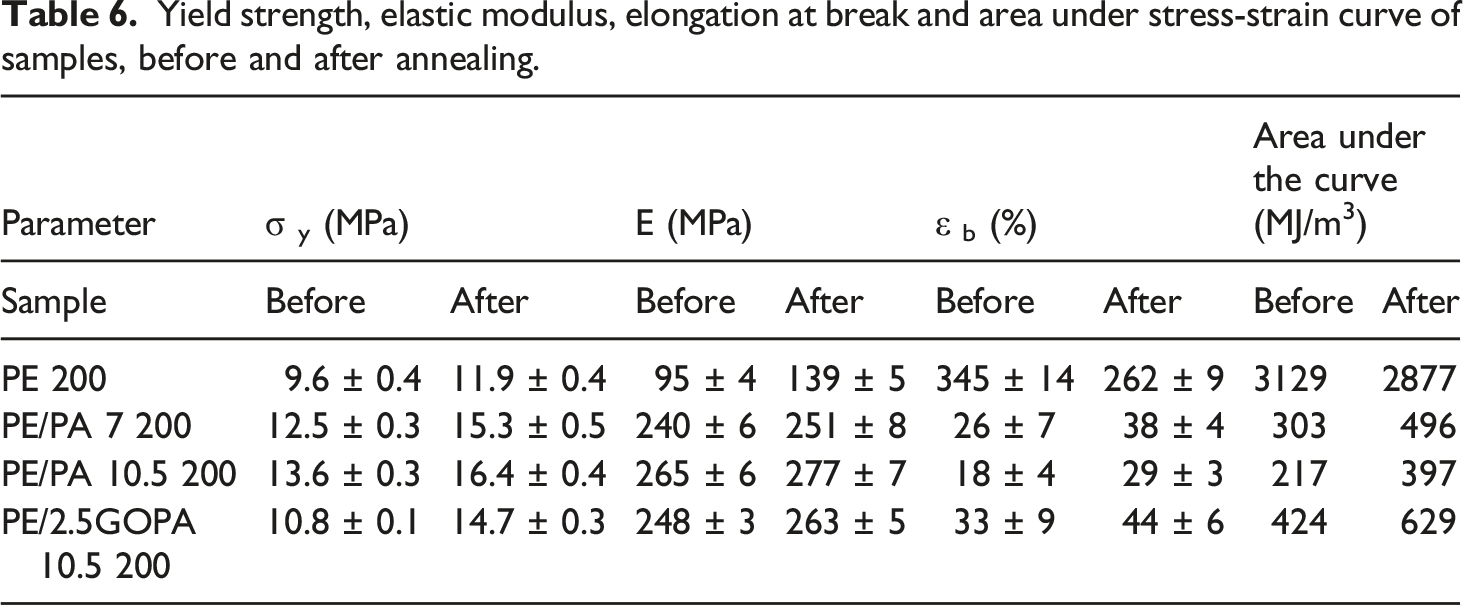
According to Table 4, it can be seen that the yield strength of the samples has improved after the annealing process. The rate of improvement is greater for composite specimens than for pure matrix specimens. Also, the rate of improvement is higher for the PE/GOPA 10.5 200 composite compared to the PE/PA 10.5 200 composite. The trend of increasing yield strength is consistent with the trend of increasing the degree of crystallization obtained from DSC and XRD (in the previous sections).
According to the data in Table 6, it can be seen that due to annealing, the elastic modulus of the samples also improved. But the rate of improvement is greater for pure PE-g-MA samples than for composite samples. This is probably due to the fact that the modulus improvement process in composites is highly saturated despite the high modulus PA6 in the composite. Also, this result could be related to the further increase of defects in the molecular network due to annealing, which was discussed earlier. The molecular lattice must maintain a sufficient level of connection points to provide an effective arrangement during the deformation of the polymeric material. 36 Modulus is an intrinsic property whose value depends on the structure of the material at the molecular level, while the strength of the material is further affected by defects in the microstructure.
Considering Figure 10 and Table 6, thermal annealing reduced the elongation at break of pure PE-g-MA, while it increased the elongation at break of the composites. So, improvement of the elongation at break for composites can be mainly related to more penetration of the matrix into the nanofibers network, more wettability, improved interfacial interaction, and reduction of defects in the fiber-matrix interface due to thermal annealing.
As can be seen from Table 6, the brake energy or toughness (proportional to the area below the stress-strain diagram) of the composite samples has improved after annealing.
Morphology of nanofibrous composite by light microscopy
The samples for optical microscopy study were prepared as explained in 2.4. A nanofiber mat was sandwiched between two thick PE-g-MA films and hot pressed. Figure 11(a) shows a light microscopy image of the cross-section of an unannealed sample cut by a surgical razor. The black line shown with the red arrow corresponds to the nanofiber mat or nanofiber-rich region and the rest of area is the bulk PE-g-MA. As can be seen, the area close to the nanofiber-rich region shows a different structure compared to the area away from the nanofiber-rich region. The dark halo around the nanofiber-rich region indicated by the white arrow can be attributed to the formation of a transcrystalline (TC) layer around the nanofiber-rich region. Images (a) light microscope and (b) Polarized reflected light microscope related to cross-section of pre-annealing sample (cut by surgical razor).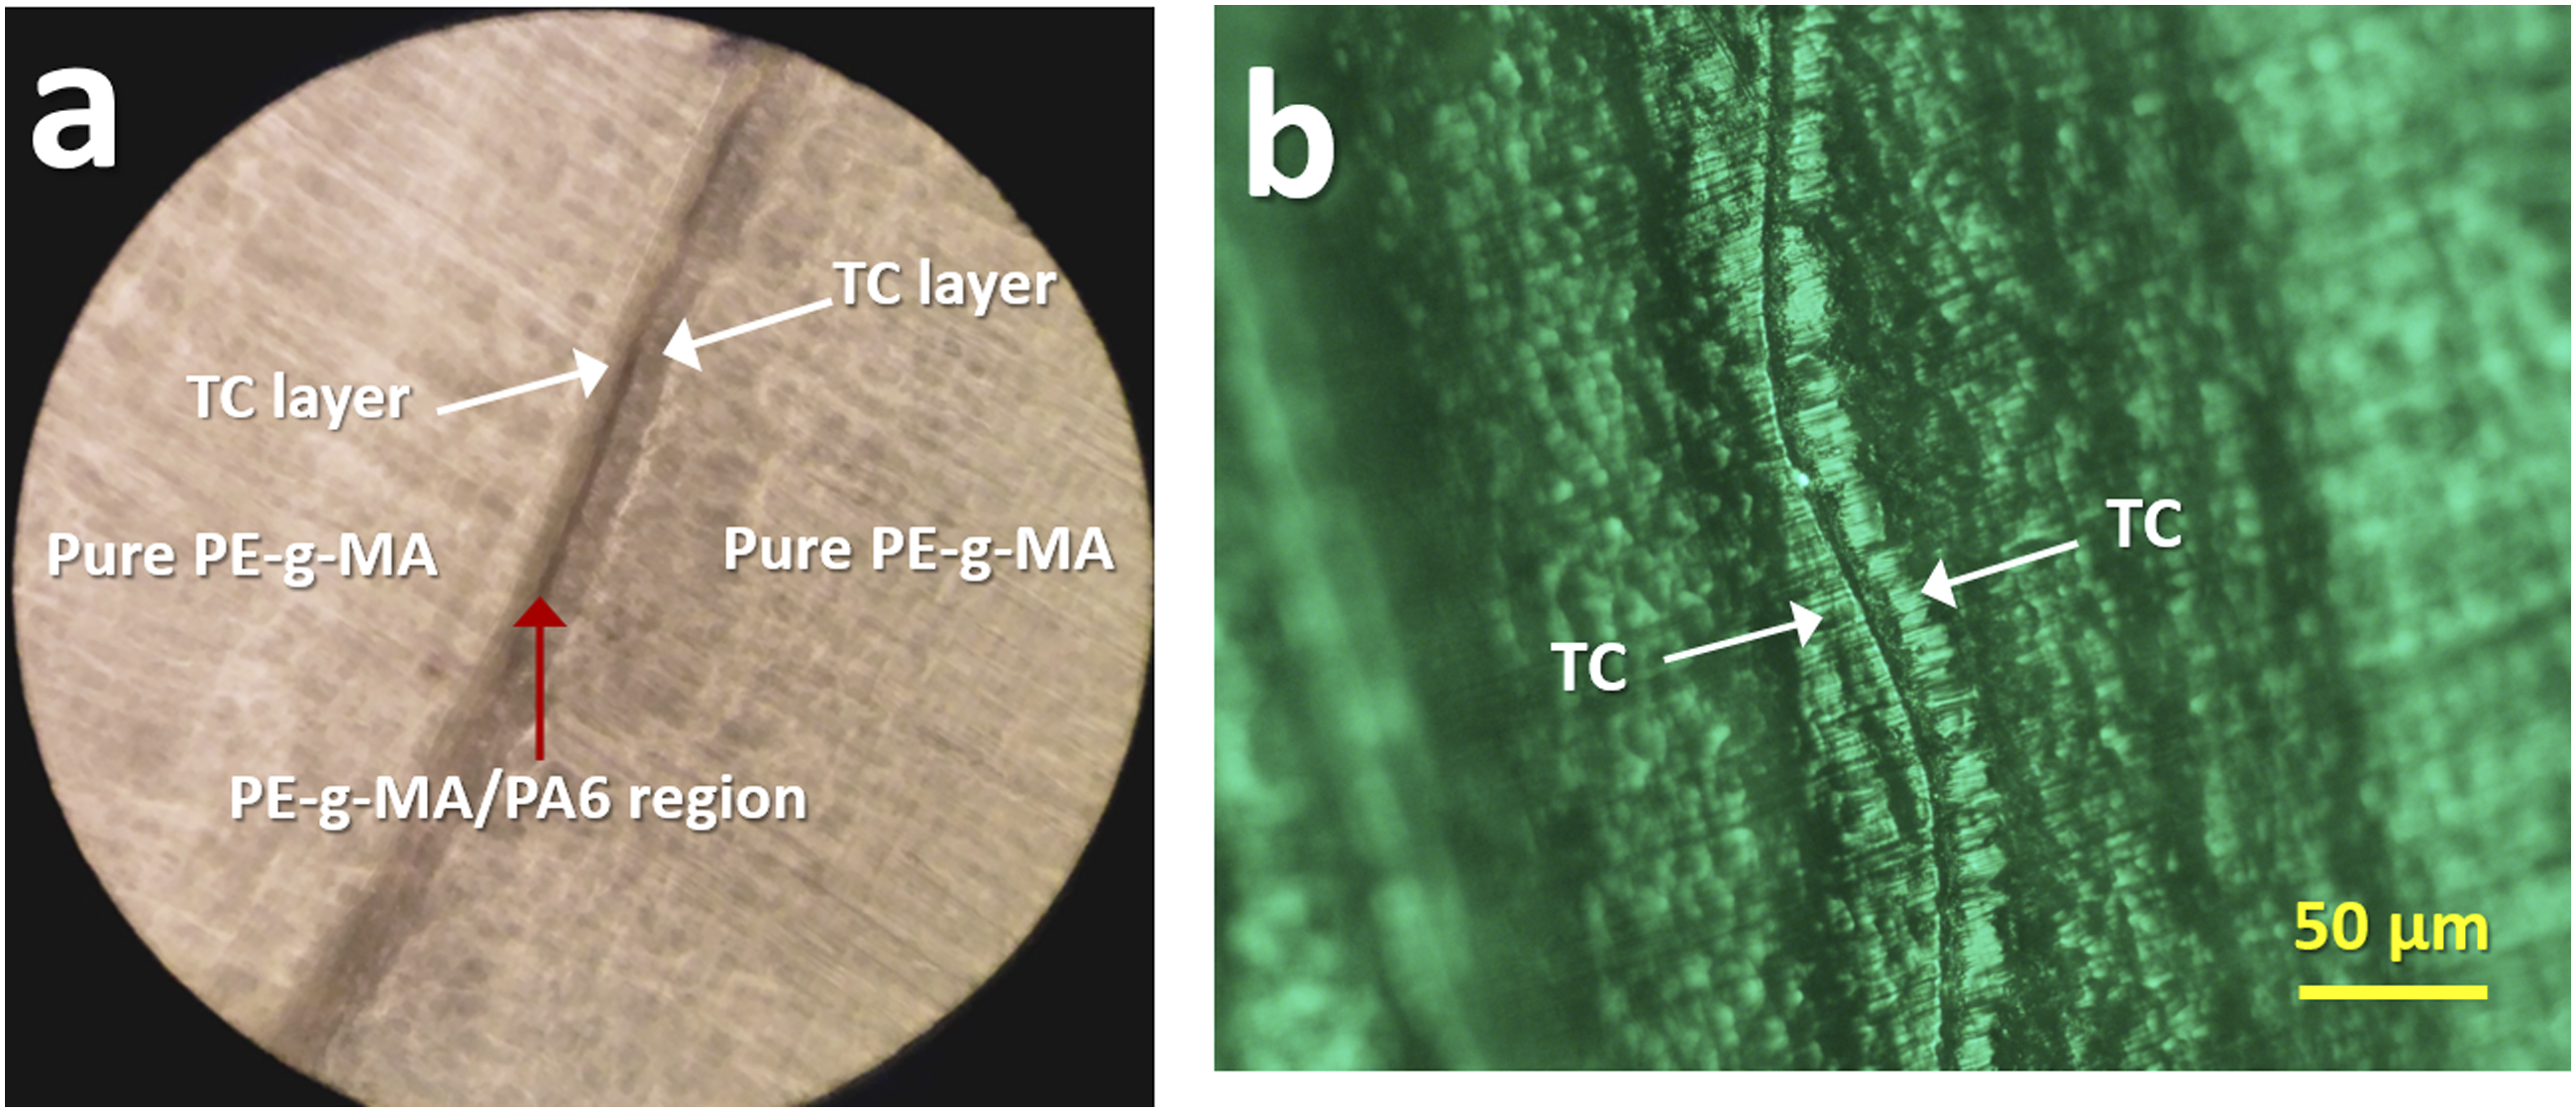
The formation of TC morphology depends on the physical and chemical nature of the components as well as the processing conditions of the composite material. 42 According to previous reports, the similarity of the chemical structure of the matrix and the reinforcing fiber often leads to the induction of transcrystallization at the interface. However, transcrystallinity has also been observed in composites containing two chemically different polymers (such as PA/PP). Transcrystallinity has been observed in many semi-crystalline polymers such as PP, PE, PET, and PA. 3 In TC crystals, the crystal nucleus forms at the fiber surface and the lamella grows perpendicular to the fiber surface, while common spherulites grow at a distance far from the fiber in the bulk of matrix. This type of lamellar arrangement, in turn, can affect the mechanical properties of composites. 38 Transcrystallinity studies have so far focused on polymer composites containing microfibers. In conventional fibrous composites where the fibers are micro-sized, the formation of a layer with TC morphology around a single microfiber is investigated. However, in a study in 2016 by Wang et al., 43 the formation of TC morphology in isotactic polypropylene (iPP) matrix composites containing electrospun iPP and PBT nanofibers (to a greater extent), as well as PS, PVA nanofibers, PET, and PA6 (to a lesser extent) was reported.
Here, the presence of an area with a different morphology around the nanofiber-rich region is attributed to the formation of a TC layer. Figure 11(b) shows a polarized reflected light microscope image of the TC layer created around the nanofiber-rich region.
The cross-section of the specimen cut by a surgical razor on a glass slide inside the oven was subjected to thermal annealing treatment, and then the annealed specimen was transferred to a reflected light microscope. Figure 12(a) shows a polarized reflected light microscope image of the cross-section of the annealed specimen. As can be seen in the image, a layer with a different morphology is created around the nanofiber-rich region, which represents the transcrystallinity around the nanofibers. At a distance from TC areas, spherulites can be seen. Interestingly, the spherulites adjacent to the TC region are much larger in size than the spherulites in the PE-g-MA bulk. Figure 12(b) also shows a close-up view of the spherulites. (a) Polarized reflected light microscope image of annealed PE-g-MA/PA6 sample, (b) a close-up view of spherulites.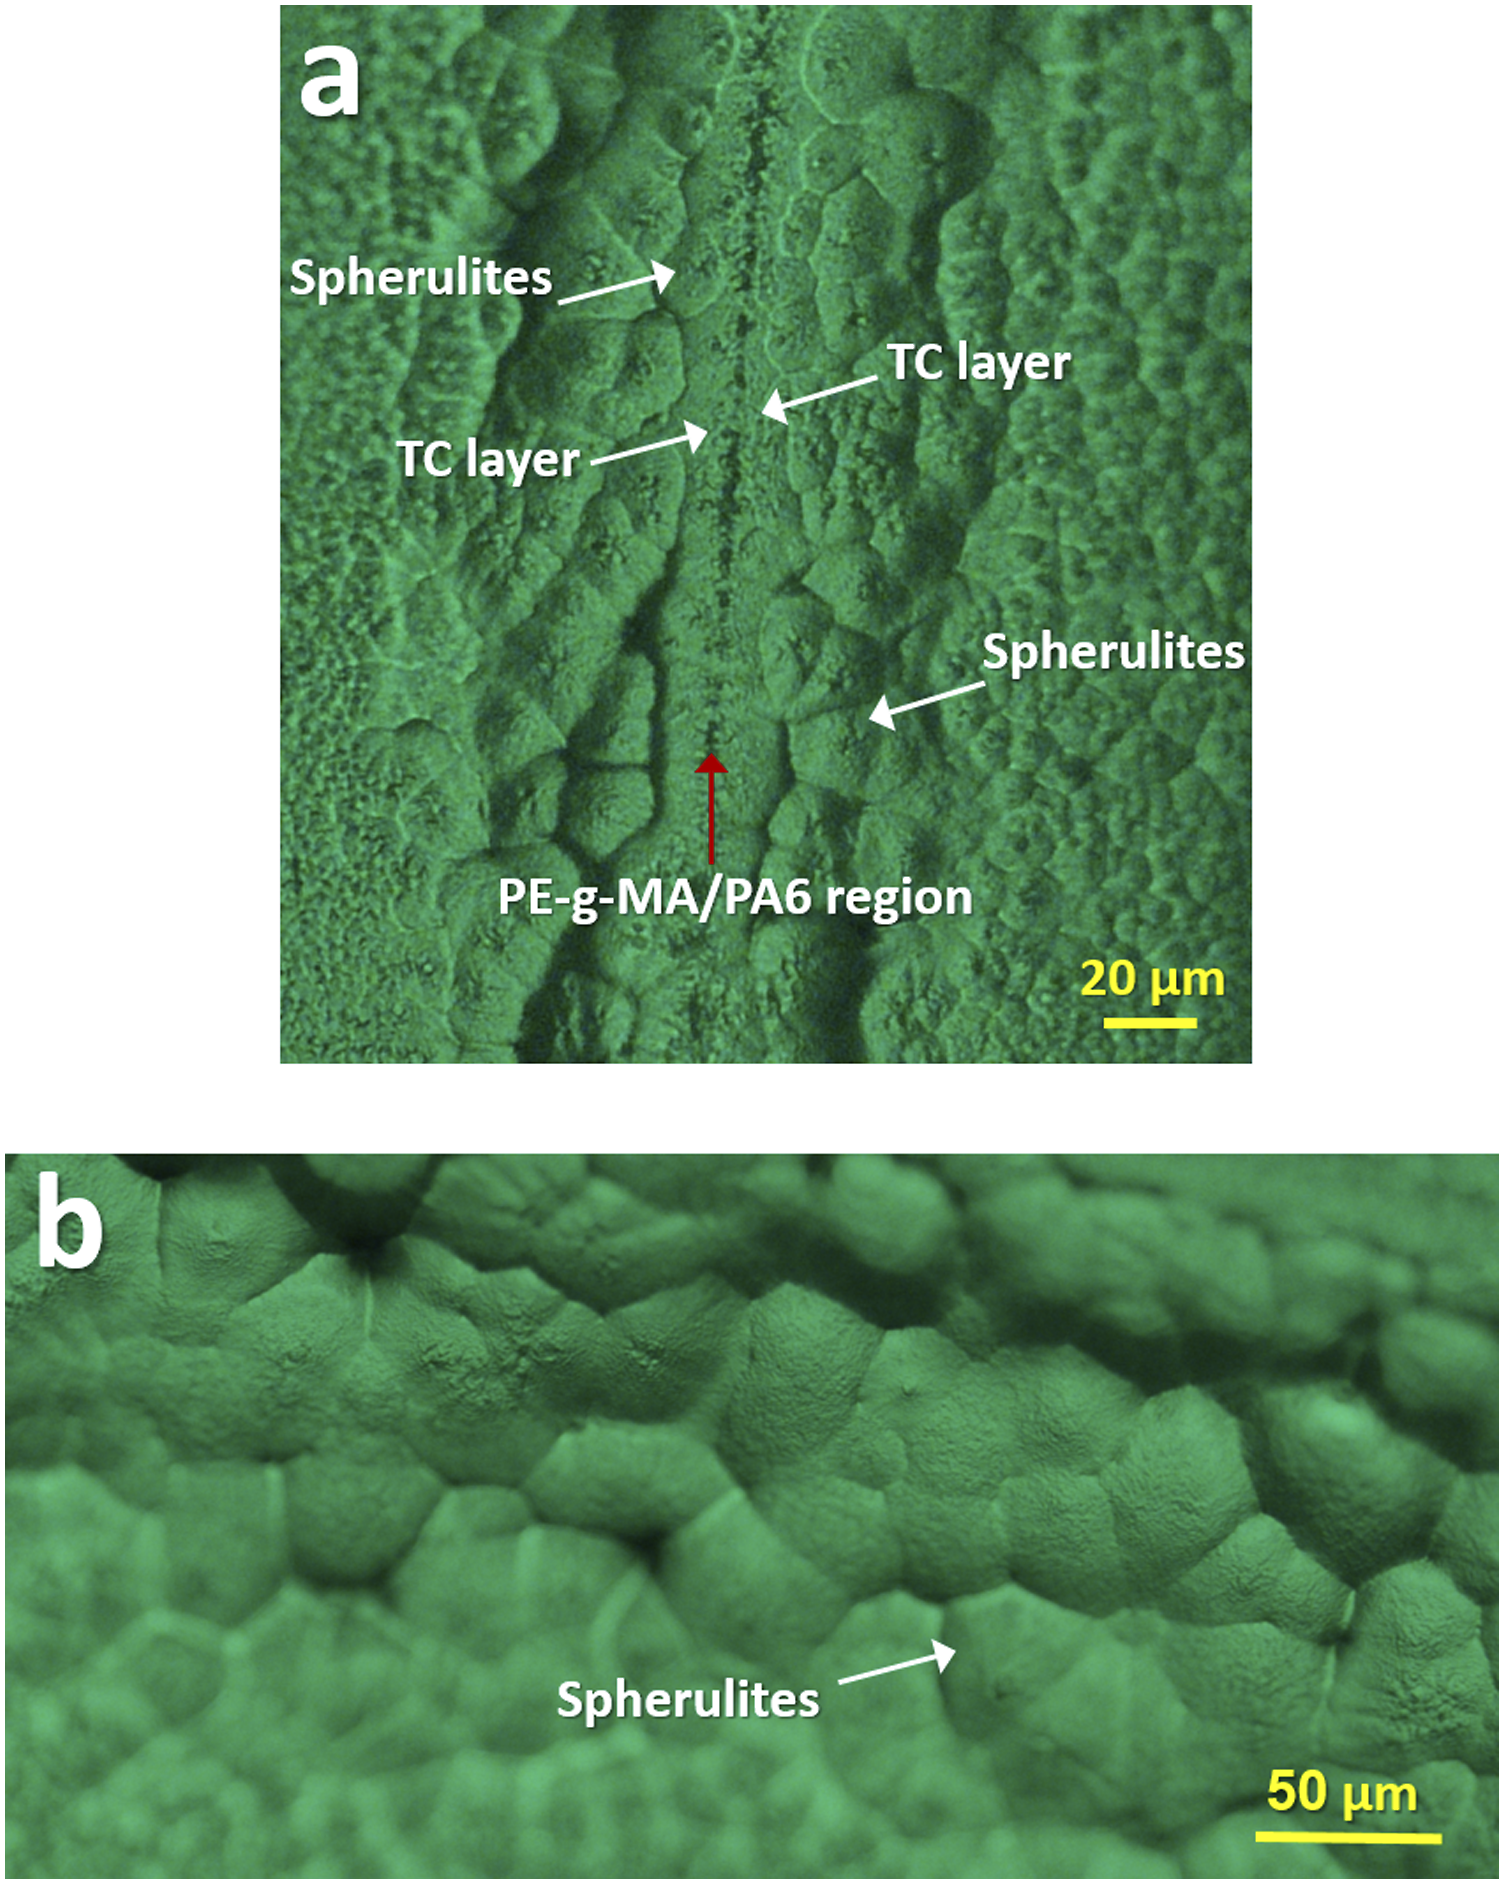
Conclusion
In the present work, at first, the pure and GO-incorporated PA6 nanofibers were electrospun and using them, PE-g-MA based nanofibrous composites were prepared via a hot-press method at 180°C. Then, these thermoplastic polymer-polymer composites were remolded in an oven at higher temperatures from 180 to 210°C. Furthermore the composites remolded at 200°C were annealed for 10 h at 100°C. The effects of higher remolding temperature and thermal annealing treatment on the morphological and mechanical properties of the nanofibrous composites were investigated.
SEM images showed better wetting and adhesion when higher remolding temperatures, close to the melting point of PA6 nanofibers, were applied. This happened in the era of an initial good interface adhesion between PE-g-MA and PA6 through hydrogen bonding and intermolecular interactions of the maleic anhydride/carboxylic acid groups of the former and amide groups of the latter. Higher molding temperature not only reduces the viscosity of the matrix to penetrate more efficiently into the mat but also partially melts the nanofibers which, promotes wetting and adhesion of matrix chains on the amorphous areas of the PA6 nanofibers rather than its crystalline areas. The DSC results showed a slight increase in the crystallinity of the matrix with an increase in the remolding temperature due to the transcrystallization of the matrix on the nanofiber mat or nanofiber-rich regions with a thickness of about 20 microns. Also the tensile properties of the composites improved with increasing remolding temperature due to the improvement in interfacial strength of the composites through better wetting, adhesion and stronger interface by the presence of TC region.
Applying thermal annealing improved the properties of the nanofibrous composites. It was attributed not only to role of annealing to reduce the amount of initial defects in the nanofibrous composites but also by the promotion of TC regions on the nanofiber mat or nanofiber-rich regions. The highest improvements of 38% and 99% in yield strength and modulus were observed for the annealed composite containing 10.5 wt% pure PA6 nanofibers as compared with the annealed matrix at the same conditions. The TC regions were extended by spherulite crystalline structures in the PE-g-MA phase of the composite up to a thickness of 100 microns. An Increase in the thickness of TC regions improves interface strength and final mechanical properties of the nanofibrous polymer composites.
Footnotes
Acknowledgments
This research received no specific funding from funding organizations in the public, commercial or non-profit sectors. The authors express their sincere gratitude to the testing specialists in Dana Plastics Testing Laboratory for their cooperation and assistance and guidance in this research.
Declaration of conflicting interests
The author(s) declared no potential conflicts of interest with respect to the research, authorship, and/or publication of this article.
Funding
The author(s) received no financial support for the research, authorship, and/or publication of this article.