
Abstract
In this paper, using Styphnolobium japonicum, Cryptomeria fortunei and Pinus yunnanensis as raw materials, cellulose (CE) was first extracted by chemical method (CM1) and biological enzymatic method 2 (BM2), and then further prepared into nanocellulose fiber (CNF) by biological enzymatic method 1(CPM (CPM stands for cellulase and pectinase)). The CE and CNF were characterized by FTIR, XRD, SEM, DSC and TG. The results showed that the CNF prepared by CM1-CPM was cellulose type II, CNF prepared by BM2-CPM was cellulose type I. The best crystallinity of the CNF prepared by CM1-CPM reached 74.1% (C. fortunei CNF), the best yield was 24.0% (S. japonicum CNF) and the minimum average diameter was 62.6 nm (C. fortunei CNF). However, the best crystallinity of CNF prepared by BM2-CPM reached 80.1% (C. fortunei CNF), the best yield was 27.4% (C. fortunei CNF), and the minimum average diameter was 31.6 nm (C. fortunei CNF). And also, the thermal degradation analysis of the CNF prepared from the three raw materials revealed that the CNF prepared by BM2-CPM had better thermal degradability. Finally, the thermal stability analysis of the C. fortunei CNF was carried out, and it was found that the residual mass of CNF prepared by BM2-CPM was 48%, while the residual mass of C. fortunei CNF prepared by BM1-CPM was 22%, which showed the C. fortunei CNF prepared by BM2-CPM had better thermal stability. Therefore, the properties of nanocellulose prepared by BM2-CPM are optimal.
Keywords
Introduction
Polymers synthesized from petroleum have caused serious environmental problems because they are not biodegradable and are difficult to degrade under natural conditions. Therefore, researchers are increasingly turning their attention to sustainable polymers that are abundant, inexpensive, renewable, and biodegradable.1,2,3 And Cellulose is the most abundant sustainable polymer on the planet. It is a linear, high-molecular-weight polysaccharide that is composed of D-glucose with β-1,4-glycosidic bond.4,5,6 Cellulose, mainly from wooden plants, herbs and algae, comes from a wide range of sources. It is the main component of plant cell wall, which has the advantages of insoluble in water, biodegradability and low cost.7,8 And Nanocellulose is a derivative of cellulose, which has a diameter at the nanometer-level and a length at the micron level, which not only retains the advantages of cellulose biodegradability, biocompatibility and chemical stability, but also features high strength, large specific surface area, high crystallinity, high transparency, low coefficient of thermal expansion.9–12 Moreover, a large number of hydroxyl on the surface of nanocellulose can form hydrogen bonds with certain in the thermoplastic materials used to prepare composites, resulting in fiber-reinforced thermoplastic composites with improved performance. 13 Therefore, researchers often add nanocellulose to some thermoplastic materials or use it as a matrix substance to prepare composites in order to improve other properties such as mechanical, optical, electrical, and magnetic.14–16
The main methods for extracting cellulose and nanocellulose include chemical, mechanical and biological enzyme treatments. Currently, chemical methods are still the mainstream methods for preparing cellulose and nanocellulose. However, due to the problem of chemical residues and pollution of the environment, the green biological enzyme methods are studied by more and more researchers. Long et al. 17 used heat-resistant xylanase (Xyn10 A) from Thermotoga thermarum DSM 5069 to remove the xylan shell and then utilized cellulase to enhance the biomass structure. The results indicated that the fiber surface became smoother, cellulose accessibility and hydrolysis were improved, and solid content reached as high as 10%w/w. Hu et al. 18 applied different combinations of endoglucanase, lytic polysaccharide monooxygenase, and xylanase to sulfate pulp. As a result, the surface of cellulose became smoother and its accessibility, crystallinity, and charge were enhanced in a short time. Bondancia et al. 19 investigated the effect of different cellulase enzyme on the production of nanocellulose from eucalyptus cellulose pulp. The results showed that all enzymatic mixtures could effectively form nanocellulose structures, and the average length is 80–400 nm. Xu et al. 20 successfully prepared spherical CNCs with a particle size of 30 nm from pulp fibers by enzymatic digestion with a complex enzyme, and obtained approximately 99.99% pure CNCs.
In order to extract cellulose from wood more effectively, chemical and biological enzyme methods were studied. Cellulose was extracted from Styphnolobium japonicum, Cryptomeria fortunei, and Pinus yunnanensis. Firstly, all three types of wood are grown in Kunming, Yunnan Province. They are easy to obtain and grow quickly, as well as being drought-resistant and suitable for planting over a wide area.21,22 Secondly, the bodies of these three types of wood are often used in construction, furniture, and lumber. However, a lot of processing trimmings are thrown away or even burned, which results in huge waste of resources and environmental pollution. The cellulose content of all three woods is approximately the same, ranging from 50% to 60%. Difference: S. japonicum is a deciduous leguminous tree that belongs to the hardwood category due to its tall height. 23 Cryptomeria fortunei, a coniferous tree unique to China, belongs to the genus Cryptomeria. 24 Pinus yunnanensis is also a coniferous tree belonging to Pinaceae and can easily form large areas of pure forest. 25
In this paper, the differences in yield, crystallinity, size, thermal stability and degradability between two nanocelluloses made from cellulose by chemical and biological enzymatic methods were investigated using S. japonicum, C. fortunei and P. yunnanensis as raw materials.
Materials and methods
Materials
Styphnolobium japonicum (SJ), Cryptomeria fortune (CF) and P. yunnanensis (PY) are all sourced from Kunming, Yunnan Province, China, and all materials are dried and ground to a powder to pass through a 40–60 mesh (250–420 µm) screen before processing; pectinase (CAS:9032-75-1), hemicellulase (CAS:9025-56-3), cellulase (CAS:9012-54-8), and laccase (CAS:80,493-15-3) were obtained from Aladdin Biotechnology Co., Ltd., Shanghai, China. The enzymes have activities of 300,000, 5000, 10,000 and 500 U/g, respectively; sodium chlorite (NaClO2), NaOH, glacial acetic acid (CH3COOH), hydrogen peroxide (H2O2), ammonia solution (NH3
Preparation of cellulose and nanocellulose
Preparation method of cellulose
Chemical method (CM1):5 g raw materials (SJ, CF or PY) were each pretreated with 98% CH3CH2OH at 80°C for 6 h and then dried; distilled water, 98% CH3COOH and NaClO2 (mass ratio 150: 2: 1) were added into the pretreated sample above, keeping 1 h in water bath at 75°C, CH3COOH and NaClO2 were added and heated for an additional hour. The process was repeated until the material became white, it was washed with distilled water and then dried. 37.5 mL NaOH solution with a mass fraction of 17.5% was mixed with the above sample, stirring slowly for 3 min into a homogeneous paste and then mercerizing the reaction using 37.5 mL 17.5% NaOH solution for 45 min at a water temperature of 20°C. After washing with distilled water, it was soaked in CH3COOH with a mass fraction of 2% for about 5 min. Finally, it was washed with distilled water until neutral, and dried to obtain cellulose.
Biological enzyme method 2 (BM2): 5 g raw materials (SJ, CF or PY) and a mixed solution of 98% CH3COOH and 30% H2O2 (mass ratio 1:1) were placed into a conical flask and kept in a water bath at 70°C, allowed to react fully until the material turns white. The white sample above was washed with distilled water and dried. The dried material was placed in a beaker and soaked in 25% NH3
Preparation methods of nanocellulose
Biological enzyme method 1 (CPM): 0.5 g powder of the cellulose made by CM1 or BM2, 15 mL 5% cellulase, 15 mL 5% pectinase were milled with 20 g of 0.1 mm zirconia media for 30 min at 50°C in a magnetic stirrer. After completion, the reactant was placed in water bath at 100°C for 10 min until pectinase and cellulase are deactivated, and then Ultrasonic treatment was conducted in a CNC ultrasonic device (500 W, 40 kHz) for 30 min. The lower turbid liquid was centrifuged out and magnetic stirred at 100°C for 30 min, placed in a CNC ultrasonic device for 30 min, repeated stirring sonication steps at room temperature until a colloidal suspension appears in the upper layer. (The preparation process was shown in Figure 1) Using Styphnolobium japonicum, Cryptomeria fortunei and Pinus yunnanensis as raw materials, cellulose was prepared by chemical method (CM1) and biological enzyme method 2 (BM2), and then nanocellulose (CNF) was further prepared by biological enzymic method 1(CPM).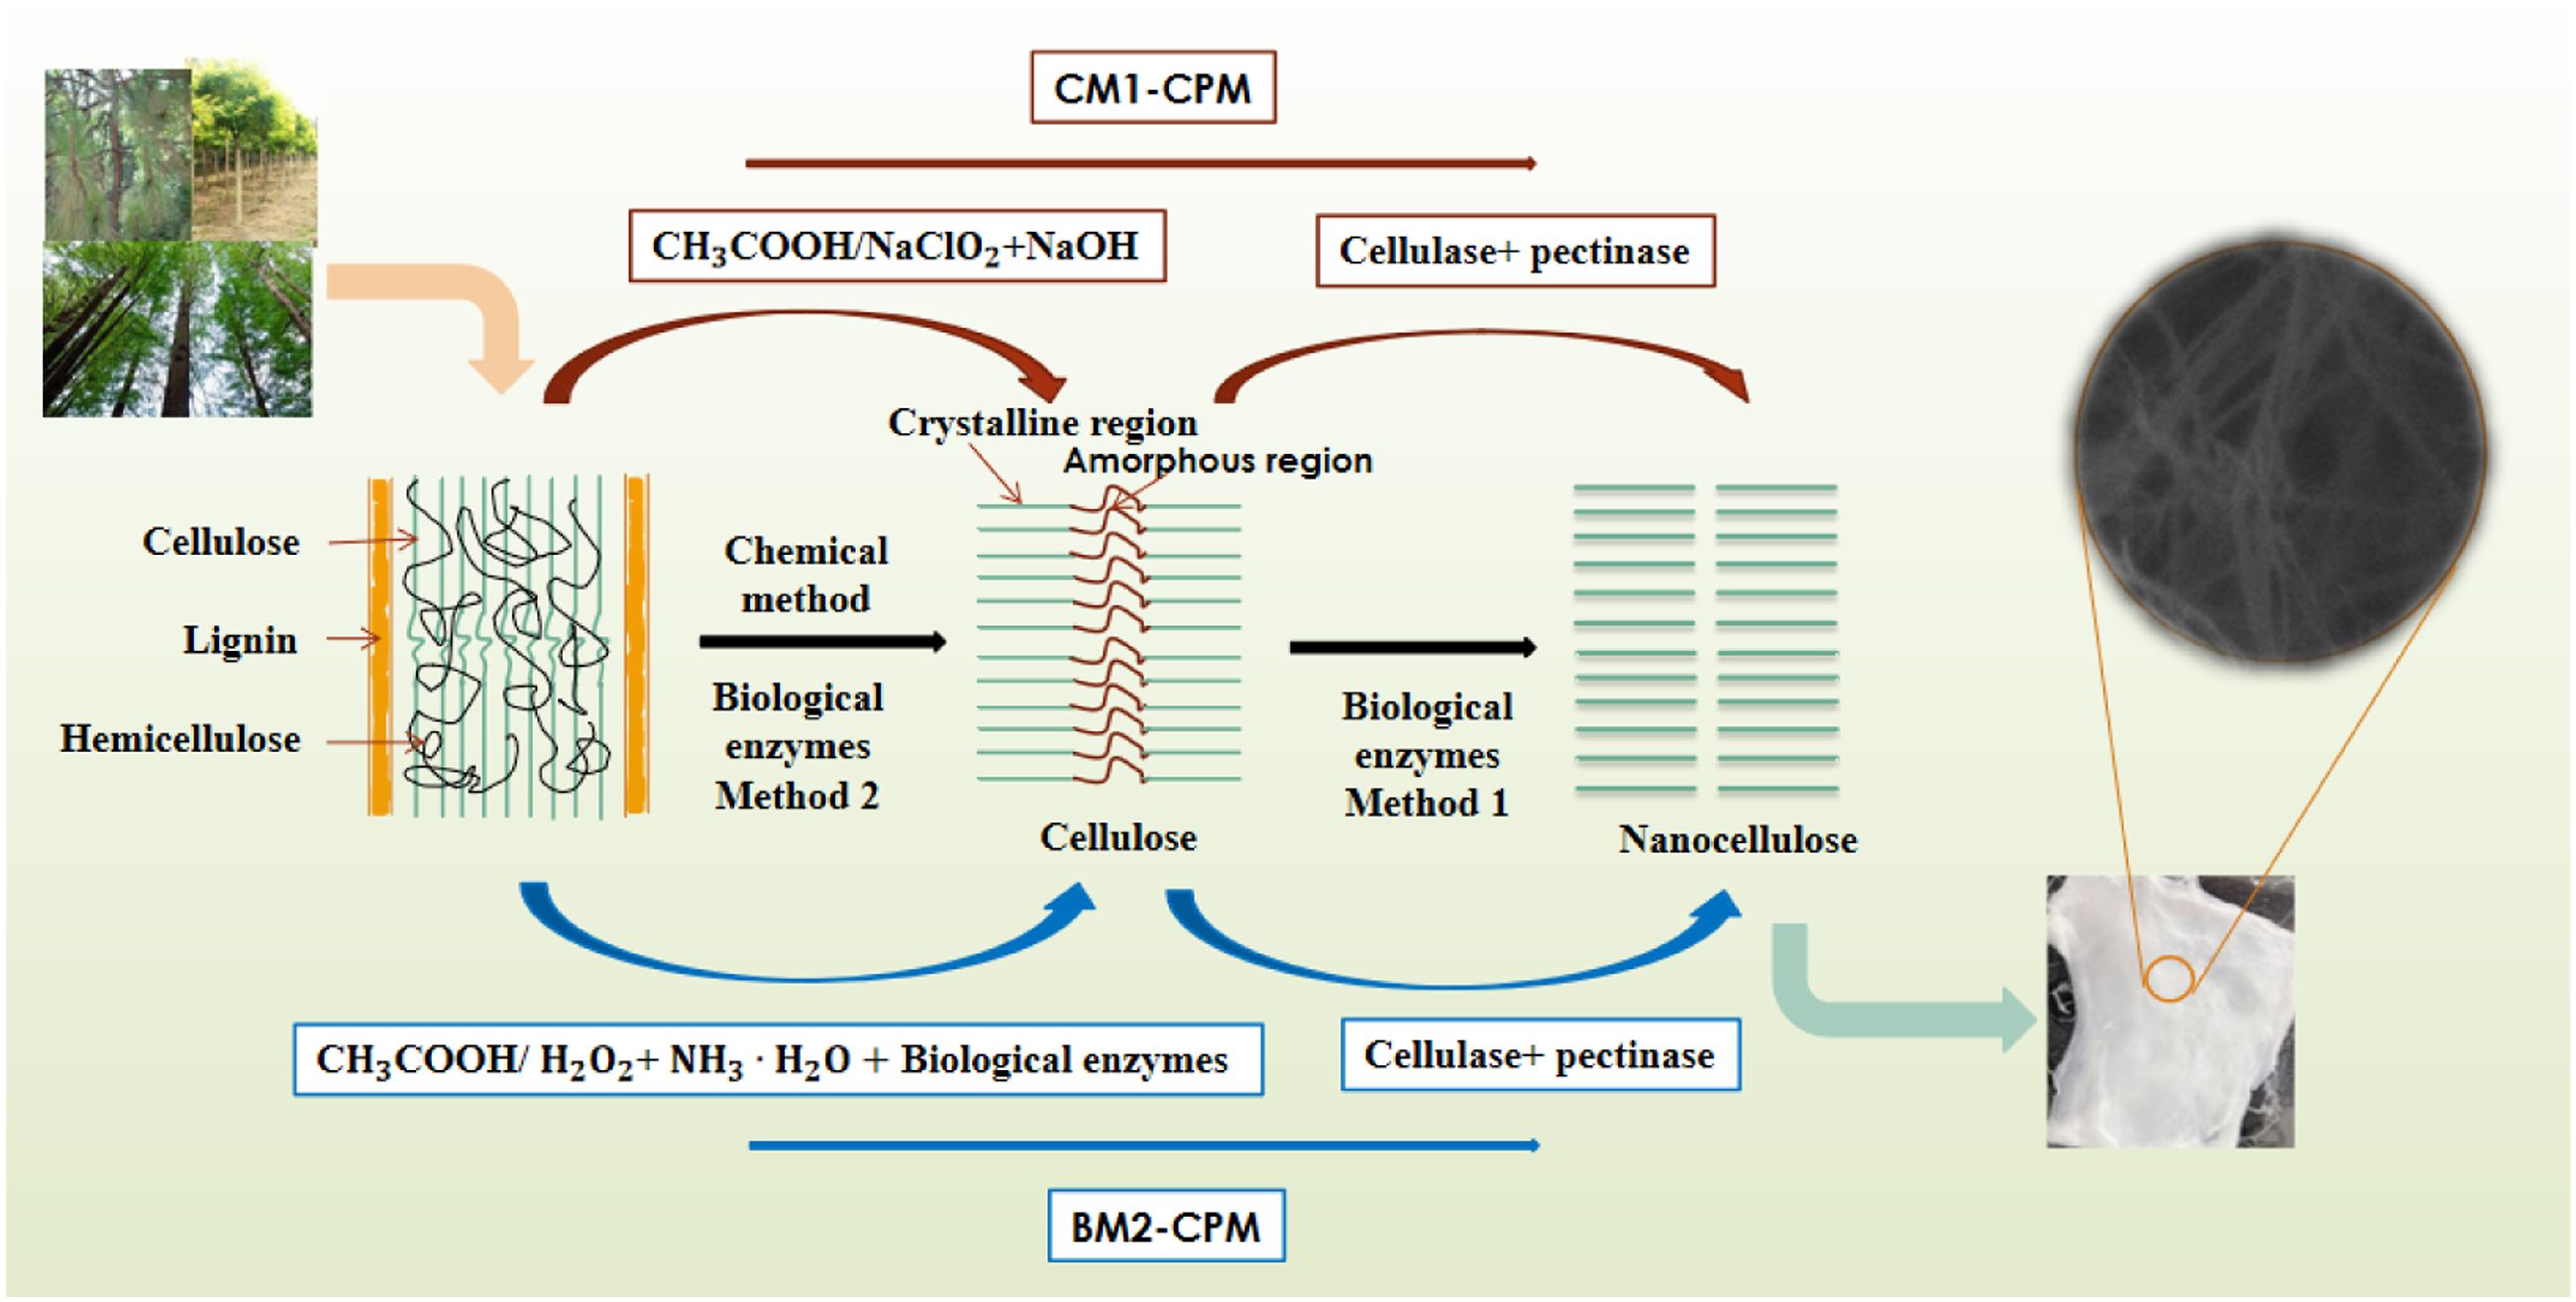
Characterization of cellulose and nanocellulose
Fourier-transform infrared spectroscopy (FTIR)
Cellulose, and nanocellulose were mixed with KBr and formed into a pellet. The pellets were directly analyzed on a Nicolet50 FTIR analyzer (Thermo Nicolet Corporation, Madison, WI, USA) for 64 scans with a scanning range of 500–4000 cm−1. Baseline correction was performed to analyze the spectral differences between plant fibers obtained by different treatments.
X-ray diffraction (XRD)
The crystal structures of cellulose and nanocellulose were studied by XRD on an Ultima-IV X-ray diffractometer (Rigaku Corporation, Tokyo, Japan) using a scanning angle from 5 to 60°, a step of 0.026° (accelerating current = 30 Ma, voltage = 40 kV, and λ = 0.154 nm of Cu-K

Crl (%): crystallinity index;
Thermogravimetric (TG)
About 10–15 mg of sample powder was ground to pass through an 80–120 mesh screen and placed into sample holders for analysis on a TGA92 thermo gravimetric analyzer (KEP Technologies EMEA, Caluire, France). N2 was used as shielding gas and Al2O3 as the reference compound. The temperature was increased from room temperature to 600°C at a rate of 10°C/min to generate thermogravimetric (TG) curve and derivative thermogravimetric (DTG) curve.
Differential scanning calorimetry (DSC)
5–10 mg of sample was added to the crucible, and an empty crucible was used as a control for analysis by DSC. The temperature was increased from 30°C to 250°C at a rate of 10°C/min using nitrogen as shielding gas.
Scanning electron microscope (SEM)
The microstructure of cellulose, and nanocellulose were coated with gold and placed on an aluminium stub for observation with the HITACHI S-3OOON scanning electron microscope at an accelerating voltage of 200 eV to 30 KeV.
Nanocellulose diameter
The diameter of nanocellulose was measured on scanning electron microscopy images using image J software.
Chemical composition
The contents of holo-cellulose, cellulose, hemicellulose and lignin were determined according to Chinese Standards GB/T 2677.10–1995 (Deter-mination of holo-cellulose in paper raw materials), GB/T 744-1989 (Determination of α-cellulose in pulp) and GB/T 2677.8–94 (Determination of acid-insoluble lignin in paper raw materials).
Nanocellulose yield
The yield of the nanocellulose prepared by enzymatic digestion for half an hour was determined by the weight method. First, the total volume of the nanocellulose suspension was measured, then measure 100 mL nanocellulose suspension from it into a vessel, and finally put it in the freeze dryer until the sample is dry. The yield equation:
19

Results and discussions
FTIR analysis for cellulose and nanocellulose
In Figure 2 (a)–(c), FTIR spectra of cellulose extracted from SJ, CF and PY by CM1 and BM2 were analyzed. In Figure 2(d), FTIR spectra of SJCNF, CFCNF and PYCNF were analyzed. All the studied cellulose and nanocellulose have an obvious wide peak around 3400 cm−1, which is the peak of stretching vibration of functional group -OH; there is also an obvious peak at 2900 cm−1, which is caused by the stretching vibration of C-H. The peak around 1640 cm−1 is the absorption peak of water molecules in cellulose, which is the stretching vibration peak of -OH; the absorption peak around 1313 cm−1 is the tensile vibration peak of C-C; the absorption peak around 1060 cm−1 is the stretching vibration peak of -O- bond; the absorption peak around 890 cm−1 is the external bending vibration peak of C-O, which is the characteristic absorption peak of cellulose. No peak was observed at around 1500 cm−1 due to the vibration of the aromatic skeleton in the lignin plane, and no peak was observed at around 1740 cm−1 due to hemicellulose.27–35 These results show that cellulose can be extracted from SJ, CF and PY by both CM1 and BM2, and there is almost no residual lignin or hemicellulose. Moreover, the peak strength of cellulose prepared by BM2 at 3400 cm−1, 1060 cm−1, 890 cm−1 is significantly higher than that prepared by chemical method and might be associated with the crystallinity of the samples.
36
The differences between cellulose and nanocellulose samples were only slight changes in strength of absorption bands. Even after cellulose is converted to nanocellulose, the functional group characteristics of cellulose remain the same. Infrared spectra of cellulose and nanocellulose: (a) Styphnolobium japonicum cellulose, (b) Cryptomeria fortunei cellulose, (c) Pinus yunnanensis cellulose, (d) nanocellulose. (a, b, c are raw materials, 1-a, 1-b, 1-c are cellulose prepared by CM1; 2-a, 2-b, 2-c are cellulose prepared by BM2; 1-A, 1-B, 1-C are CNF prepared by CM1-CPM; 2-A, 2-B, 2-C are CNF prepared by BM2-CPM.).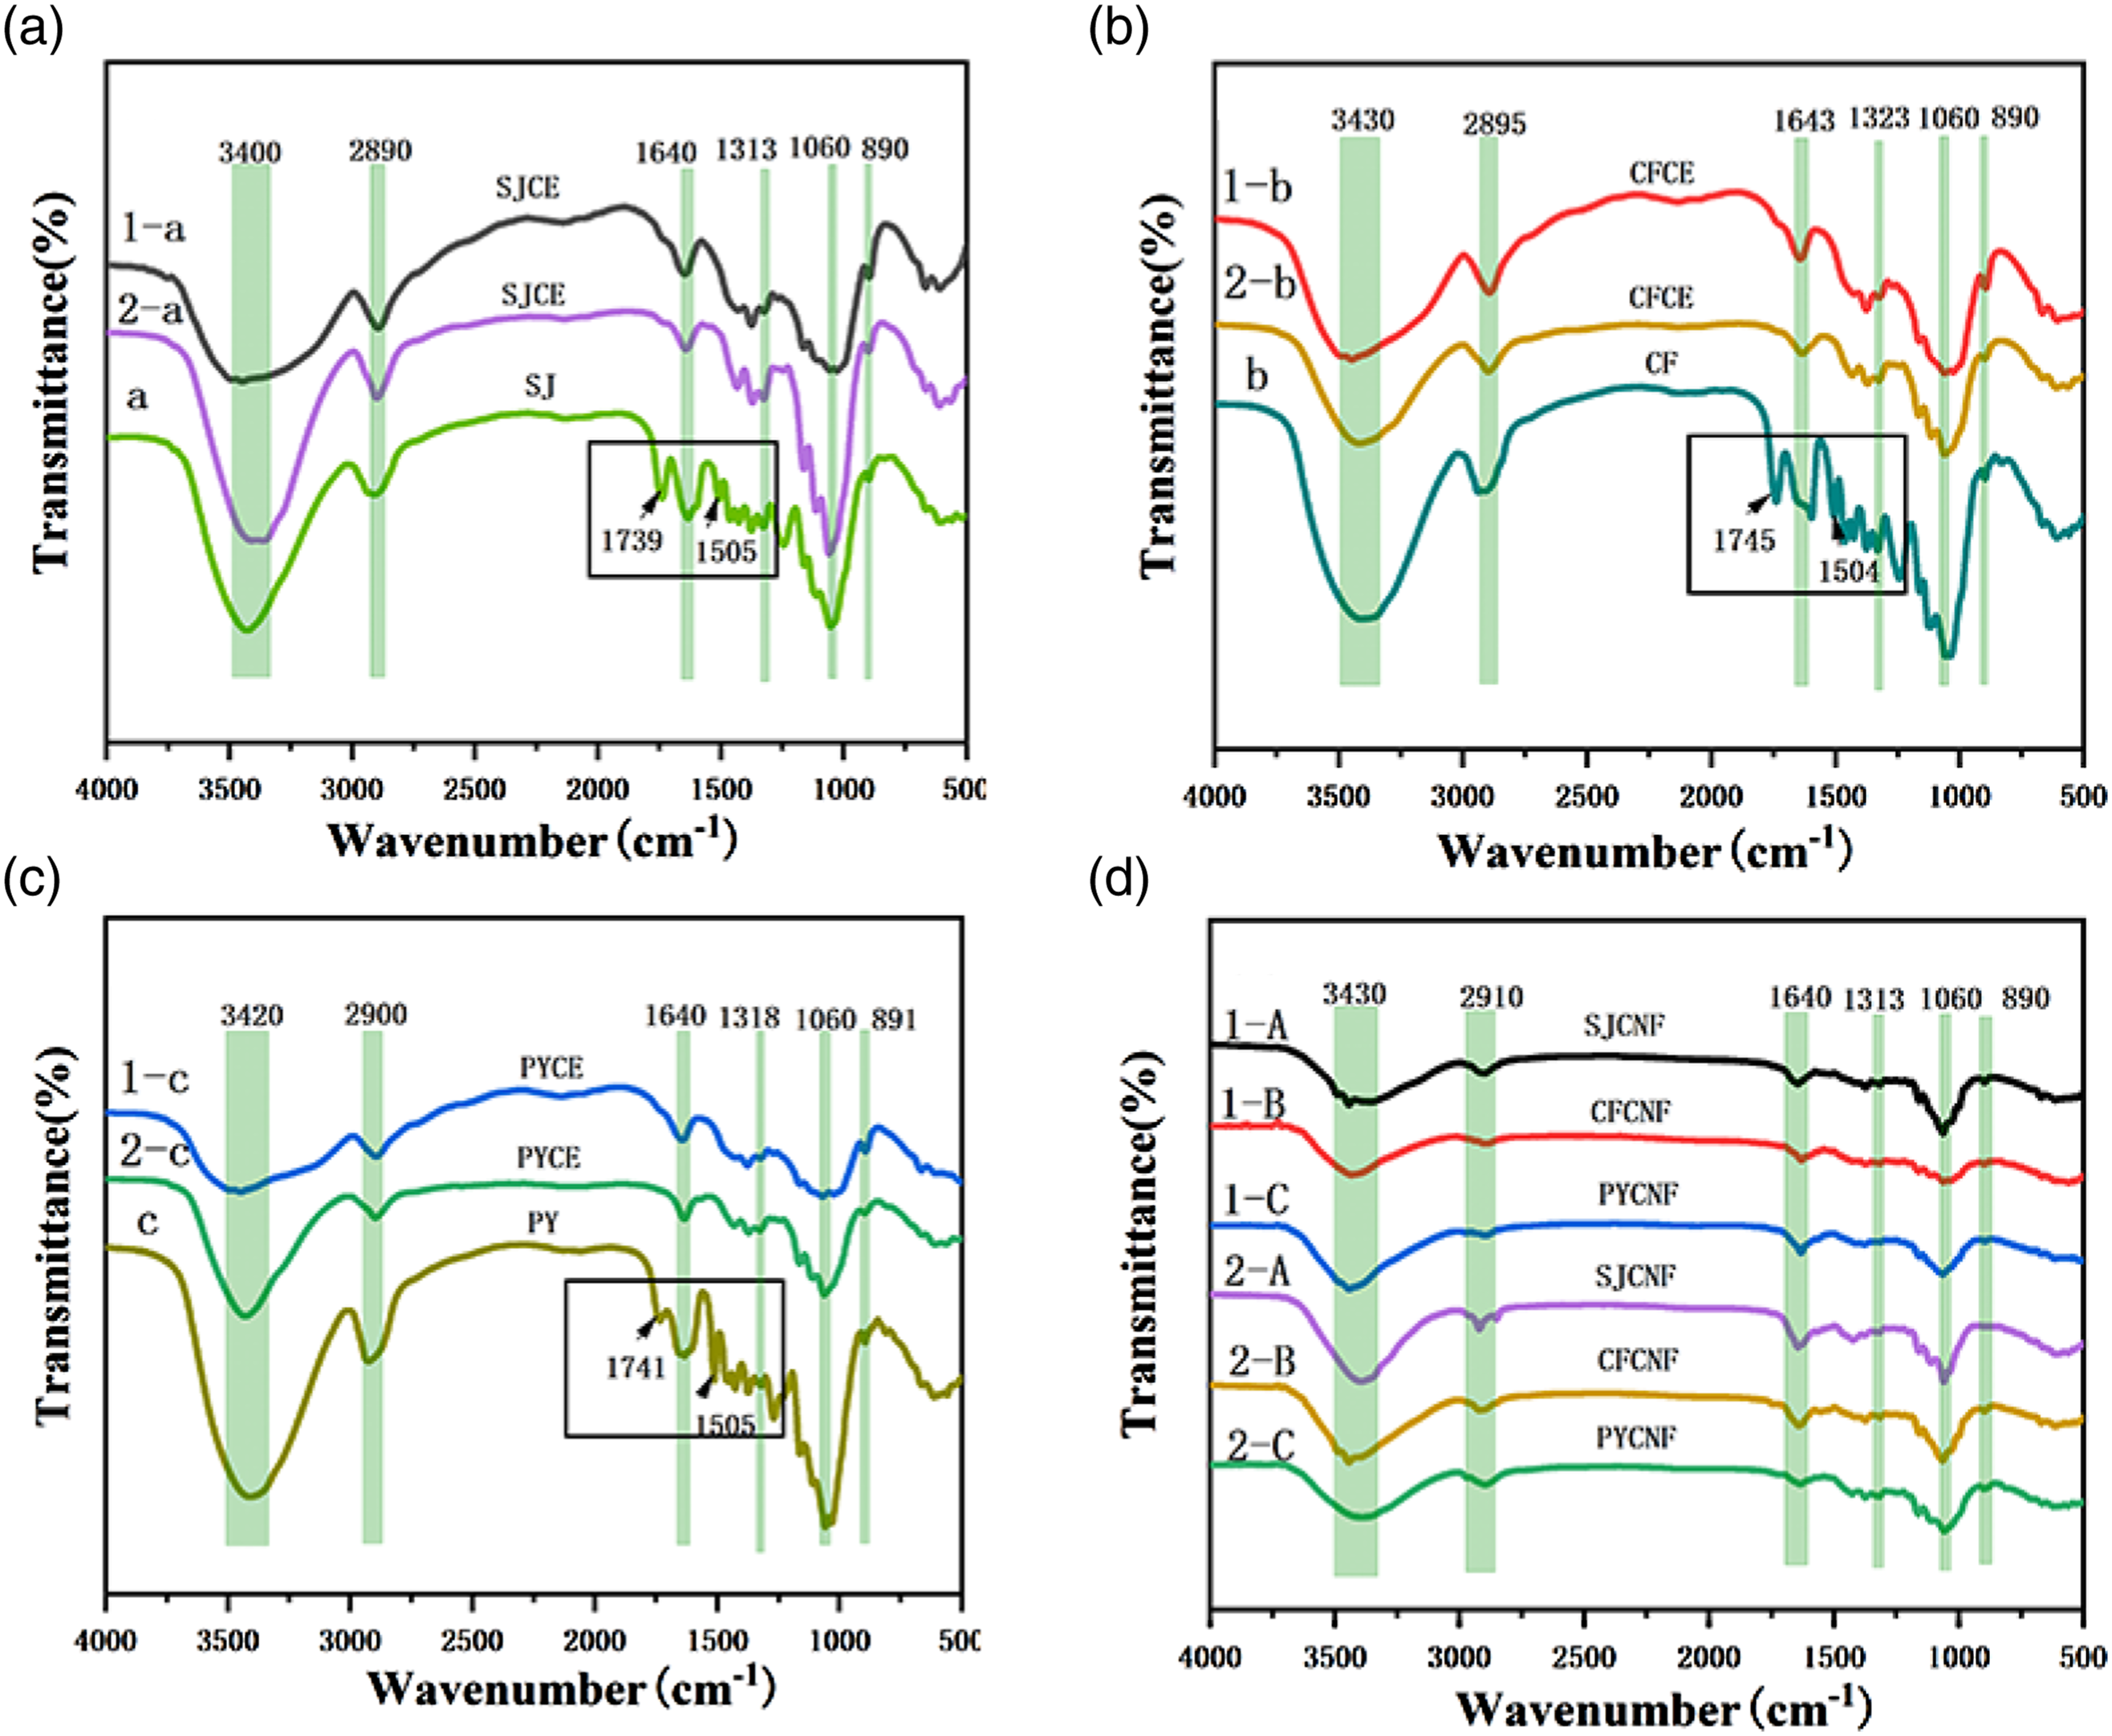
XRD analysis for cellulose and nanocellulose
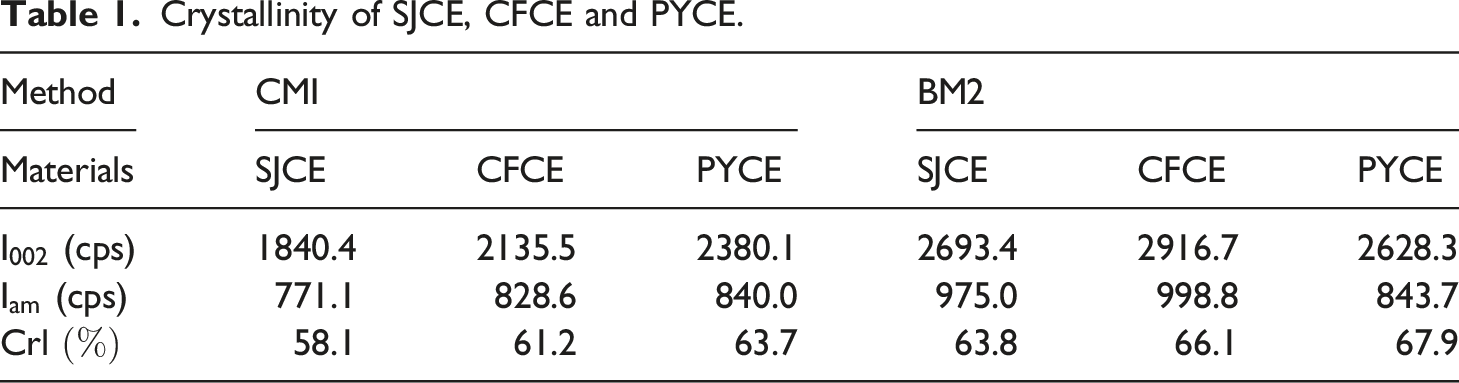
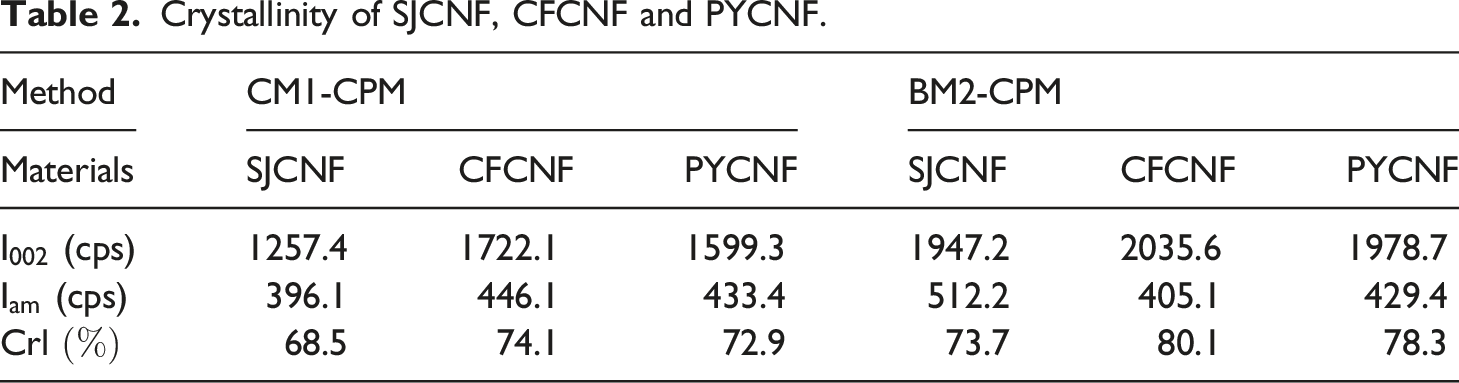
Figure 3(a) shows the XRD pattern of SJCE extracted by CM1 and BM2. The diffraction peak of the cellulose by chemical method located at 12.3° and 20.2° and 22.1°, respectively corresponding to the 101, 10 XRD patterns of cellulose and nanocellulose: (a) Styphnolobium japonicum cellulose, (b) Cryptomeria fortunei cellulose, (c) Pinus yunnanensis cellulose, (d) nanocellulose (a, b, c as raw materials, 1-a, 1-b, 1-c are cellulose prepared by CM1; 2-a, 2-b, 2-c are cellulose prepared by BM2; 1-A, 1-B, 1-C are CNF prepared by CM1-CPM; 2-A, 2-B, 2-C are CNF prepared by BM2-CPM.). Crystallinity of SJCE, CFCE and PYCE. Crystallinity of SJCNF, CFCNF and PYCNF. Chemical composition of SJCE, CFCEF and PYCE.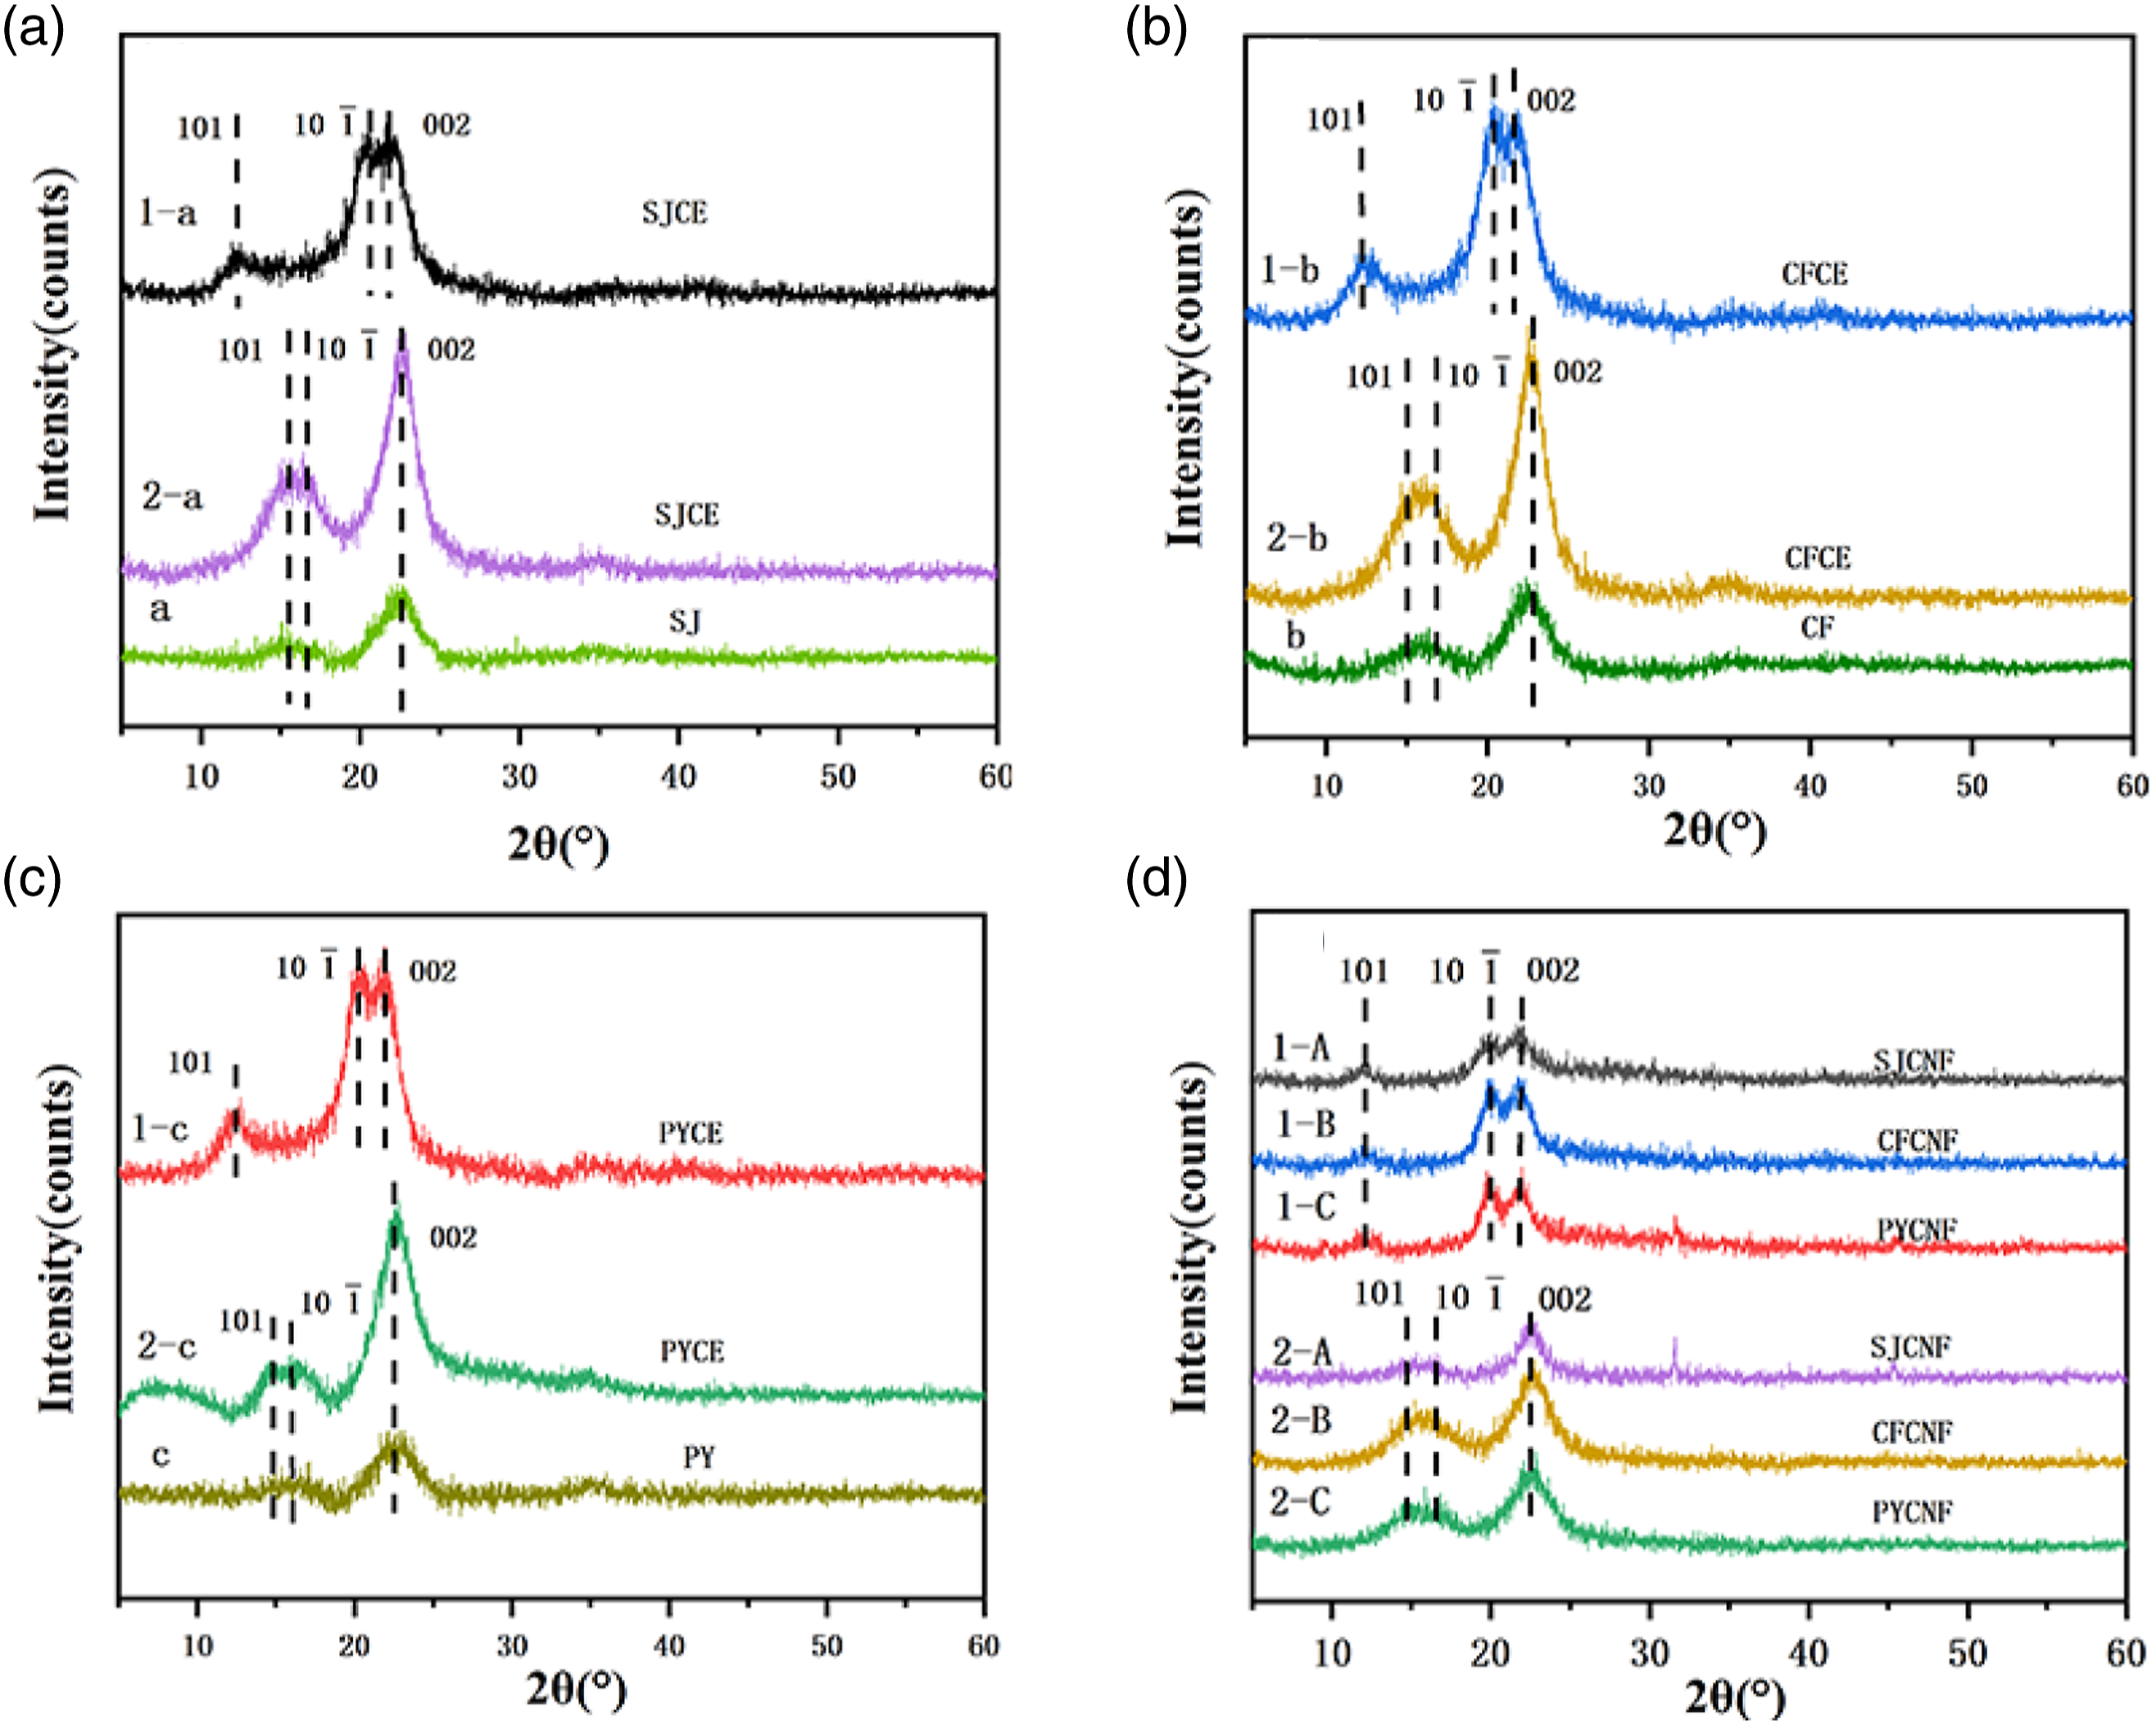
SEM analysis of cellulose and nanocellulose
Figure 4 shows SEM images of cellulose prepared by the chemical method and enzyme method. Among them, 1-a, 1-b, 1-c are the cellulose extracted by CM1 from SJ, CF and PY, and 2-a, 2-b, 2-c are the cellulose extracted by BM2 from SJ, CF and PY. As a whole, in Figure 4 (1-a, 1-b, and 1-c) it can be observed that the cellulose has a linear bundle morphology
41
and the overall area exposed to air is relatively small and the surface is relatively rough. The efficiency of hydrolysis is affected by the strength of acid, hydrolysis time, and hydrolysis temperature.
46
Therefore, artificial agitation during mercerization with NaOH can lead to uncertainties and uneven experimental reactions, resulting in a small surface area of cellulose that is not smooth. However, in Figure 4 (2-a, 2-b, and 2-c) demonstrate that cellulose possesses a flake morphology with an increased surface area and greater exposure to air. This facilitates more thorough reactions and serves as the foundation for further nanocellulose preparation. This is because the use of chemical pretreatment in the early stage destroys the frame structure formed by hemicellulose and lignin, resulting in enlarged pores.
47
With subsequent treatment using biological enzymes (pectinase, hemicellulase and laccase), enzyme molecules can directly enter the pores, react with cellulose, and improve conversion efficiency. SEM images of cellulose of (a) Styphnolobium japonicum, (b) Cryptomeria fortunei and (c) Pinus yunnanensis (1 is cellulose prepared by CM1; two is cellulose prepared by BM2).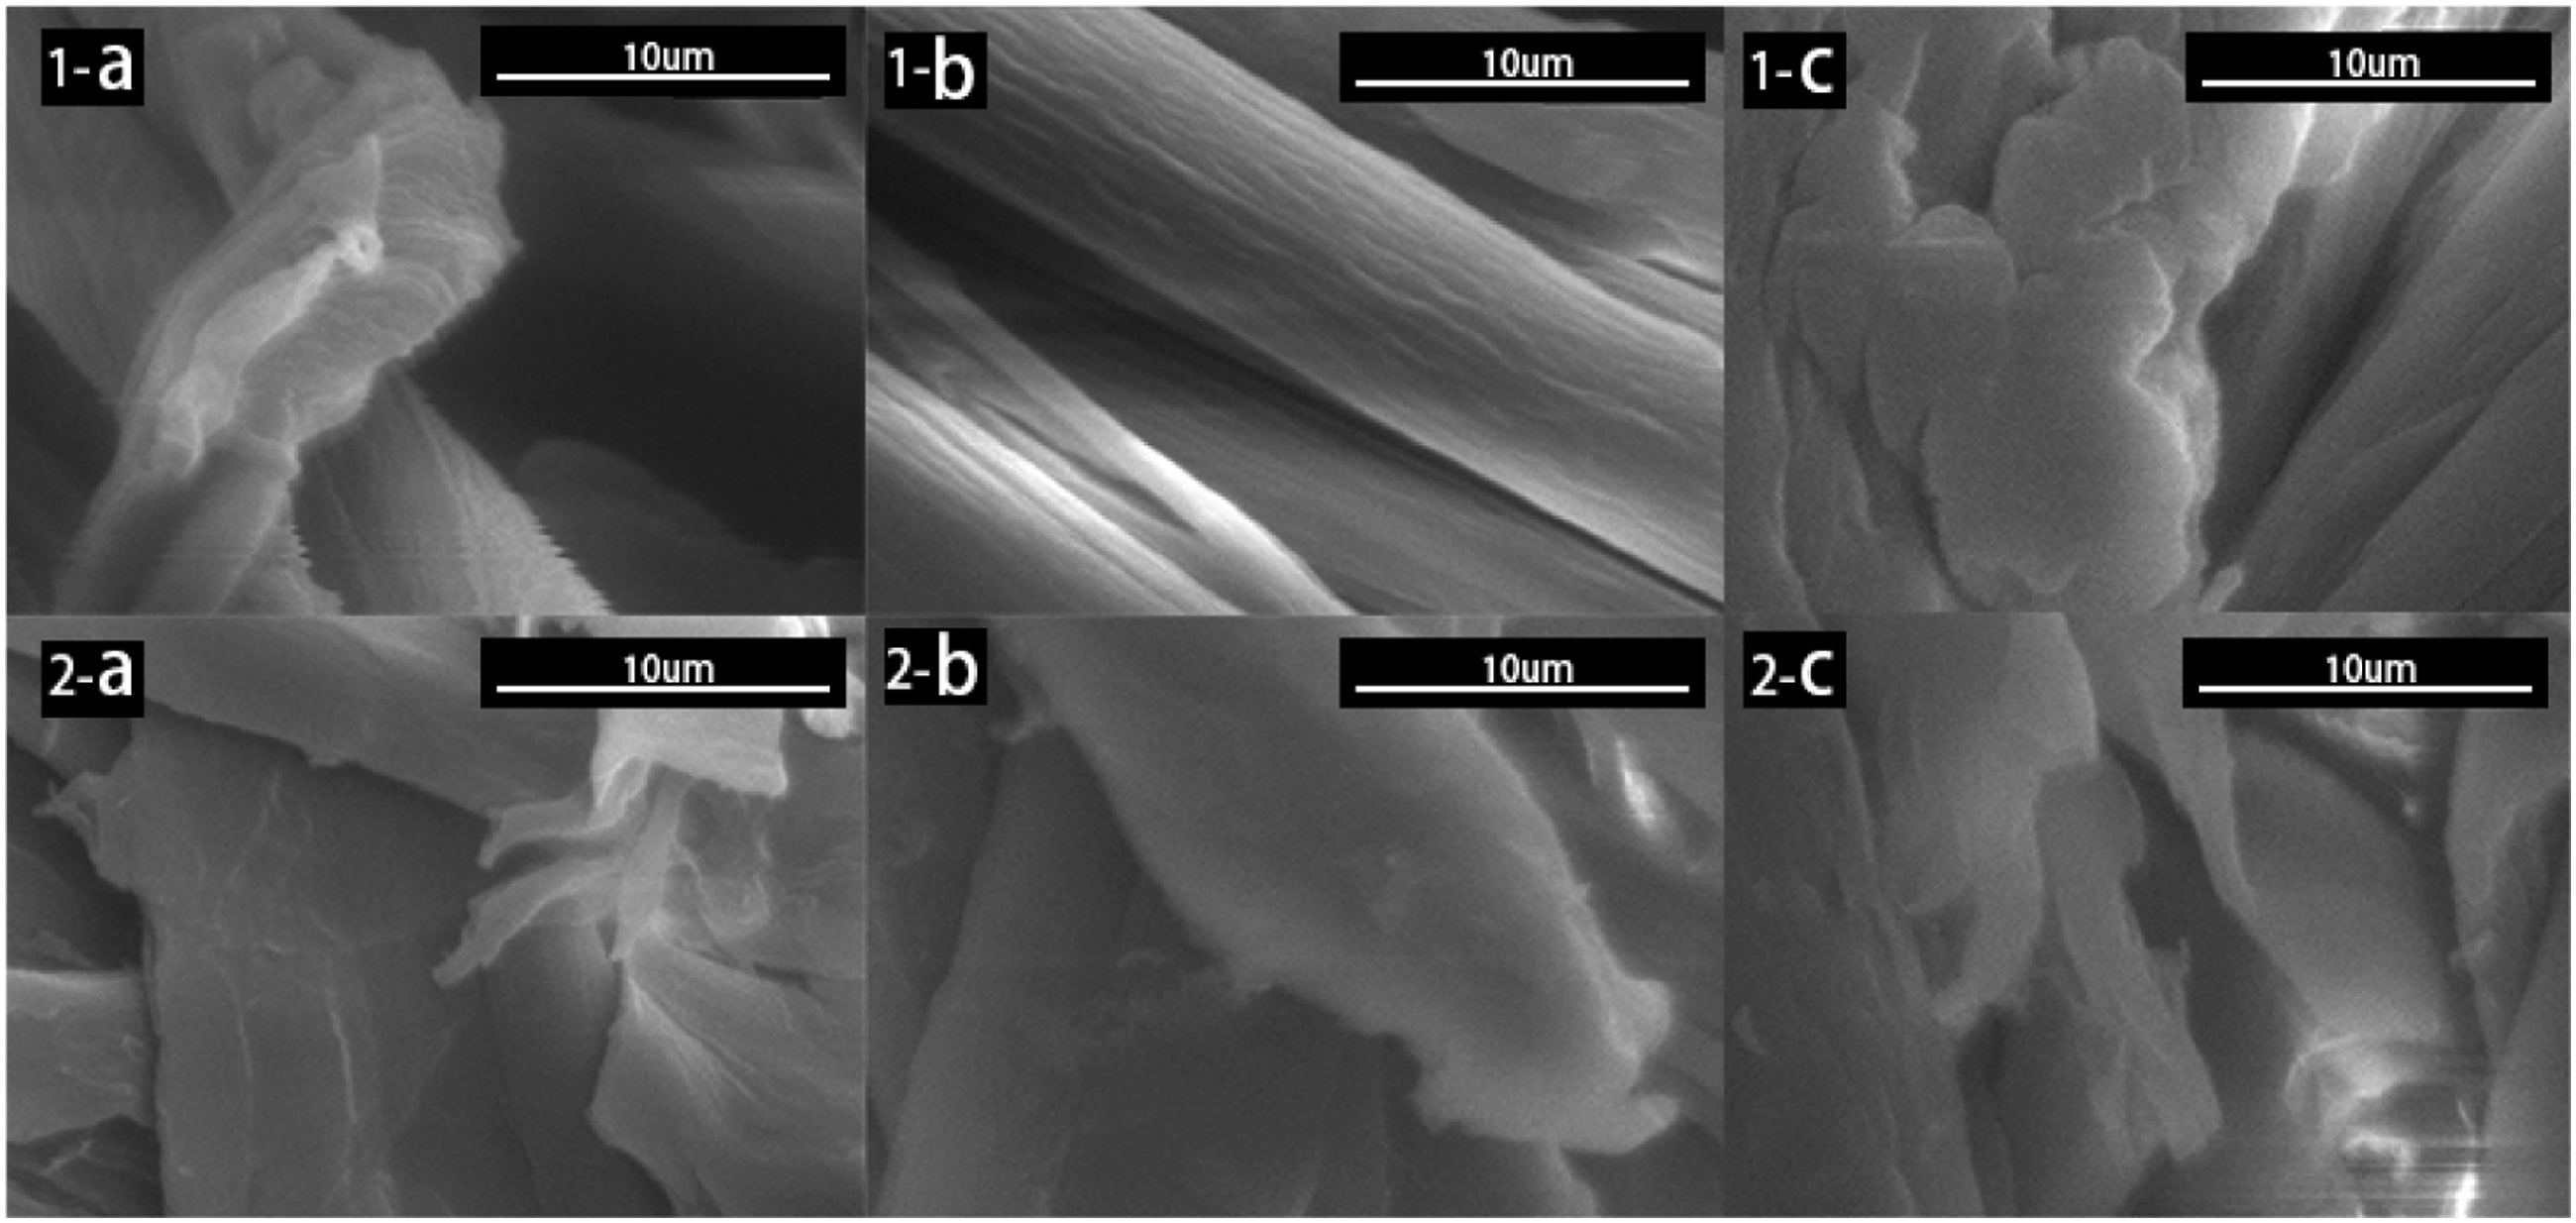
Nanocellulose can be divided into nanocellulose crystals (CNC) and nanocellulose fibers (CNF) according to their morphology. From SEM image of nanocellulose in Figure 5, it can be observed that nanocellulose prepared by the enzyme method is CNF with the diameter at the nanometer level. They are interwoven to form a 3D network structure, which has a significant impact on the mechanical properties of CNF suspensions due to its highly entangled network.44 Image J software was used to measure the diameter fibers of SJCNF, CFCNF and PYCNF in SEM images, which was listed in Table 3. It can be seen that the average diameter of SJCNF is 88.2 nm (CM1-CPM) and 60.5 nm (BM2-CPM). The diameters of CFCNF were 62.6 nm (CM1-CPM) and 31.6 nm (BM2-CPM). The diameters of PYCNF were 142.2 nm (CM1-CPM) and 81.1 nm (BM2-CPM). As shown in the histogram of diameter distribution of CNF Figure 6. SEM images of CNF of (A) Styphnolobium japonicum, (B) Cryptomeria fortunei and (C) Pinus yunnanensis (1 is CNF prepared by CM1-CPM; two is CNF prepared by BM2-CPM.). Histogram of CNF diameters of (a) Styphnolobium japonicum, (b) Cryptomeria fortunei and (c) Pinus yunnanensis (1 represents CNF prepared by CM1-CPM, two represents CNF prepared by BM2-CPM).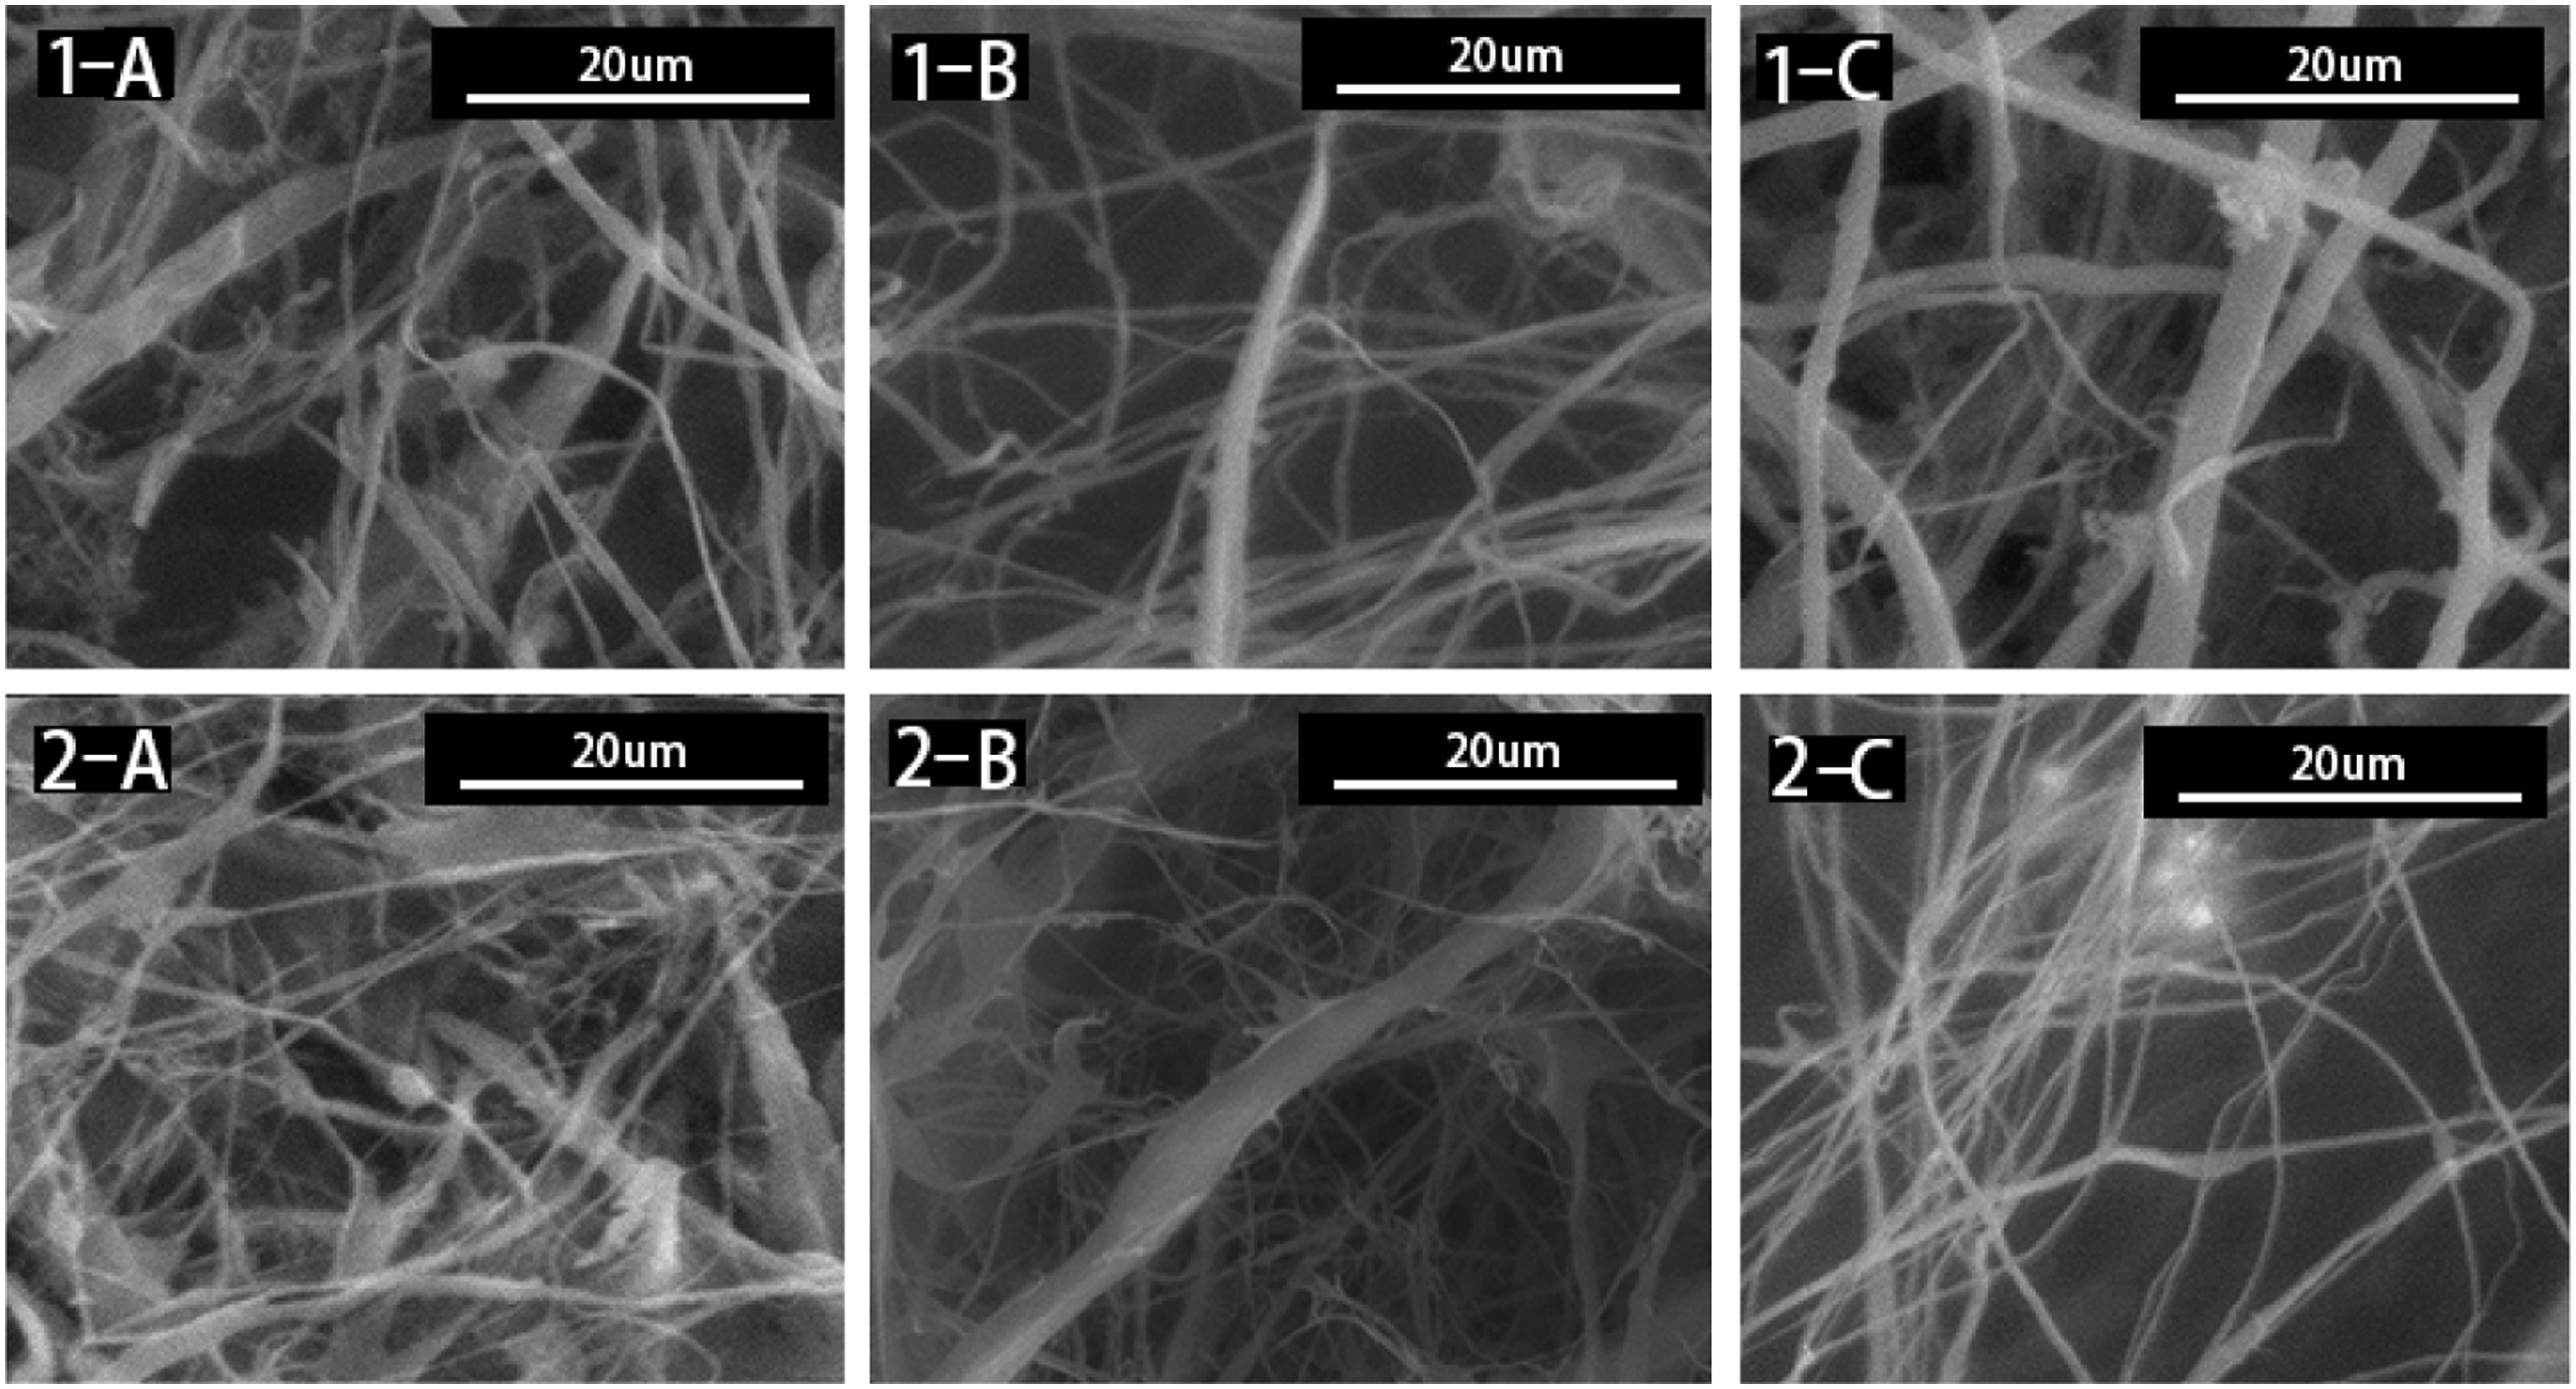
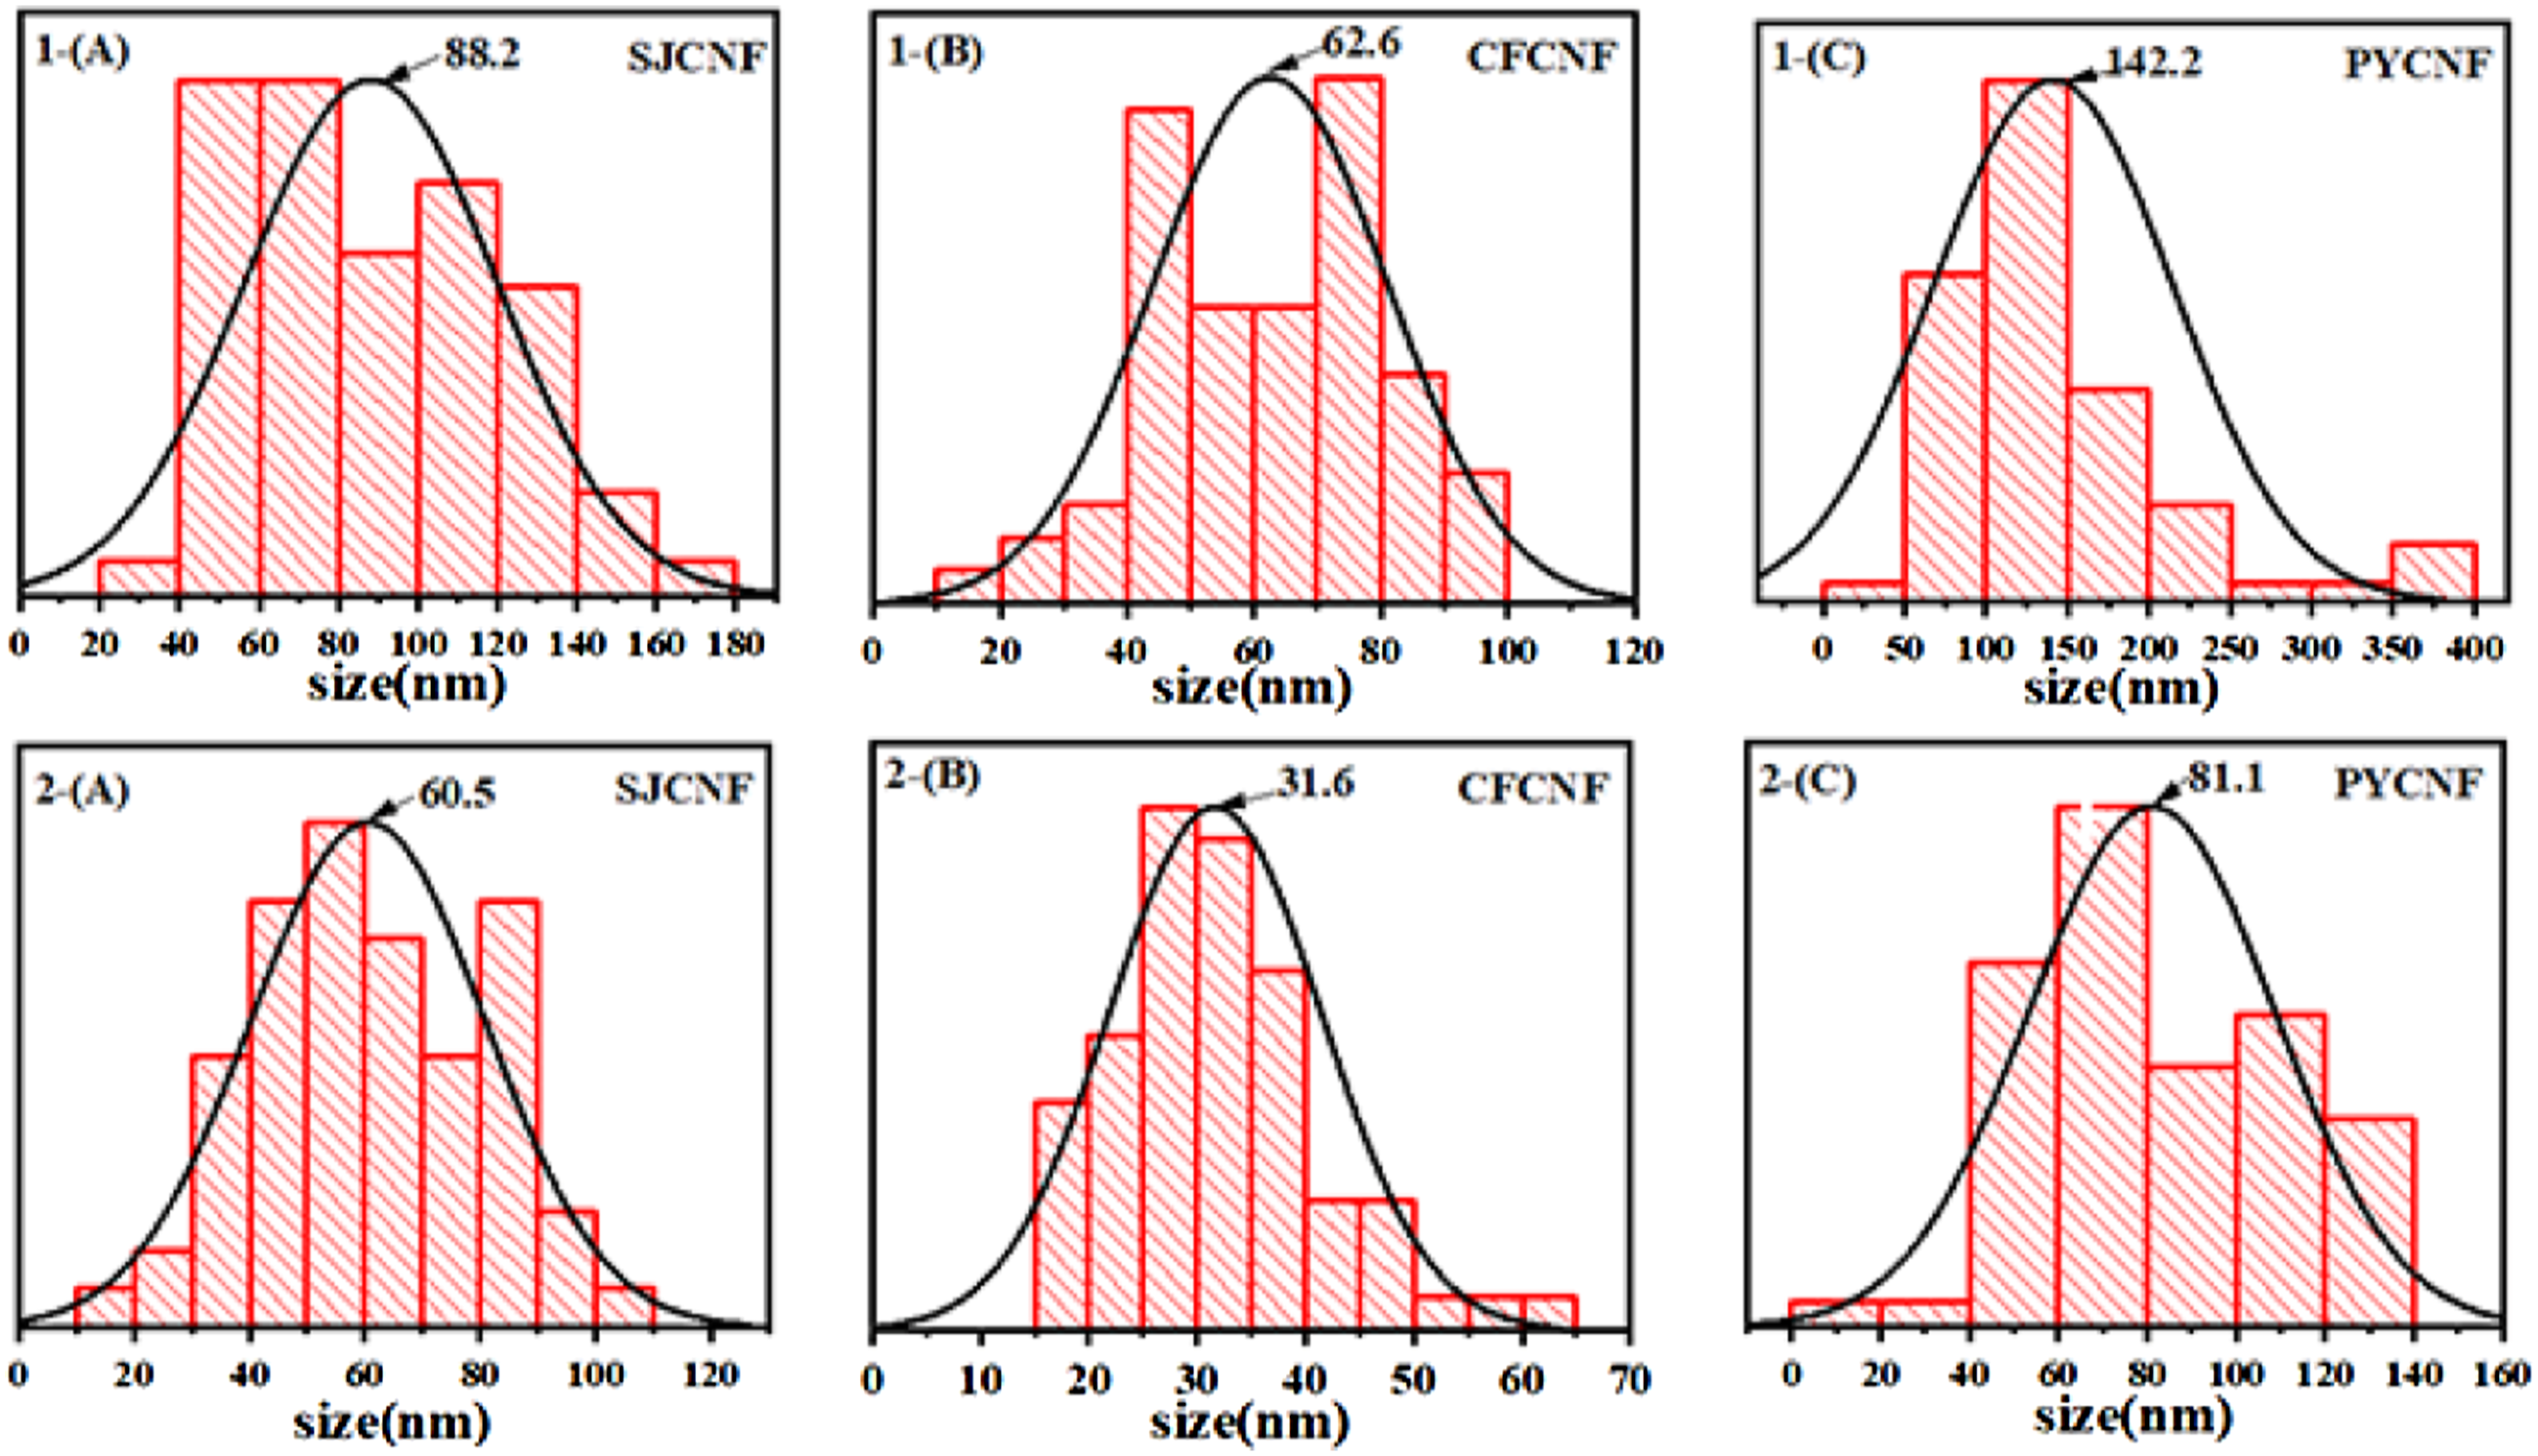
Histogram in Figure 6, CNF prepared by BM2-CPM is more uniform. For SJCNF (1-a, 2-a in Figure 5), the CNF shows a flat shape and the fiber surface is damaged, which is due to the release of more short fibers from the fiber surface by enzymatic hydrolysis. 42 For CFCNF (1-b, 2-b in Figure 5), the network structure is closer and more interwoven, which is due to the self-assembly by strong hydrogen bonds during freeze-drying. 44 For PYCNF (1-C, 2-C Figure 5), the shape is more like a long column and the mesh is less dense than other materials, the size is more uniform, but nanocellulose has the largest diameter of the three materials. Therefore, the size and properties of nanocellulose prepared from different materials by different methods are different.
Analysis of chemical composition of cellulose and yield of nanocellulose
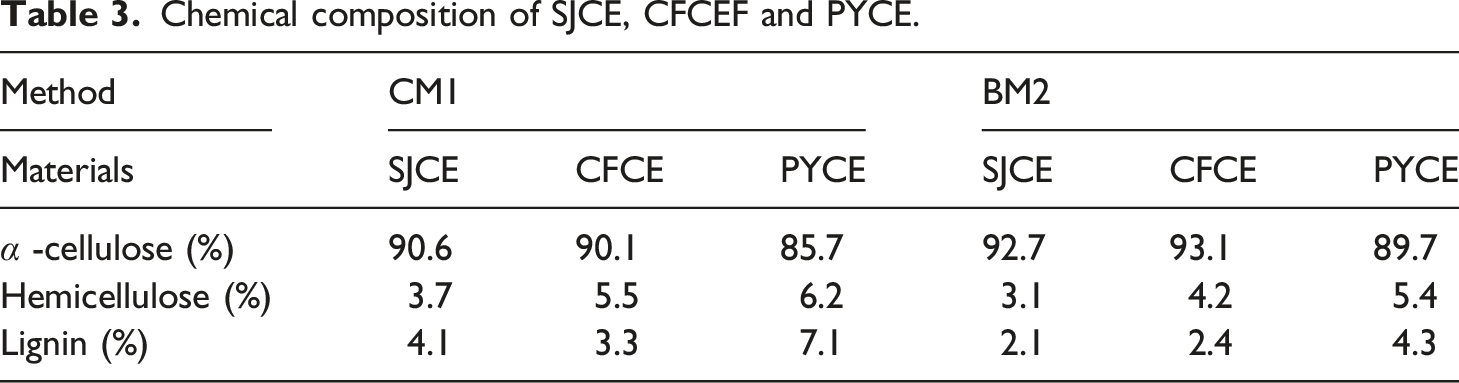
Figure 7 shows images of cellulose prepared by the chemical method and enzyme method. Visually, cellulose prepared by both methods yielded white cellulose, indicating that most non-cellulose (hemicellulose, pectin, lignin, etc.) components were removed. Cellulose prepared by chemical method retains its rod-like structure in appearance. The whole structure of cellulose prepared by enzymes method is broken down and the cellulose becomes very fluffy. Table 3 shows the chemical composition of cellulose extracted from SJ, CF and PY. The results indicate that the content of cellulose by CM1 method is 85%–91% and the content of cellulose by BM2 method is 89%–93%, while the cellulose content in the raw material is 50%–60% due to excessive non-cellulose impurities. Nguyen et al.
2
and Li et al.
41
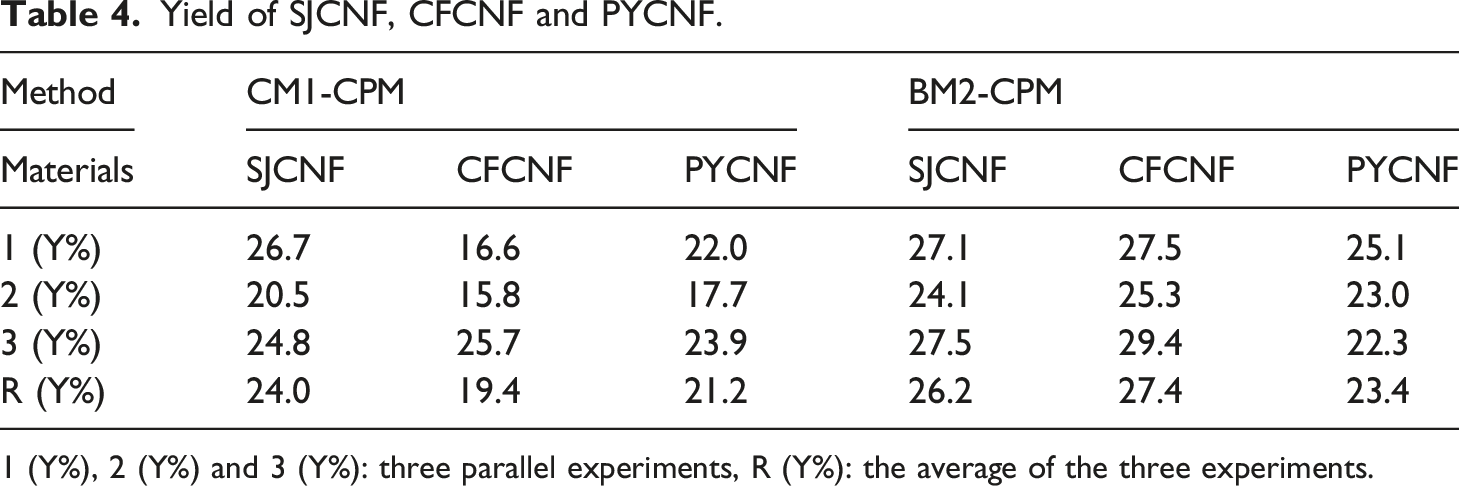
have pointed out that the use of chemical and biological enzymatic methods can effectively remove non-cellulose from wood, thereby increasing the cellulose content. The cellulose prepared by BM2 method had lower content of lignin and hemicellulose compared to that prepared by CM1 method, which is possibly due to the use of biological enzymes such as pectinase, hemicellulase, and laccase. It can effectively break down pectin, hemicellulose, and lignin, which play important roles in cell wall interactions, particularly in primary cell wall formation. Disrupting these components may facilitate cellulose extraction. Cellulose prepared by biological enzymes and chemical methods was further processed into nanocellulose using biological enzymes methods (pectinase and cellulase). As shown in Table 4, the yields of nanocellulose prepared by the CM1-CPM method were 24.0%(SJCNF), 19.2%(CFCNF), and 21.2%(PYCNF), respectively, while those prepared by the BM2-CPM method were 26.2%(SJCNF), 27.4%(CFCNF), and 23.4%(PYCNF). Ilyas et al.48 hydrolyzed palm fiber tree candy with acid, and the yield of nanocellulose was between 10%-30%. Thomas et al.49 used different enzymes to hydrolyze eucalyptus pulp, yielding between 10% and 13% nanocellulose. Compared to the CM1-CPM method, the BM2-CPM method yields higher and is more practical for preparing nanocellulose. Nanocellulose was prepared using the BM2-CPM method. SJ and CF have greater potential for sustainable development in nanocellulose preparation compared to PY. Because the BM2 process is used in process is used in cellulose preparation, non-cellulose impurities are removed more thoroughly (refer to Table 3). Therefore, when pectinase and cellulase are used for crosslinking in the CPM method during nanocellulose preparation, they can be targeted at the non-crystalline zone of cellulose more precisely. This will result in greater breakdown of cellulose and a higher yield of nanocellulose. images of cellulose of (a) Styphnolobium japonicum, (b) Cryptomeria fortunei and (c) Pinus yunnanensis (1 is cellulose prepared by CM1; two is cellulose prepared by BM2). Yield of SJCNF, CFCNF and PYCNF. 1 (Y%), 2 (Y%) and 3 (Y%): three parallel experiments, R (Y%): the average of the three experiments.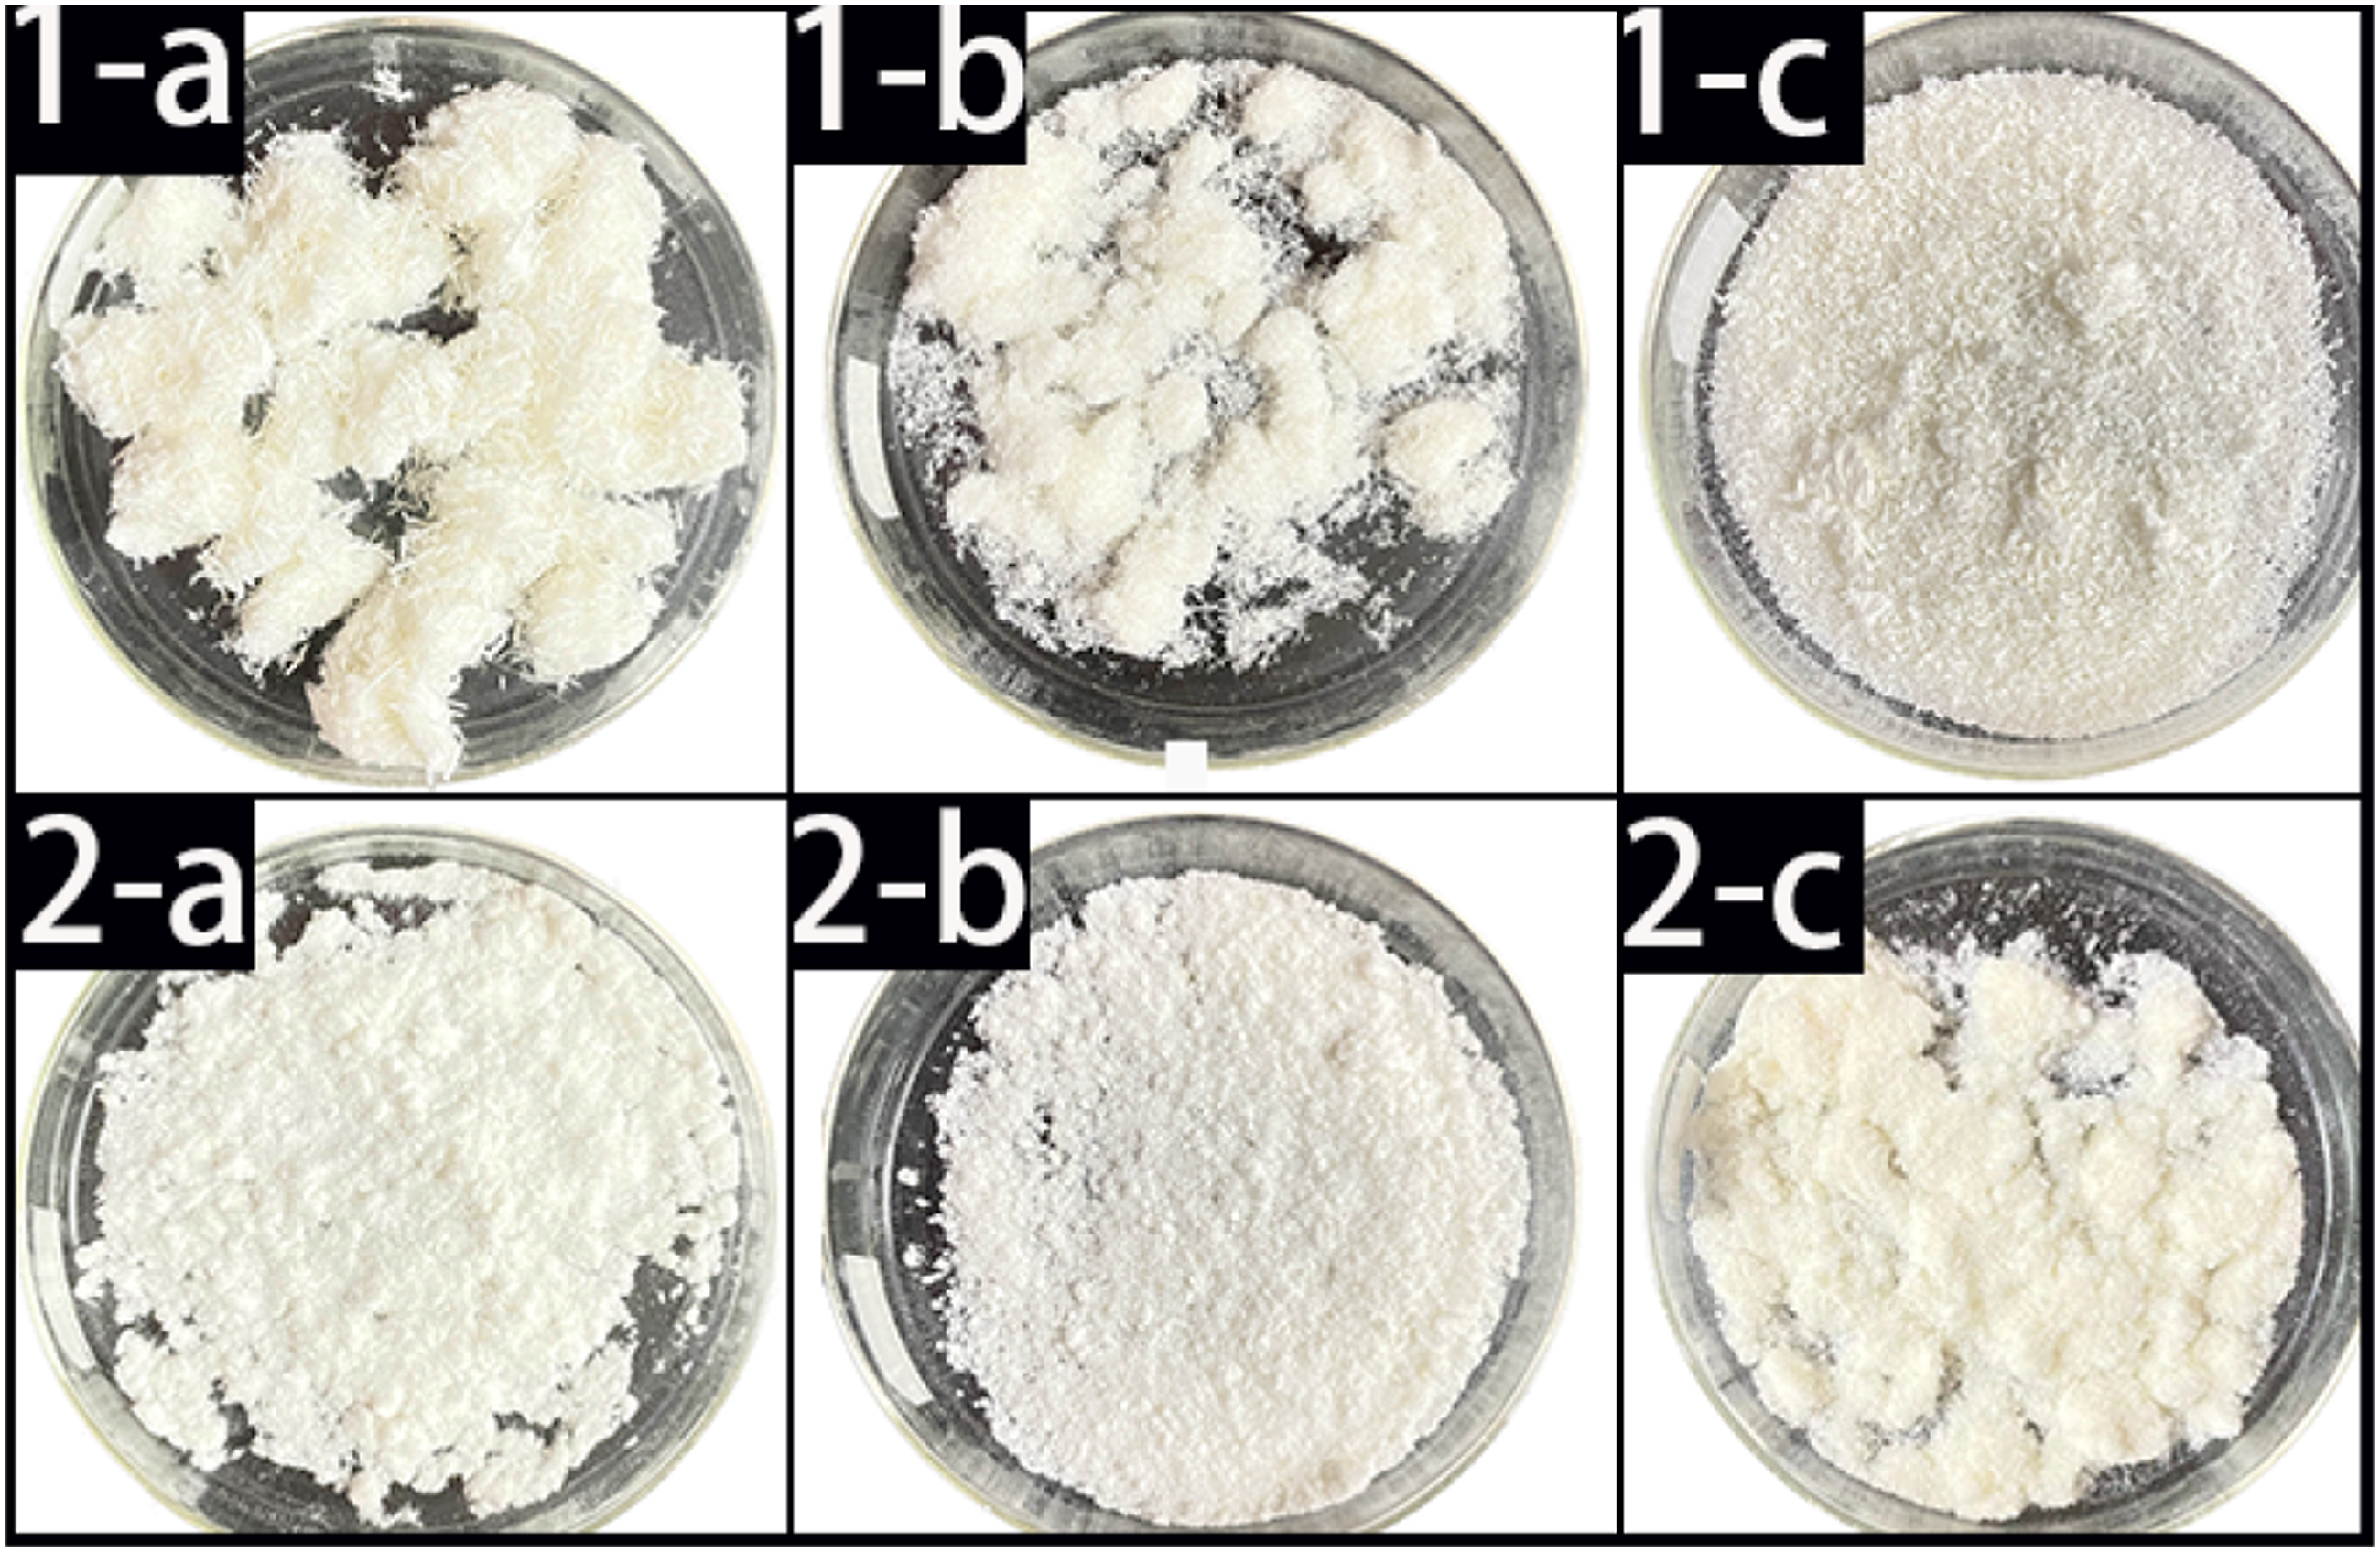
Nanocellulose fiber DSC and TG analysis
Differential scanning calorimetry (DSC) is an analytical method to assess the thermal degradation of organic and inorganic compounds. Figure 8 shows DSC plots for SJCNF, CFCNF and PYCNF prepared by CM1-CPM and BM2-CPM as a function of temperature. Related studies have demonstrated that the endothermic peak is related to the presence of crystalline regions. In the extraction process, nanocellulose substances are removed, and the temperature required for the endothermic peak is lower.50,51 The temperature required for the endothermic peak of CNF prepared by BM2-CPM showed a lower temperature, the CNF prepared by CM1-CPM, confirming the CNF prepared by BM2-CPM had a higher crystallinity. So, the DSC confirming that the CNF prepared by BM2-CPM had a higher crystallinity than the CNF prepared by CM1-CPM. DSC graph of CNF: (a) Styphnolobium japonicum, (b) Cryptomeria fortunei, (c) Pinus yunnanensis (1-A, 1-B, 1-C is nanocellulose prepared by CM1-CPM; 2-A, 2-B, 2-C is CNF prepared by CM2-CPM).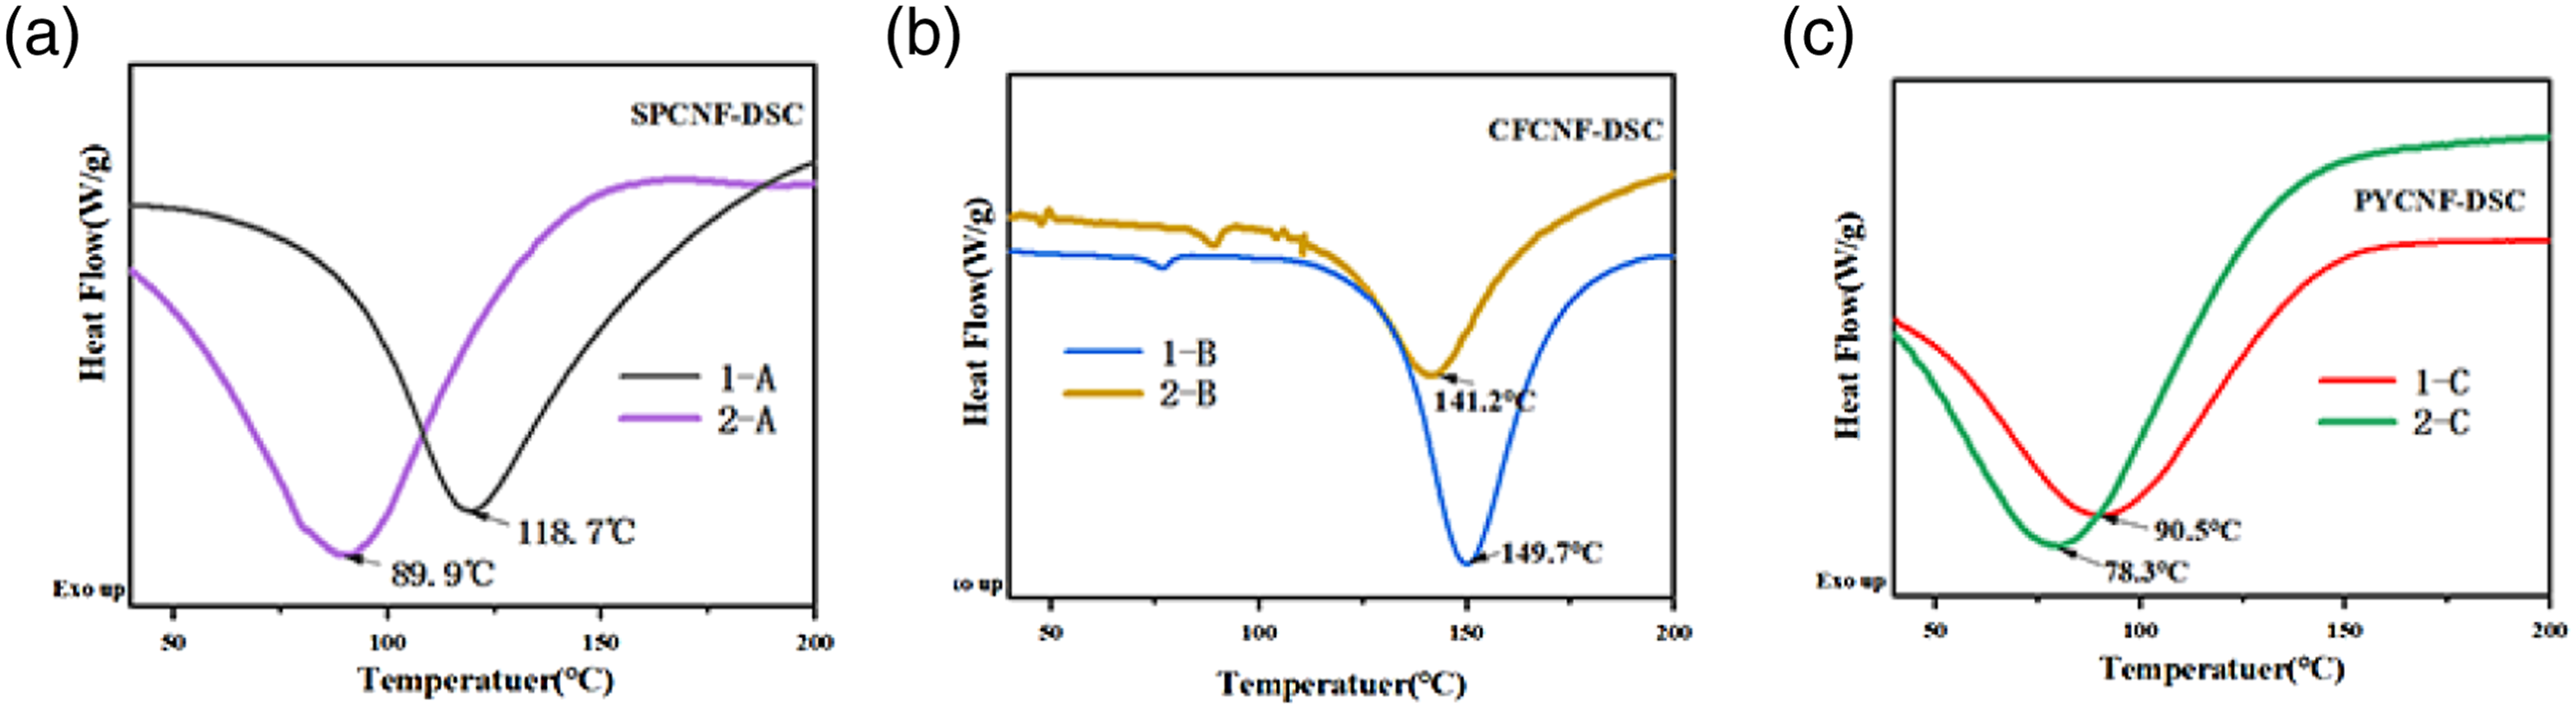
Thermogravimetric analysis was performed on the nanocellulose of CF because of its smaller diameter. Figure 9(a) and (b) show the curve of TG and DTG of CNF prepared by CM1-CPM and BM2-CPM. In Figure 9, three stages of CNF decomposition can be observed. The first stage, the powder mass loss (less than 10%) of CNF between 45°C and 150°C is mainly due to the evaporation of water and volatile substances in CNF. 52 The second stage, In Figure 9(b), the peak in Curve 2-B at around 250°C marks the beginning of the rapid pyrolysis stage. This phase, a small amount of depolymerization, internal recombination and “glass transition” occur in the biomass raw materials, 53 which release some small molecular compounds to prepare for rapid thermal degradation. The third stage, In Figure 9(a), it can be seen that the initial degradation temperature of 1-B is about 243°C, while that of 2-B is about 261°C, indicating that 2-B has good thermal stability (The higher the initial degradation temperature, the greater the thermal stability. 54 ). The maximum degradation temperature of curve 1-B is 335°C, while that of curve 2-B is 338°C. The maximum decomposition temperature of nanocellulose is closely related to its size and surface area. 55 It can be clearly seen from the scanning electron microscope in Figure 5 that the average size and surface area of 2-B are smaller, indicating a higher maximum thermal degradation temperature. Furthermore, the mass loss of the CFCNF in curve 2-B is 44% at the highest thermal degradation temperature, while that in curve 1-B is 69%. It can be seen that 2-B has better thermal stability. As the temperature continues to increase, the CFCNF thermal decomposition until complete carbonization. 56 As can be seen from Figure 9(a), the residual mass of CFCNF in curves 1-B is about 22%, while that in curves 2-B is about 48%. The more residual mass is left, it means that the substance is difficult to decompose. Therefore, curve 2-B has better thermal stability. This may be because the biological enzyme method used to prepare cellulose destroys more amorphous regions, resulting in increased crystallinity (80.1% for CFCNF prepared by BM2-CPM(2-B) and 74.1% for CFCNF prepared by CM1-CPM(1-B) 57 ), which makes it difficult to degrade the nanocellulose. Based on the aforementioned decomposition stages, it can be concluded that CFCNF prepared by BM2-CPM exhibits better thermal stability than CM1-CPM.
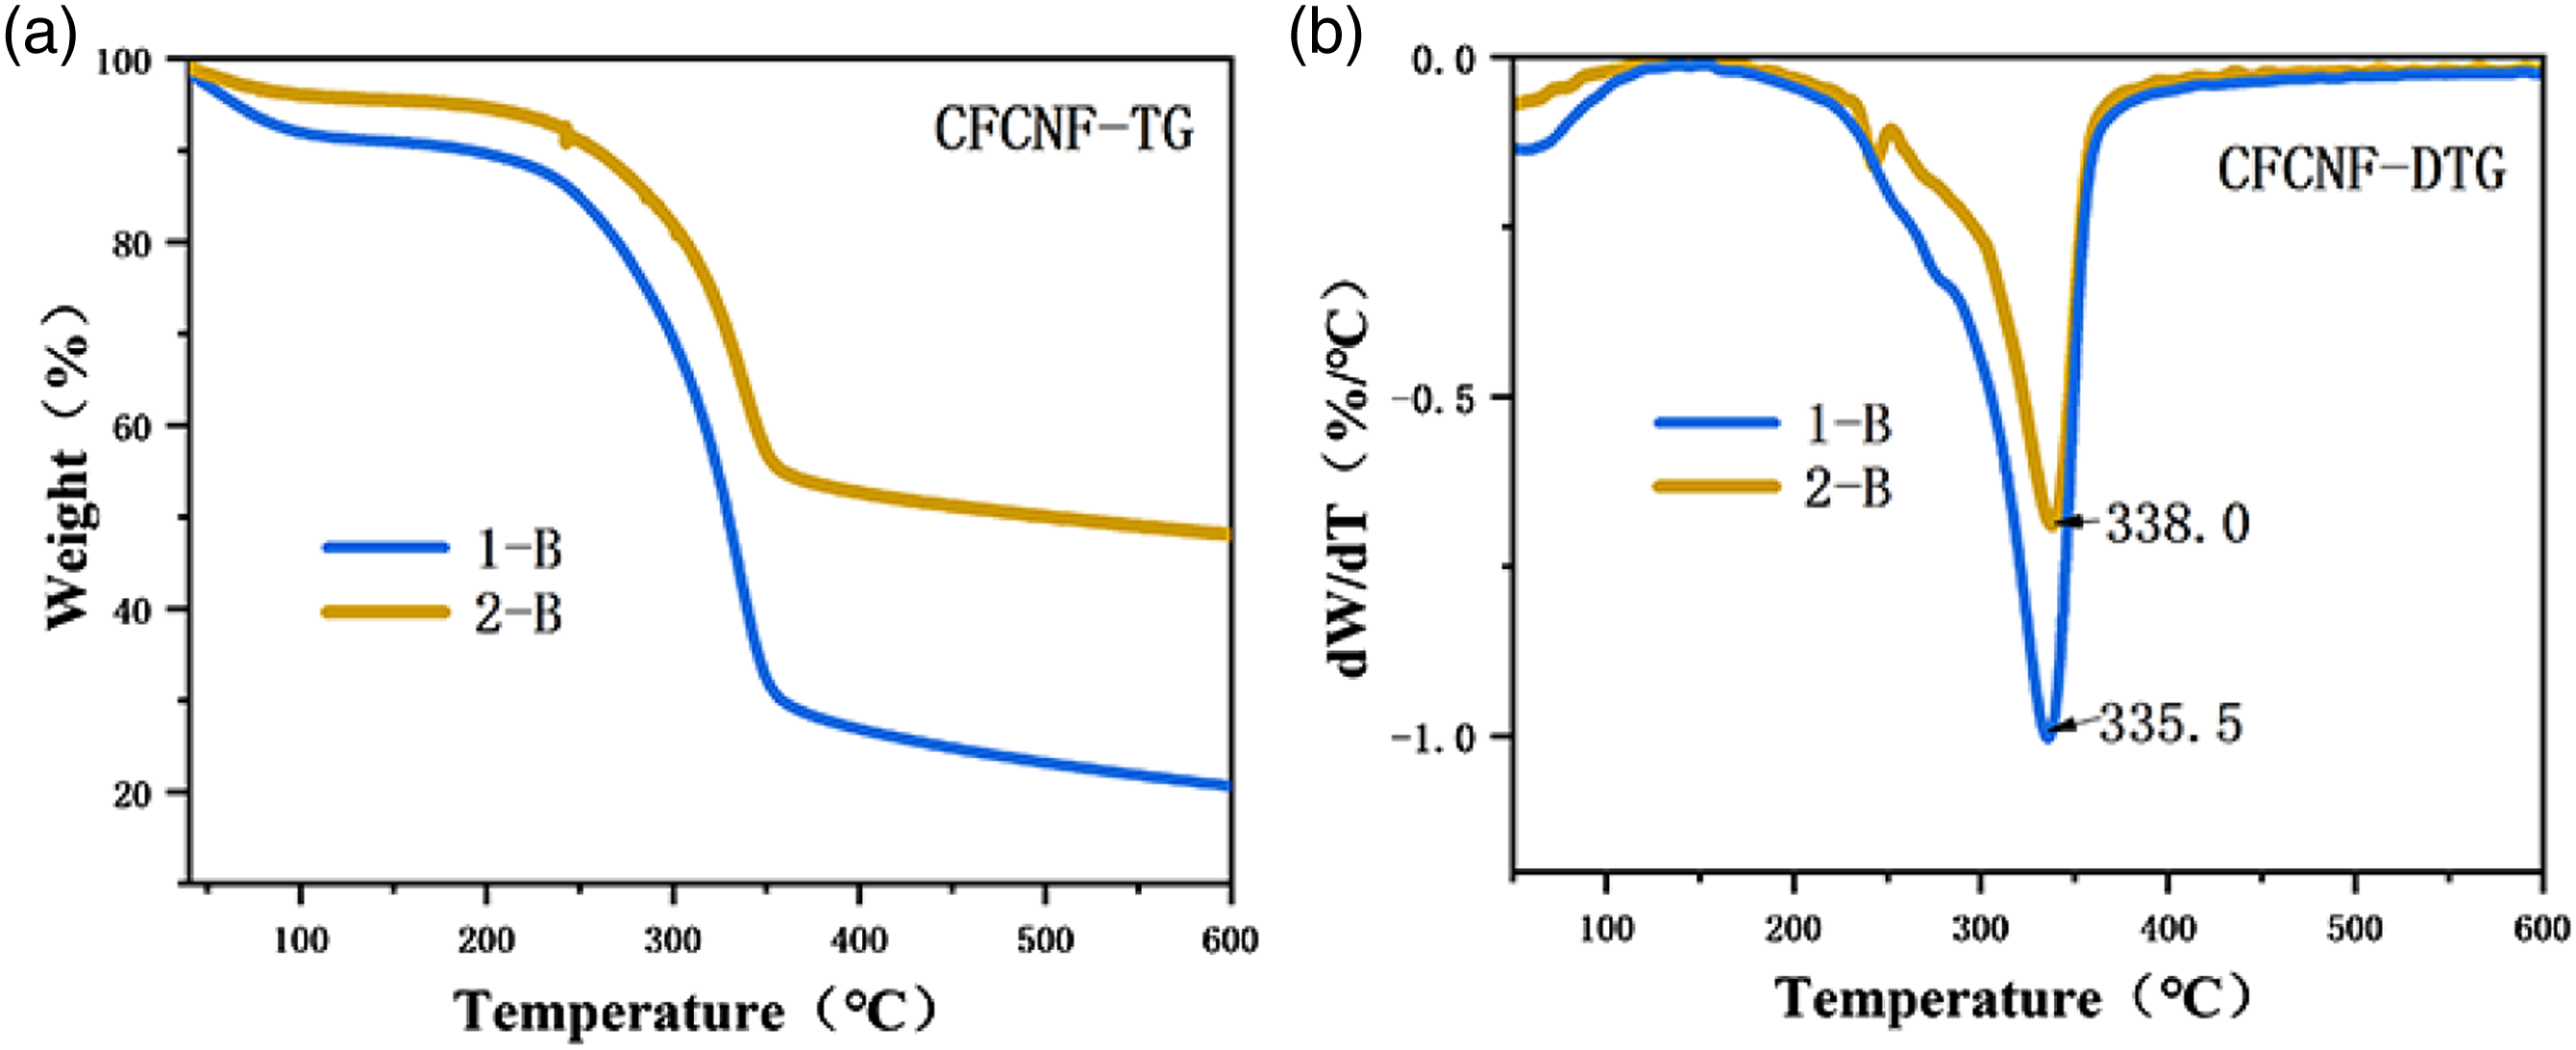
(a) TG curve of Cryptomeria fortunei CNF, (b) DTG curve of Cryptomeria fortunei CNF (1-B is CNF prepared by CM1-CPM; 2-B is CNF prepared by BM2-CPM).
Conclusions
Cellulose was prepared from SJ, CF and PY by chemical method and biological enzyme method 2, respectively. Nanocellulose was obtained from the prepared cellulose by biological enzyme method one treatment. The CNF prepared by CM1-CPM was cellulose Ⅱ with a crystallinity of 68.5% (SJCNF), 74.1% (CFCNF) and 72.9% (PYCNF), respectively’ The yields was 24.0% (SJCNF), 19.4% (CFCNF) and 21.2% (PYCNF). The CNF prepared by BM2-CPM was cellulose I with crystallinity of 73.7% (SJCNF), 80.1% (CFCNF) and 78.3% (PYCNF), respectively. The yields were 26.2% (SJCNF), 27.4% (CFCNF) and 23.4% (PYCNF). The crystallinity of CNF prepared by BM2-CPM was higher than that of CNF prepared by CM1-CPM.The average diameter of CNF prepared by CM1-CPM is 88.2 nm (SJCNF), 62.6 nm (CFCNF) and 142.2 nm (PYCNF), and the average diameter of CNF prepared by BM2-CPM is 60.5 nm (SJCNF), 31.6 nm (CFCNF) and 81.1 nm (PYCNF). The thermal degradation analysis of nanocellulose prepared from three kinds of raw materials showed that the nanocellulose prepared by the enzyme method had better thermal degradability. Among the nanocellulose prepared by the three raw materials, the CFCNF has the smallest diameter and the highest crystallinity. Therefore, the thermal stability of CFCNF was analyzed. It was found that the residual mass of CFCNF prepared by BM2-CPM after thermal decomposition was 48%, while the residual mass of CFCNF prepared by CM1-CPM was 22%. The CFCNF prepared by BM2 -CPM has better thermal stability. Therefore, the properties of nanocellulose prepared by BM2-CPM are optimal.
Footnotes
Declaration of conflicting interests
The author(s) declared no potential conflicts of interest with respect to the research, authorship, and/or publication of this article.
Funding
The author(s) disclosed receipt of the following financial support for the research, authorship, and/or publication of this article: This work was supported by the Open Fund of the International Joint Research Center for Biomass Materials, Southwest Forestry University (2022-GH09), the 111 Project (D21027) and the National Natural Science Foundation of China (31,870,551).