
Abstract
A growing concern of climate change and waste pollution is causing a shift in products towards green materials. The automotive industry is exploring environmentally friendly alternatives to glass fibers (GF). This research focuses on understanding interactions between constituents of biocomposites made up of basalt fiber (BF) and hemp hurd particle fiber (HF) reinforced polypropylene (PP), and statistically comparing the mechanical properties. The addition of a coupling agent has significantly improved the performance and fiber-matrix interactions in the biocomposite blends. The elastic modulus of some BF/HF/PP mixtures were comparable to the GF/PP composite; however, the GF still outperformed in strength. Rotational and capillary rheometer analysis determined the viscosities of all formulations displaying that basalt composites were consistently lower in viscosity than the glass fiber composite, indicating easier processing conditions.
Introduction
A lot of pressure has been put on major corporations in the past two decades, especially the automotive and plastics industry, to take responsibility for the damage their products have on Earth’s ecosystem and make the change to more environmentally conscious materials.1,2 Many automotive companies are working towards being more sustainable and only including recyclable or biodegradable materials in their vehicles.3,4 For this reason, renewable fibers such as basalt (BF) and hemp (HF), are being used as reinforcements to replace traditional resource intensive reinforcements such as glass fiber (GF) and carbon fiber. However, understanding the characteristics of a material is crucial to incorporate it into different products especially when consumer safety is top priority. During the material selection process, engineers examine the ultimate tensile strength (UTS), Young’s modulus (E), flexural strength (MOR) and modulus, density, viscosity, and other properties to ensure the material will hold up under specific conditions it may be exposed to during use.
It has been generally accepted that the fiber reinforcement is primarily responsible for the improvement of UTS, E, and MOR.5,6 The interfacial bonding between the BFs, HFs, and PP is critical to maximize for these composites to compete with the highly researched and optimized GF composites, especially in strength. Through substantial previous research, the use of maleic anhydride g-PP (MAPP) has shown to induce the chemical bonding effectively between BFs and most natural fibers.5,7–10 By grafting maleic anhydride groups to the backbone of the PP, the polarity of PP is increased and better matches that of the BFs. These polar chains bond to the carboxyl groups on the fiber surface. 7 The surface of natural fibers is saturated with hydroxyl groups which creates covalent and hydrogen bonds to the carbonyl groups of the MAPP.5,10 It is also believed that increased chain length and bulkiness from MAPP causes more chain entanglements of the polymer, helping the transfer of stress. Another way proven to induce bonding between the BFs and PP is through modification of the fiber surface itself.
A sizing step is applied during production of fibers to help protect them, but also to help increase the compatibility with polymers. The SiO2 base of both GFs and BFs is advantageous when incorporating a silane sizing because it reacts with the silica forming a Si-O-M bond, where M is either another Si atom or metallic atom. This creates a bulky chain on the surface of the fiber, increasing surface roughness and the ability to covalently bond to the polymer. 11 Though the general term of “silane sizing” is often used, the chemistries of each silane sizing can greatly differ from one another, even if they are all designed for a specific polymer matrix. There are four major components that make up sizing chemistry: binders, lubricants, antistatic agents, and film formers.12–15 This creates a multitude of ways in which a sizing can be tailored to the polymer. When these components change, especially the film former, the interaction between the fibers and matrix are impacted. It has been found that even if applying a polymer specific sizing on the incorporated reinforcements, they may not always beneficially impact the interphase or mechanical performance. 14
Within the automotive industry, the most widely used methods for processing plastics and fiber reinforced composites during manufacturing are extrusion and injection molding. During these processes, high levels of shear are applied to the materials to blend them together and move them through the die. Extrusion applies shear rates of 1 − 1×10⁴ Hz, while shear rates of 1×10² − 1×10⁵ Hz are experienced during injection molding. 16 A highly viscous material requires higher shear rates than a material with a lower viscosity, thus increasing the amount of energy required. Through rheology testing, the melt viscosity of a material, as well as other viscoelastic properties, can be determined to assist with optimal processing temperatures and pressures. 17
Rotational rheology is useful to determine the storage and loss moduli and low shear viscosity. The storage modulus is the elastic behavior of a material and its ability to store energy as shear is applied, and the loss modulus represents the viscous behavior of a material and the energy that is lost, typically as heat, when shear is applied. When the storage modulus is lower than the loss modulus, the material favors viscous behavior and acts more liquid-like. When the two resulting curves cross one another, the material shifts towards more solid-like elastic behavior. This crossover point correlates to the relaxation time of the material which is important when it comes to die swell and warpage of parts.16,18–20
The use of a capillary rheometer is important for determining the shear viscosity at high shear rates correlated to processing during injection molding. This rheometer uses a heated barrel and ram to push polymer through a small capillary die at specified shear rates to determine the resistance of the material and calculate shear viscosity. 21 Due to the considerable size difference between the barrel and die, pressure build up greatly contributes to the data output and leads to high levels of die swell. It was found that the longer the die is, the less the material swells after exiting and the less effect pressure has on the data. 18 This can be omitted by applying the Bagley correction or using a die with a minimum aspect ratio (L/D) of 20.17,22,23 The shear viscosities from the capillary rheometer can be paired with the viscosities obtained from the rotational rheometer to obtain a broader scope of behavior necessary for processing.
The material properties of basalt fiber (BF)/hemp hurd hybrid biocomposites lacks prior research and substantial data. The purpose of this research was to determine if BF/hemp hurd hybrid composites can serve as an alternative to glass fiber composites in automotive applications, and how their mechanical and viscoelastic properties compare. Understanding these behaviors will be beneficial to determine what next steps need to be taken to incorporate biocomposites in the automotive industry.
Materials and methods
Materials
Polypropylene (PP) supplied by RheTech (Whitmore Lake, MI, USA) with a Melt Flow Rate at 230°C/2.16 kg of 2.6 g/min and density of 0.89 g/cm3, served as the matrix material for the composites. AC 950P MAPP (density of 0.93 g/cm3) provided by Honeywell (Morristown, NJ, USA) was used as a coupling agent to chemically improve the interfacial bond between the matrix and fibers. The composites tested in this research were reinforced with BF and hemp hurd particles (HF). Two types of BFs, provided by Sudaglass Fiber Technology, Inc. (Houston, TX, USA) and Mafic USA (Shelby, NC, USA), were examined to determine if there is a difference in performance due to BF characteristics. Both manufacturers applied a silane sizing to the BFs specified for a PP matrix and had an average diameter of 13 μm with densities of 2.75 g/cm3 and 2.63 g/cm3, respectively. Both 3- and 6-mm chopped BFs were tested from each manufacturer to examine how fiber length affects performance. The hemp hurd (density of 0.08–0.12 g/cm3) was supplied by Sunstrand, LLC (Louisville, KY, USA). Pre-compounded pellets (GC30P200-01) containing PP and 30 wt.% glass fibers (GF) used in the automotive industry, were supplied from RheTech (Melt Flow Rate at 230°C/2.16 kg of 0.7 g/min and density of 1.13 g/cm3). This mixture served as a control sample for baseline comparison purposes.
Formulations and compounding
Experimental design used to compare effects of MAPP content, fiber content, fiber length, and fiber manufacturer. Contents of each constituent are displayed in wt.%.
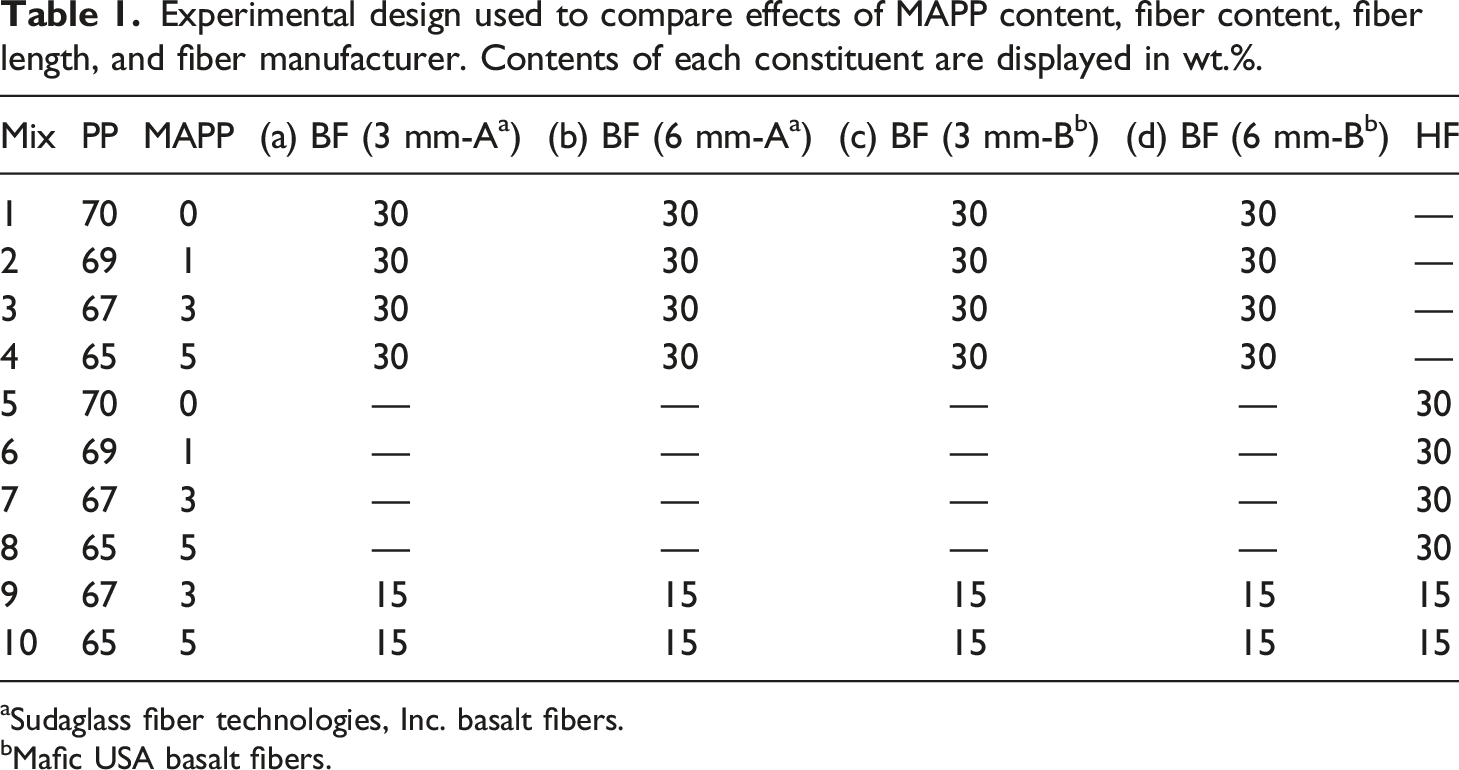
aSudaglass fiber technologies, Inc. basalt fibers.
bMafic USA basalt fibers.
Before processing the composites, the HF was first hammer milled to around 680 μm particles and sieved through 25–50 mesh pans for 15 minutes. Particles that passed through the 50-mesh pan (<300 μm) were collected for use. The HFs were then dried at 100°C for 24 h before including them into the blends. Each mixture was extruded using a Leistritz 18 mm twin-screw extruder maintaining 180°C in each of the eight chambers and a screw speed of 40 rpm. The extruded filament was immediately cooled in a water bath and pelletized. Pellets were dried for 24 h at 100°C to evaporate any moisture before processing. Standard dog bone and bending specimens (Type I) were injection molded at 180°C in a Sumitomo injector under 700 kgf/cm2 with a mold temperature of 100°C. A minimum of five replicates from each blend were tested and analyzed, and in some cases up to nine specimens were tested dependent on the purity of the specimen to ensure they were not over-saturated with PP. The pre-compounded GF/PP pellets (control blend) were injection molded under the same conditions.
Each formulation from the experimental model was compared against the GF mixture to determine the weight loss from replacing the GFs with BFs and HFs. The mass and dimensions of the rectangular bending specimen were recorded to determine the density of each mixture. The weight loss percentage can be determined by equation (1). ρ
GF
is the density of the GF composite and ρ
mix
is the density of the alternative composite blend.
Tensile and 3-point flexural tests were performed at room temperature following ASTM standards D638 26 and D790, 27 respectively. A 2-kip Instron testing machine was used to conduct both tensile and flexural tests. Tensile tests were completed with a crosshead speed of 5 mm/min using a two-inch MTS extensometer to measure strain %. During bending tests, the crosshead displacement was used to measure deflection of the specimen. The accuracy of this method was verified using a LE-05 Laser Extensometer. The crosshead speed used was 1.36 mm/min. GraphPad Prism™ was used to complete a statistical analysis on all tensile and bending results. A One-way Analysis of Variance (ANOVA) was performed to compare the mean values for all mixtures of each property using the Fisher LSD method. A statistical significance between values is present when α ≤ 0.05.
SEM imaging and fiber length analysis
The fracture surface of tensile coupons was observed using a Tescan Vega3 scanning electron microscope (SEM). The fractured surfaces were sectioned off, mounted to a stub, and sputter coated with gold (Au) to create a conductive surface. The Au layer applied was between 7–10 nm thick. Imaging was carried out at 20 kV.
To determine the amount of fiber breakage during processing, fiber length was evaluated from mixtures containing BFs after the extrusion process (i.e. filament strands prior to injection molding). For this purpose, the materials were first burnt using a convection furnace (Isotemp® muffle furnace Fisher Scientific) at 550°C for 2 h at isothermal conditions. Replicates were completed in some formulations to verify results. Afterwards, the fiber length analysis was conducted using a Malvern Mastersizer 3000, coupled to a Hydro LV Malvern wet dispersion unit, mixing at 2400 rpm. For this analysis, approximately 200 mg of BFs obtained from the combustion process was added to distilled water in the dispersion unit to obtain obscuration of 12–14%. The ultrasound option was turned on (at 70%) during the tests. A minimum of five measurements were carried out for each mixture until a consistent reading was reported, and the mean fiber length was recorded.
Rheology analysis
The viscoelastic properties of mixtures were determined through the use of two rheometers: rotational and capillary. The initial tests were completed using a 25 mm parallel plate setup in a TA Instrument DHR-2. To ensure the plate was fully covered with the sample, and there were not any gaps or bubbles, one-inch discs were made from each blend prior to testing. A 6″ × 6″ aluminum (Al) mold (i.e., 150 mm x 150 mm) was manufactured for the process of compression molding panels that the discs could then be cut from. The mold was made up of a bottom plate (BP) that the frame screws into forming the base of the mold. The inner plate (IP) was used to set the thickness of the panel to 1.1 mm. The top plate (TP) sat above the IP to catch any excess materials from spilling out, as well as evenly distribute the heat through the middle sections. A schematic of the mold can be seen in Figure 1. Schematic of aluminum mold used to compression mold panels for testing.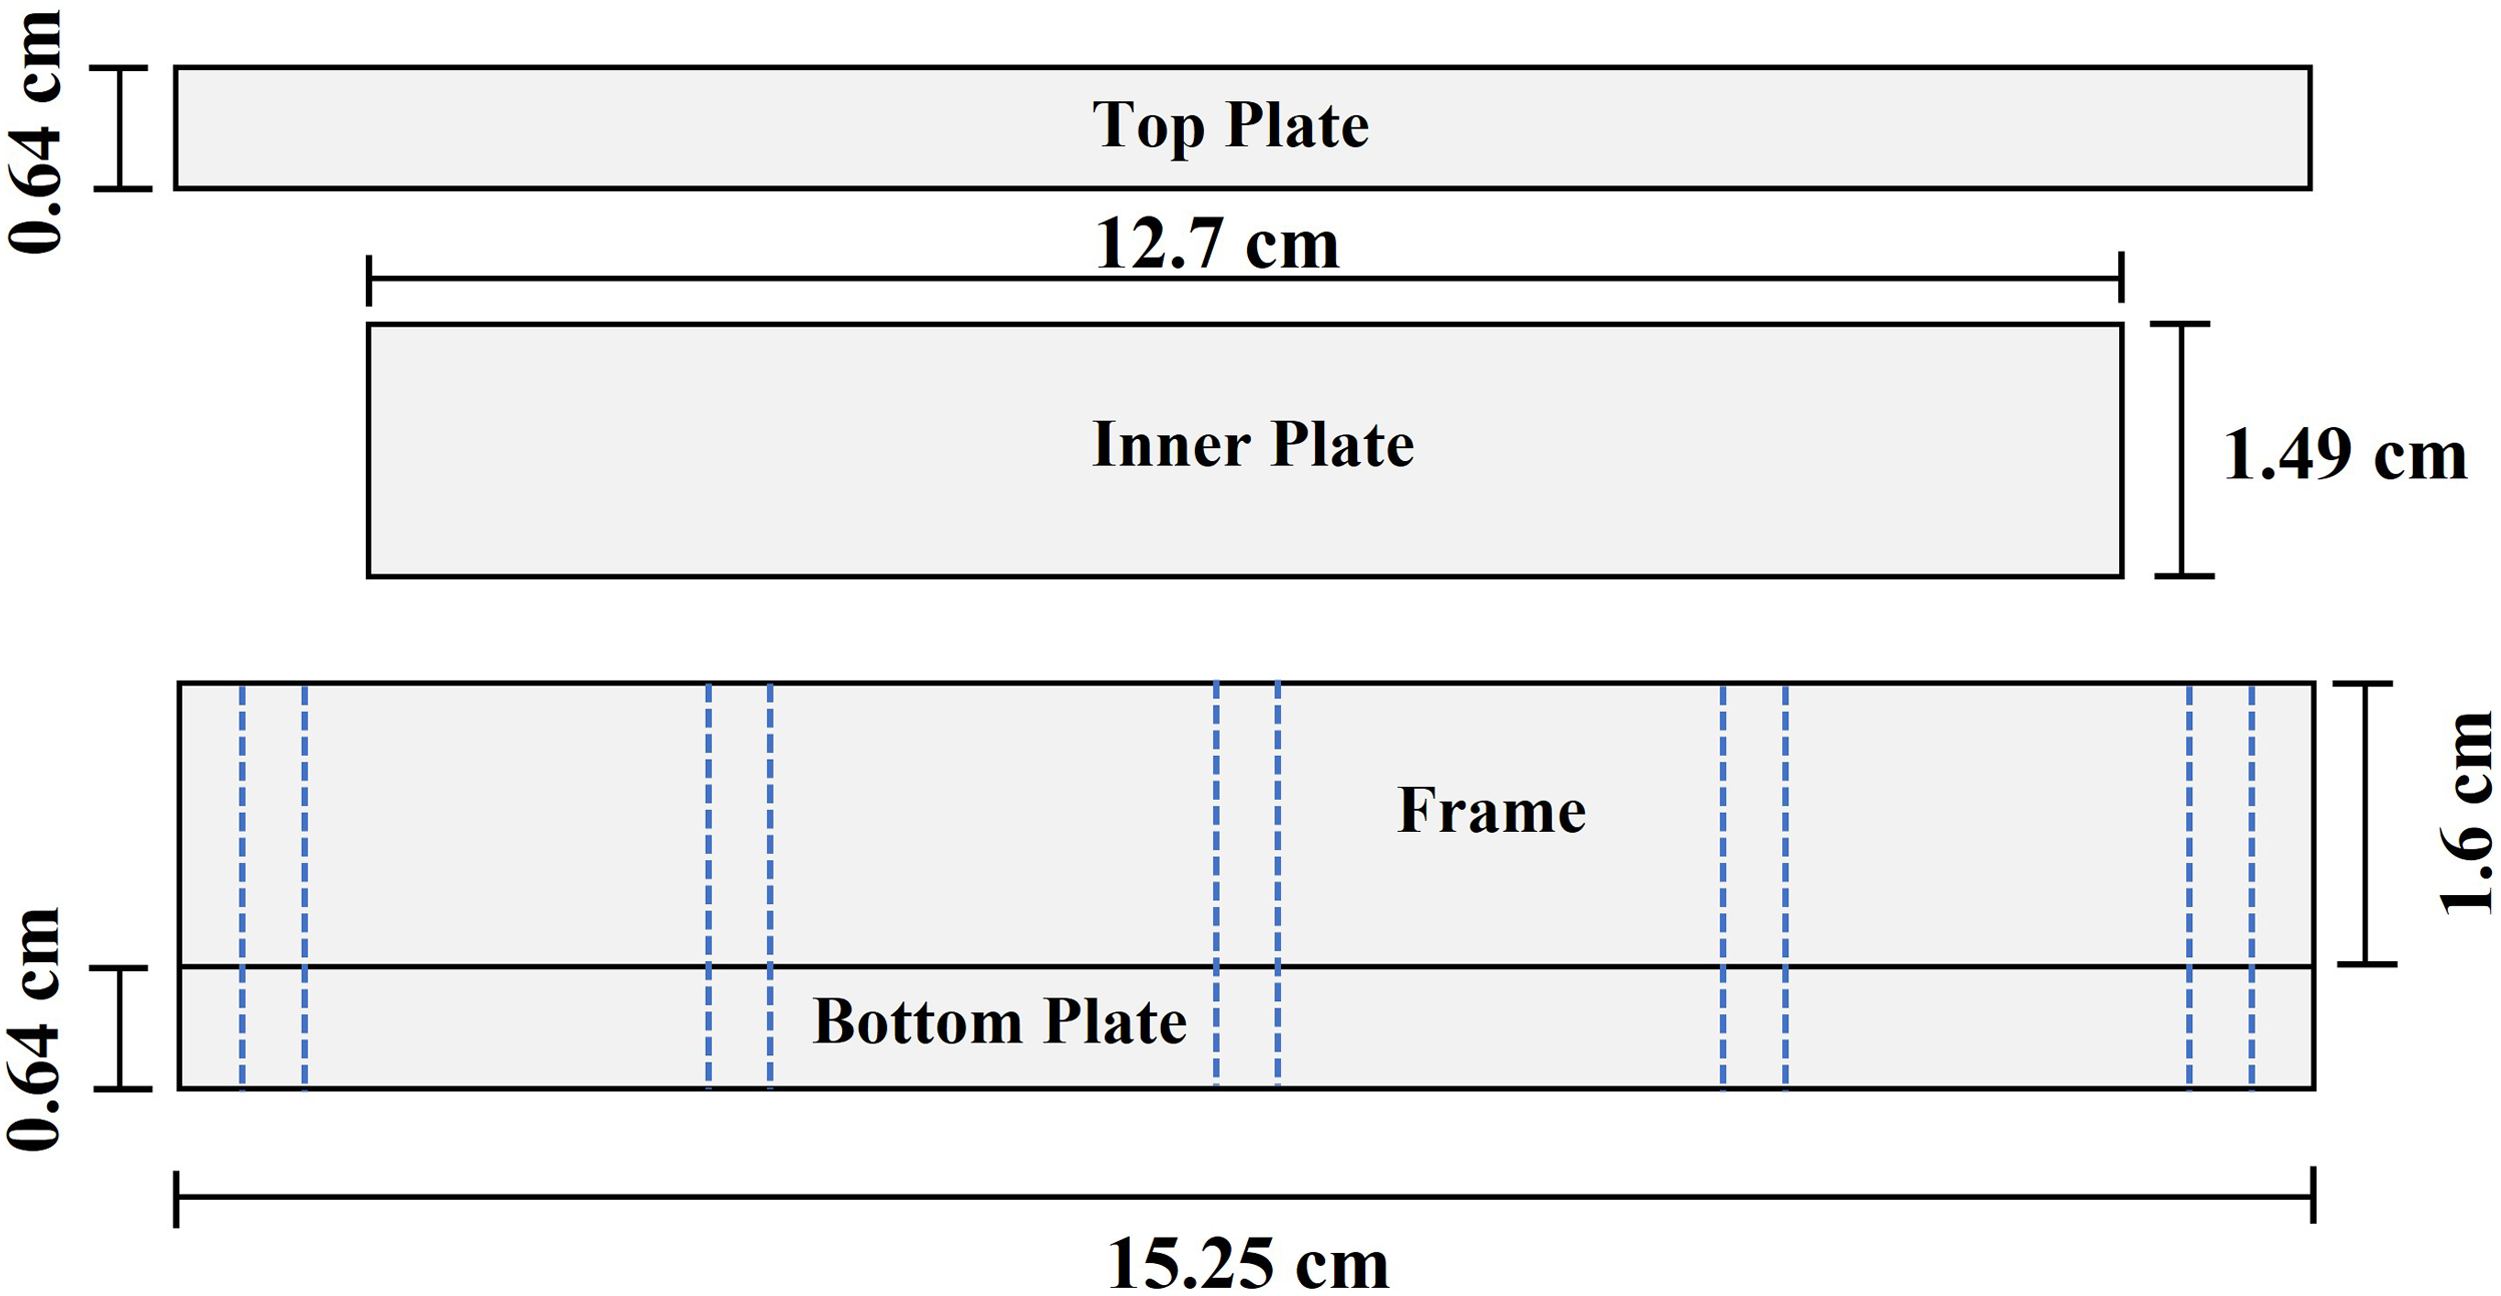
Using the densities measured from bending specimens, pellets were weighed out based on the desired volume of panel to be molded. To prevent the panels from sticking to the mold, the surfaces contacting the pellets were lined with aluminum foil and canola oil was sprayed on all sides and edges. A 6″ × 6″ (150 mm x 150 mm) Carver hydraulic hot press was heated to 200°C, and the mold filled with pellets was placed inside. The two platens were then brought together so the top platen was barely touching the TP of the mold; no pressure was applied. After 5 minutes of heating, the mold was removed, inverted, and re-inserted into the hot press. The platens were then closed all the way, applying 193 kPa of pressure and heated for five more minutes. After heating, the mold was removed from the press and steel plates were placed on top of the closed mold so the panels would not expand after the pressure was removed. The panels were cooled in the mold for 5 minutes and then removed. The panels were placed under steel plates again until they reached room temperature to avoid warpage at the edges. After the panels were cooled, sixteen one-inch diameter (25.4 mm) discs were punched out of the panel using a general metal arch punch. For all tests, the gap between the parallel plates was set to 1000 μm and the temperature was 180°C. A disc was placed on the lower heated plate in the rheometer and the moveable plate was lowered to hover above the disc to melt it for approximately 2 minutes. Once the disc was melted and the gap was set, all excess material was carefully trimmed from around the parallel plates.
The first rheological tests performed were strain sweeps to find the linear viscoelastic region (LVR) of the composites. Mixtures were tested in oscillation amplitude mode under continuous oscillation, or direct strain, from 0.01 to 100% strain to determine where the plateau level of storage modulus (G′) began to deviate from linearity by 10%. This was done at several frequencies to ensure that all tests would be completed within the LVR. After determining the LVR for the mixtures, small amplitude oscillation frequency (SAOF) sweeps were conducted at a frequency range between 0.1–300 rad/s to investigate the shear dependent material flow behavior of these heterogeneous blends. The test was performed as a logarithmic sweep and five points per decade were recorded. The strain % used was based on the results from the strain sweep tests and varied between 1% to 2%, depending on the mixture being tested. A minimum of five replicates were tested for each formulation.
An Acer capillary extrusion rheometer was used to test the materials at higher shear rates. A die with a diameter of 1.5 mm and 30 mm in length was used for testing (L/D = 20). Again, to replicate processing temperatures, testing was done at 180°C. The test parameters were as follows: pack to length of 220 mm at a rate of 800 Hz under 10 MPa of pressure. In the controller, the pre-soak option was enabled to ensure a steady temperature of ±1°C for 60 s, and the second prepack option was disabled. The shear viscosity was recorded once a steady-state shear stress was reached for 60 s at each rate; shear rates were varied between 10 to 2000 Hz. Before each test, the machine was calibrated to start with a force and pressure of zero. A gain of 0.987 was set and full-scale pressure was set to 70 MPa. Approximately 70 g of material was used for each test.
Results and discussion
Weight loss
The weight loss that can be achieved through substitution of materials is an extremely important factor that is considered during material selection. The measured densities of each fiber ratio at all levels of MAPP, were averaged and compared against the density of the GF mixture. In all cases when substituting the GF with the alternate fibers, weight loss is achieved. As anticipated, the highest degree of weight loss was achieved when substituting with 30 wt.% HF (30HF) at a decrease of 9%. As the BF content increased, the level of weight loss declined; however, when substituting with 30 wt.% BF (30BF), there was a reduction in weight of approximately 2%. This was not expected since GFs and BFs are typically very similar in density; however, it is unknown what the exact composition of the GF/PP composite was regarding the added coupling agents and stabilizers.
Mechanical properties
All 29 formulations were tested in tension to determine the UTS, Young’s Modulus (E), and strain at failure (SAF). An overview of the results can be seen in Figure 2. Each plot is grouped by fiber ratio with 30BF on the left, 15BF 15HF (hybrid) in the center, and 30HF on the right for all properties. For the blends that contain BFs, all variations of fiber manufacturer and fiber length are displayed in the same plot. Each plot of varying fiber content within the same property is displayed on the same scale and can be found on the 30BF graph. The mechanical properties are plotted against varying MAPP content to emphasize the impact at each fiber ratio. The GF/PP blend (red) and neat PP (gray) are also shown on the plots for comparison purposes. Tensile properties (a) ultimate tensile strength (b) Young’s modulus (c) strain at failure, for 30BF, hybrid, and 30HF composite blends as a function of MAPP. Mixtures containing basalt show manufacturer A (blue) and manufacturer B (orange), as well as 3 mm (▲) and 6 mm (□) fibers. GF (solid red) and neat PP (dashed gray) are also shown.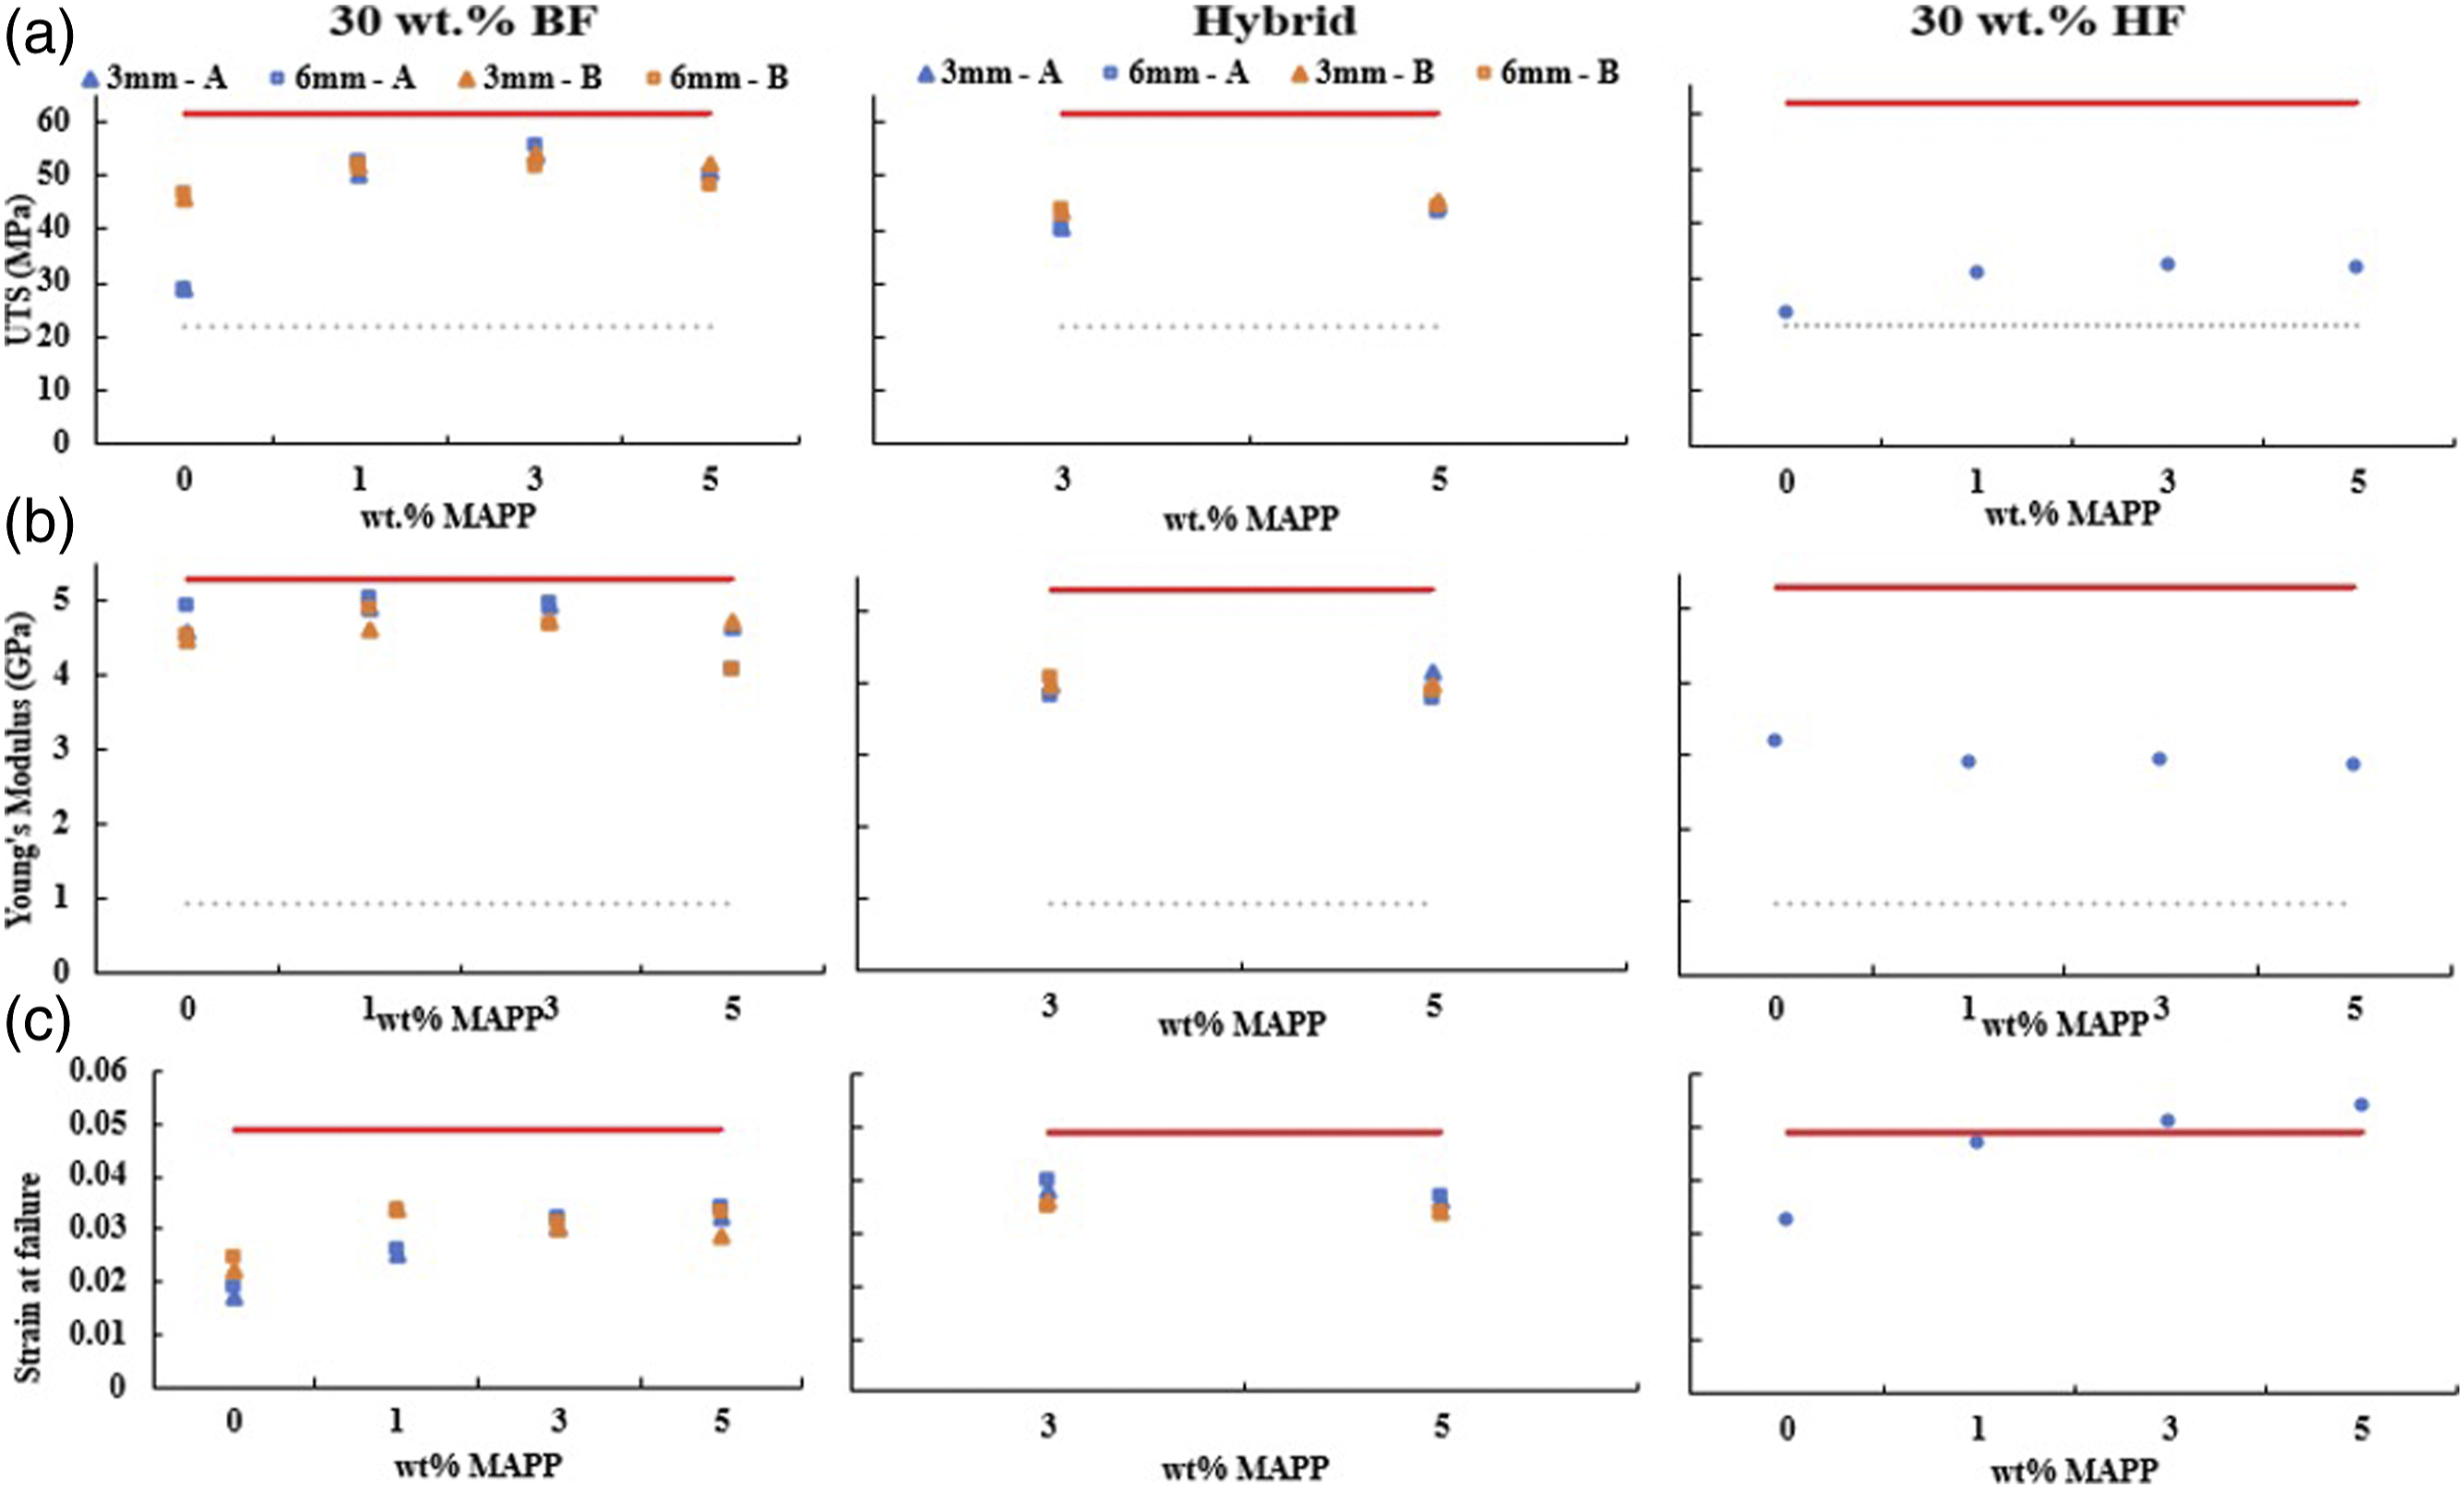
From initial observations of the UTS data (Figure 2(a)), a distinct difference between the performance of fiber manufacturers in the 30BF 0MAPP mixtures is seen. Results indicate that even though a silane sizing specified for PP is applied to all BFs, the sizing applied by manufacturer B interacts with the PP matrix better than that applied by manufacturer A. Better interaction between the matrix and the fiber produced by Manufacturer B was also evident from higher strain at failure at lower MAPP contents. For both 30BF and 30HF blends, an increase in MAPP content up to 3 wt.% increased the UTS indicating improved interfacial bonding; however, with further addition to 5 wt.% the properties began to decrease or level out. The hybrid blends were minimally impacted by an increase in MAPP, suggesting that 3 wt.% was adequate to the improve strength at this fiber ratio.
The Young’s modulus data (Figure 2(b)) remained relatively consistent for the blends containing BF at various MAPP contents but fluctuated between fiber manufacturers. When observing this graph, a decreasing trend in E as BF content decreased and HF increased was detected, indicating that the HF decreased the stiffness of the composite material. The increased SAF as MAPP increased confirms an improvement in interfacial bonding. The 30HF blends contained the highest SAF values of any BF/HF/PP formulations indicating a higher toughness, which decreased as BF content increased.
Results of one-way ANOVA analysis conducted to determine statistical significance between mixtures mean UTS values. Gaps in the table separate the fiber ratios from one another, and thin, double lines separate different MAPP contents.
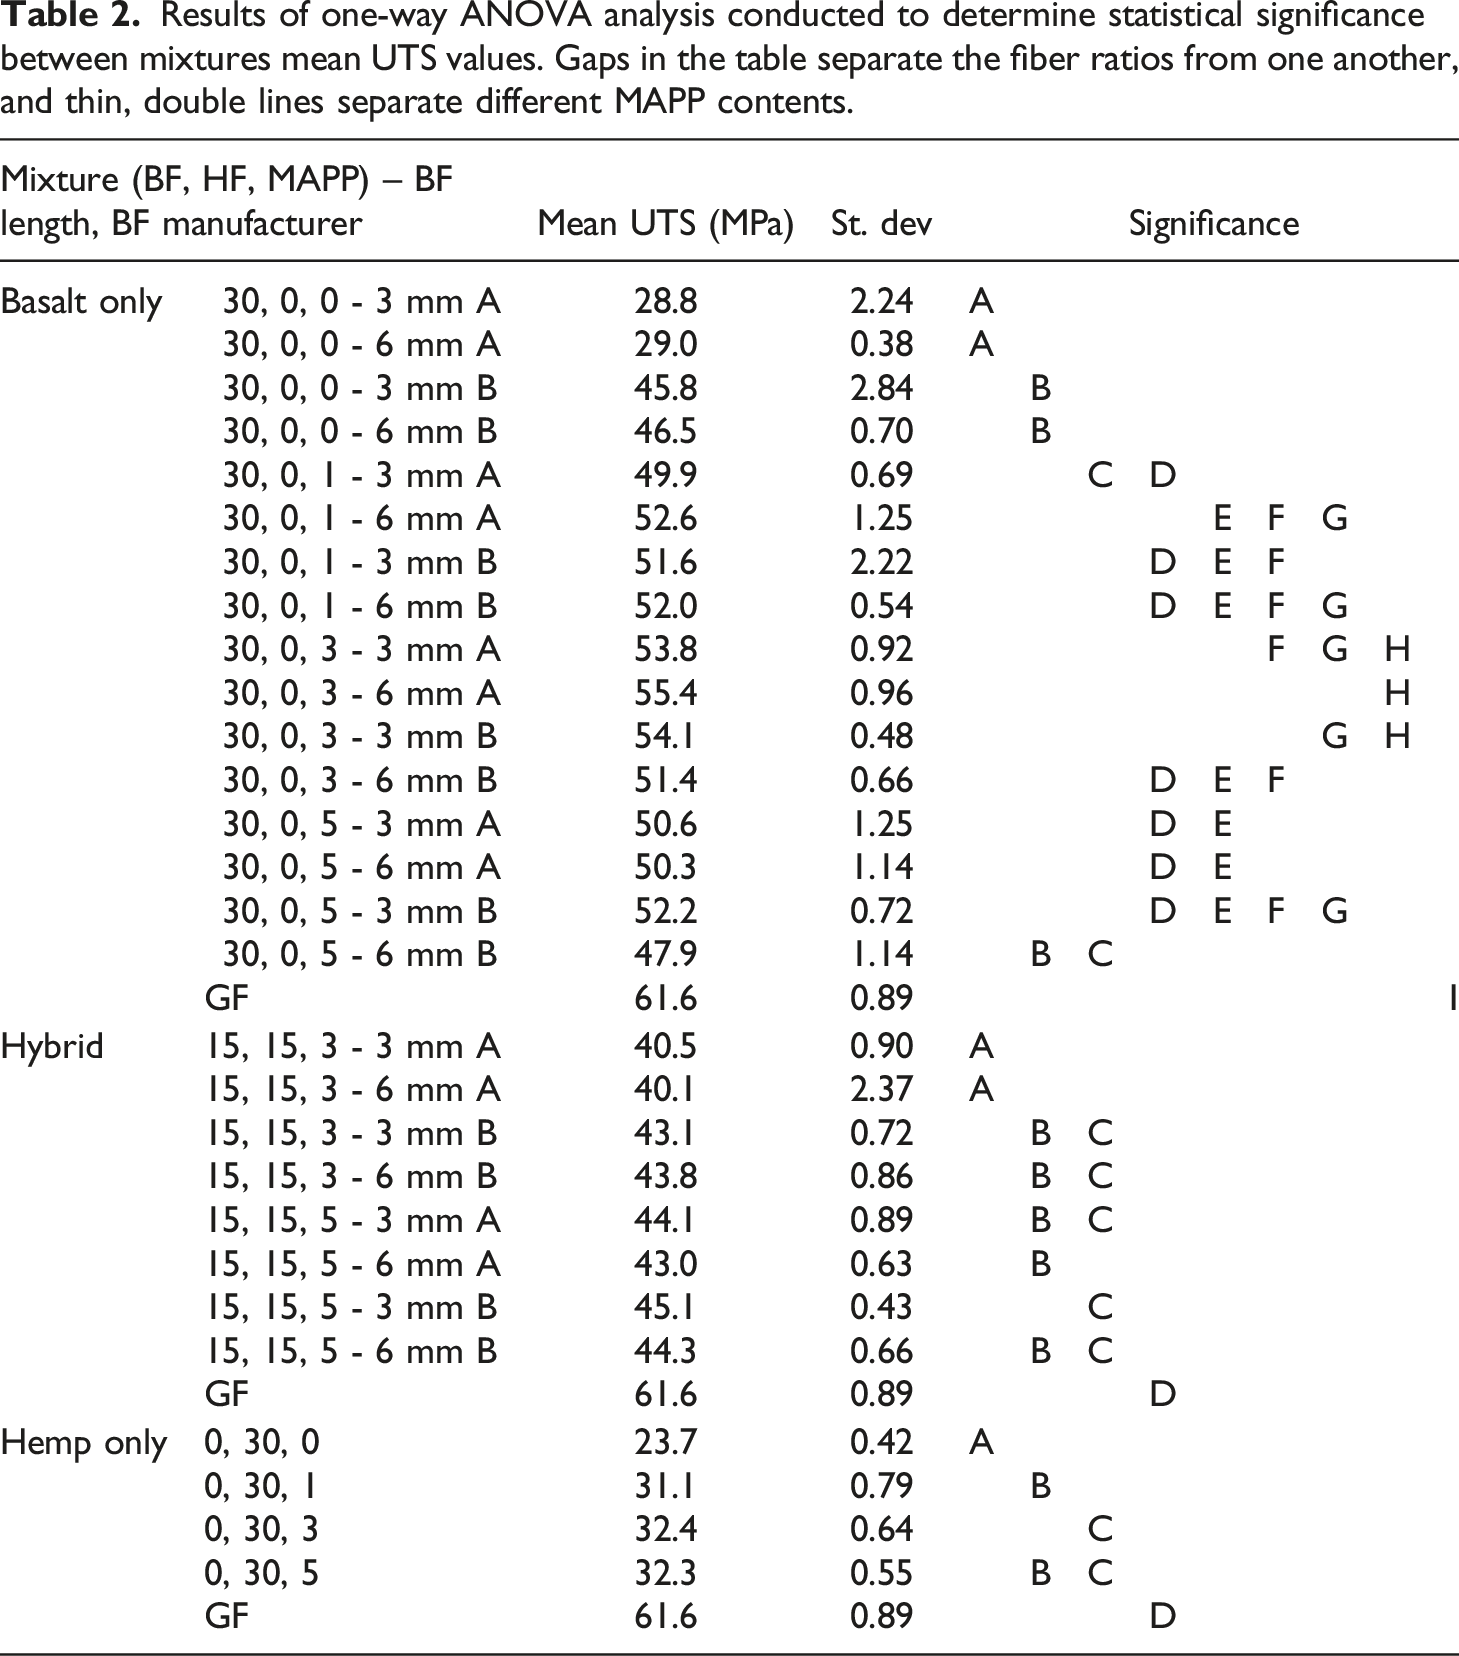
The ANOVA analysis confirms that there is a significant difference between the mean UTS value of two fiber manufacturers at 30BF 0MAPP; additionally, for both manufacturers A and B of this mixture, the fiber length does not significantly alter the mean UTS value. When focusing on the contributions of MAPP, it was found that the increase in mean UTS values observed after incorporating MAPP into the mixture is substantial at all levels compared to 0MAPP. However, the extent of which it impacts the data is different for each fiber ratio and manufacturer. In the 30BF composites, manufacturer A appears to have a significant increasing trend in mean UTS from 0 wt.% to 3 wt.% MAPP, but then significantly decreased again at 5 wt.%. As seen from the initial observation of data, there is a strong dependance on the incorporation of MAPP when using these fibers. Composites containing fibers from manufacturer B were not as greatly impacted by the level of MAPP content. There was a significant increase in mean UTS values from 0 wt.% to 1 wt.%, but there was not a considerable change when MAPP continued to increase from 1 wt.% to 5 wt.%. However, there was an exception with the mixture containing 5 wt.% MAPP and 6 mm fibers where the mean UTS significantly dropped to levels comparable to that of 0MAPP. An increase in fiber pullout and debonding was also observed through the SEM image analysis for this mixture which is the probable cause of this occurrence.
The hybrid mixtures showed similar trends to the 30BF composite blends. When containing BFs from manufacturer A, there was a significant increase in mean UTS values when increasing the MAPP content from 3 to 5 wt.%. However, mixtures with fibers from manufacturer B, show that increasing the amount of MAPP from 3 to 5 wt.% does not significantly impact the mean UTS values. Finally, when looking at the 30HF mixtures there is a significant increasing trend in mean UTS from 0 wt.% to 3 wt.%, but plateaus at 5 wt.%. Here, the incorporation of MAPP is only effective up to a certain point and after that does not benefit the performance. A similar trend is found in literature when analyzing wood flour composites and bamboo/GF composites with the optimal amount of coupling agent being around 1.5–2 wt.%.5,8
Similar to the effects of MAPP, when focusing in on the impacts of BF length the results also varied depending on fiber manufacturer. In the formulations containing BFs from manufacturer A, fiber length only significantly altered the performance in the mixture containing 1 wt.% MAPP, where the 6 mm fiber specimen had a higher mean UTS than the 3 mm fiber composites. When evaluating the mixtures containing BFs from manufacturer B, the fiber length did not significantly alter the mean UTS value in the formulations containing 0 wt.% and 1 wt.% MAPP. However, in both 3 wt.% and 5 wt.% MAPP formulations, 3 mm BFs had a significantly higher mean UTS than the 6 mm fibers. The fiber length did not impact the mean UTS of any hybrid blends. From these results, is is seen that the strength of the fiber reinforced composites is more dependent on the fiber-matrix interactions and less dependent on the fiber length. Although the addition of MAPP improved the UTS for all fiber ratios and variations, none of the mixtures met the same level of performance as the GF composite blend. Additional research should be carried out to further improve the fiber-matrix interactions of the BF/HF/PP composites to directly compete with the highly researched and tailored GF composite.
A similar statistical analysis was completed on the Young’s modulus (E) data for the 29 blends. As with the UTS data, three separate analyses were done for each of the fiber ratios. Again, the neat PP had a significantly lower mean Young’s modulus than the composites. From the ANOVA analysis, it was determined that the results do not vary between fiber manufacturers or MAPP for both 30BF and the hybrid mixtures, except for the 5 wt.% MAPP and 6 mm BFs, where E substantially decreases. It is believed that decreased fiber alignment is the cause for this occurrence; however, there does not appear to be a significant difference in the fiber length distribution after processing (Fiber Breakage Analysis). There was not a significant change in mean Young’s modulus when MAPP is increased in the hybrid composites. These observations further demonstrate that Young’s modulus is influenced by fiber alignment and not by the quality of the interfacial bonding, as expected. The observed decrease in E of the 30HF composite blends was significant, which is unusual since the addition of a coupling agent typically promotes even fiber distribution leading to higher E. 1 However, because the hemp hurd is a particulate reinforcement, alignment during processing in the direction of flow is less likely since the L/D ratio was small.
Results of mechanical testing (tensile and bending) summarized.
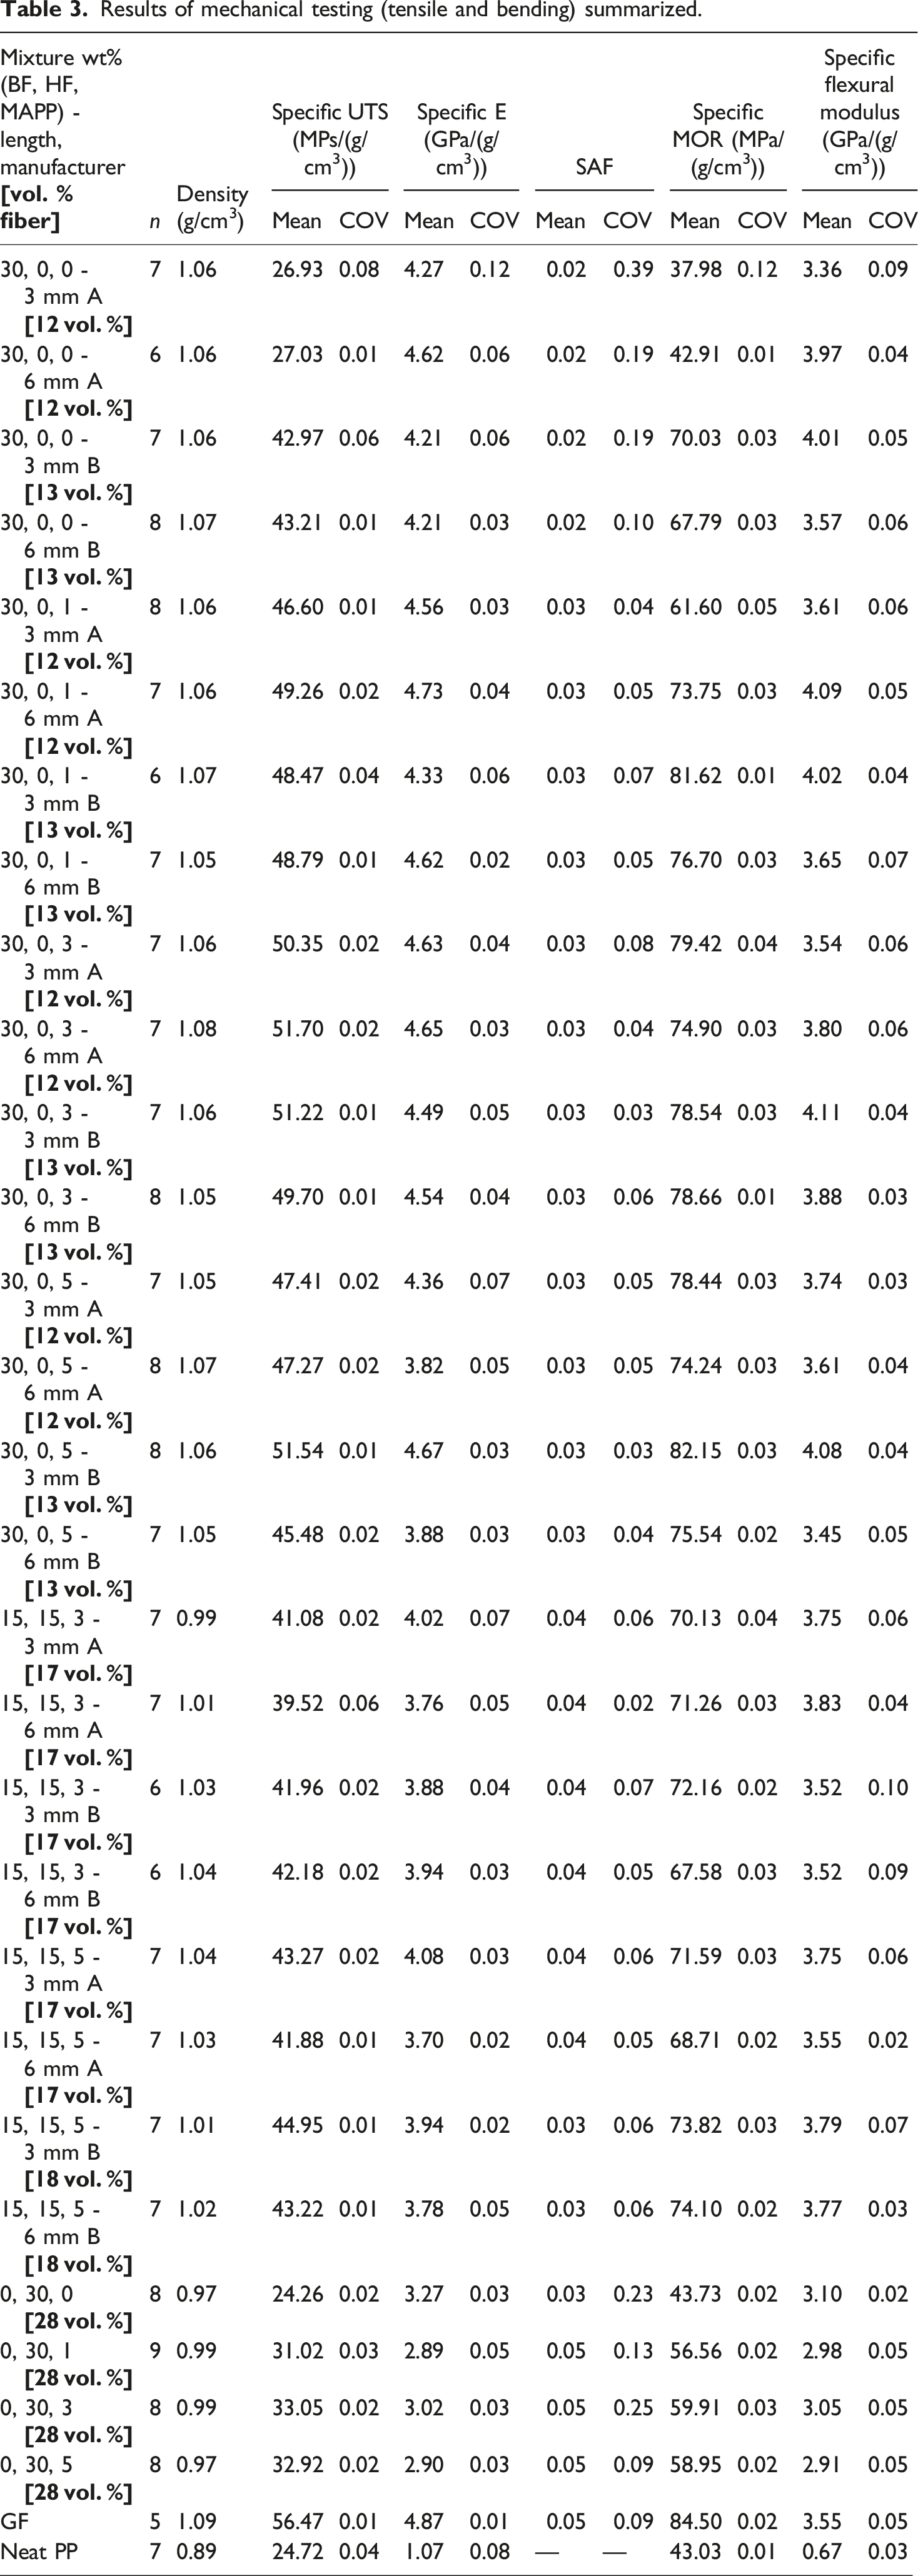
The results for the specific flexural strength (MOR) and specific flexural modulus are listed in Table 3. Very similar trends were seen from the bending tests as compared to the tensile tests. For both flexural strength and modulus, the neat PP performance was significantly lower than any of the composite blends tested. The addition of MAPP significantly increased the mean MOR values for all fiber ratios. The incorporation of MAPP had a larger impact on the mixtures containing BFs from manufacturer A than manufacturer B at low MAPP content. There was also an increasing trend in mean MOR with BFs from manufacturer A from 0 wt.% to 3 wt.% MAPP and then levels off at 5 wt.%. The mixtures containing BFs from manufacturer B initially improved mean MOR from 0 to 1 wt.% but did not continue to increase as MAPP content increased. For the hybrid mixtures, MAPP did not greatly impact the mean MOR values; however, the 30HF composites showed an increasing trend of mean MOR with MAPP content from 0–3 wt.% and then plateaus at 5 wt.%, again suggesting that 3 wt.% MAPP is sufficient to improve the interfacial bonding. As observed with the tensile strength, the GF/PP composite outperformed all BF/HF/PP composite blends and additional work should be done to improve the fiber-matrix interaction.
When analyzing the flexural modulus data, similar trends to the Young’s modulus were seen; The incorporation of MAPP into the mixtures had insignificant effects on the mean flexural modulus values for all fiber ratios. Fiber manufacturer appears to have the main role in the mean flexural modulus data. 30BF and hybrid mixtures with BFs from manufacturer A, revealed the performance from mixtures with 6 mm fibers is consistently significantly higher except at 5 wt.% MAPP where 3 mm fibers perform higher. However, examining the performance of BFs from manufacturer B, the results indicate the opposite for 30BF blends with 3 mm fibers outperforming 6 mm fibers, and fiber length having minimal effects in the hybrid mixtures. Several BF/HF/PP blends perform at the same level as the control GF/PP mixture, and all of the 3 mm blends from manufacturer B have a significantly higher flexural modulus than the GF/PP composite. Due to the performance and consistency of data from the mixtures containing BFs from manufacturer B, it was decided to move forward with the rest of testing only using these fibers. Comparisons will now only be analyzed between 16 different mixtures, still comparing them to the GF/PP control mixture provided.
Scanning electron microscopy analysis
When analyzing the fracture surfaces of the BF/HF/PP composites, fiber pullout (voids) and debonding (gaps) occurred at the interfacial regions. Both phenomena are responsible for decreasing the mechanical behavior since proper stress transfer was prohibited. Figure 3 shows micrographs of 30BF mixtures containing 3 mm BFs. The images are displayed to show increasing MAPP content from left to right. When there was no MAPP incorporated Figure 3(a), fiber pullout was prominent across the surface. When 1 wt.% MAPP was added Figure 3(b), the amount of fiber pullout appeared to have decreased and the adhesion between the fibers and matrix was significantly improved. The matrix material appeared to be bonded to the outer edges of fibers that were protruding from the surface. In image Figure 3(c), at 3 wt.% MAPP, the amount of fiber pullout significantly decreased, and the interfacial bonds appear to have improved further. At 5 wt.% MAPP Figure 3(d), the amount of fiber pullout appeared to slightly increase while adhesion remained very good, similar to image b. However, the visible fiber alignment in image Figure 3(d) revealed a lack of orientation, which confirms why the observed Young’s modulus of this mixture would decrease so drastically. The trends found in the micrographs were consistent with the improvements of mechanical performance observed and can be directly correlated to the increased interfacial bonding. SEM micrographs of 3 mm 30BF composites with varying wt.% of MAPP content imaged at 600×. MAPP increases from left to right (a) 0MAPP (b) 1MAPP (c) 3MAPP (d) 5MAPP.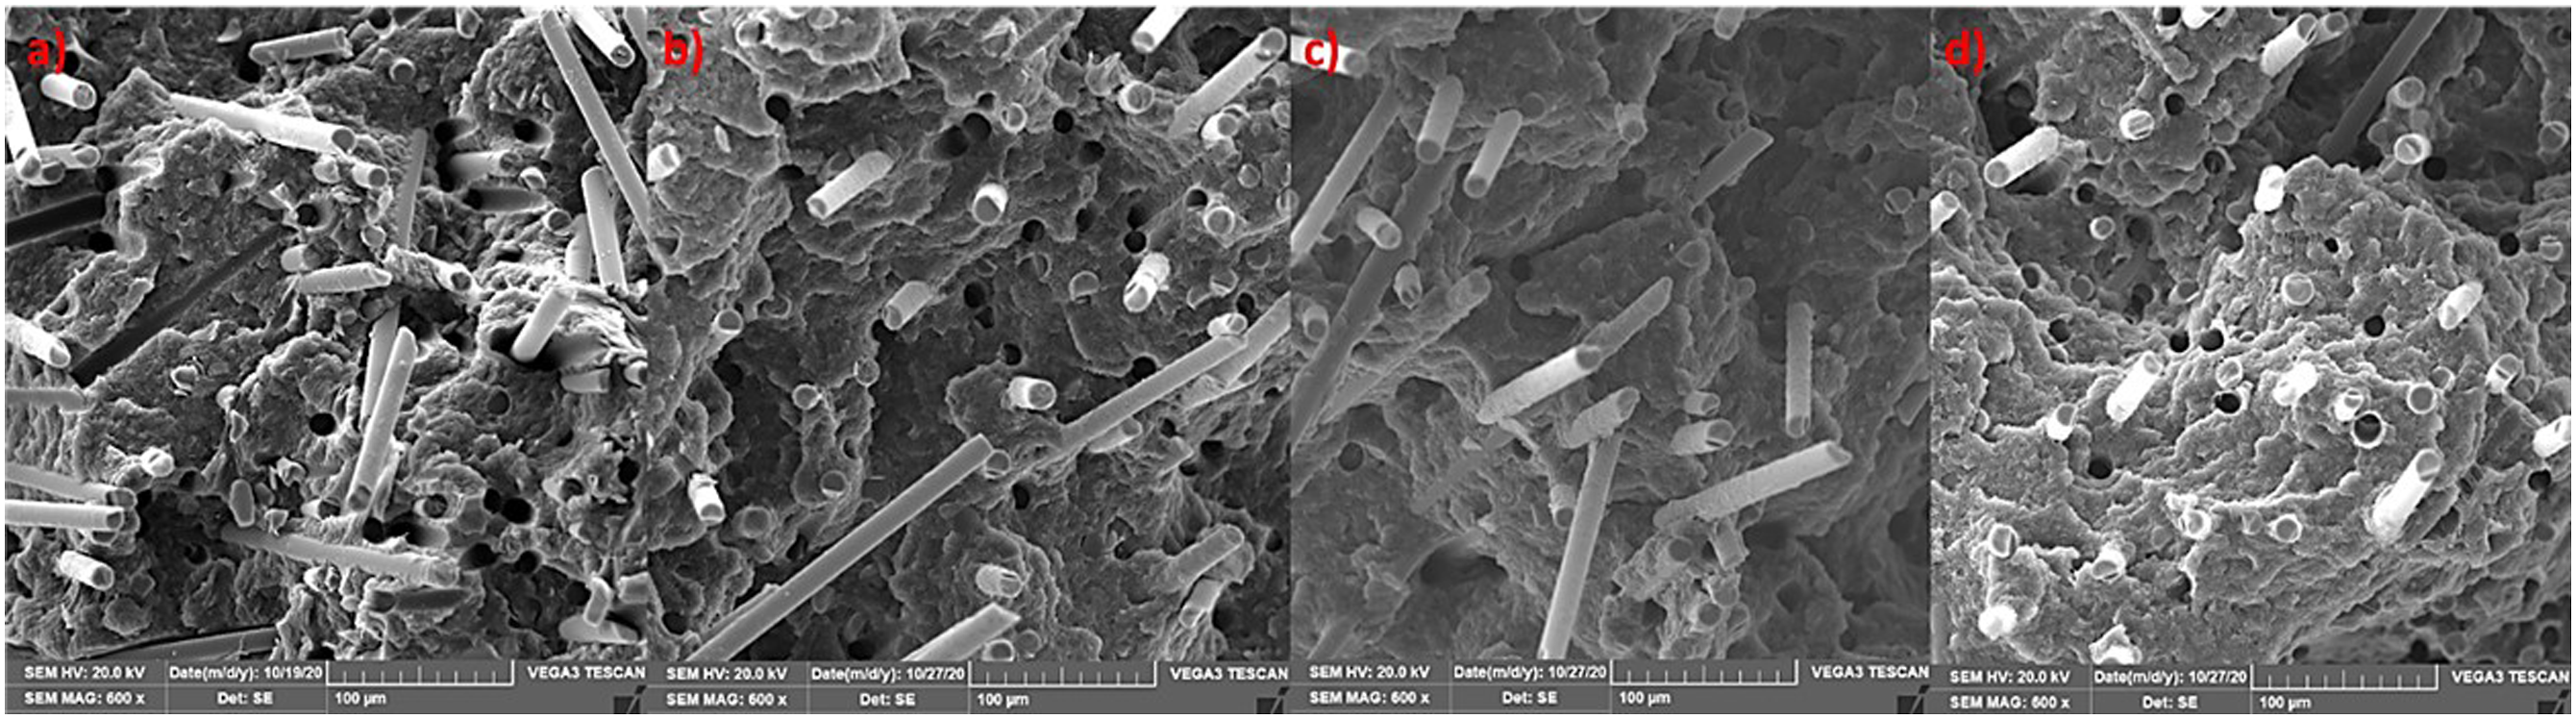
Figure 4 displays micrographs of the hybrid composite mixtures containing both 3 mm Figure 4(a) and (b) and 6 mm Figure 4(c) and (d) BFs. At both fiber lengths, there was minimal change in the amount of fiber pullout present, as well as adhesion between the matrix and fibers, when the MAPP content increased from 3 to 5 wt.%. There also did not appear to be a difference between the two fiber lengths. These trends coincide again with what was observed in the mechanical behavior of the composites. SEM micrographs of hybrid composites imaged at 600×. Images (a) and (b) contain 3 mm BFs with 3 wt.% and 5 wt.% MAPP, respectively. Images (c) and (d) contain 6 mm BFs with 3 wt.% and 5 wt.% MAPP, respectively.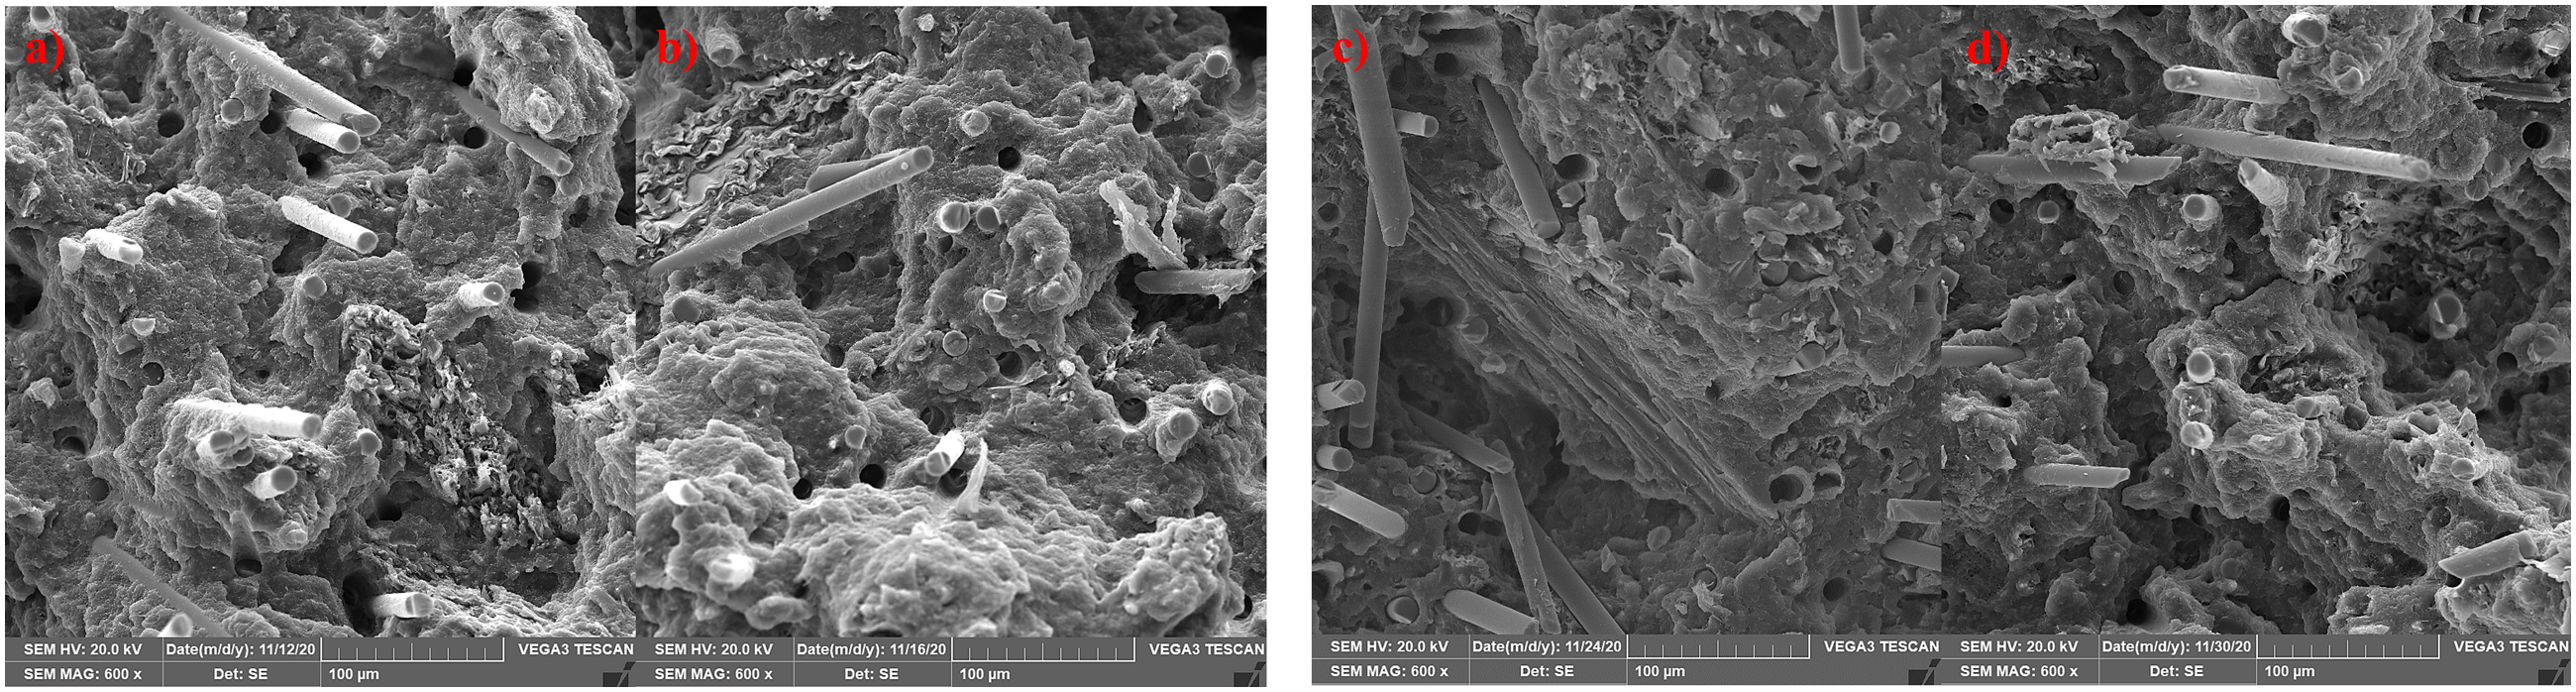
Figure 5 displays the composites of 30HF at varying MAPP contents. Due to the lack of contrast between the HFs and matrix, the micrographs shown are at ×800 magnification to better highlight the features. In image Figure 5(a) with 0MAPP, the HFs tend to agglomerate across the surface rather than evenly distribute themselves. There were also large gaps between the fibers and matrix, and high amounts of fiber pullout. In images Figure 5(b)–(d) after MAPP was incorporated, the interfacial bonding significantly improved, and the matrix material was discovered imbedded within the cervices of HFs. The dispersion of fibers also became more even across the fracture surface with the addition of MAPP; however, these features did not appear to considerably change as the MAPP increased from 1 wt.% to 5 wt.%. The trends correlate to the same behaviors found in the mechanical performance data. SEM micrographs of 30HF composites imaged at 800×. The wt.% of MAPP content increases from left to right. (a) 0MAPP (b) 1MAPP (c) 3MAPP (d) 5MAPP.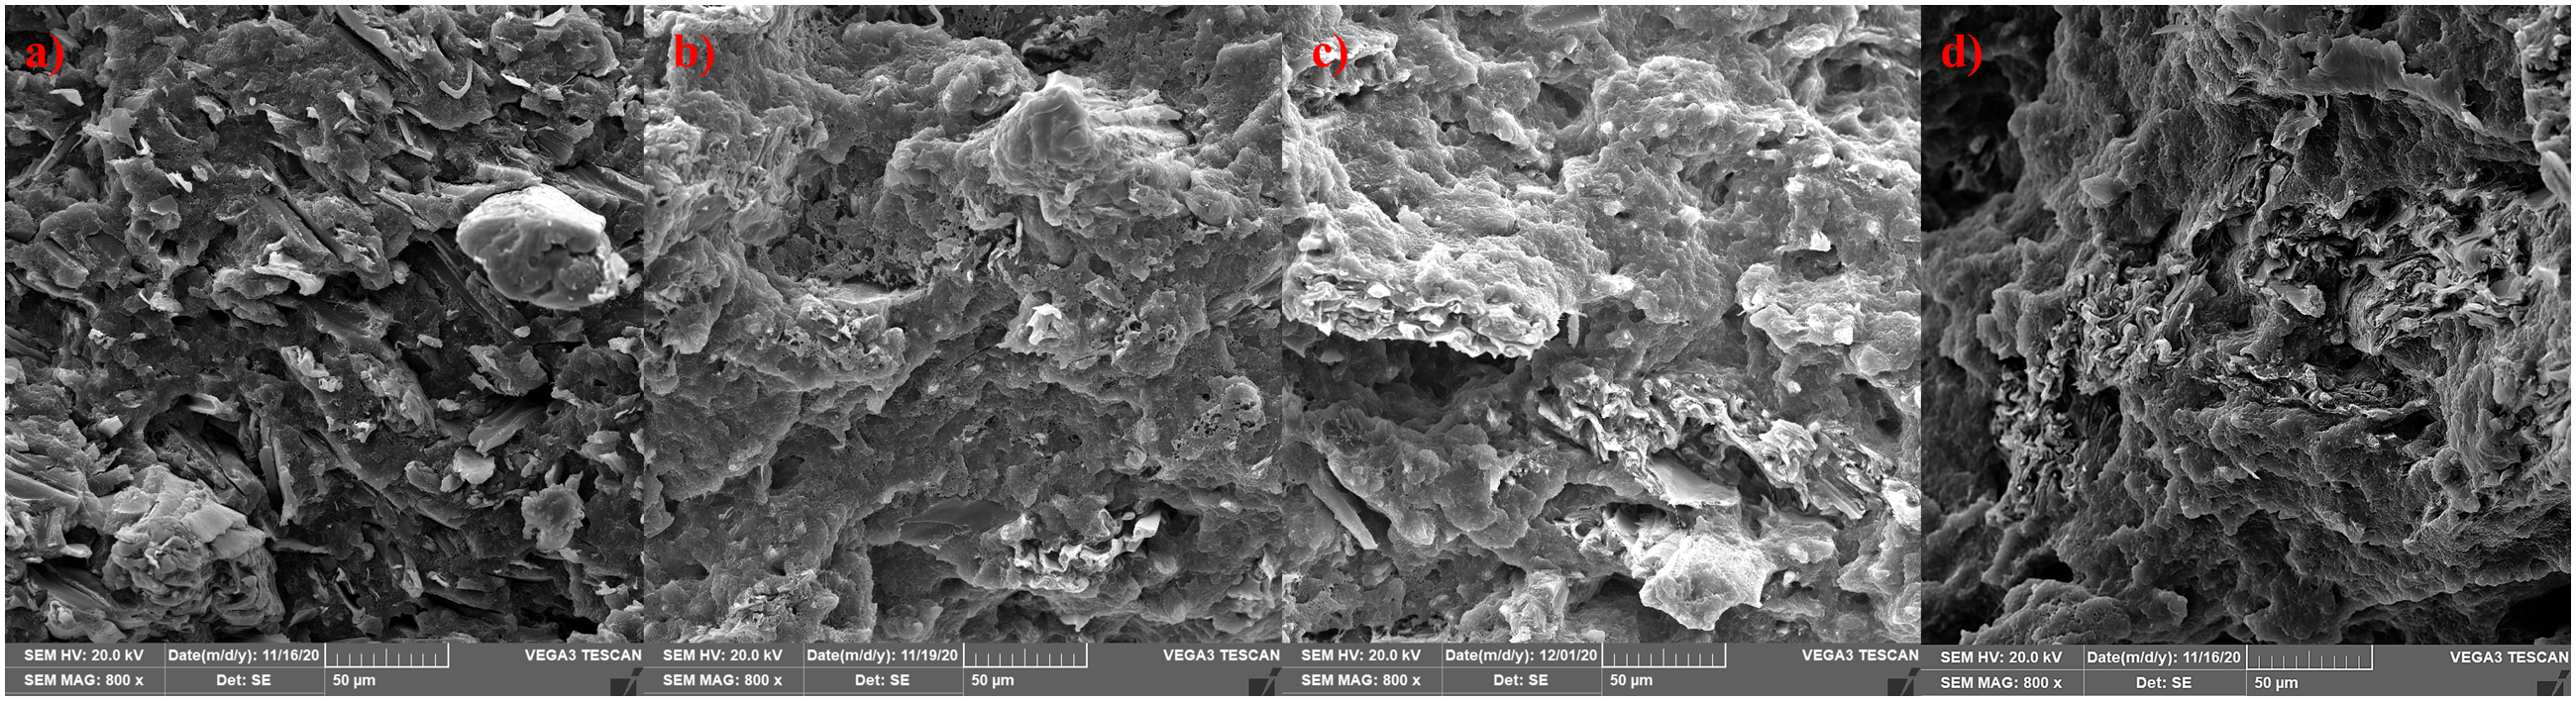
Finally, we observed the fracture surface of the pre-compounded GF mixture that was used as a control comparison (Figure 6). As expected, based on the mechanical performance, there was minimal fiber pullout and excellent adhesion at the fiber-matrix interface. Large fragments of the matrix material can also be seen on the face of GFs protruding from the surface. In image Figure 6(c) the thick layer of material can also be observed across the GF surface, which was not found on the BF surfaces. These features are desired to obtain the best performance from the composites and represent the target interactions we are striving to achieve in our BF/HF/PP composites. Pre-compounded GF mixture at different magnifications (a) 600× (b) 800× (c) 2.5kx.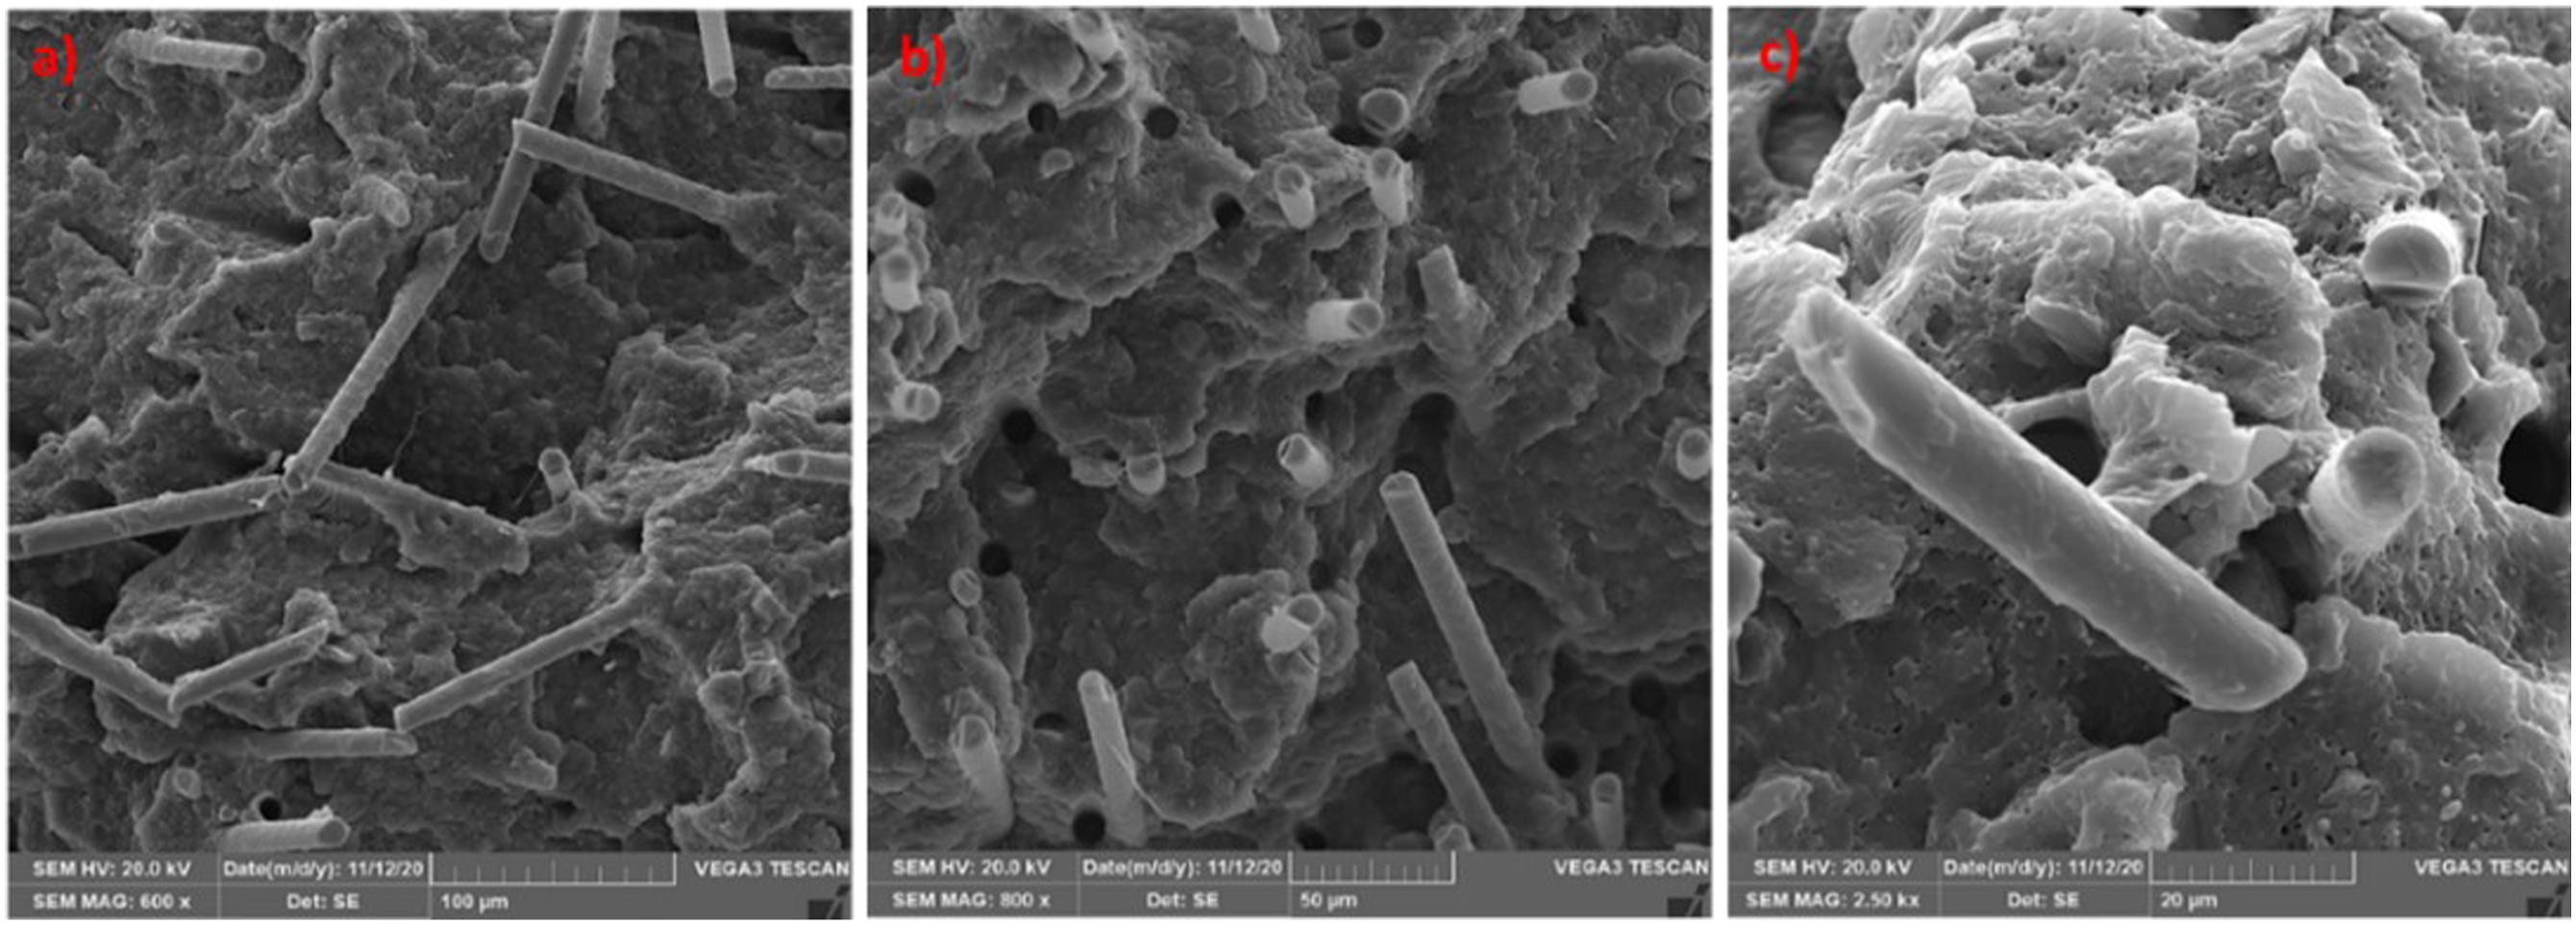
To correlate the mechanical performance to the interfacial interactions occurring, a quantitative analysis was conducted using ImageJ software to apply a threshold to the images and isolate voids (black pixels) across the fracture surface (white pixels) and can be seen in Figure 7. The voids represent fiber pullout and debonding. The software classified the different colored pixels and an average area percentage of voids from each blend was obtained. Five images of the same magnification were analyzed from each of the 16 blends. These area fractions were used to determine an estimated amount of fiber pullout and debonding in each mixture to determine how interfacial bonding changed in response to the addition of MAPP. Example of SEM micrograph before (left) and after (right) the threshold was applied to detect fiber pullout and debonding.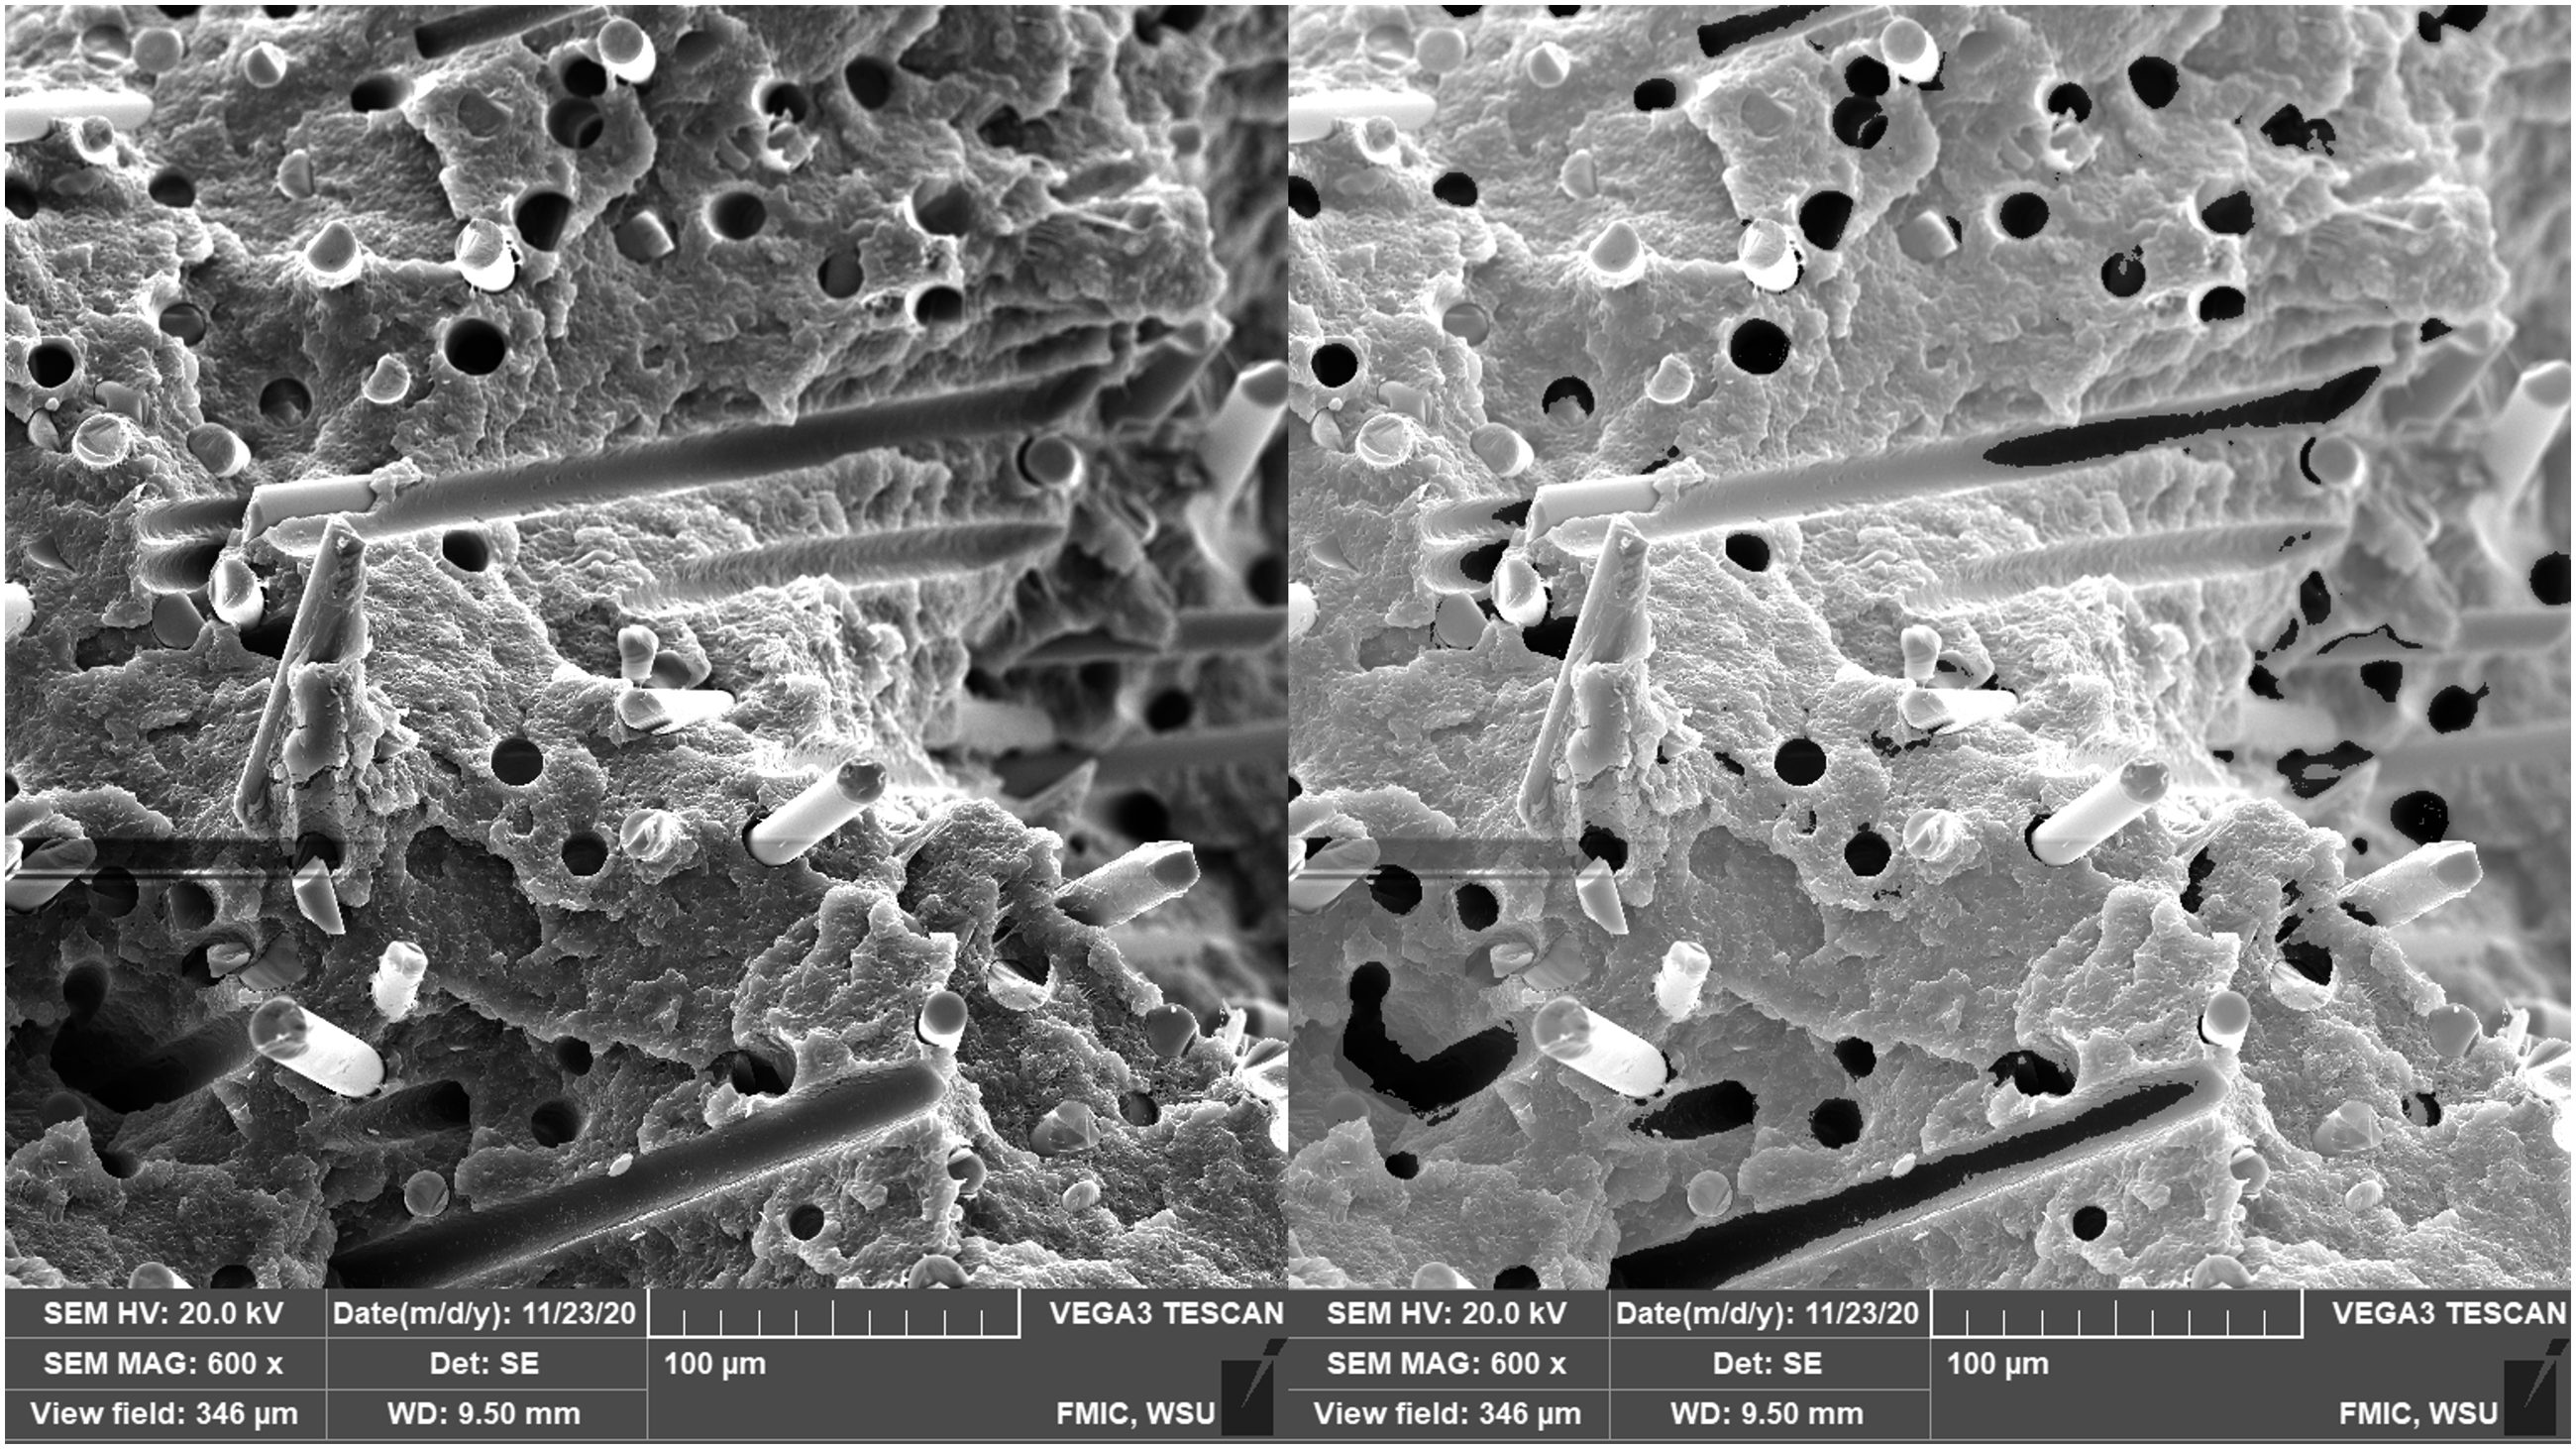
The preliminary results showed that the inclusion of MAPP at all levels decreased the void content. When analyzing the blends of 30BF (3 mm fibers) and 30HF mixtures with 0MAPP, the total area of voids is over 10%, but once MAPP was added to the mixtures the voids present decreased by 30–50%. The exact area fraction of voids varied slightly between 1–5 wt.% MAPP, but similar to the mechanical property data, there was not a continuous decreasing trend as MAPP increased. The percentage of voids present in the hybrid mixtures remained constant as MAPP increased, again similar to the mechanical behaviors recorded. The control GF/PP blend had a significantly lower area fraction of voids as compared to the biocomposite blends, which confirms why the mechanical properties were also significantly higher.
This analysis has not been perfected, as seen in Figure 7. Most of the fiber pullout holes were detected, as well as large gaps between the fiber and matrix where debonding occurred; however, the software could not detect horizontal fiber pullout impressions as these impressions were only partially filled after applying the threshold. Therefore, the actual area fraction for each mixture is suggested to be slightly higher due to this issue. This occurred in all analyzed micrographs, thus it should not significantly affect the observed trends, though a more precise analysis method is ideal.
Fiber breakage analysis
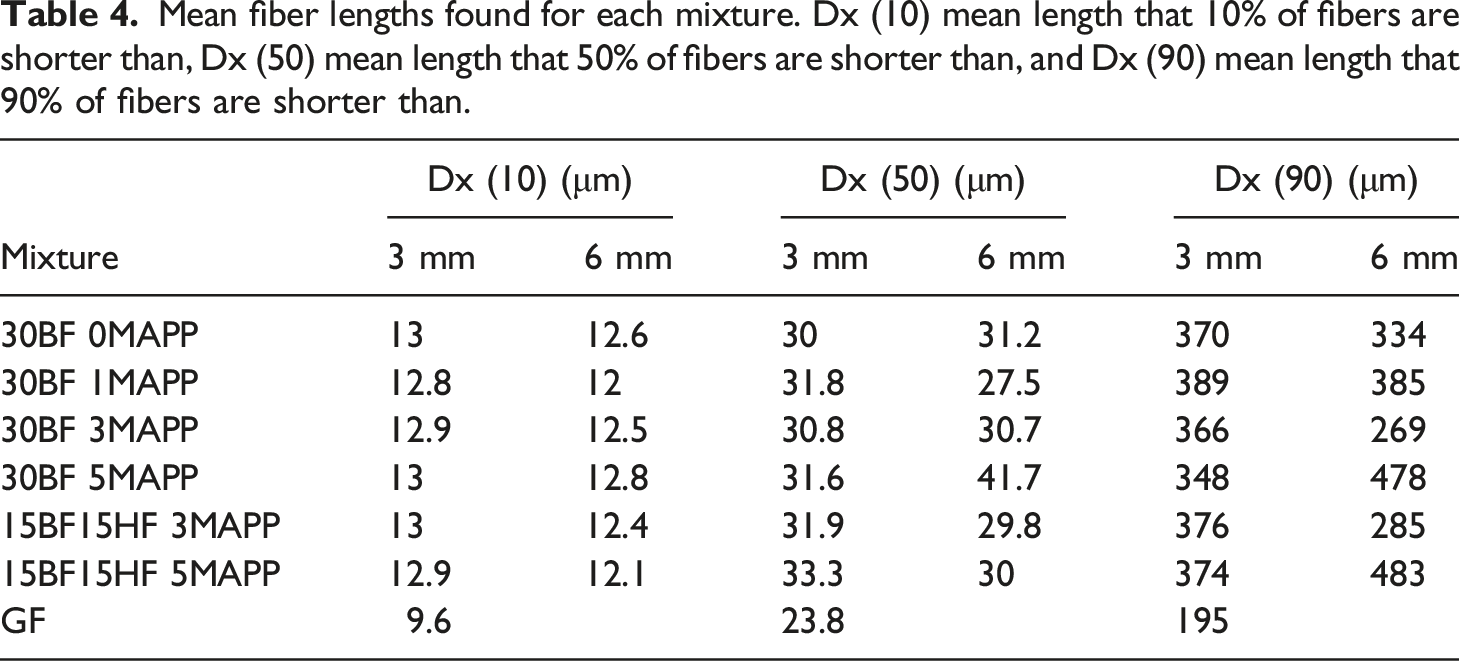
Another major contribution to the overall performance of the composites is the amount of fiber breakage that occurred during processing. The longer the fibers remain, the higher the aspect ratio, resulting in better fiber alignment. An example from the fiber length distribution analysis can be seen in Figure 8 showing a comparison between both 3 mm and 6 mm BFs in the same formulation and the pre-compounded GF formulation. The data shown is the fiber length versus the volume density or frequency of detection of the whole sample. The data from each test was compiled and summarized to show the mean standard percentile readings from the analysis (Dx (10), Dx (50) and Dx (90)) for each formulation, as reported by the Mastersizer equipment and can be found in Table 4. Interpretation of these values is, as follows: Dx 10, for example, indicates the mean size (in μm) that 10% of the sample fibers are smaller than, and 90% are larger than. The mean length of the 3 mm fibers appear to be slightly larger than that of the 6 mm fibers in most cases; however, this difference was not significant. These results correlate to the Young’s modulus data previously discussed. Because the fiber length distribution after processing was similar for both 3 mm and 6 mm fibers, the level of fiber alignment between the formulations would be similar, thus not impacting the Young’s modulus behavior. Nonetheless, the mean length of the GFs in all categories were several microns smaller than the BFs, implying that the BFs maintain integrity during processing better than GFs and should be further evaluated. Fiber length distributions curves of formulation (30BF 5MAPP) containing 3 mm BFs (gray) fibers and 6 mm BFs (orange) and GF blend (blue). Mean fiber lengths found for each mixture. Dx (10) mean length that 10% of fibers are shorter than, Dx (50) mean length that 50% of fibers are shorter than, and Dx (90) mean length that 90% of fibers are shorter than.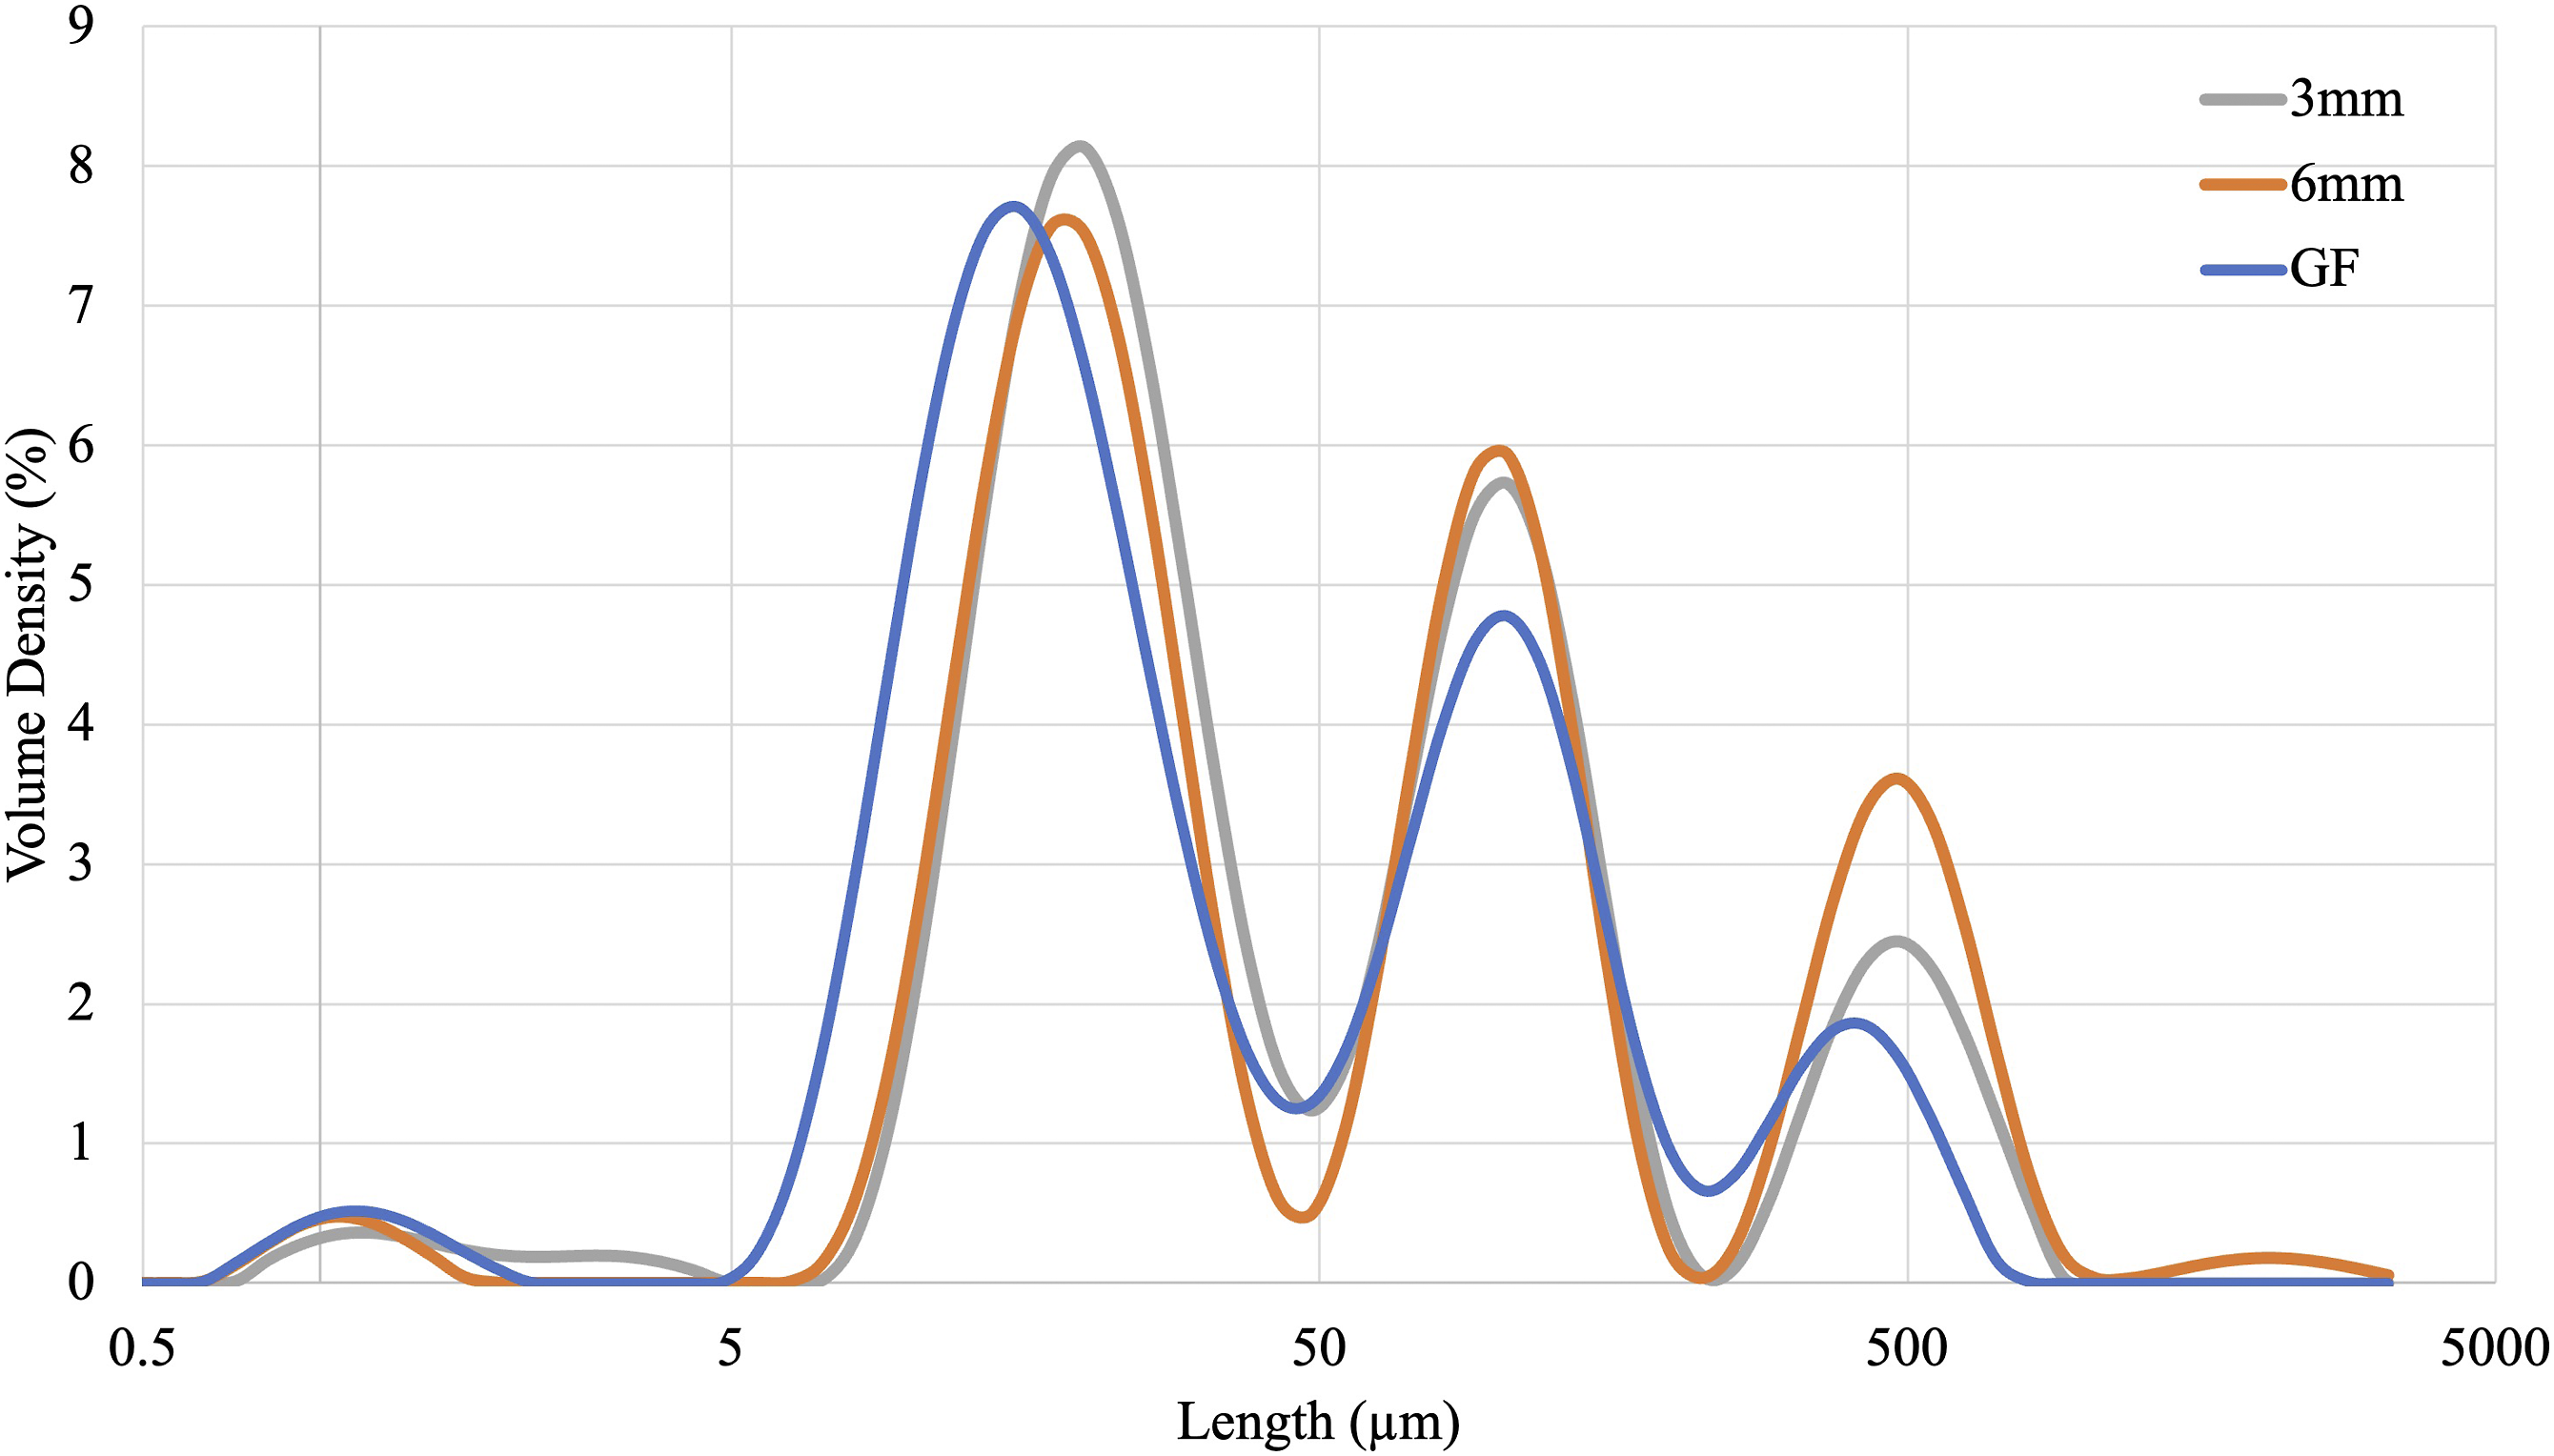
Rheological behavior
Rotational rheometer data
The LVR is an important factor to determine before conducting rheology tests to ensure that the material was not undergoing degradation or being influenced by the amount of stress/strain being applied during testing. Strain sweeps were conducted on several mixtures of both fiber lengths and types, at various frequencies between 10-100 rad/s to determine if there was variation between the LVR for 3 mm and 6 mm composites; fiber length did not appear to affect the resulting LVR. The curves of the 5MAPP mixture were consistently lower than the 0MAPP curves which was anticipated since MAPP typically has a lower molecular weight than neat PP, causing a decreased storage modulus. 20 The same trend was observed in the 30HF composite blends. Though a lower storage modulus is observed, the deviation from linearity between the two mixtures did not change. As expected, the deviation from linearity occurred faster at higher frequencies. Thus, the complete comparison of the rest of the mixtures was done at 80 rad/s. The results were used to determine the strain % used during testing. The 30BF and GF/PP mixtures remained within the LVR at 2% strain; however, the 30HF and hybrid mixtures deviated from linearity very quickly. Therefore, testing of these blends were performed at 1% strain.
Summarized data from the SAOF sweeps that were conducted on each of the mixtures.
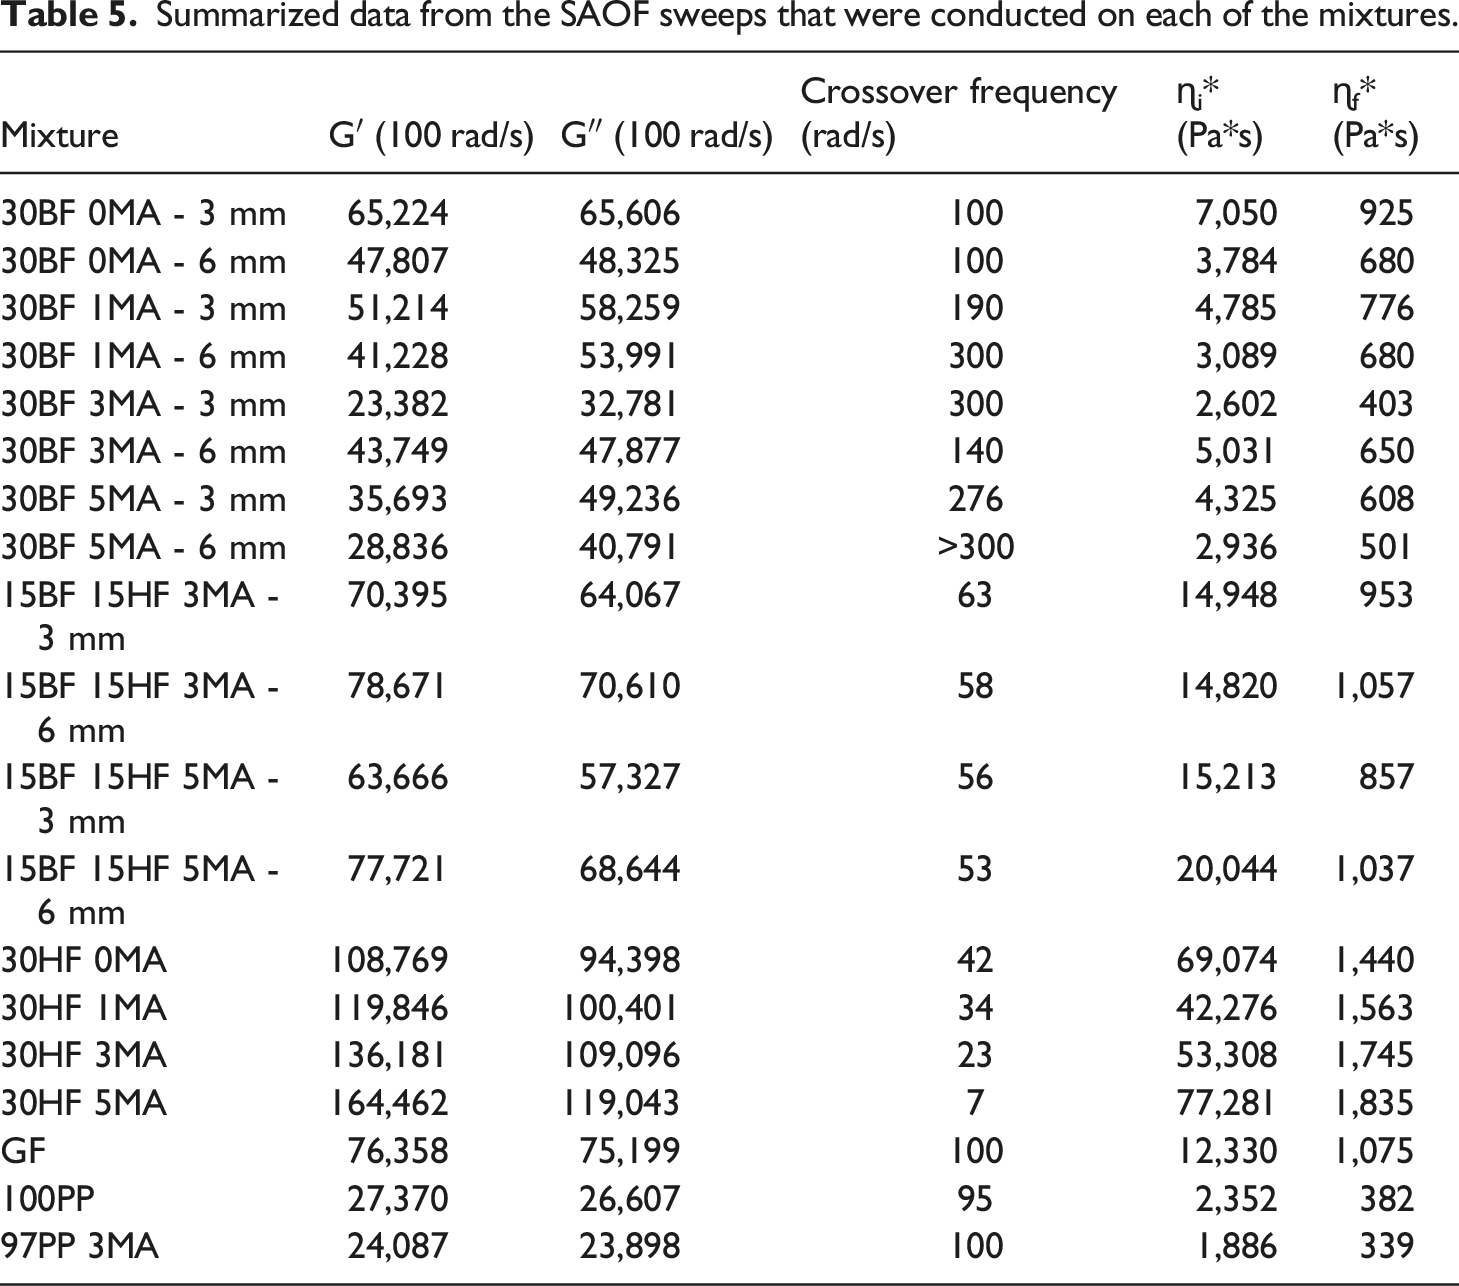
The fiber type significantly affected the apparent viscoelastic properties. Aside from the neat PP and 97PP 3MAPP mixtures, the 30BF mixtures at all variations of MAPP content showed the lowest G′, G″, and viscosity. There appeared to be a decreasing trend in all three properties as MAPP content increases in the 30BF composites, likely due to the decreased molecular weight of the MAPP causing this shift. The addition of HF significantly increased properties and caused a shift towards solid-like behavior at lower frequencies. The occurrence is likely due to there being a higher overall volume of hemp as compared to the denser basalt and GF of the same wt.% creating a greater dispersion of filler content in the matrix. The HF is also much coarser and particle like than the BFs and has a lower aspect ratio. The 30HF mixtures had the highest G′, G″, and viscosities of all mixtures and appeared to increase as MAPP increased, confirming the improved interfacial bonding. The hybrid blends fell between the 30BF and 30HF blends with higher properties than basalt only mixtures, and lower properties than hemp only mixtures. This was likely due to there being more overall fibers present in the blends when incorporating hemp than in the blends of basalt only, and less than the hemp only.
There were minor differences found between the viscosities from mixtures with 3 mm and 6 mm BFs at constant fiber ratios and MAPP content at low shear rates and converges at high shear rates. In the 30BF mixtures, the 6 mm fiber mixtures appeared to have lower viscosities where the hybrid mixtures containing 3 mm BFs appear to have lower viscosities. Thus far, the initial BF length has imposed minimal differences in the observed properties. Considering the results from previous sections, the 3 mm BF mixtures showed the highest mechanical performance, improved interfacial bonding, and slightly less fiber breakage during processing, so despite the minor differences in viscosity, it was decided to again narrow down the mixtures to only those containing 3 mm BFs. The following rheological analysis contains only 3 mm BFs when BF is present; there are now only 11 mixtures being analyzed from the initial 29. Note that for the rheology testing, neat PP has been added to the analysis for comparison purposes.
The GFs and BFs have similar aspect ratios so comparison of the 30BF composite blends to the GF/PP blends were insightful. The storage and loss moduli of the GF composite were higher than that of the 30BF blends, proving there is better interfacial bonding present. Due to the inability to directly compare moduli between different fiber types, a comparison can be made between the slope of the log-log curves of storage modulus versus low angular frequency (Figure 9) to determine the elastic behaviors and how independent the material is from applied frequency.
28
A uniform or neat polymer melt has a slope of two and is highly dependent on the frequency; a reference line can be seen in the lower right-hand corner of Figure 8. The neat PP and 97PP 3MAPP curves have slope of about 1.25. The slopes of the 30BF blends closely resemble that of the neat PP curves indicating that they exhibit viscous behaviors. The GF/PP curve has a slightly lower slope indicating it behaves more as an elastic solid than the 30BF blends, which makes sense since the fiber-matrix interactions were stronger. As hemp hurd is incorporated into the blends, the slope continues to decrease implying the material is becoming more solid-like. This is likely again due to the increased volume of hemp incorporated, even though the composites all have the same wt.% of reinforcements. Log storage modulus (G′) curves of all BF/HF/PP, GF/PP, and PP composite blends tested.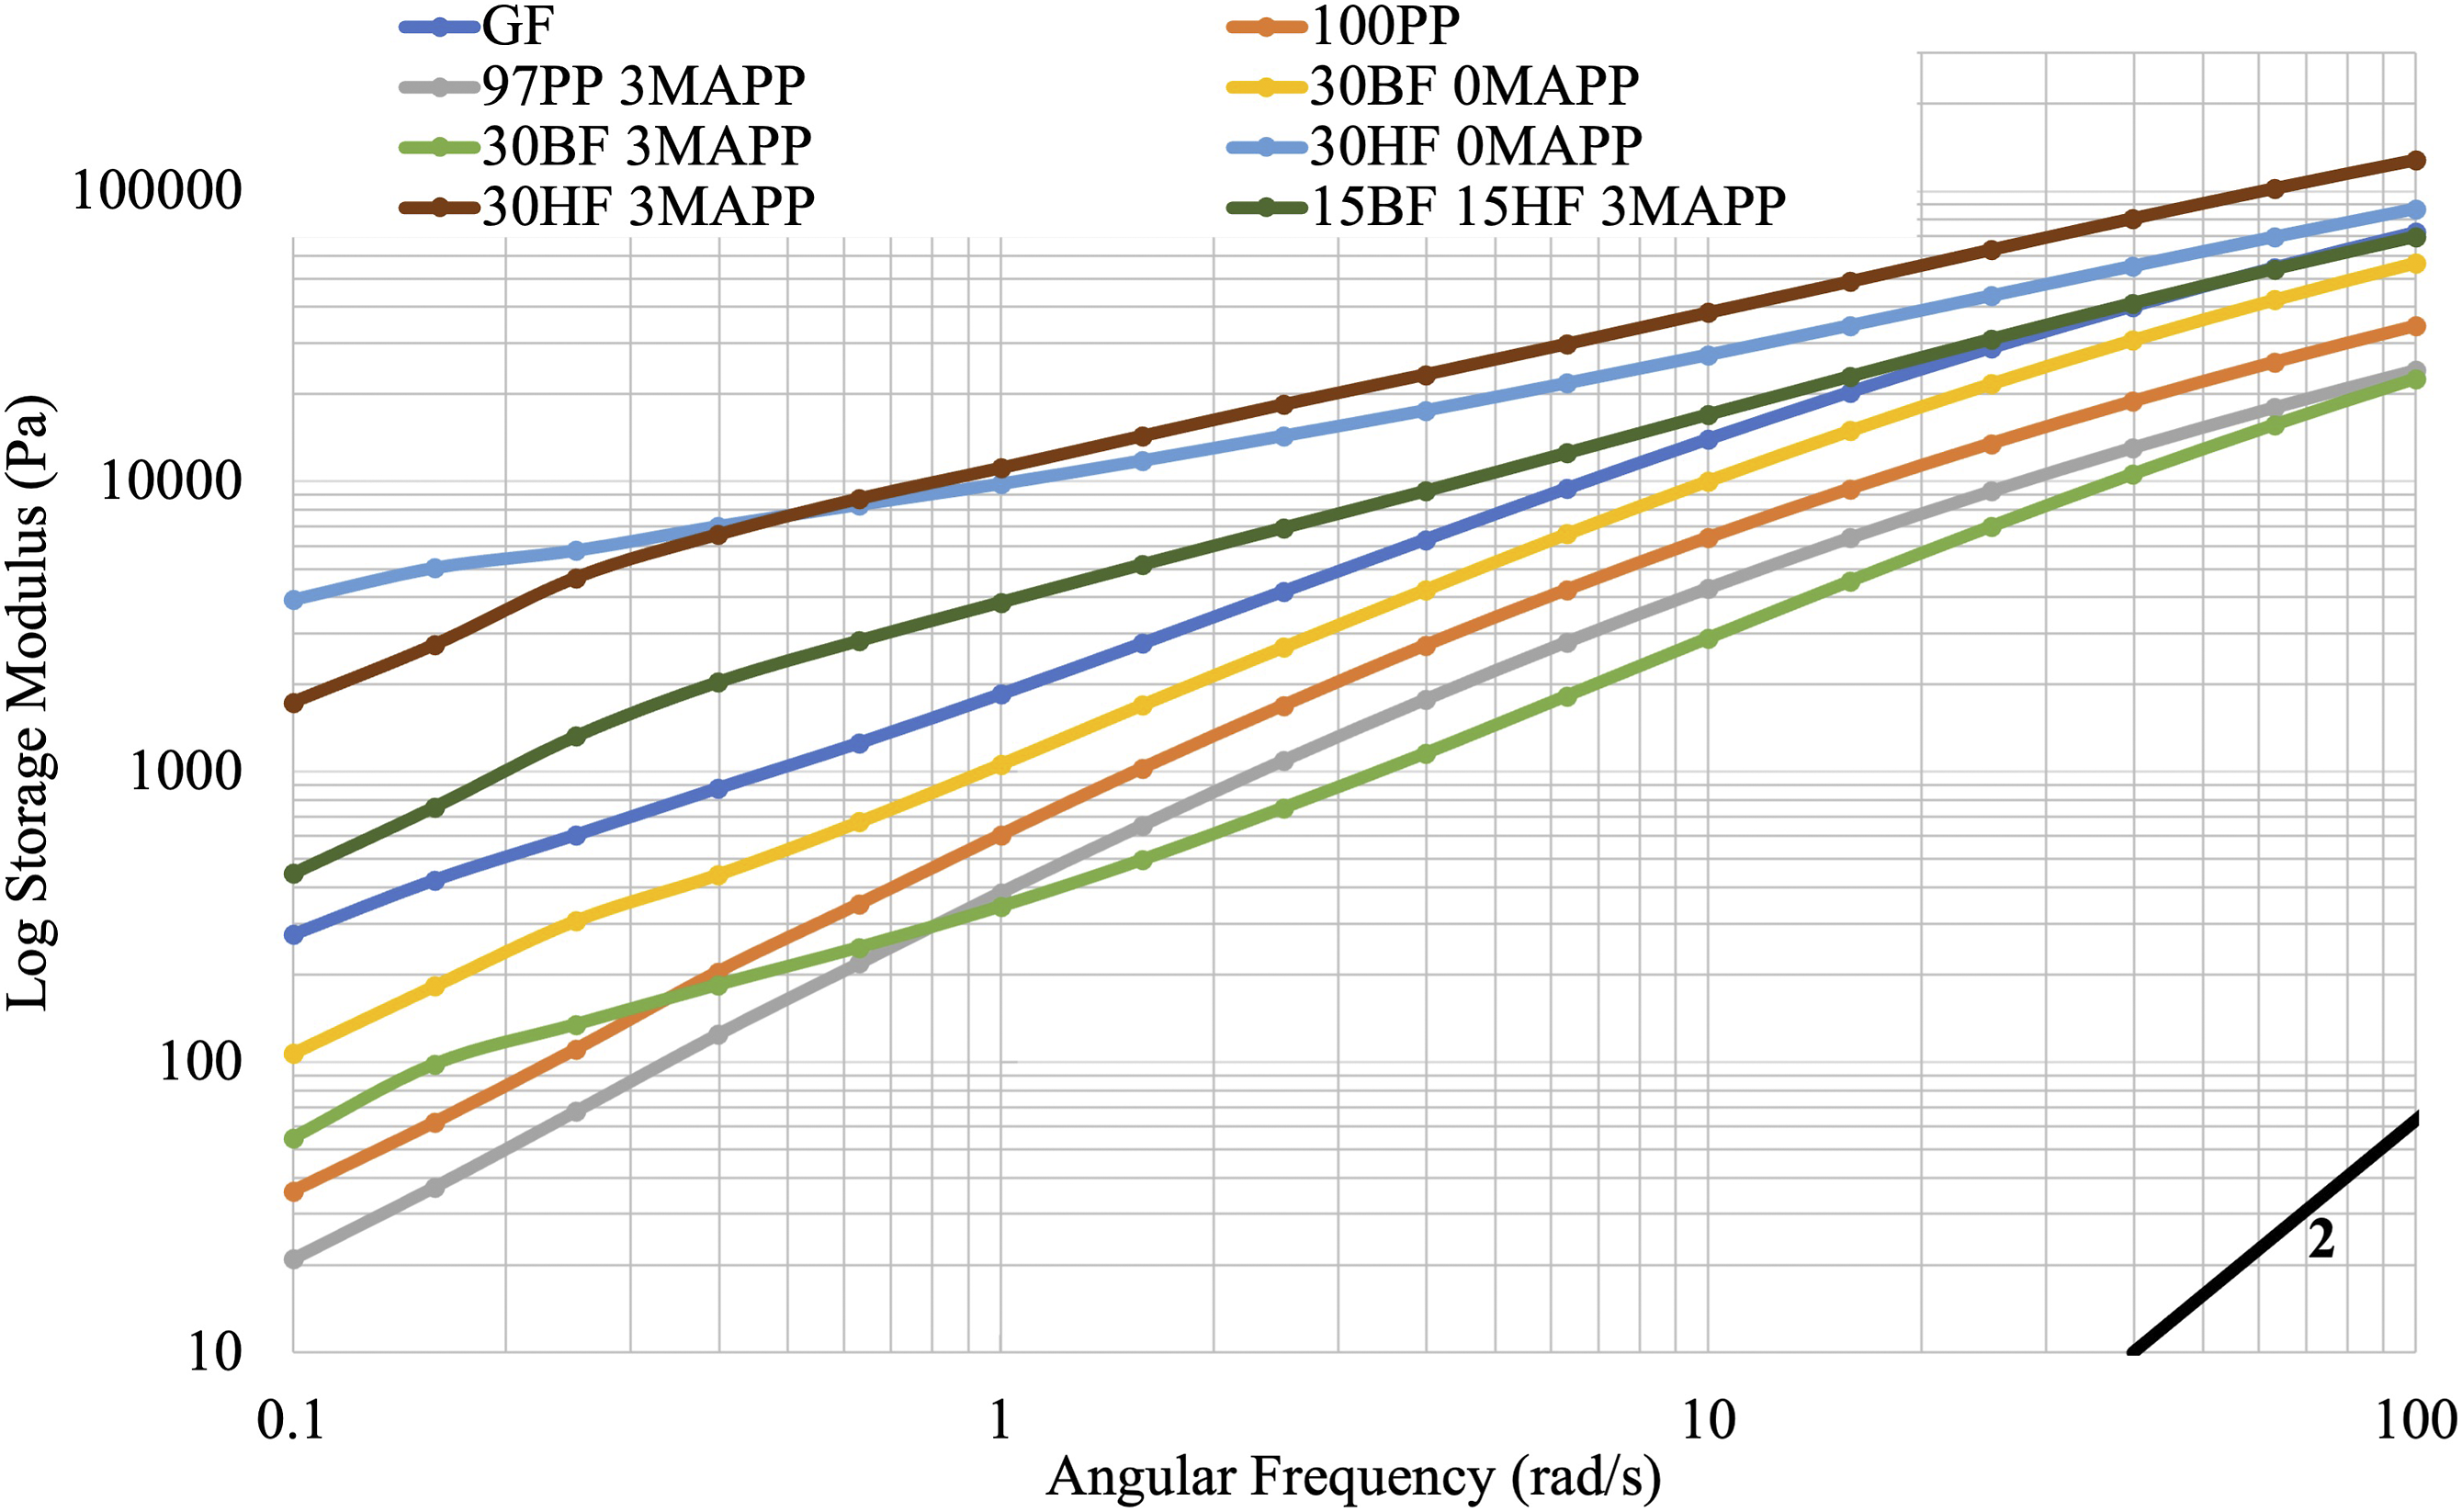
Figure 10 displays the complex viscosity curves. The GF composite viscosity acted as a separation point between the 30HF mixtures and the 30BF mixtures. The 30HF mixtures showed the highest viscosity behavior with an increasing trend corresponding to increasing MAPP content. This is likely due to the greater volume of filler and large fiber size. Additional data can be found in Table 5. Log complex viscosity plots of composite mixtures containing various fiber ratios and MAPP content. The arrow is pointing directly at the GF curve for comparison.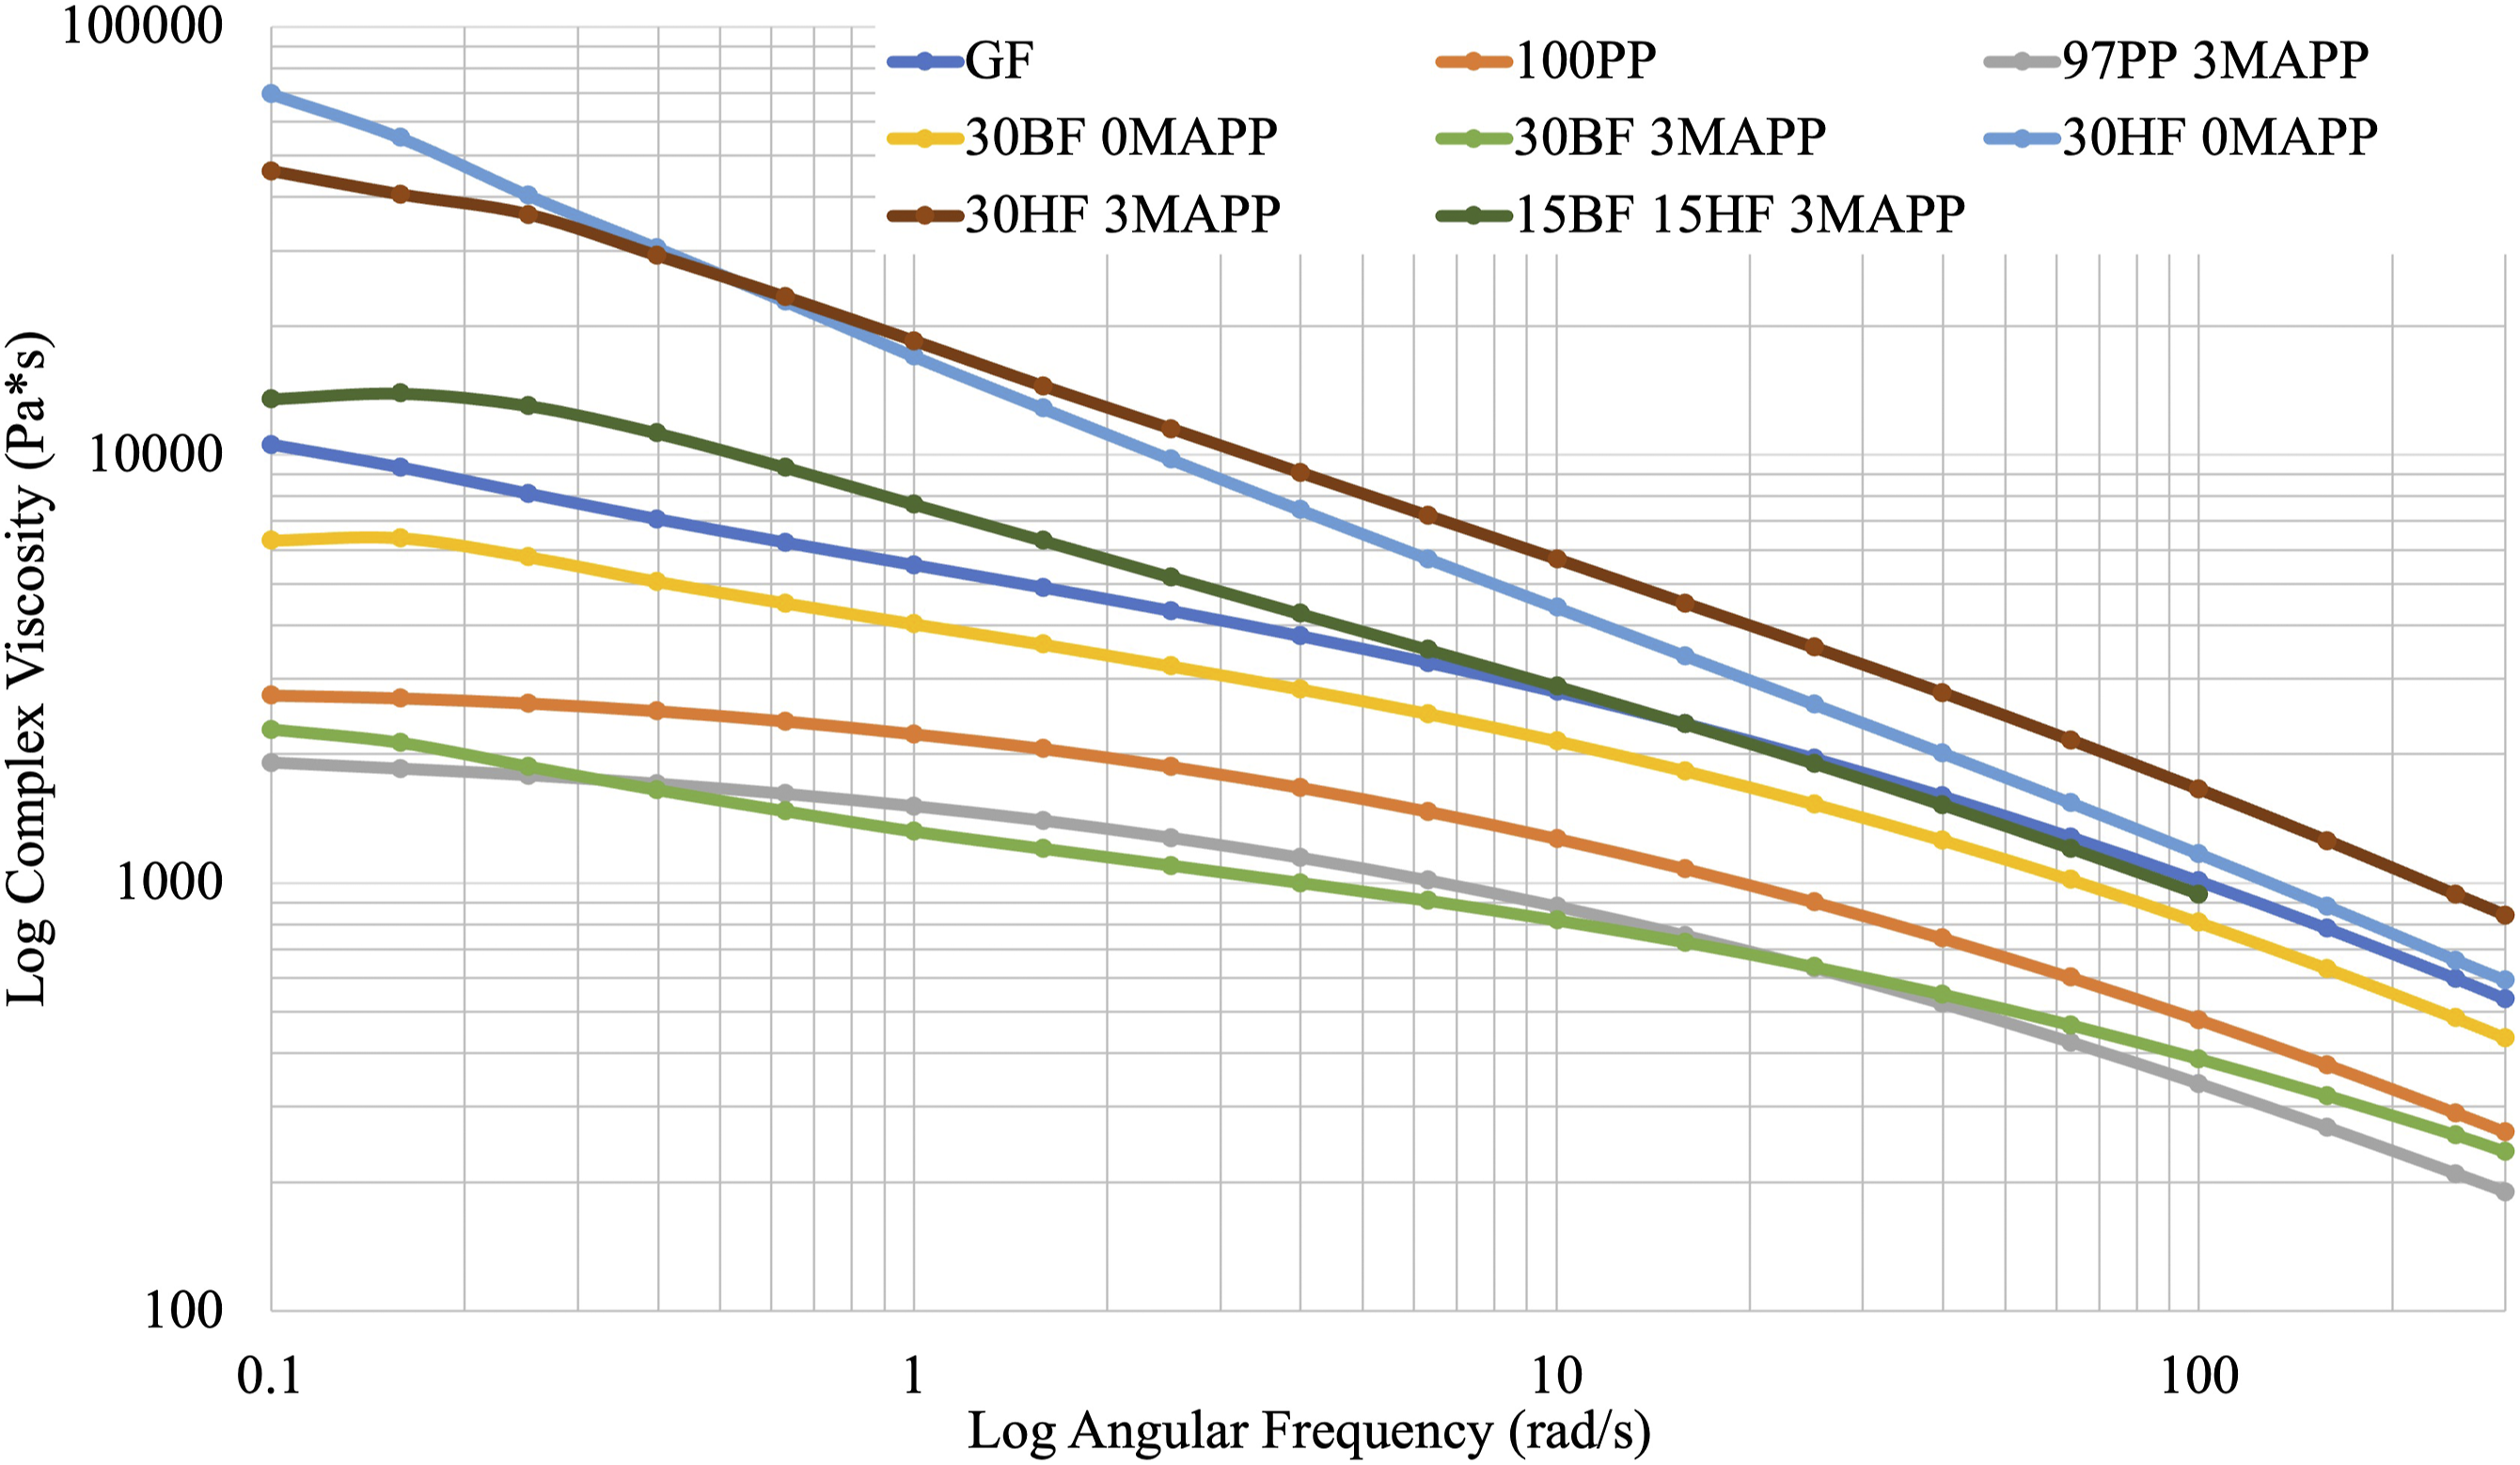
The 30BF blends had lower viscosities than the GF mixture, which could be again due to the lower interaction present between the BFs and PP than the GFs. Unlike the 30HF composites, the opposite trend was observed with a decreasing viscosity as MAPP increased up to 3 wt.% and then increases again at 5 wt.%, which does not correspond to the observed interfacial interactions or mechanical properties. It is believed that a lower molecular weight of MAPP was the cause of this observation. Finally, when observing the hybrid curves, it can be seen that these mixtures have comparable viscosities to the GF mixture. Initially, the hybrid mixtures have a higher viscosity than the GF mixture like the 30HF composites, but as the shear rate increased the viscosity dropped below the levels of the GF mixture, behaving more like that of the 30BF mixtures.
Capillary rheometer data
The capillary rheometer allowed higher shear to be applied to the composite melts. The results showed that at higher shear rates, the 30HF viscosity curves have also fallen below the viscosity curve of the GF mixture, and the GF mixture now has the highest viscosity of the 12 mixtures (Figure 11). The hybrid composites lie between the 30HF and 30BF mixtures but began to converge to a similar shear viscosity of the 30BF mixtures around 800 Hz. The 30BF and hybrid composites displayed significantly lower viscosities compared to the GF mixture at high shear rates. This behavior is thought to be related to the amount of fiber breakage that the GFs experienced during processing.
29
The smaller fiber size of the GF at the same wt.% would lead to a greater surface area of reinforcements, obstructing the flow of the polymer chains. The lower resistance to flow of the BF blends indicates that lower pressures could be used during processing of these materials. Shear viscosity data collected using a capillary rheometer.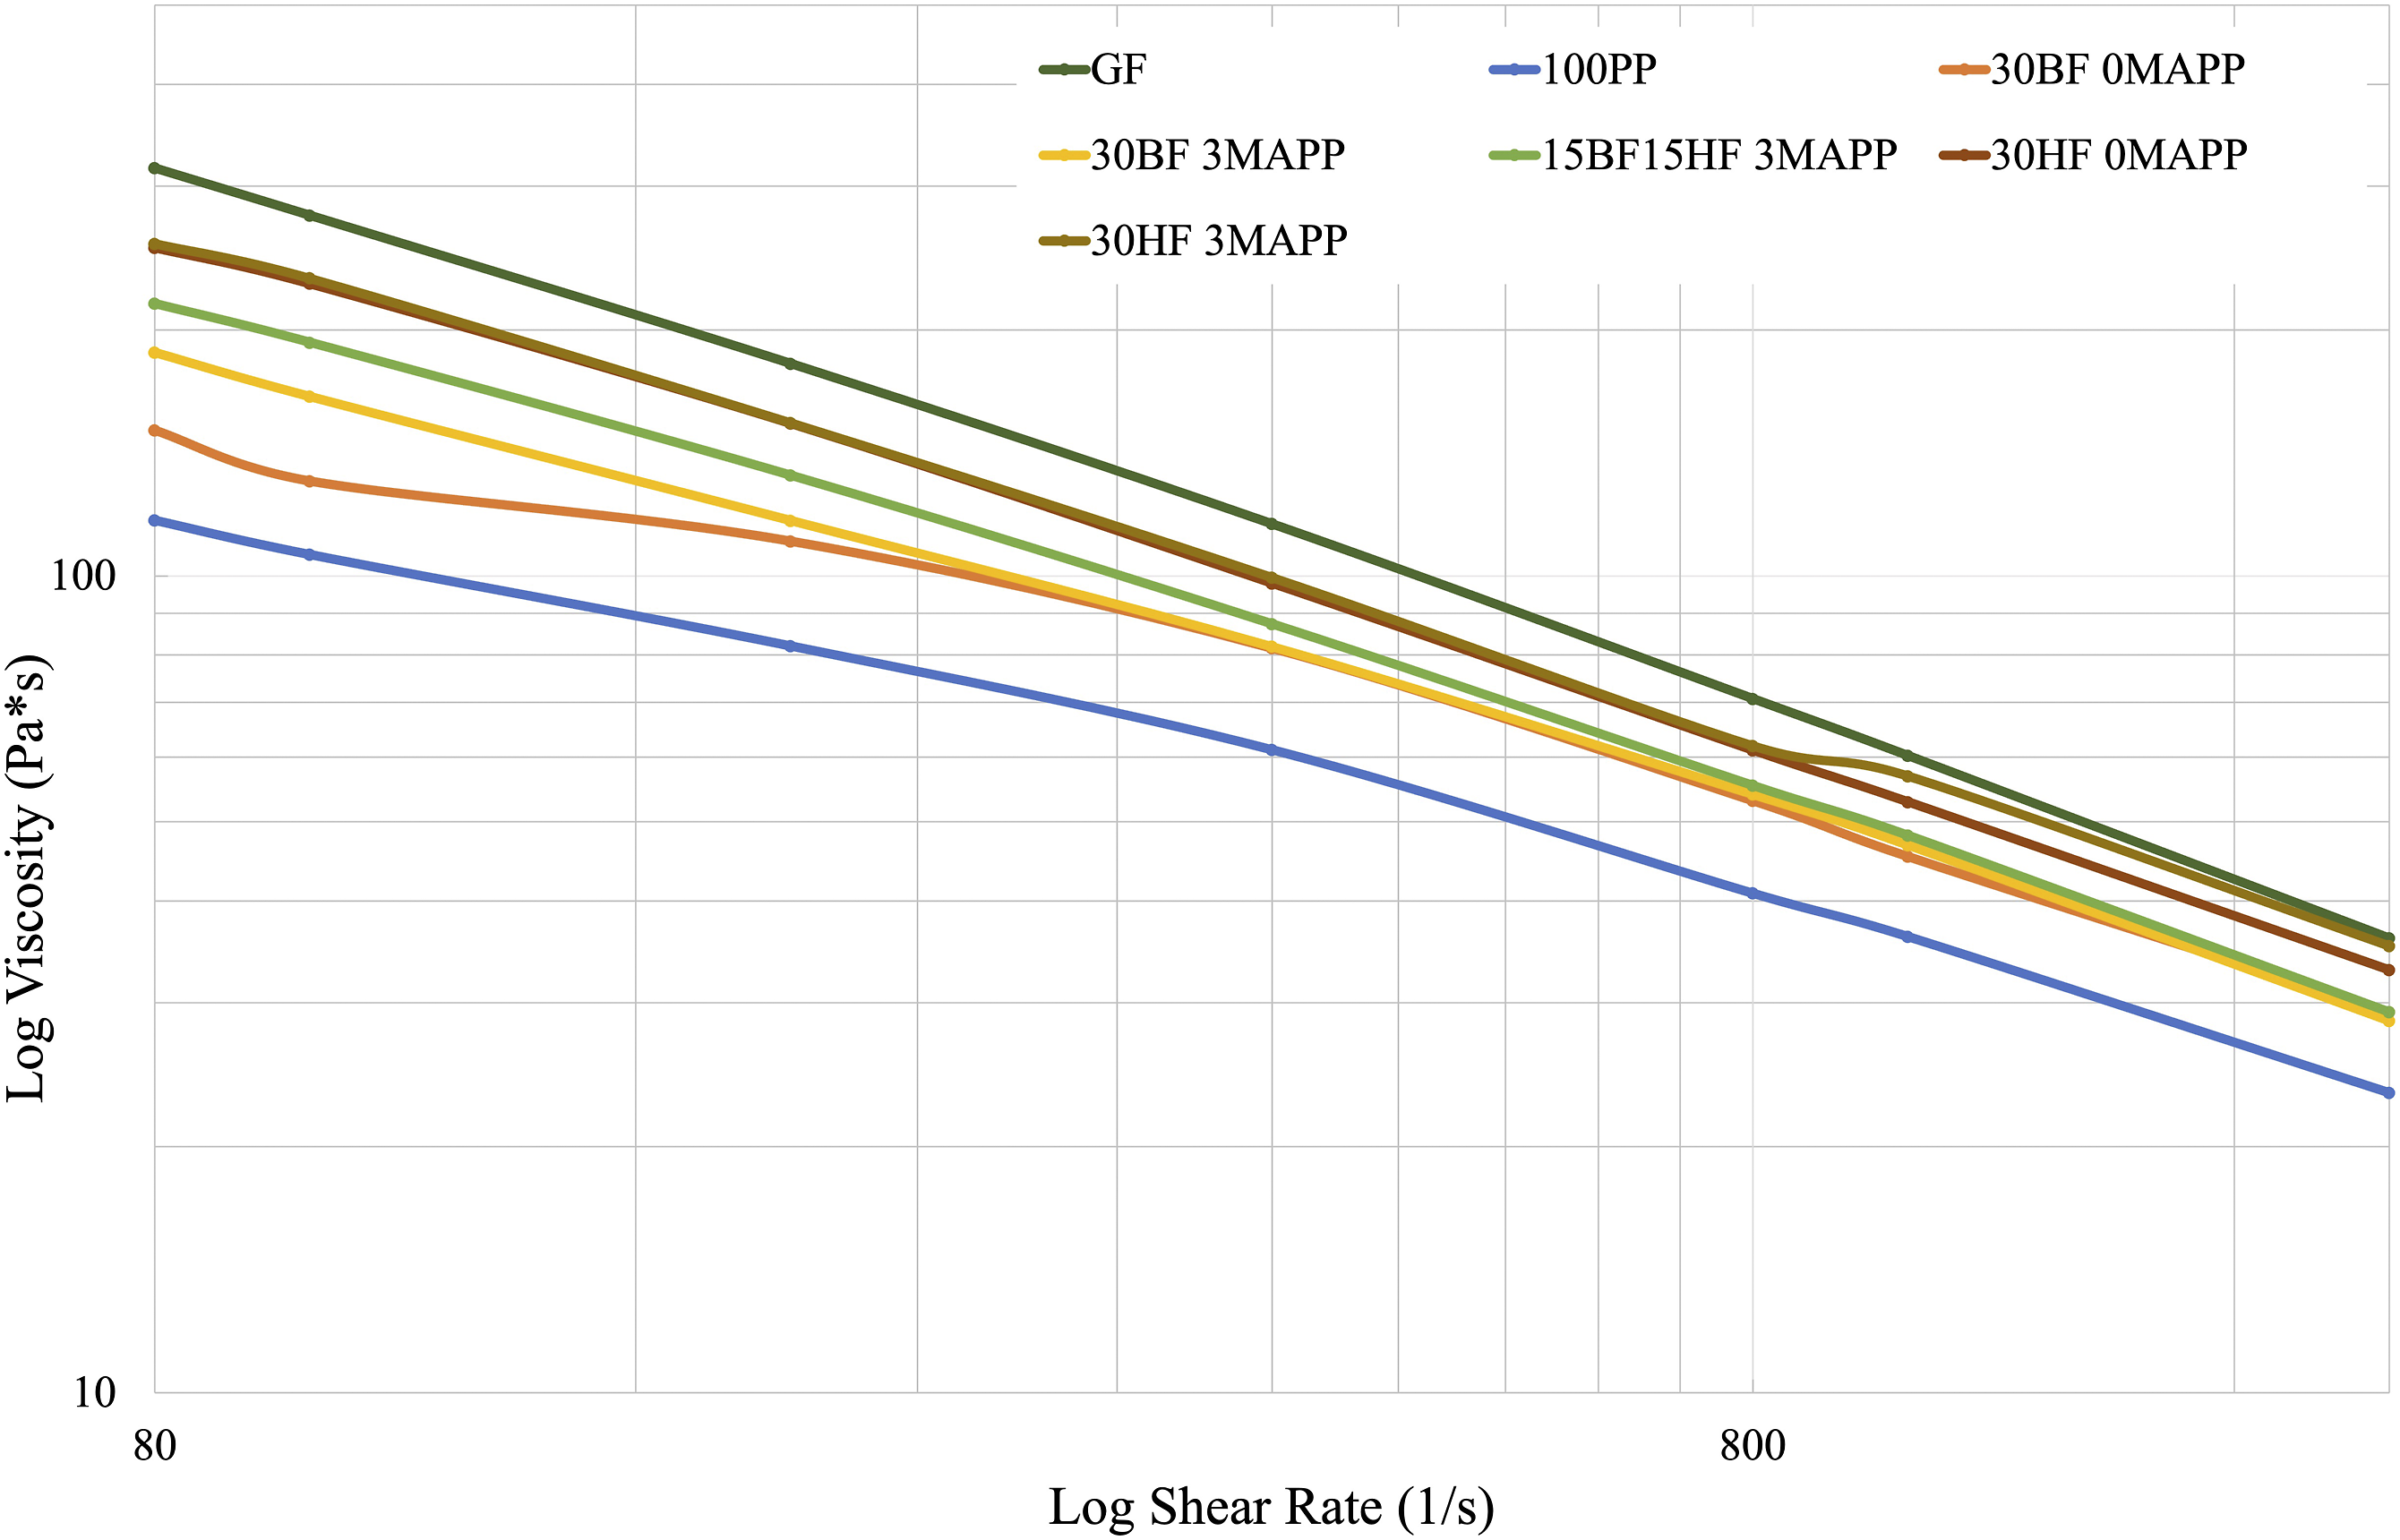
Conclusion
The biocomposites with BF and HF have comparable elastic moduli to the GF/PP composite; though, they are not yet at the strength performance to directly compete with the GF composites being used in industry today. All BFs had a silane sizing applied for a PP matrix, however, the addition of the MAPP coupling agent further enhanced the mechanical strength performance but was not enough to strengthen the bond to the same degree as the pre-compounded GF/PP composite, as seen in the SEM micrographs. The SEM image analysis revealed a decrease in void content of all BF/HF/PP composites when MAPP was incorporated. The GF/PP fracture surface had the lowest void content confirming better fiber-matrix interactions. A fiber length analysis showed that the initial fiber length of BFs does not affect the levels of fiber breakage that occurred during processing, thus resulting in minimal differences between the elastic moduli. However, under the same processing conditions the average fiber length was greater in the BFs than the GFs indicating greater resilience to breakage. This could be beneficial for potential recyclability and should be investigated further.
The rheology data further confirmed this prediction through the storage modulus of the BF/PP blends being lower than that of the GF/PP composite indicating a weaker interfacial bond. However, it was found that all composites tested exhibit shear thinning behavior which is beneficial for processing purposes. Furthermore, the 30BF composite blends had the lowest viscosities of all mixtures tested, and the hybrid mixtures had similar viscoelastic properties to the GF/PP composite blend. The 30HF mixtures had the highest viscoelastic properties and increased with MAPP addition. However, the viscosity appears to converge to lower viscosity value and drops below that of the GF composite at high shear rates. Processing these materials through injection molding would be a viable option and could be introduced into various industries. Additional improvement in interaction between PP and BF/HF is needed to increase the strength to substitute for GF/PP composites.
Footnotes
Acknowledgements
The authors acknowledge Bob Allen, Domenica Gachet, and Spencer Lowder for their assistance with this research, and the Franceschi Microscopy and Imaging Center at Washington State University. We also acknowledge Sudaglass Fiber Technologies, Mafic, Honeywell, and Sunstrand for supplying the materials.
Declaration of conflicting interests
The author(s) declared no potential conflicts of interest with respect to the research, authorship, and/or publication of this article.
Funding
The author(s) disclosed receipt of the following financial support for the research, authorship, and/or publication of this article: This research was funded by the National Science Foundation I/UCRC [grant numbers 1439732 and 1738669].