
Abstract
Impedance spectroscopy analysis has been employed to investigate the effect of melt mixing time on electrical conduction mechanism, direct contact or electron tunneling, of a polymer blend using a conductive masterbatch. A novel approach is proposed to correlate the dispersion/distribution states of conductive nanoparticles within the phases, achieved through kinetic control of the conductive masterbatch, and their impedance properties. A blend of polypropylene and ethylene-vinyl acetate copolymer (PP/EVA) was considered as a case study for the matrix. An electrically conductive masterbatch of multiwalled carbon nanotubes (MWCNTs) in polypropylene-grafted-maleic anhydride (PP-g-MA) was added to the blend. The masterbatch in varying amounts was mixed with PP/EVA in a range of 1 min–4.5 min. The co-continuous morphology of the ternary polymer blend was validated via scanning electron microscopy micrographs. The atomic force microscopy (AFM) results showed that as the mixing time of the masterbatch increases the interconnected structures within the conductive interphase decrease. Impedance spectroscopy using alternating current was employed to probe the conduction mechanism in the composite blends. The impedance spectroscopy results revealed that for samples with low mixing time, a dielectric relaxation peak occurs at high frequencies due to the existence of more conductive pathways as a consequence of the interconnected structures of the masterbatch phase. Also, the major contribution of conductance was direct contact in the samples with low mixing times while electron tunneling mechanism was considerable for the samples with high mixing times. Dielectric constant was increased as a result of interfacial polarization boosting with mixing time. The percolation threshold was considerably decreased from 0.95 v% for simultaneous direct mixing method to 0.16 v% for the masterbatch method.
Introduction
Conductive polymer composites are useful in many applications such as electromagnetic interference shielding, batteries, fuel cells, solar cells, metal coatings, neural injuries treatments, flammable packaging, and so on.1–7 Antistatic property is the key factor in electrical/flammable/EMI packaging. 8 The need of flexibility of material in antistatic packaging makes it very important to decrease percolation threshold. Because a large amount of conductive filler is required to make insulating polymers conductive which makes the polymer brittle. 9 The development of material technologies in the packaging industry can help to preserve the products from damage during transportation, storage, and commercializing processes. Every year, a lot of time and energy is devoted to the enhancement of research and development in this area.10,11 Polymer materials are used in packaging industries, more than other materials, due to their lightness and good processability.12–14 Electrical packaging is one of the main sections of the packaging industry. Antistatic discharge of electronic products, flammable bottles, and containers during transportation and storage due to the triboelectric effect can damage the products or causes fire. Antistatic packaging by the modification of commercial polymers such as polyethylene (PE), PP, and poly (ethylene terephthalate) (PET) is a cost-effective way for solving this problem.15–17 Blending these commercial polymers can improve the purposive properties for antistatic applications such as mechanical properties, film processing, and barrier ability properties.18,19 Also, in polymer blend nanocomposites the adjustability of morphology due to the segregated structure that is originated from the formation of disperse-matrix or co-continuous morphologies and the tendency of conductive nanoparticles for localization in favorite phase is desirable in academic and industry for fabrication of conductive polymer nanocomposites with widespread applications.20,21
In polymer blend nanocomposites, two important parameters that correlate with electrical conductivity and percolation threshold are first, blend morphology, i.e. co-continuous or disperse-matrix and their domain size, and second, nanoparticles localization. The blend morphology can be altered by interfacial properties induced by several parameters such as nanoparticle localization, compatibilizer effect, mixing time, etc.22–24
A lower percolation threshold is usually observed in co-continuous morphology as compared to disperse-matrix morphology on the condition that nanoparticles are predominantly distributed in one phase or at interphase.22,23 Liu et al. investigated Polylactic acid/Polycaprolactone/Multiwalled carbon nanotubes (PLA/PCL/MWCNTs) (70/30) blend nanocomposites. They found that electrical conductivity increases by an order of 10 and percolation threshold decreases from 0.14V% to 0.06V% when a transition from dispersed morphology to co-continuous morphology occurs. They embedded Silicone dioxide (SiO2) particles in PLA to increase PLA viscosity for the development of co-continuous morphology. 25
The electrical percolation threshold dramatically decreases by the localization of nanoparticles at the interface for immiscible polymer blend nanocomposites with a co-continuous morphology due to the confinement of a continuum electrical path. This is well known as double percolation.26,27 Double percolation is also reported for conductive polymer composite foams.28–30 Using an immiscible, but compatible, third polymer component as a favorable phase for nanoparticles and an interfacial agent with improved filler-polymer interactions is one of the most promising methods that has been used for changing the affinity of nanoparticles for localization at the interface.31,32 Chen et al. used acrylonitrile butadiene styrene grafted maleic anhydride (ABS-g-MA) as a compatibilizer for localizing MWCNTs at the interface of polycarbonate/acrylonitrile butadiene styrene (PC/ABS) blends. They reported an ultralow percolation threshold of 0.05 wt.% for the case of using compatibilizer as compared to 0.25 wt% without compatibilizer. 33 In another study, Poothanari et al. 34 reported that the DC electrical conductivity of co-continuous PC/PP blends is increased from 10−12 S/cm without using compatibilizer to 0.33 S/cm using 10 wt% of PP-g-MA as compatibilizer.
PP/EVA blend is a good candidate for cost-effective antistatic films or dielectric films with a low percolation threshold. PP-g-MA as a compatibilizer is inevitable for improving the interfacial adhesion between PP and EVA phase.35–37 Also, PP-g-MA compatibilizer is an interfacial agent for controlling blend morphology, MWCNTs localization, and manipulating conduction properties. 38
The effect of melt mixing time of a conductive composite masterbatch into a co-continuous immiscible polymer blend on electrical behavior of the composite blend has not been reported. Also, the effect of the mixing time on mechanical and dielectric properties, at the same time, would be very useful. In this work first PP-g-MA/MWCNTs (3 v%) masterbatch is prepared through melt mixing. This masterbatch is added to PP/EVA blend through melt mixing at varying mixing times for the masterbatch, after the complete melting of PP/EVA. The idea is to keep MWCNTs in the PP-g-MA phase, as a minor phase, which develops as a third phase in the ternary blend. The relationship between AC/DC electrical conductivity, dielectric constant, dielectric loss, rheological properties, blend morphology, MWCNTs dispersion/distribution, and tensile properties with masterbatch mixing time are investigated. For the first time the mechanism of conduction, either direct contact or electron tunneling is discussed and reported using impedance spectroscopy data. The effect of mixing time and therefore mixing state, MWCNTs distribution state, on these mechanisms are investigated. It is interesting to know how much is the power and benefits of impedance spectroscopy to address morphological changes of a polymer blend nanocomposite. Also a high electrical conductivity is expected to see for the blend with very short mixing time of masterbach but it is a question that how big is this increase and how would be its detrimental effect on mechanical properties due to poor mixing.
Materials and methods
Materials
PP, Topilene J740, melt flow index (230◦ C/2.16 kg) of 25 (g/10 min) and density of 0.9 (g/cm3) was supplied by Hyosung Corporation. EVA with VS430 trade name, melt flow index (190°C, 2.16 kg) of 2.5 (g/10 min), a density of 0.939 (g/cm3), and a melting point of 84°C was provided by Lotte Chemical Corporation. PP-g-MA with ADMER™ QF551 E trade name, 0.5 wt% grafted maleic anhydride, tensile strength at break 25 MPa, the density of 0.89 (g/cm3), melt flow index (230°C, 2.16 kg) of 4.4 (g/10 min) was received from Mitsui Chemicals. The content of grafted maleic anhydride of (PP-g-MA) was measured by titration method. Commercial unfunctionalized MWCNT with nominal values of d = 10–30 nm, L = 10–30 μm, A >200 m2 G−1 and purity>95 wt% was supplied by United Nano, India.
Sample preparation
The samples were mixed in a 60 cm3 internal melt mixer, Misagh Afzar, Tehran, Iran, at 190°C and 60 rpm. PP-g-MA and CNT were mixed for 10 min in the internal mixer at 190°C and 60 rpm to prepare a masterbatch of PP-g-MA/CNT (3 v%). Then conductive polymer blends were prepared using this masterbatch. First PP and EVA (40/60 v%) were melt-blended at the same condition but for 6 min. Then the PP-g-MA/CNT masterbatch was added at 20 v% to the blend and mixing was continued for 1, 2.5, and 4.5 min to prepare PP/EVA/PP-g-MA/CNT (0.6 v%) blends. The nanocomposites were molded into 1.5 mm thick sheets or thin films using a hot press at 200°C, 5 min preheat, and 100 bar for 3 min. For comparison purposes a direct mixing sample was prepared by melt-mixing of all components which were added at the same time to the internal mixer and mixed for 10 min.
Characterization
Dynamic rheometry was carried out using MCR300 of Physica rheometer, Anton Paar, Austria at 190°C. First, a strain sweep test at a frequency of 1 HZ was performed on a blend composite sample to determine the linear viscoelastic region. Based on that, a strain of 1% was used for a frequency sweep of 0.1–600 HZ. The DC electrical resistivity of the samples with a conductivity of lower than 10−4 S/cm was measured using a Keithley electrometer, model 610°C through a two-point probe method. For the samples with higher electrical conductivity, the measurements were performed by a four-point probe method (in-plane conductivity) using a DC supply IT6123 from ITECH company and a Mastech MS8050 Digital multimeter.29,30,39 A Hitachi S-4160 field emission scanning electron microscope (FE-SEM) at 10 kV accelerating voltage was used to characterize the morphology of the blends and localization of MWCNTs. The samples were immersed in liquid nitrogen for 5 min and then fractured immediately. Some of the fractured samples were etched by 1,2-Dichloroethane at 70°C. The cryo-fractured surfaces were coated with gold to make sure the surface is sufficiently electrically conductive. The tensile test was carried out by a 2 ton JJ universal testing machine, Jinjian Co, China, according to ASTM D638-10 at a crosshead speed of 20 mm/min. The static contact angle of the polymers was measured using a surface tension measurement device, CAG-20, Jikan Co at 25°C. To investigate the inductive-capacitive and dielectric properties of the samples, the impedance changes against frequency (0.1–1,000,000 (1/s)) were measured using a Sharif Solar potentiostat, Tehran, Iran, in EIS mode. An alternating voltage of 2000 mV was applied to the samples in frequency mode. A multifunctional atomic force microscopy (AFM), ARA-AFM, Ara Pajoohesh, Iran with a silicone tip was used to study the morphology and surface topology of the samples in both contact and tapping modes. The samples were cryogenically ultramicrotomed into 1 micron-thick sections using a HIS-2260 rotary microtome, mrc company, UK to obtain specimens with a smooth surface for AFM. The samples were etched with 1,2 dichloroethane at 70°C to mark the EVA phase.
Results and Discussion
MWCNTs localization in PP/PP-g-MA/EVA polymer blends
Surface energies of PP, PP-g-MA, EVA, and MWCNTs at 25°C.
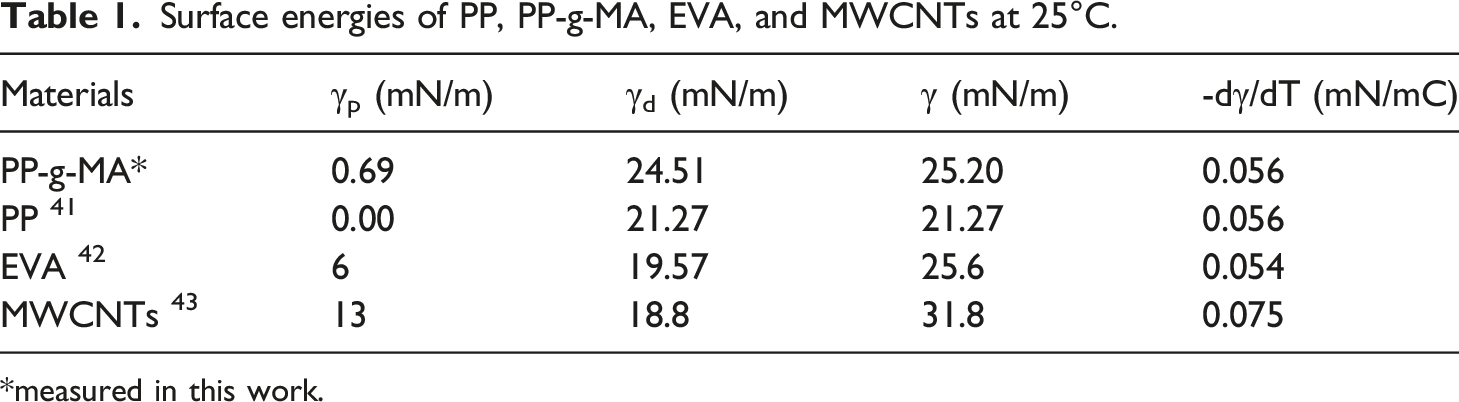
*measured in this work.


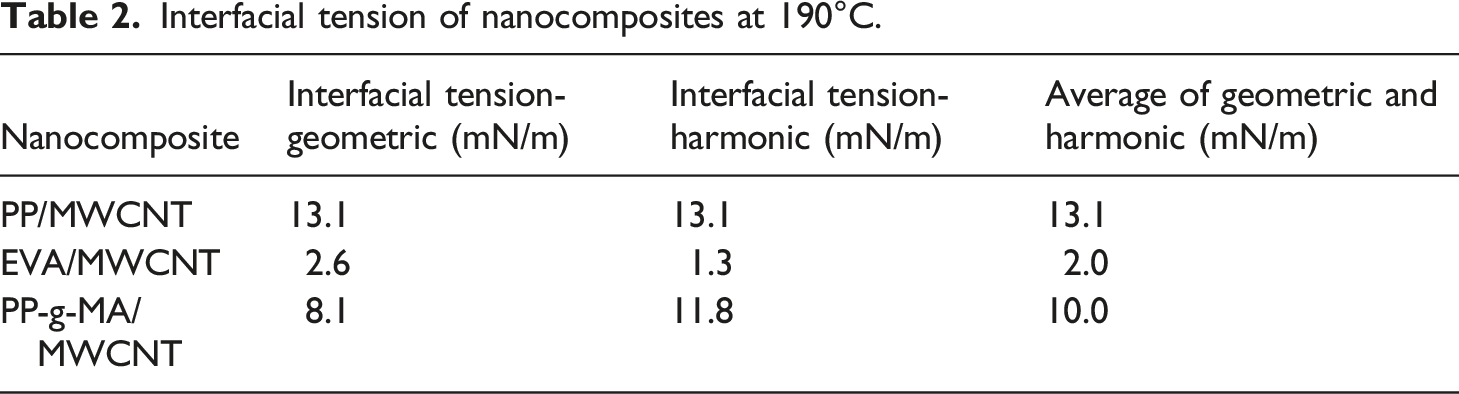
Interfacial tension of nanocomposites at 190°C.
Microstructure evaluation
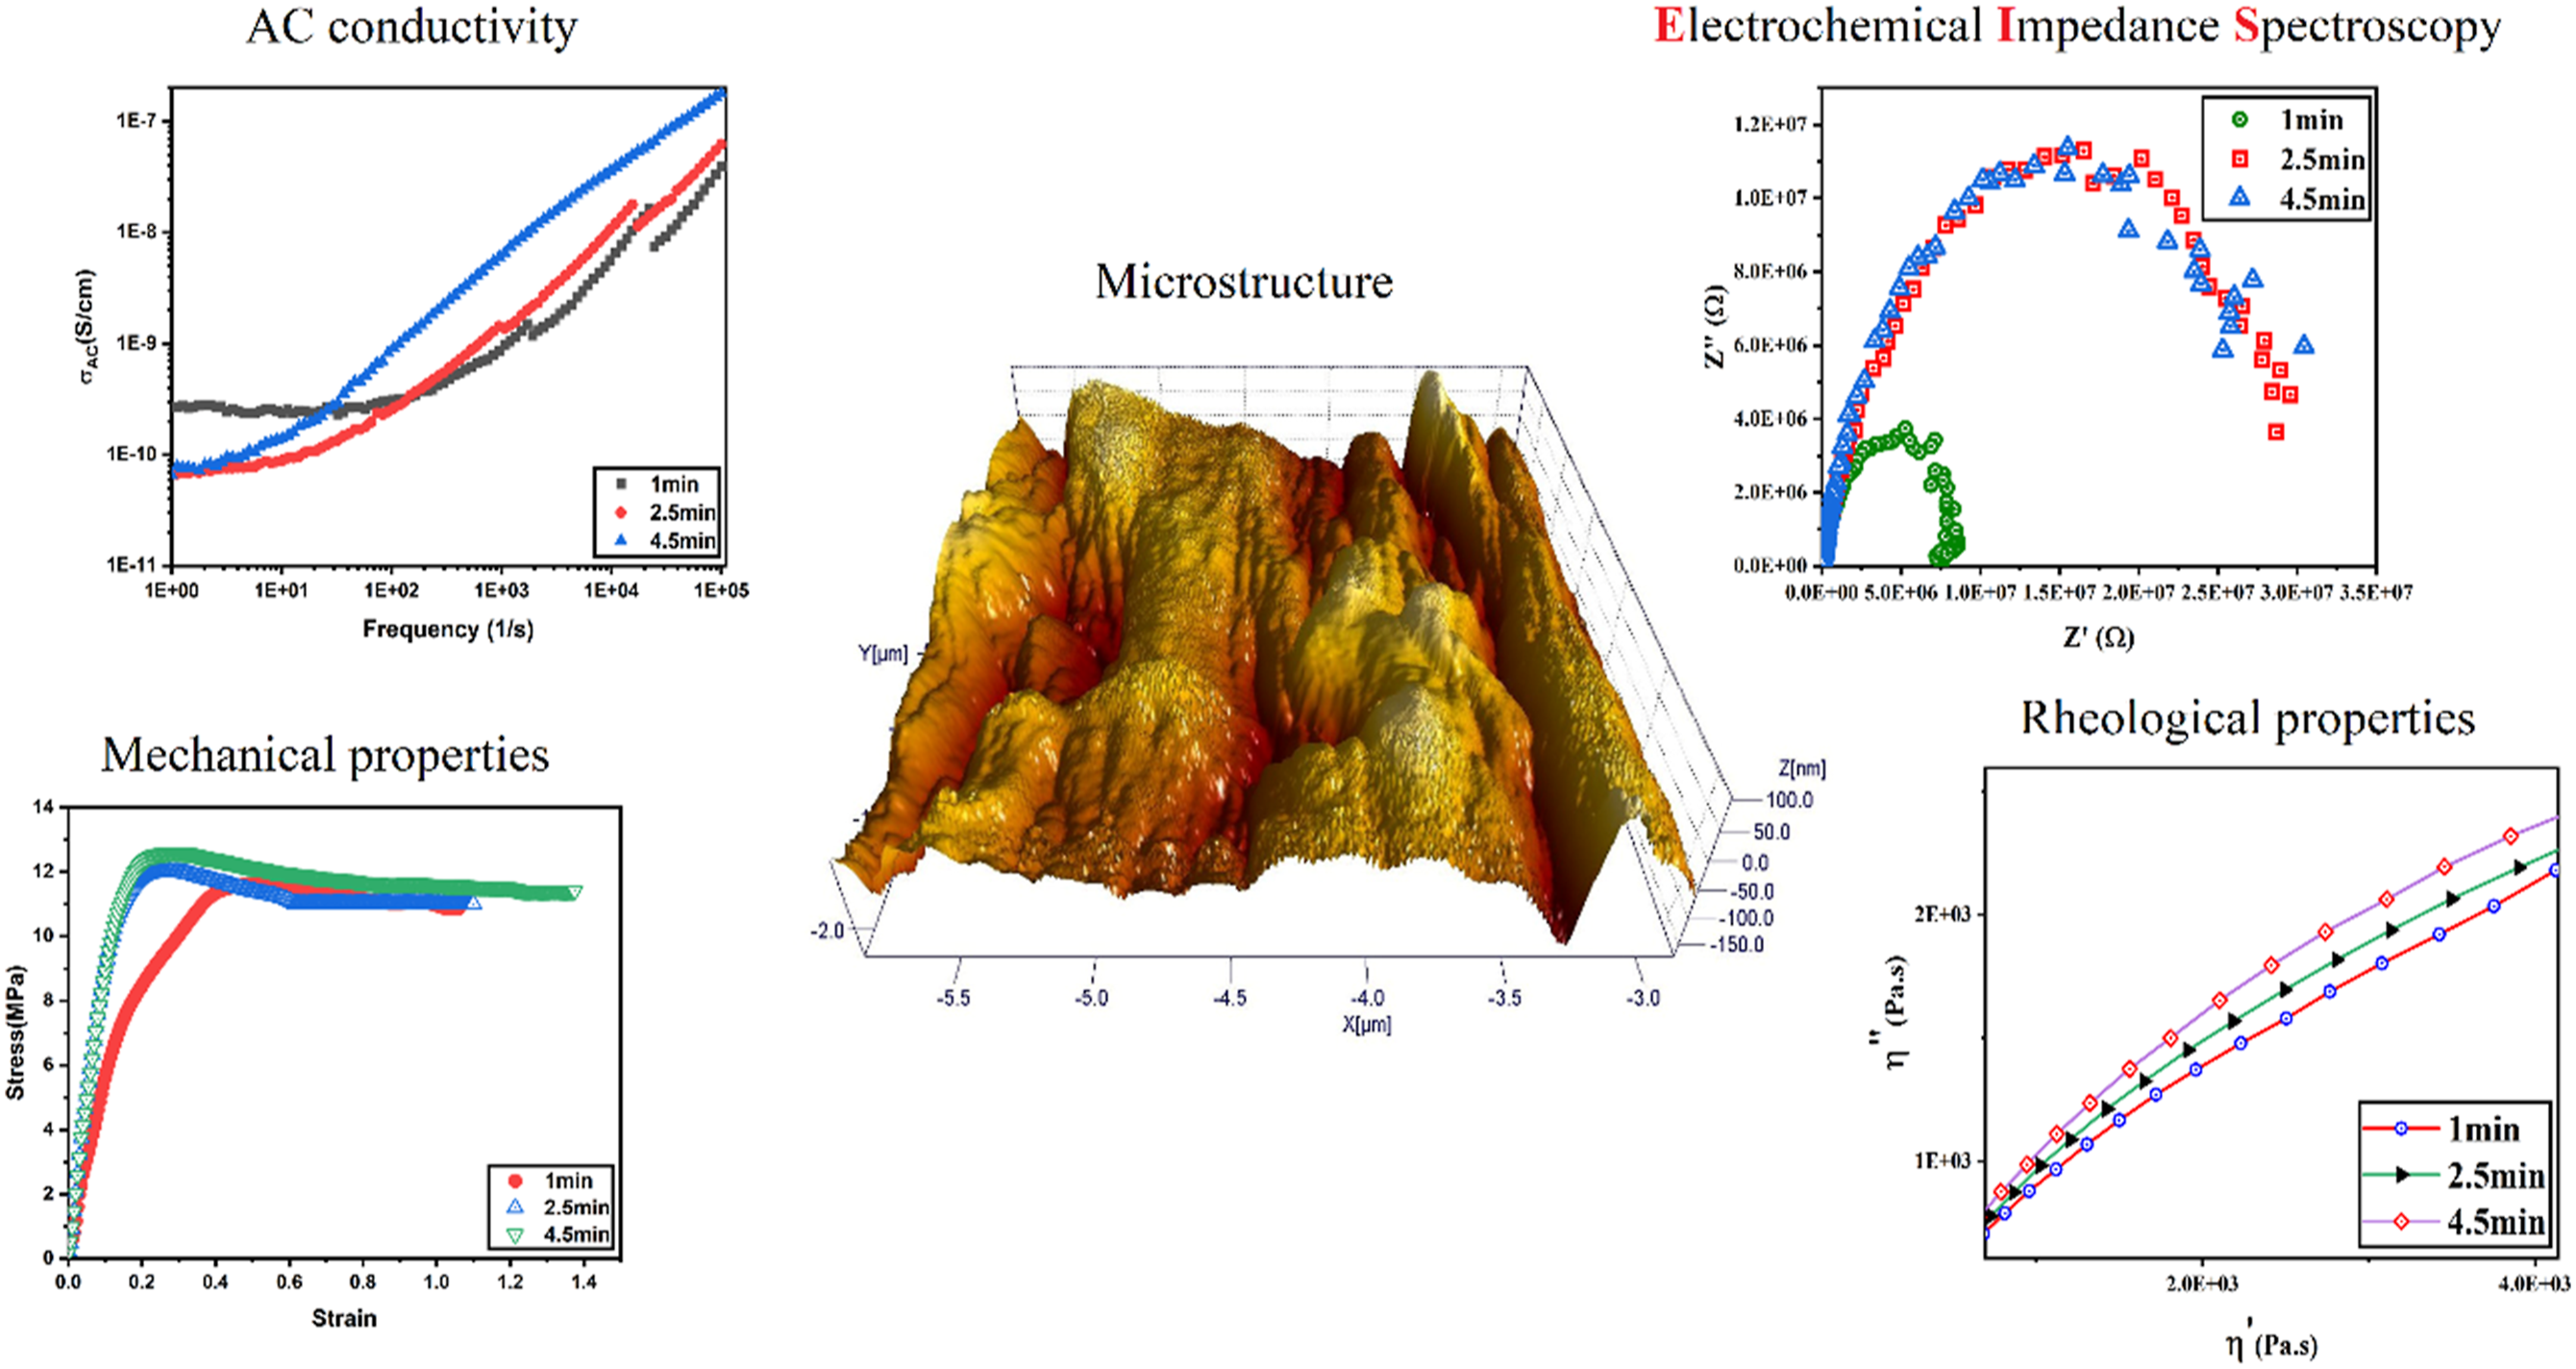
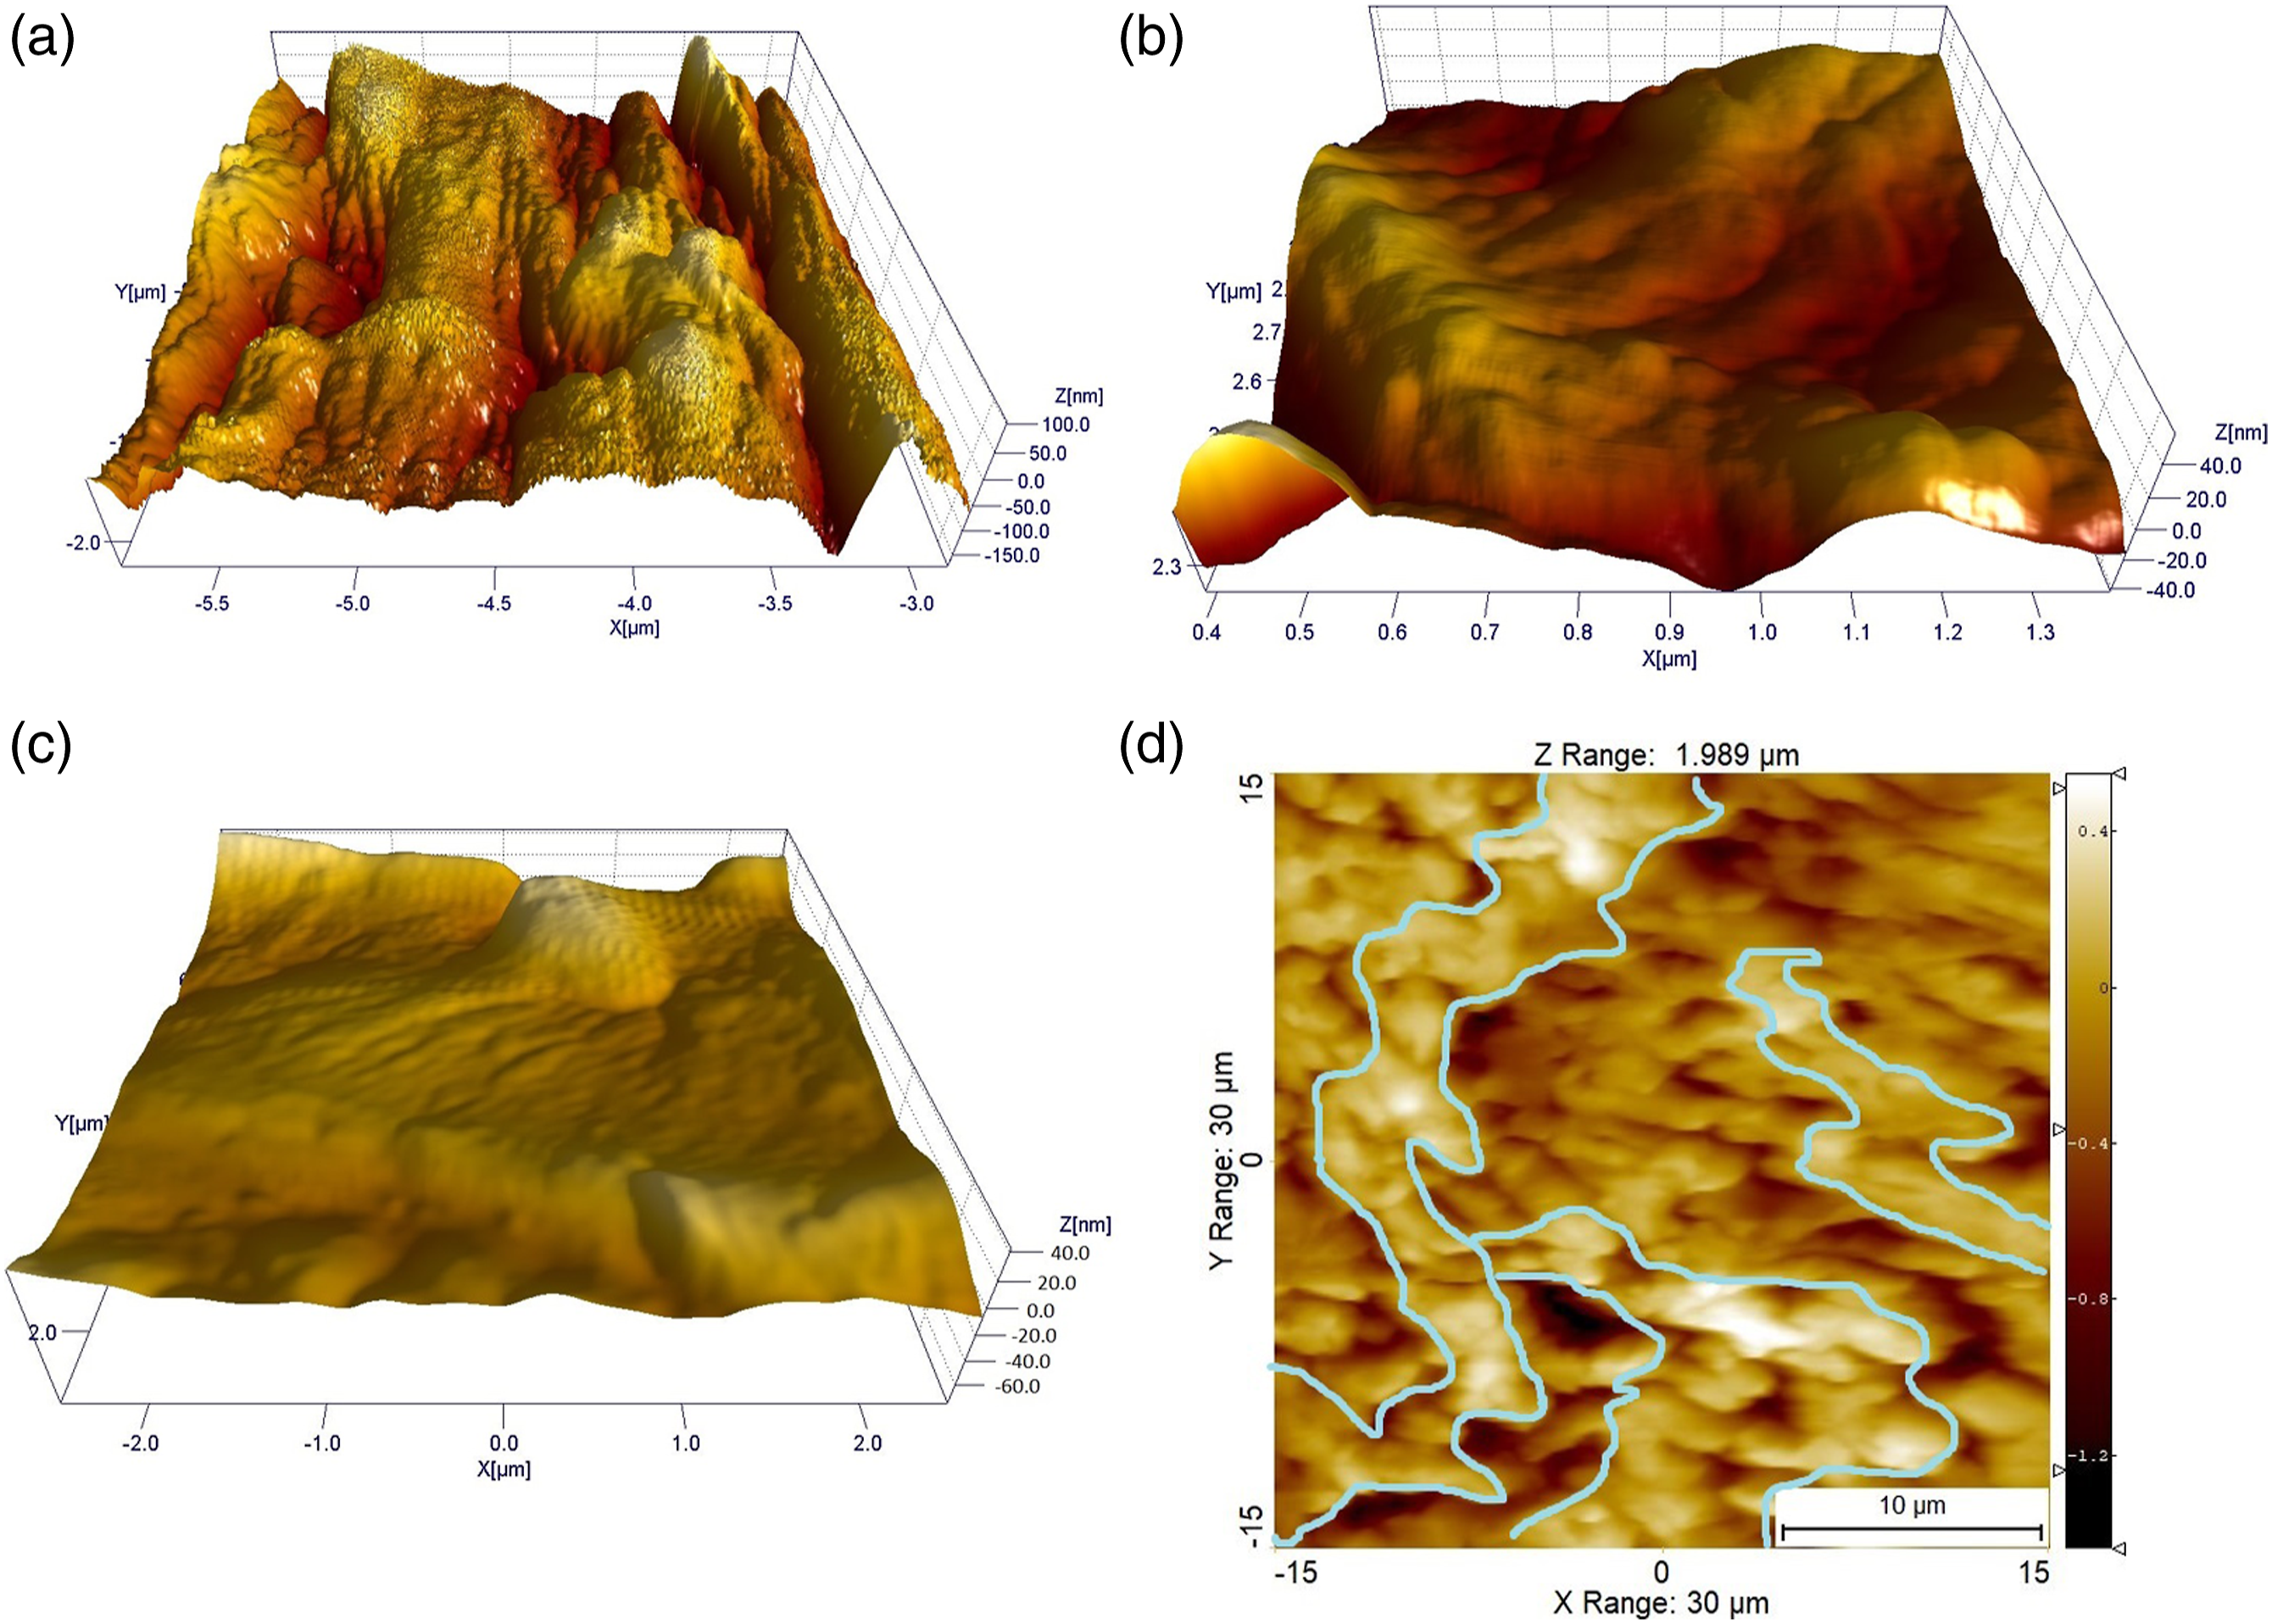
Figure 1, shows FE-SEM micrographs of the nanocomposite blends containing PP-g-MA/CNT masterbatch after 1 min, 2.5 min, and 4.5 min mixing. A co-continuous morphology is observed for the three samples. Also, the degree and quality of co-continuity has further developed by increasing the mixing time. A co-continuous morphology is known as the preferred morphology for lower percolation threshold in conductive polymer blends.44,45 Figure 2(d), shows the AFM image of the sample with 1 min mixing time of the masterbatch. Due to the etching of EVA phase with 1,2, dicholoroethane, this phase has appeared in slightly dark color and the PP or PP-g-MA/MWCNTs phase has appeared in slightly bright color.
46
According to Figure 2(d),(a) continuum structure of masterbatch with a bright color is observed for the sample with a short mixing time of 1 min. The topography images from AFM for the three mixing times of 1, 2.5 and 4 min are demonstrated in Figures 2(a)–(c). As seen a higher mixing time of masterbatch causes better homogeneity and therefore lower surface roughness. FE-SEM micrographs of a) 1 min, b) 2.5 min and, c) 4.5 min samples. AFM in tapping mode topography images of a) 1 min, b) 2.5 min, and c) 4.5 min samples, and d) AFM contact mode image of 1 min sample.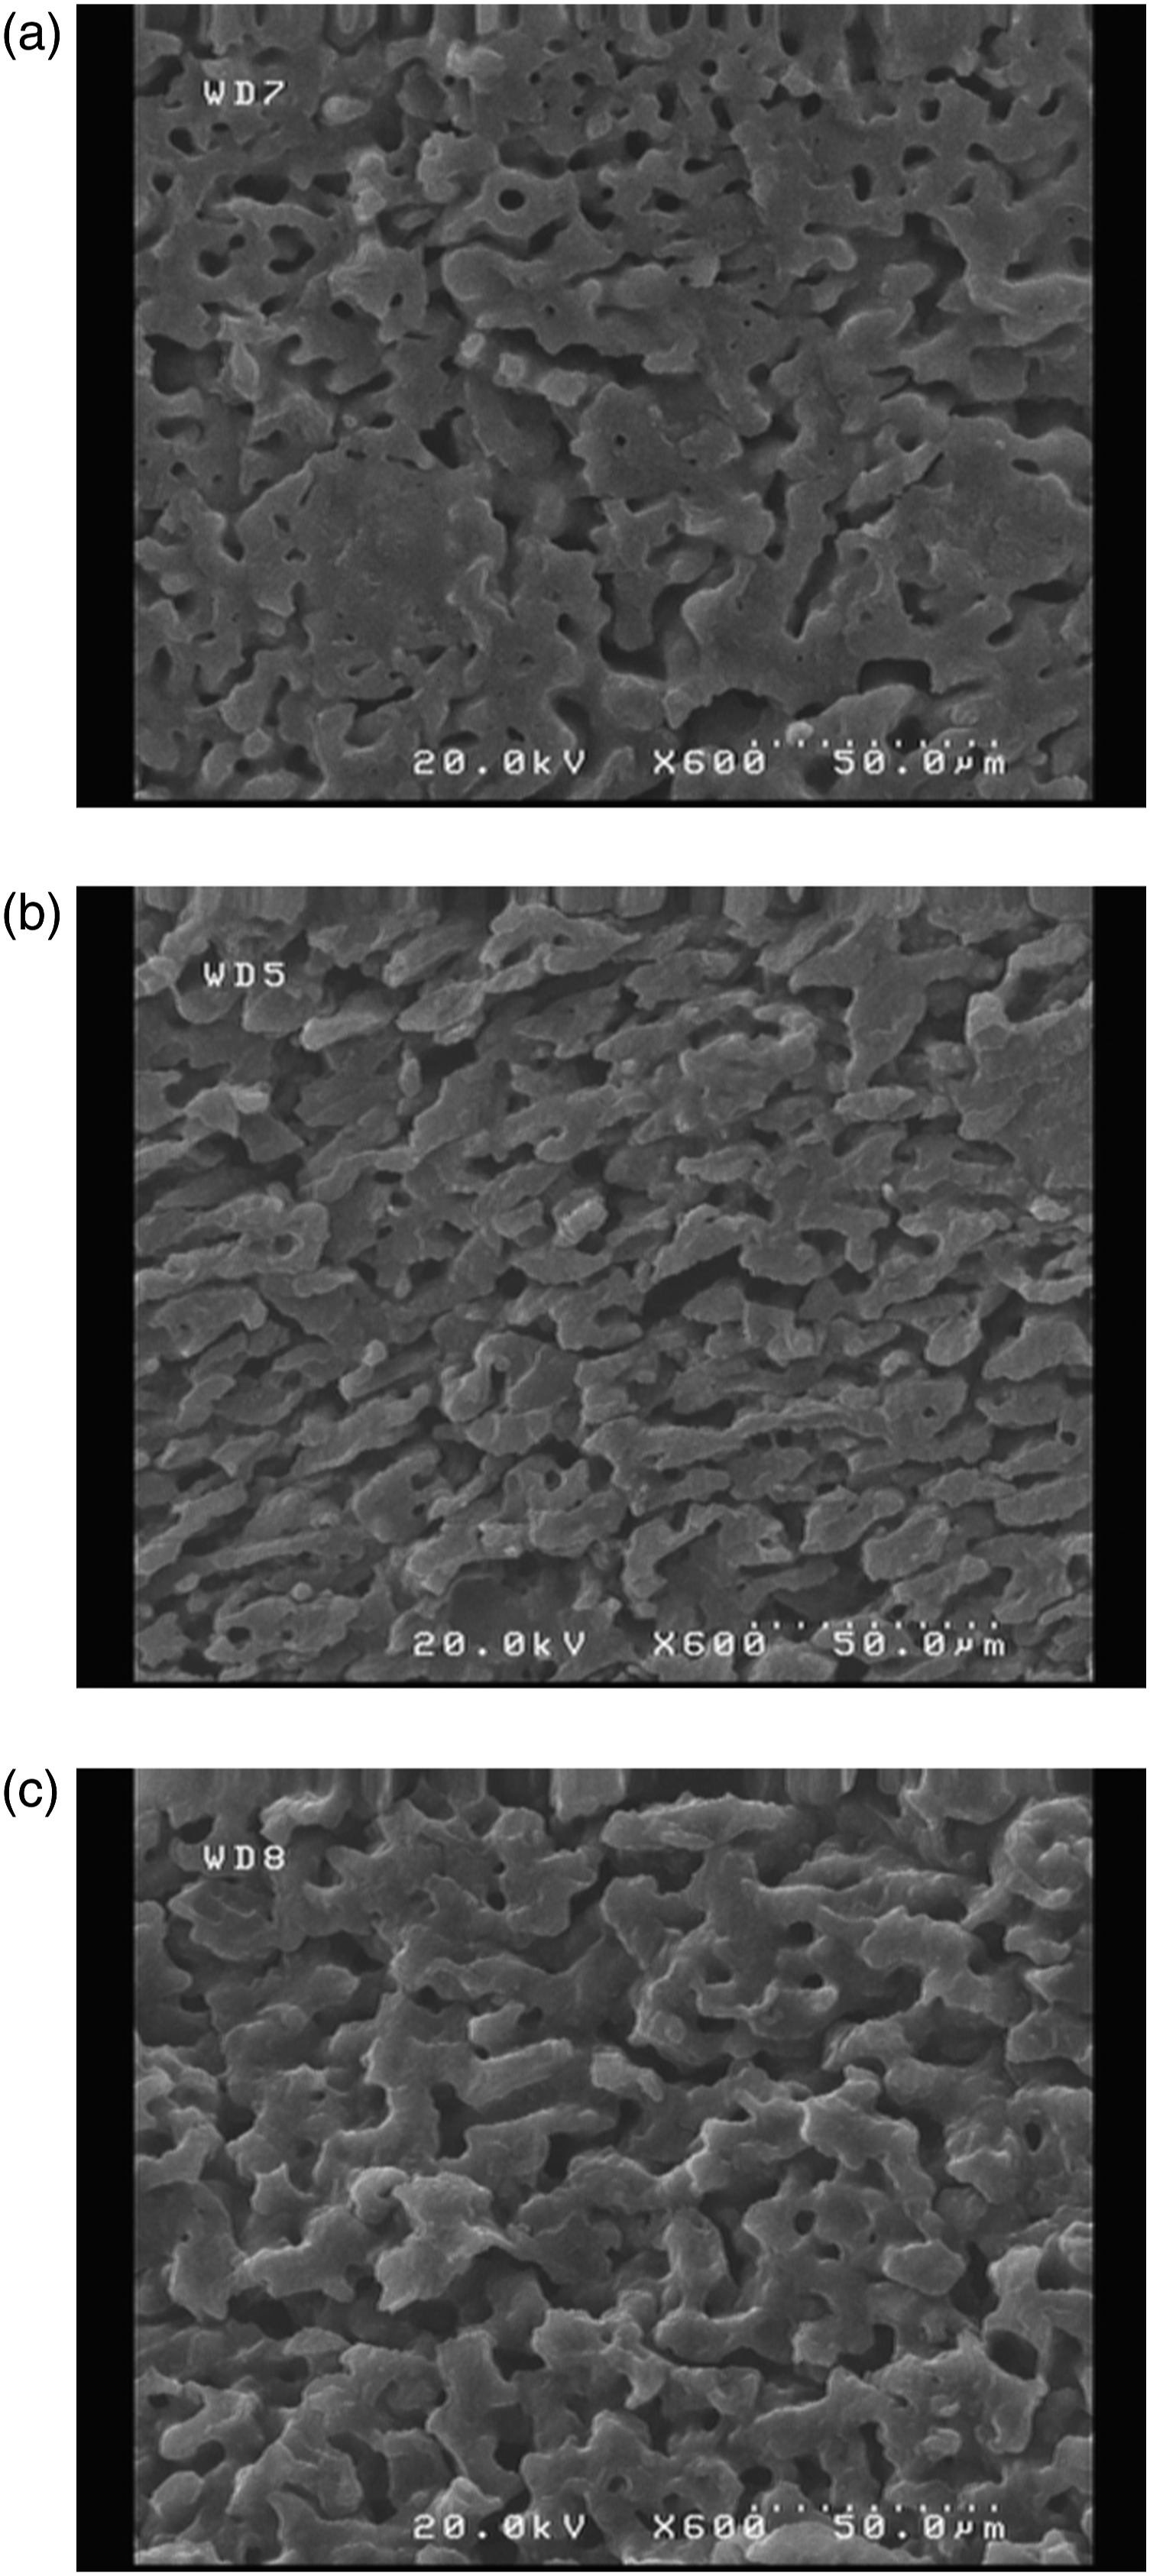
Briefly a successful co-continuous morphology of PP/EVA was developed in the samples with a continuous phase of PP-g-MA/MWCNTs masterbatch at their interface.
Further attention into AFM image in Figure 2(a) shows needle like particles i.e. MWCNTs in the PP-g-MA phase. 47 The smooth bright areas are PP which is poor in CNT. The needle-like bright areas could be PP-g-MA or its interface with PP or EVA which is rich in CNT. Therefore, the wish of putting MWCNTs in a minor phase of PP-g-MA localized at the interface of PP/EVA has come true (further results are included in supplementary information, Supplementary Figure S1).
Electrical percolation threshold
Figure 3 shows the volume DC electrical conductivity versus volume fraction of MWCNT for the blends prepared through the masterbatch method with 1 min mixing time. By fitting equation (5), the universal percolation model, on the experimental results of Figure 3(a) percolation threshold of 0.16 v% was obtained.
48
Log (volume electrical conductivity) vs MWCNTs volume fraction for 1 min sample.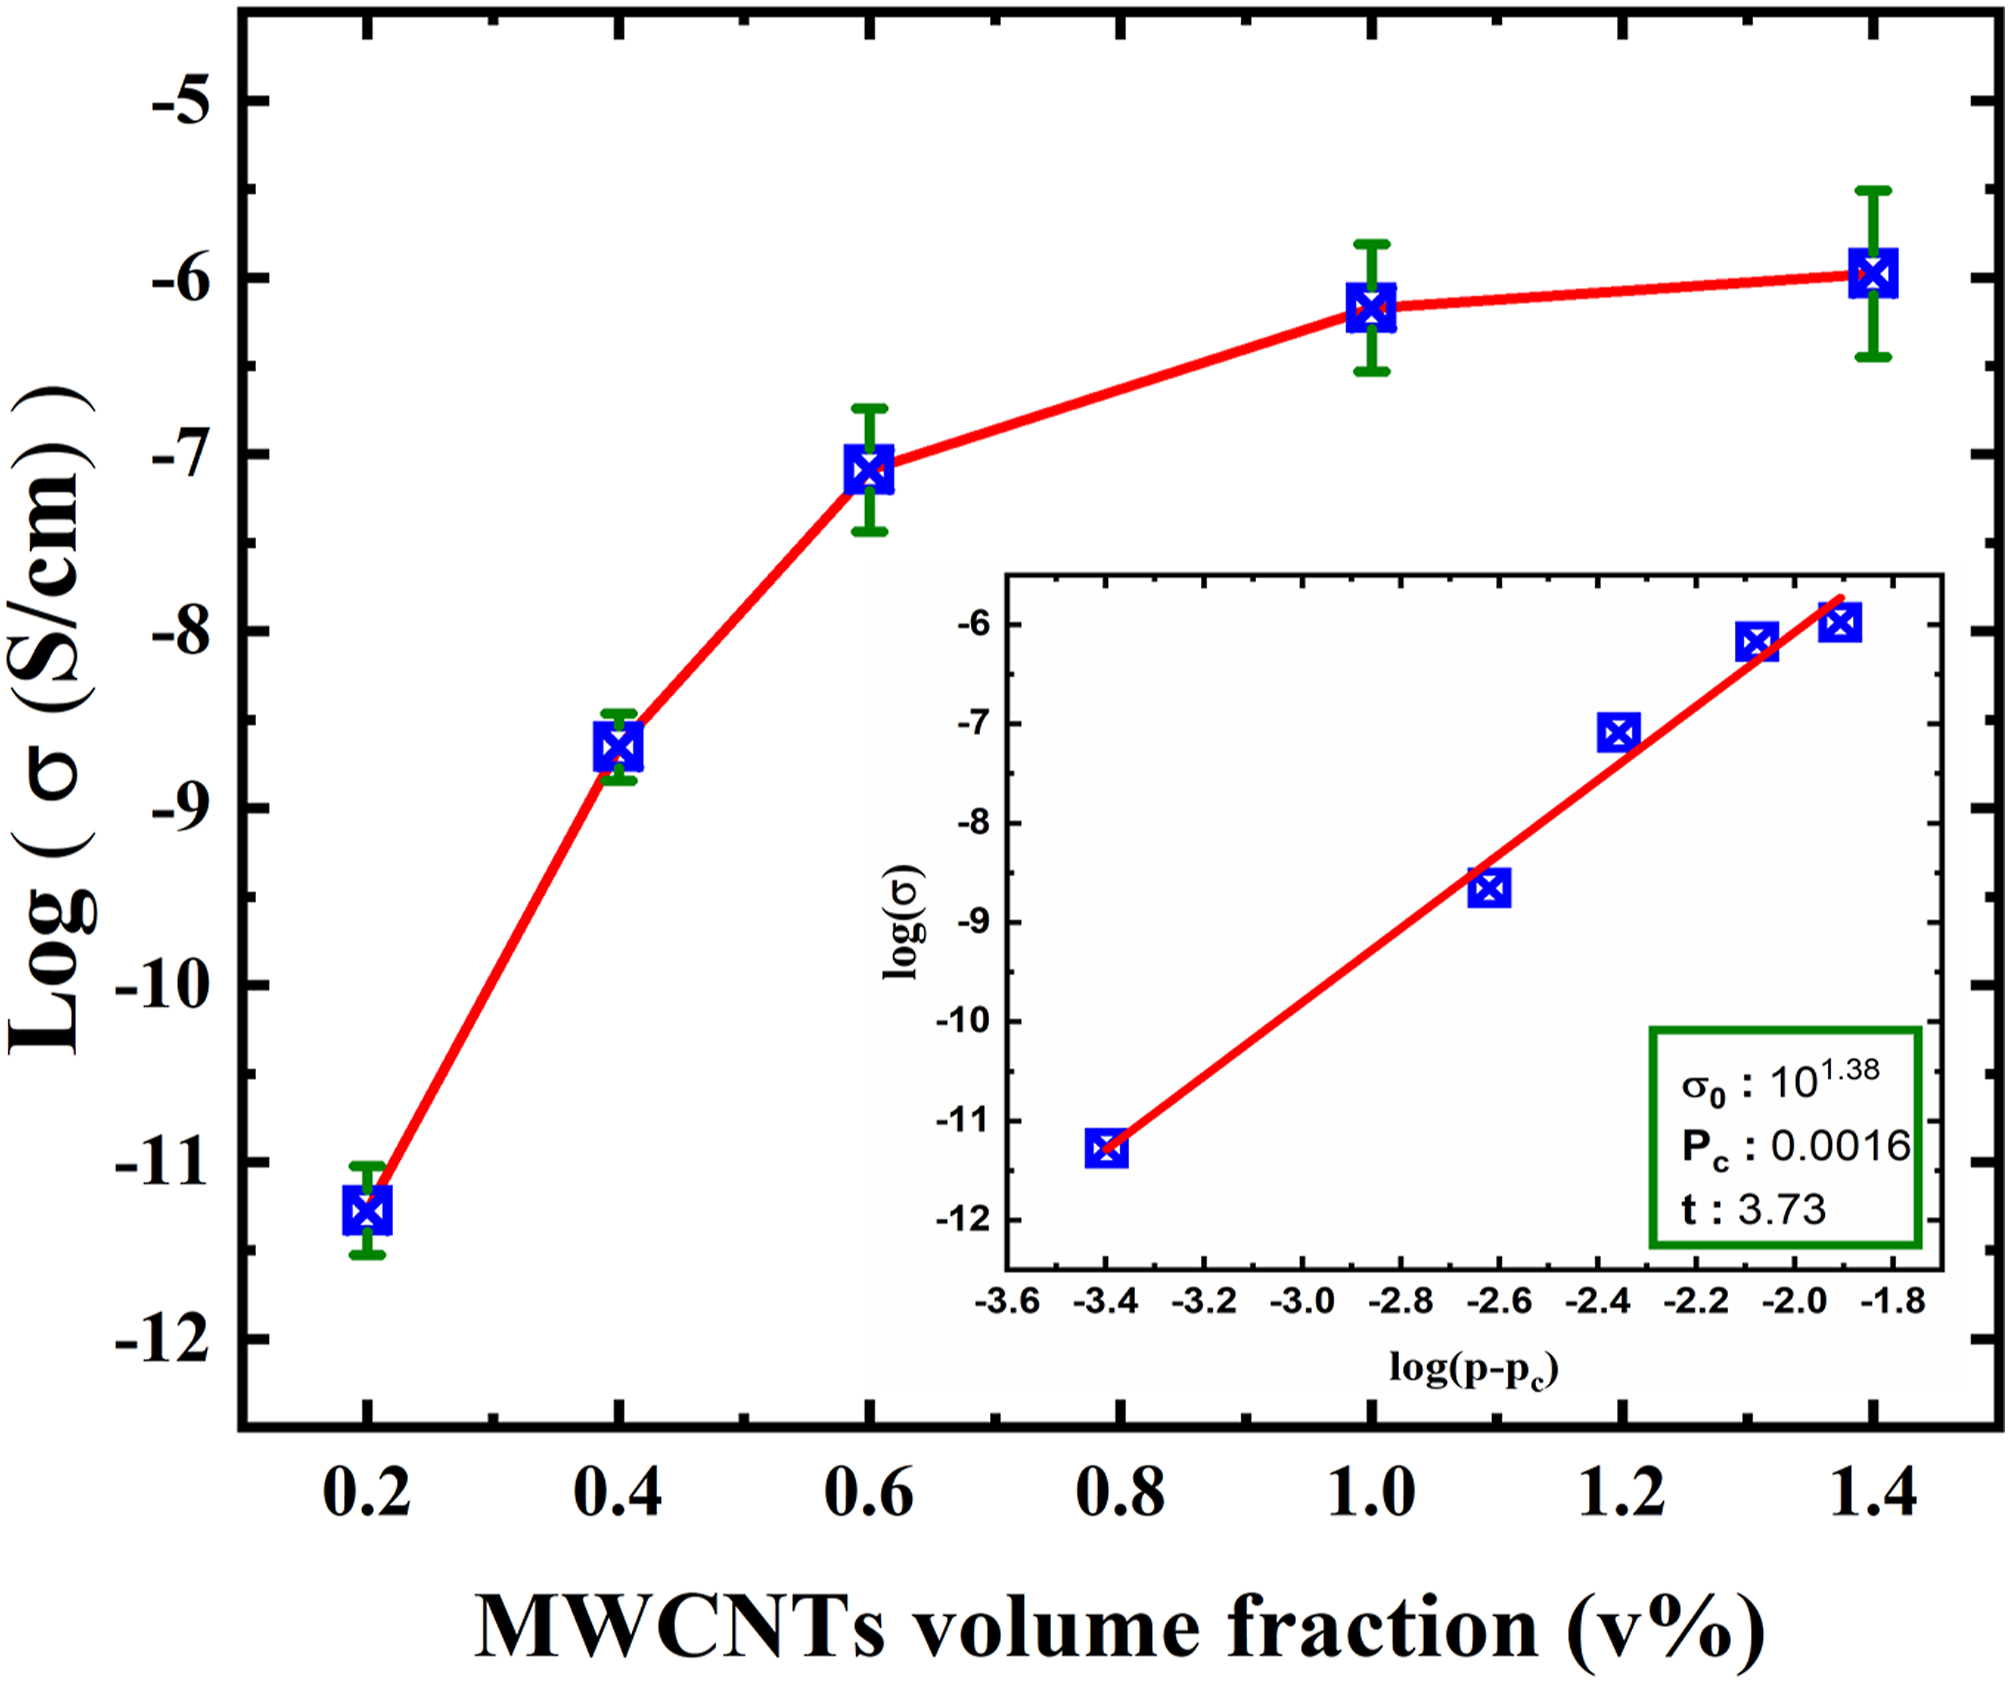
Figure 4 shows the volume DC electrical conductivity versus volume fraction of MWCNT for the blends prepared through direct mixing protocol. By fitting equation (5) to the experimental results of Figure 4(a) percolation threshold of 0.95 v% was obtained. Log (volume electrical conductivity) vs MWCNTs volume fraction for simultaneous mixing of all components.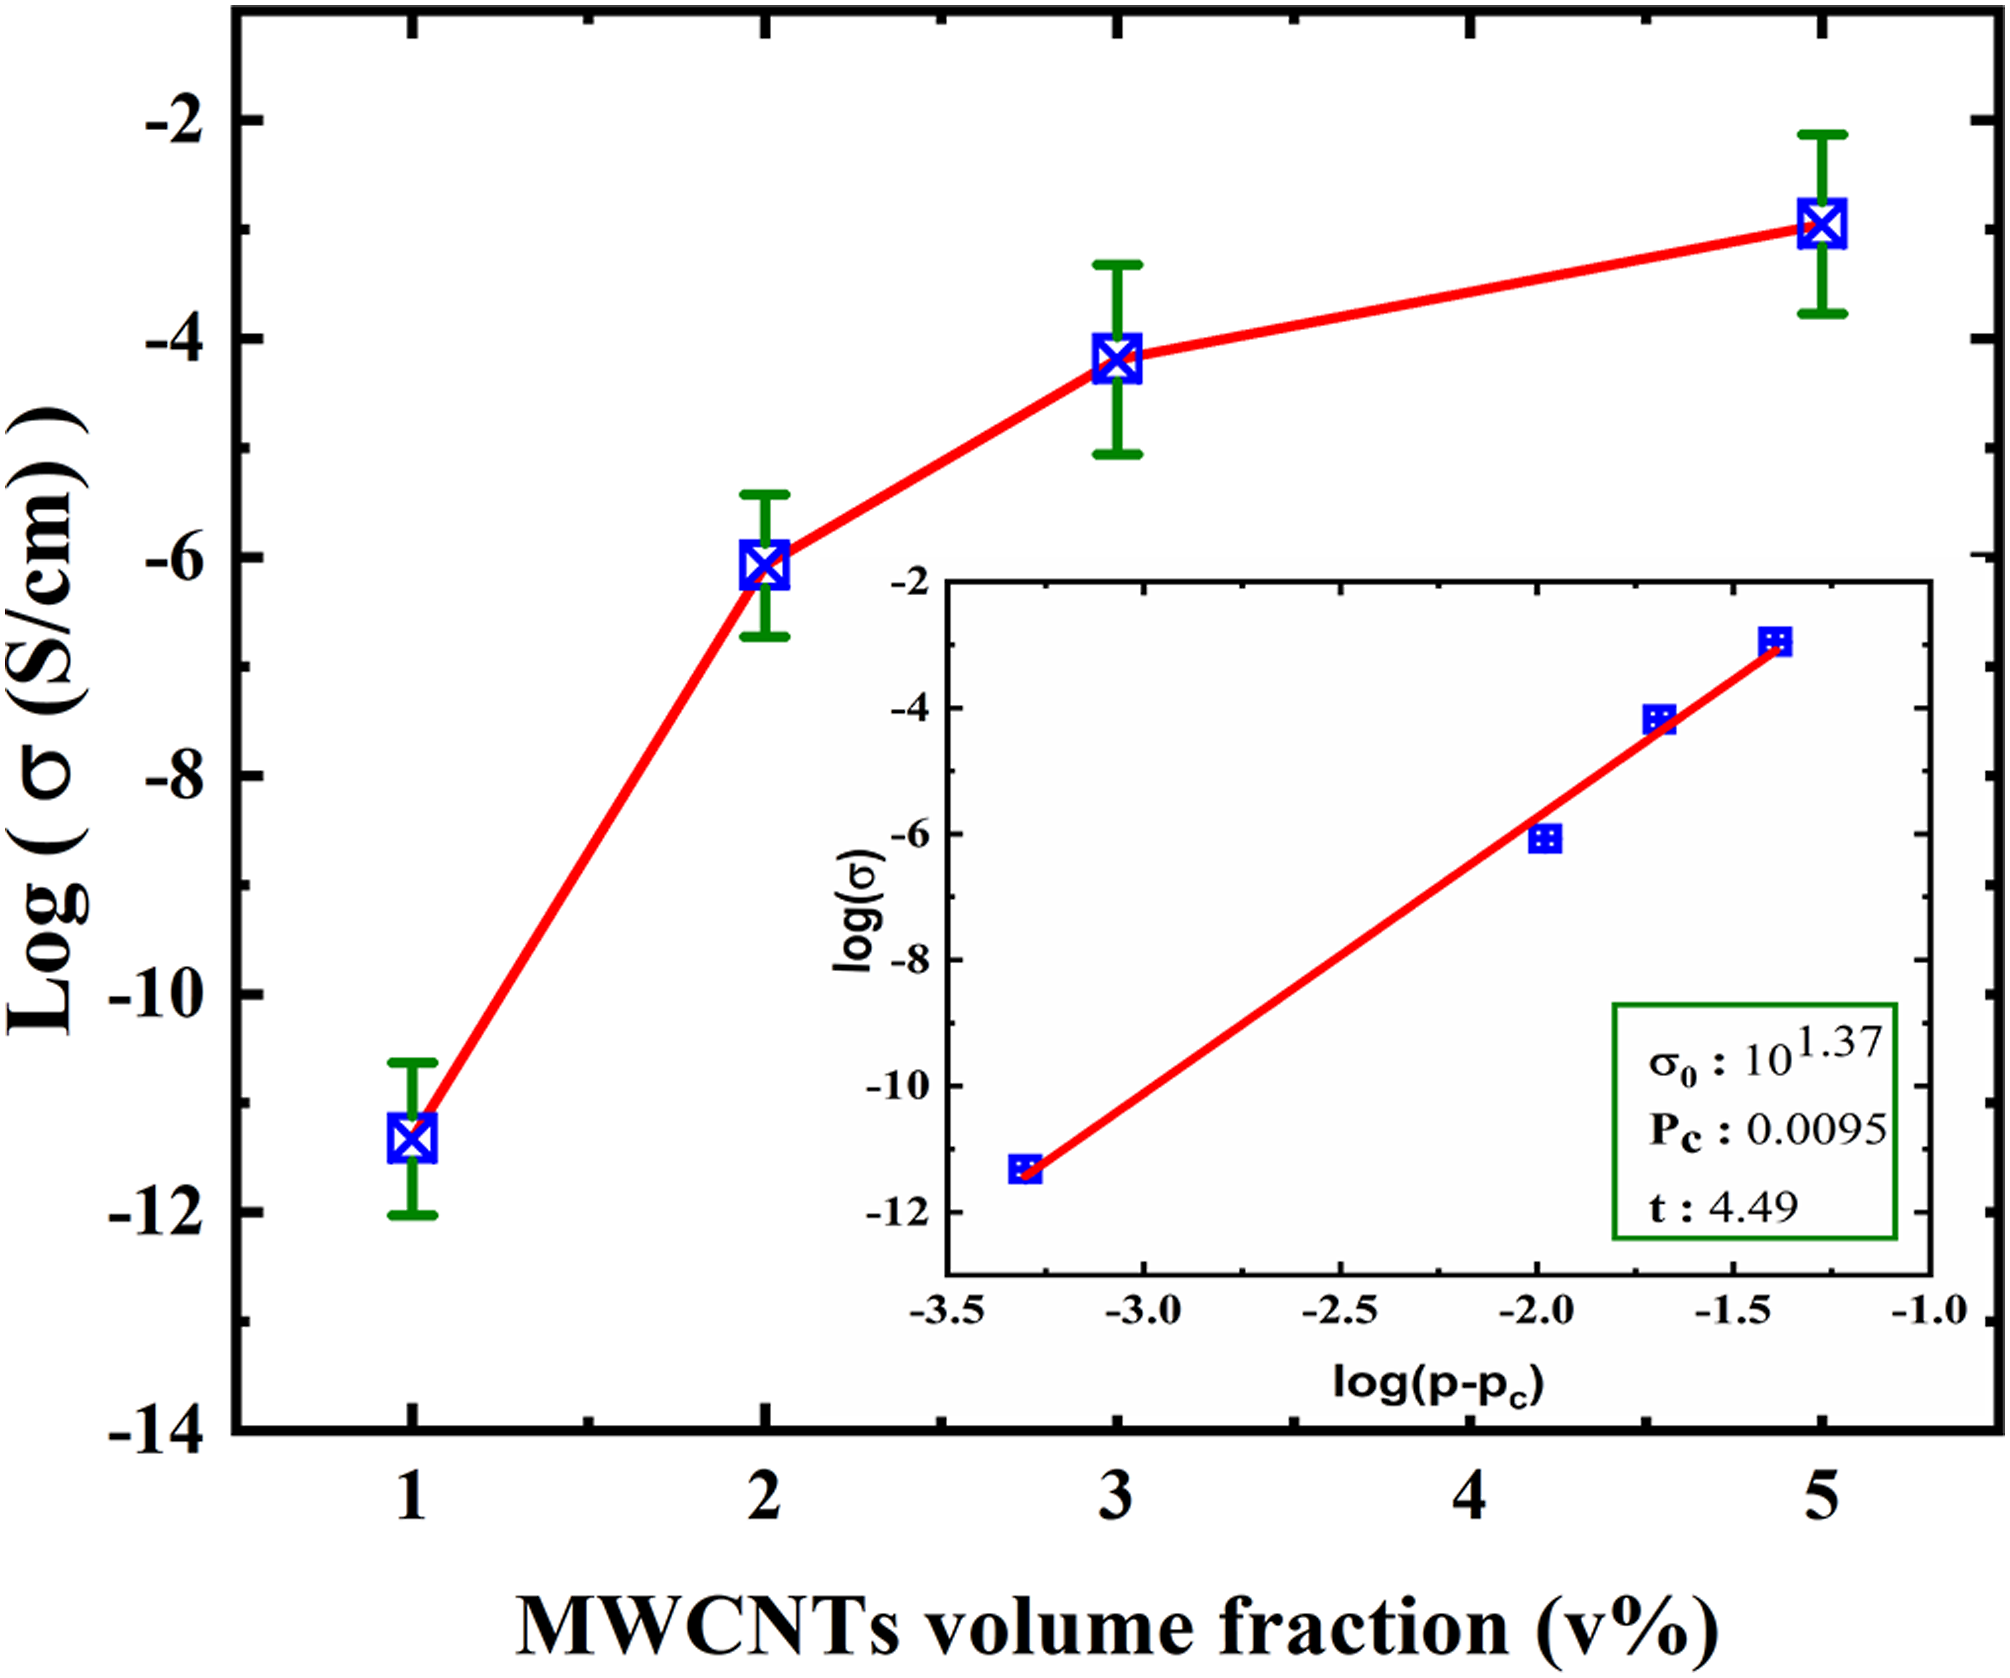

σ0, pc, and t for prepared samples by masterbatch and direct mixing methods.
Electrical and dielectric properties
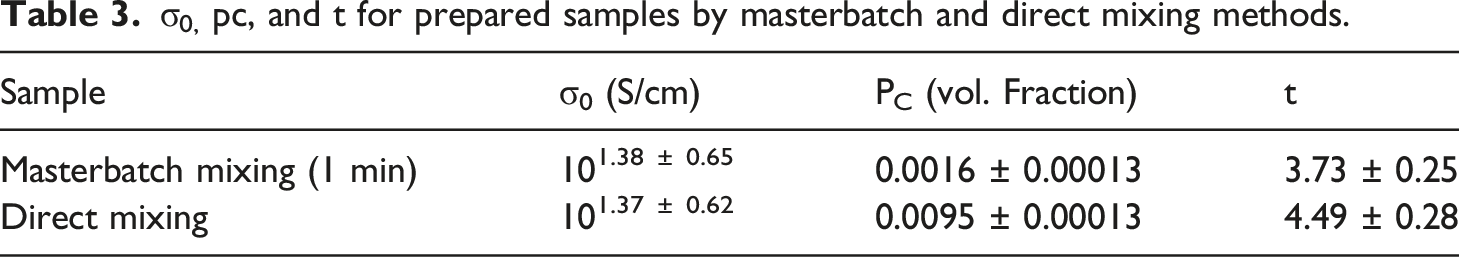
Figure 5 shows the electrical conductivity of the PP/EVA/PP-g-MA (MWCNTs 0.6 v%) blends prepared with the masterbatch method after 1, 2.5, and 4.5 min of mixing time for the masterbatch. As the mixing time has increased, the DC electrical conductivity of the samples has drastically decreased up to 4 orders of magnitude due to more distribution of the rich MWCNTs phase and probably more migration of MWCNTs from PP-g-MA to EVA. An increase in the mixing time leads to an improvement in the distribution and dispersion of compatibilizer in the PP/EVA blend and hence a decrease in the interconnected networks of MWCNTs localized in the compatibilizer. DC electrical conductivity versus mixing time after masterbatch addition (PP/EVA/PP-g-MA/CNT 0.6 v%).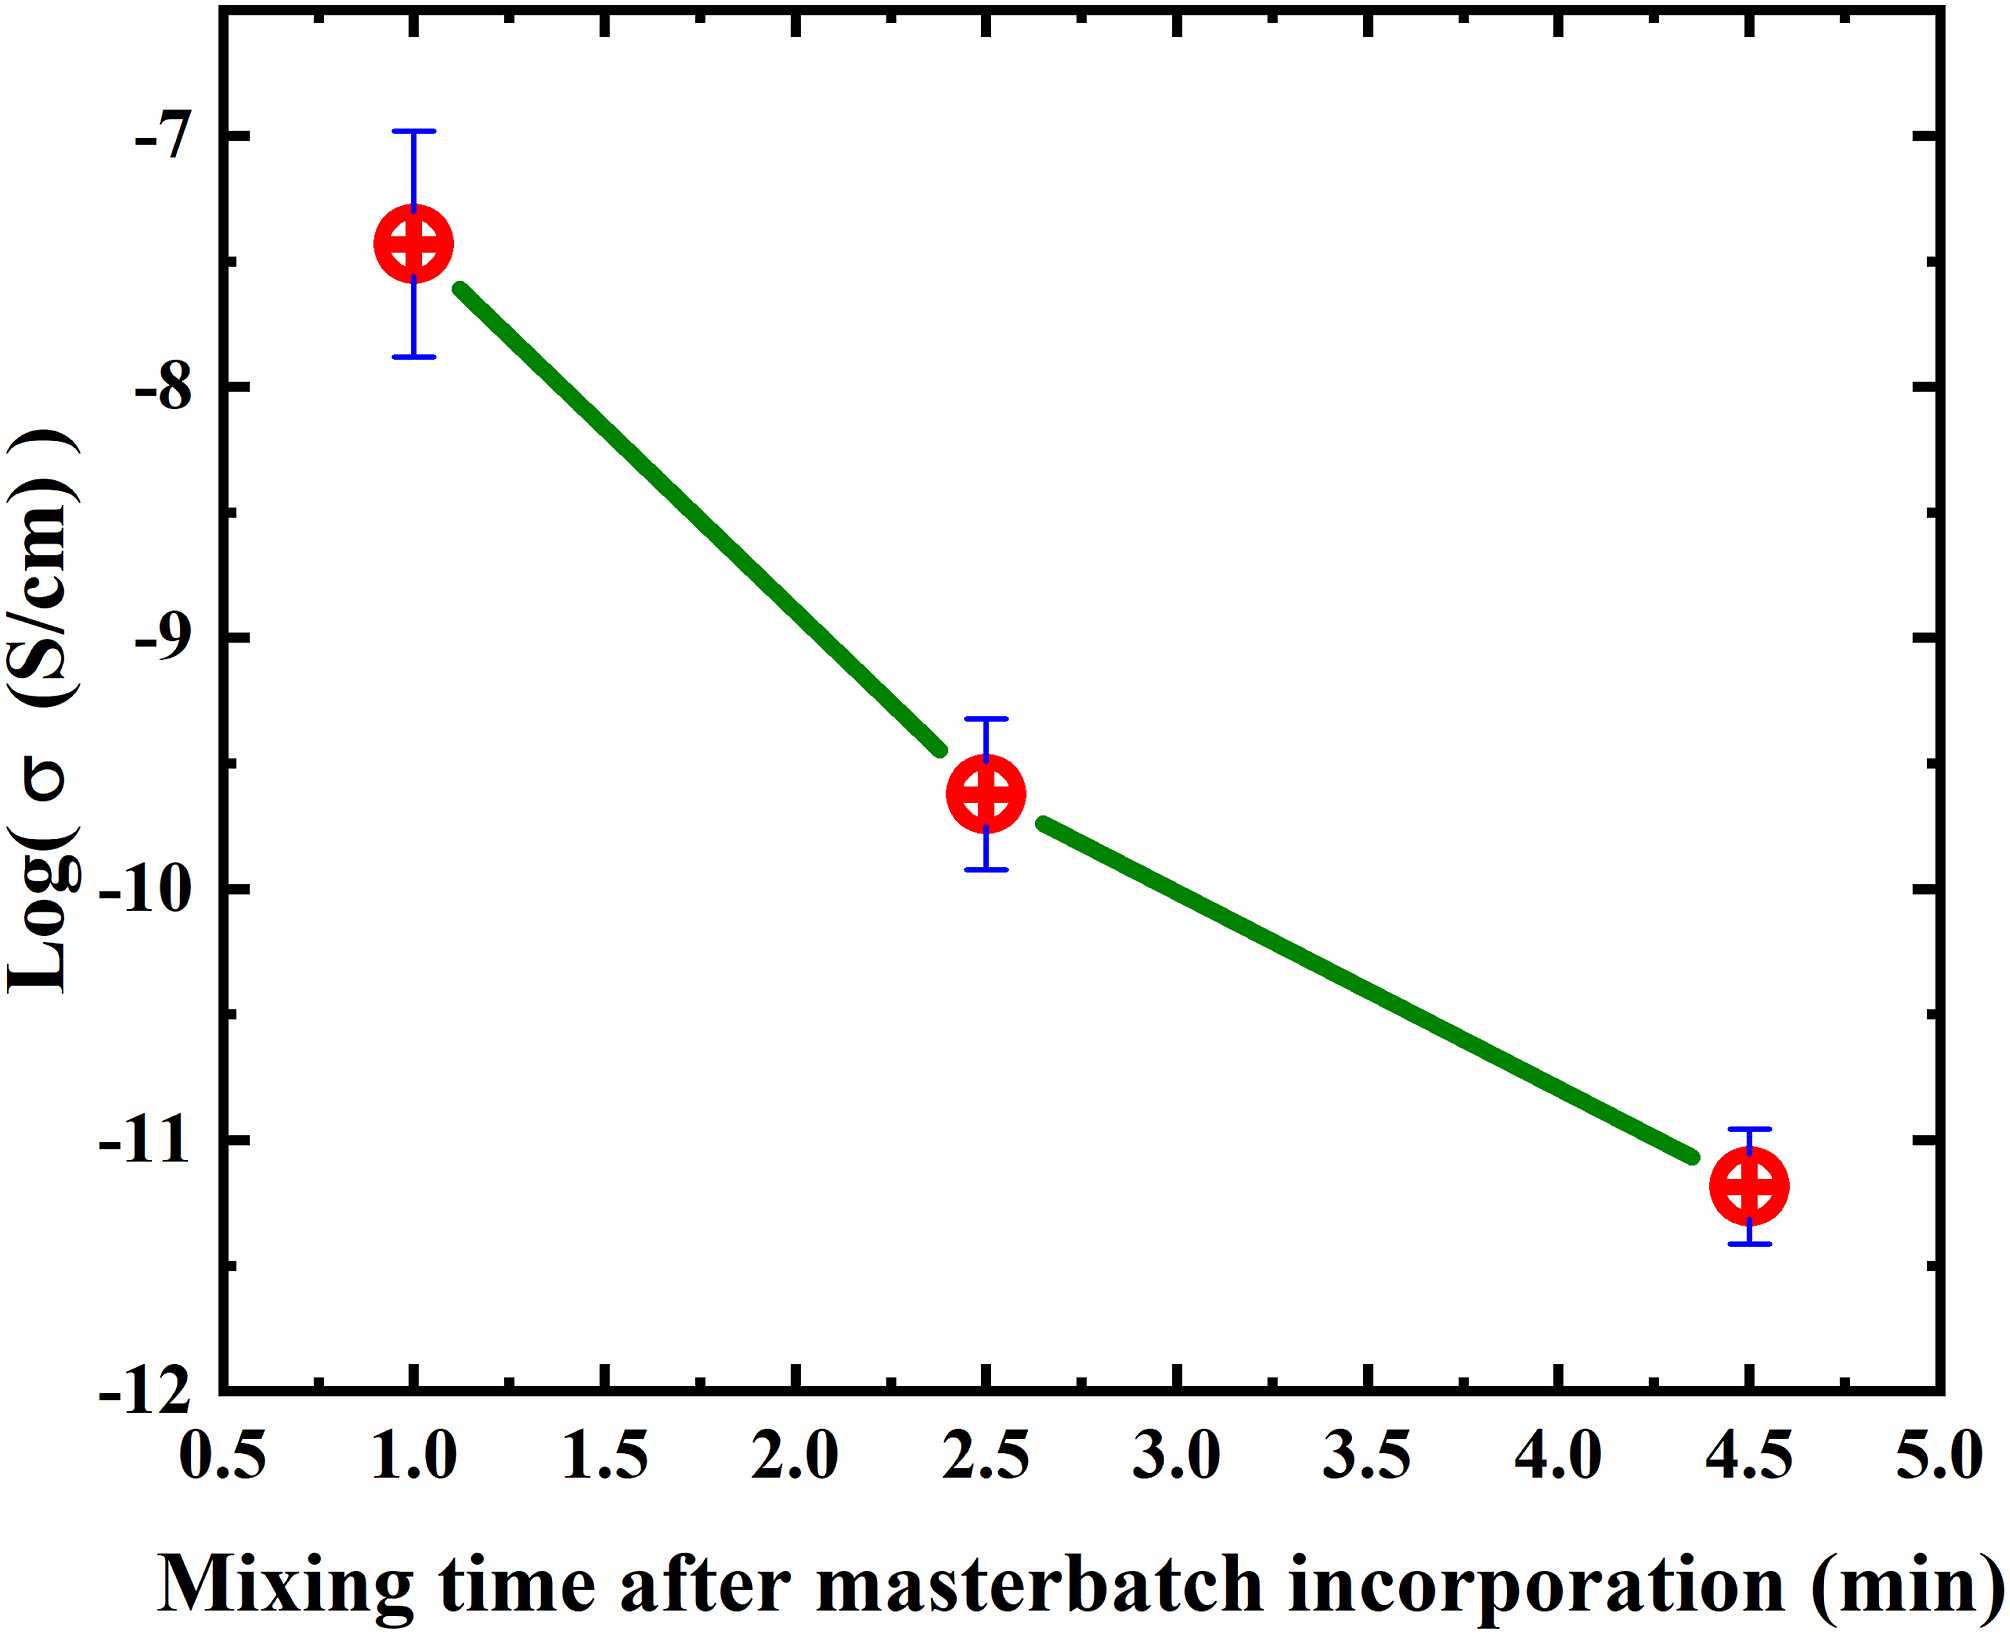
The resistance and reactance (loss factor) in a material are denoted as Z′ for the real part and Z″ for the imaginary part respectively, where the overall impedance (Z) is expressed as Z = Z′ + jZ″, where j = √−1. Figures 6(a)–(c) shows the plots of impedance, its real part (Z′), and imaginary part (Z″) against frequency for the samples with 1 min, 2.5 min, and 4.5 min mixing time. Insulating materials are notable for their tendency to exhibit a significant decrease in Z′ as the frequency of the electrical conductivity increases. The impedance and its real part have slightly decreased with an increase in the mixing time due to further dispersion/distribution of the compatibilizer as the conductive network. The frequency cutoff is the frequency at which impedance starts to decrease with frequency. Before this frequency, the major conduction mechanism is direct contact while after that the major mechanism is electron tunneling.
51
As seen in Figure 6 the frequency cutoff has increased to higher frequencies as the mixing time has decreased meaning that the direct contact mechanism is more dominant at low frequencies for the sample with low mixing time. In fact, at low mixing time, a near continuous and conductive phase of PP-g-MA/MWCNTs masterbatch exists. In Figure 6(c) a peak is observed for the storage impedance against frequency. Interestingly, there is a shift in the location of the peak for the sample with 1 min mixing time compared to the samples with 2.5 and 4.5 min mixing time. This shift can be assumed and used as an indication of a change in blend morphology or homogeneity. The peak for low mixing time occurs at a higher frequency but with less intensity. This could be due to the decrease in impedance and also the increase in the relaxation time of the polarizable dipoles to the applied AC electric field.
52
Figure 6(d) shows the plot of Z″ against Z′, Nyquist plot. The diameter of the Nyquist plot has increased from 0.75 × 10⁶ Ω to 3 × 10⁷ Ω by increasing the mixing time from 1 min to 4.5 min. Again there is a distinct difference between the size of the circle for the sample with short mixing times and that of the samples with longer mixing times. A smaller diameter is an indication of a more conducting network.51,53 The difference in the size of the circle in the Nyquist plot can be used as an indirect tool or quality control tool for morphology characterization in conductive polymer blends. Plots of a) impedance, b) storage impedance, c) loss impedance versus frequency and d) Nyquist plots for mixing times of 1min, 2.5 min, and 4.5 min.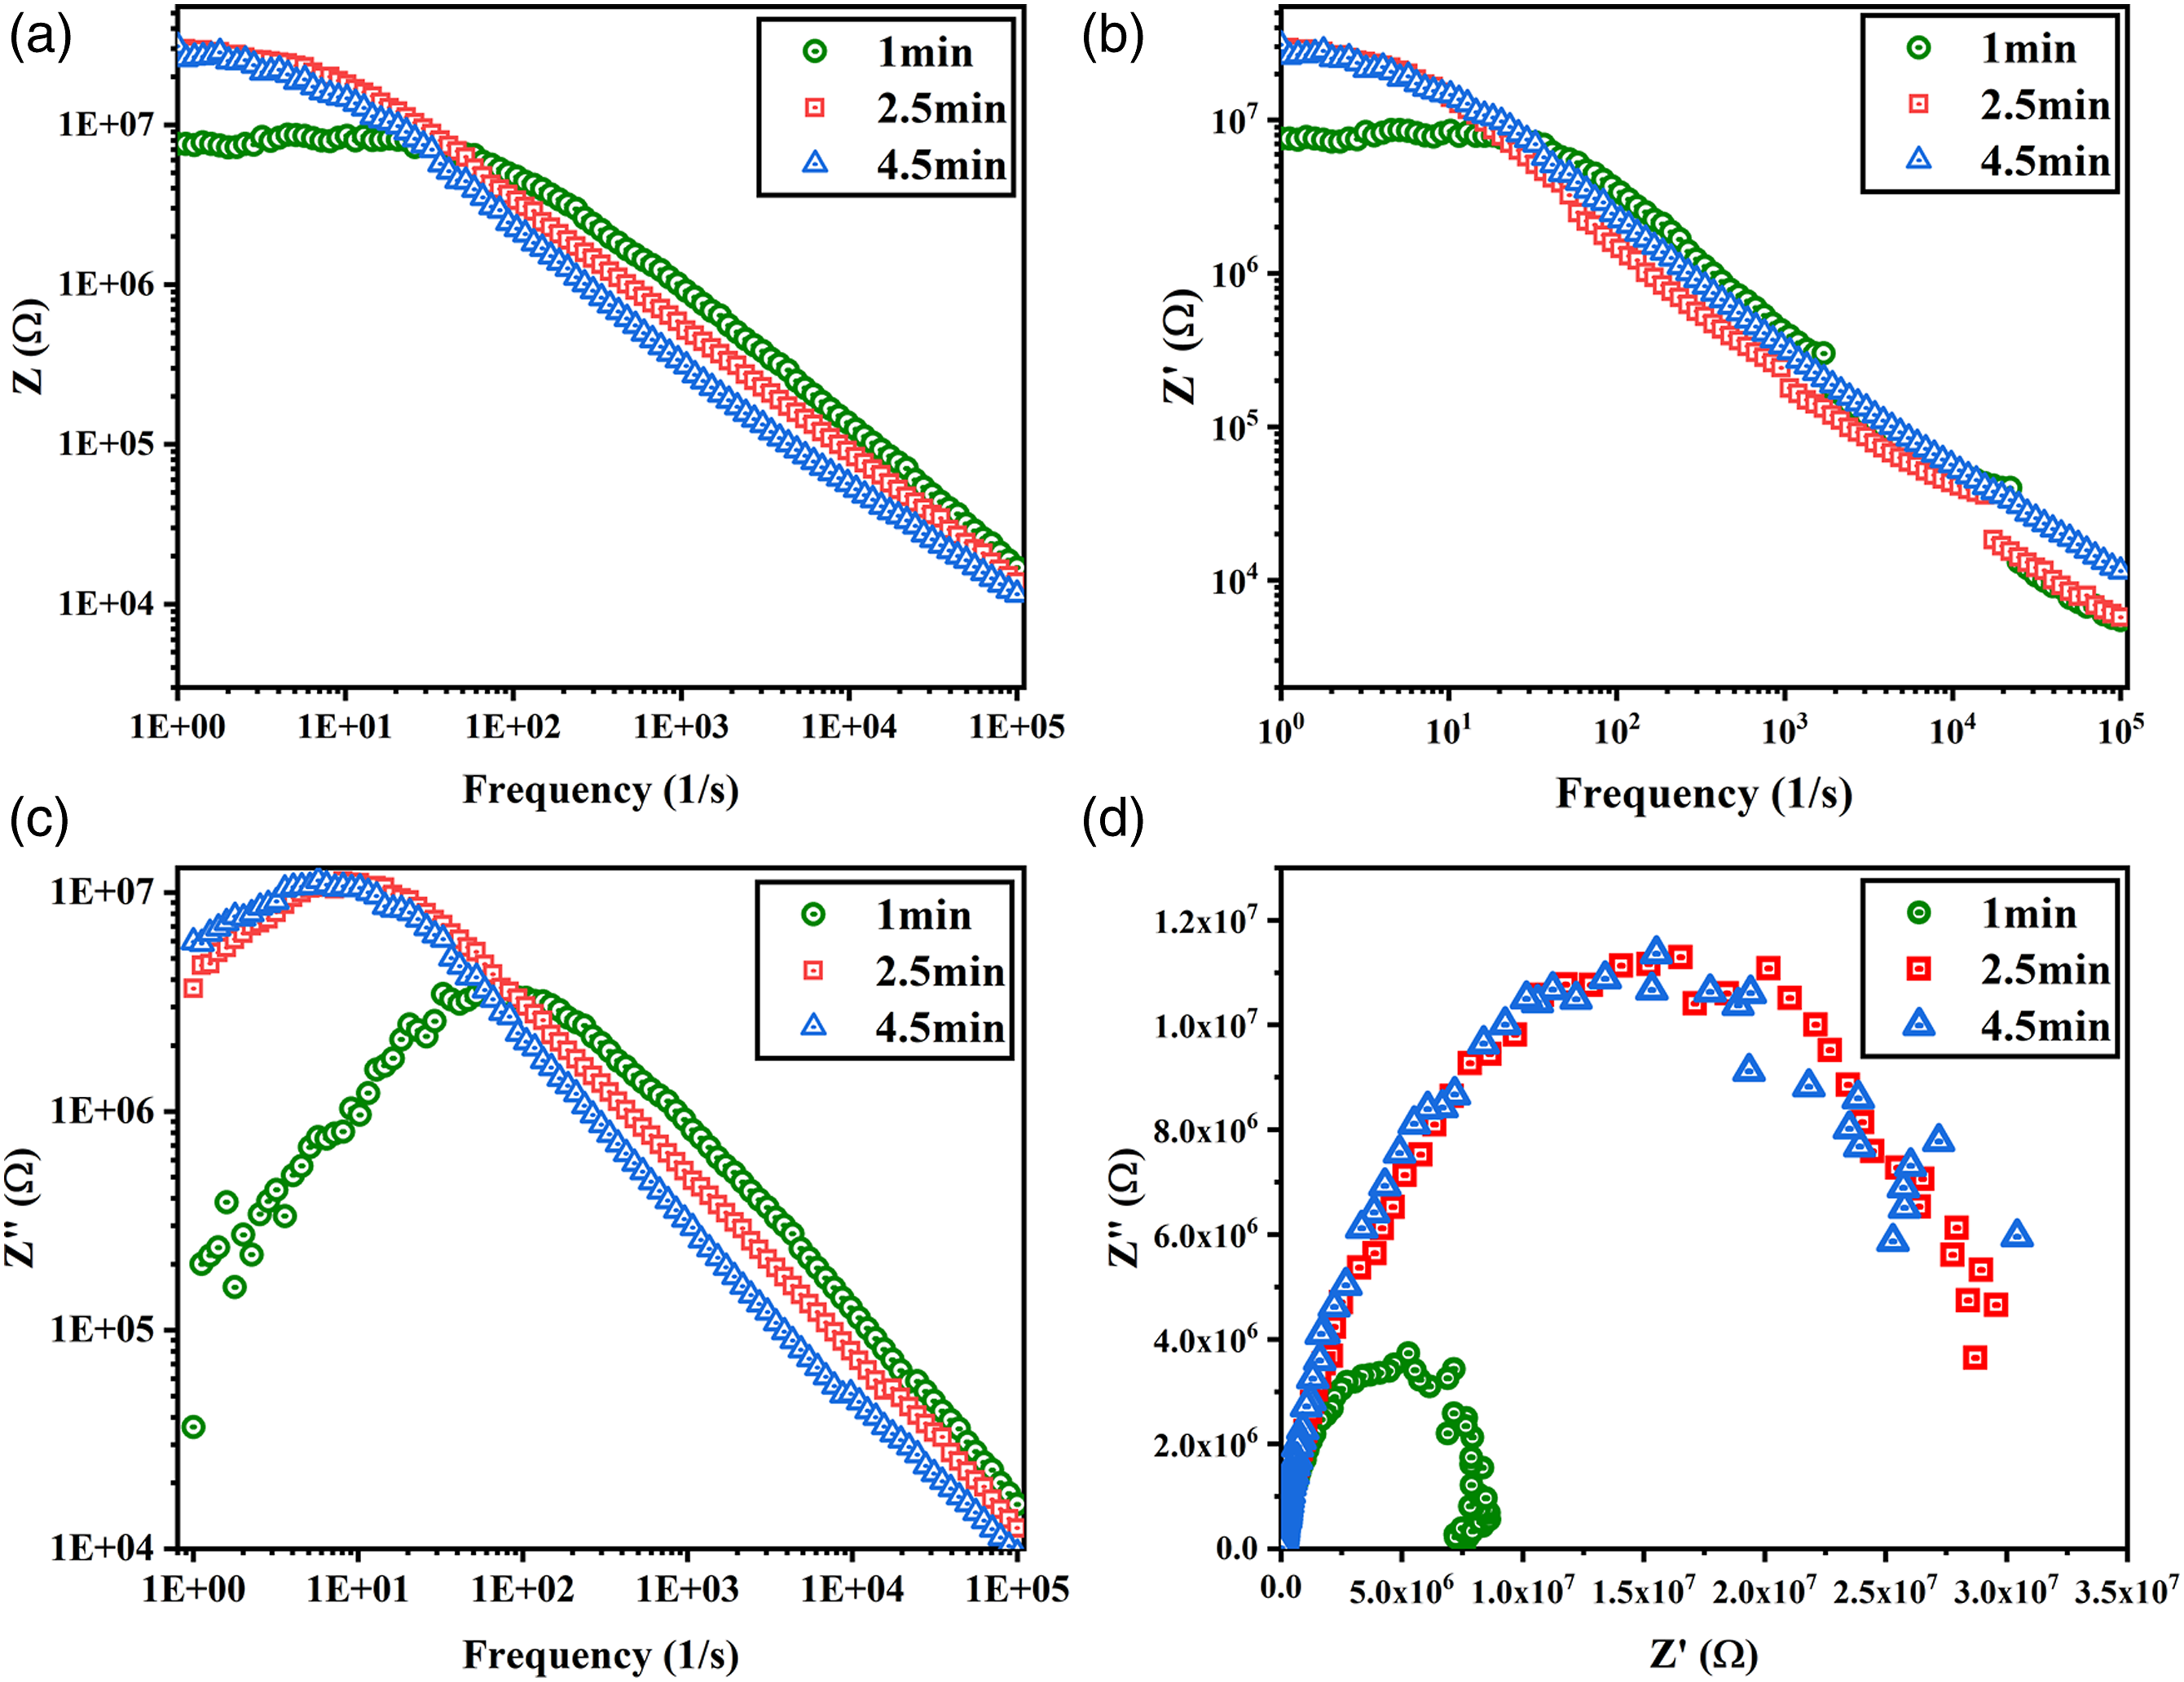
AC electrical conductivity for all the samples was calculated from equation (6). Plots of AC conductivity for PP/EVA/PP-g-MA (0.6 v% CNT) prepared through masterbatch method with 1 min, 2.5 min, and 4.5 min mixing time.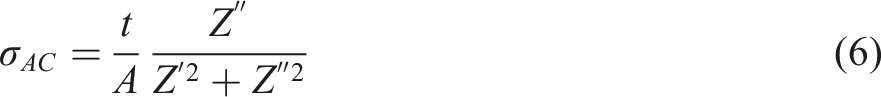
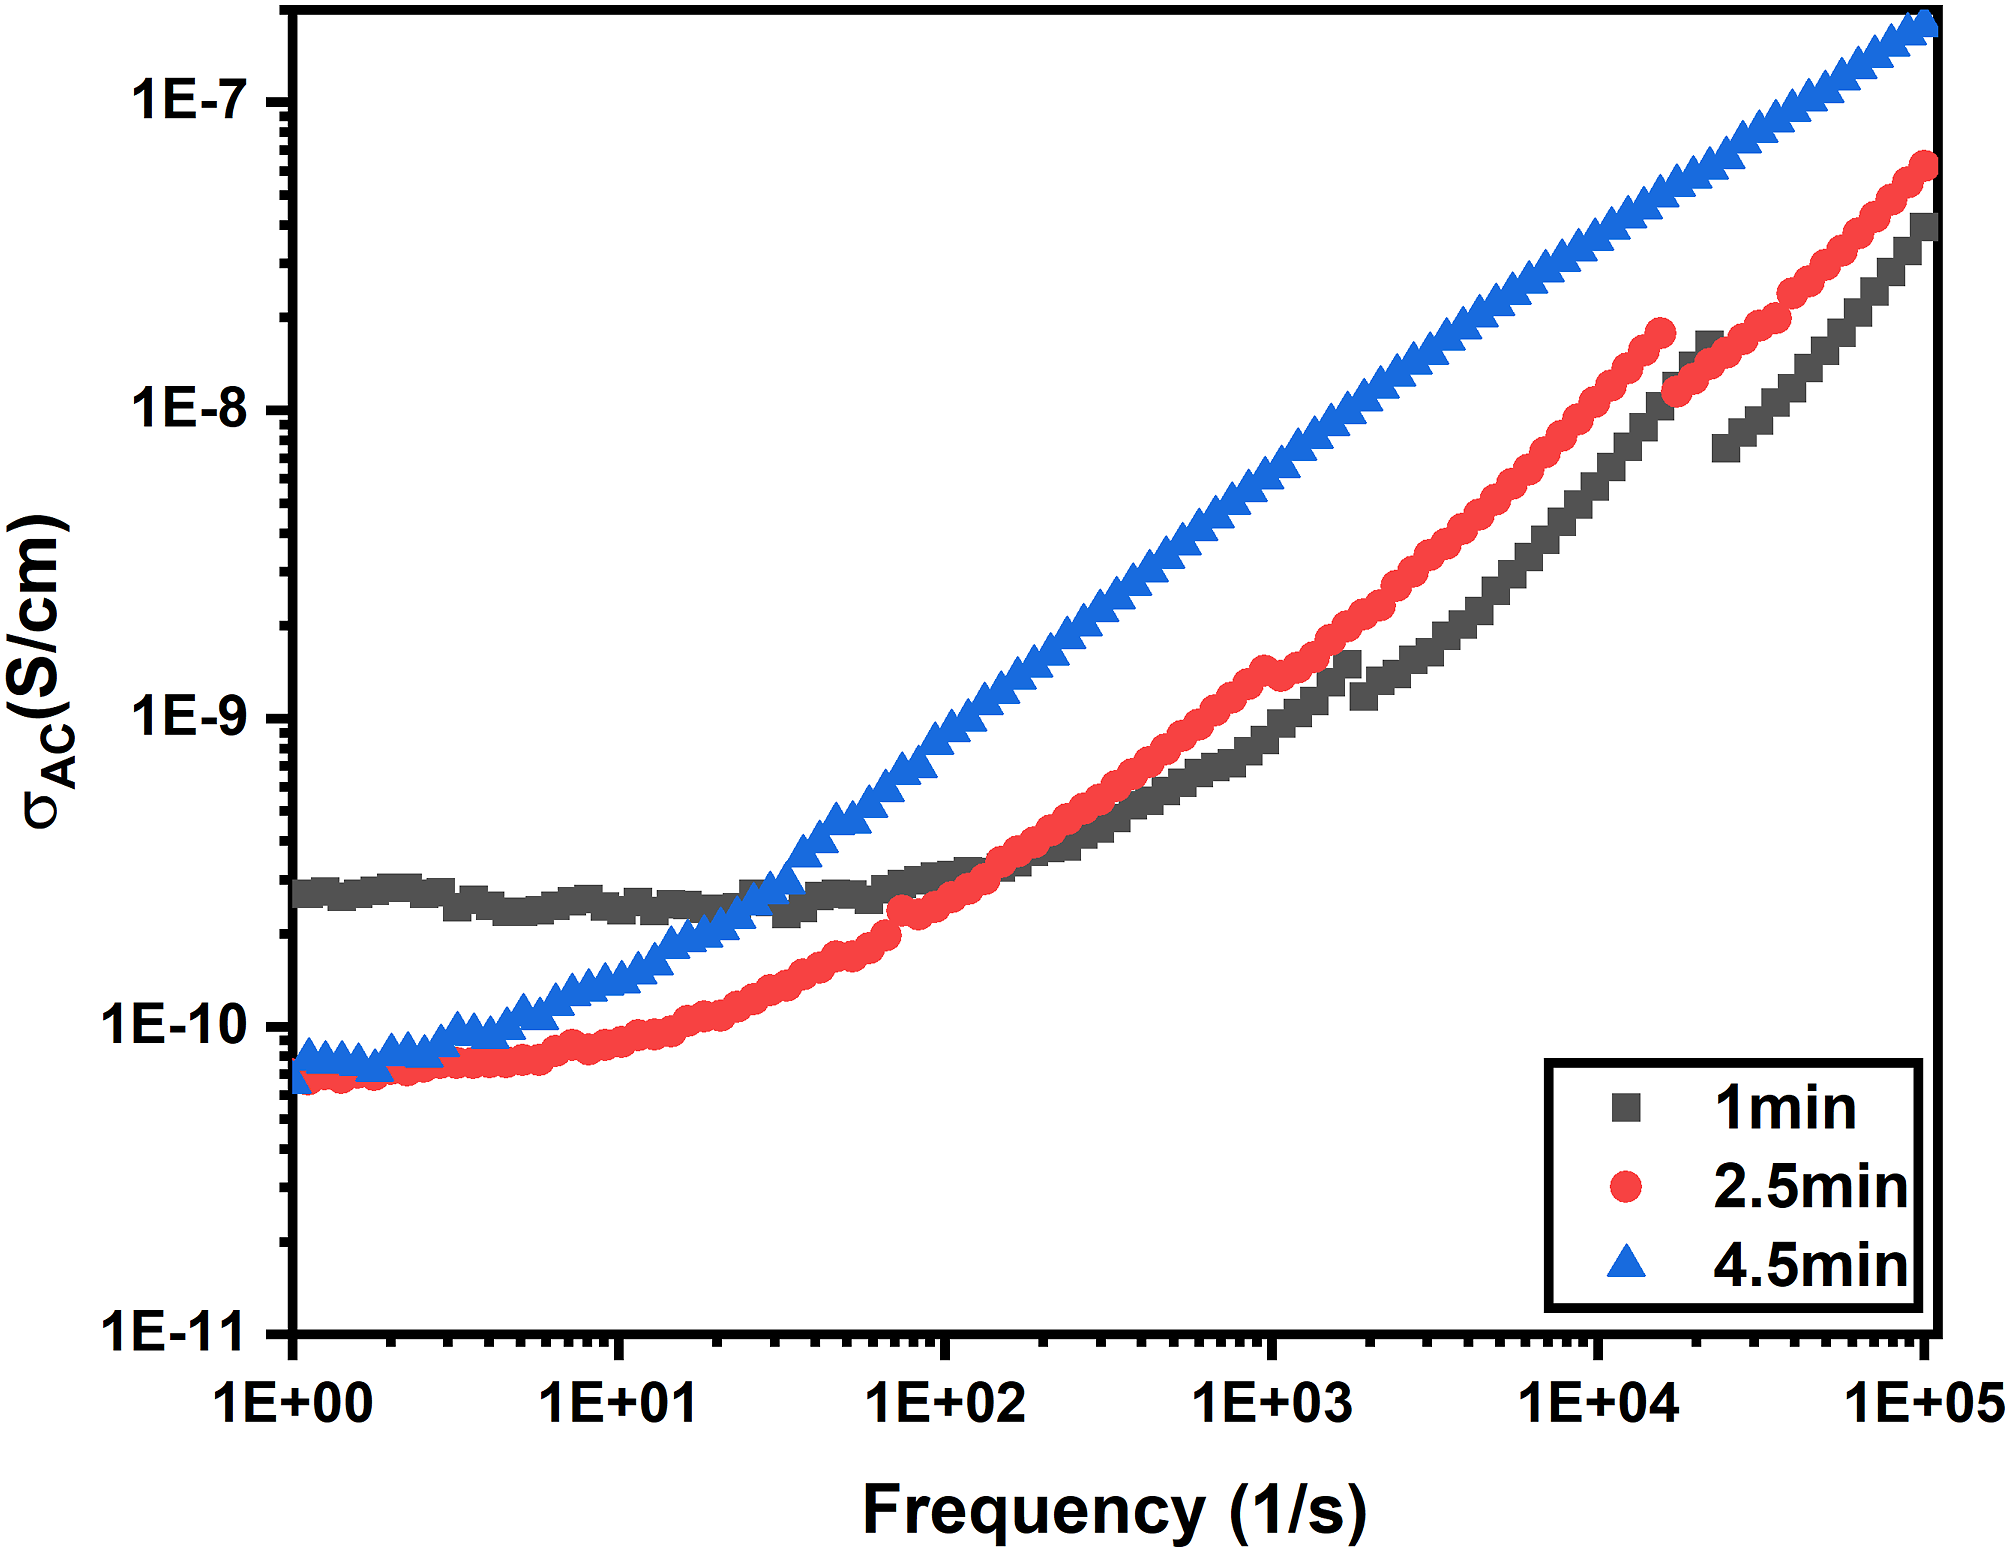
According to Figure 6 and Figure 7, electrical conductivity decreases with increasing the mixing time, below a critical frequency, but after that frequency, the trend is the opposite. The samples with a high mixing time have a chance for better dispersion/distribution. In this regard, more nanoparticles with less particle-particle distances will be expected and also, electron tunneling process is the most possible conduction mechanism in the systems with high mixing time. Based on Simmons approximation, when the applied electrical energy increases, as a consequence of increase in frequency, electron conduction mechanism boosts over direct contact mechanism due to increasing electron tunneling current, after a critical frequency. 55 In other words, the samples with high mixing time and therefore a higher degree of dispersion/distribution are potentially able to start electron tunneling which becomes active after a critical frequency.
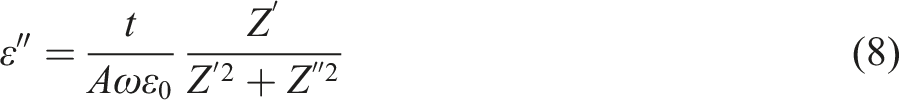
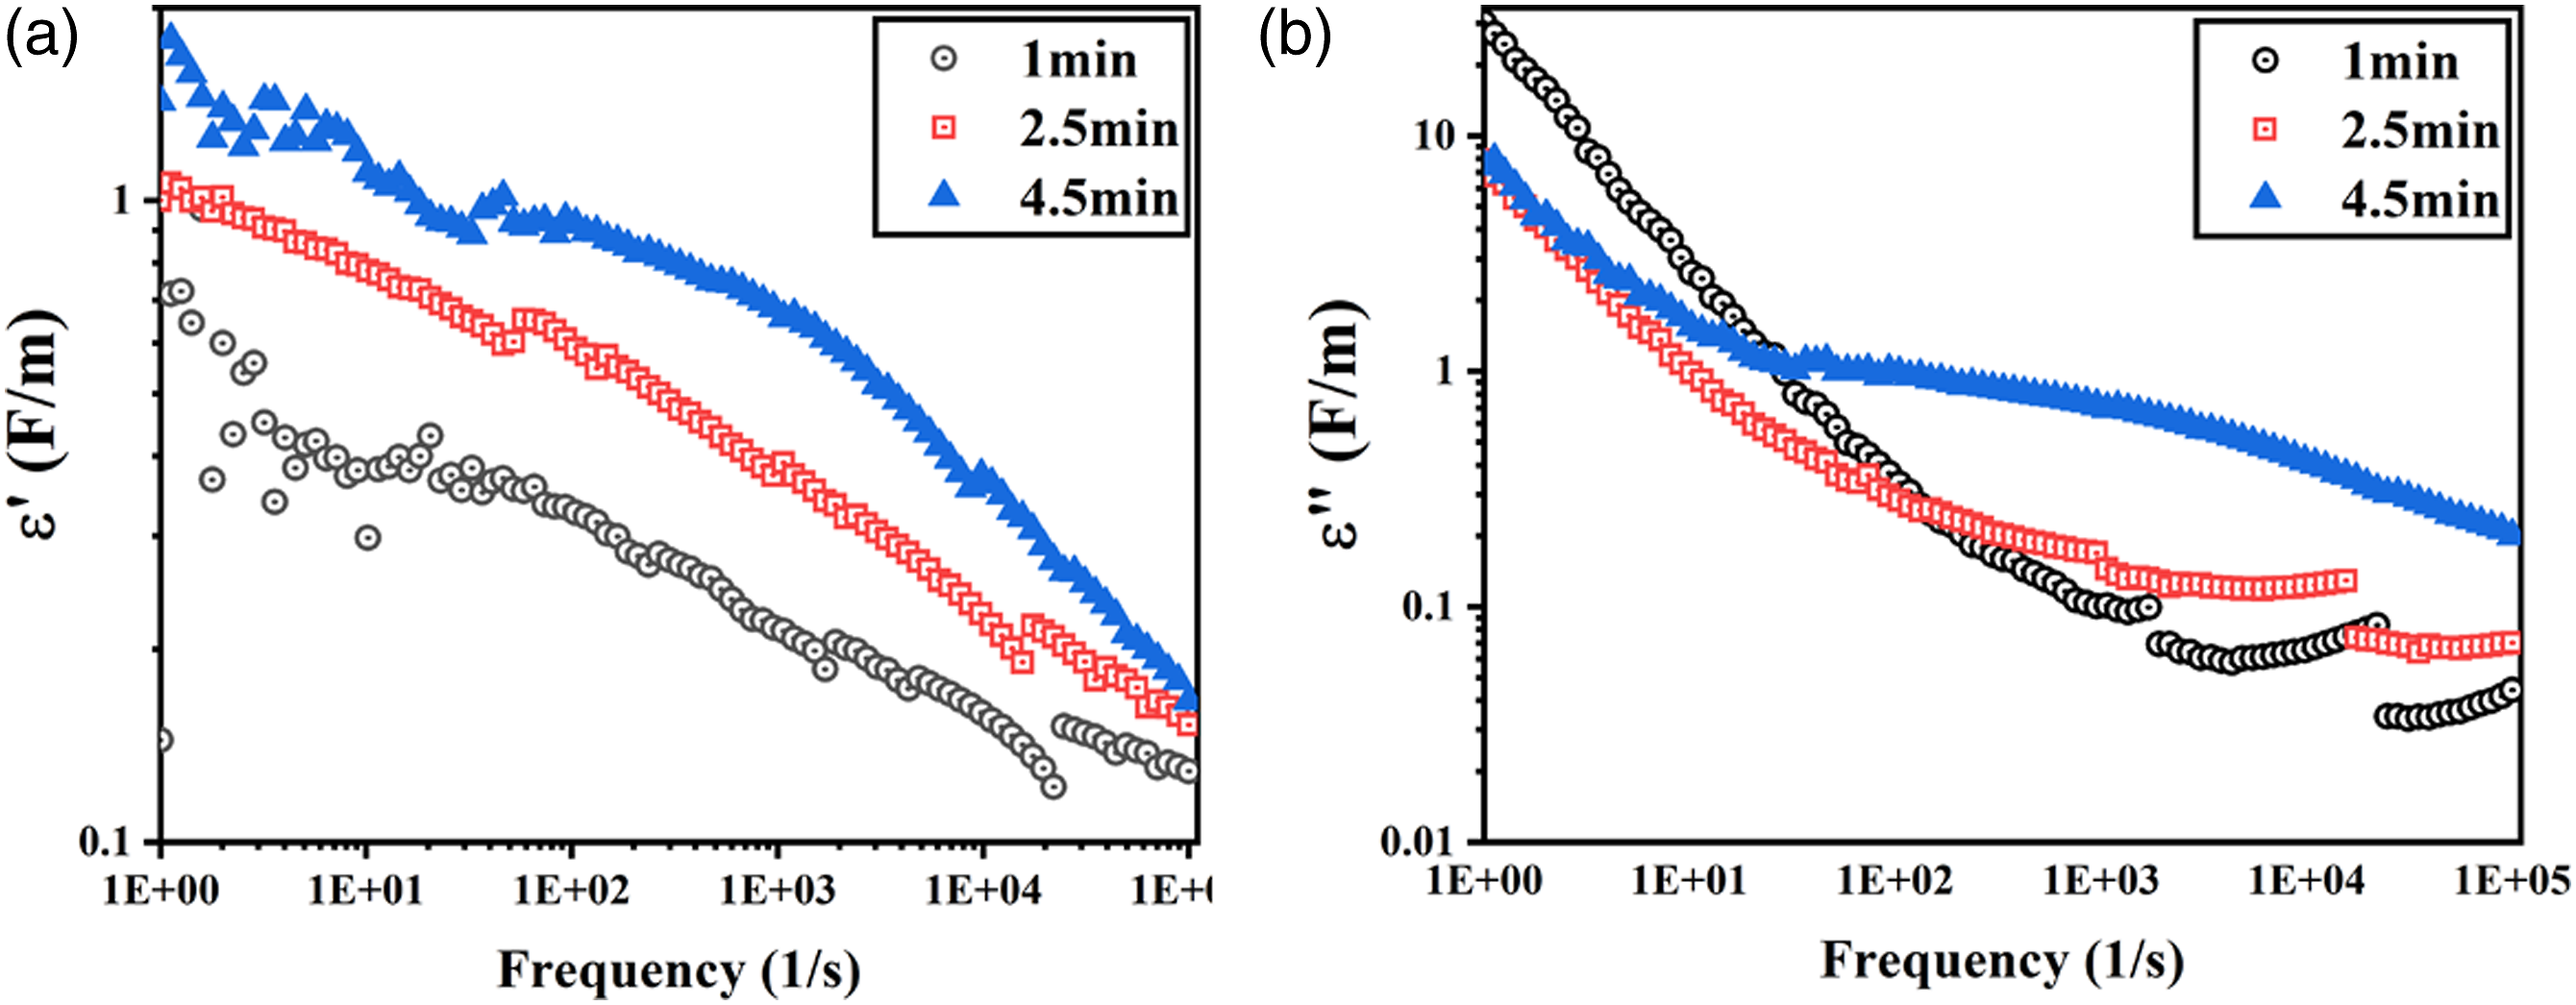
Dielectric constant (ε’) and loss dielectric (ε”) as dielectric properties were obtained from equations (7) and (8), respectively. a) dielectric constant and b) loss dielectric for 1 min, 2.5 min, and 4.5 min samples.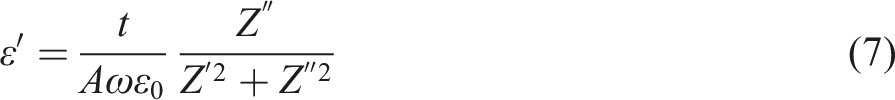
Rheological assessments
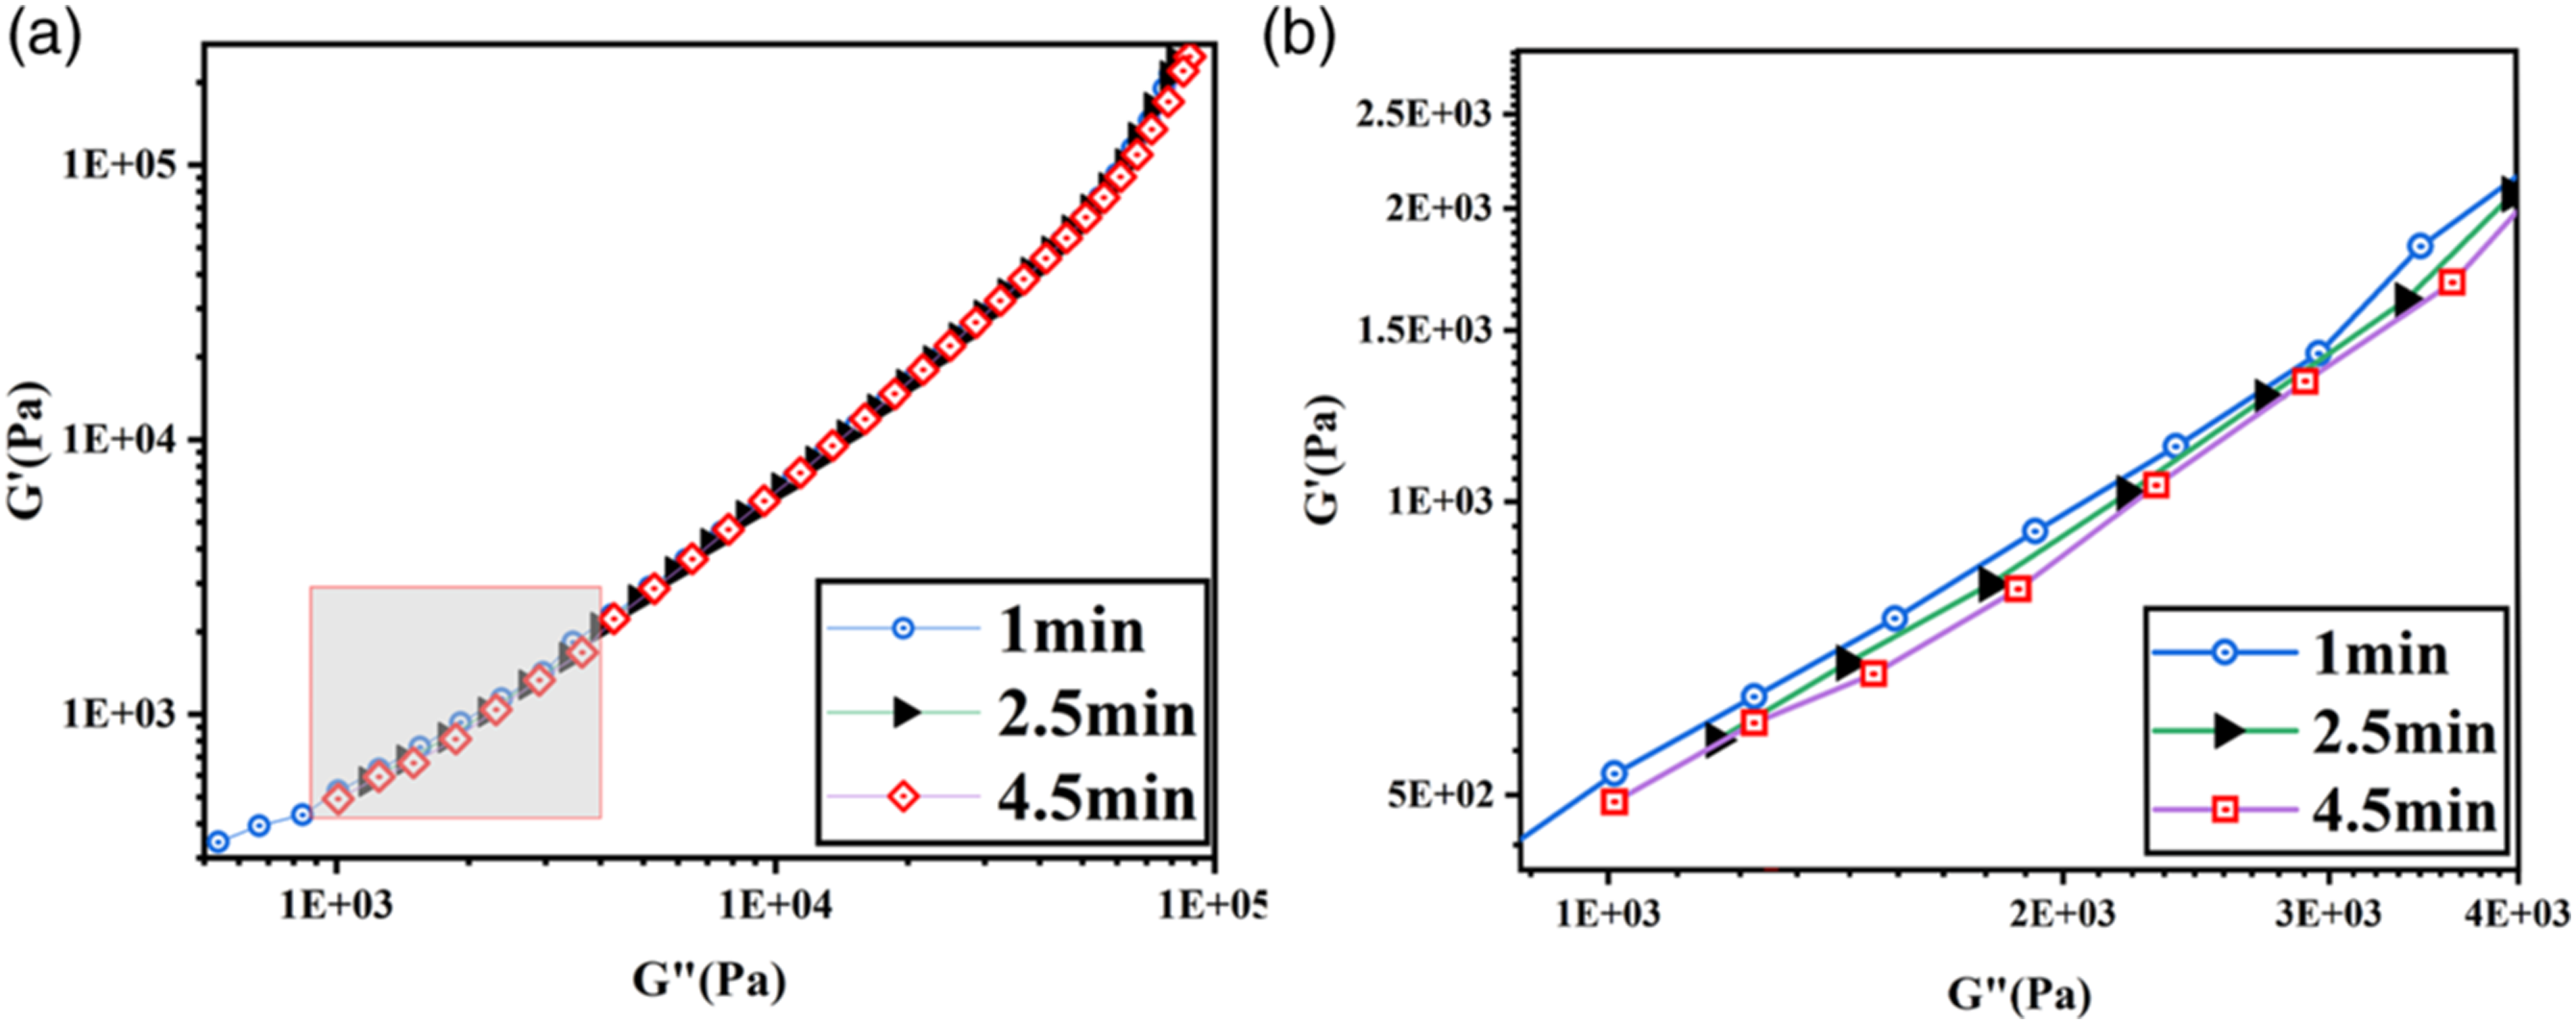
Rheology as a useful tool can help researchers to assess the microstructural properties of multiphase polymeric materials.59–61 In this way, Figure 9 shows the plots of storage modulus (G′), loss modulus (G″), and complex viscosity (η*) vs frequency for the samples with 1 min, 2.5 min, and 4.5 min of mixing time. As seen G′, G″ and η* increase by increasing the mixing time due to more dispersion/distribution of CNTs in the blends. Han plot (log G′-log G″) is a well-known plot for investigating the miscibility of polymer blends and multiphase systems.
62
Figure 10 shows the Han plots for the samples with 1 min, 2.5 min, and 4.5 min mixing time. The linearity trend of the plots at low frequencies is an indication of the homogeneity of the blends. As the mixing time has decreased to 1 min, a small deviation from linearity is observed at lower frequencies.
63
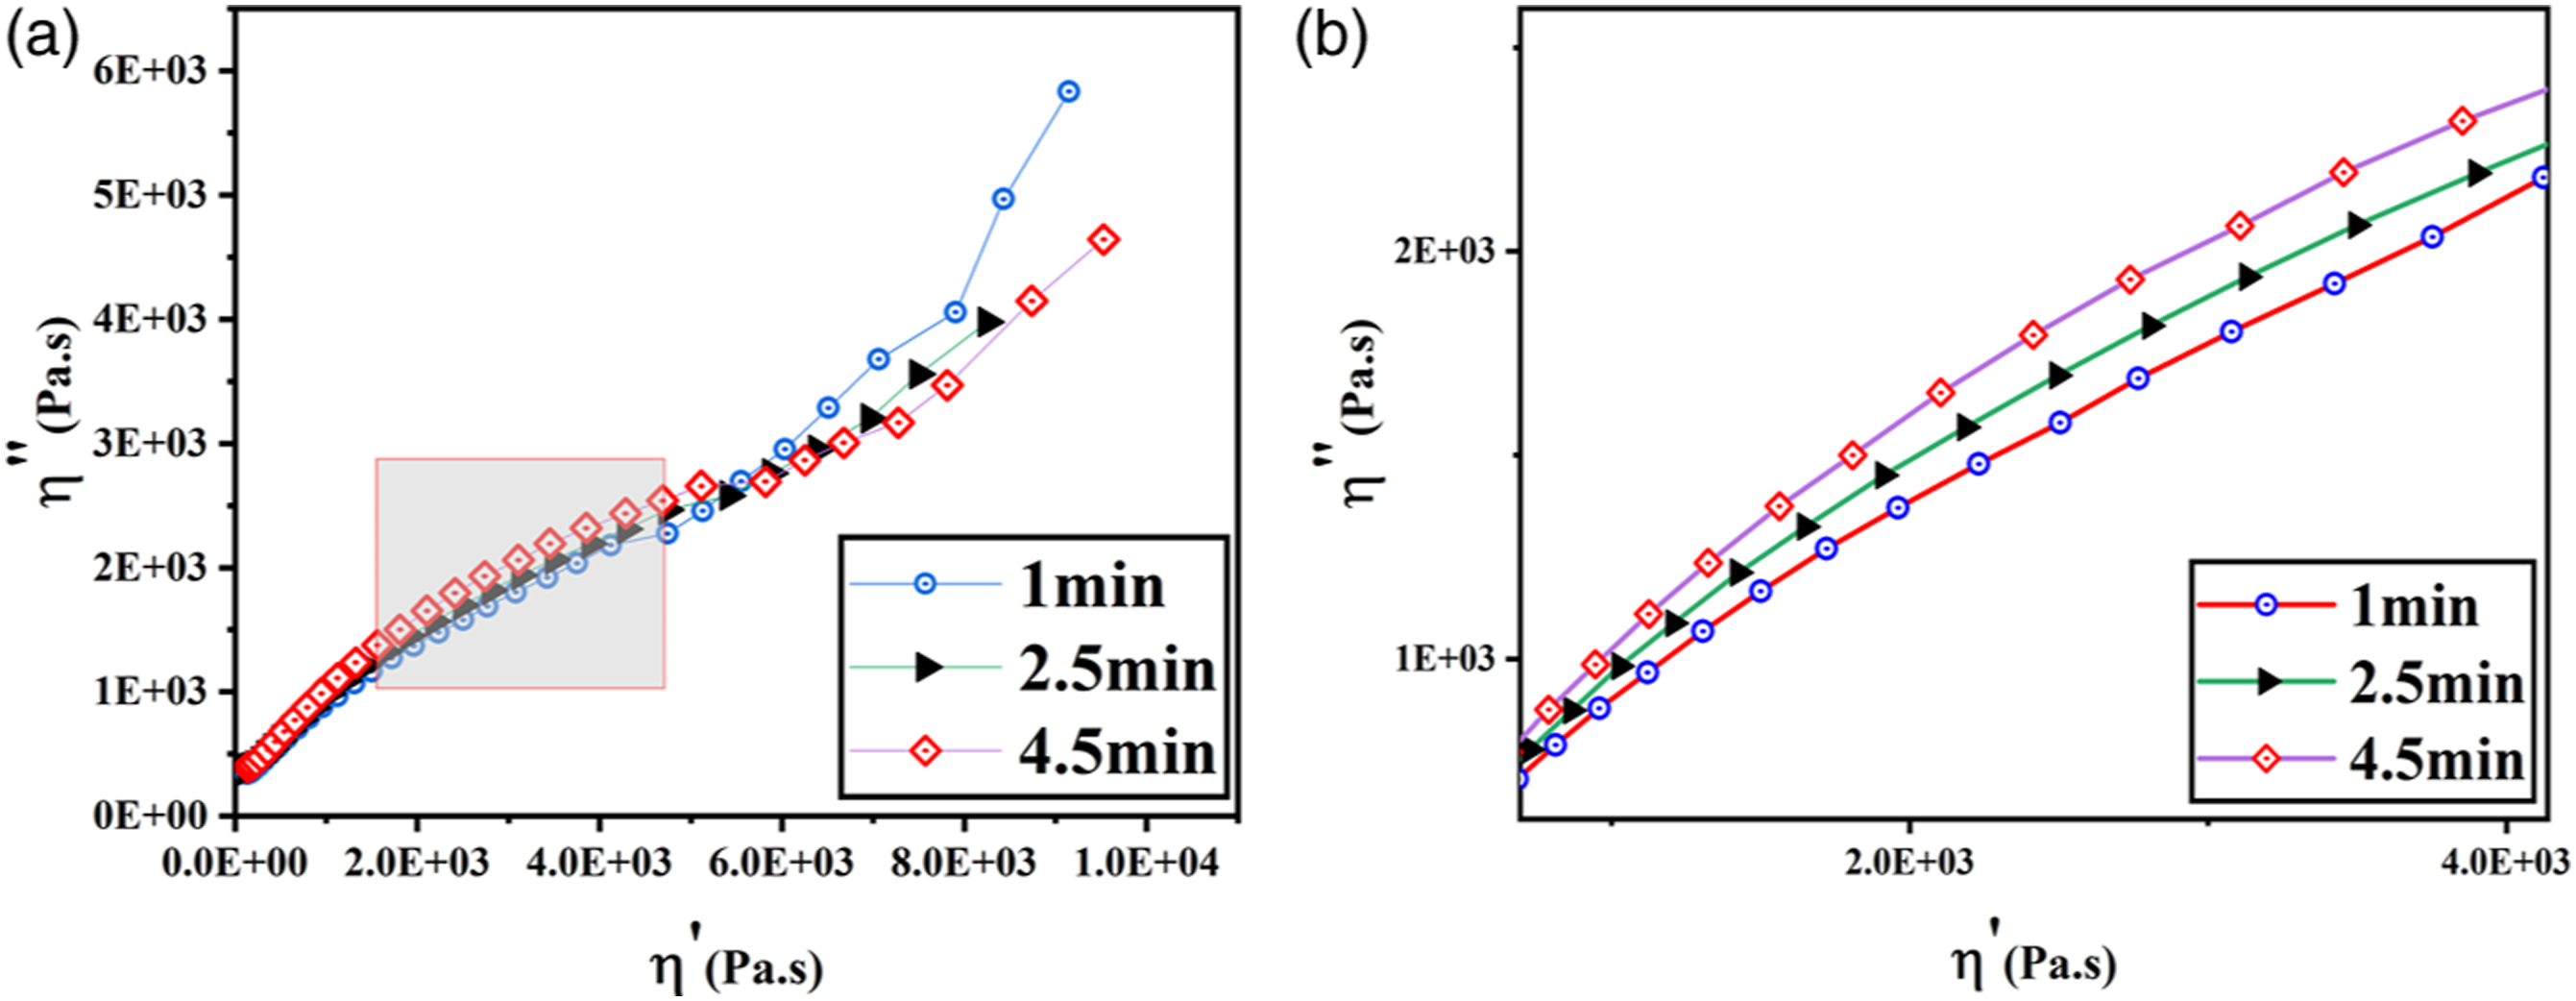
Figure 11 shows Cole-Cole plots (ƞ″- ƞ′) of the samples. The height of semi-arcs has increased with mixing time. A higher peak shows more homogenization which takes place with increased mixing time of the PP-g-MA compatibilizer.
64
Plots of a) complex viscosity, b) loss modulus and c) storage modulus versus frequency on the left with their magnified images on the right, for the mixing time of 1 min, 2.5 min and 4.5 min. Han plots of a) 1 min, 2.5 min and 4.5 min samples and b) magnified image. Cole-Cole plots of a) 1 min, 2.5 min and 4.5 min samples and b) magnified image.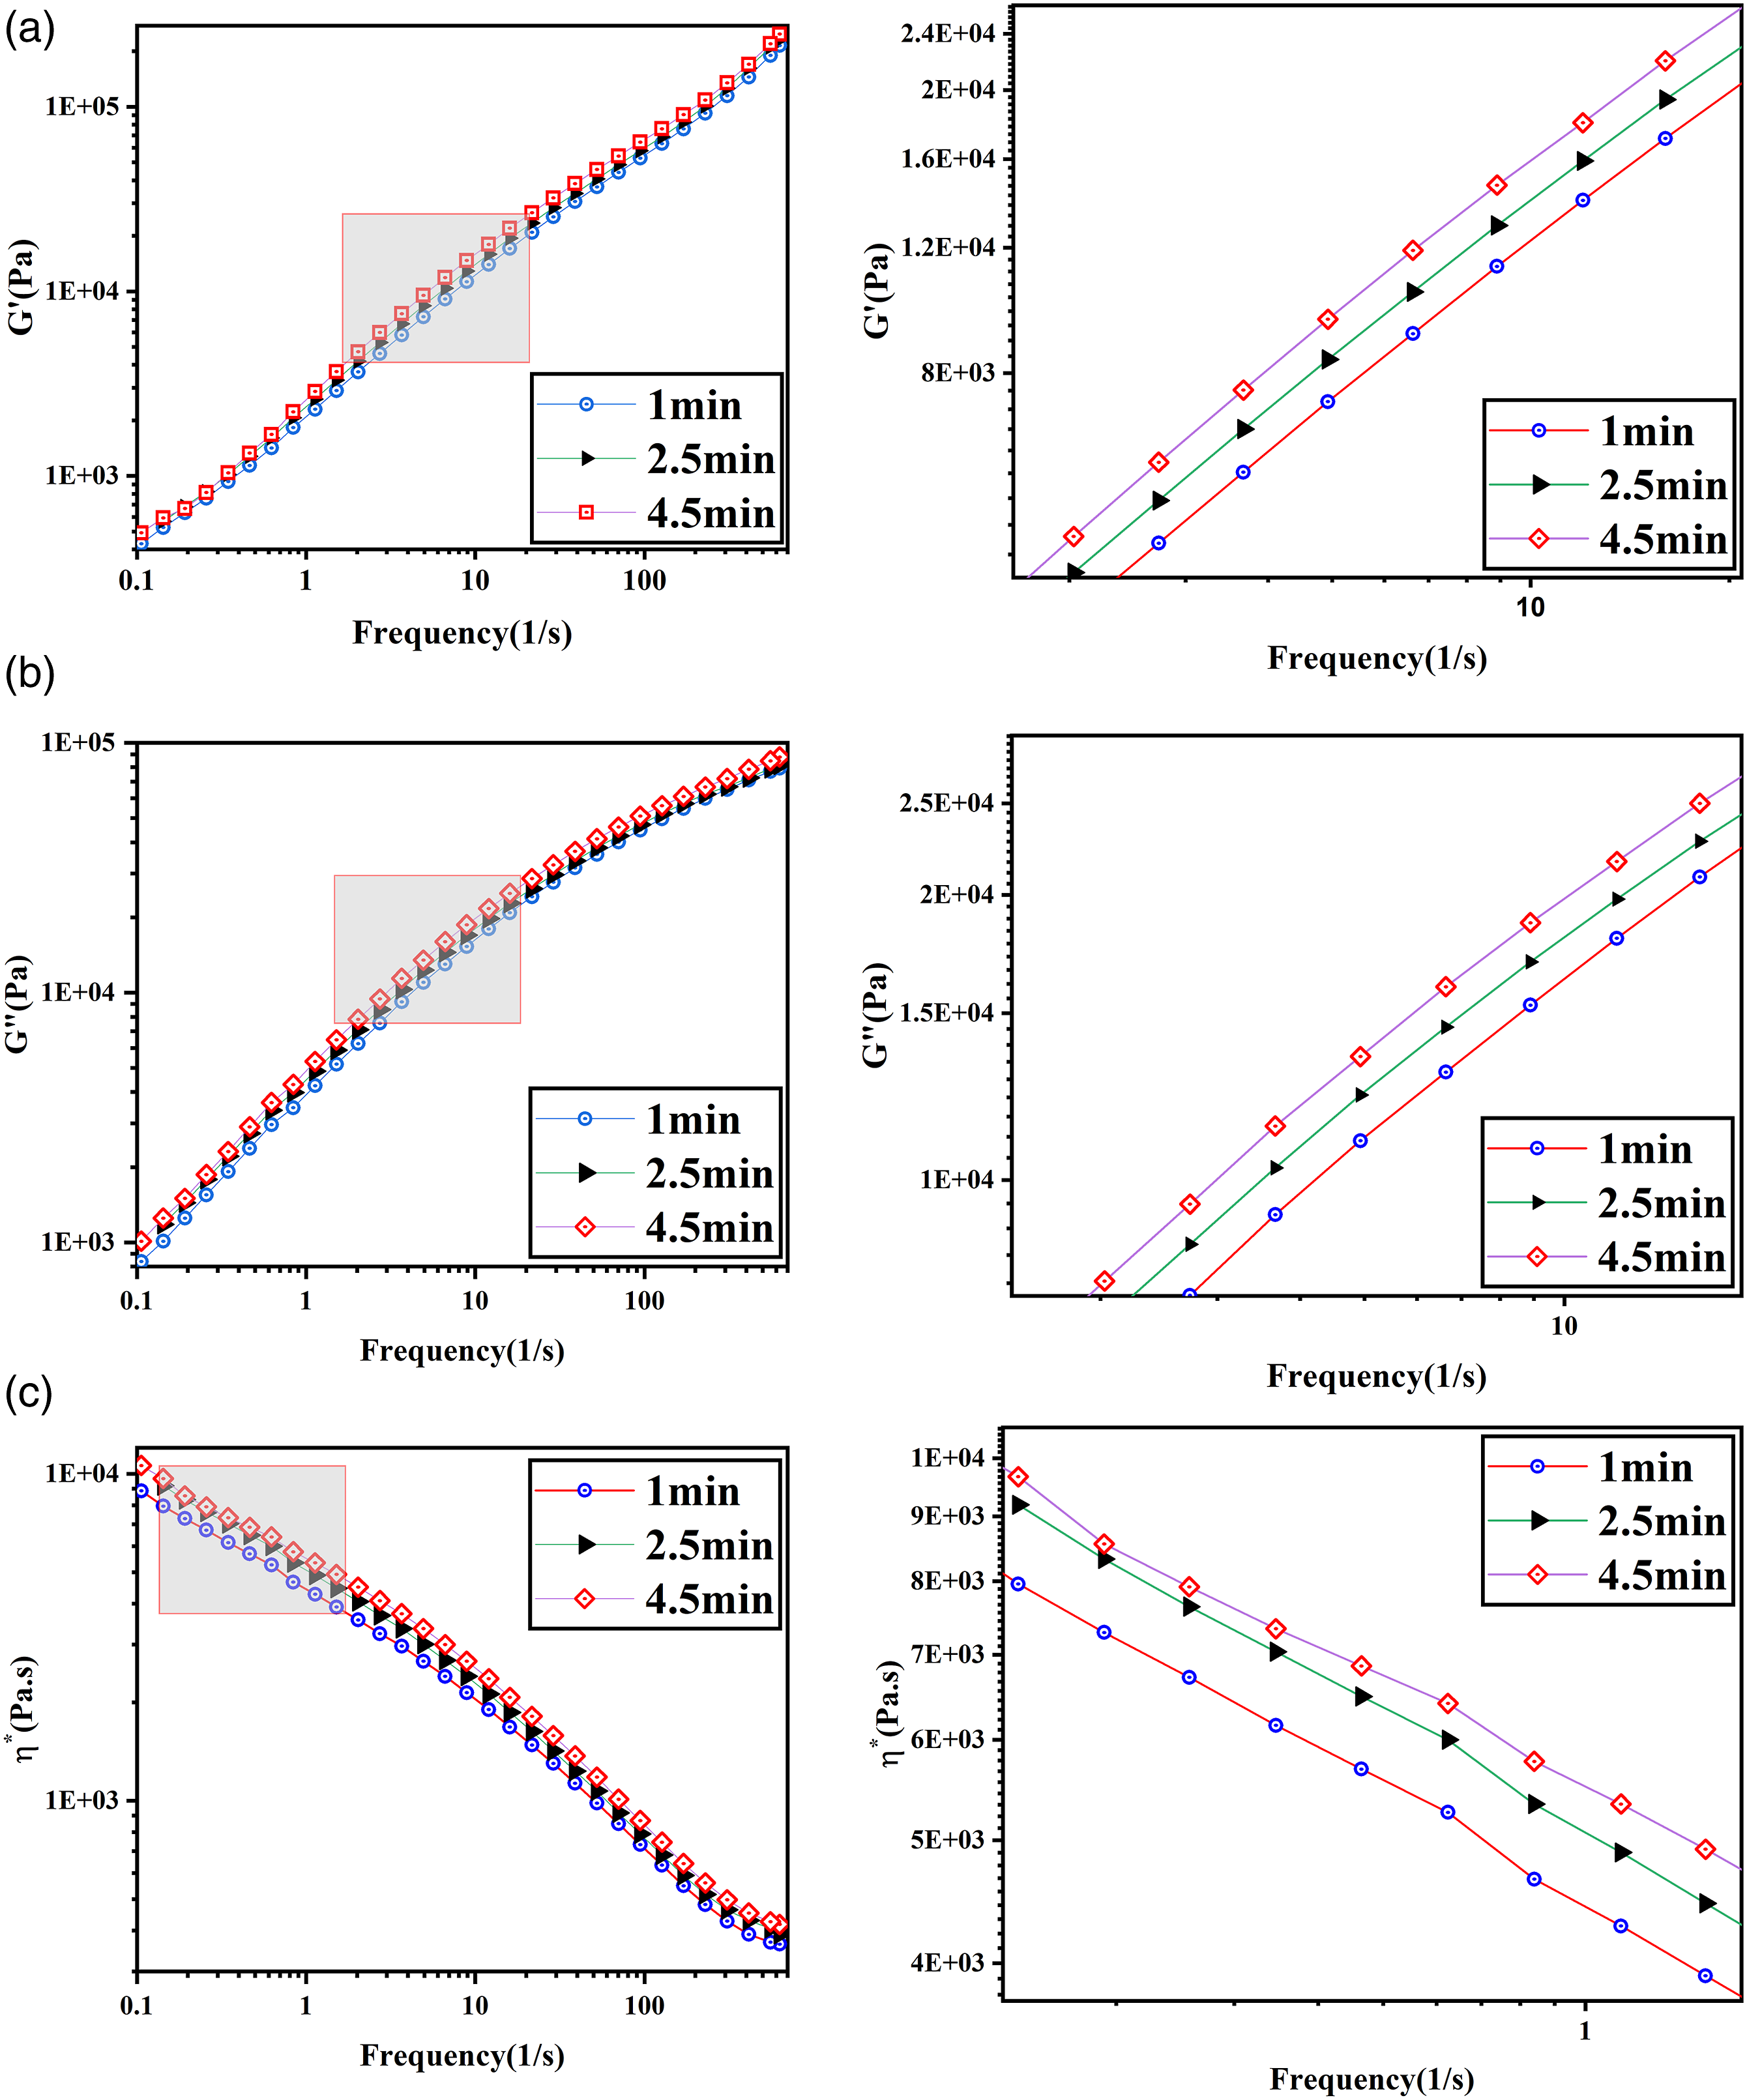
3.6- Mechanical properties
Figure 12 shows the average tensile stress-strain curves of PP/EVA/PP-g-MA (MWCNTs 0.6 v%) at varying mixing times of 1 min, 2.5 min, and 4.5 min. As seen all the samples are ductile and the short mixing time has not caused a severe effect on the tensile properties.
65
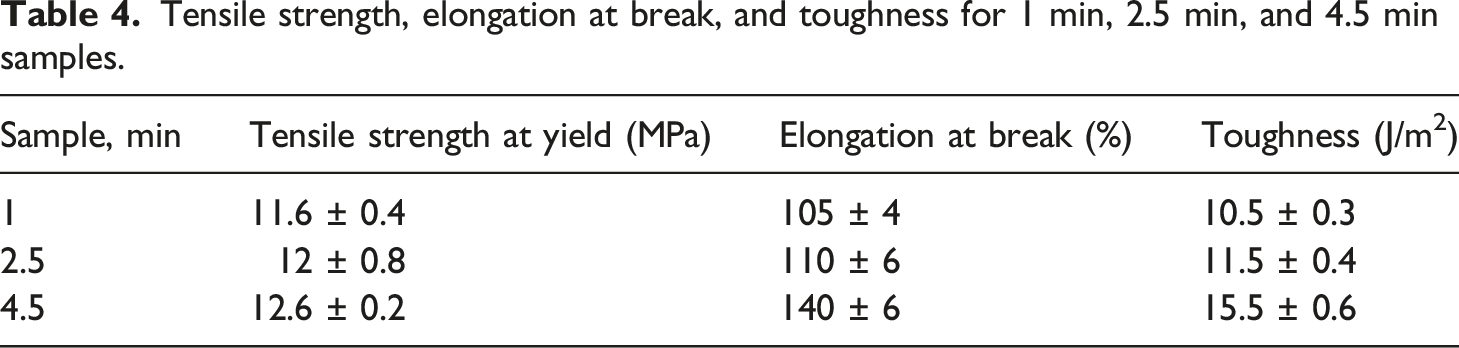
It is interesting that a monotonic yield behavior is observed for the samples with longer mixing times while for the sample with the short mixing time a non-monotonic yield behavior is observed. A nominal yield elongation of 40% can be assigned to the sample with 1 min mixing time. The results of tensile tests are tabulated in Table 4. Tensile strength, elongation at break, and toughness have slightly improved with increasing mixing time due to the reduction of interfacial tension originating from the development of compatibilizer dispersion in the polypropylene phase and the migration of some of it towards the interface. Stress-strain plots of 1 min, 2.5 min, and 4.5 min samples. Tensile strength, elongation at break, and toughness for 1 min, 2.5 min, and 4.5 min samples.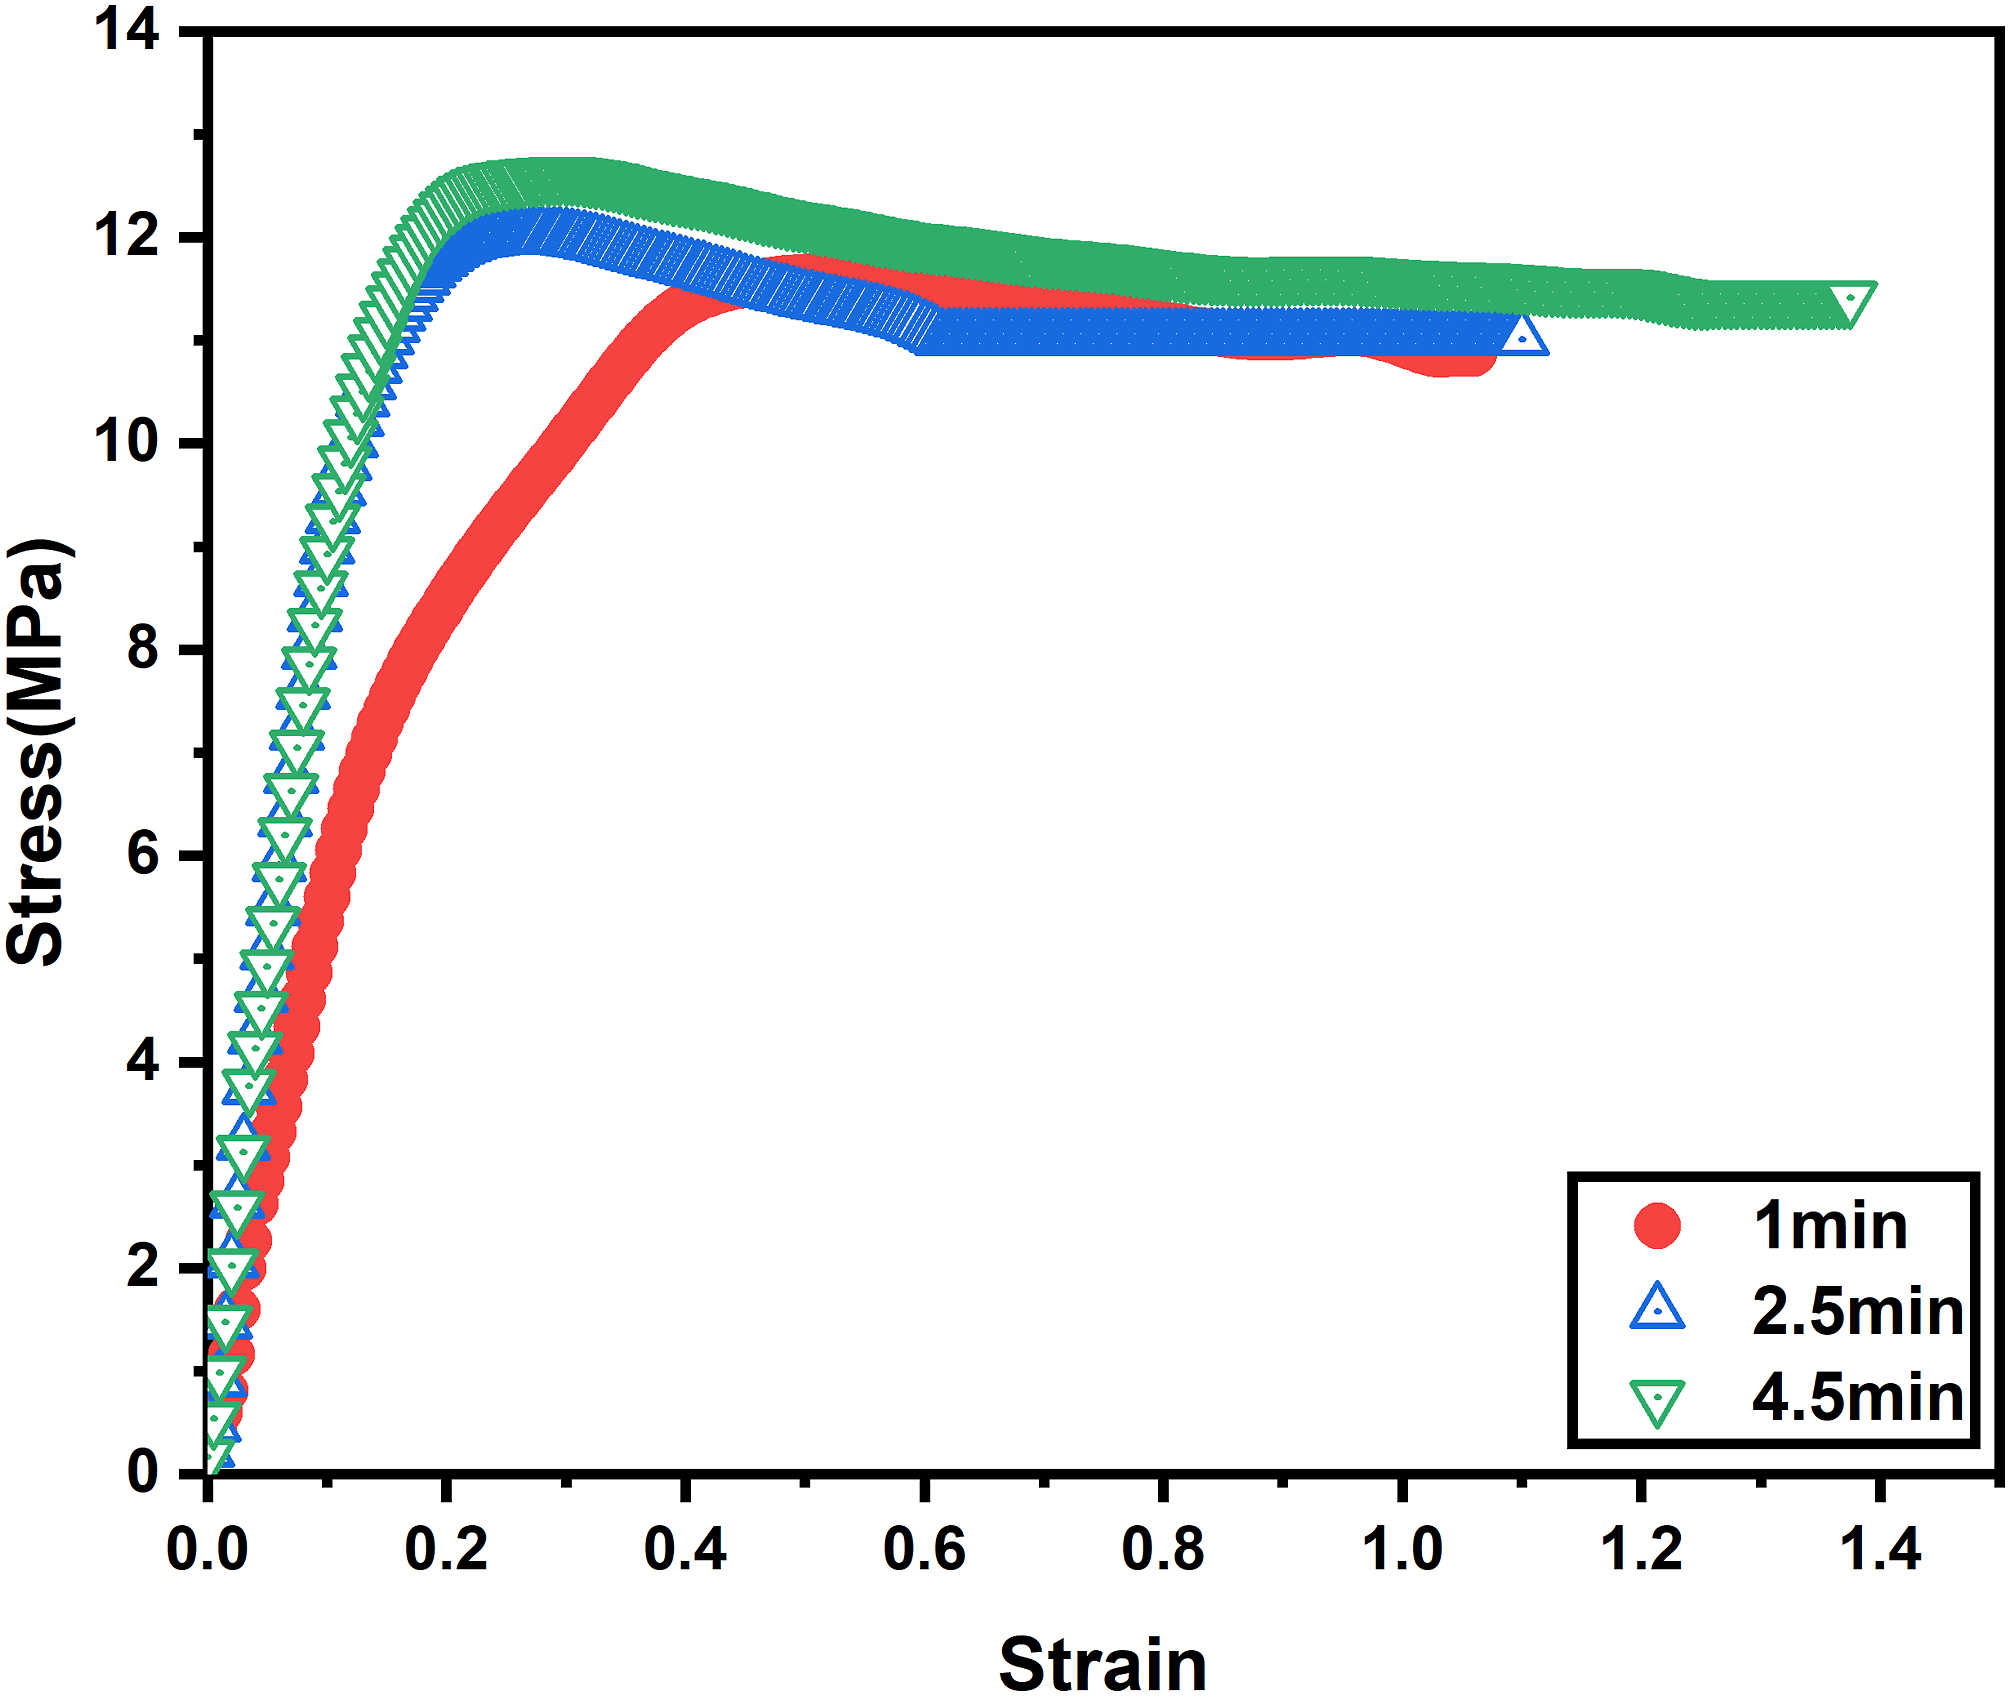
Conclusion
In this research, the effect of mixing time of PP-g-MA/MWCNTs masterbatch into a PP/EVA polymer blend on dielectric properties and electrical conductivity in AC and DC mode was studied. SEM and AFM results confirmed a co-continuous morphology for PP/EVA/PP-g-MA blends. A very low percolation threshold of 0.16 v% was obtained for the sample with a short mixing time of 1 min. For the direct method of mixing of all components at once, a percolation threshold of 0.95 v% was obtained. The results indicated that with an increase in the mixing time, the interfacial polarization increased which led to an increase in the dielectric constant due to a better distribution/dispersion of the masterbatch and an increase in the number of conductive nano-units according to Maxwell-Wagner-Sillars theory. Also, the results of impedance spectroscopy showed the interplay of the two electrical conduction mechanisms i.e. at low mixing time electrical contact was the main mechanism of conduction while at higher mixing time electron tunneling became the main mechanism of electrical conduction. It was interesting to also see that direct contact was the main mechanism for the sample with a low mixing time before the frequency cutoff. Before the frequency cutoff, the impedance decreased with a decrease in mixing time but after that, the trend was the opposite. The Nyquist plots revealed that as the particle distances decreases due to a higher degree of dispersion at a higher mixing time, the center of the semicircle shifts to a lower frequency. Therefore, this shift can be used as a tool to identify the dispersion/distribution state of a nano-filler in a matrix. The complementary results of rheology, mechanical properties, and microstructural examination validated the loss of interconnected conductive networks at a longer mixing time of the masterbatch. The use of impedance spectroscopy to investigate conduction mechanisam or conductive filler dispersion/distribution or blend morphology is applicable to all conductive nanocomposite materials with an insulating matrix.
Supplemental Material
Employing impedance spectroscopy to investigate electrical conduction mechanism in polymer composite blends containing conductive masterbatch: PP/EVA/ (PP-g-MA/MWCNTS)
Employing impedance spectroscopy to investigate electrical conduction mechanism in polymer composite blends containing conductive masterbatch: PP/EVA/ (PP-g-MA/MWCNTS) by Parsa Dadashi and Ghodratollah Hashemi Motlagh in Party Politics
Footnotes
Acknowledgements
The author of the article is extremely grateful to Azmoun Dana Plastic Company for providing the laboratory equipment to carry out this project.
Declaration of conflicting interests
The author(s) declared no potential conflicts of interest with respect to the research, authorship, and/or publication of this article.
Funding
The author(s) received no financial support for the research, authorship, and/or publication of this article.
Supplemental Material
Supplemental material for this article is available online.
References
Supplementary Material
Please find the following supplemental material available below.
For Open Access articles published under a Creative Commons License, all supplemental material carries the same license as the article it is associated with.
For non-Open Access articles published, all supplemental material carries a non-exclusive license, and permission requests for re-use of supplemental material or any part of supplemental material shall be sent directly to the copyright owner as specified in the copyright notice associated with the article.