Abstract
Laminated composite beams are widely used in engineering applications, including wind turbine blades and automobile, where the structures are highly subjected to non-deterministic random loadings, requiring a reliable technique to ensure the stability of the structure during operation. Recently, to mitigate the effects of random loadings on the structural stability of the structure, segments of magnetorheological (MR) fluids have been embedded in the laminated beams (MR-laminated beams). In this work, the effects of the size and location of MR-fluid segments on random vibration characteristics are investigated. A laminated beam is considered in which several layers/segments are filled with MR fluids and are subjected to several random loads. An N-layer model of layerwise theory (LWT) developed by the present authors in previous work is considered for computational purposes. A finite element model based on LWT is developed to study the numerical examples. MR-laminated beams consist of five sections; two MR-fluid sections and three composite sections have been studied using LWT. To justify the numerical results, the first three natural frequencies of a laminated beam without an MR layer are solved using a 3D model in COMSOL software which shows a close match with the results of LWT. An in-house experimental setup has been developed to verify the simulation results. The simulation results are then compared with the first-order shear deformation theory (FSDT) and verified by several experimental tests. The effects of MR fluid segments on the dynamic response of MR-laminated beams for six different configurations have been investigated. In addition, the effects of thicknesses of MR fluid section on the dynamic behavior of structures have been investigated. Effects of magnetic fields on statistical properties, correlation, and autocorrelation on MR-laminated beams made of E-glass and fiber-carbon have been investigated. As a case study, the vibration response of a wind turbine blade made of an MR-laminated beam has been investigated using a narrow band process.
Introduction
Composite materials, as structural elements, are being used in various applications in which the stability of the system under random excitation is a major concern. That includes the arms of the robot, wings, wind turbine blades, and dampers and chassis in the automobile. Such structures suffer from insufficient dynamic characteristics, particularly damping and controllability, that may result in catastrophic failure when the structure undergoes unpredicted dynamic loadings. In the past few years, researchers have attempted to develop accurate and efficient models to simulate the stability/dynamic behavior of composite structures.
Derbale et al. 1 investigated the effects of critical buckling and temperatures on laminated beams. Bouazza et al. 2 Studied post-buckling of a thick FGM rectangular beam using the hyperbolic shear deformation theory (HYSDT). Bouazza et al. 3 investigated the thermal effects on the behavior reinforced concrete beams strengthened by bonded angle-ply laminated composites. Bouazza and Zenkour 4 investigated the buckling of cross-ply and angle-ply composite beams under hygro-thermo-mechanical loading. Antar et al. 5 investigated he hygrothermal effects on the behavior of reinforced-concrete beams strengthened by bonded composite laminate plates. Bouazza et al. 6 investigated the effects of temperature distribution, length to thickness ratio, modulus ratio, and thermal expansion coefficient ratio on thermal buckling of isotropic, orthotropic and laminated composite beams. Ebrahimi et al. 7 investigated the wave propagation in simply supported (S-S) functionally graded (FG) beam while the beam is exposed to magneto-thermal environments and embedded on two-parameter elastic foundation. Amara et al. 8 studied the post-buckling of simply supported FGM beams using various theories, classical beam theory (CBT), first-order shear deformation beam theory (FSDBT), parabolic shear deformation beam theory (PSDBT) and exponential shear deformation beam theory (ESDBT). Bouazza et al. 9 developed the post buckling analysis of a nanobeams based on trigonometric shear deformation theory. Zabihollah et al. 10 calculated the dynamic behavior of tapered laminated composite beams reinforced with different fractions of nano-particles.
The above studies bold the importance of the dynamic/stability responses of the composite structures. However, it is understood that using a passive technique such as layer orientation, resin type/thickness, curing, etc., may not always be an appropriate solution to enhance the dynamic/stability behavior of the structure. Most recently, due to the advancement in smart materials, researchers in the composite structure communities attempted to improve the performance of structures by adding/embedding smart materials/elements to the conventional laminated composite structures. Rudykh and Bertoldi 11 investigated the stability of magnetorheological elastomer and calculated the finite deformation for onset of macroscopic instability by applying magnetic fields. Qiu et al. 12 obtained the natural frequencies and damping coefficients of aluminum beams incorporated with electrorheological fluid (ER). Eshaghi et al. 13 numerically and experimentally calculated the free vibration characteristic of an aluminum sandwich plate which fully incorporated with MR fluid. Romamoorthy et al. 14 investigated the free vibration behavior of laminated composite plates which partially treated with MR fluid. Bashtovoi et al. 15 controlled the vibration behavior of plates by using MR fluid. Sun et al. 16 computed the free vibration behavior of a stainless steel adaptive beam which fully integrated with MR/ER fluid. Romaskzo and Wegrzynowski. 17 studied the free vibration response of aluminum sandwich beam incorporated with a full layer of MR fluid. Joshi et al. 18 investigated the effects of magnetic fields on the simple dynamic response of an aluminum beam filled with MR fluid. Yalcintas and Dai. 19 obtained the free vibration response of aluminum adaptive beams, which totally incorporated with MR and ER fluid. Rajamohan et al. 20 Experimentally and numerically calculated simple dynamic behavior of aluminum beam incorporated with MR fluid. The simple dynamic behavior of an aluminum sandwich beam which fully incorporated with MR fluid has been studied by Sapinski and Snamina. 21
Existing works on MR-laminated beams use the Equivalent Single Layer theories (ESL) and deal with simple free vibration response of aluminum/stainless steel beams incorporated with a full layer of MR fluid. As a result, (ESL) theories do not provide sufficient accuracy to approximate the dynamic behavior of these structures. Layerwise theory is more suitable and accurate for determining the dynamic response of these structures compared with ESL.
Layerwise model has been used to determine the dynamic response of laminated composite beams by many researchers (Yang et al., 22 Xing et al., 23 Ferreira et al. 24 ). MR-laminated composite beams composed of a sandwich beam made by conventional laminated layers and internal layers filled by MR fluids. Modeling MR-laminated beams requires a thorough understanding of the performance of the laminated sandwich beams. Dao et al. 25 and Moreira and Rodrigues. 26 used layerwise theory to study the behavior of laminated sandwich beams under dynamic and static loading.
Barman and Hedge. 27 investigated the effects of different types of MR elastomers and modes of application of the magnetic field of the sandwich beam on natural frequencies. Kumar and Srinivasa. 28 calculated the free vibration and buckling of laminated composite sandwich plates integrated with MR, ER, and piezoelectric. Robins et al. 29 investigated the effects of discrete layers on the response of composite laminated beams based on a 2-D finite element model using the first-order shear deformation theory (FSDT). Rahul and Shinde. 30 determined the static deformation of the cross-ply laminated beam based on layerwise theory. Latifi et al. 31 developed an N-layer model for determining the dynamic behavior of laminated composite beams without MR fluid. Naji et al. 32 applied the simple layerwise theory to determine the free vibration response of a laminated composite beam filled with a full layer of MR fluid. An accurate model for the N-layer of an MR-laminated beam and an accurate finite element model for tapered laminated beams incorporated with MR-fluid based on layerwise theory has been developed by the present authors.33,34
Momeni et al. 35 investigated the experimental and theoretical dynamic behavior of composite beams incorporated with MR fluid.
Most of the existing works on the dynamic response of the MR-laminated beams are limited to the beams with one or two continuous layers of MR/ER fluids that are embedded in a specific location through the thickness. However, such arrangements may add unnecessary cost and/or complexity to the structures. Before adding MR layers to the structures, one may need to have a clear picture of the effects of MR layers on the structure’s performance, particularly the size, location, and thickness of the MR fluids. It is noted that MR segments may act as actuators to provide adaptability to the structure. In this sense, for example, adding an actuator at a node may not be beneficial in controlling the vibration.
In the present work, the vibration behavior of MR-laminated beams with different materials, locations, thicknesses, and sizes of the MR fluid layers/segments through the thickness and along the length of the beams have been studied using an N-layer model of layerwise theory (LWT) under random excitations. The finite element model based on the present LWT has been provided for computation purposes. Where applicable, the simulation results of LWT have been compared with FSDT and COMSOL software. The vibration behavior of beams under random loading subject to various boundary conditions has been considered. Several characteristics of random loading, including correlation, autocorrelation, and statistical properties are taken into consideration. In addition, the effects of MR fluid segments on the dynamic response of MR-laminated beams for six different configurations have been investigated and the effects of thicknesses of MR fluid section on the dynamic behavior of structures have been investigated. An in-house experimental setup has been developed to verify the simulation results of the present model. Using the standard test ASTM E756-98 the complex shear modulus of MR fluid has been determined. The random vibration response of a wind turbine blade made of an MR-laminated beam has been studied as a practical case study.
Mathematical modelling of MR-laminated beam
Most of the existing works on the dynamic behavior of MR-laminated beams have been investigated based on First Order Shear Deformation Theory (FSDT) and Classical Laminated Theory (CLT). The layerwise theory for the N-layer of MR-laminated beam has been developed by the present authors.
33
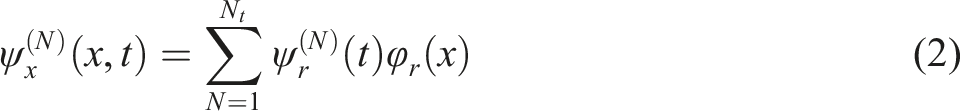
Figure 1 shows an MR-laminated beam for five layers based on a layerwise model. The variables ( Layerwise theory for five layers of laminated beam.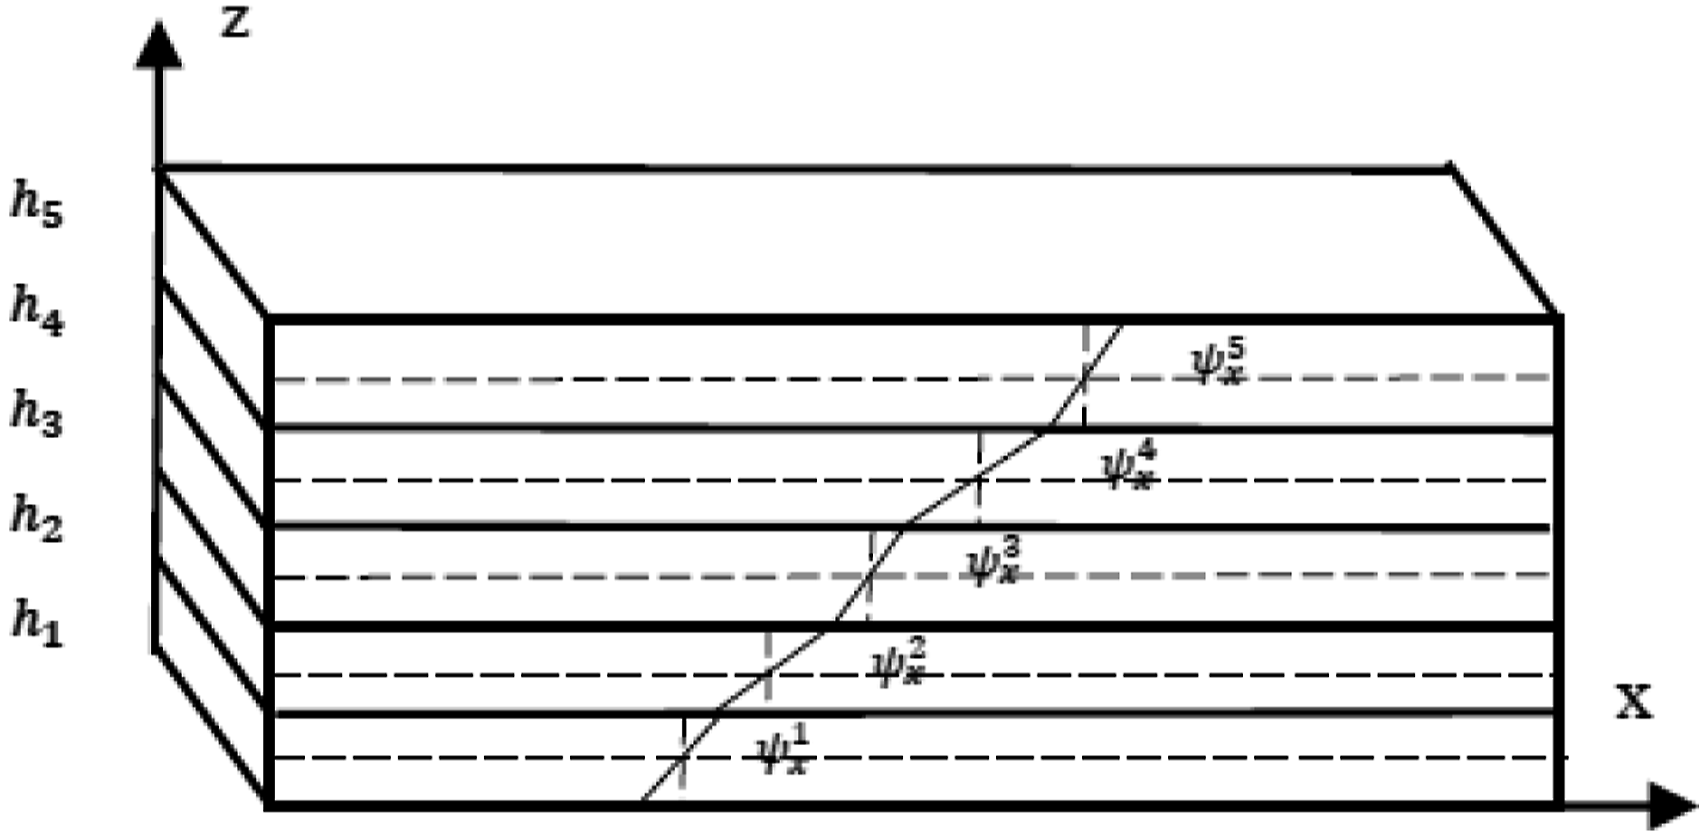
The thickness of layer N of MR-laminated beam is
The displacement of layer N is defined as


According to LWT, the global displacements of MR-laminated beam is given as
Equations of motion of MR-laminated beam
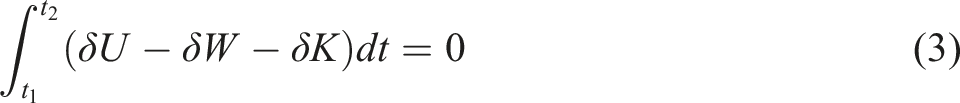
The Hamilton’s principle is defined as


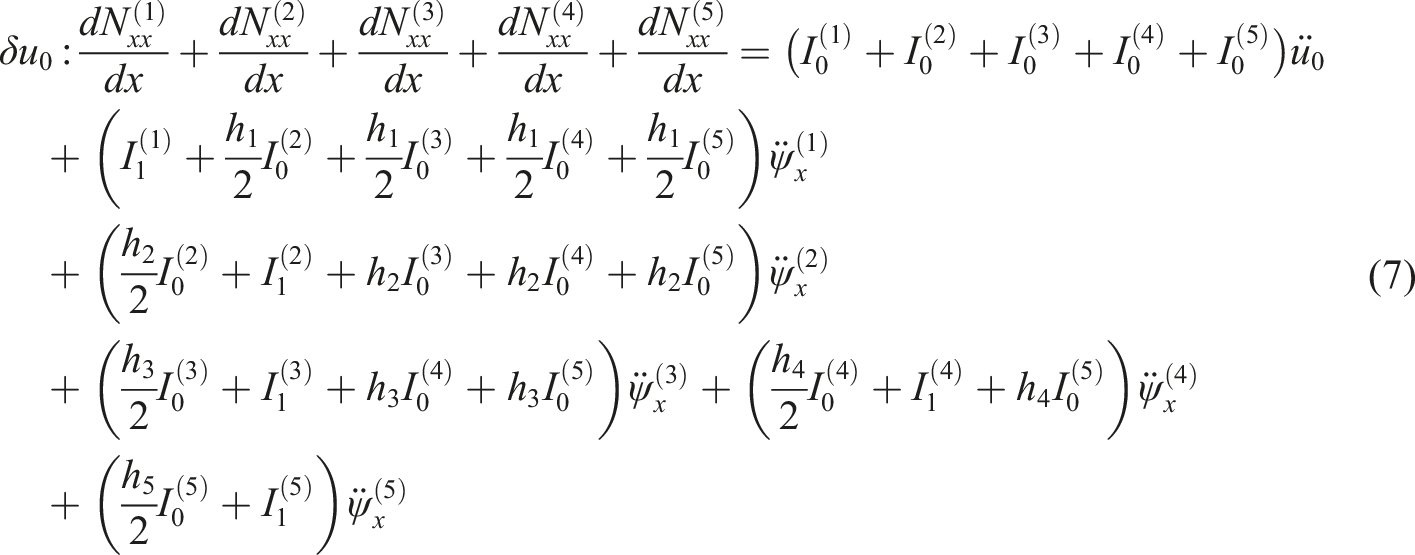
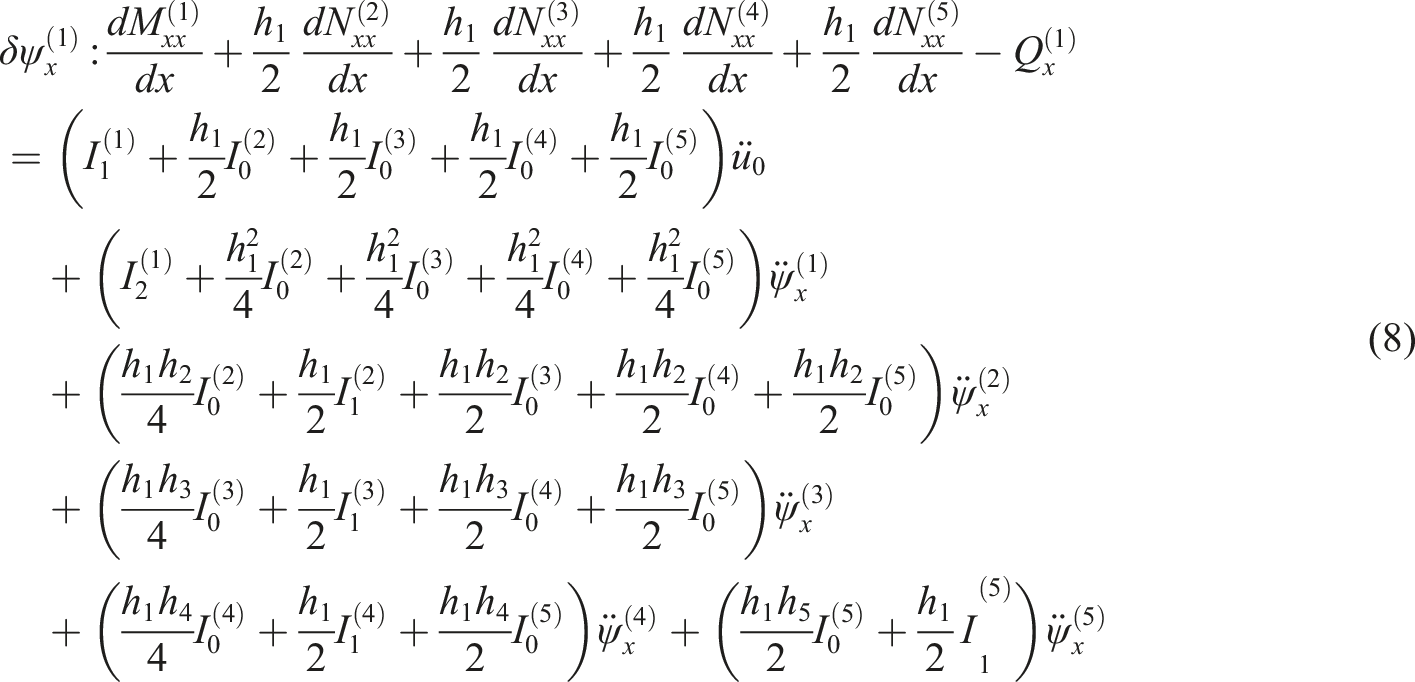
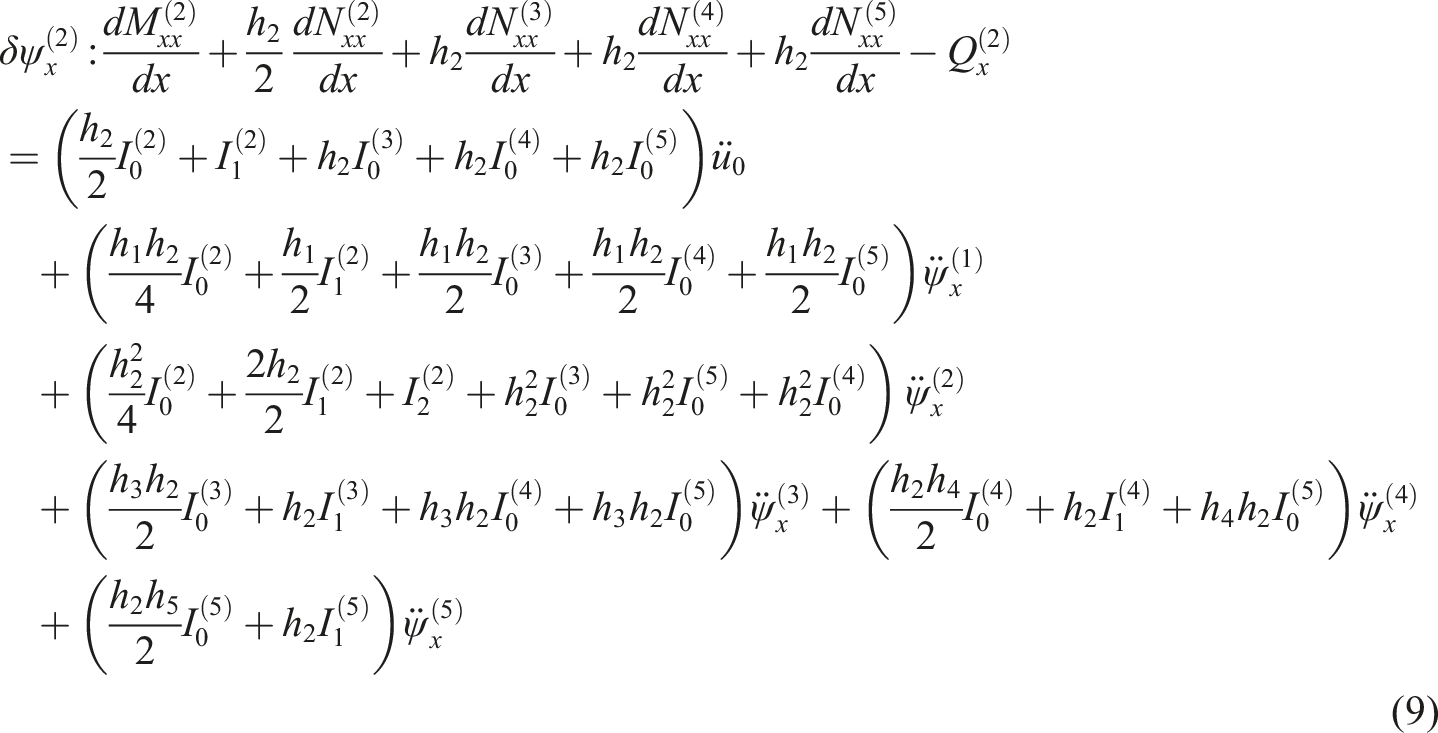
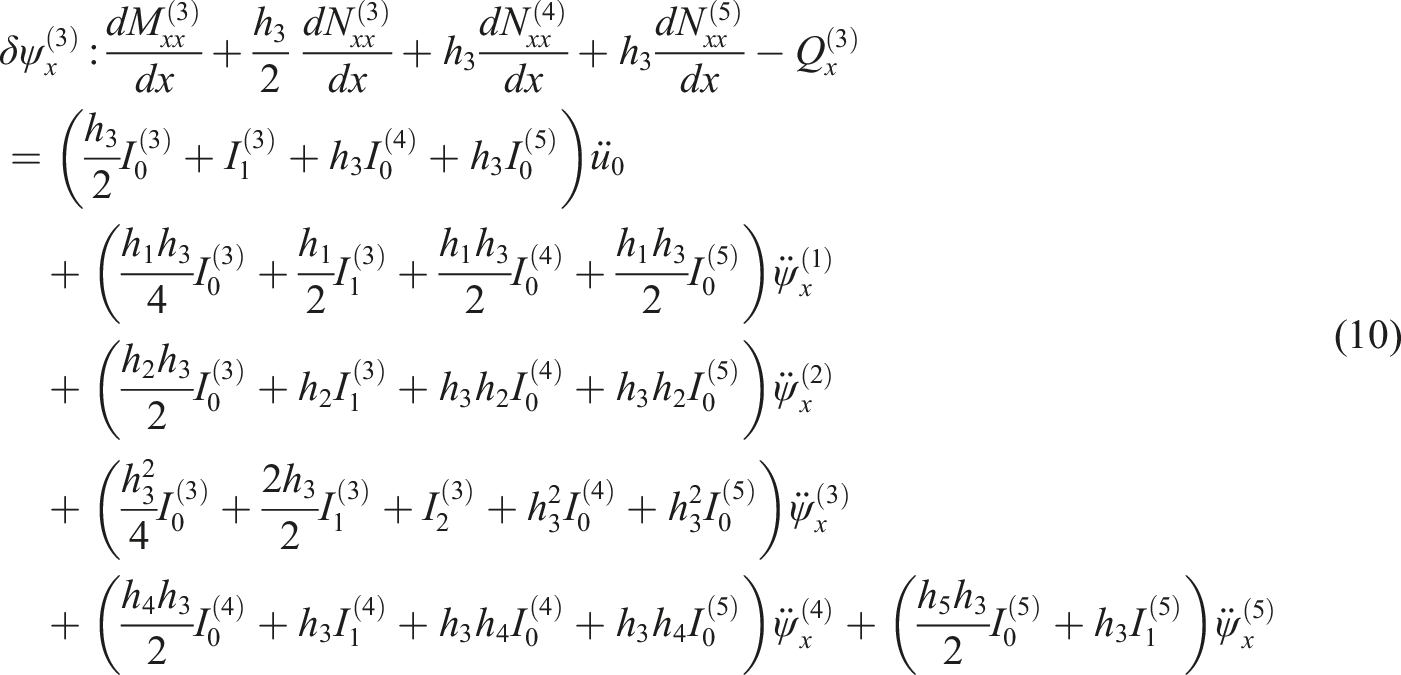
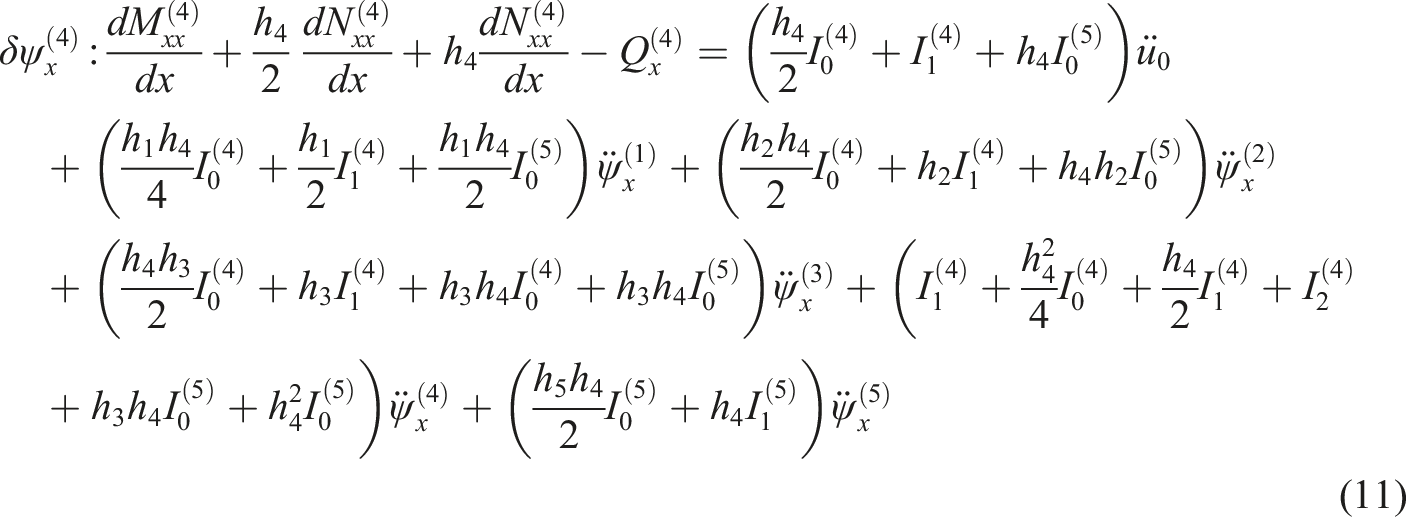
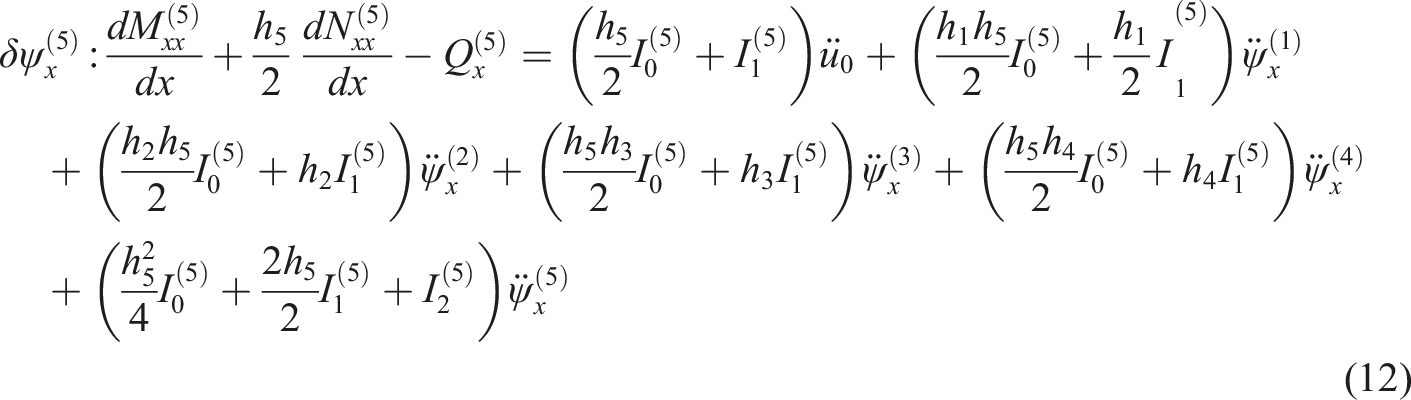
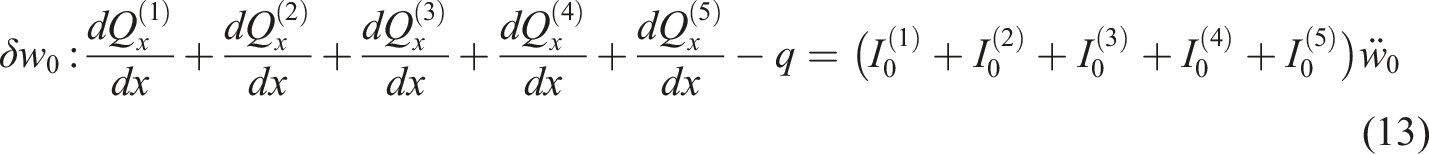
The equations of motion of MR-laminated beam for five-layers (N = 5) are derived as
The in-plane force
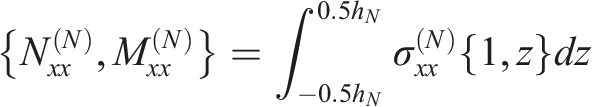
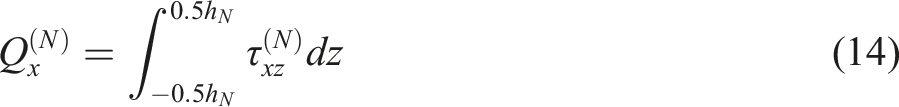
The mass moments of inertia of layer N are defined as

Finite element model
Proceeding a conventional finite element method, one may derive the matrix equations of motion of MR-Laminated beam as


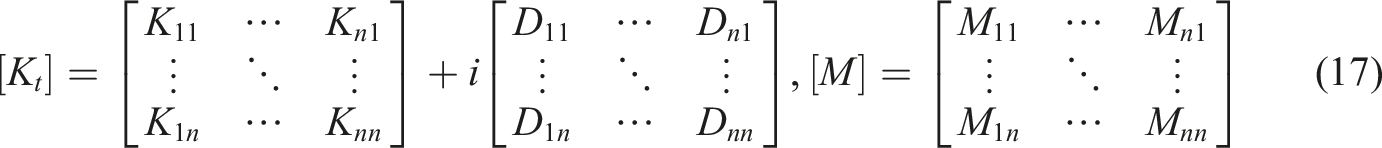
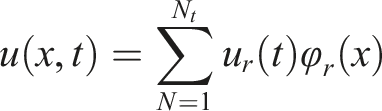
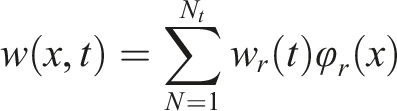
In addition, the generalized displacement field of each node,

Equation (18) shows the element displacement vector. Following a FEM, the global displacement vector and matrices are determined.
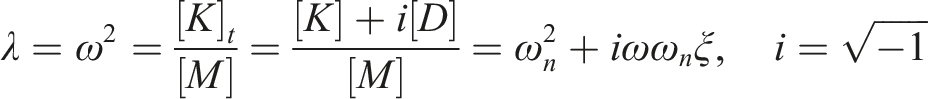
The frequency response of MR-laminated beam is determined as

The Eigenvalue of equation (19) is defined as

Random vibration analysis
In general, the equation of motion, mass and stiffness matrices should be decoupled and the equation of motion of

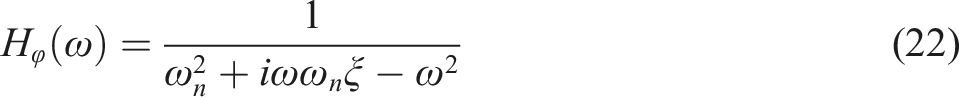
The complex frequency response function of an MR-laminated beam is defined as

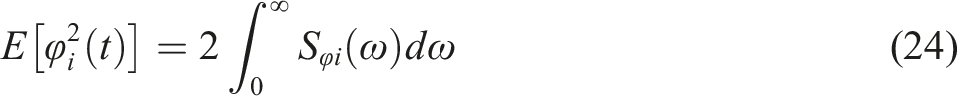
In addition, the mean square response of ith for MR-laminated beam is defined as

Then the standard deviation of MR-laminated beam is defined as

Moreover, the variance is given by

The autocorrelation function for random process


The correlation coefficient,

Fabrication and experimental study of MR-laminated beam
Fabrication: To fabricate the MR-laminated beam, a laminated plate made of eight layers of E-glass has been prepared. By using the hand-layup method the resin mixture is stirred between each layer of composite. In the next step, the laminated composite plate was placed in an autoclave for 160 min at 85°C. After curing, the plate is cut into strips with dimensions of 230 × 30 × 1.8 mm. In each finished laminated strip approach, there is 50 percent of fiber and 50 percent of the resin. To make the composite section of the MR-laminated beam, Figure 2 illustrates the cutting process of the laminated composite plate. The MR-laminated beam consists of five sections (three sections belong to laminated composites and two sections belong to MR fluid) as shown in Figure 3. The thickness of the MR fluid section is 1.3 mm, and the thickness of the composite is 1.8 mm. MR fluid with the commercial brand (MRF-132DG) is injected between two sections. The gap between MR fluid layers and composite sections was sealed with rubber. The cutting process of laminated composite plate. (a) Experimental of MR-laminated beam with five sections, (b) Thicknesses of composite sections and MR fluid sections.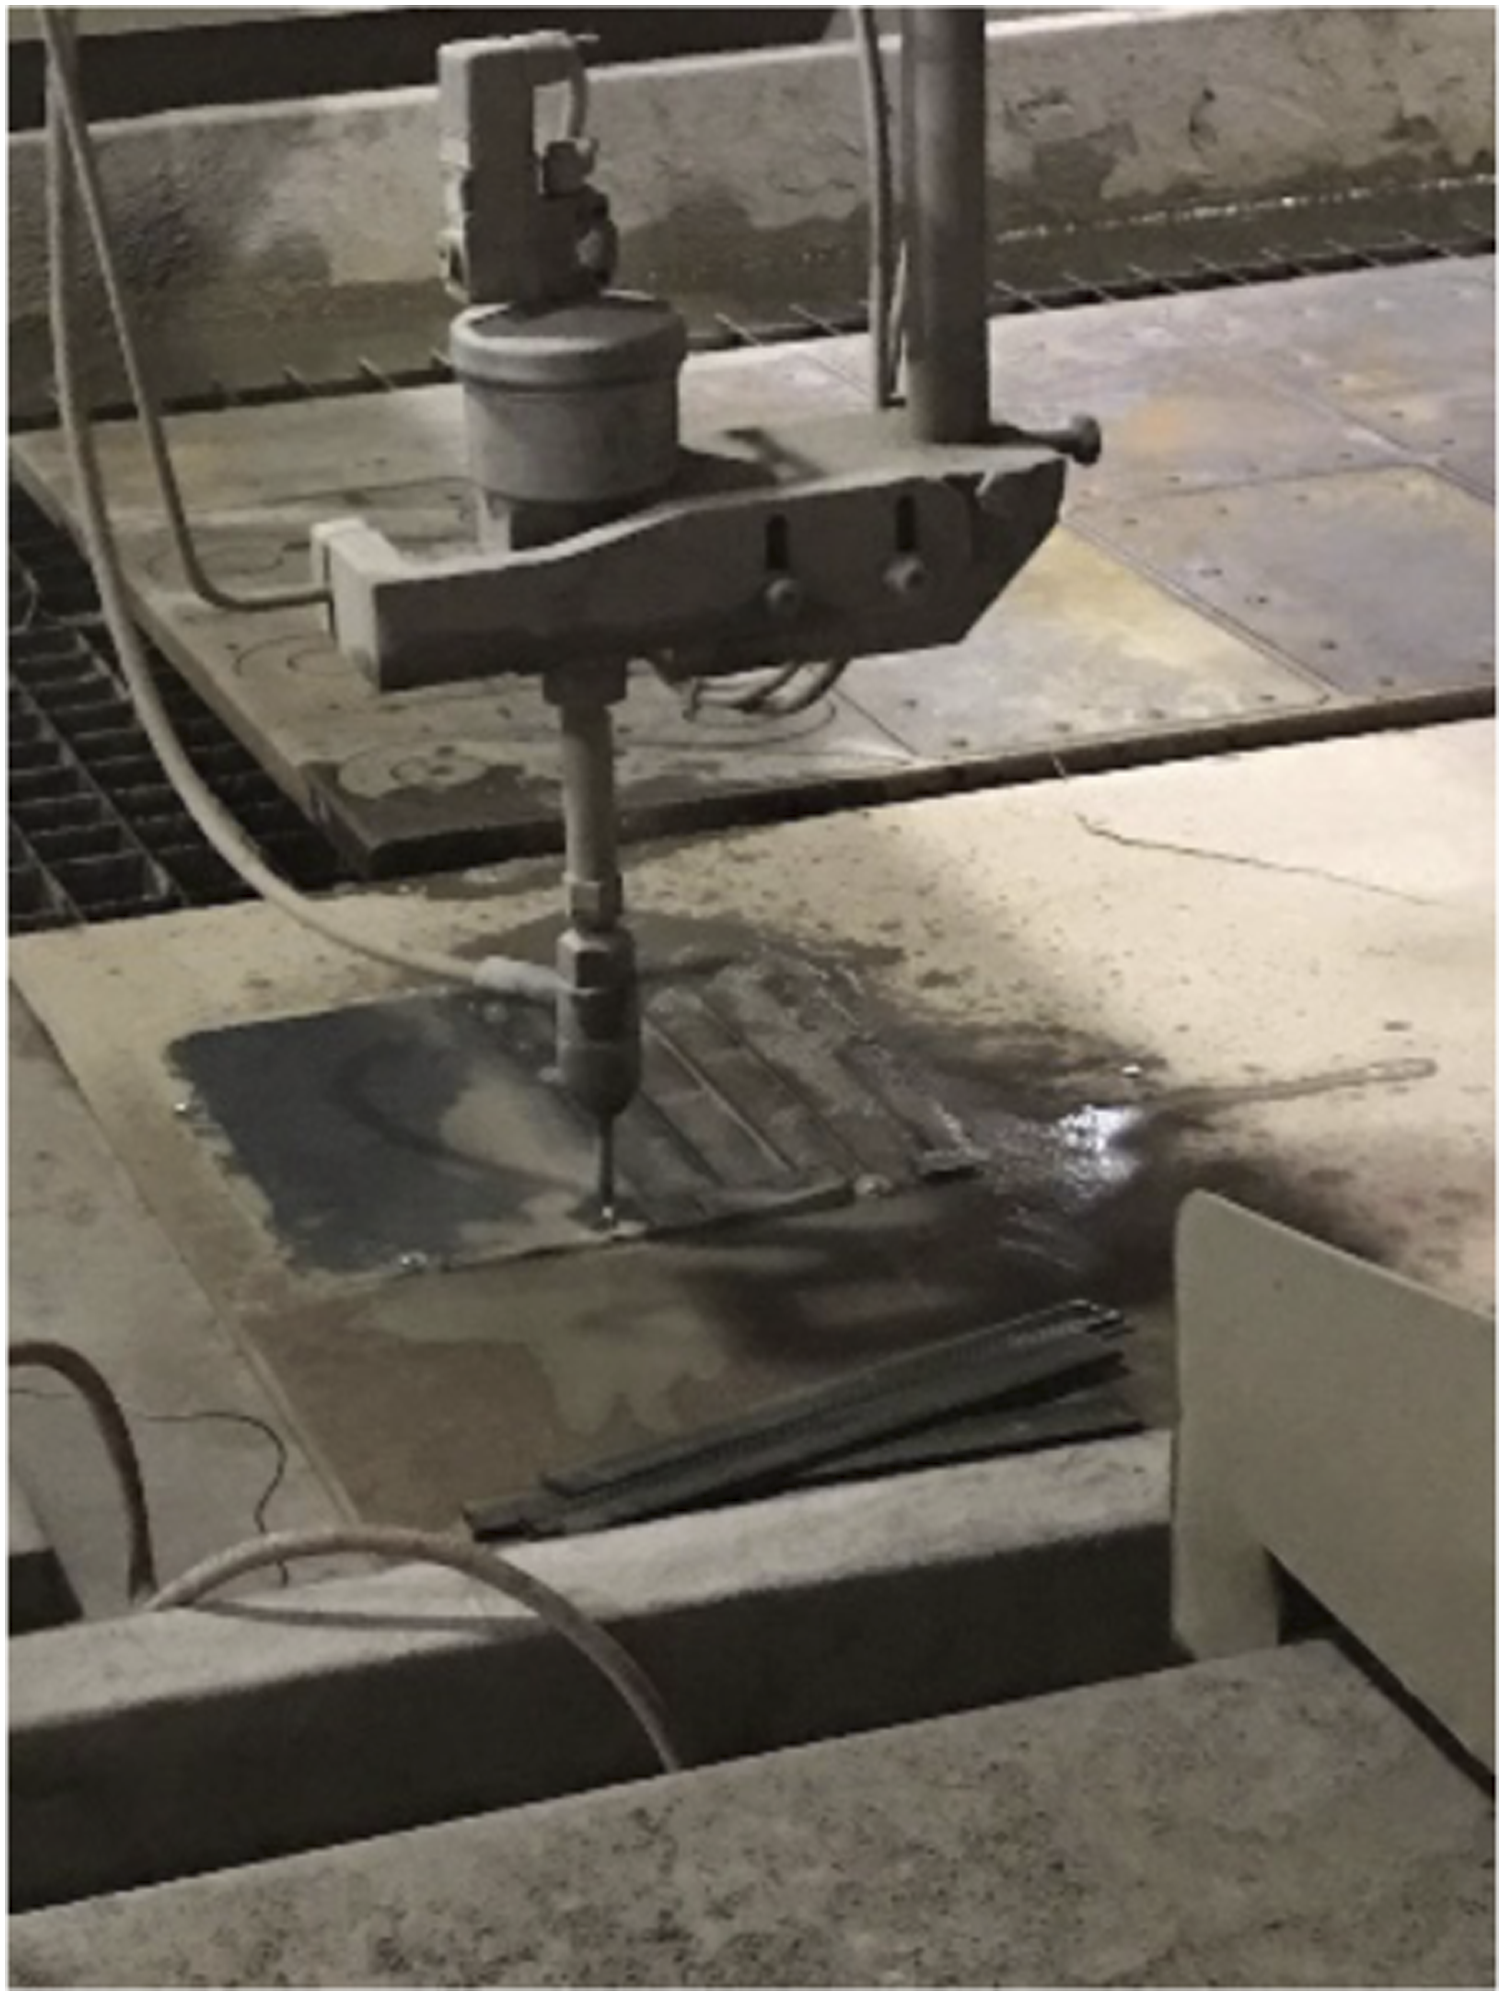
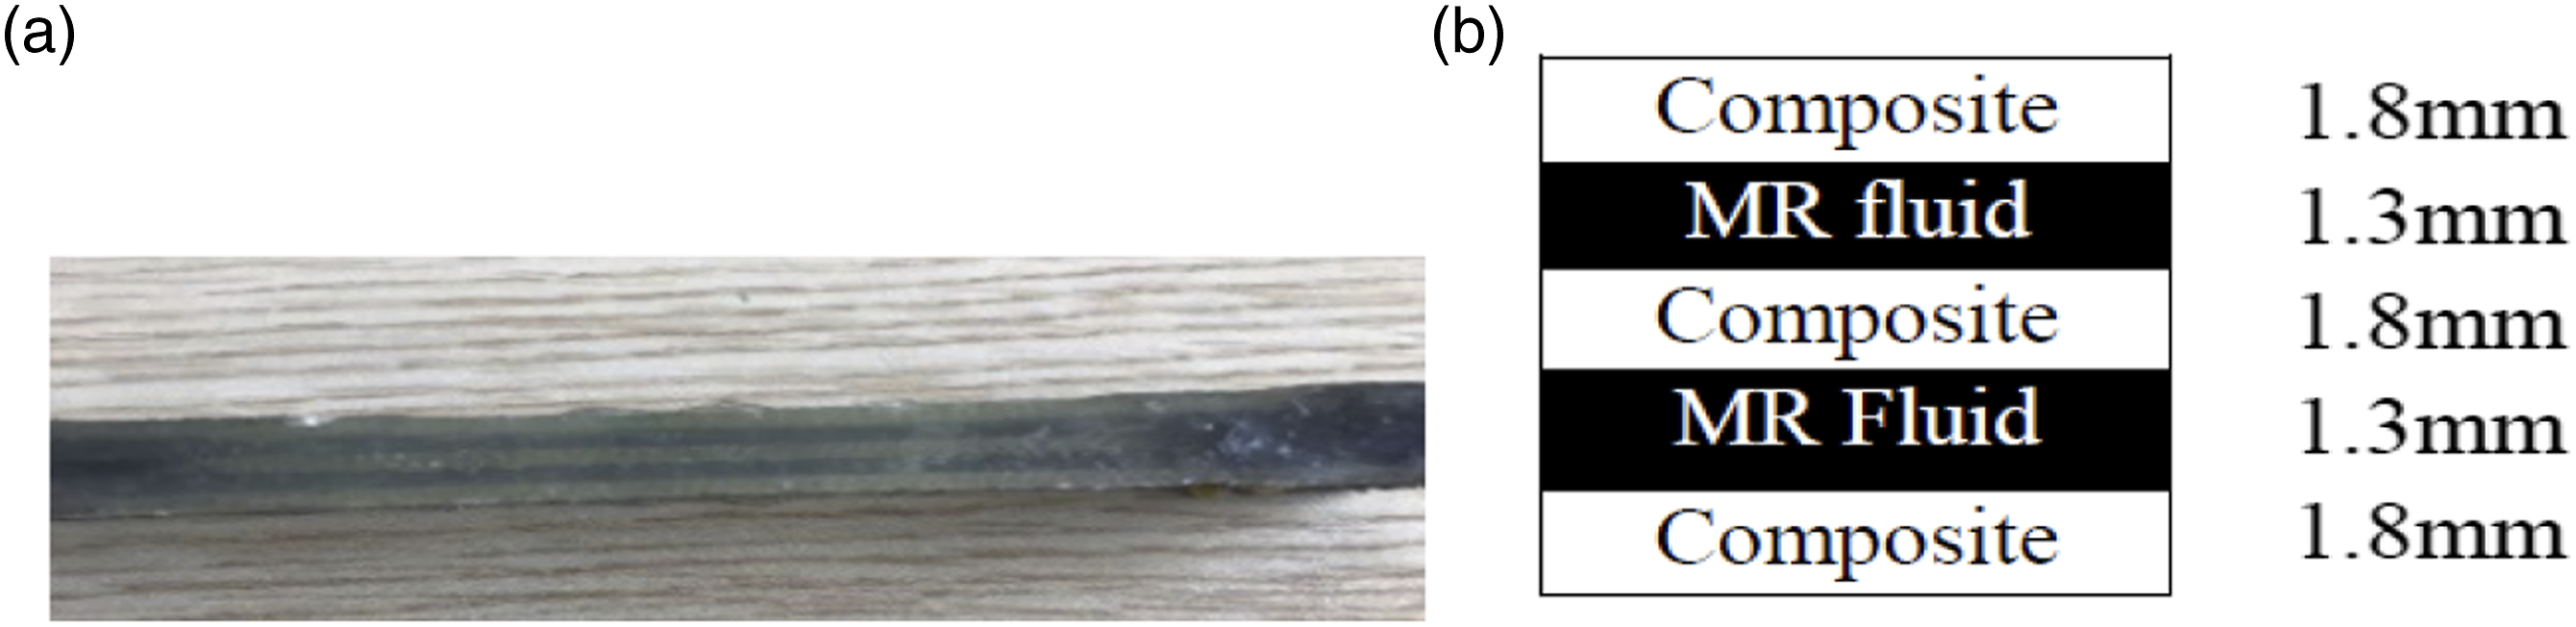
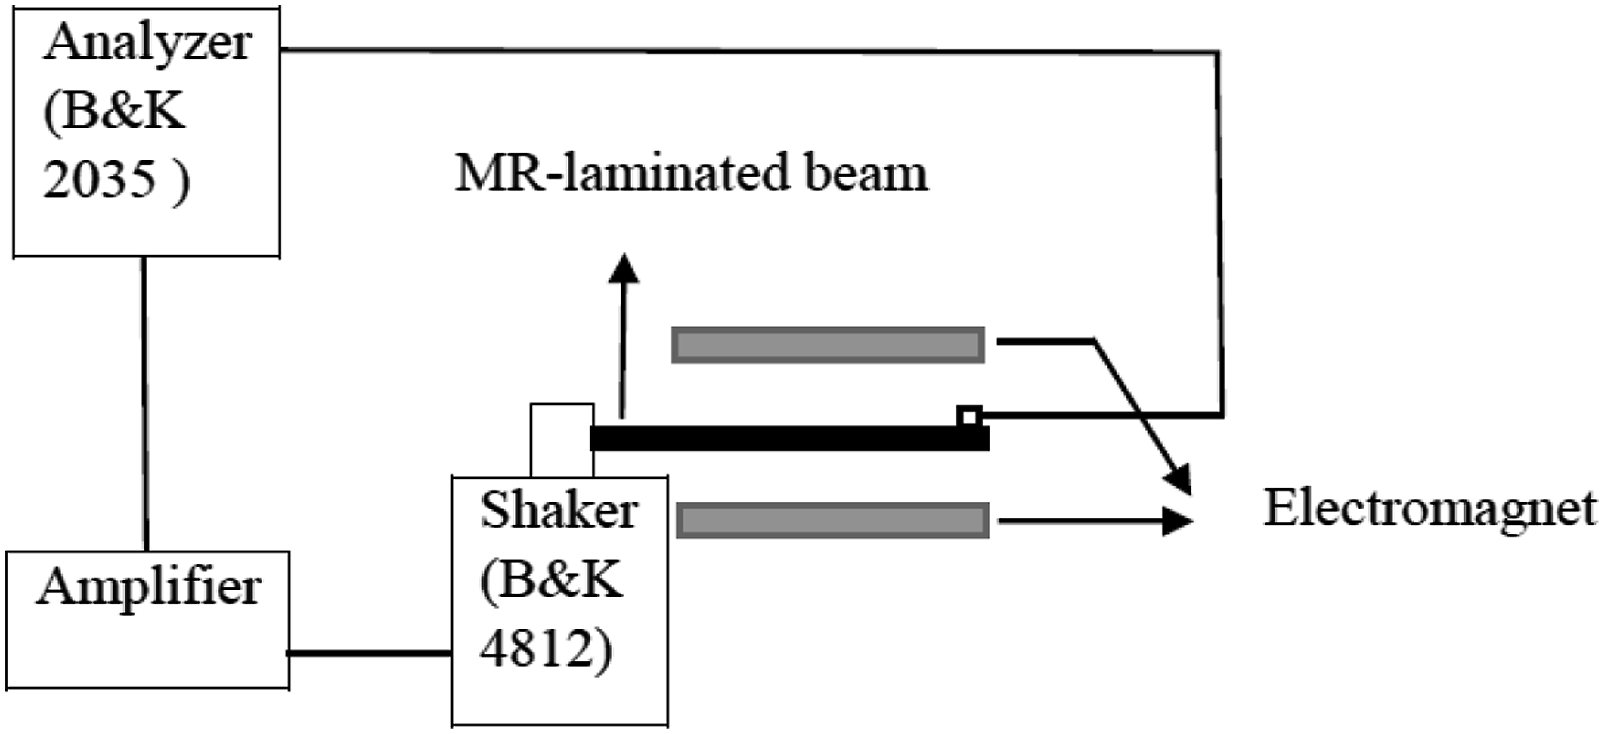
Exprimental setup: An MR-laminated beam which consists of five sections, has been fabricated using the procedure described above. The gap between the composite layer and MR fluid layer was applied by rubber. Sections one, three, and five are laminated composite, and sections two and four are MR fluid. The MR fluid is supplied by Lord (MRF-132DG). The arrangement of sections is shown in Figure 3(a). The length and width of the MR-laminated beam are 230 mm and 30 mm respectively. The thicknesses of composite sections and MR fluid sections are shown in Figure 3(b). The dynamic behavior of the MR-laminated beam was measured in clamped-free and simply supported conditions. To measure the natural frequencies of the MR-laminated beam, a tiny accelerometer (ENDEVCO 2222B) is attached at the free end. A mechanical shaker (B&K 4812) is used to generate a random Gaussian white noise with PSD (Power Spectral Density) of 40 dB in the range of 0–800 HZ. Analyzer (B&K 2035) is used to extract the acceleration signals of the MR-laminated beam for further analysis. The experimental setup and the schematic of the experimental setup are shown in Figures 4 and 5 respectively. Experimental setup of MR-laminated beam. Schematic of experimental setup.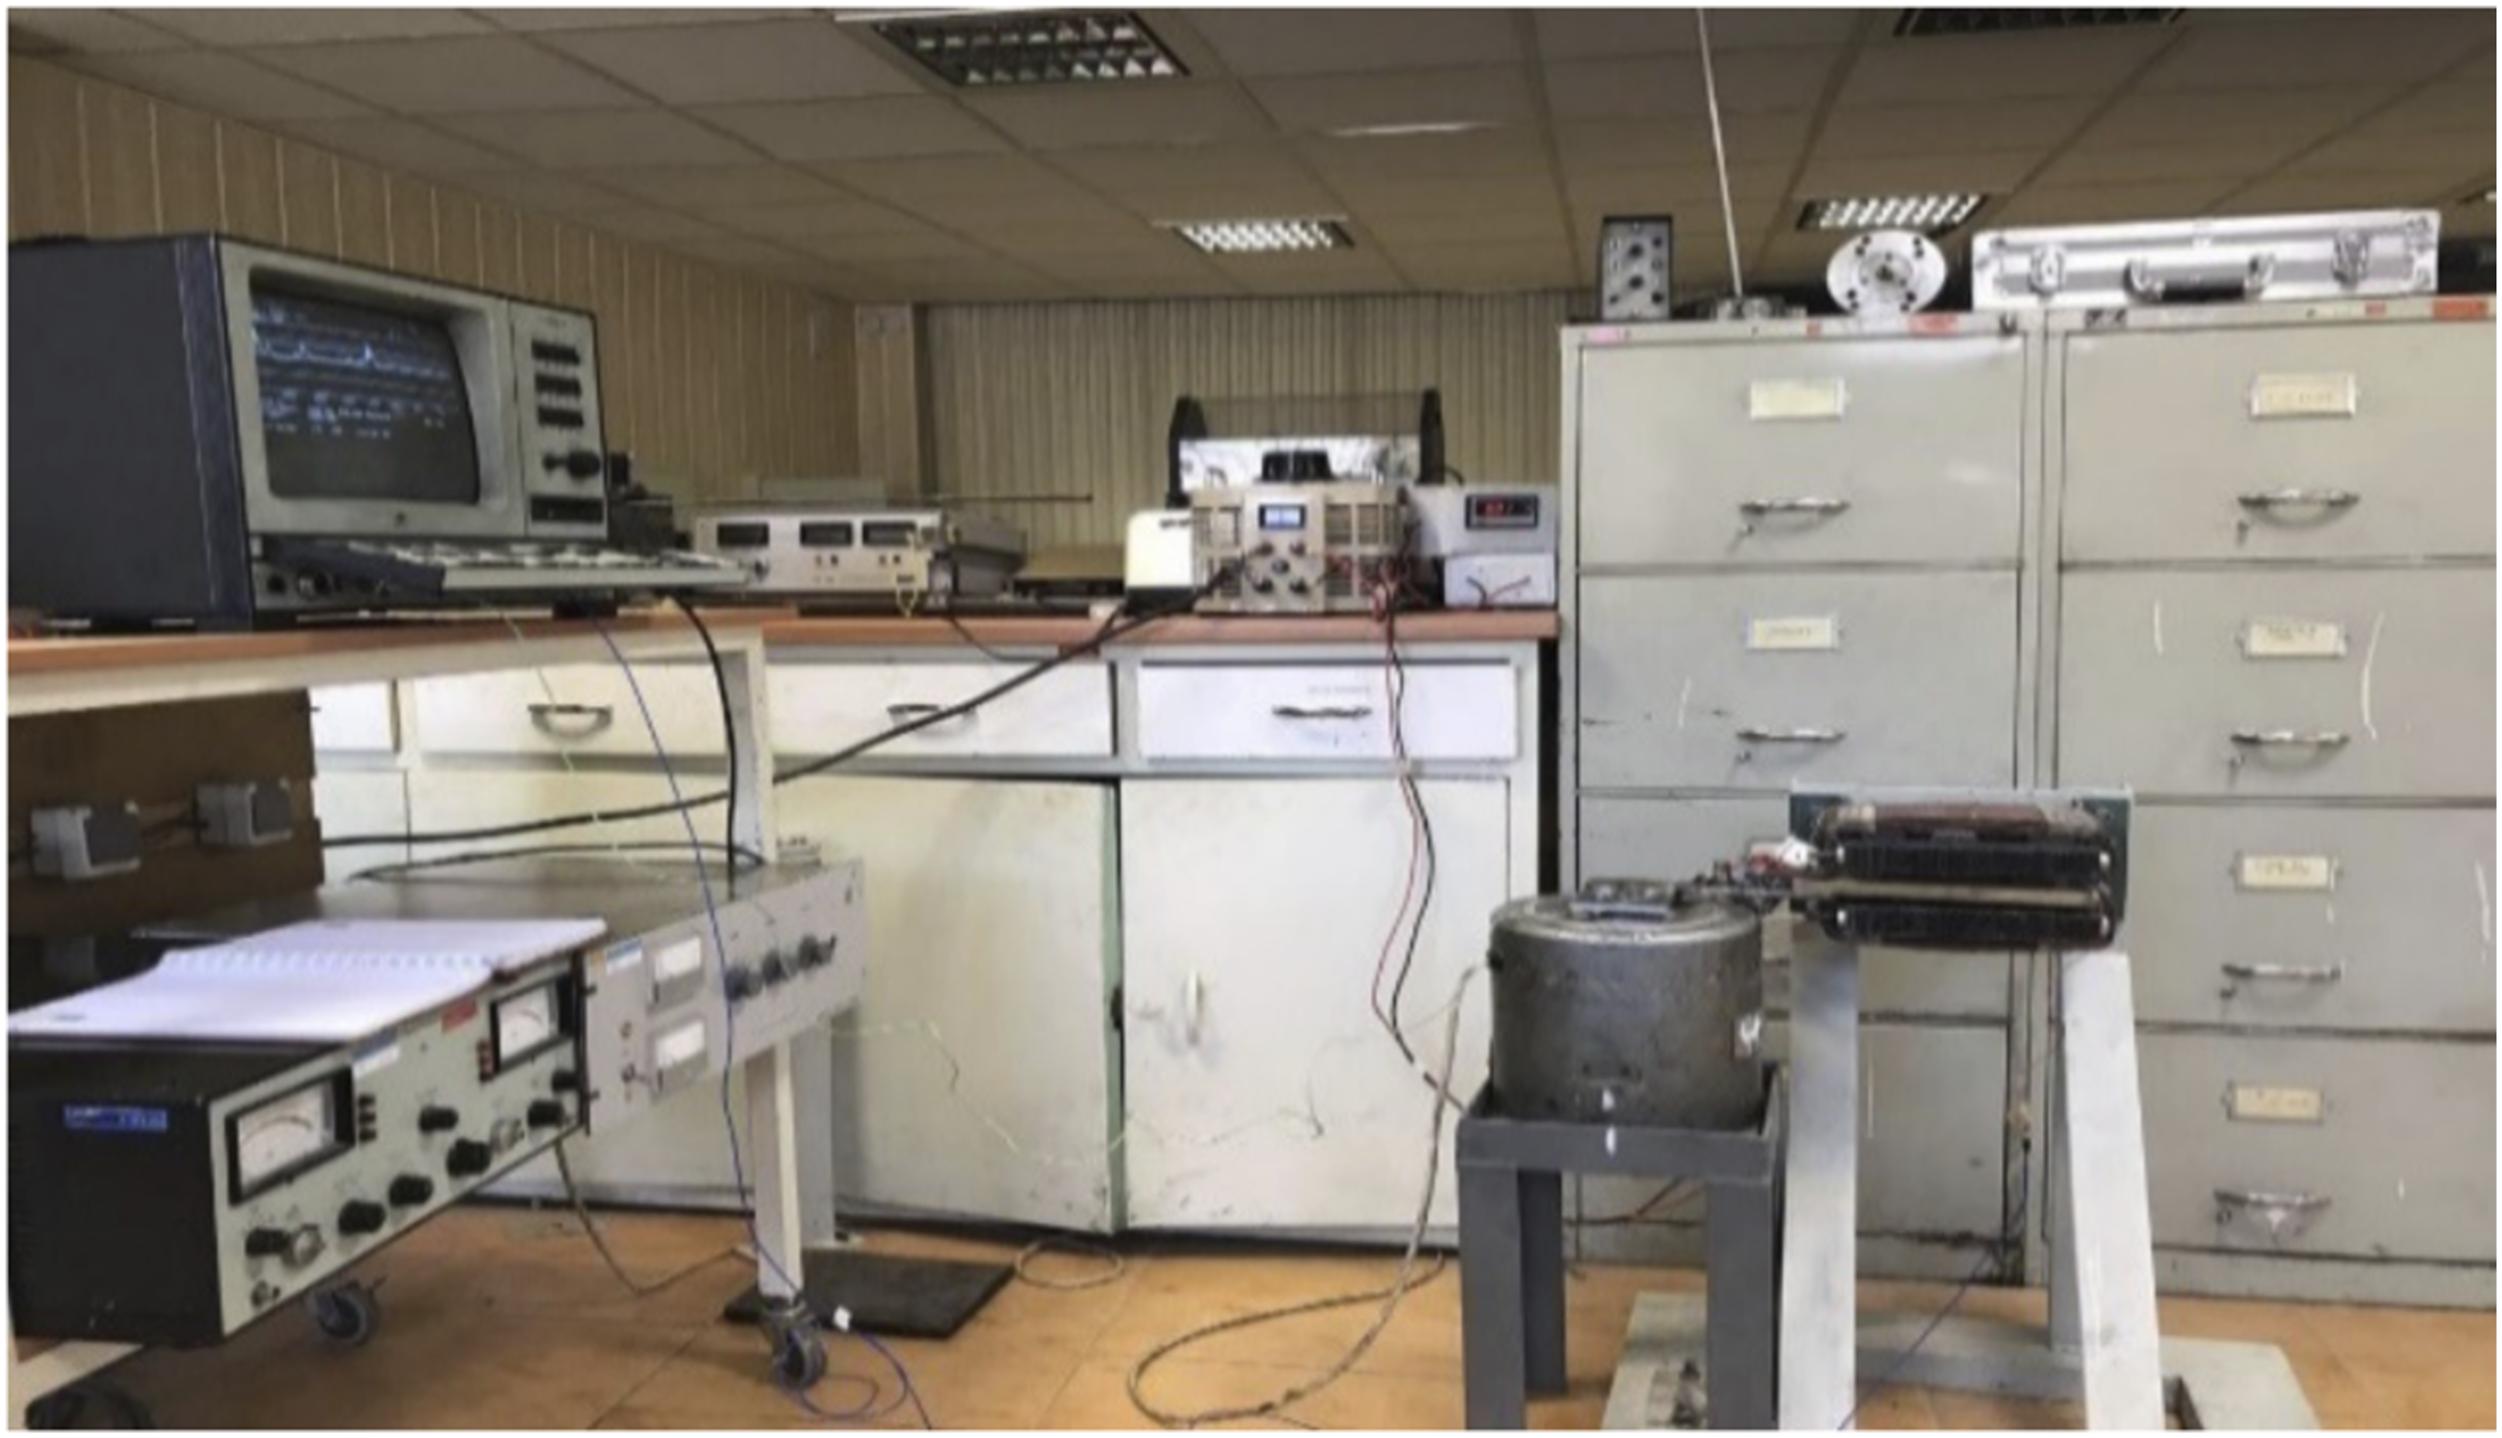
The dynamic behavior of the MR-laminated beam was suppressed while a handmade magnetic field was used to generate the magnetic field over the structure. The natural frequencies of the MR-laminated beam were determined by changing the electrical current of handmade magnetic fields in the range of 0–2,100 Gauss. The natural frequencies of the MR-laminated beam were recognized from the peaks in Frequency Response Function (FRF) as shown in Figure 6. To determine the complex shear modulus of the MR-laminated beam, the standard test ASTM E756-98 is used and determined as Experimental response of MR-laminated beams in Clamped-free condition with different magnetic field.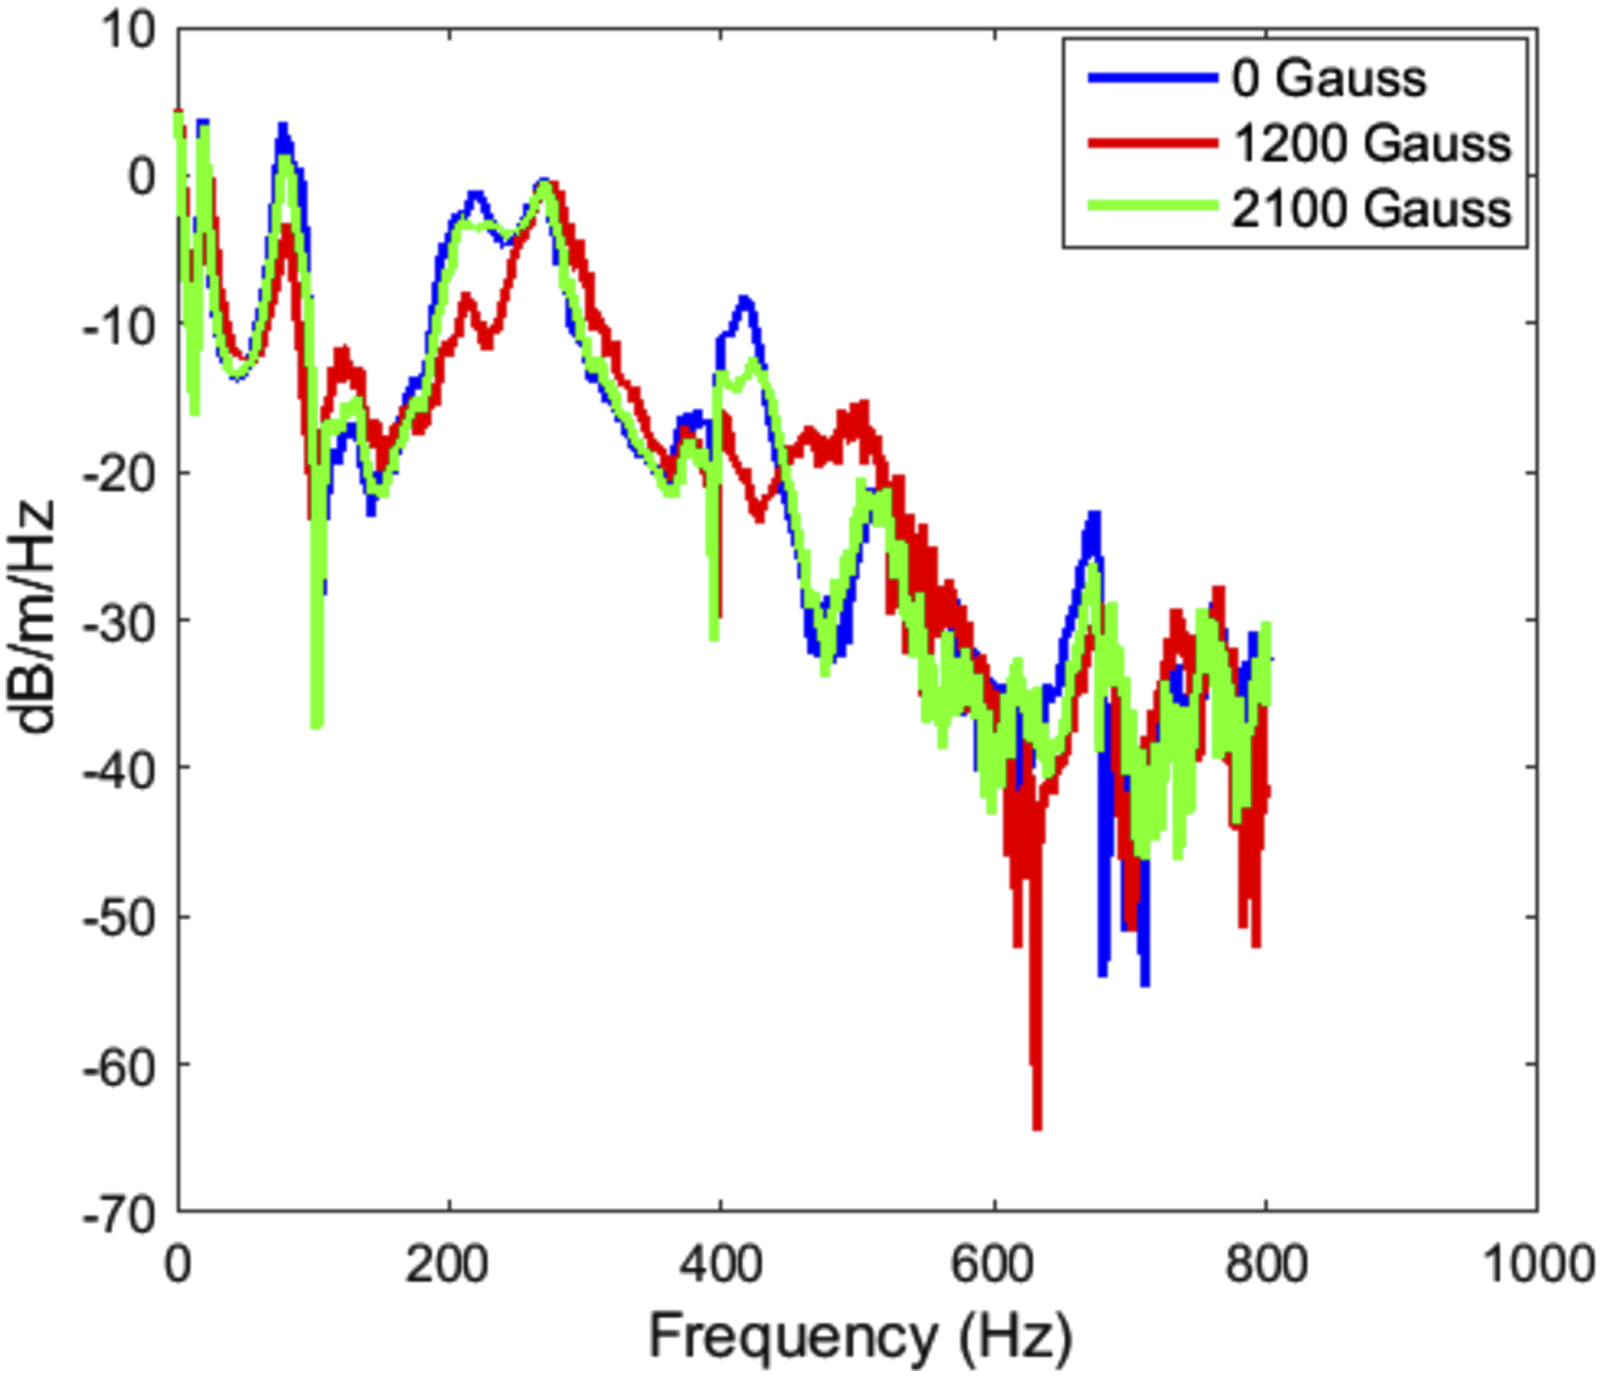


The storage and loss shear modulus approximated by a second-order polynomial function of magnetic fields and applied frequency response.
Validating the results of LWT
An MR-laminated beam, as described in Section Fabrication and experimental study of MR-laminated beam is simulated and validated with experimental results. The numerical results were obtained by considering the properties of composite materials and MR fluid as: E
11
(GPa) = 16.55,
Comparison of natural frequencies (HZ) of present LWT and FSDT with experimental results in Clamped-free conditions.
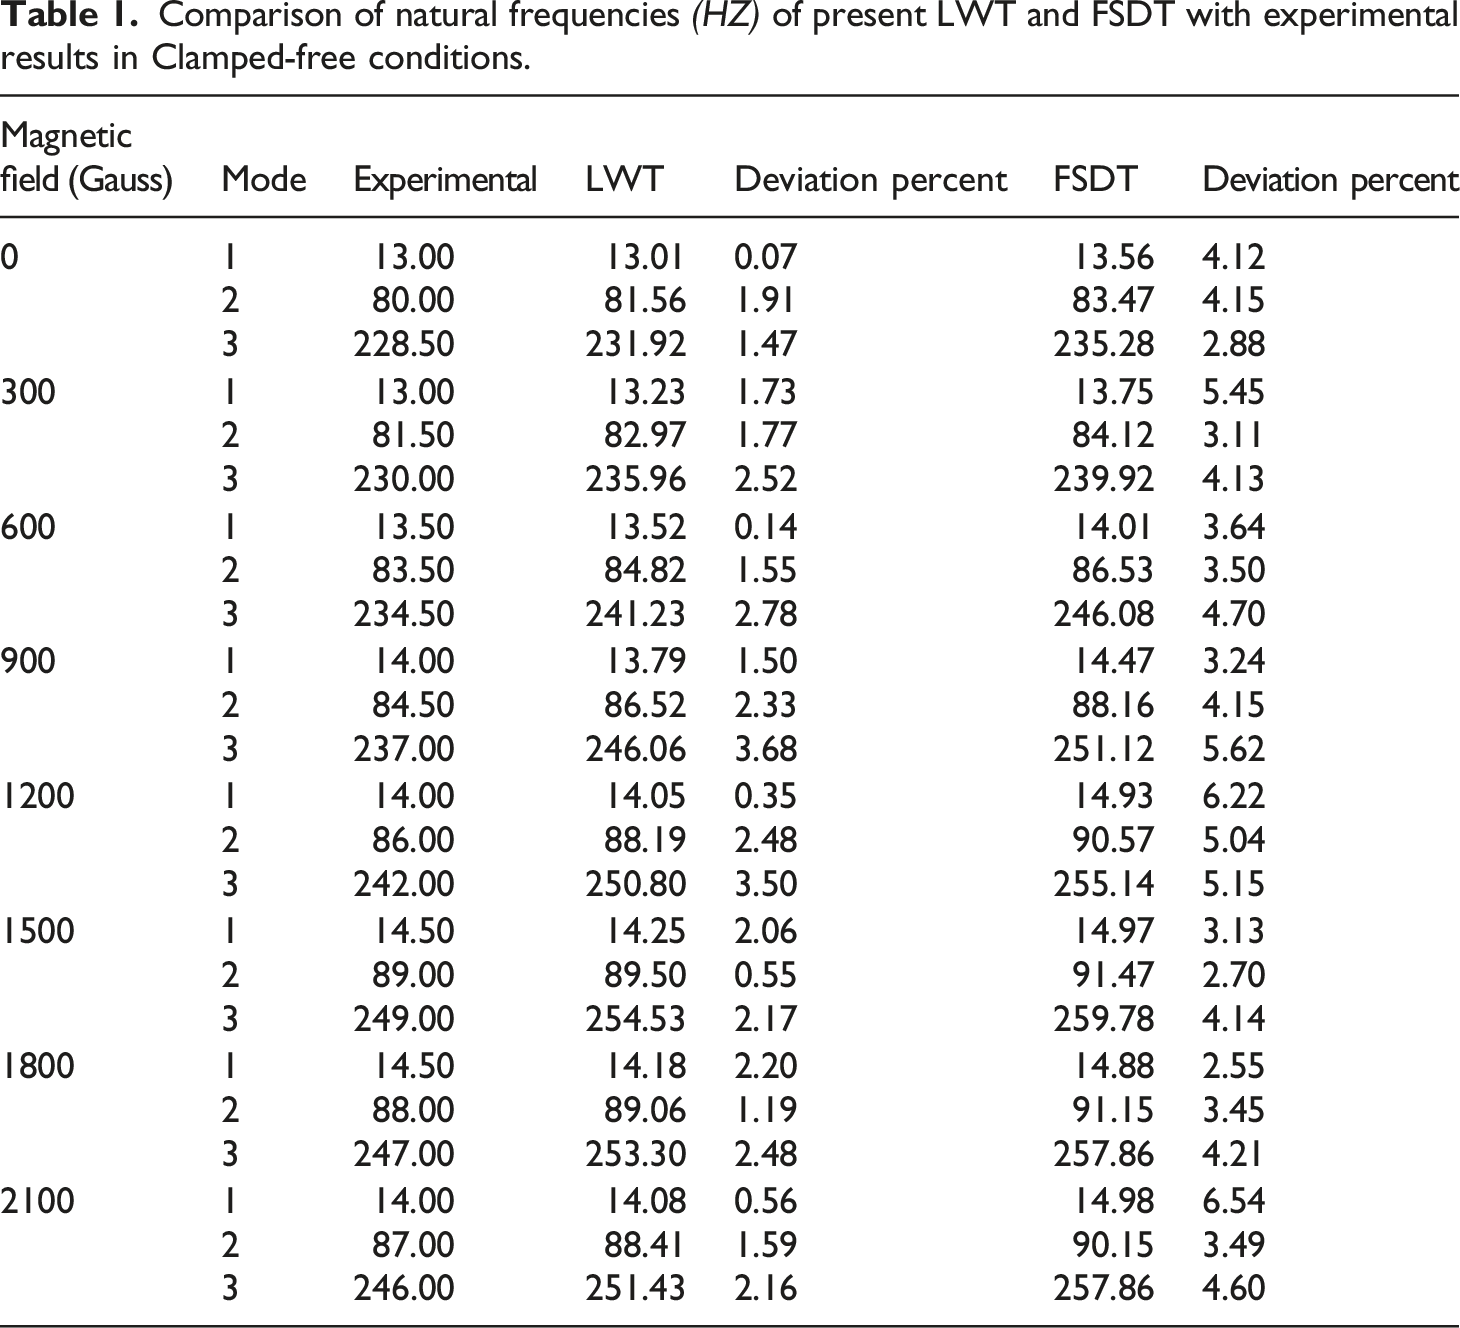
Another feature of interest is that when the applied magnetic field reaches to 1,500 Gauss, the natural frequencies shift to upper values. Beyond this value, the natural frequencies of MR-laminated beams started to decline.
Figures 7–9 show the deviations of the first three vibration modes for different magnetic fields using LWT, and FSDT from the experimental results respectively. Comparison of the first modes of deviation percent obtained from LWT and FSDT with experimental by applying magnetic fields. Comparison of the second modes of deviation percent obtained from LWT and FSDT with experimental by applying magnetic fields. Comparison of the third modes of deviation percent obtained from LWT and FSDT with experimental by applying magnetic fields.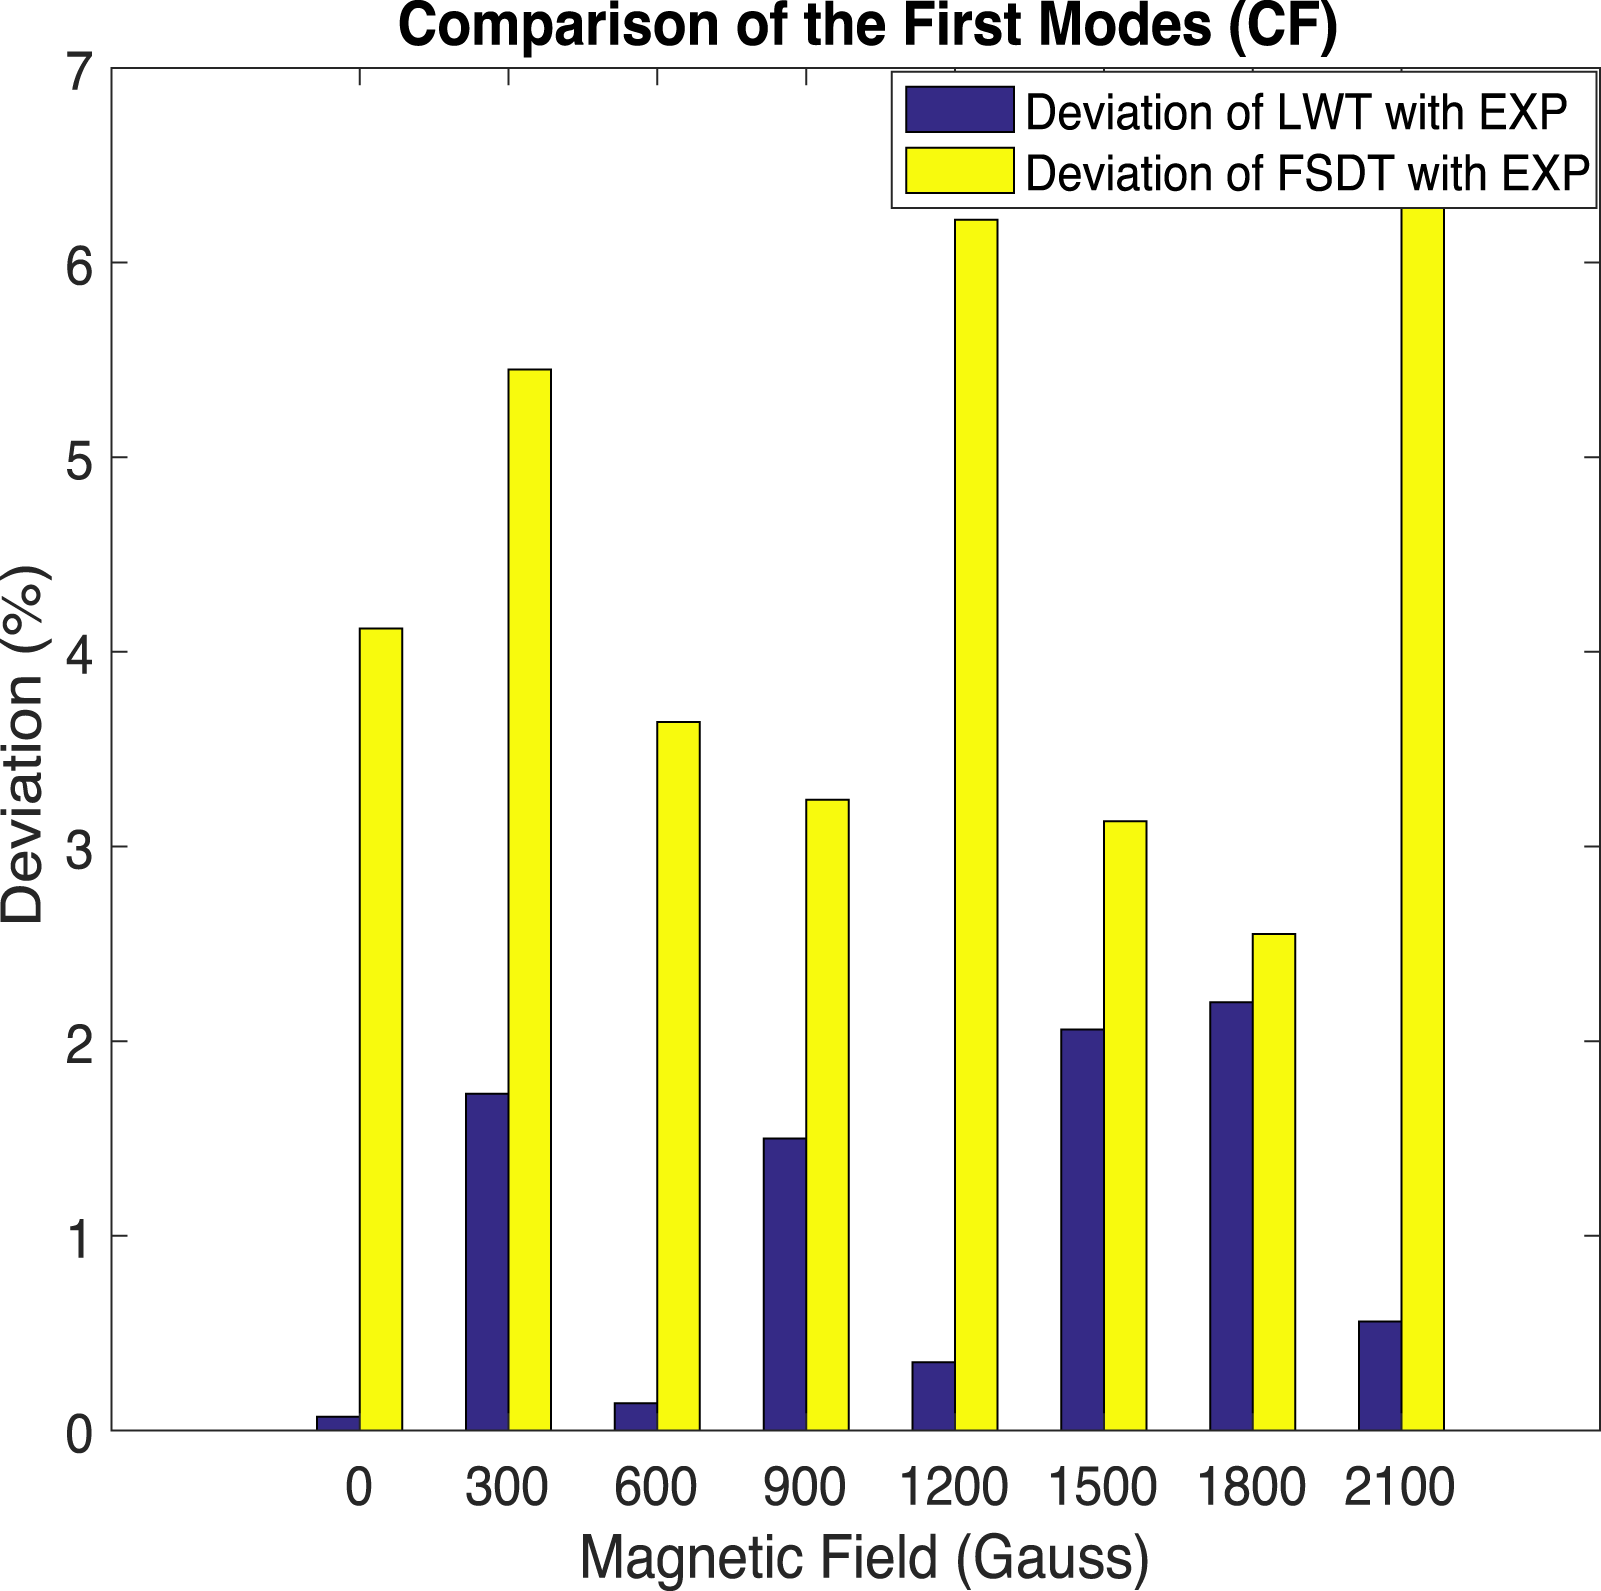
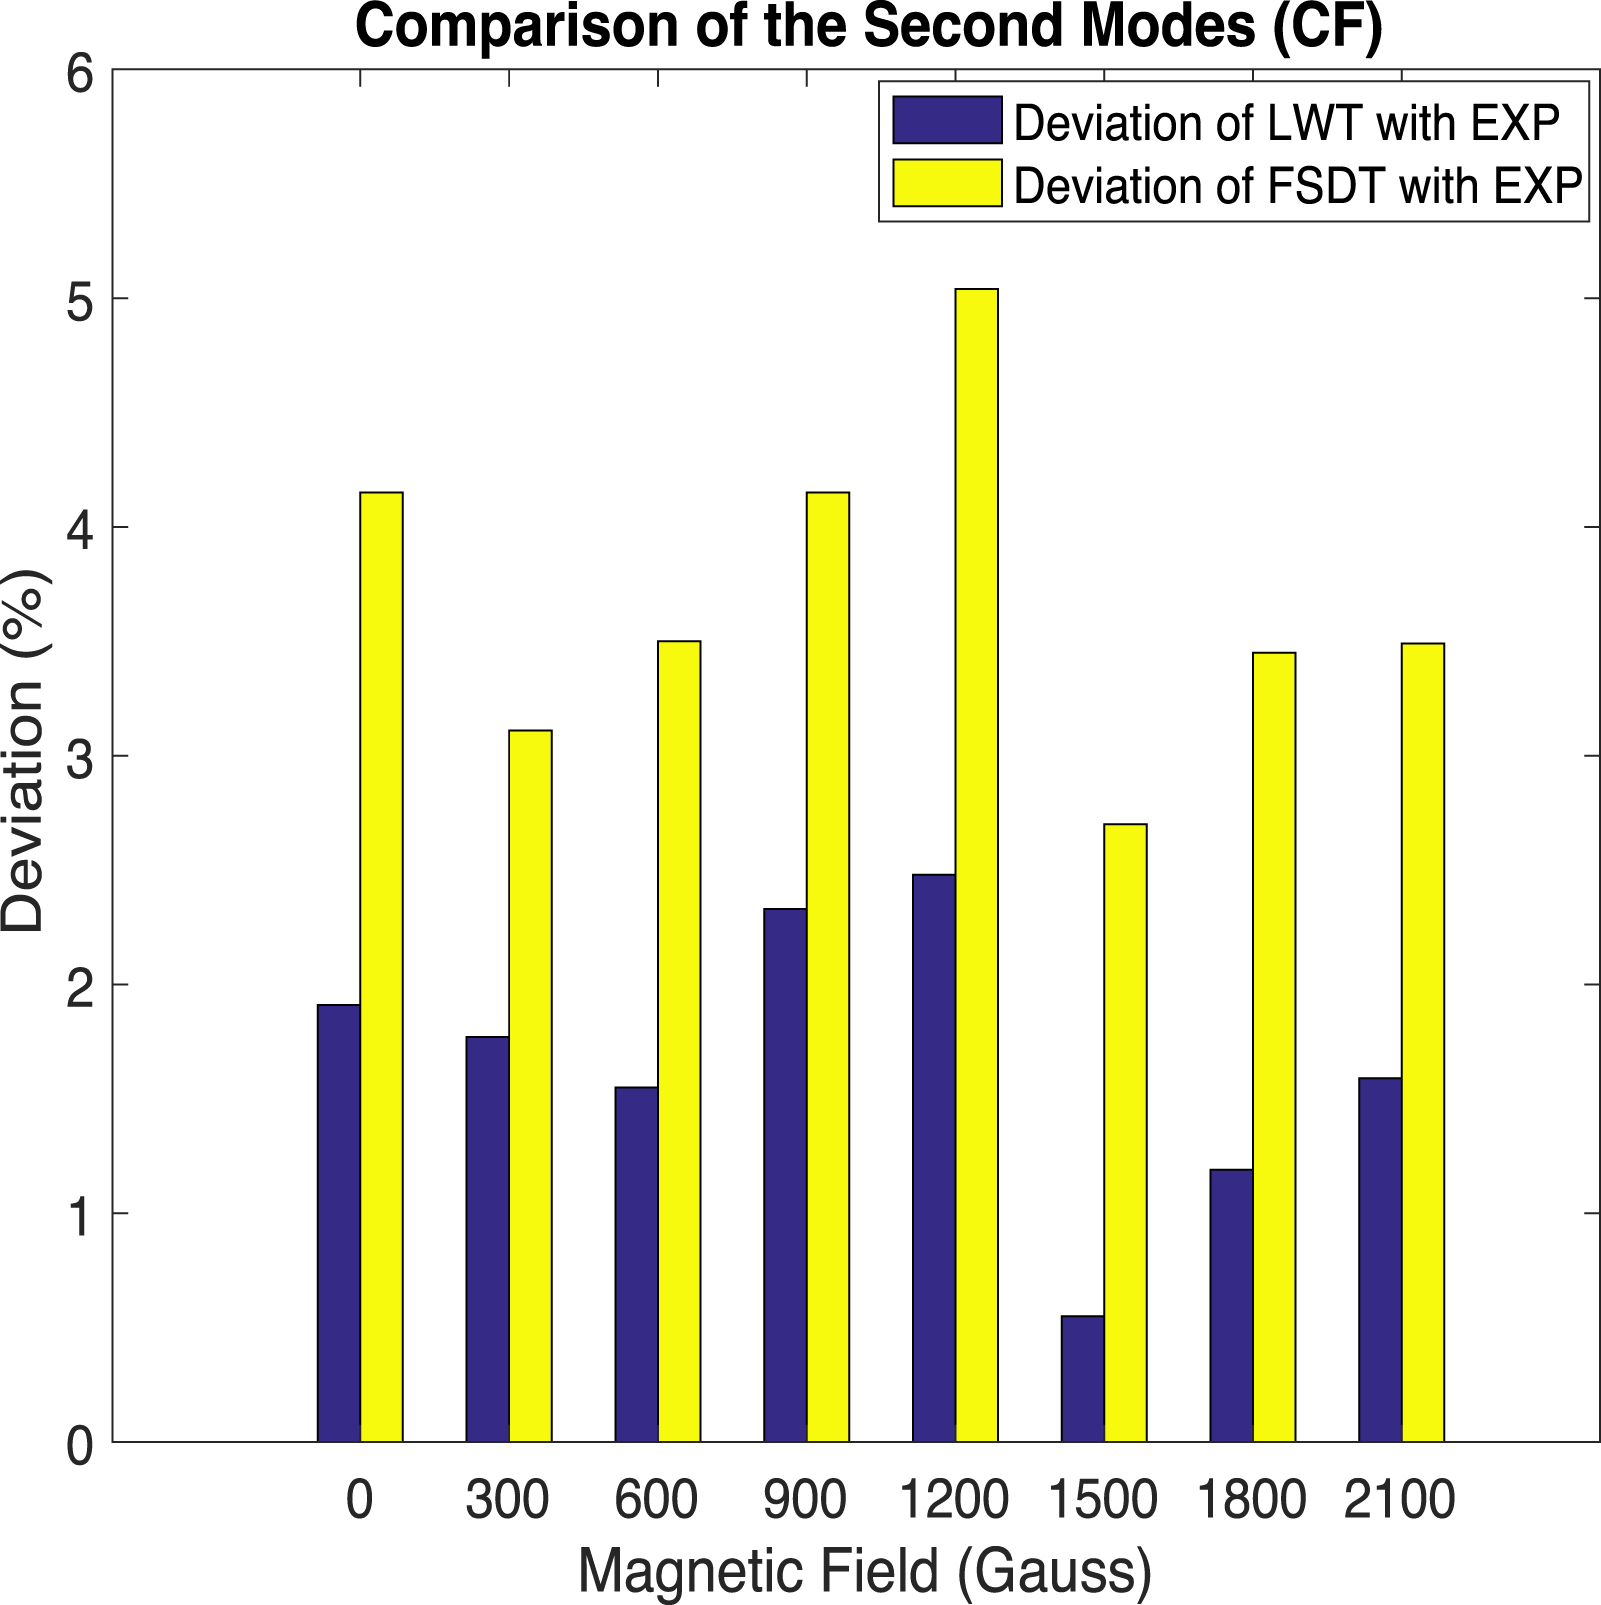
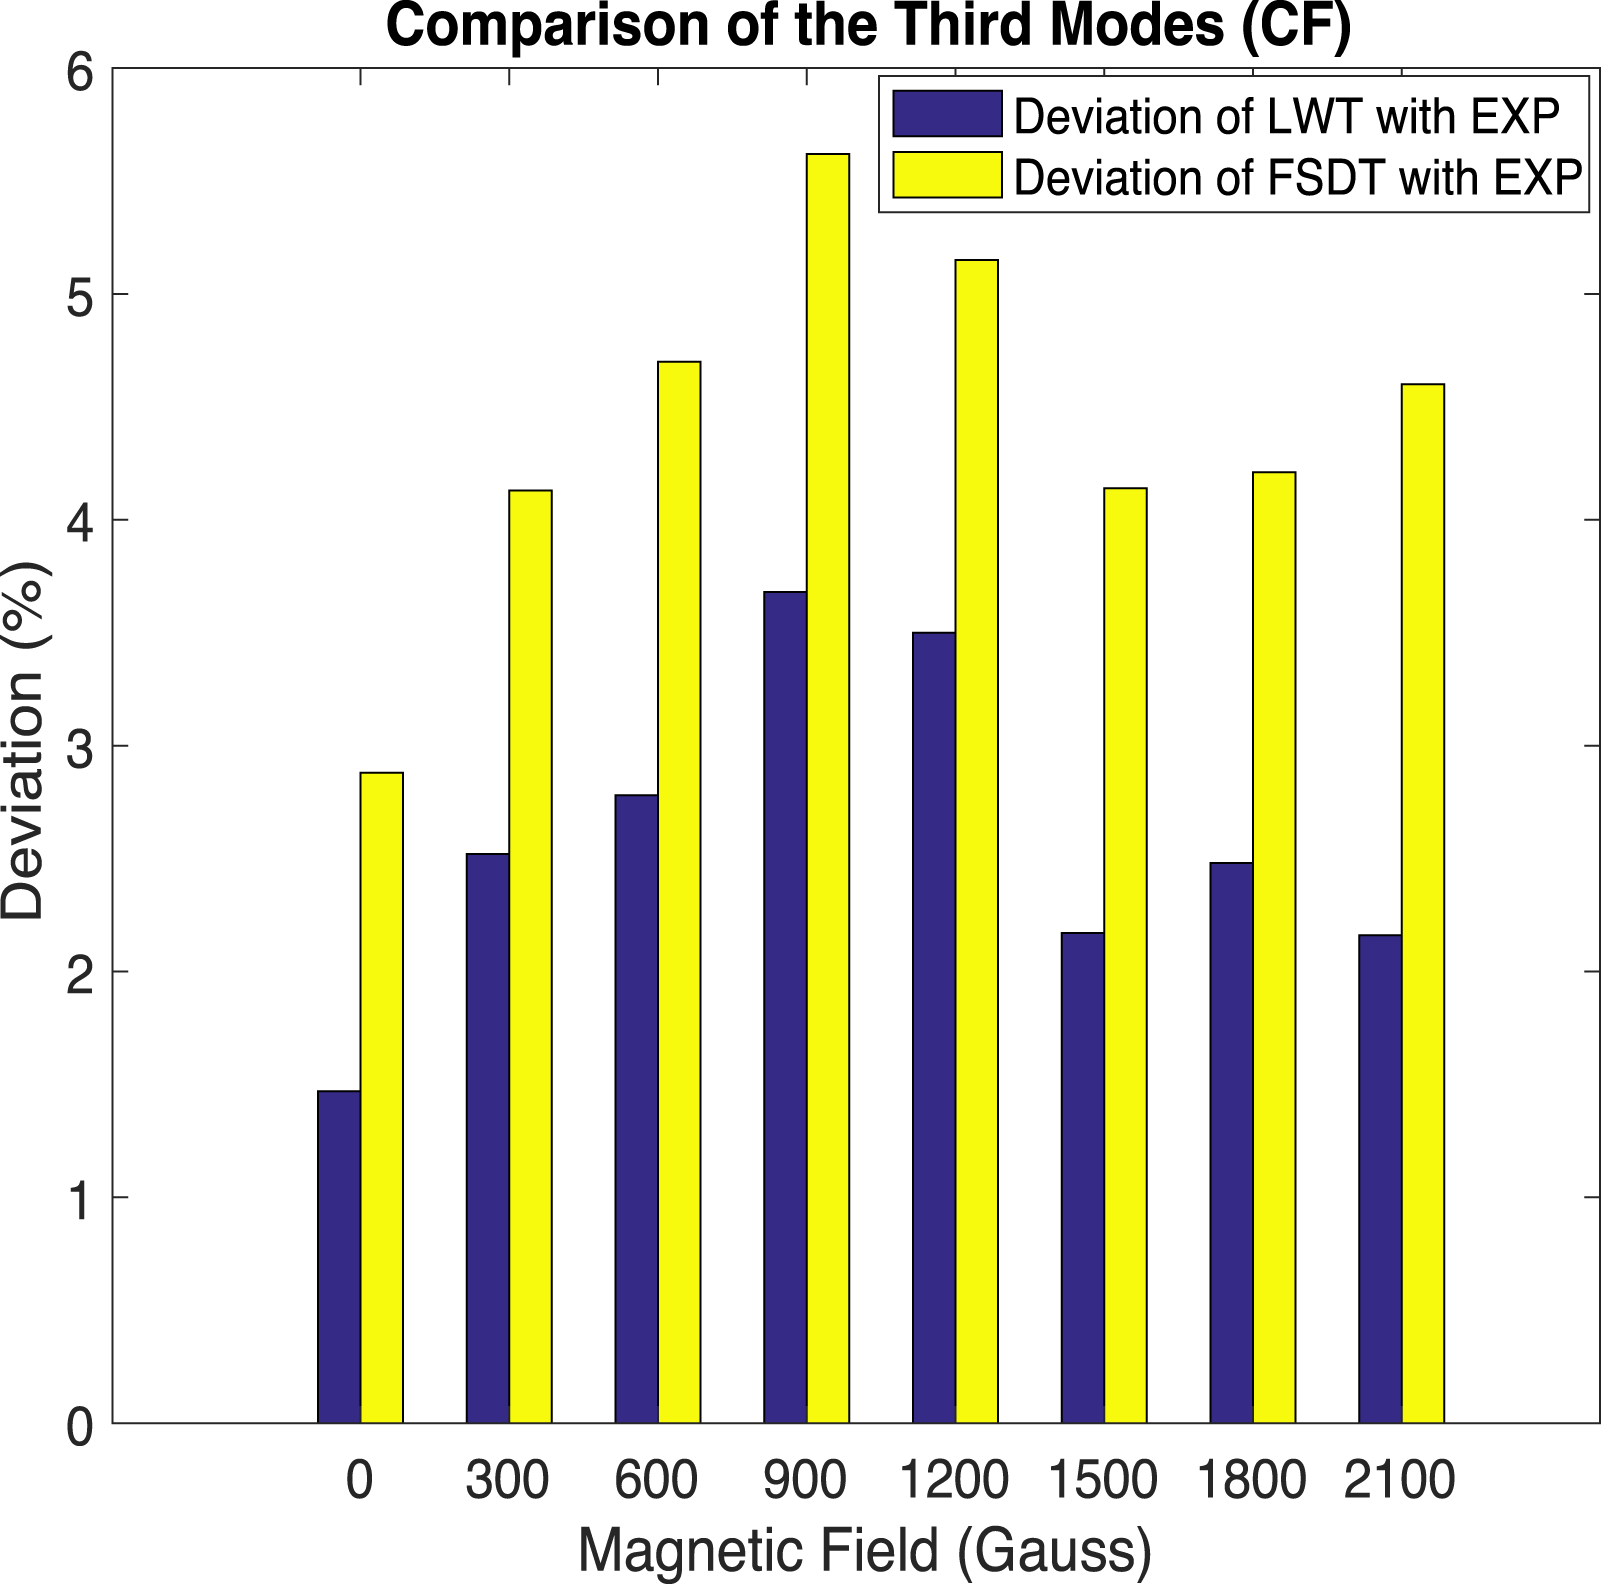
Based on the results of Figures 7–9 the deviations percent of LWT results from the experimental ones are lower than the deviations percent of FSDT with experimental results. In other words, the results of LWT show a better agreement with experimental results.
Validating the results of LWT with COMSOL
In this section, the results of the proposed LWT have been validated with the results obtained by COMSOL software. In order to compare the accuracy of the proposed model, a laminated beam with five sections (each section is made of several layers) of E-glass composite (without MR fluid layers) in clamped-free condition has been investigated. The dimensions of the laminated beam are the same as the dimensions of the beam in Section Fabrication and experimental study of MR-laminated beam (230 mm*30 mm*8 mm). The properties of E-glass material are: E
11
(GPa) = 16.55,
Natural frequencies (HZ) obtained from present LWT and COMSOL software.
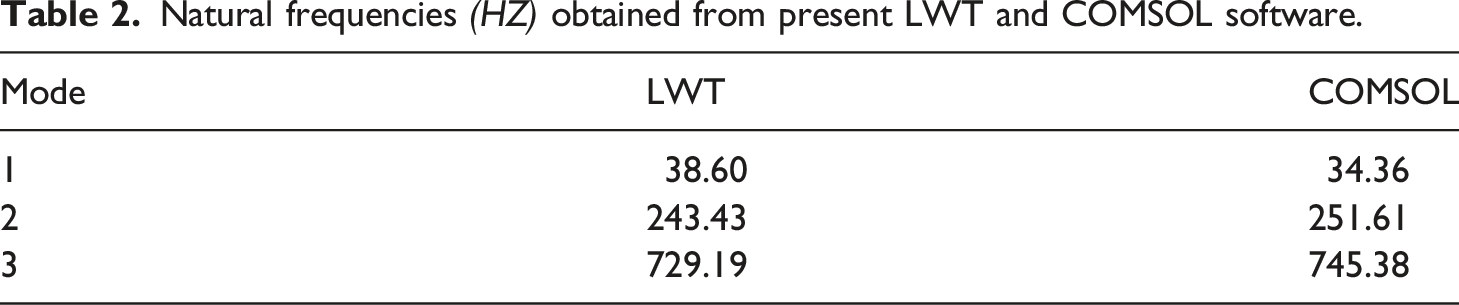
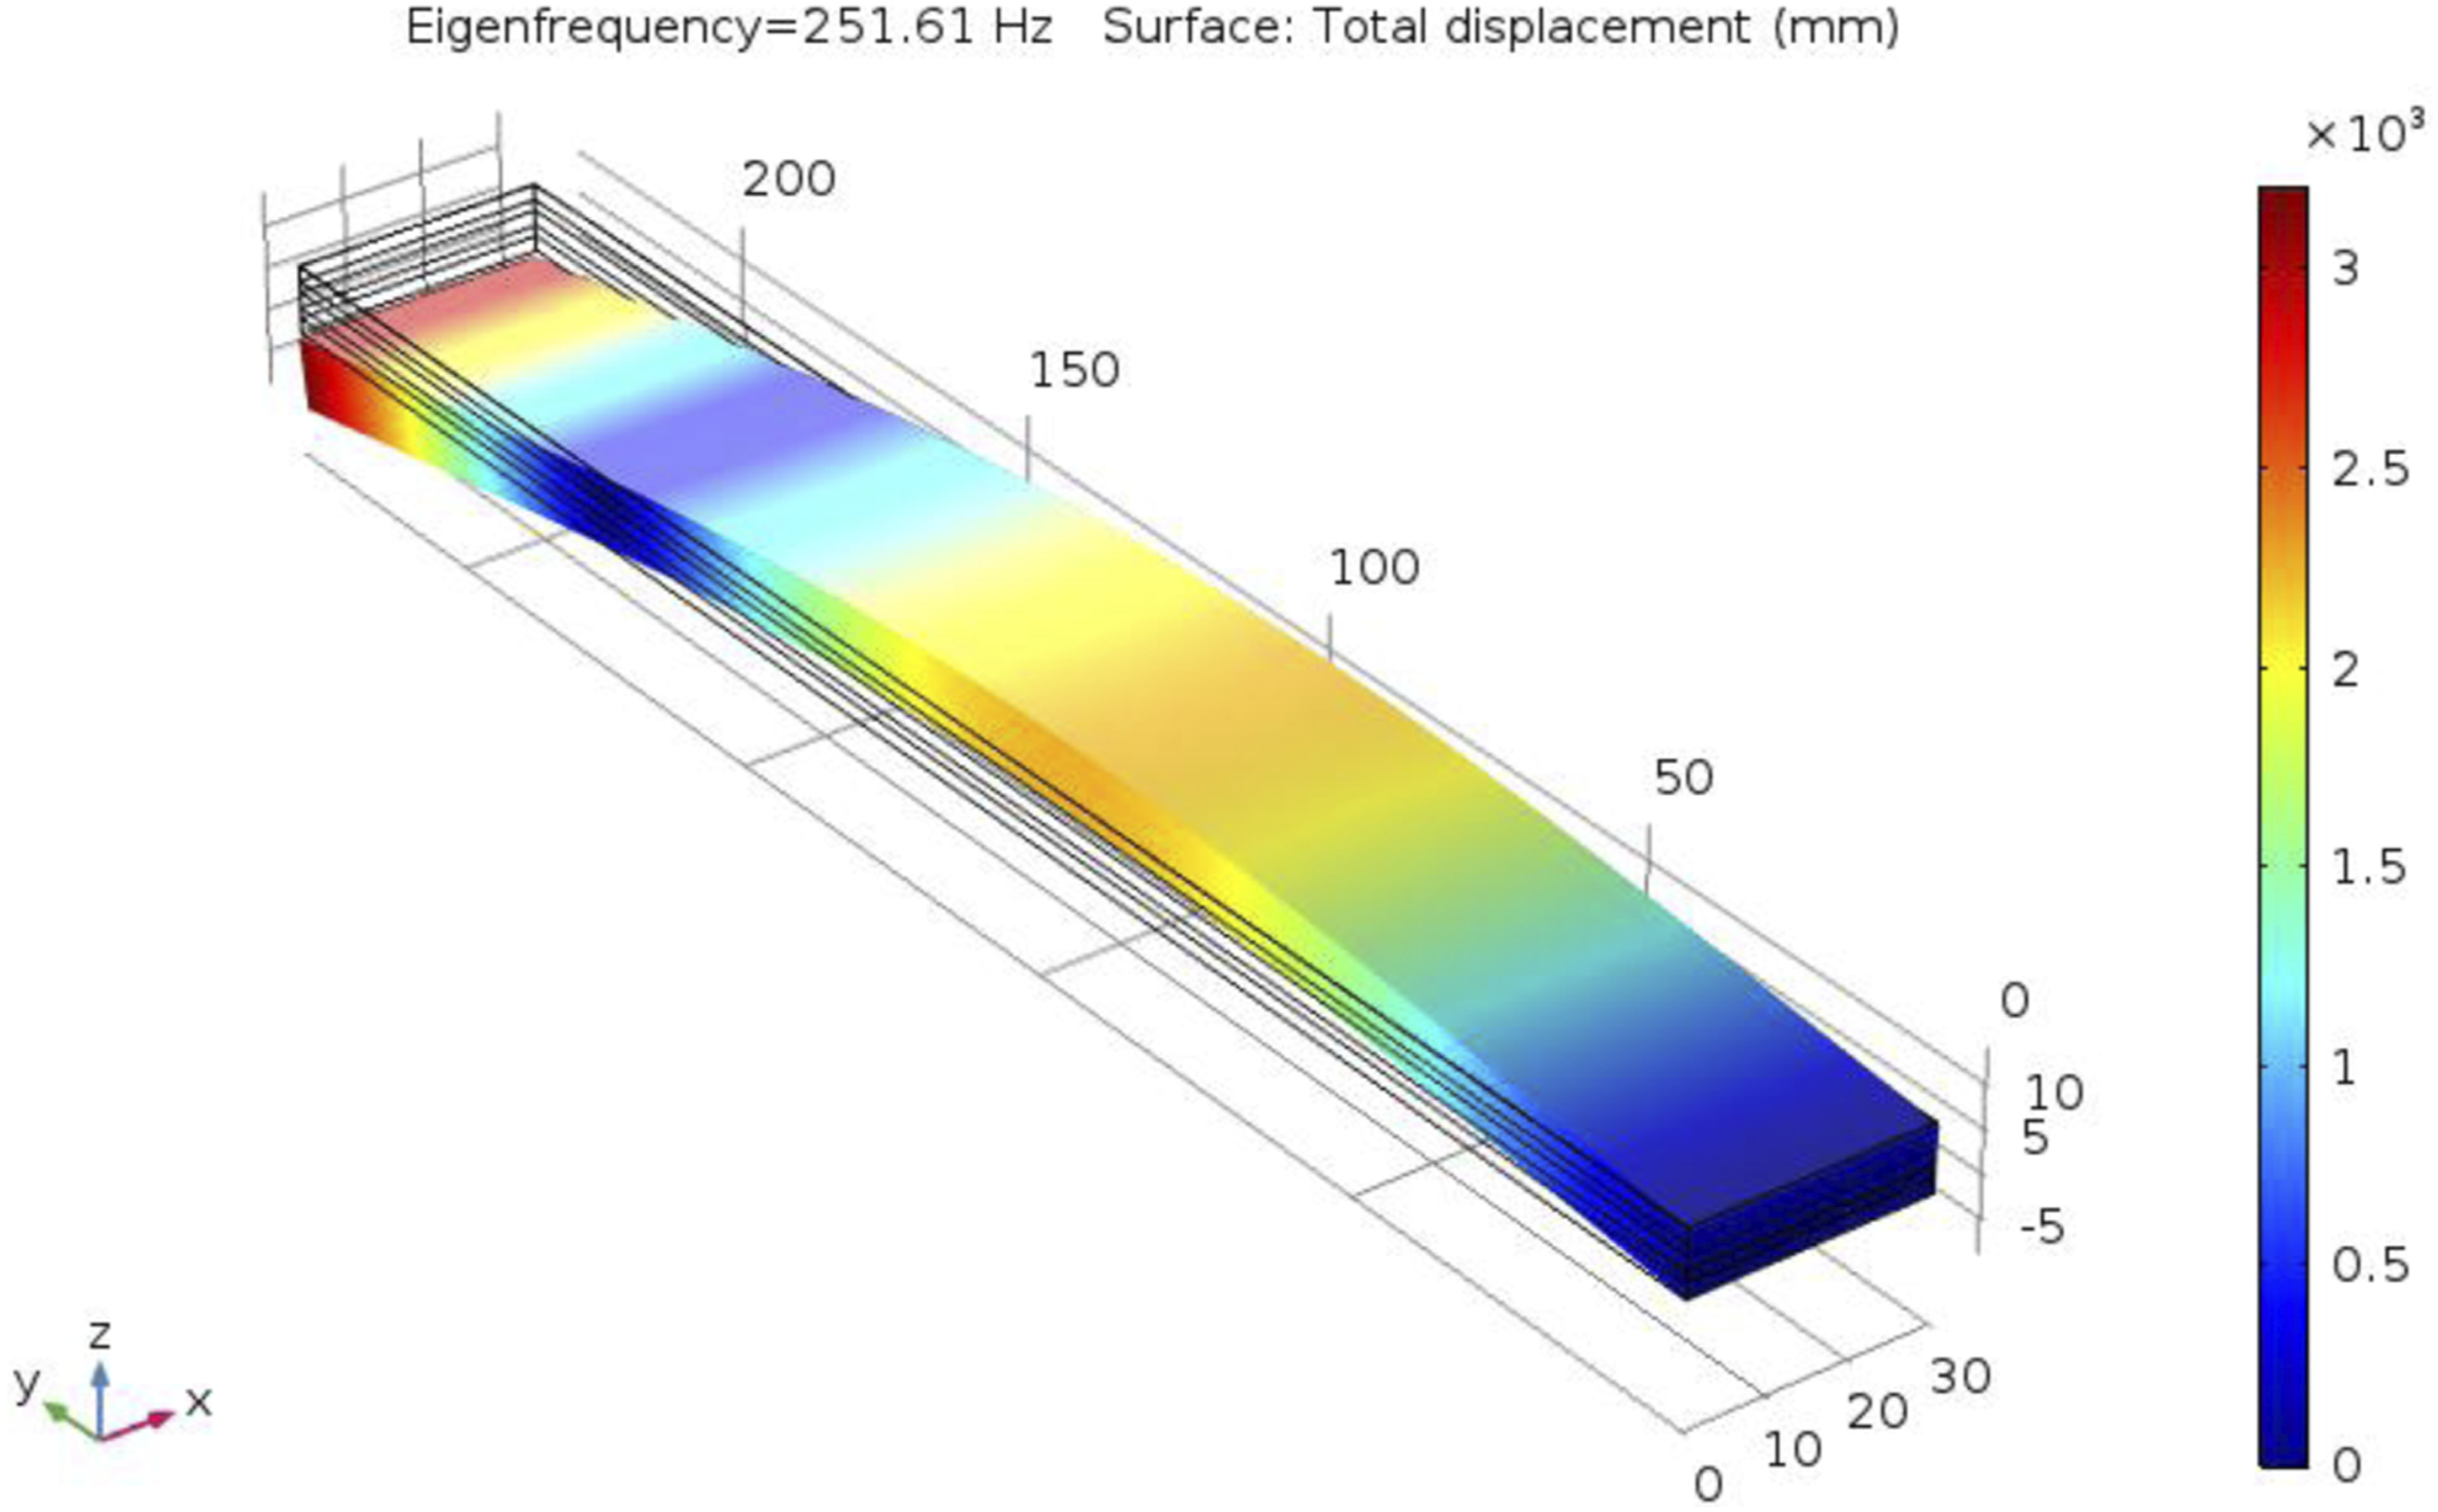
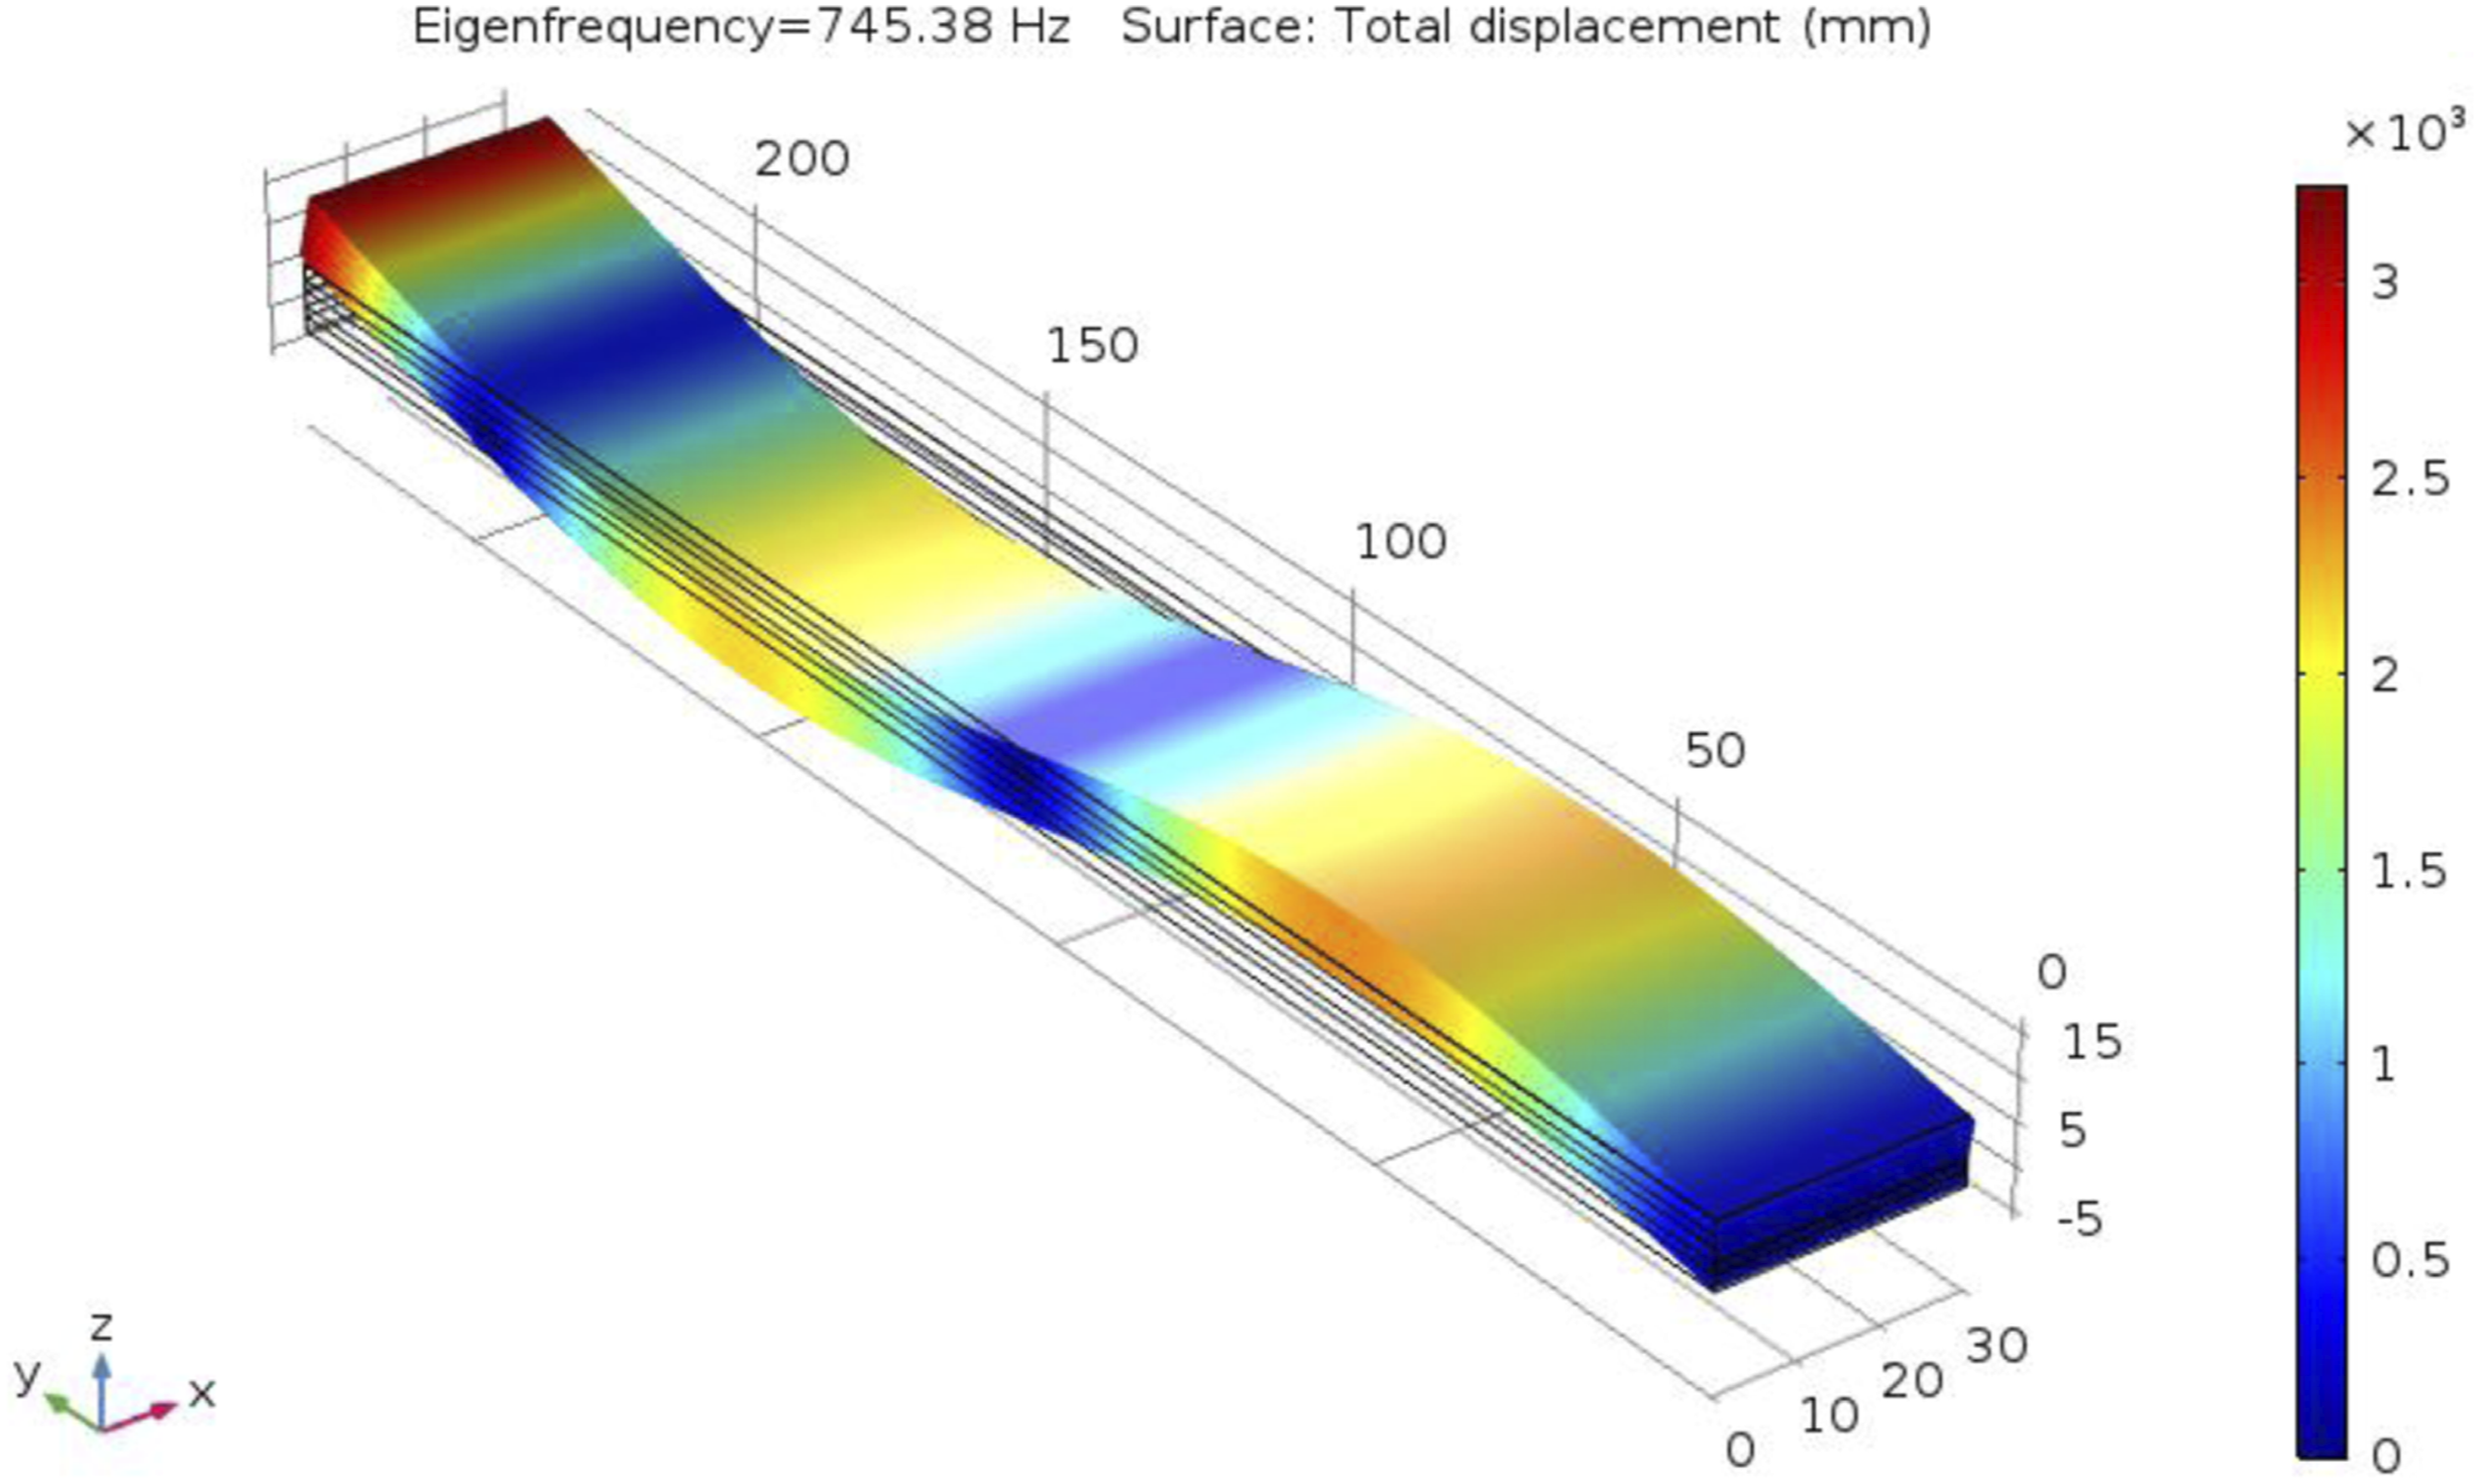
Table 2 shows that the comparisons of natural frequencies obtained from present LWT and COMSOL software. In which one may realize that the natural frequencies obtained from present LWT are in very good agreement with the results of COMSOL software. Figures 10–12 illustrate the first, second, and third mode shapes of laminated composite beams obtained by COMSOL software. The first mode of laminated composite obtained by COMSOL. The second mode of laminated composite obtained by COMSOL. The third mode of laminated composite obtained by COMSOL.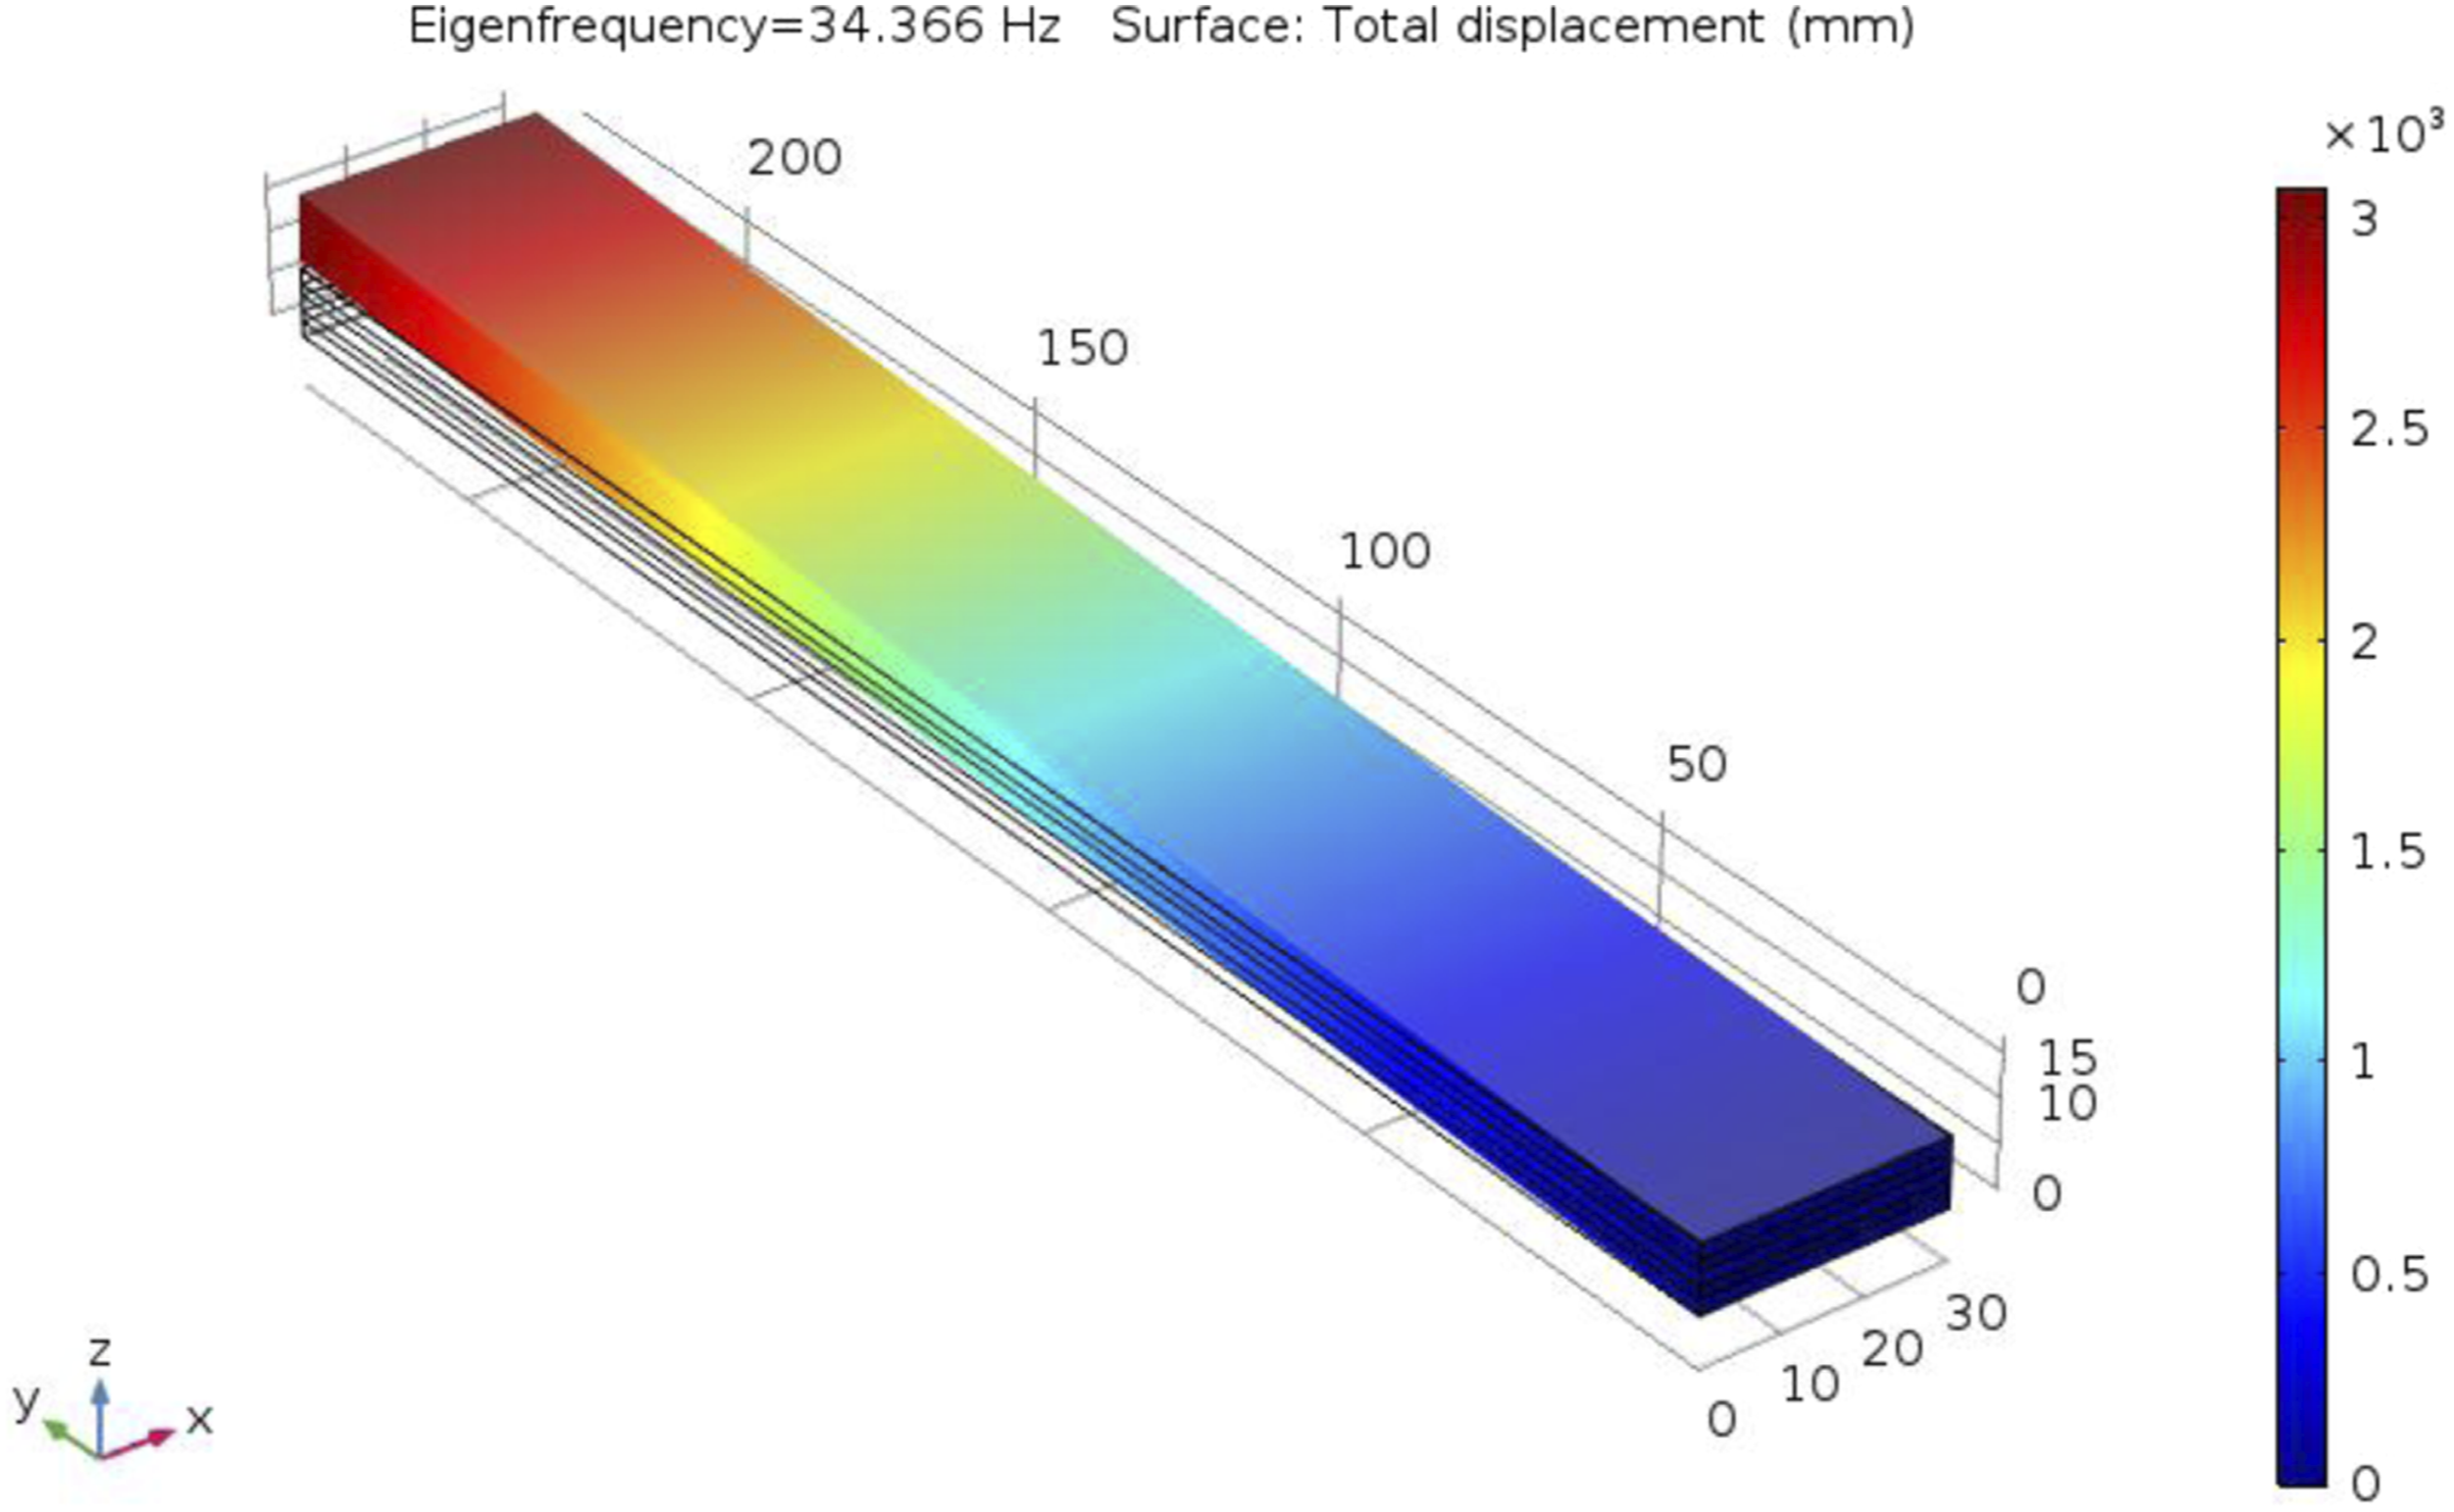
Effects of MR segments on dynamic response of MR-laminated beam
In order to investigate the effects of MR segments on the dynamic behavior of MR-laminated beams, different configurations as shown in Figure 13 are taken into consideration. An MR-laminated beam with five sections (each section consists of several layers), three sections made of E-glass laminated composite, and two sections filled by MR fluid layers is considered. The effects of location, thickness, and magnetic fields on the MR fluid layer (section) through the thickness and along the length of the beam on random vibration response have been investigated based on LWT. For this goal, six different configurations of MR-laminated beams with different locations of MR fluid, shown as configurations “A”, “B”, “C”, “D”, “E”, and “F” are considered with clamped-free and simply supported boundary conditions. Table 3 shows the natural frequencies of different configurations of LWT and FSDT for clamped-free and simply supported boundary conditions. The total length of the MR-laminated beam is divided into 20 segments with equal lengths. In this numerical example, each configuration of MR-laminated beams was measured in clamped-free and simply supported boundary conditions. In all of the configurations, the length, width, and thickness of the composite layer and thickness of the MR fluid section of the structure are 230 mm, 30 mm, 1.8 mm, and 1.3 mm respectively. Different configurations of MR segments on MR-laminated beams. Comparison of first three natural frequencies (HZ) of different configurations of MR-laminated beams in LWT and FSDT with Clamped-free (CF) and Simply Supported (SS) conditions.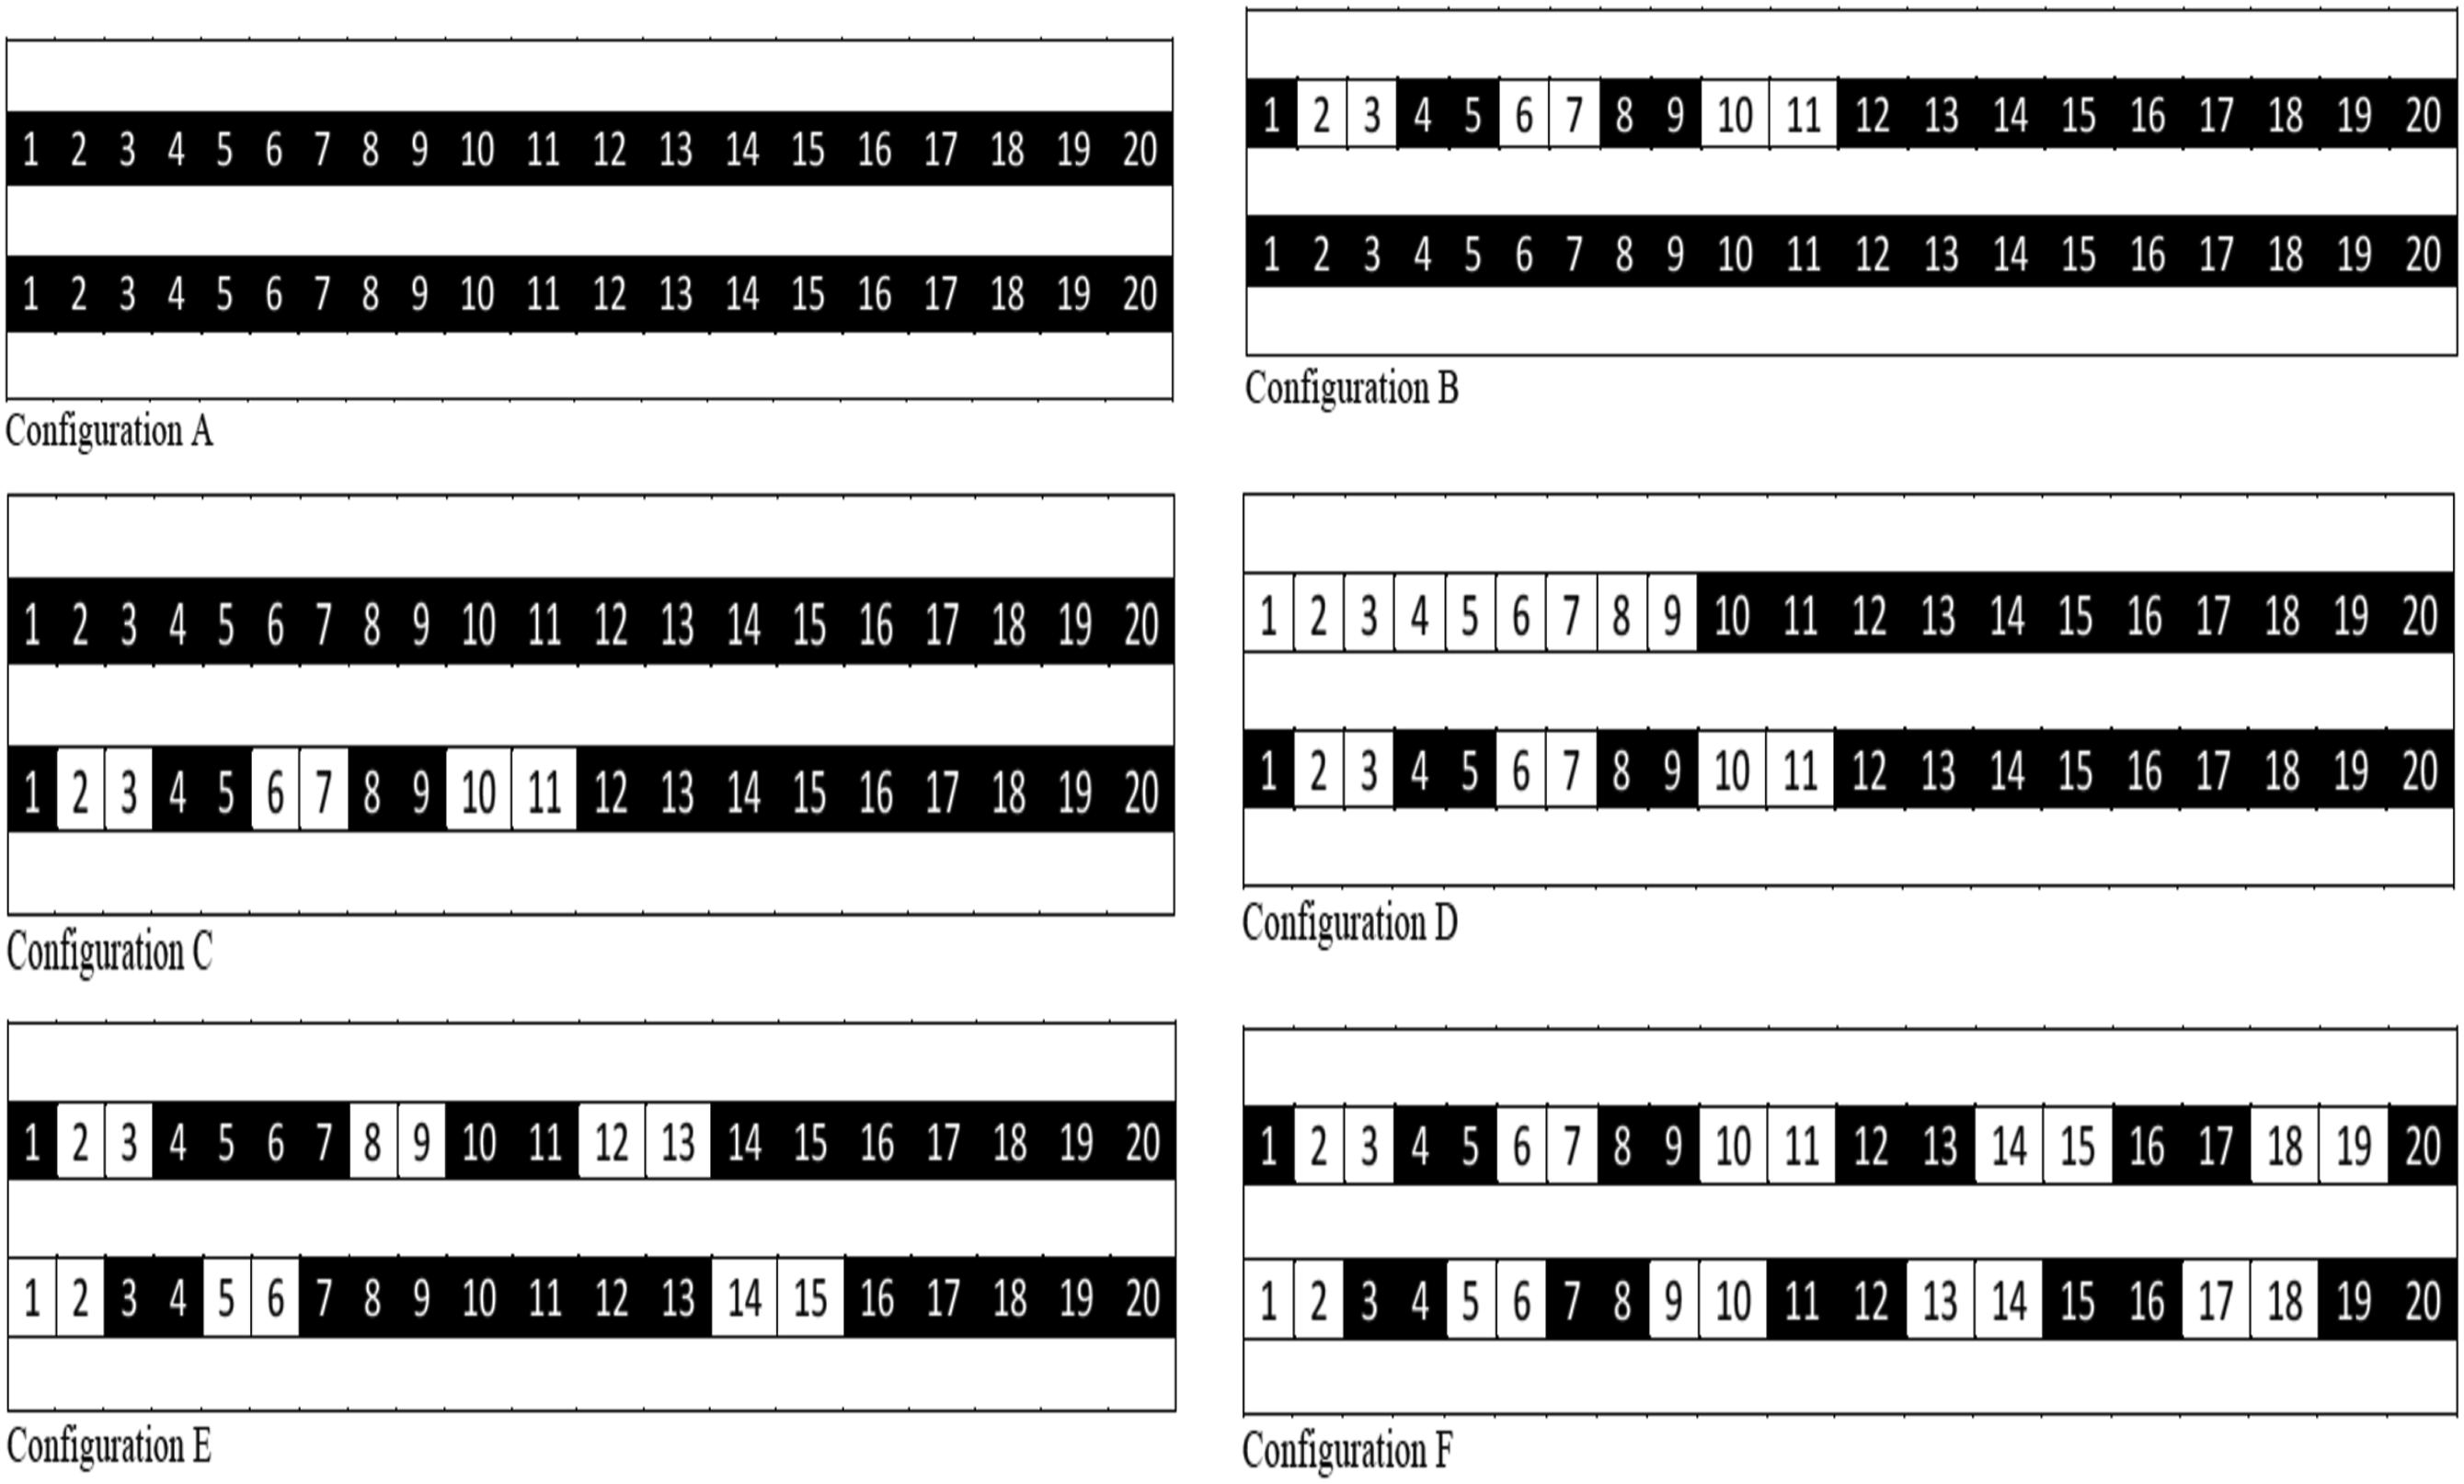
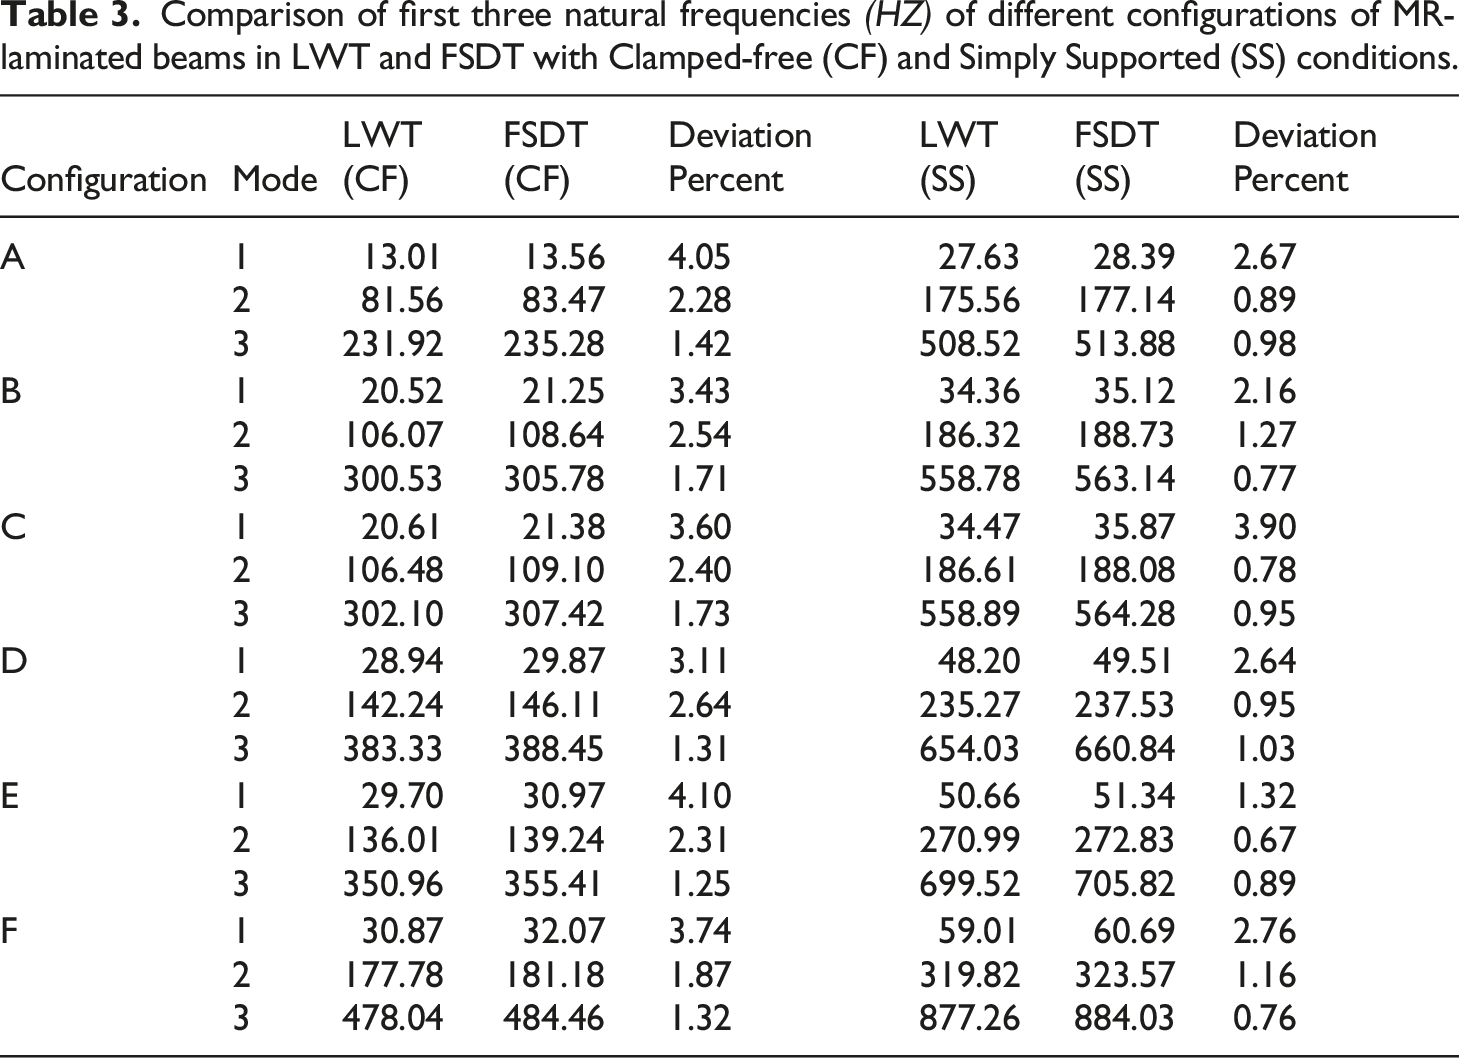
For the sake of clarification, the first three natural frequencies of six different configurations of low-thickness MR-laminated beams obtained by LWT have been compared with that of the FSDT. Two boundary conditions, clamped-free and simply supported boundaries are studied. It is worth noting that due to the low thickness of the beam, the results of both theories are in good agreement. According to Table 3, by increasing the number of the composite segment in the second and fourth sections, the natural frequencies of the MR-laminated beam have been increased. It can be perceived that the natural frequencies of configuration A are generally lower than the natural frequencies of other configurations and the natural frequencies of configuration F are higher than other configurations. This phenomenon is due to the ratio of the composite segment with respect to the MR fluid segment.
Effects of thicknesses of MR fluid sections and composite sections on natural frequencies
Effects of thickness of MR fluid layer and composite layer on first four natural frequencies of MR-laminated beam.
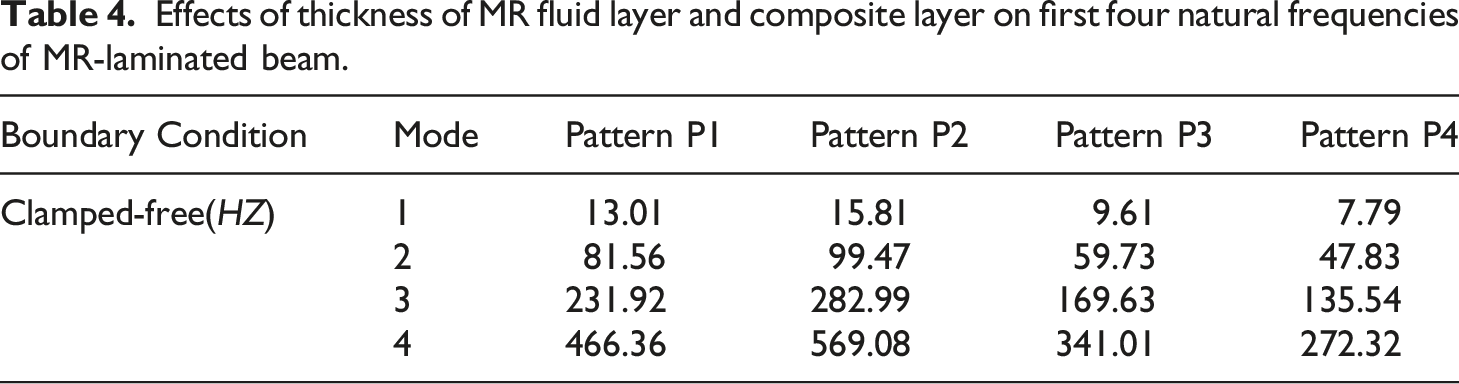
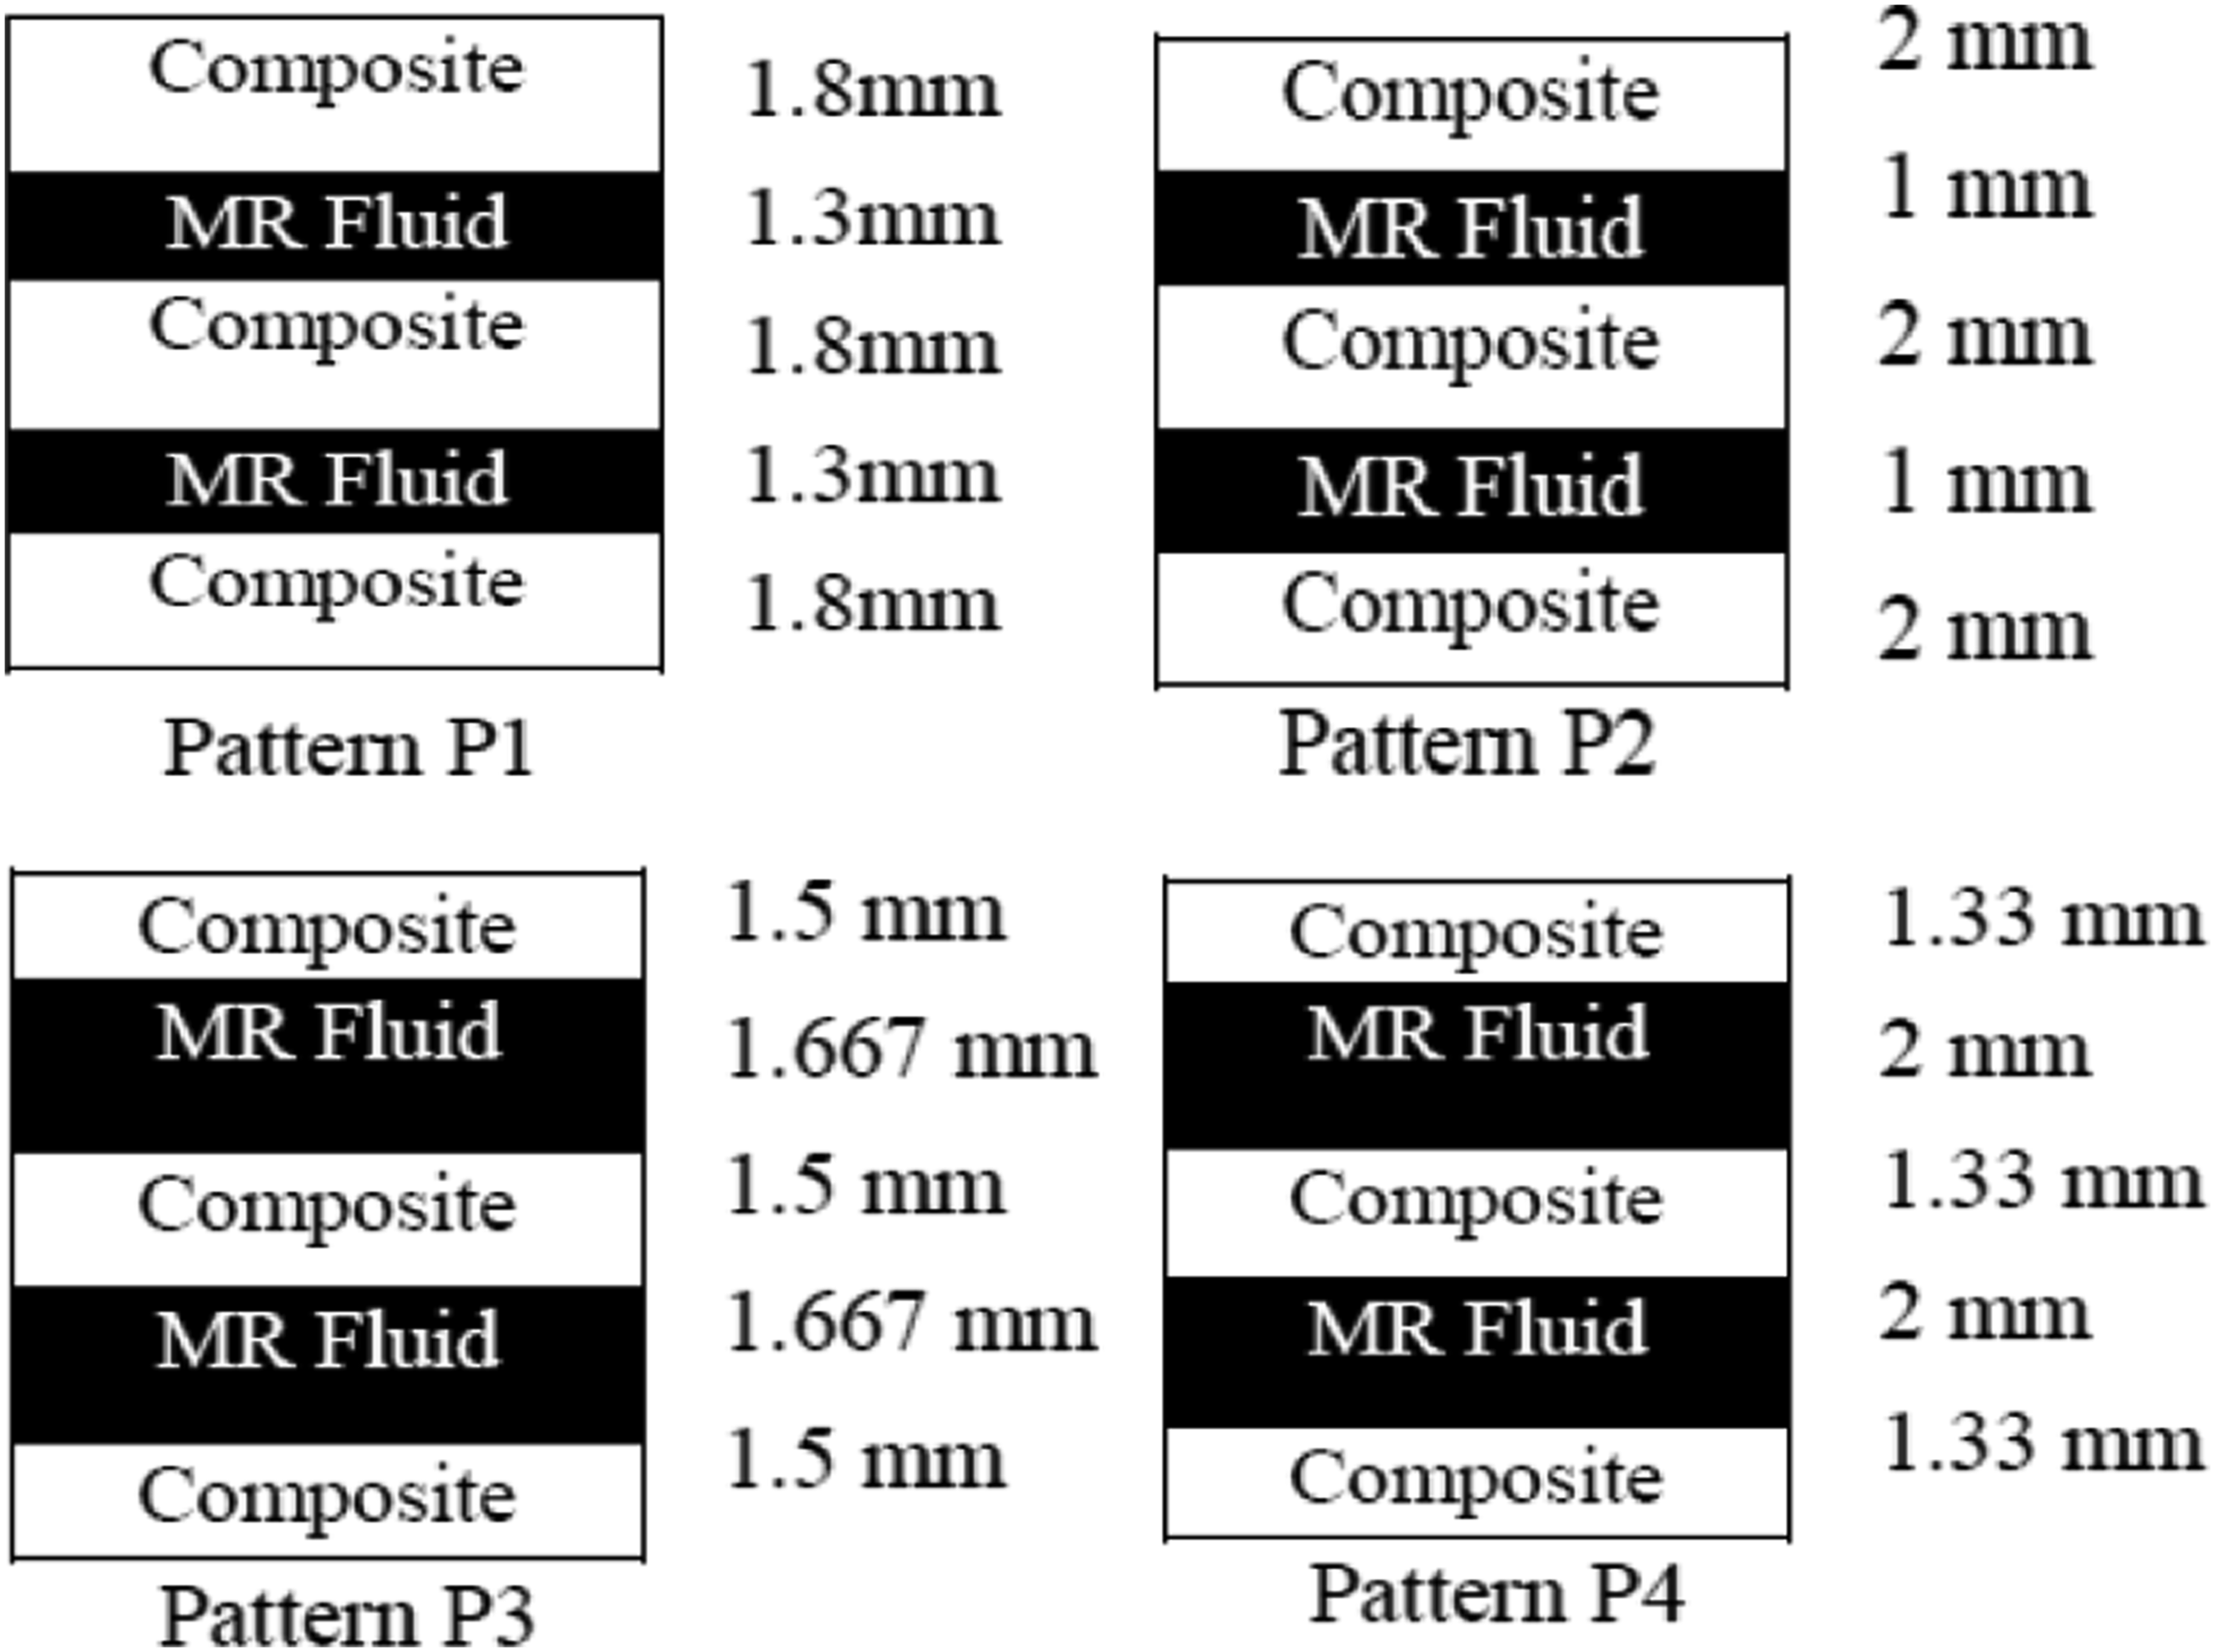
Different thicknesses of patterns of MR-laminated beams.
It can be observed that due to the nature of the composite section, by increasing the thickness of the composite section with respect to MR fluid layer, the natural frequencies of the MR-laminated beam increased. One may also observe that the natural frequencies of pattern P2 are remarkably higher than other patterns, while pattern P4 yields the lowest natural frequencies.
Effects of magnetic field on natural frequencies
The effects of magnetic fields on natural frequencies of MR-laminated beams are investigated for different configurations A-F in clamped-free and simply supported boundary conditions. The first three natural frequencies of six different configurations of the MR-laminated beam for E-glass material obtained from the present LWT and FSDT with different magnetic fields (0 up to 2,100 Gauss) are summarized in Table A1 in appendix. The natural frequencies of MR-laminated beam in clamped-free and simply supported boundary conditions for all modes by increasing the magnetic fields up to 1,500 and 2,100 Gauss has been increased respectively. Furthermore, increasing the natural frequencies leads to increasing the complex shear modulus of MR-laminated beams. By increasing the magnetic field up to 1,500 Gauss, the amounts of complex shear modulus have been increased and beyond this value, the amounts of complex shear modulus started to decline. This phenomenon is due to the properties of MR fluid to control the vibration response of MR-laminated beams. According to equation (33), by increasing the magnetic fields, the amounts of loss shear modulus of MR fluid have been increased, therefore, beyond the 1,500 Gauss, the amounts of natural frequencies have been decreased.
For this reason, between 1,500–2,100 Gauss the natural frequencies of MR-laminated beam in clamped-free conditions decreased. The natural frequencies of configuration F in both boundary conditions are generally higher than in other configurations. This phenomenon is due to replacing the MR fluid segment with a composite layer segment. Data on natural frequencies are given in the appendix in Table A1.
Figures 15 and 16 show the comparisons of natural frequencies of the first and second modes of configuration A in experimental, LWT, and FSDT. It can be observed that the differences in natural frequencies between experimental and LWT are lower than the differences between experimental and FSDT. The comparisons of the first and second modes of different configurations of MR-laminated beams in LWT and FSDT have been illustrated in Figures 17 and 18. Comparison of the first modes of Configuration A by applying magnetic fields in clamped-free condition. Comparison of the second modes of Configuration A by applying magnetic fields in clamped-free condition. Comparison of the first modes of different configurations of MR-laminated beams in clamped-free condition. Comparison of the first modes of different configurations of MR-laminated beams in Simply Supported condition.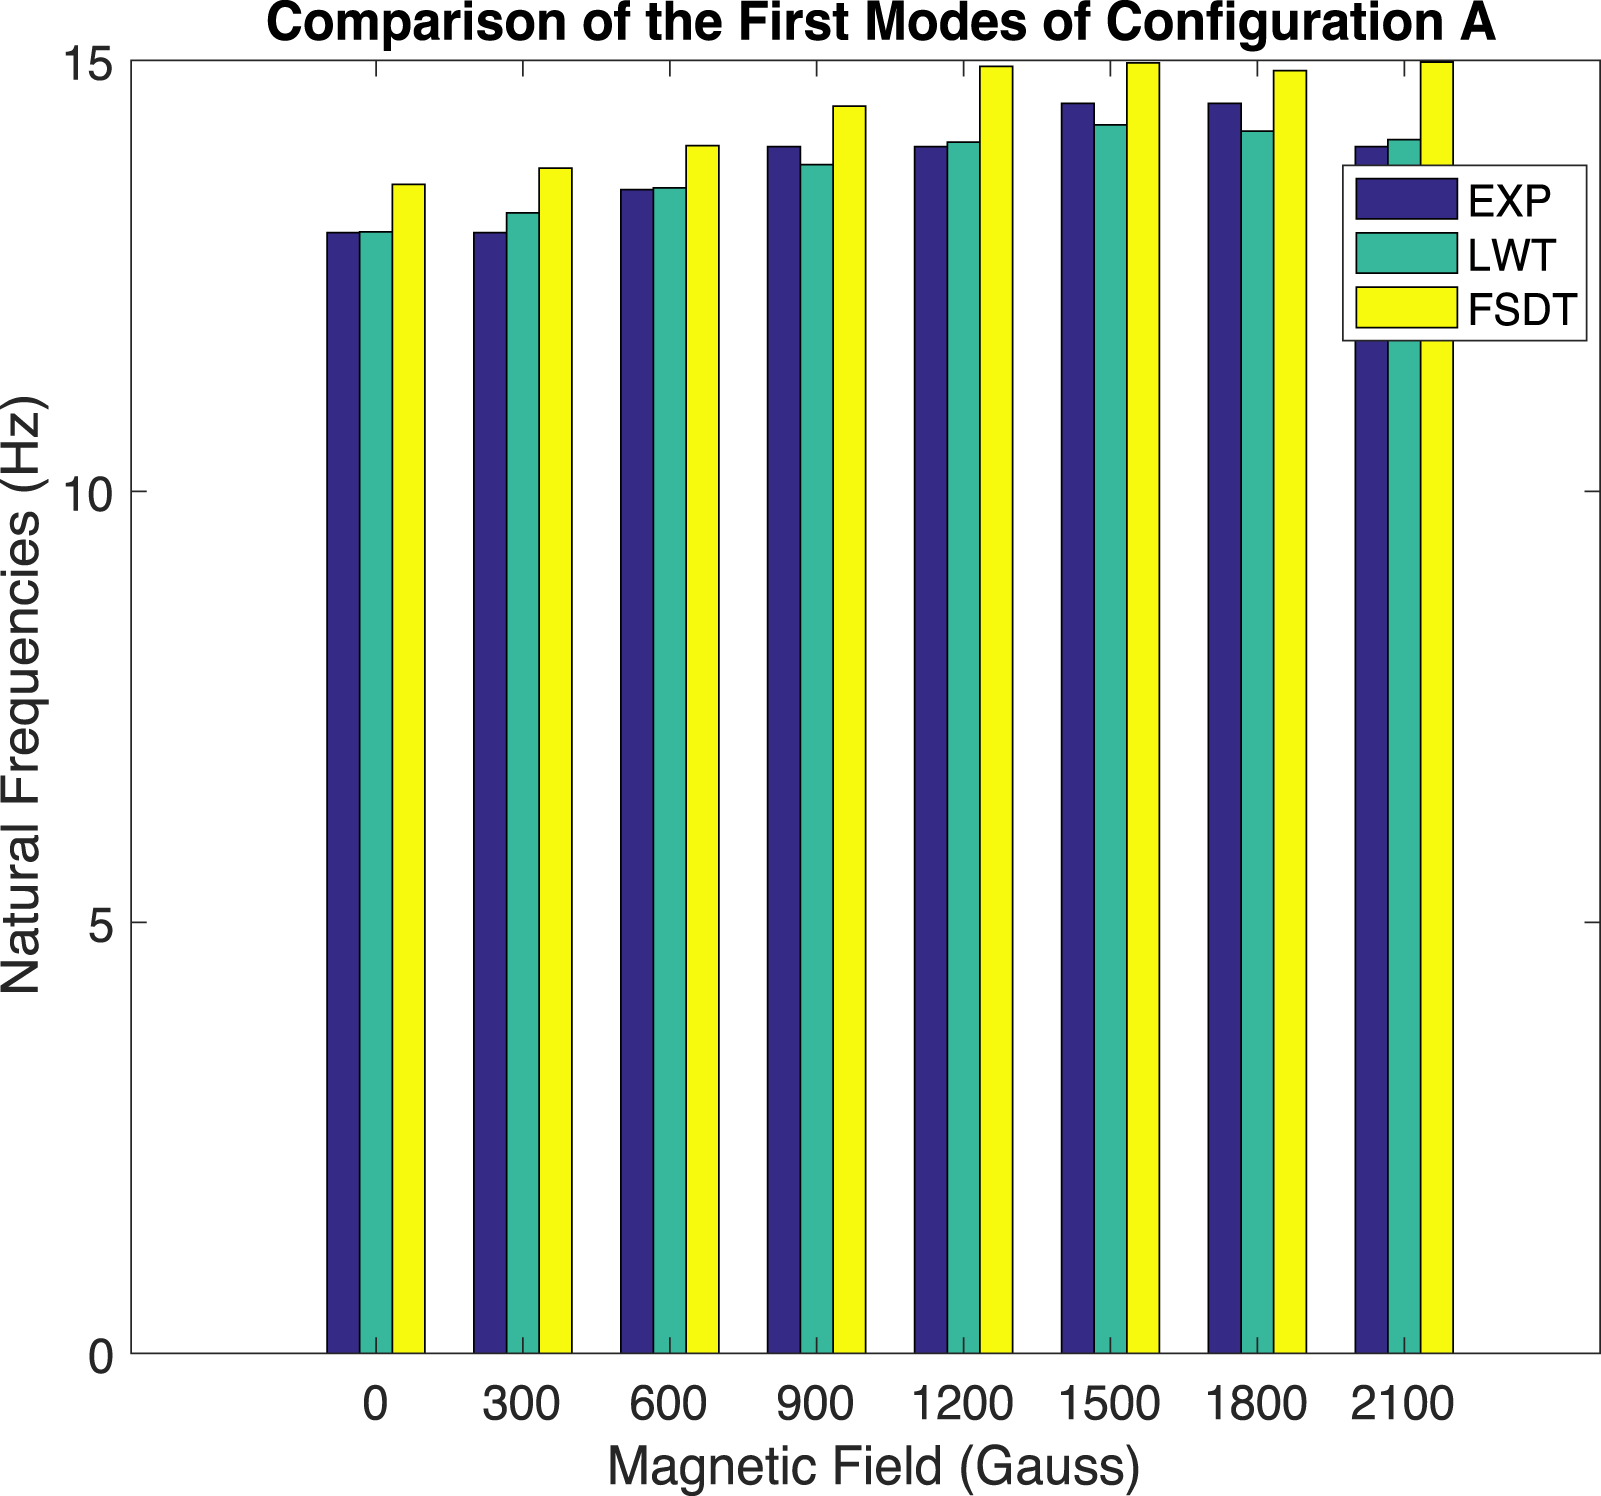
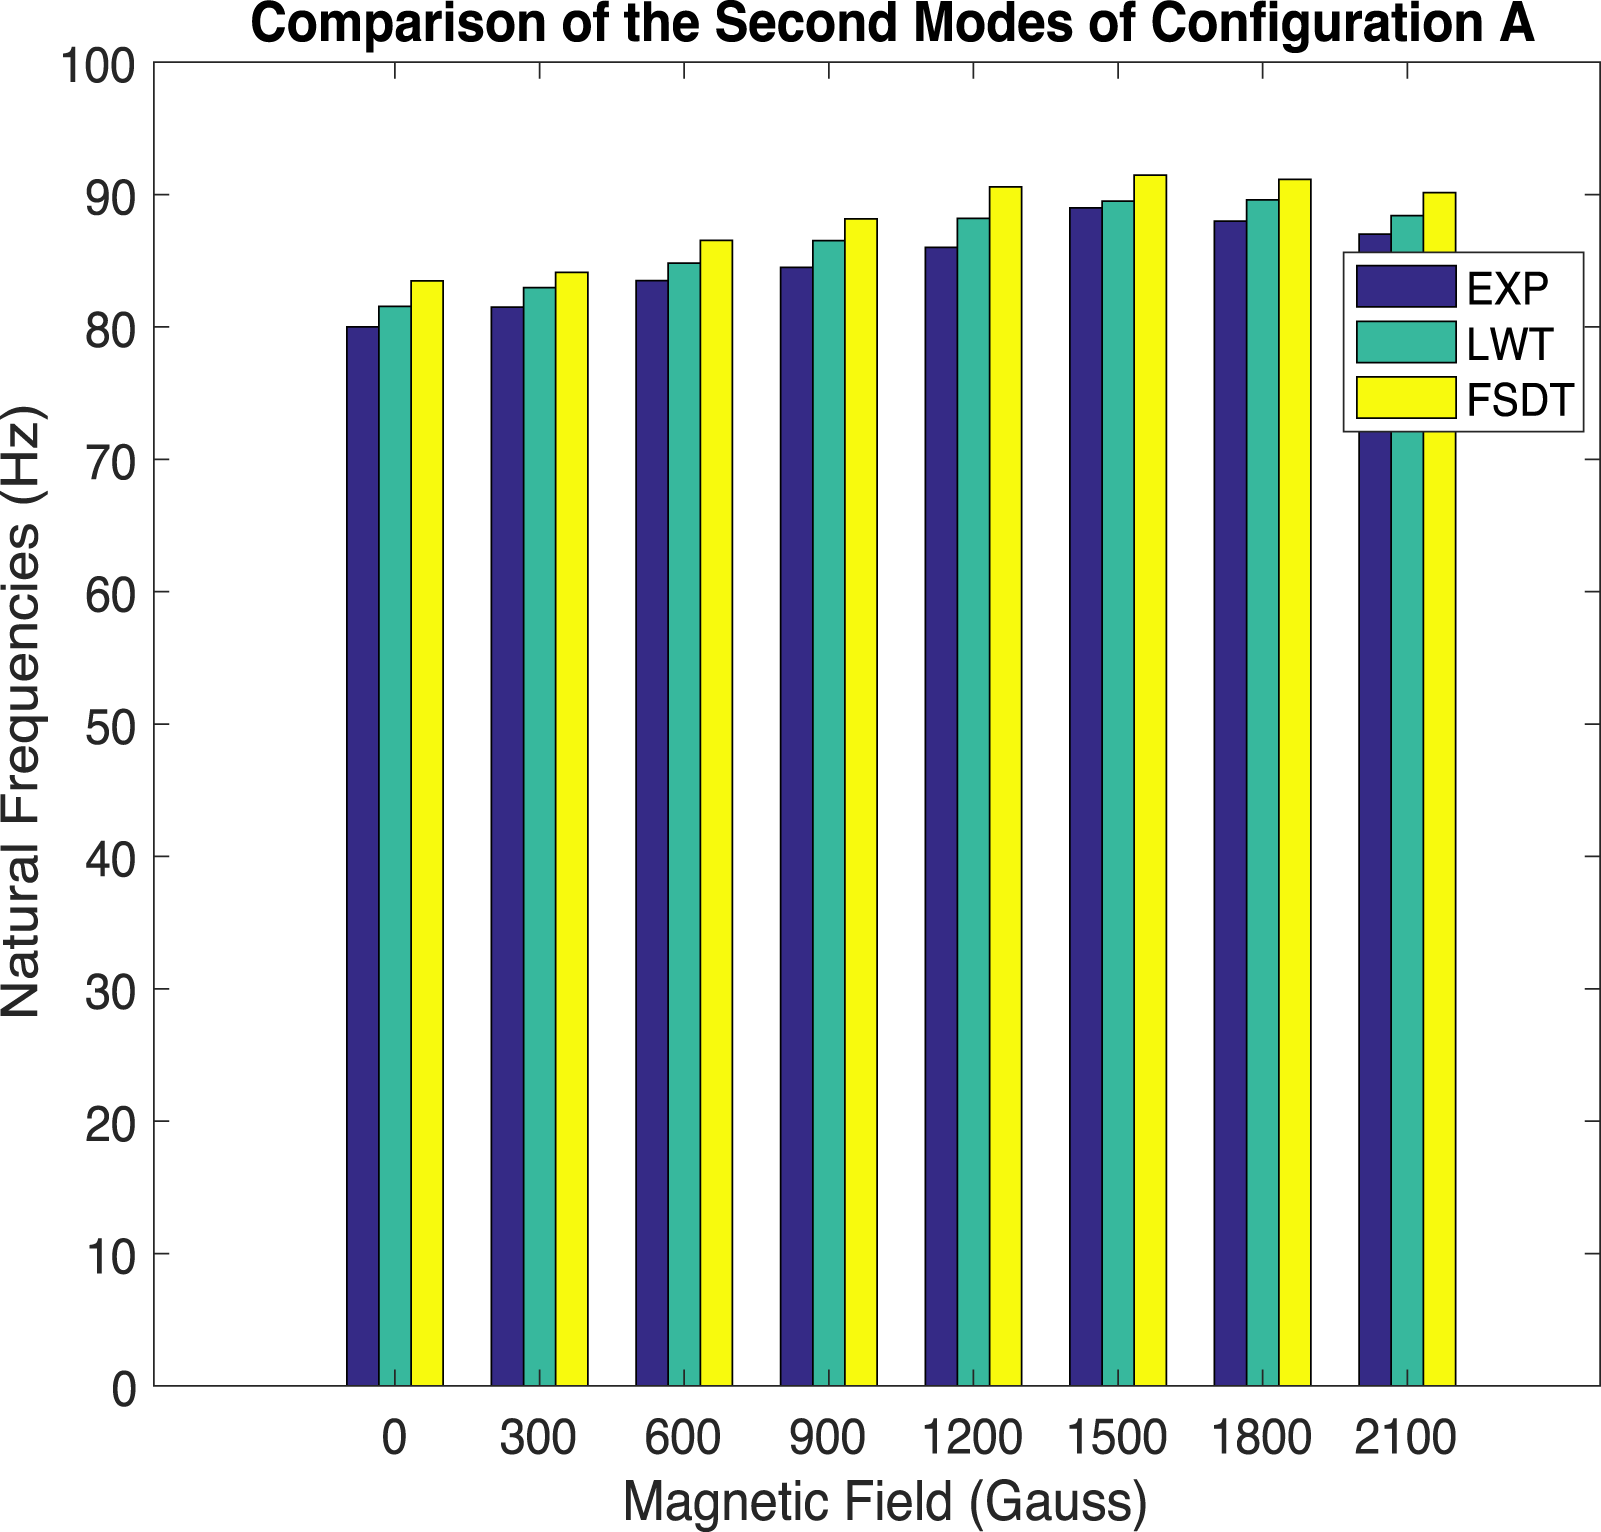
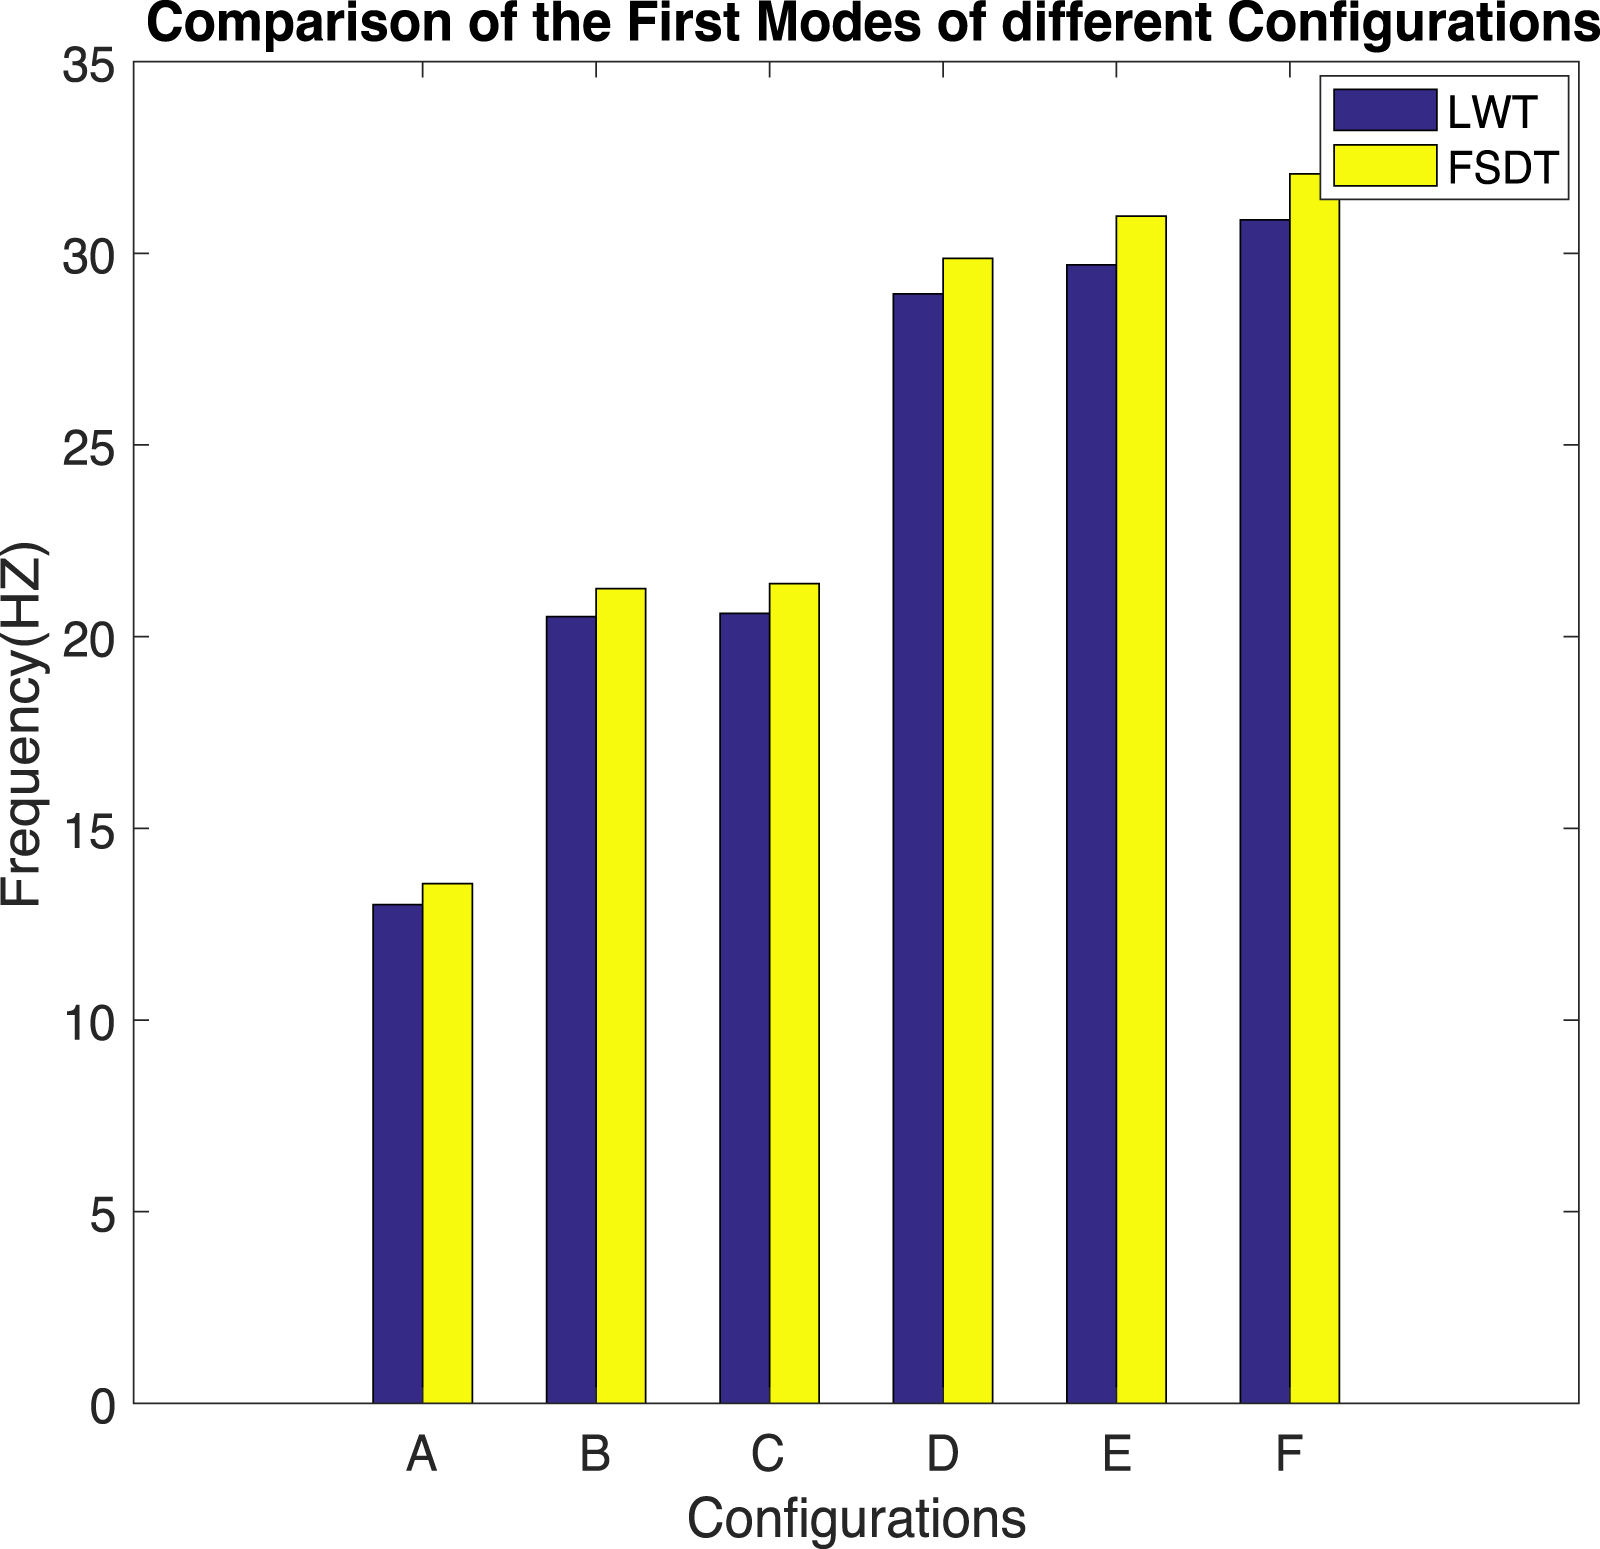
Once again, the results of Figures 17 and 18 demonstrate that the natural frequencies of LWT are near the experimental results.
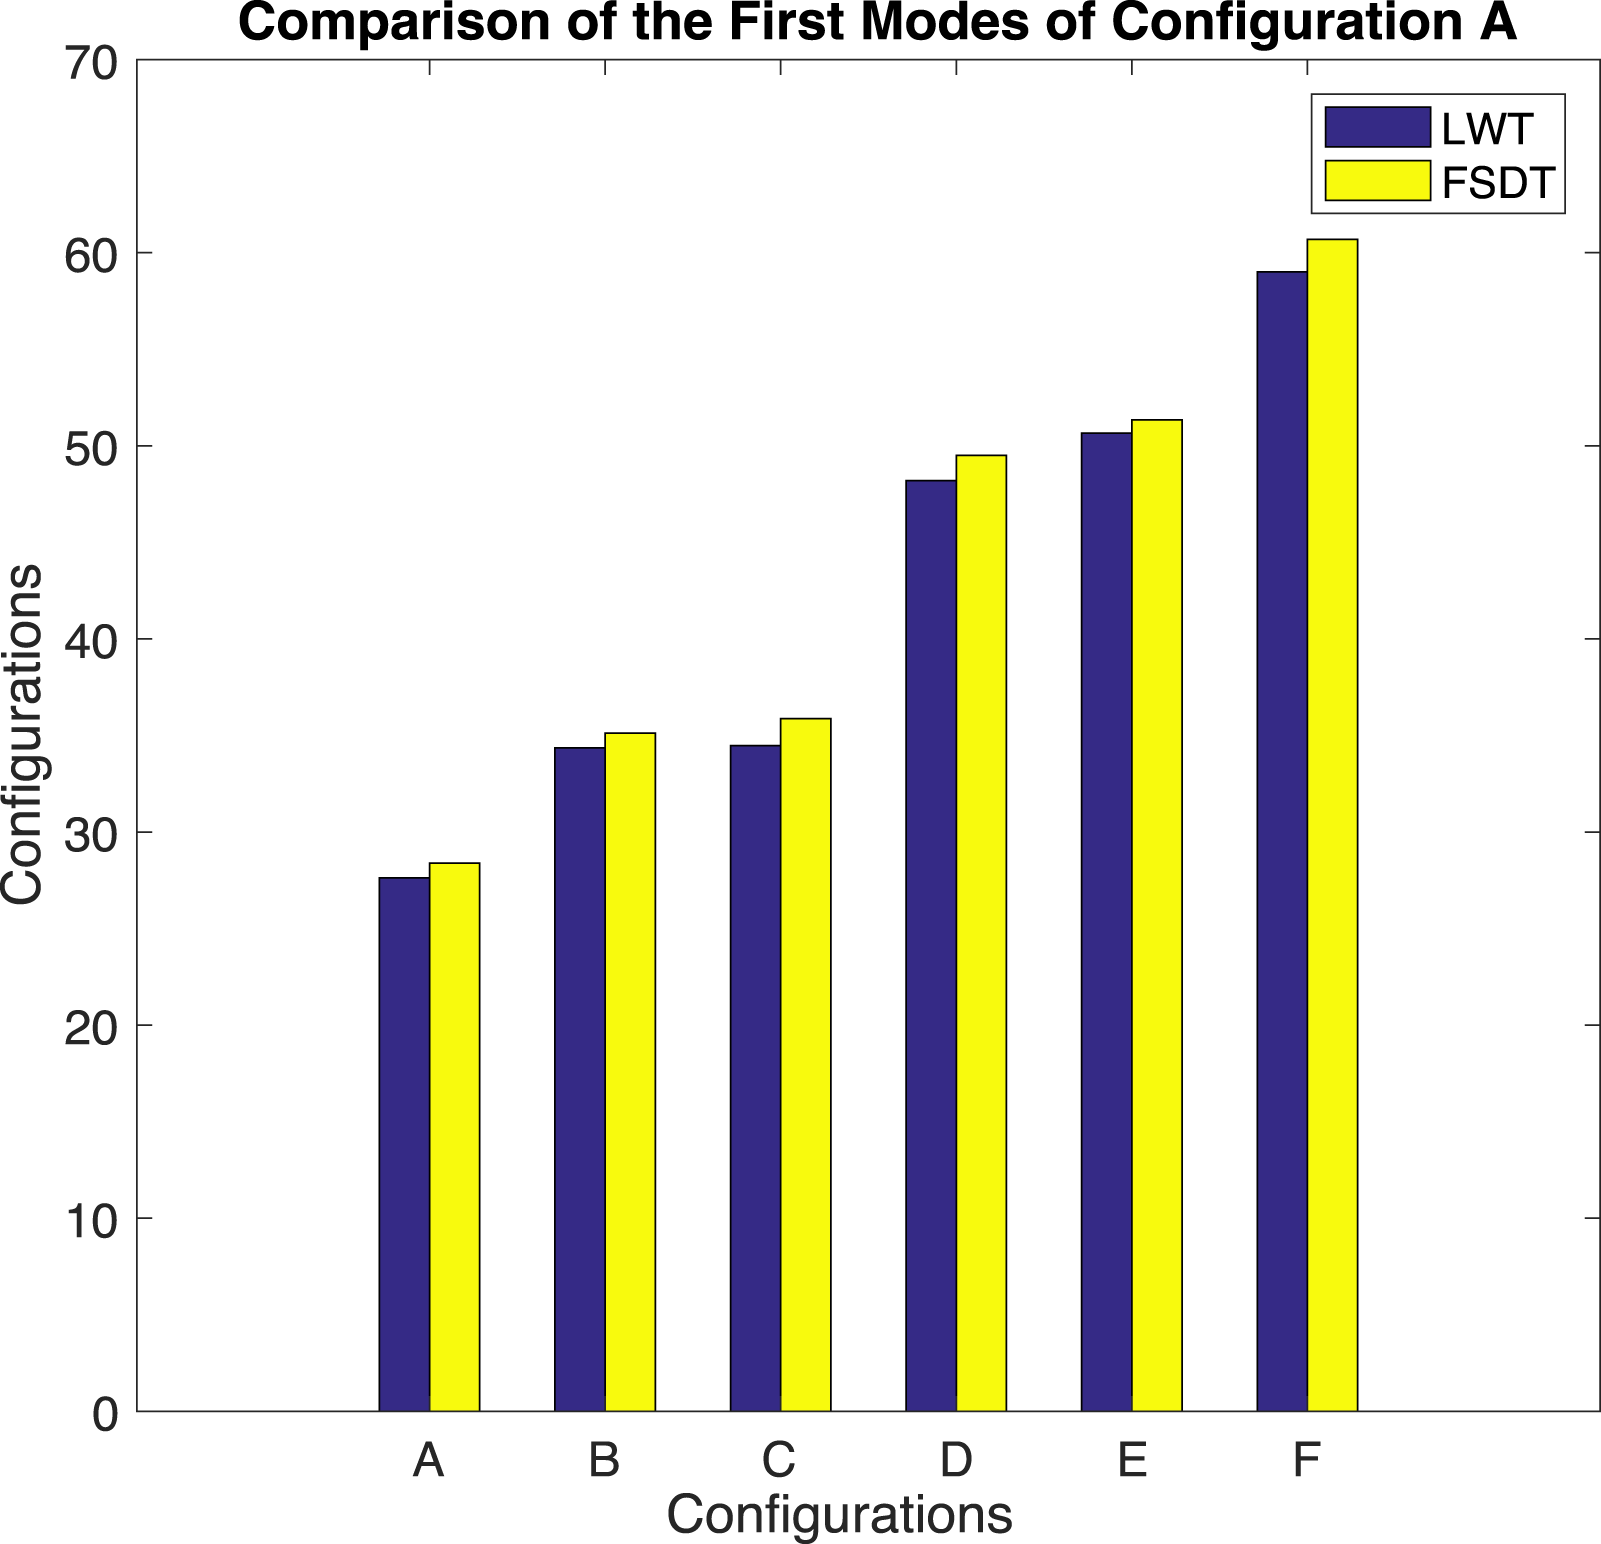
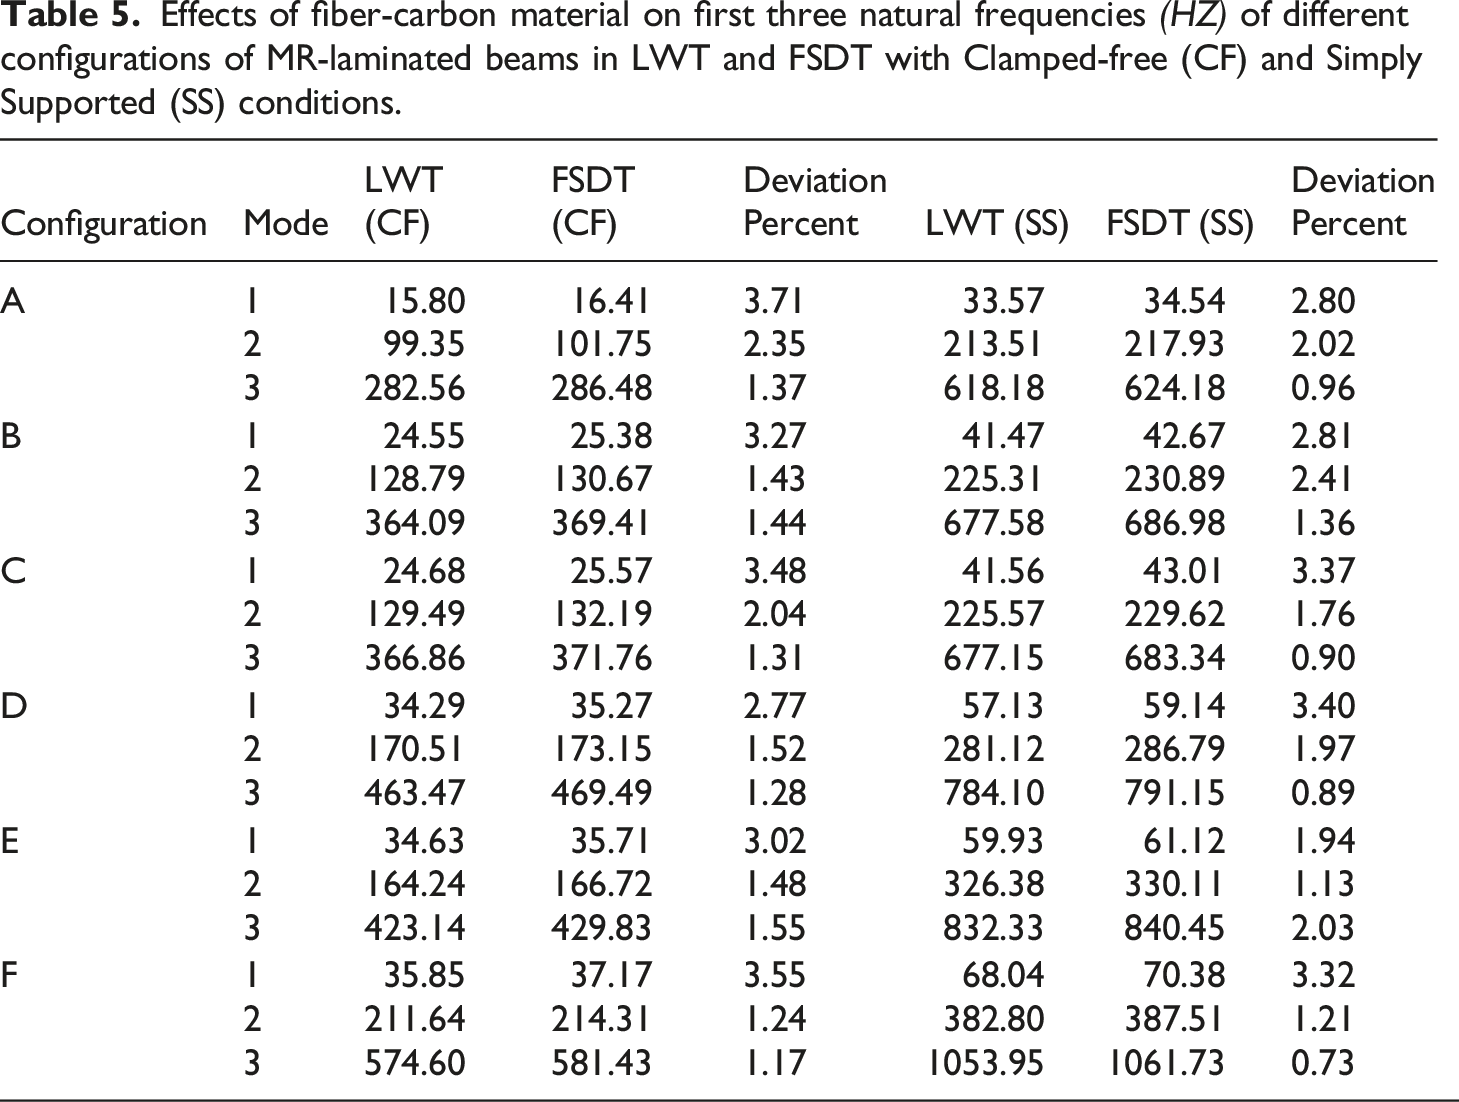
Influences of composite material on natural frequencies
Effects of fiber-carbon material on first three natural frequencies (HZ) of different configurations of MR-laminated beams in LWT and FSDT with Clamped-free (CF) and Simply Supported (SS) conditions.
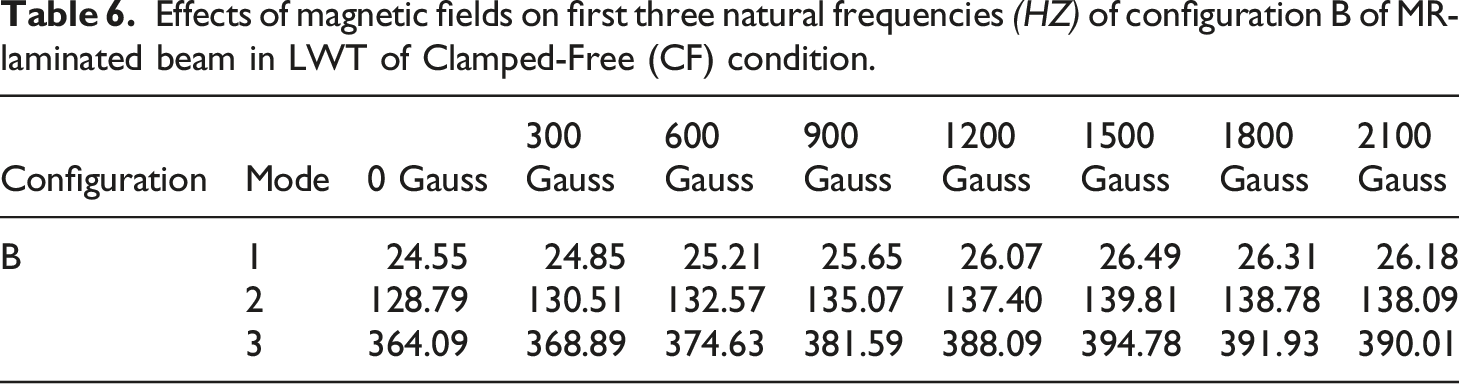
Effects of magnetic fields on first three natural frequencies (HZ) of configuration B of MR-laminated beam in LWT of Clamped-Free (CF) condition.
Influence of random loading on MR-laminated beams
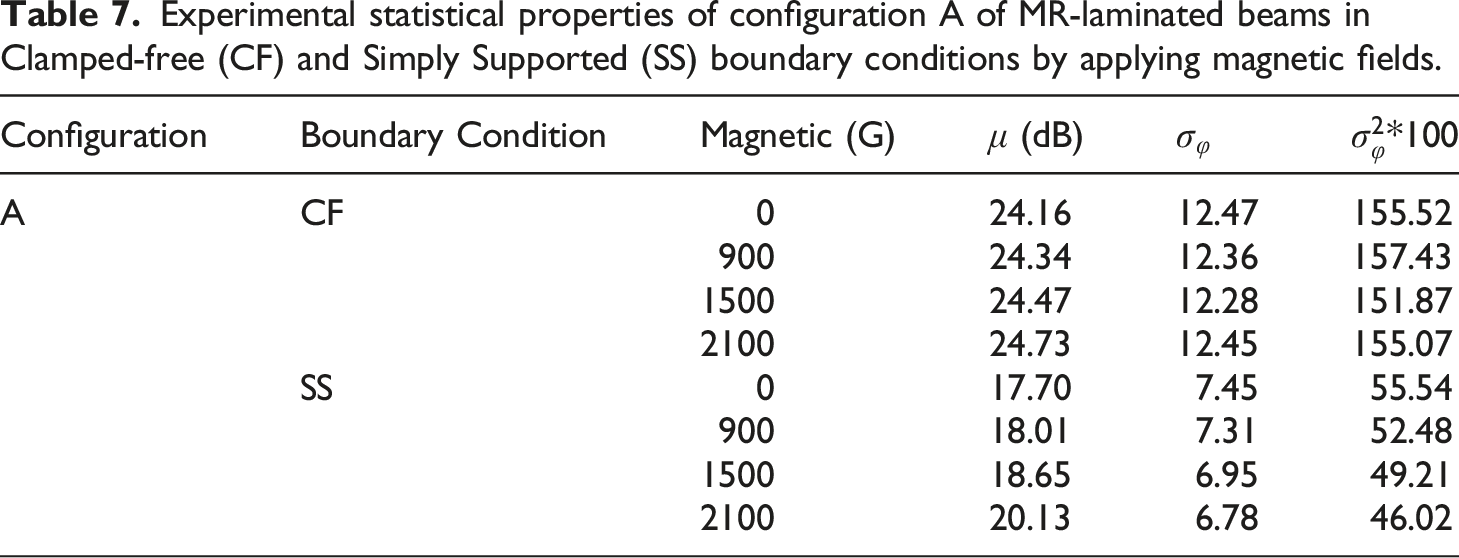
Analysis of statistical properties
Experimental statistical properties of configuration A of MR-laminated beams in Clamped-free (CF) and Simply Supported (SS) boundary conditions by applying magnetic fields.
Analysis of correlation
An important parameter in random vibration analysis is the correlation coefficient between the input random excitation and output response of the MR-laminated beam. The correlation is defined as the population of pairs of two different random values that has a value between zero and one. The correlation is excellent if it is one, and if the correlation coefficient is equal to zero, there is no correlation between input and output. The correlation coefficient for different configurations and materials of MR-laminated beams by applying magnetic fields are given in Table A2 in the appendix.
By applying the magnetic fields up to 1,500 Gauss, the values of correlation coefficients for all configurations of E-glass and fiber-carbon materials in clamped-free and simply supported conditions approaches to one. However, the correlation coefficients for E-glass material are lower than that of the fiber carbon. By increasing the composite segments, the values of the correlation coefficient have been increased. Moreover, it can also be observed that the values of correlation coefficients of configurations A and F for E-glass material with different magnetic fields generally have the highest and lowest values, respectively.
It is worth noting that for all boundary conditions, the location of MR fluid segments alters the statistical properties and correlation coefficients.
Analysis of autocorrelation
The autocorrelation function for a random process is defined as the average value of the product Autocorrelation of different configurations of E-glass material. Autocorrelation of different configurations of fiber-carbon material.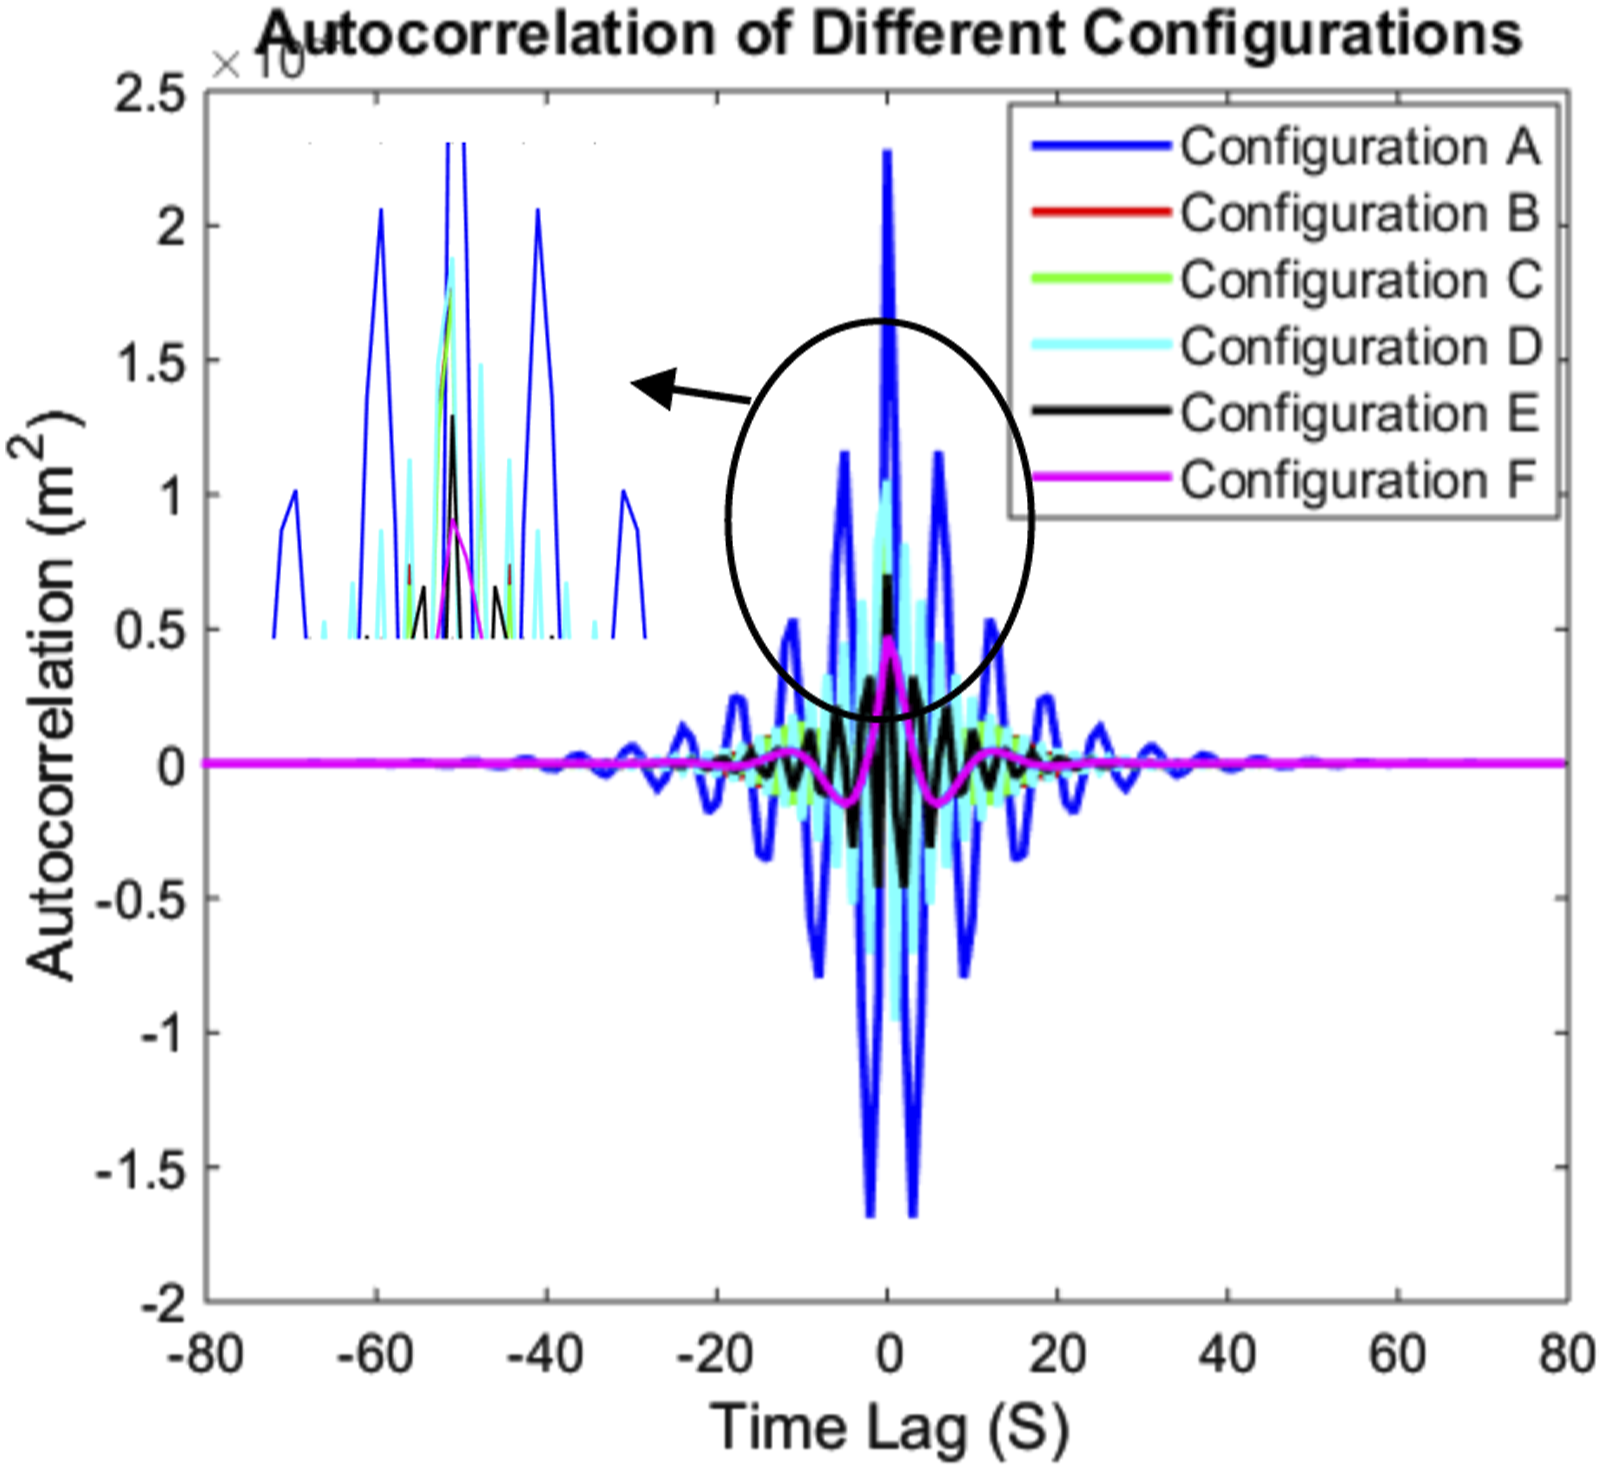
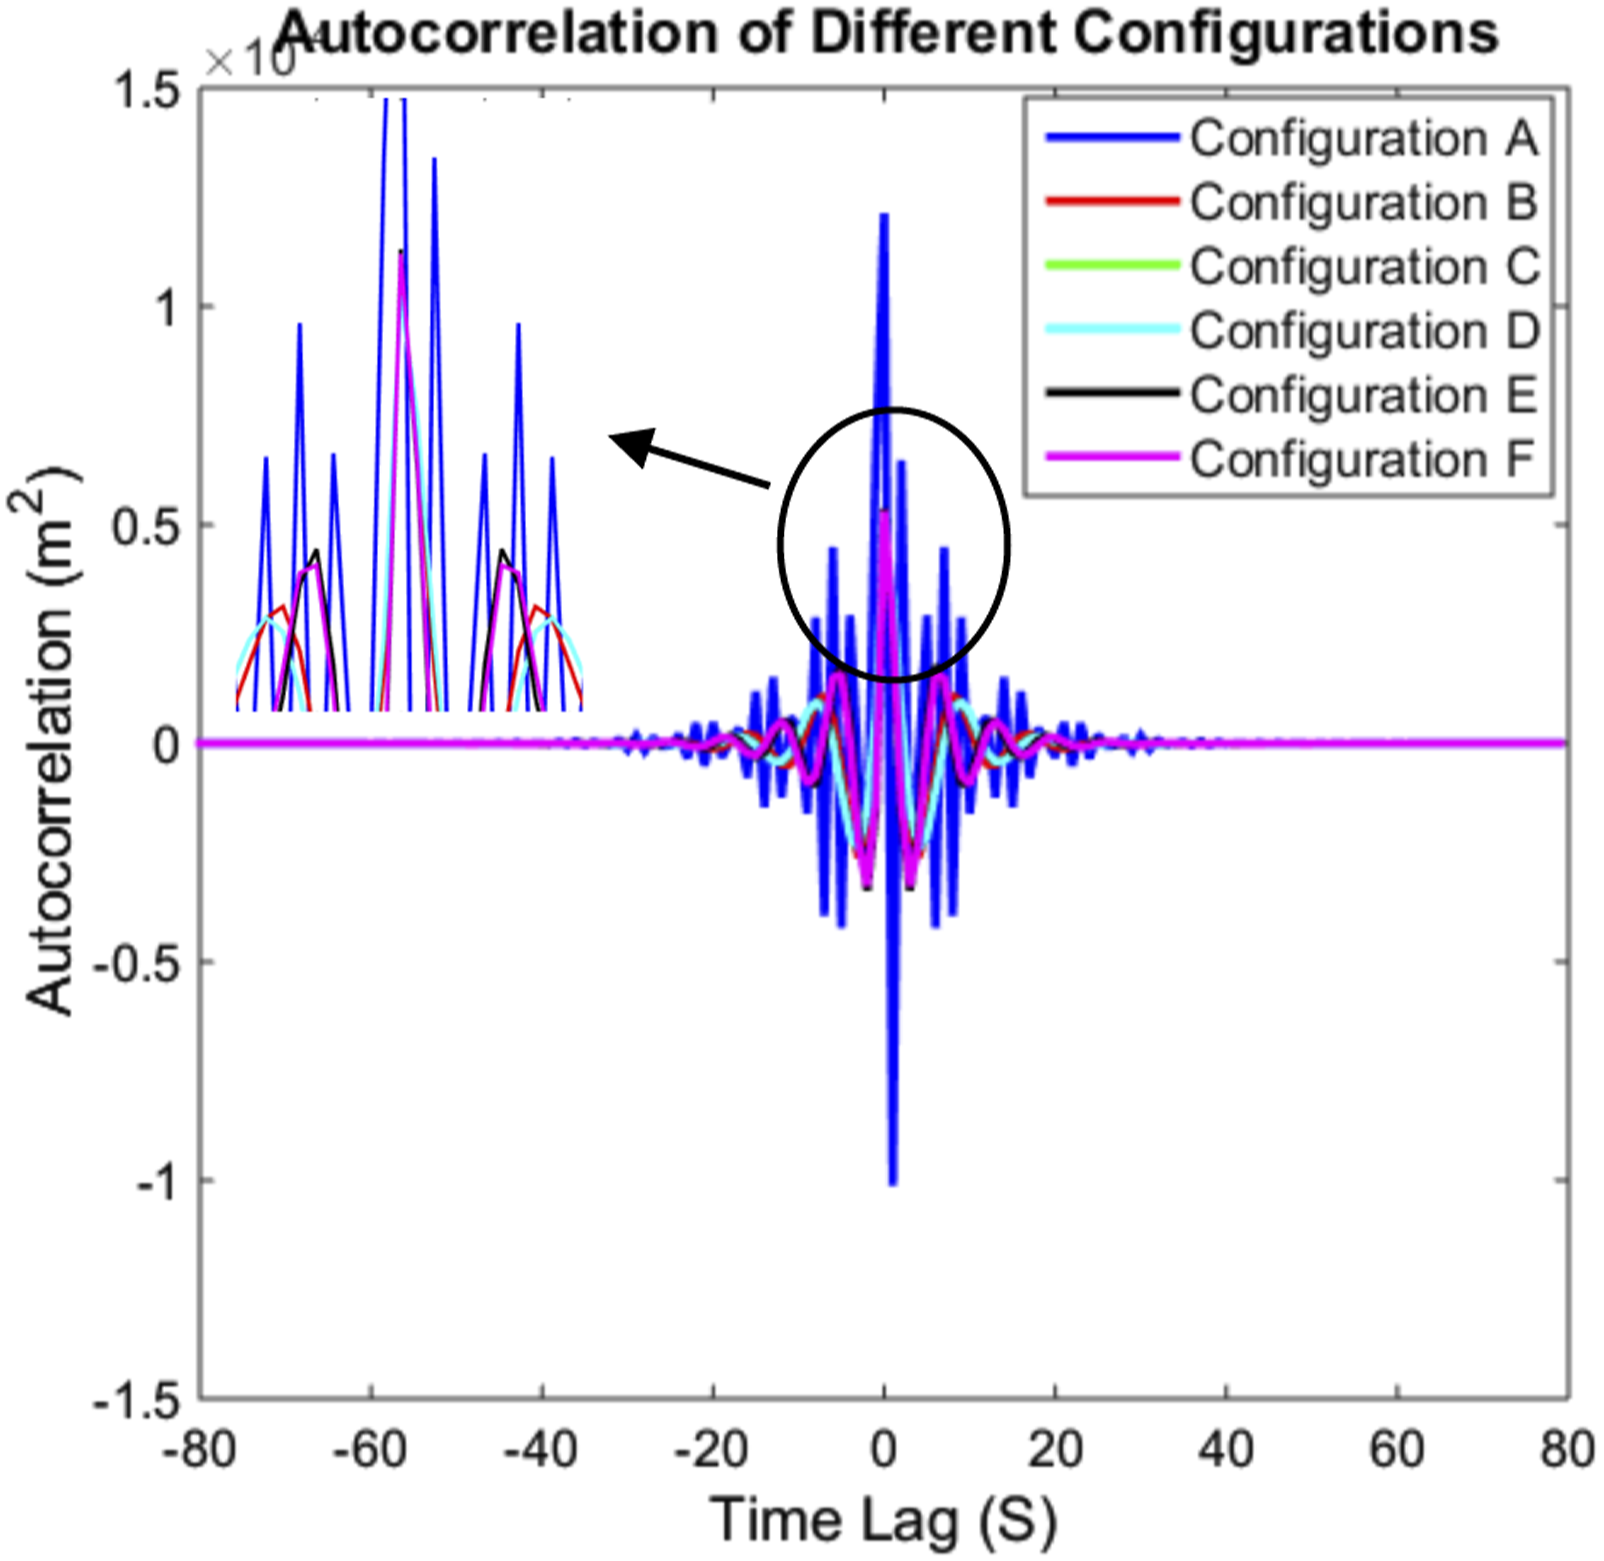
It can be observed that in Figures 19 and 20, the lowest peak amplitude of the MR-laminated beam, belongs to configuration F. The peak amount of configuration A is generally higher than other configurations. Figures 19 and 20 show that the peak amplitude of different configurations of MR-laminated beams with fiber-carbon material is lower than MR-laminated beams with E-glass material. By increasing the number of segments of the composite layer, the amount of autocorrelation decreases. The wave period of configuration A is higher than other configurations. Therefore, for an engineering structure in which control is very important, configuration A is suitable. In addition, E-glass and fiber-carbon of configuration F are more favorable for applications under impact loading. However, other configurations are good candidates for applications, in which vibration control and impact suppression are of equal importance.
In Figure 21 the experimental and LWT values for autocorrelation of configuration A made of E-Glass are compared. The peak amplitudes of the autocorrelation response of the experimental are higher than LWT. Comparison of autocorrelation of E-glass of configuration A with 900 Gauss.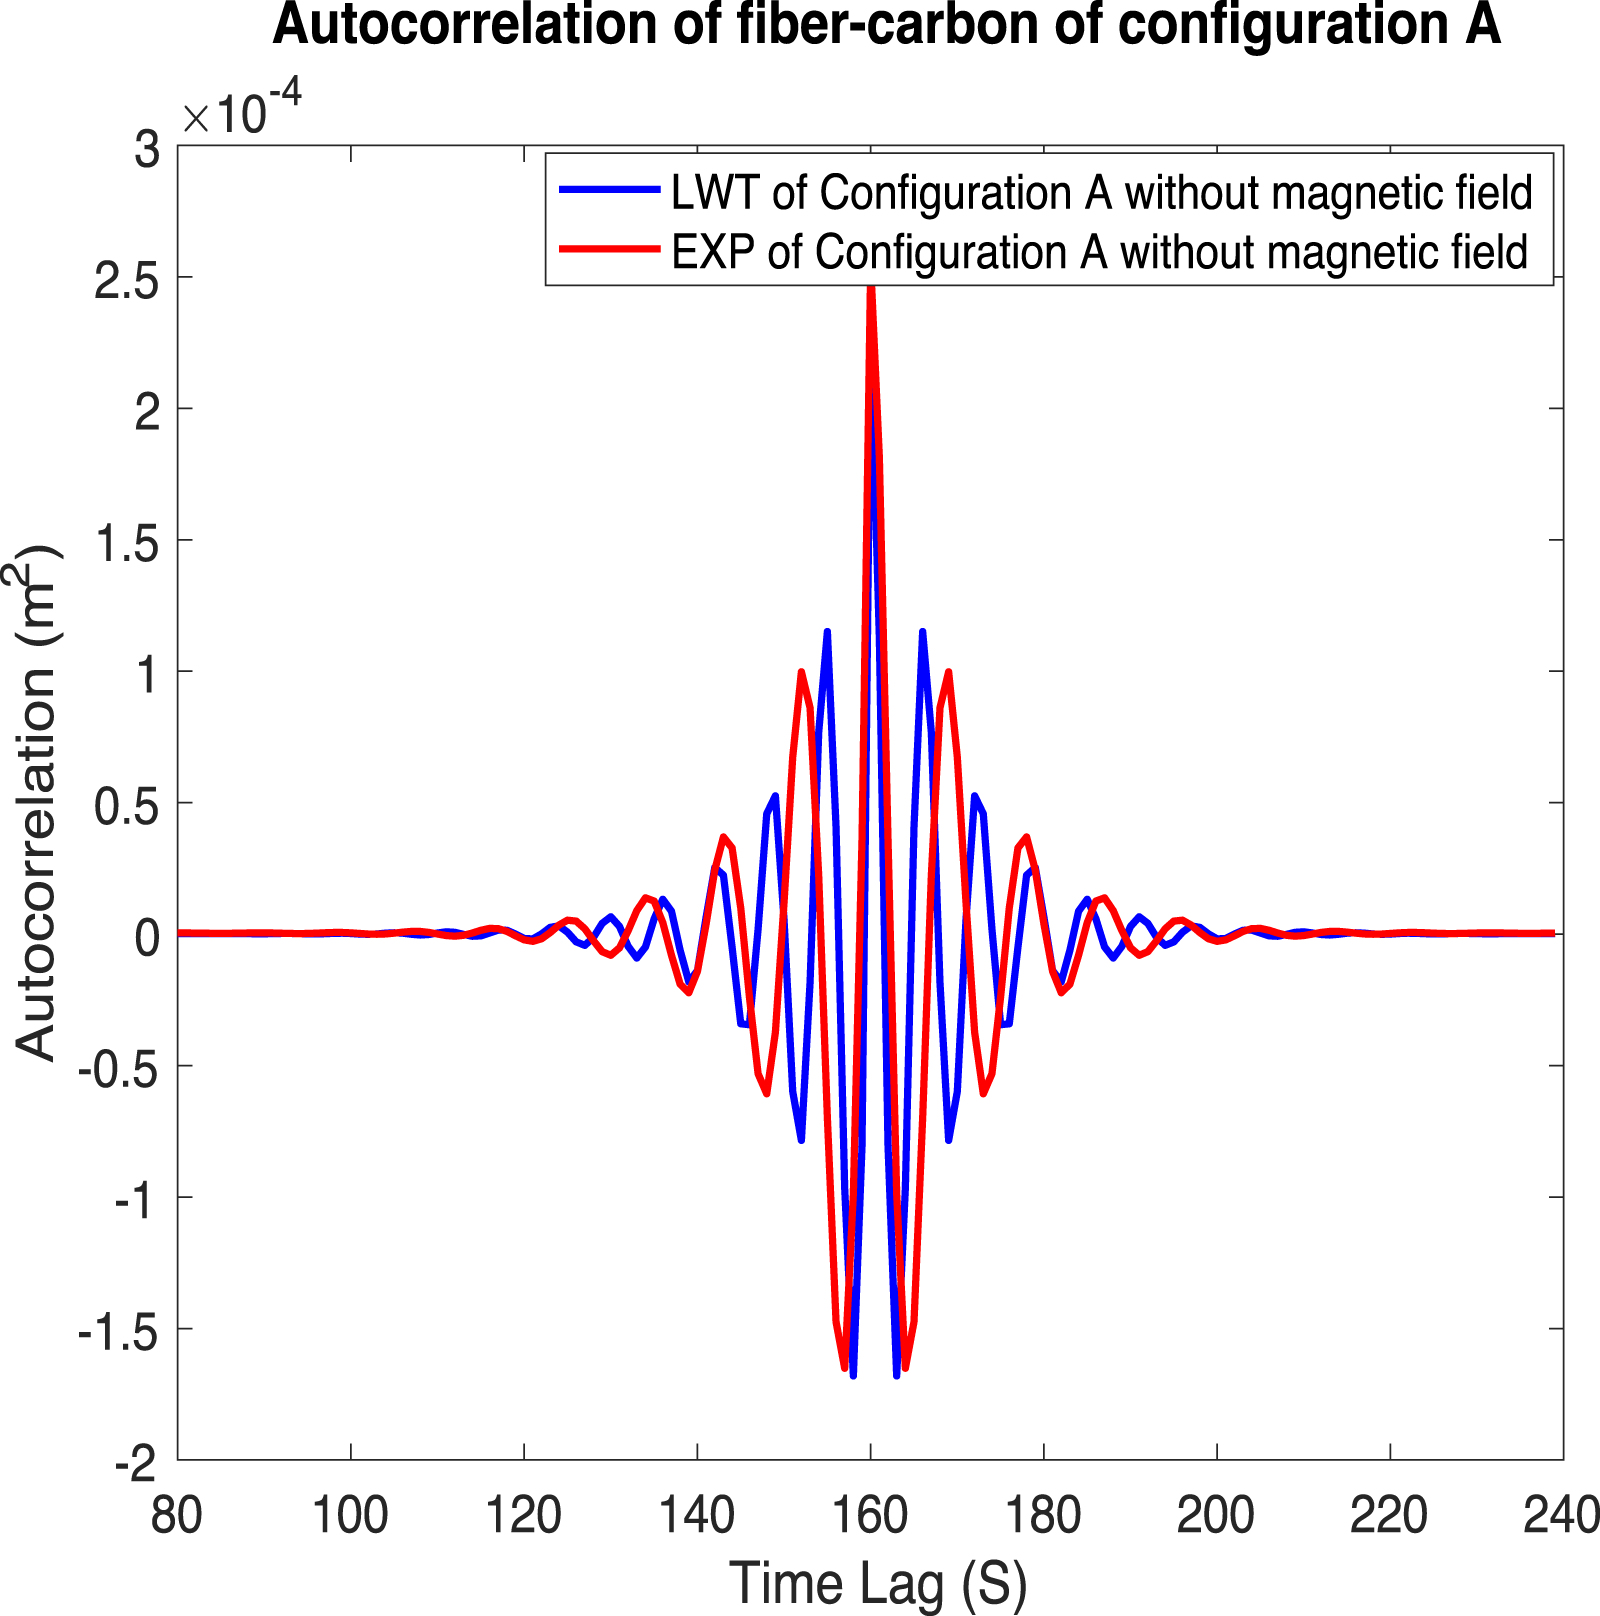
Random vibration behaviour of wind turbine blade applications
In order to investigate the dynamic behavior of wind turbine blade application, a narrow band is an excellent candidate to design this application and this is a stationary random process whose samples are close to oscillations of some fixed point 
The natural frequencies of wind turbine blades with different lengths and shapes are obtained by.37,38 In addition, a random loading with a narrow band frequency between 30-40 Hz is applied at the end of the structure. The best configuration for this frequency range is configuration F of E-glass material in clamped-free condition. The frequency response of this configuration is suitable for this application. Figure 22 shows the PSD of the wind turbine blade for E-glass material under random loading. Similarly, the same input is applied to wind turbine blades made of fiber carbon and the results are shown in Figure 23. PSD of wind turbine blade for E-glass material. PSD of wind turbine blade for fiber-carbon material.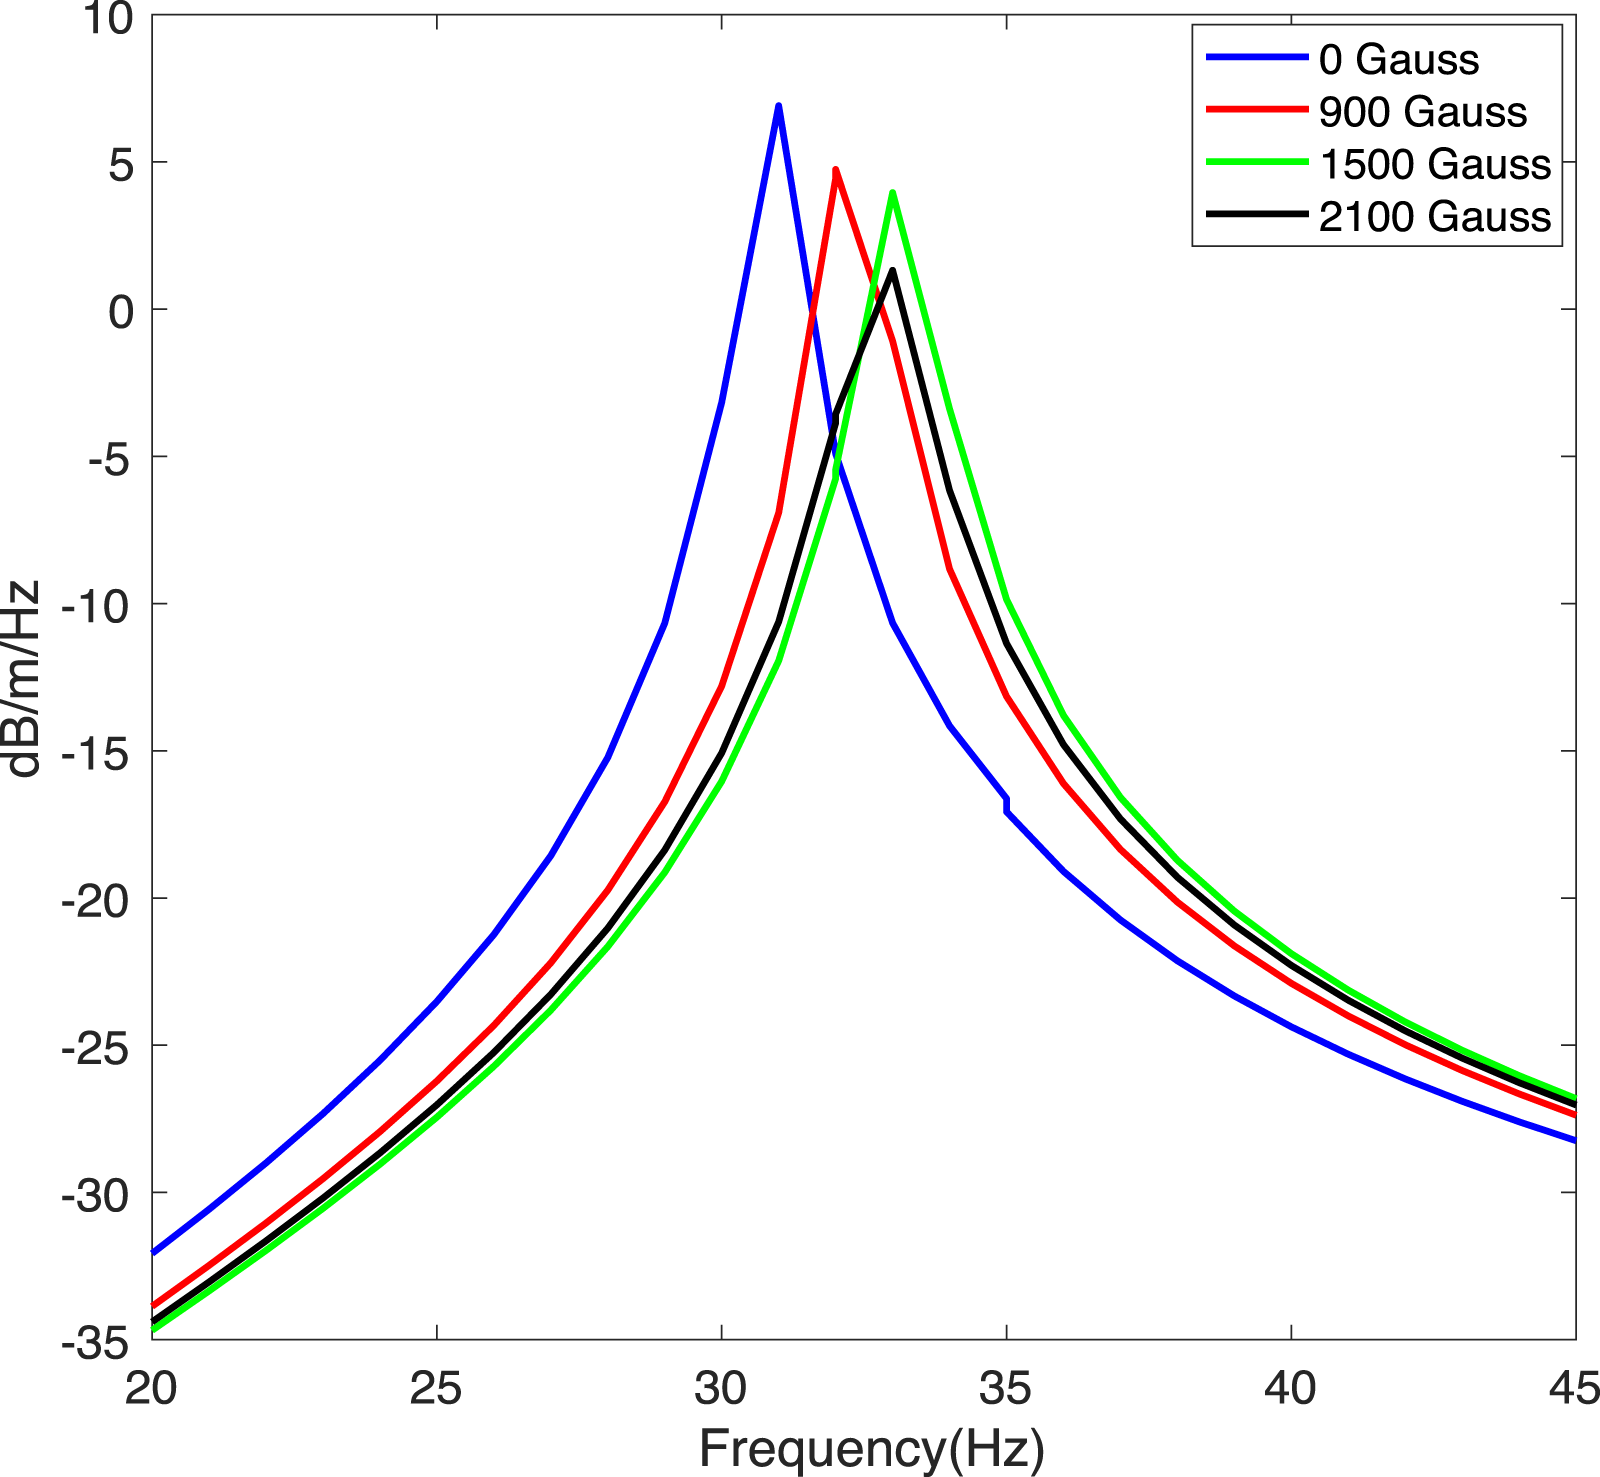
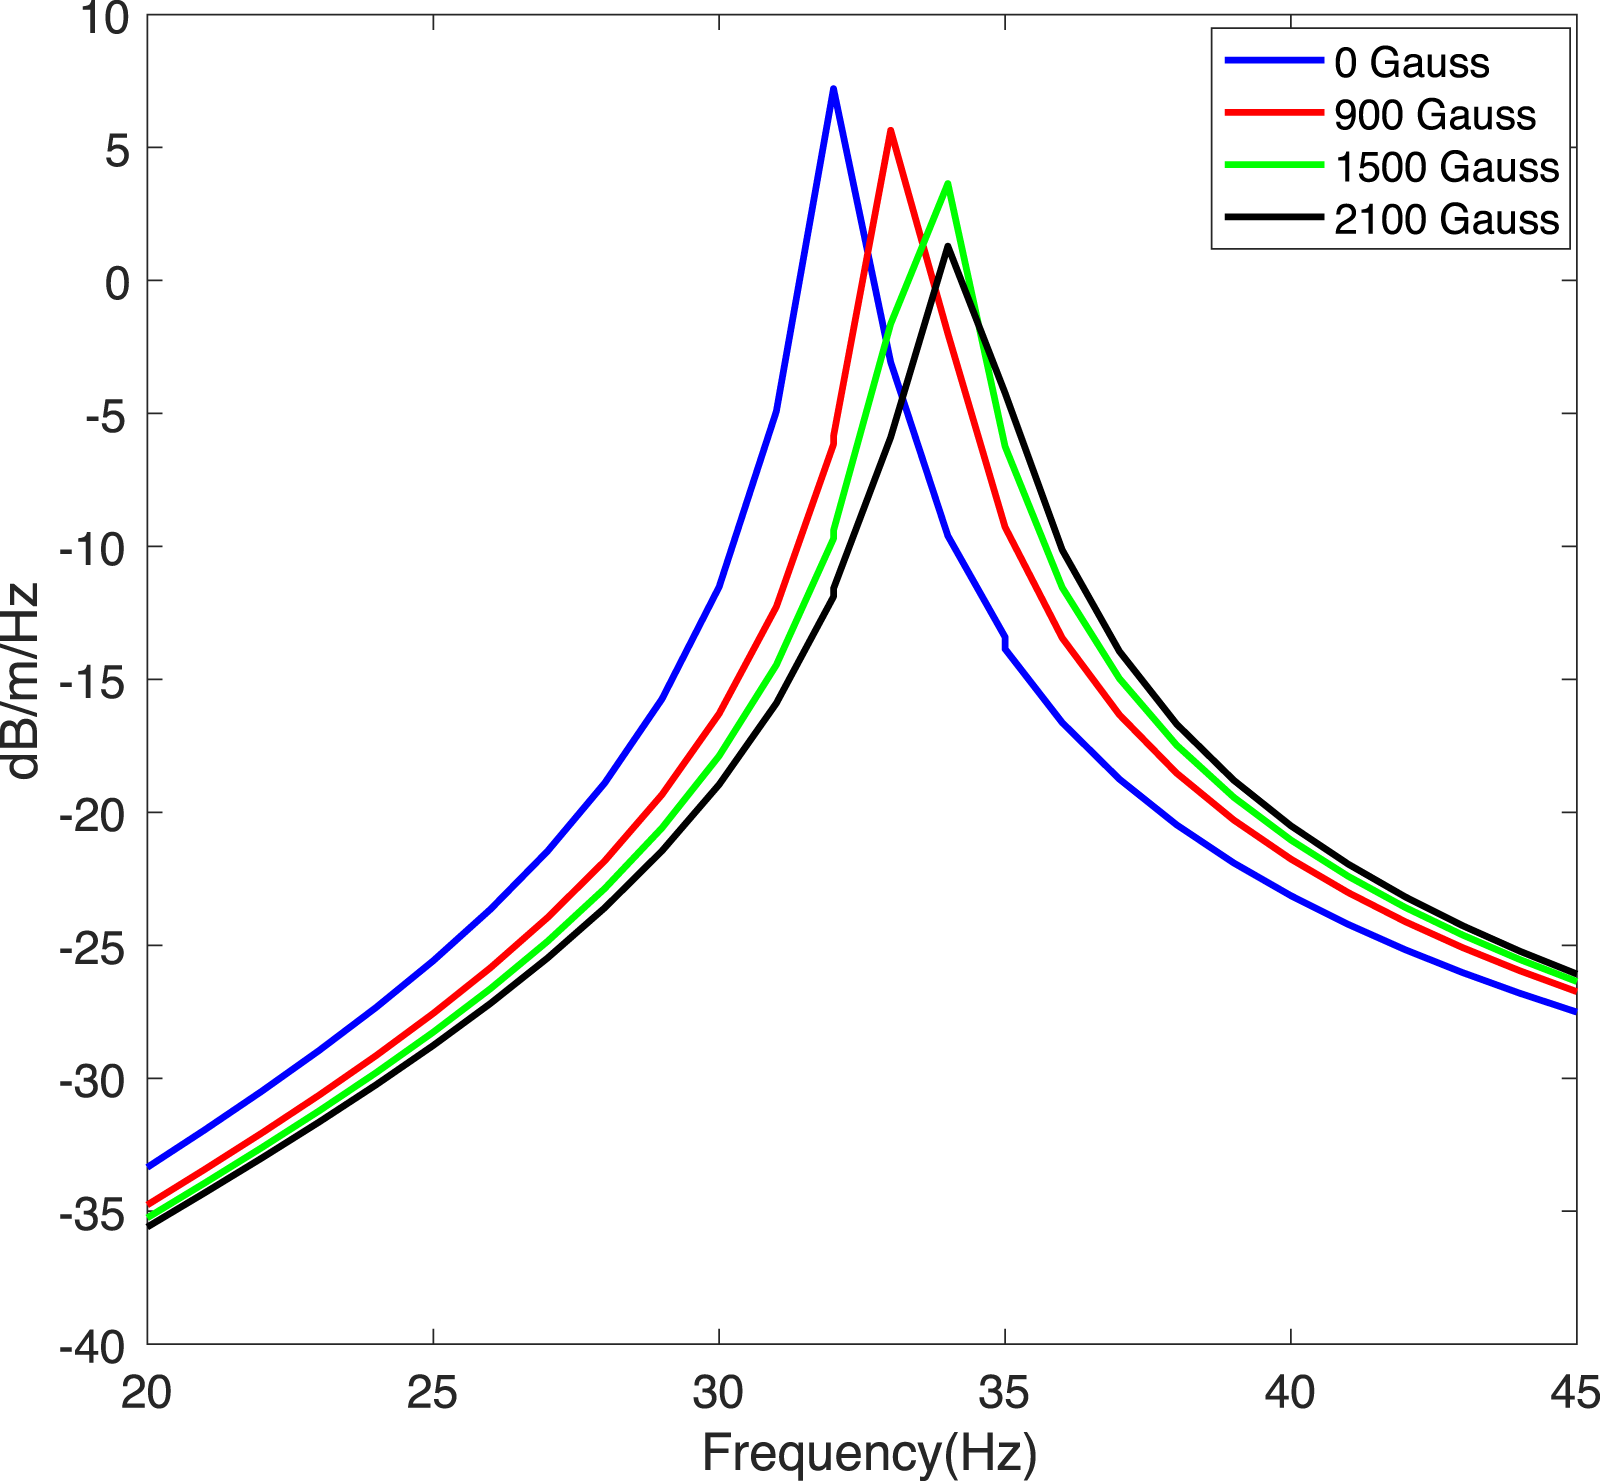
It can be realized that the PSD of wind turbine blades for both materials beyond 1500 Gauss started to decline. By increasing the magnetic fields up to 1,500 Gauss, the peak response of the structure reduced from 8 dB to −5 dB for both materials. One may realize that by adding magnetic fields up to 1,500 Gauss for E-glass and fiber-carbon materials, the natural frequencies of the structure have been improved. Once again it is realized that after 1,500 Gauss, the natural frequencies reduced which is due to the reducing the stiffness matrix of the structure.
Figure 24 shows the comparison of PSD of wind turbine blades for E-glass and fiber-carbon materials without a magnetic field. The first natural frequency of fiber-carbon MR-laminated beams is 8–10% higher than E-glass MR-laminated beams. Comparison of PSD of wind turbine blade for E-glass and fiber-carbon materials without magnetic field.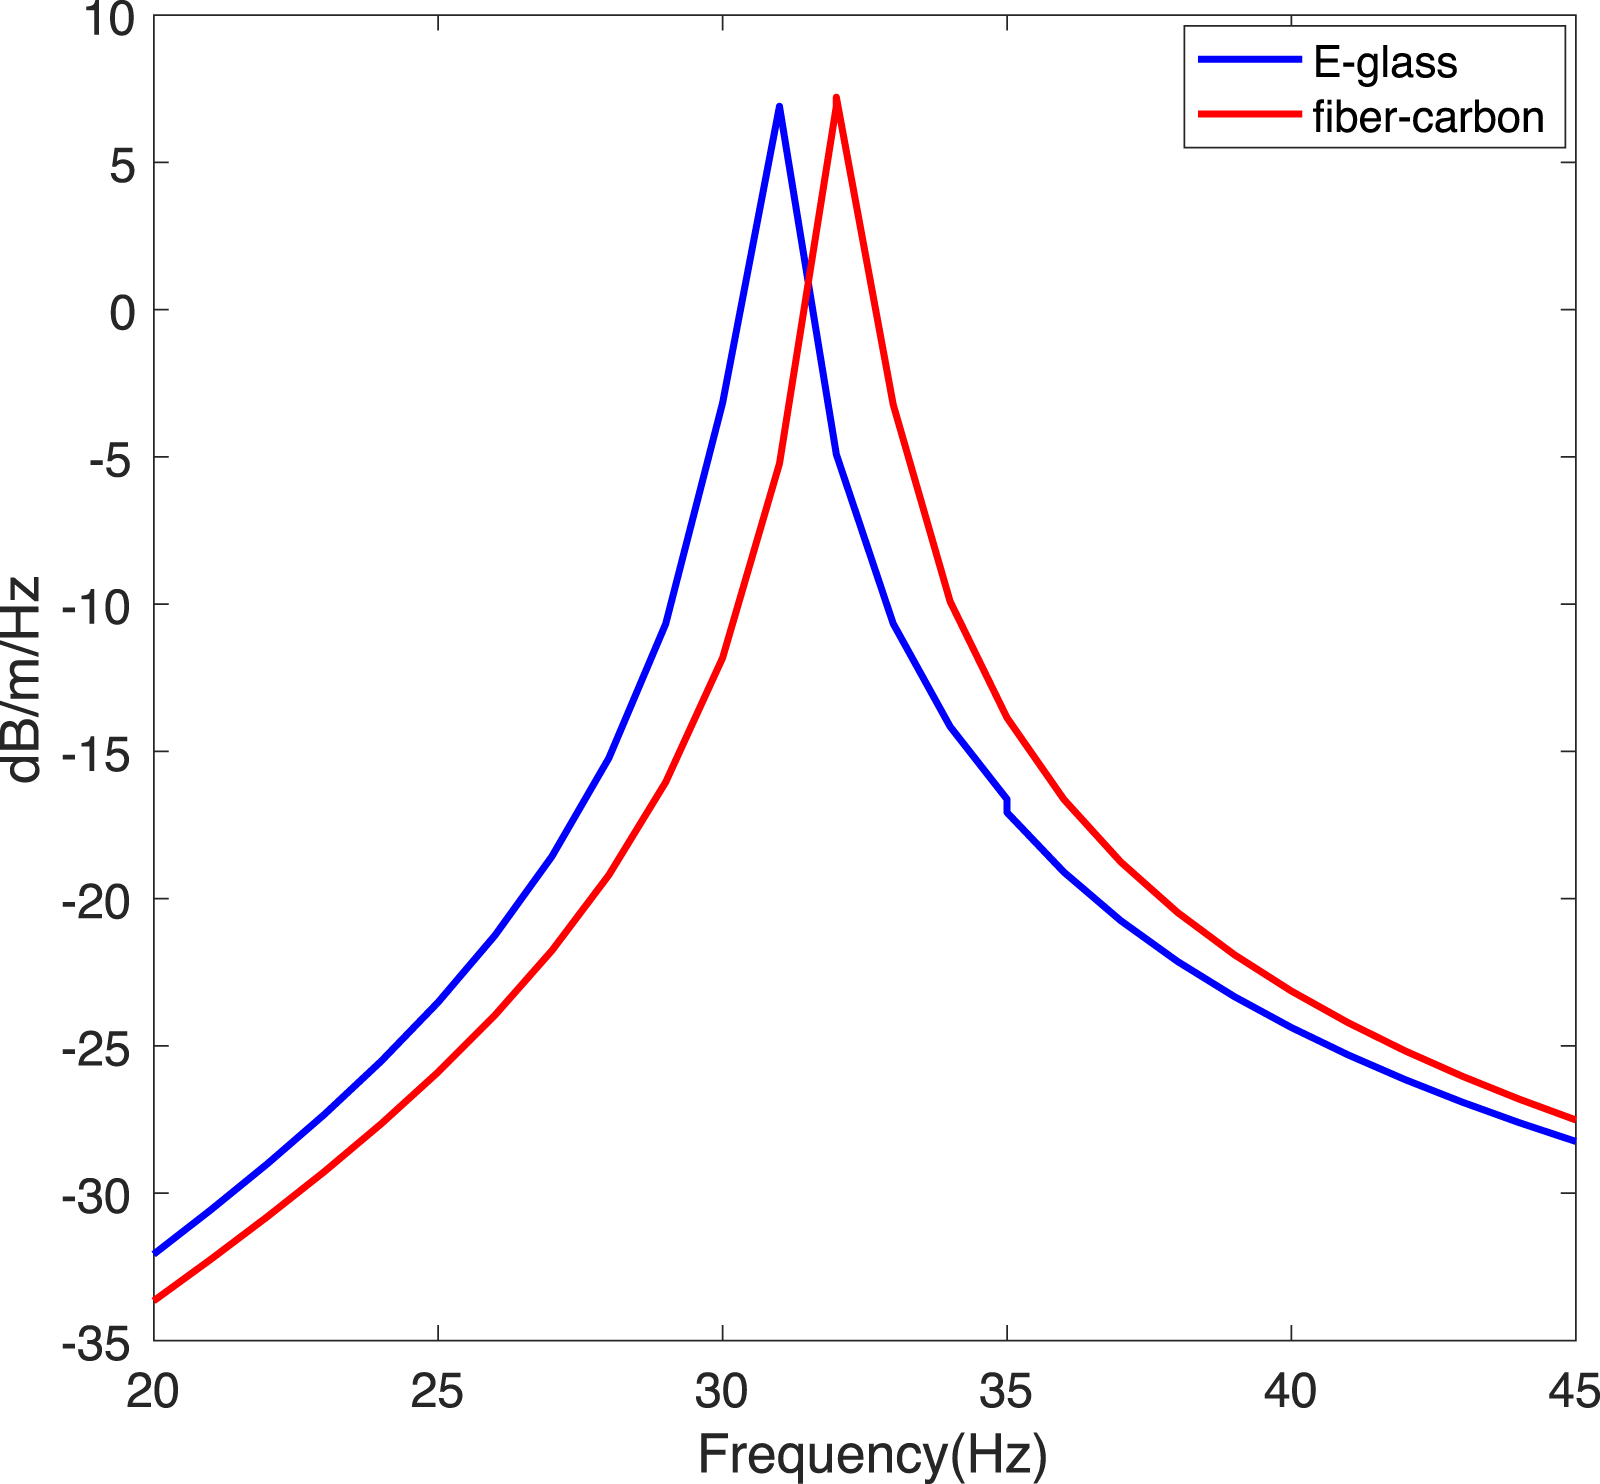
Conclusion
The influences of the size and location of MR-fluid segments on random vibration characteristics of MR-laminated beams have been investigated. An N-layer model of layerwise theory (LWT) developed by the present authors in previous work is considered for computation purposes. A finite element model based on LWT is developed to study the numerical examples. The results of the LWT have been compared with the first-order shear deformation theory (FSDT). To justify the numerical results, the first three natural frequencies of a laminated beam without an MR fluid layer (section) are solved using a 3D model in COMSOL software which shows a close match with the results of LWT. An in-house experimental setup has been developed to illustrate the effects of MR fluid on the dynamic behavior of the structure and to validate the simulation results. Six different configurations have been provided to study different arrangements of MR segments. The dynamic responses of all configurations have been studied by applying different magnetic fields under random loading. It has been concluded that the natural frequencies of configuration F, with more composite segments, are higher than other configurations. To show the effects of MR fluid thickness in dynamic response, four different patterns have been presented. It was realized that pattern P2, in which the ratio of composite to MR is two, provides a higher natural frequency than the other patterns. The results also show that the natural frequencies of fiber-carbon of MR-laminated beams are higher than in E-glass material.
Furthermore, the influences of statistical properties, correlation, and autocorrelation of different configurations of MR-laminated beams by applying magnetic fields up to 2,100 Gauss have been investigated. For clamped-free and simply supported boundary conditions, by applying a magnetic field, the amounts of statistical properties have been increased. However, for MR-laminated beams made of fiber carbon, the statistical properties approximately have been improved. In addition, the correlation coefficients of simply supported beams are higher than that of the clamped-free beam. It is observed that the statistical properties of configuration F for both materials are higher than other configurations.
Similarly, configuration F provided the lowest peak amplitude in autocorrelation. The study deals with the frequency response domain by applying a narrow-band process, especially for wind turbine blade applications. The PSD of the displacement response of configuration F subjected to a known PSD of the excitation is discussed. Using MR layers (sections) in wind turbine blades may improve the damping characteristics of the blades while keeping the stiffness and natural frequency of the blade at a stable range.
Footnotes
Declaration of conflicting interests
The author(s) declared no potential conflicts of interest with respect to the research, authorship, and/or publication of this article.
Funding
The author(s) received no financial support for the research, authorship, and/or publication of this article.
Appendix
Table A1 shows that the natural frequencies of different configurations of MR-laminated beams in LWT and FSDT in clamped-free and simply supported boundary conditions.
Comparison of natural frequencies (HZ) of different configurations of MR-laminated beams in LWT and FSDT with Clamped-free (CF) and Simply Supported (SS) conditions by applying different magnetic field (The values in parentheses are obtained from FSDT).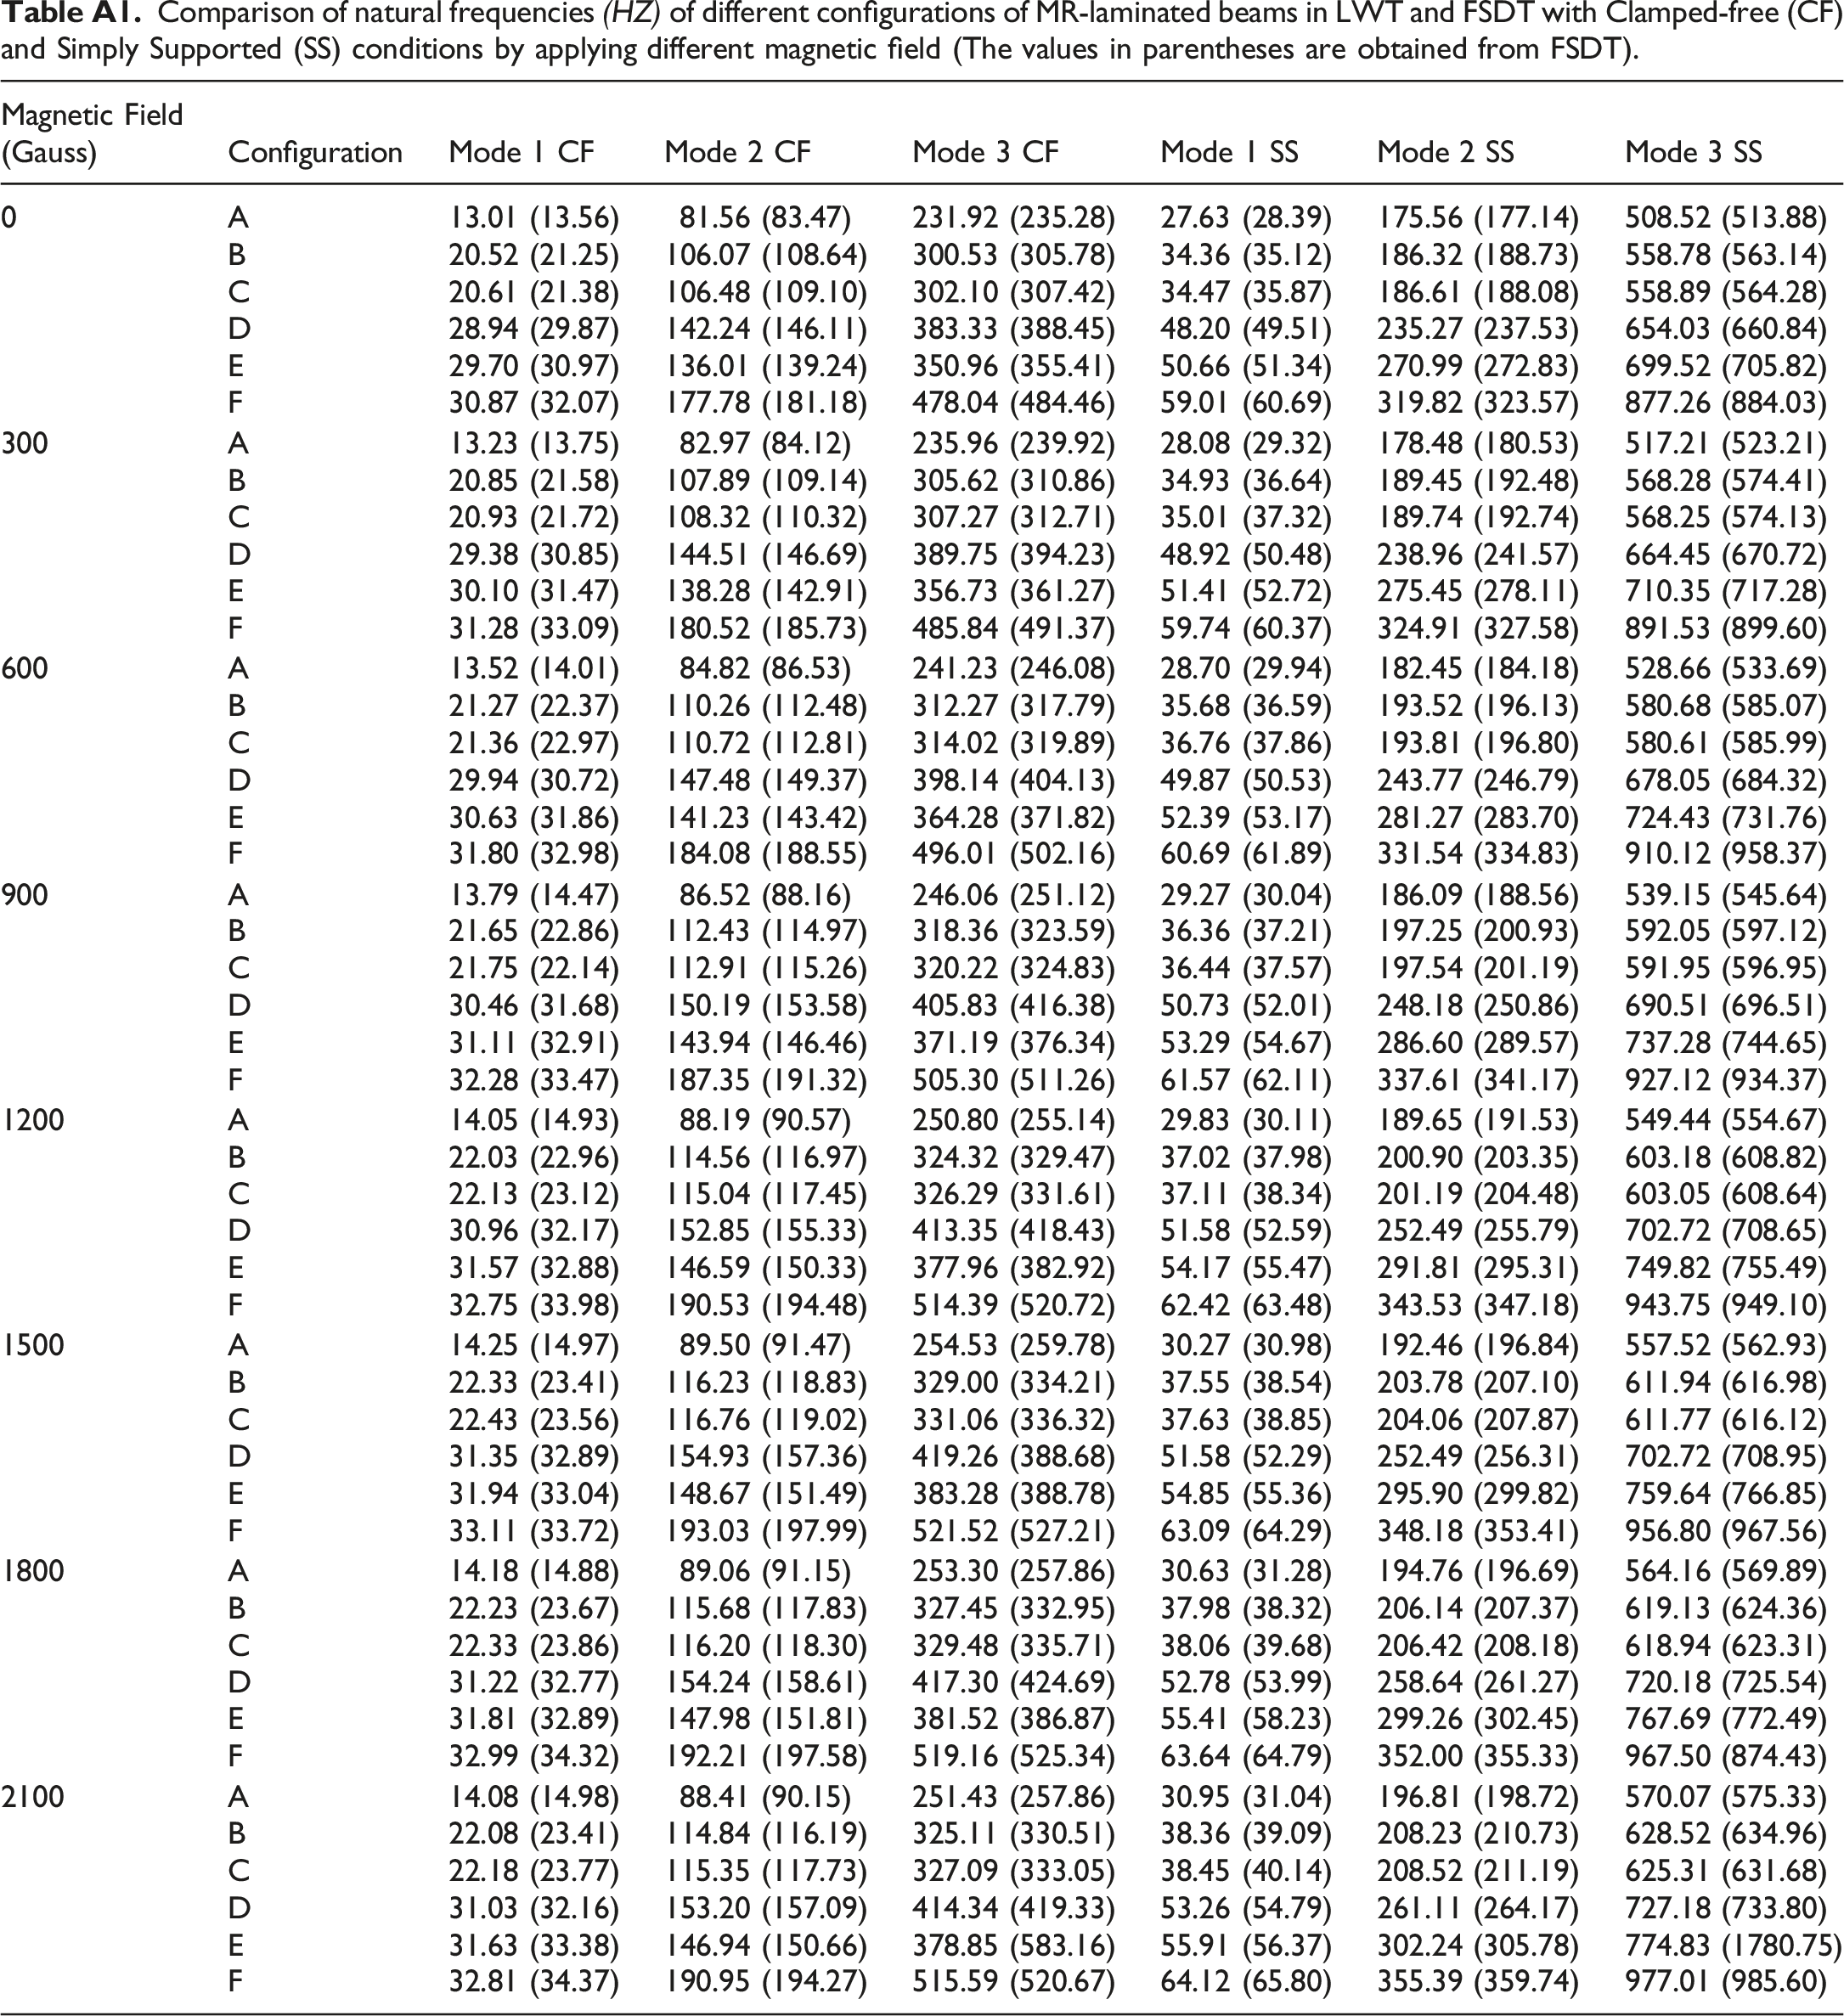
Magnetic Field (Gauss)
Configuration
Mode 1 CF
Mode 2 CF
Mode 3 CF
Mode 1 SS
Mode 2 SS
Mode 3 SS
0
A
13.01 (13.56)
81.56 (83.47)
231.92 (235.28)
27.63 (28.39)
175.56 (177.14)
508.52 (513.88)
B
20.52 (21.25)
106.07 (108.64)
300.53 (305.78)
34.36 (35.12)
186.32 (188.73)
558.78 (563.14)
C
20.61 (21.38)
106.48 (109.10)
302.10 (307.42)
34.47 (35.87)
186.61 (188.08)
558.89 (564.28)
D
28.94 (29.87)
142.24 (146.11)
383.33 (388.45)
48.20 (49.51)
235.27 (237.53)
654.03 (660.84)
E
29.70 (30.97)
136.01 (139.24)
350.96 (355.41)
50.66 (51.34)
270.99 (272.83)
699.52 (705.82)
F
30.87 (32.07)
177.78 (181.18)
478.04 (484.46)
59.01 (60.69)
319.82 (323.57)
877.26 (884.03)
300
A
13.23 (13.75)
82.97 (84.12)
235.96 (239.92)
28.08 (29.32)
178.48 (180.53)
517.21 (523.21)
B
20.85 (21.58)
107.89 (109.14)
305.62 (310.86)
34.93 (36.64)
189.45 (192.48)
568.28 (574.41)
C
20.93 (21.72)
108.32 (110.32)
307.27 (312.71)
35.01 (37.32)
189.74 (192.74)
568.25 (574.13)
D
29.38 (30.85)
144.51 (146.69)
389.75 (394.23)
48.92 (50.48)
238.96 (241.57)
664.45 (670.72)
E
30.10 (31.47)
138.28 (142.91)
356.73 (361.27)
51.41 (52.72)
275.45 (278.11)
710.35 (717.28)
F
31.28 (33.09)
180.52 (185.73)
485.84 (491.37)
59.74 (60.37)
324.91 (327.58)
891.53 (899.60)
600
A
13.52 (14.01)
84.82 (86.53)
241.23 (246.08)
28.70 (29.94)
182.45 (184.18)
528.66 (533.69)
B
21.27 (22.37)
110.26 (112.48)
312.27 (317.79)
35.68 (36.59)
193.52 (196.13)
580.68 (585.07)
C
21.36 (22.97)
110.72 (112.81)
314.02 (319.89)
36.76 (37.86)
193.81 (196.80)
580.61 (585.99)
D
29.94 (30.72)
147.48 (149.37)
398.14 (404.13)
49.87 (50.53)
243.77 (246.79)
678.05 (684.32)
E
30.63 (31.86)
141.23 (143.42)
364.28 (371.82)
52.39 (53.17)
281.27 (283.70)
724.43 (731.76)
F
31.80 (32.98)
184.08 (188.55)
496.01 (502.16)
60.69 (61.89)
331.54 (334.83)
910.12 (958.37)
900
A
13.79 (14.47)
86.52 (88.16)
246.06 (251.12)
29.27 (30.04)
186.09 (188.56)
539.15 (545.64)
B
21.65 (22.86)
112.43 (114.97)
318.36 (323.59)
36.36 (37.21)
197.25 (200.93)
592.05 (597.12)
C
21.75 (22.14)
112.91 (115.26)
320.22 (324.83)
36.44 (37.57)
197.54 (201.19)
591.95 (596.95)
D
30.46 (31.68)
150.19 (153.58)
405.83 (416.38)
50.73 (52.01)
248.18 (250.86)
690.51 (696.51)
E
31.11 (32.91)
143.94 (146.46)
371.19 (376.34)
53.29 (54.67)
286.60 (289.57)
737.28 (744.65)
F
32.28 (33.47)
187.35 (191.32)
505.30 (511.26)
61.57 (62.11)
337.61 (341.17)
927.12 (934.37)
1200
A
14.05 (14.93)
88.19 (90.57)
250.80 (255.14)
29.83 (30.11)
189.65 (191.53)
549.44 (554.67)
B
22.03 (22.96)
114.56 (116.97)
324.32 (329.47)
37.02 (37.98)
200.90 (203.35)
603.18 (608.82)
C
22.13 (23.12)
115.04 (117.45)
326.29 (331.61)
37.11 (38.34)
201.19 (204.48)
603.05 (608.64)
D
30.96 (32.17)
152.85 (155.33)
413.35 (418.43)
51.58 (52.59)
252.49 (255.79)
702.72 (708.65)
E
31.57 (32.88)
146.59 (150.33)
377.96 (382.92)
54.17 (55.47)
291.81 (295.31)
749.82 (755.49)
F
32.75 (33.98)
190.53 (194.48)
514.39 (520.72)
62.42 (63.48)
343.53 (347.18)
943.75 (949.10)
1500
A
14.25 (14.97)
89.50 (91.47)
254.53 (259.78)
30.27 (30.98)
192.46 (196.84)
557.52 (562.93)
B
22.33 (23.41)
116.23 (118.83)
329.00 (334.21)
37.55 (38.54)
203.78 (207.10)
611.94 (616.98)
C
22.43 (23.56)
116.76 (119.02)
331.06 (336.32)
37.63 (38.85)
204.06 (207.87)
611.77 (616.12)
D
31.35 (32.89)
154.93 (157.36)
419.26 (388.68)
51.58 (52.29)
252.49 (256.31)
702.72 (708.95)
E
31.94 (33.04)
148.67 (151.49)
383.28 (388.78)
54.85 (55.36)
295.90 (299.82)
759.64 (766.85)
F
33.11 (33.72)
193.03 (197.99)
521.52 (527.21)
63.09 (64.29)
348.18 (353.41)
956.80 (967.56)
1800
A
14.18 (14.88)
89.06 (91.15)
253.30 (257.86)
30.63 (31.28)
194.76 (196.69)
564.16 (569.89)
B
22.23 (23.67)
115.68 (117.83)
327.45 (332.95)
37.98 (38.32)
206.14 (207.37)
619.13 (624.36)
C
22.33 (23.86)
116.20 (118.30)
329.48 (335.71)
38.06 (39.68)
206.42 (208.18)
618.94 (623.31)
D
31.22 (32.77)
154.24 (158.61)
417.30 (424.69)
52.78 (53.99)
258.64 (261.27)
720.18 (725.54)
E
31.81 (32.89)
147.98 (151.81)
381.52 (386.87)
55.41 (58.23)
299.26 (302.45)
767.69 (772.49)
F
32.99 (34.32)
192.21 (197.58)
519.16 (525.34)
63.64 (64.79)
352.00 (355.33)
967.50 (874.43)
2100
A
14.08 (14.98)
88.41 (90.15)
251.43 (257.86)
30.95 (31.04)
196.81 (198.72)
570.07 (575.33)
B
22.08 (23.41)
114.84 (116.19)
325.11 (330.51)
38.36 (39.09)
208.23 (210.73)
628.52 (634.96)
C
22.18 (23.77)
115.35 (117.73)
327.09 (333.05)
38.45 (40.14)
208.52 (211.19)
625.31 (631.68)
D
31.03 (32.16)
153.20 (157.09)
414.34 (419.33)
53.26 (54.79)
261.11 (264.17)
727.18 (733.80)
E
31.63 (33.38)
146.94 (150.66)
378.85 (583.16)
55.91 (56.37)
302.24 (305.78)
774.83 (1780.75)
F
32.81 (34.37)
190.95 (194.27)
515.59 (520.67)
64.12 (65.80)
355.39 (359.74)
977.01 (985.60)
The correlation coefficients of different configurations of MR-laminated beams are shown in Table A2.
The correlation coefficient of different configurations of MR-laminated beam with Clamped-free(CF)and Simply Supported (SS) boundary conditions by applying magnetic fields (The values in parenthesis are obtained from fiber-carbon material).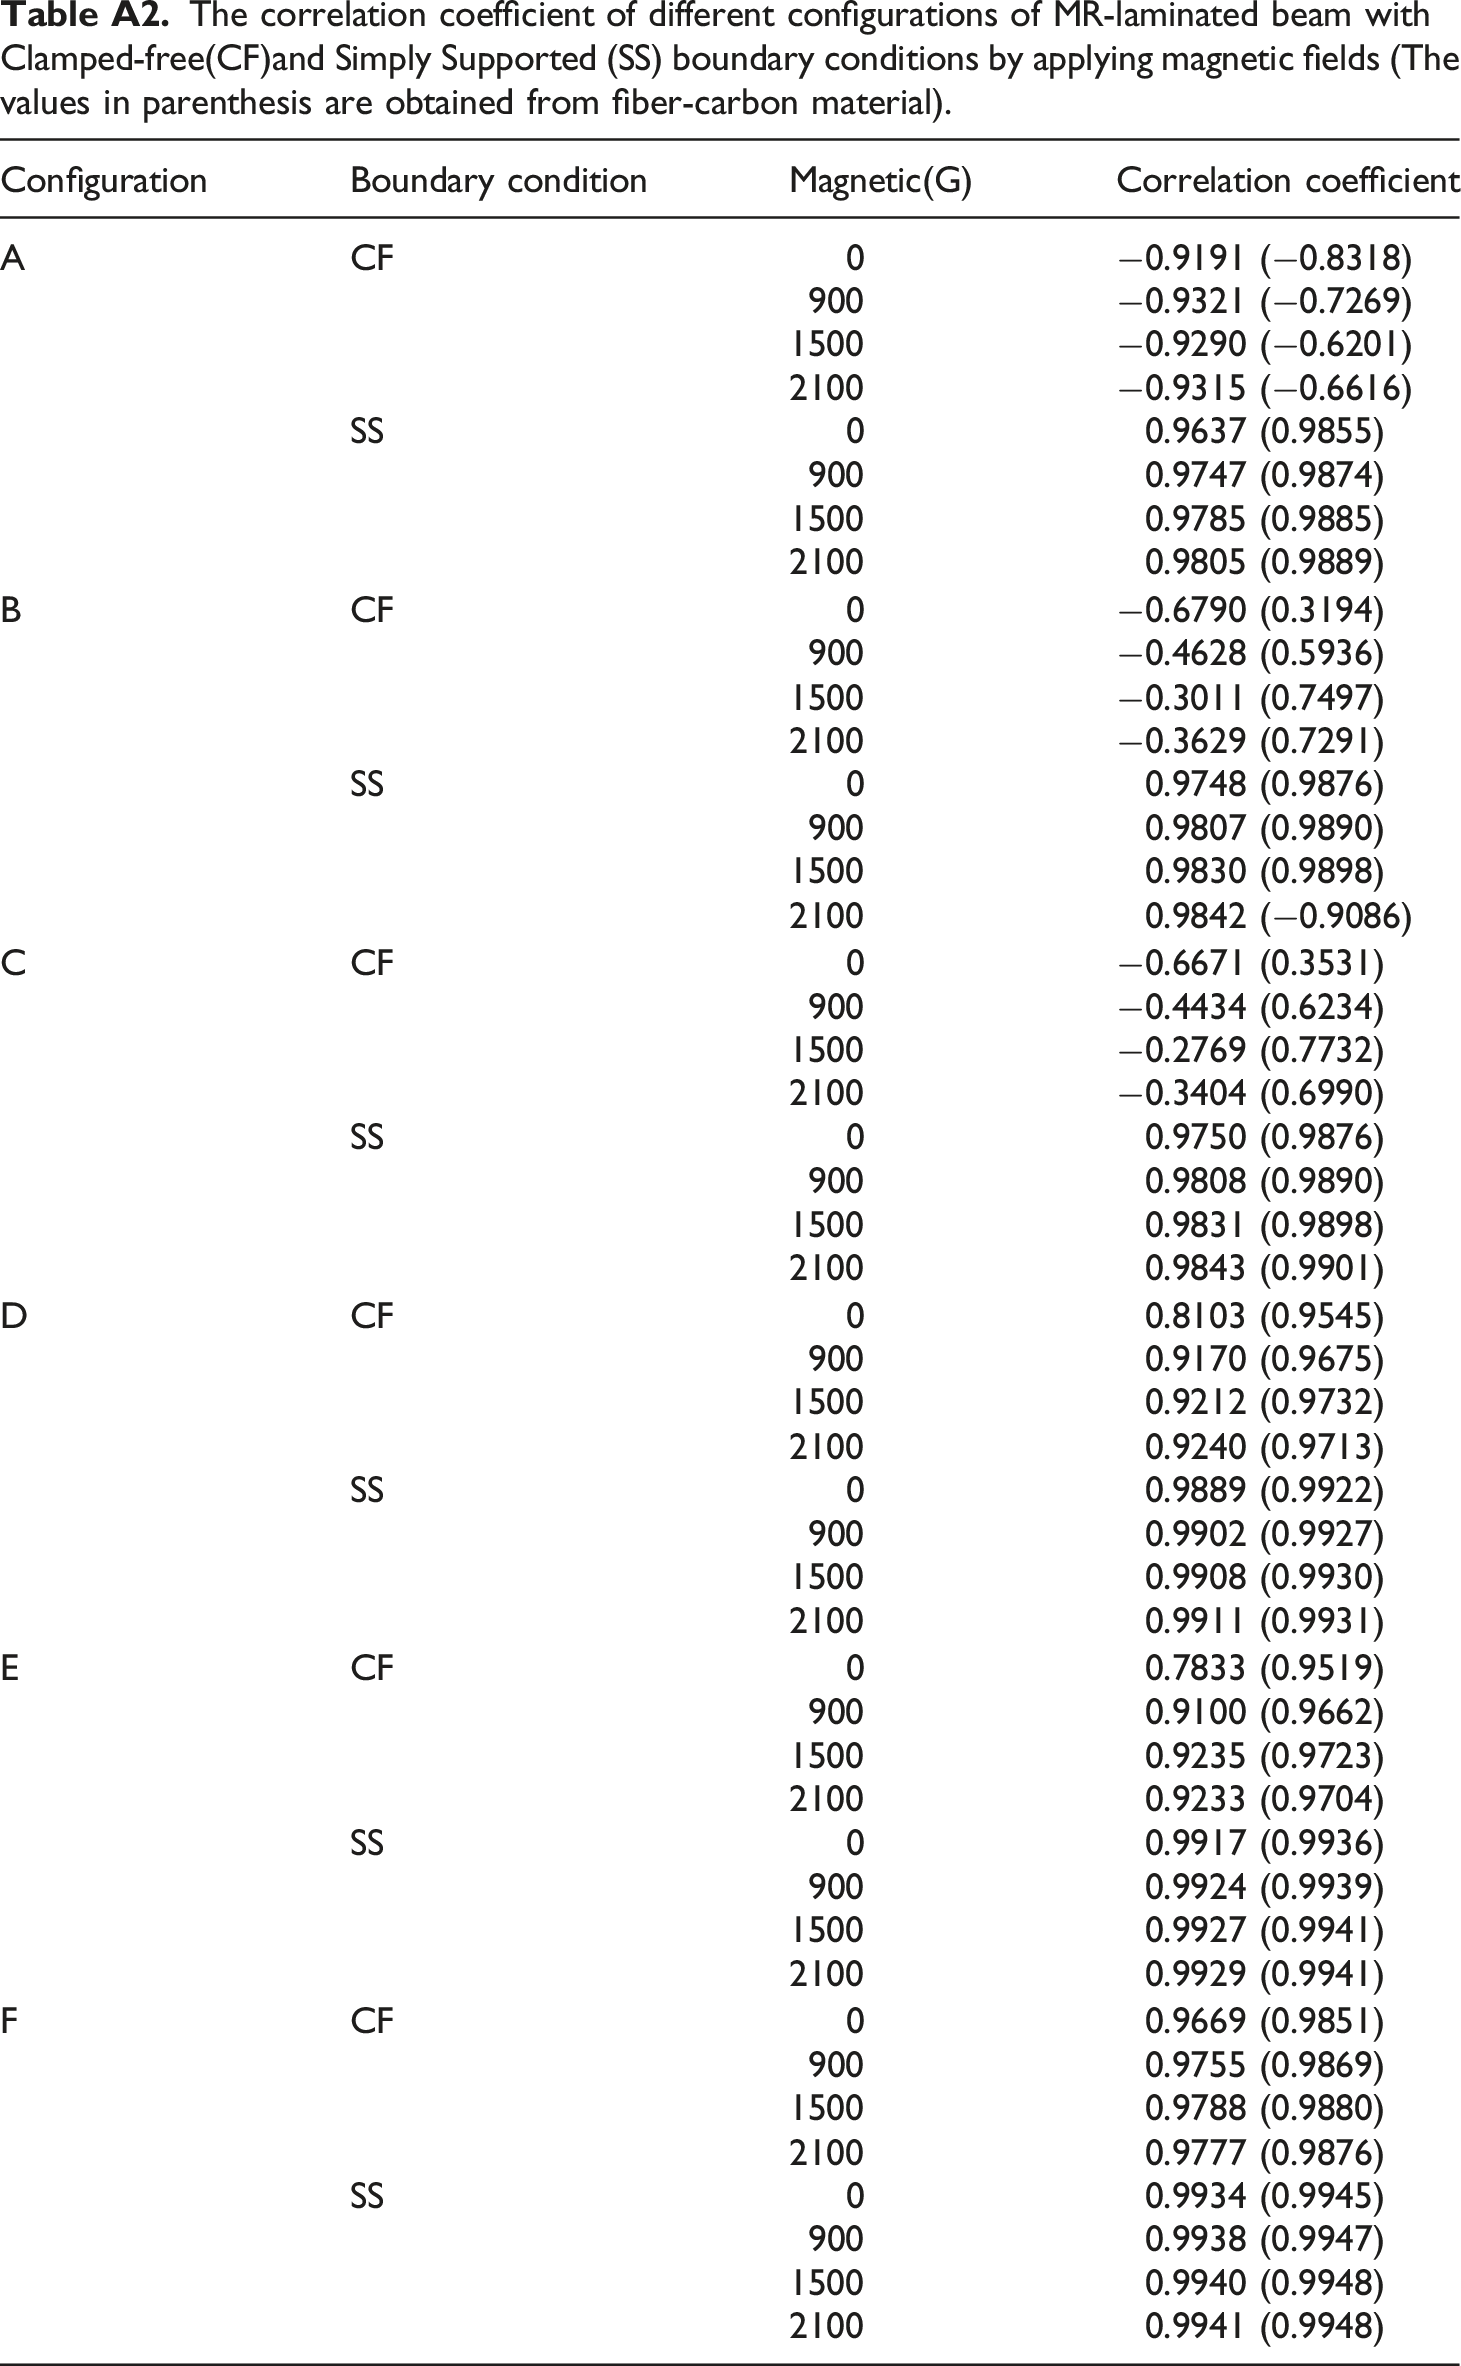
Configuration
Boundary condition
Magnetic(G)
Correlation coefficient
A
CF
0
−0.9191 (−0.8318)
900
−0.9321 (−0.7269)
1500
−0.9290 (−0.6201)
2100
−0.9315 (−0.6616)
SS
0
0.9637 (0.9855)
900
0.9747 (0.9874)
1500
0.9785 (0.9885)
2100
0.9805 (0.9889)
B
CF
0
−0.6790 (0.3194)
900
−0.4628 (0.5936)
1500
−0.3011 (0.7497)
2100
−0.3629 (0.7291)
SS
0
0.9748 (0.9876)
900
0.9807 (0.9890)
1500
0.9830 (0.9898)
2100
0.9842 (−0.9086)
C
CF
0
−0.6671 (0.3531)
900
−0.4434 (0.6234)
1500
−0.2769 (0.7732)
2100
−0.3404 (0.6990)
SS
0
0.9750 (0.9876)
900
0.9808 (0.9890)
1500
0.9831 (0.9898)
2100
0.9843 (0.9901)
D
CF
0
0.8103 (0.9545)
900
0.9170 (0.9675)
1500
0.9212 (0.9732)
2100
0.9240 (0.9713)
SS
0
0.9889 (0.9922)
900
0.9902 (0.9927)
1500
0.9908 (0.9930)
2100
0.9911 (0.9931)
E
CF
0
0.7833 (0.9519)
900
0.9100 (0.9662)
1500
0.9235 (0.9723)
2100
0.9233 (0.9704)
SS
0
0.9917 (0.9936)
900
0.9924 (0.9939)
1500
0.9927 (0.9941)
2100
0.9929 (0.9941)
F
CF
0
0.9669 (0.9851)
900
0.9755 (0.9869)
1500
0.9788 (0.9880)
2100
0.9777 (0.9876)
SS
0
0.9934 (0.9945)
900
0.9938 (0.9947)
1500
0.9940 (0.9948)
2100
0.9941 (0.9948)
Typical properties of MR fluid (MRF-132DG) manufactured by Lord are shown in Table A3.
Typical properties of MR fluid (MRF-132DG).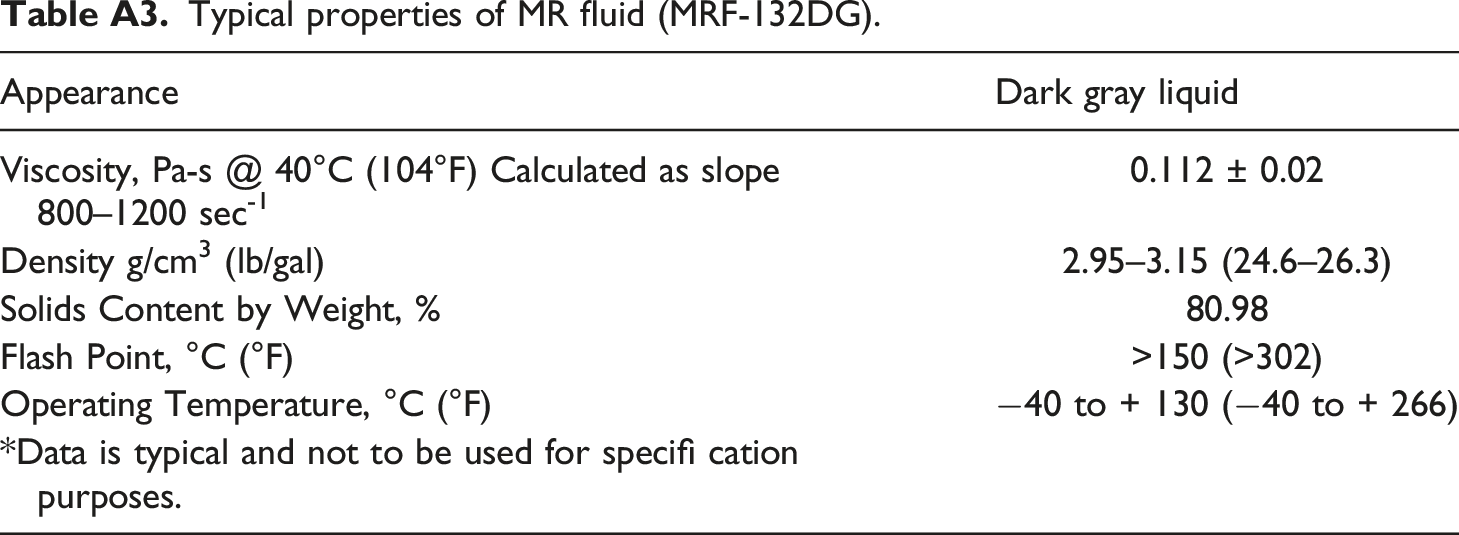
Appearance
Dark gray liquid
Viscosity, Pa-s @ 40°C (104°F) Calculated as slope 800–1200 sec-1
0.112 ± 0.02
Density g/cm3 (lb/gal)
2.95–3.15 (24.6–26.3)
Solids Content by Weight, %
80.98
Flash Point, °C (°F)
>150 (>302)
Operating Temperature, °C (°F)
−40 to + 130 (−40 to + 266)
*Data is typical and not to be used for specifi cation purposes.
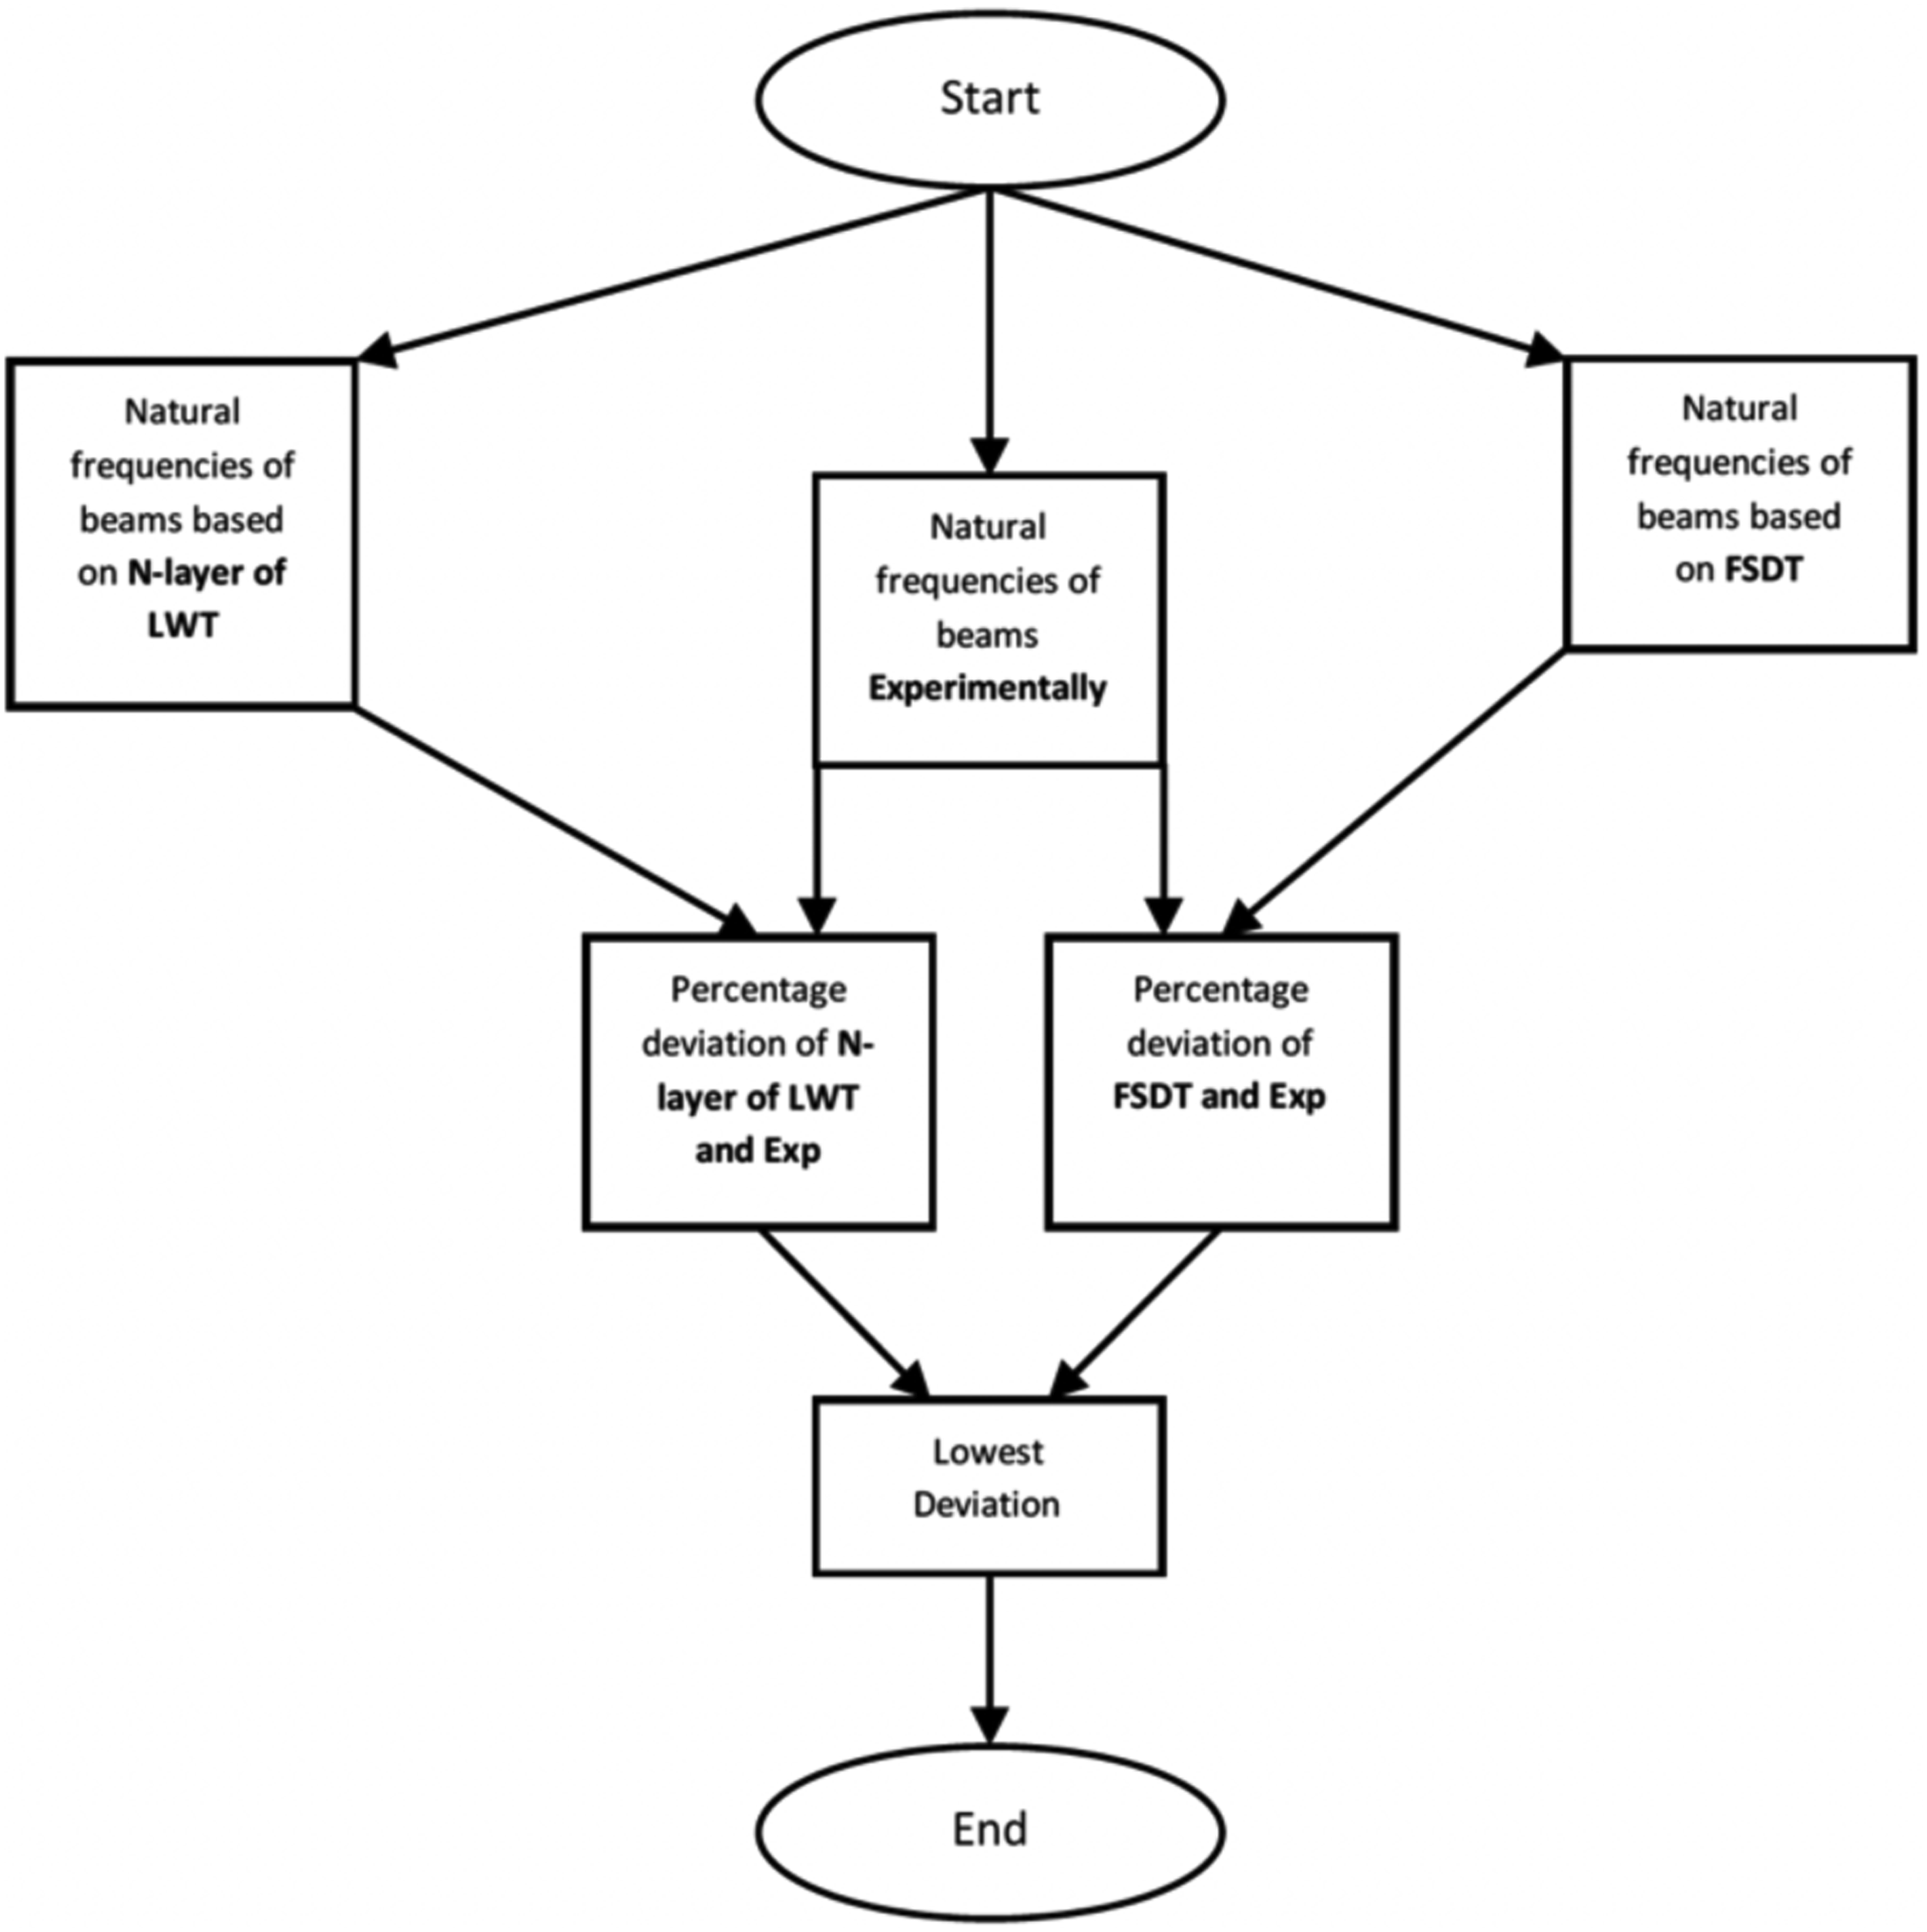
The flow chart for determining the theory of composite beam incorporated with MR fluid.