
Abstract
The objective is focusing on the prediction of dielectric properties of the polypropylene composites reinforced with banana fiber using an Artificial Neural Network (ANN). To prepare the composites in accordance with ASTM requirements, randomly oriented banana fibers were combined with polypropylene at volume fractions of 20%, 30%, 40%, and 50%. For these composites, the impedance analyzer was used to determine dielectric characteristics such as the dielectric constant, tan δ, and ac conductivity. To estimate the dielectric properties, an artificial neural network is used with a supervised training strategy. The data set was assembled using ReLU, sigmoid, and tanh, three activation functions. Forecasting the outcome variables used temperature, frequency, filler content, and polymer content as input factors. Comparing the model utilizing ReLU to the other two activation functions, the MSE value was 0.32, and the R2 value was 0.98. Dielectric parameter values from both experiments and ANN modeling show a similar pattern. The dielectric properties of fiber-reinforced polyester matrix composites can be accurately predicted using ANN, reducing the need for manual intervention.
Introduction
Biomaterials are increasingly being used in the manufacturing of polymer composites nowadays. The preference for plant resources and recycling goods helps the ecologically and economically friendly manufacture of composites. The term “composite material” refers to materials that have two or more physically separate phases. In reinforced plastic composites, biomass particles from forestry or agriculture have been employed as fillers. Due to their bio-degradability and various benefits, the perspective of both environmental and economic concerns, polymer composites manufactured from bio-resources are obtaining favor. 1 The development of recycling techniques and the evaluation of waste biomass will be aided by the manufacture of bio-composite materials from renewable vegetable sources and the inclusion of ligno-cellulosic fibers into polymers. 2 Bio-composites made from natural fibers have a low density, are ecologically benign, cost-effective, and have high mechanical strength. In the construction business, the usage of natural fiber-reinforced bio-composites, particularly as building materials, is becoming more prevalent. 3
Banana fiber is used as a reinforcement in polypropylene composite materials to improve their dielectric characteristics. In the insulating application, this composite material will be employed. The material designer should accomplish a set of dielectric characteristics that are appropriate for the targeted use. This work is finding the effective relationship by doing multiple experiments on random samples. The fiber quantity of samples varies, and product designers aim to determine the best dielectric properties for some sample such as dielectric constant, tangent loss, and AC conductivity. The fundamental difficulty is the nonlinearity of the interaction between the dielectric parameters under consideration. To increase the adhesion between the filler (banana fiber) and polypropylene (matrix), a coupling agent malic anhydride grafted polypropylene (MAPP) is incorporated with small quantity. 4 The effect of the temperature, frequency, and filler concentration on the dielectric properties of BF/PP composite such as dielectric constant, tangent loss, and AC conductivity is studied based on ANN. A twin-screw extruder apparatus was employed to make the BF/PP composite specimens. Using an impedance analyzer, the experimental values of dielectric constant, tangent loss, and AC conductivity were determined for different fiber concentrations. 5 The obtained experimental data was utilized to predict the dielectric properties using ANN.
The Artificial Neural Network (ANN) model can learn both linear and non-linear correlations between process parameters and outputs, it is appropriate for an extensive variety of engineering challenges. Natural fiber and composite property ANN modeling aid in making rapid and accurate predictions based on a variety of criteria. It is been used to simulate the dielectric characteristics of polypropylene composites reinforced with lignocellulosic fibers 6 and. 7 An artificial neural network (ANN) is a computational model inspired by the brain’s central nervous system that can learn and detect patterns and use empirical models to generate predictions. 8 The electrical properties are modeled using the relationship between natural fiber, polypropylene, temperature, and frequency. The number of hidden layers and training repetitions are raised to attain the best output with the least amount of error.
An ANN model with the optimal number of hidden layers can fulfill the estimation since the hidden layers are made up of neurons that will be instructed using suitable learning algorithms to get the necessary weight and activation function, which are the ANN model’s main components. The most critical aspect of building this model will be selecting its architecture as several hidden layers and neurons. Forward and backpropagation techniques in machine learning are often used to learn the values of the parameters. However, additional characteristics are known as hyper-parameters that are altered to improve the performance of the model. It’s essential to fine-tune these hyper-parameters so that the model can reliably answer the proper prediction.
9
To discover an appropriate design, we can utilize a hyperparameter tuning approach like a grid search in Tensor Flow. Figure 1 depicts the strategic processes involved in developing and testing the planned ANN models. The ANN learning algorithm will be trained using random sample experimental data for the different fiber content of composites to build a relationship between dielectric characteristics. This would enable designers to create intelligent product designs by removing the need for physical experimentation across all ranges studied. The proposed Analytical model is intended to estimate the optimal dielectric properties based on earlier experimental values, so that upcoming investigators can carefully develop their characterization methodology for justifying the aimed dielectric properties in accordance with product stipulations.
10
The experimental dataset was divided into three subgroups: learning, validating, and testing, using composite compositions as input components and electrical characteristics as output responses.
11
ANN modeling may be used to determine the proper weight percentage for obtaining desirable attributes, according to the findings. ANNs include data reduction and non-linear dynamic models, as well as adaptable non-linear regression and classifying models. General workflow of a machine learning algorithm.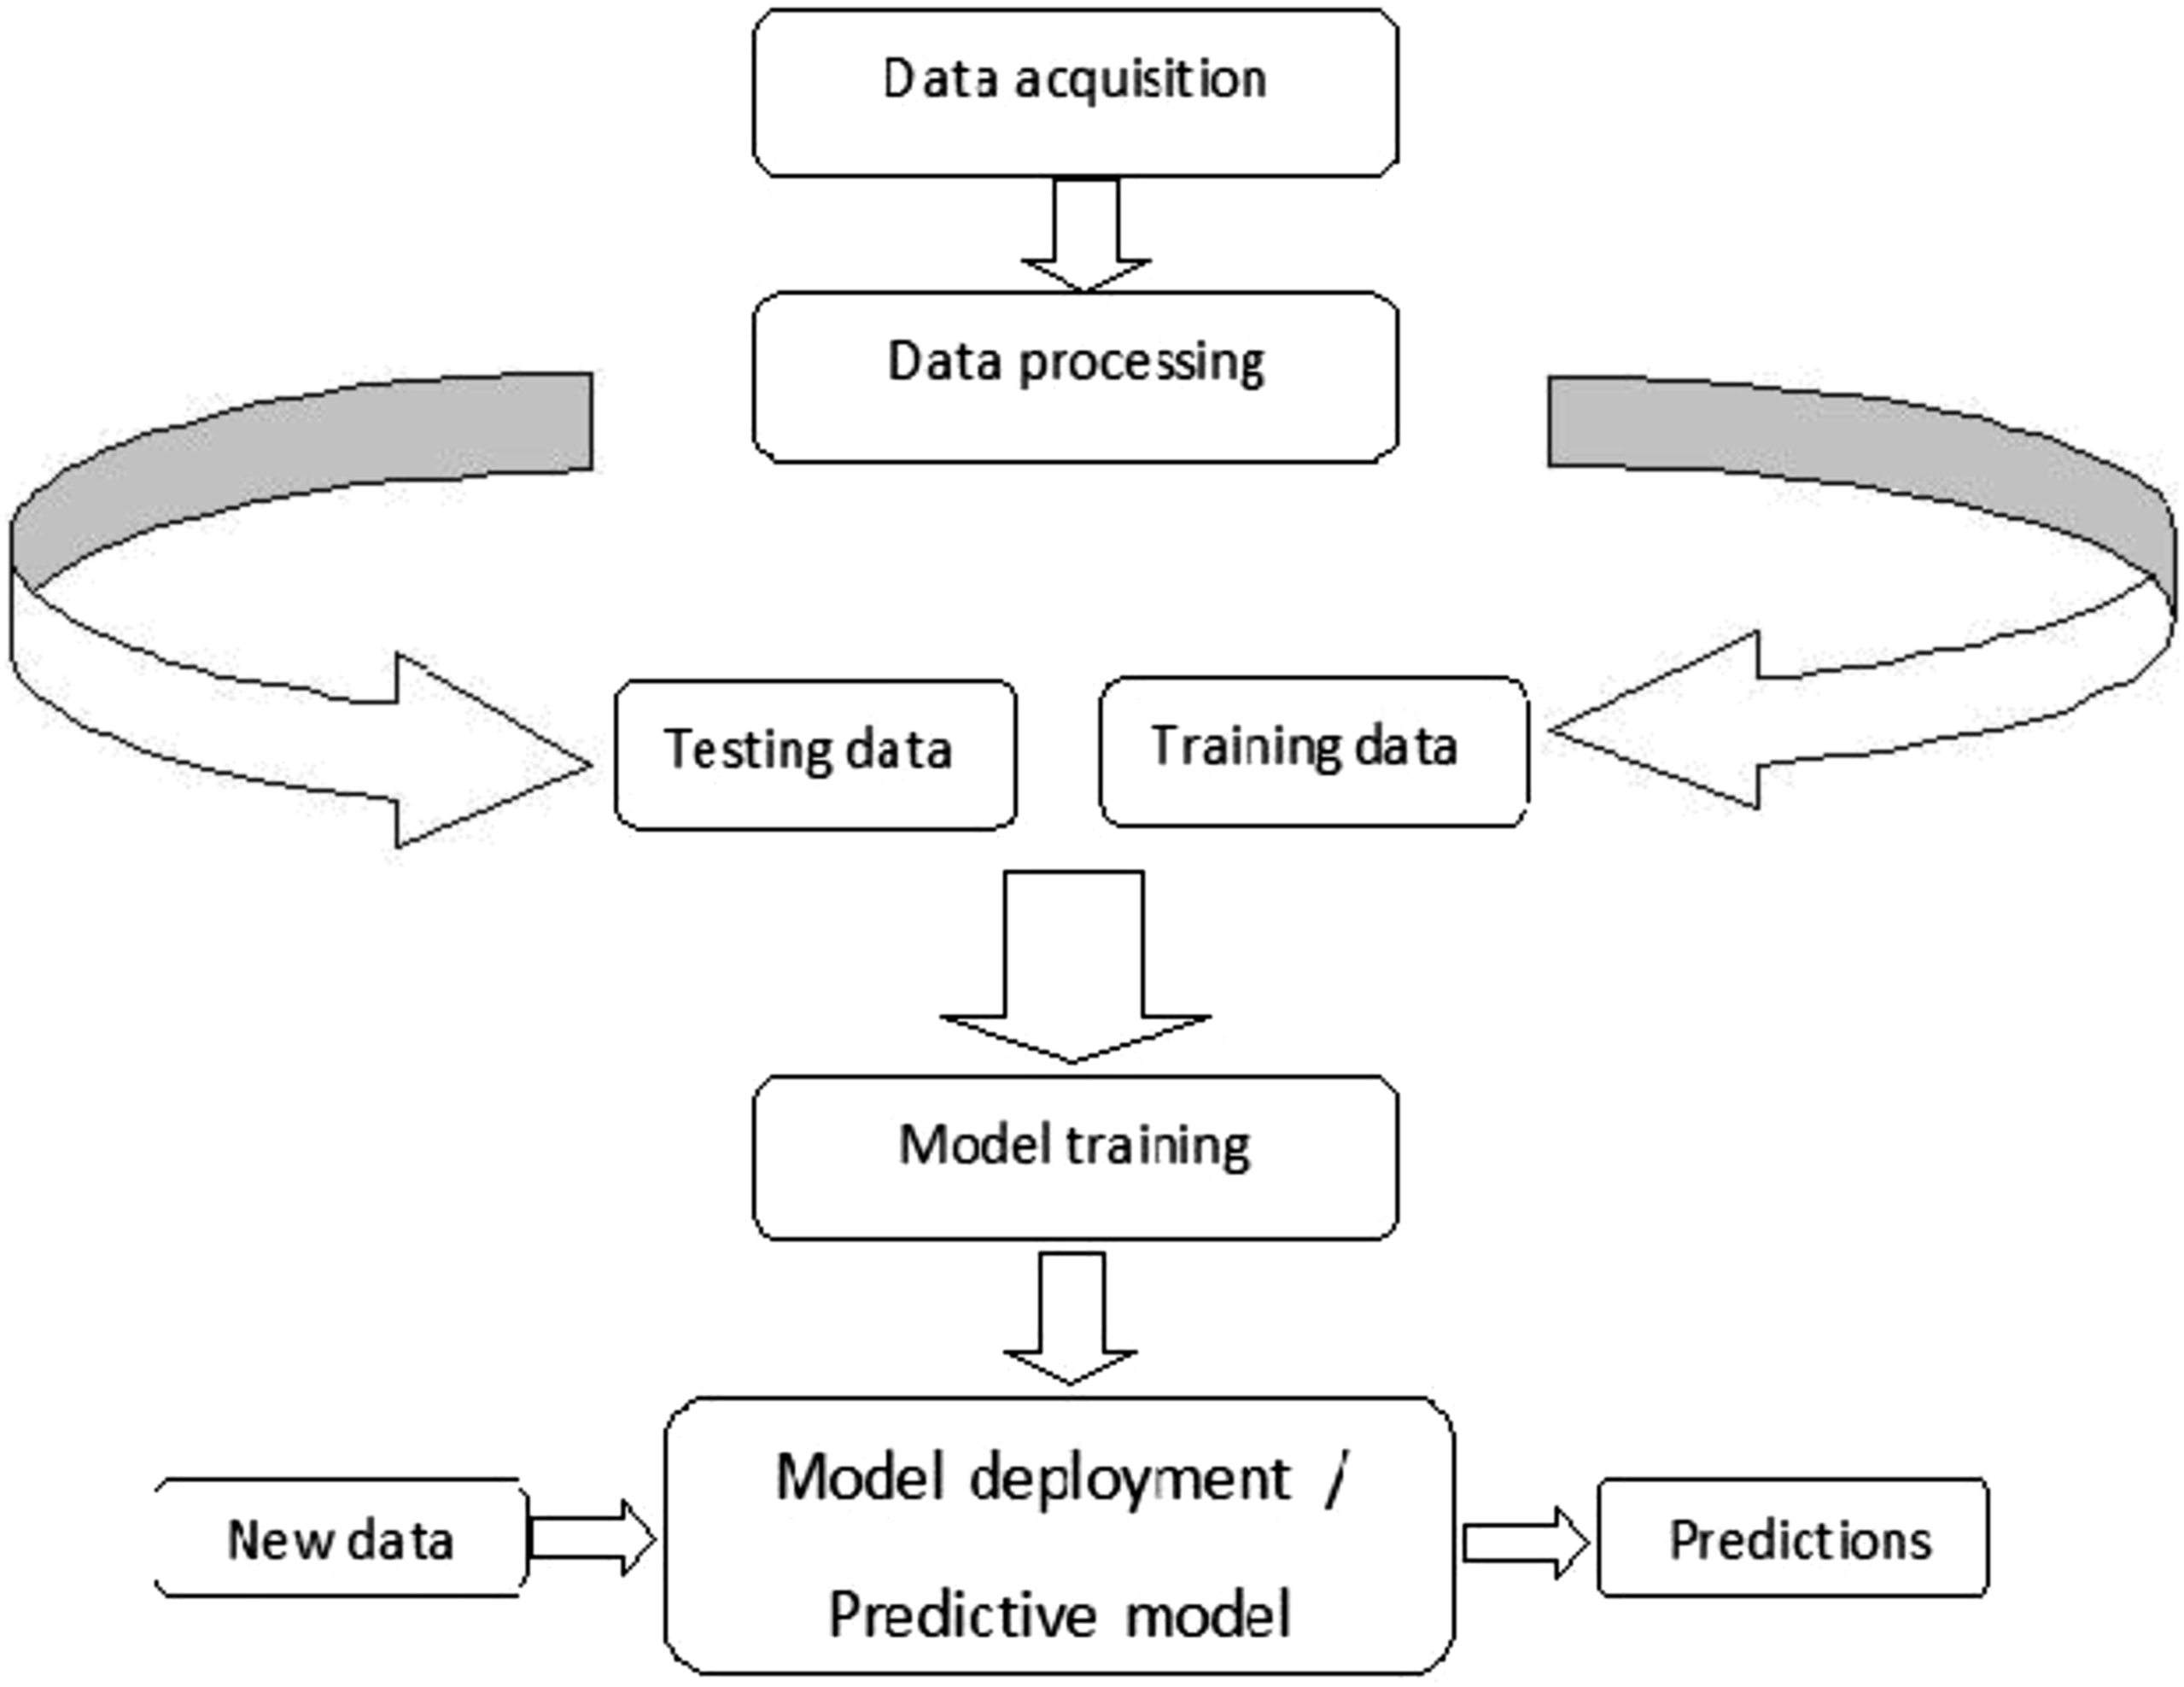
An activation function in a neural network defines how the weighted sum of the input is transformed into an output from a node or nodes in a layer of the network. All hidden layers typically use the same activation function. The output layer will typically use a different activation function from the hidden layers and is dependent upon the type of prediction required by the model. 12 A hidden layer in a neural network is a layer that receives input from another layer and provides output to another layer. Hidden layer doesn’t directly contact input data or produce output for a model, at least in general. In the hidden layers of a neural network, a differentiable non-linear activation function is typically applied. In comparison to a network trained using a linear activation function, the model can learn more complicated functions as a result. For use in hidden layers, there are three activation functions (1) ReLU, (2) Sigmoid, and (3) Hyperbolic Tangent (tan h).
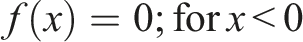
Perhaps the most often utilized function for hidden layers is the rectified linear activation function, or ReLU activation function. It is prominent because it is easy to use and successful in overcoming the drawbacks of other formerly well-liked activation functions, like Sigmoid and Tanh. Specifically, it is less susceptible to vanishing gradients that prevent deep models from being trained, although it can suffer from other problems like saturated or “dead” units. The ReLU function is calculated as follows: max (0.0, x). This means that if the input value (x) is negative, then a value 0.0 is returned, otherwise, the value is returned.
The logistic function is another name for the sigmoid activation function. The logistic regression classification approach uses the same function. The function outputs numbers between 0 and 1 and accepts any real value as input. The output value will be nearer to 1.0 the larger the input (more positive), and nearer to 0.0 the smaller the input (more negative). This is how the sigmoid activation function is calculated: 1.0/(1.0 + e^−x). Where e is a mathematical constant, which is the base of the natural logarithm. 13
The Tanh function (also “tanh” and “TanH”) is another name for the hyperbolic tangent activation function. It even shares the same S-shape with the sigmoid activation function. Any real value may be used as an input, and the function returns values between −1 and 1. The output value will be closer to 1.0 the larger the input (more positive), and the output will be closer to −1.0 the smaller the input (more negative). Tanh activation function is calculated as follows: (e^x – e^−x)/(e^x + e^−x). Where e is a mathematical constant that is the base of the natural logarithm.
The ANN model has more flexibility, fewer assumptions, non-destructive online measurement, and tolerance for incomplete or noisy data. When developing an ANN model, a variety of procedures are applied. Data collection, data processing, network design, training, model validation, and performance evaluation are the five basic phases in general. 14 The number of neurons in the input and output layers indicates the number of independent variables (input) and dependent variables (output). Artificial neural networks to offer a comprehensive technique for estimating the dielectric characteristics of banana fiber thermoplastic (PP) composites. The created predictive ANN model and approach will aid subsequent material designers who analyze banana fiber/PP composite materials for a variety of purposes. More precisely, the model will decrease material characterization testing effort. If the appropriate experimental data is provided, the suggested technique for the ANN model can be applied to different composite materials. Packaging, medications, automobile, construction, and housing are all sectors that use polymer composites produced from renewable resources.
Literature survey
Mechanical performance of banana fiber reinforced polypropylene composites were studied in detail. There is an enhancement in the tensile, flexural and impact strength of the composites as the filler content increases up to 50% fiber and polypropylene volume ratio. The interfacial adhesion also improved due to the incorporation of coupling agent MAPP in small quantity during the composite fabrication. 5
Dielectric parameters such as dielectric constant, tan δ and ac conductivity of banana fiber filled polypropylene composites with respect to temperature and frequency were examined using LCR Impedance analyzer. The experimental data set are noted and the same data were utilized for this study. 15 Response Surface Methodology (RSM) was designed to create a waste polyethylene terephthalate reinforced bio-composite and used ANN to assess the thermo-physical characteristics. The assessment and evaluation results of the empirically collected Bio-based Unsaturated Composites (BUP) are used to construct the input data in the ANN model, and the output values show how closely the ANN model results match the actual data. 1 Investigations on the water absorption behavior of plantain peel and bamboo fiber-filled polystyrene composites reached coefficient of determination (R2) values >0.98 during the training, validation, and testing stages. The model’s results also revealed low RMSE values. An ANN prediction model was more flexible and capable of displaying nonlinear relationships. Furthermore, the ideal condition for maximal flexural strength, displacement, and flexural modulus for the generated composite was a 2.074 %NaOH concentration with the dimension of fiber length. As a result, the ANN technique can be a useful strategy for predicting values in experimental investigations, thus saving time and money when conducting new tests. 16 The third, eighth, and fourteenth trials of Grey Relational Analysis (GRA) produced almost identical outcomes when compared to the ANN forecast. The graph between real GRA data and ANN calculated results showed a strong connection, demonstrating that topology for assessing mechanical strength parameters were successful with five variables, three hidden nodes, and one response. The composites produced can be employed in interior components of automobiles for low-mechanical applications. For improved applications, the optimal GRA combinations can be combined through a variety of bio and metal fillers. In the next model, fiber, yarn, and fabric qualities were used as input variables at varying moisture conditions. All these models had excellent forecasting power, according to the results. The regression coefficients of the first model’s anticipated (training and testing) and reported thermal resistance readings were 0.96 and 0.94, correspondingly. The regression coefficient (R2) of the estimated (training) and real thermal resistance readings of the second model for fully dry, at 25% moisture, at 50% moisture, at 75% moisture, and 100% moisture is 0.98, 0.98, 0.99, 0.99, and 0.99, accordingly. 17 The mechanical and thermal properties of bronze-filled polyamide 66 composites were estimated utilizing an artificial neural network. The stress-strain and expansion curves could be appropriately reconstructed by the trained network based on the performance plots and comparison between expected and actual values. It may be concluded that, even with minimal empirical data, the ANN is a trustworthy and effective tool for predicting different aspects of multicomponent systems. 18 Using an artificial neural network, the author evaluated the heat degradation of vegetable fibers based on kinetics factors. The thermo-gravimetric (TG) behavior of vegetable fibers was predicted using this method at various heating speeds. For the training data, a heating rate of 10°C min−1 was employed. The heating rates of 5, 20, and 40°degrees Celsius per minute were confirmed both experimentally and by the expected data. 19 The research demonstrates that for a more complicated non-linear connection between input and output, a higher number of training datasets is necessary, with the ideal number of training datasets for all investigated vegetable fibers being about 50–60. Any input data may be simply inserted in the trained ANN after it has been constructed, and the output can be generated suitably. The study on effect of recycled thermoplastic polyurethane (RTPU) on the Izod impact resistance of polypropylene (PP) compounds with 50% coconut fibers revealed that, the higher Izod impact resistance and a higher adhesion between long coconut fiber and PP when they contain 5% RTPU. 20 A review on natural fiber reinforced engineering plastic composites reported that even after recycling, engineering plastics properties are superior to those of commodity plastics, and thus, utilization of recycled engineering plastic in natural fiber reinforce polymer (NFRP) composites can help reduce waste and lower composite material costs. The aim of this review article is to explore the current status of engineering plastics reinforced with natural fibers. 21 The final concentration of cadmium in an electrochemical removal process is estimated by an artificial neural network (ANN) model. To validate the accuracy and the adaptability of the model proposed, statistical and linearity tests (slope-intercept) were performed. The best model was validated with a R2 value of 0.9850 and a MSE value of 0.00,166, besides approved linearity tests with 99% confidence. 22
Proposed methodology
In this research work we have used ANN to predict the dielectric properties such as dielectric constant, tan δ and AC conductivity of banana fiber reinforced with polypropylene composites.
Designing and optimizing prediction models
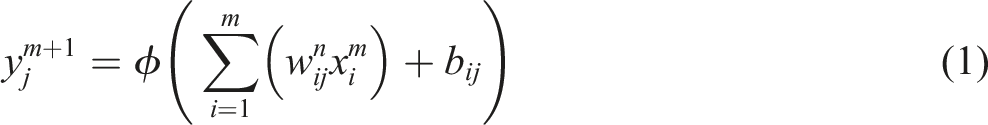
Output = activationdot(input, kernel) + bias
Figure 1 represents the ANN model with input and output layers. Input signifies the data input, activation indicates the object activation function that was successfully passed as the activation declaration, kernel denotes the layer’s weights matrix, dot symbolizes the NumPy dot product of all input and its corresponding weights, and bias conveys the component’s bias vector. Figure 2 indicates the structure of ANN model with input, hidden and output layers. The Keras-Dense layer, which employs TensorFlow as the backside, is used to create the ANN model.
8
The rectified linear unit (ReLU), sigmoid and tanh activation functions was used by the hidden layers in this case. These are the popular and reliable estimator that can activate all neurons at the same time. ANN model with input, hidden and output layers.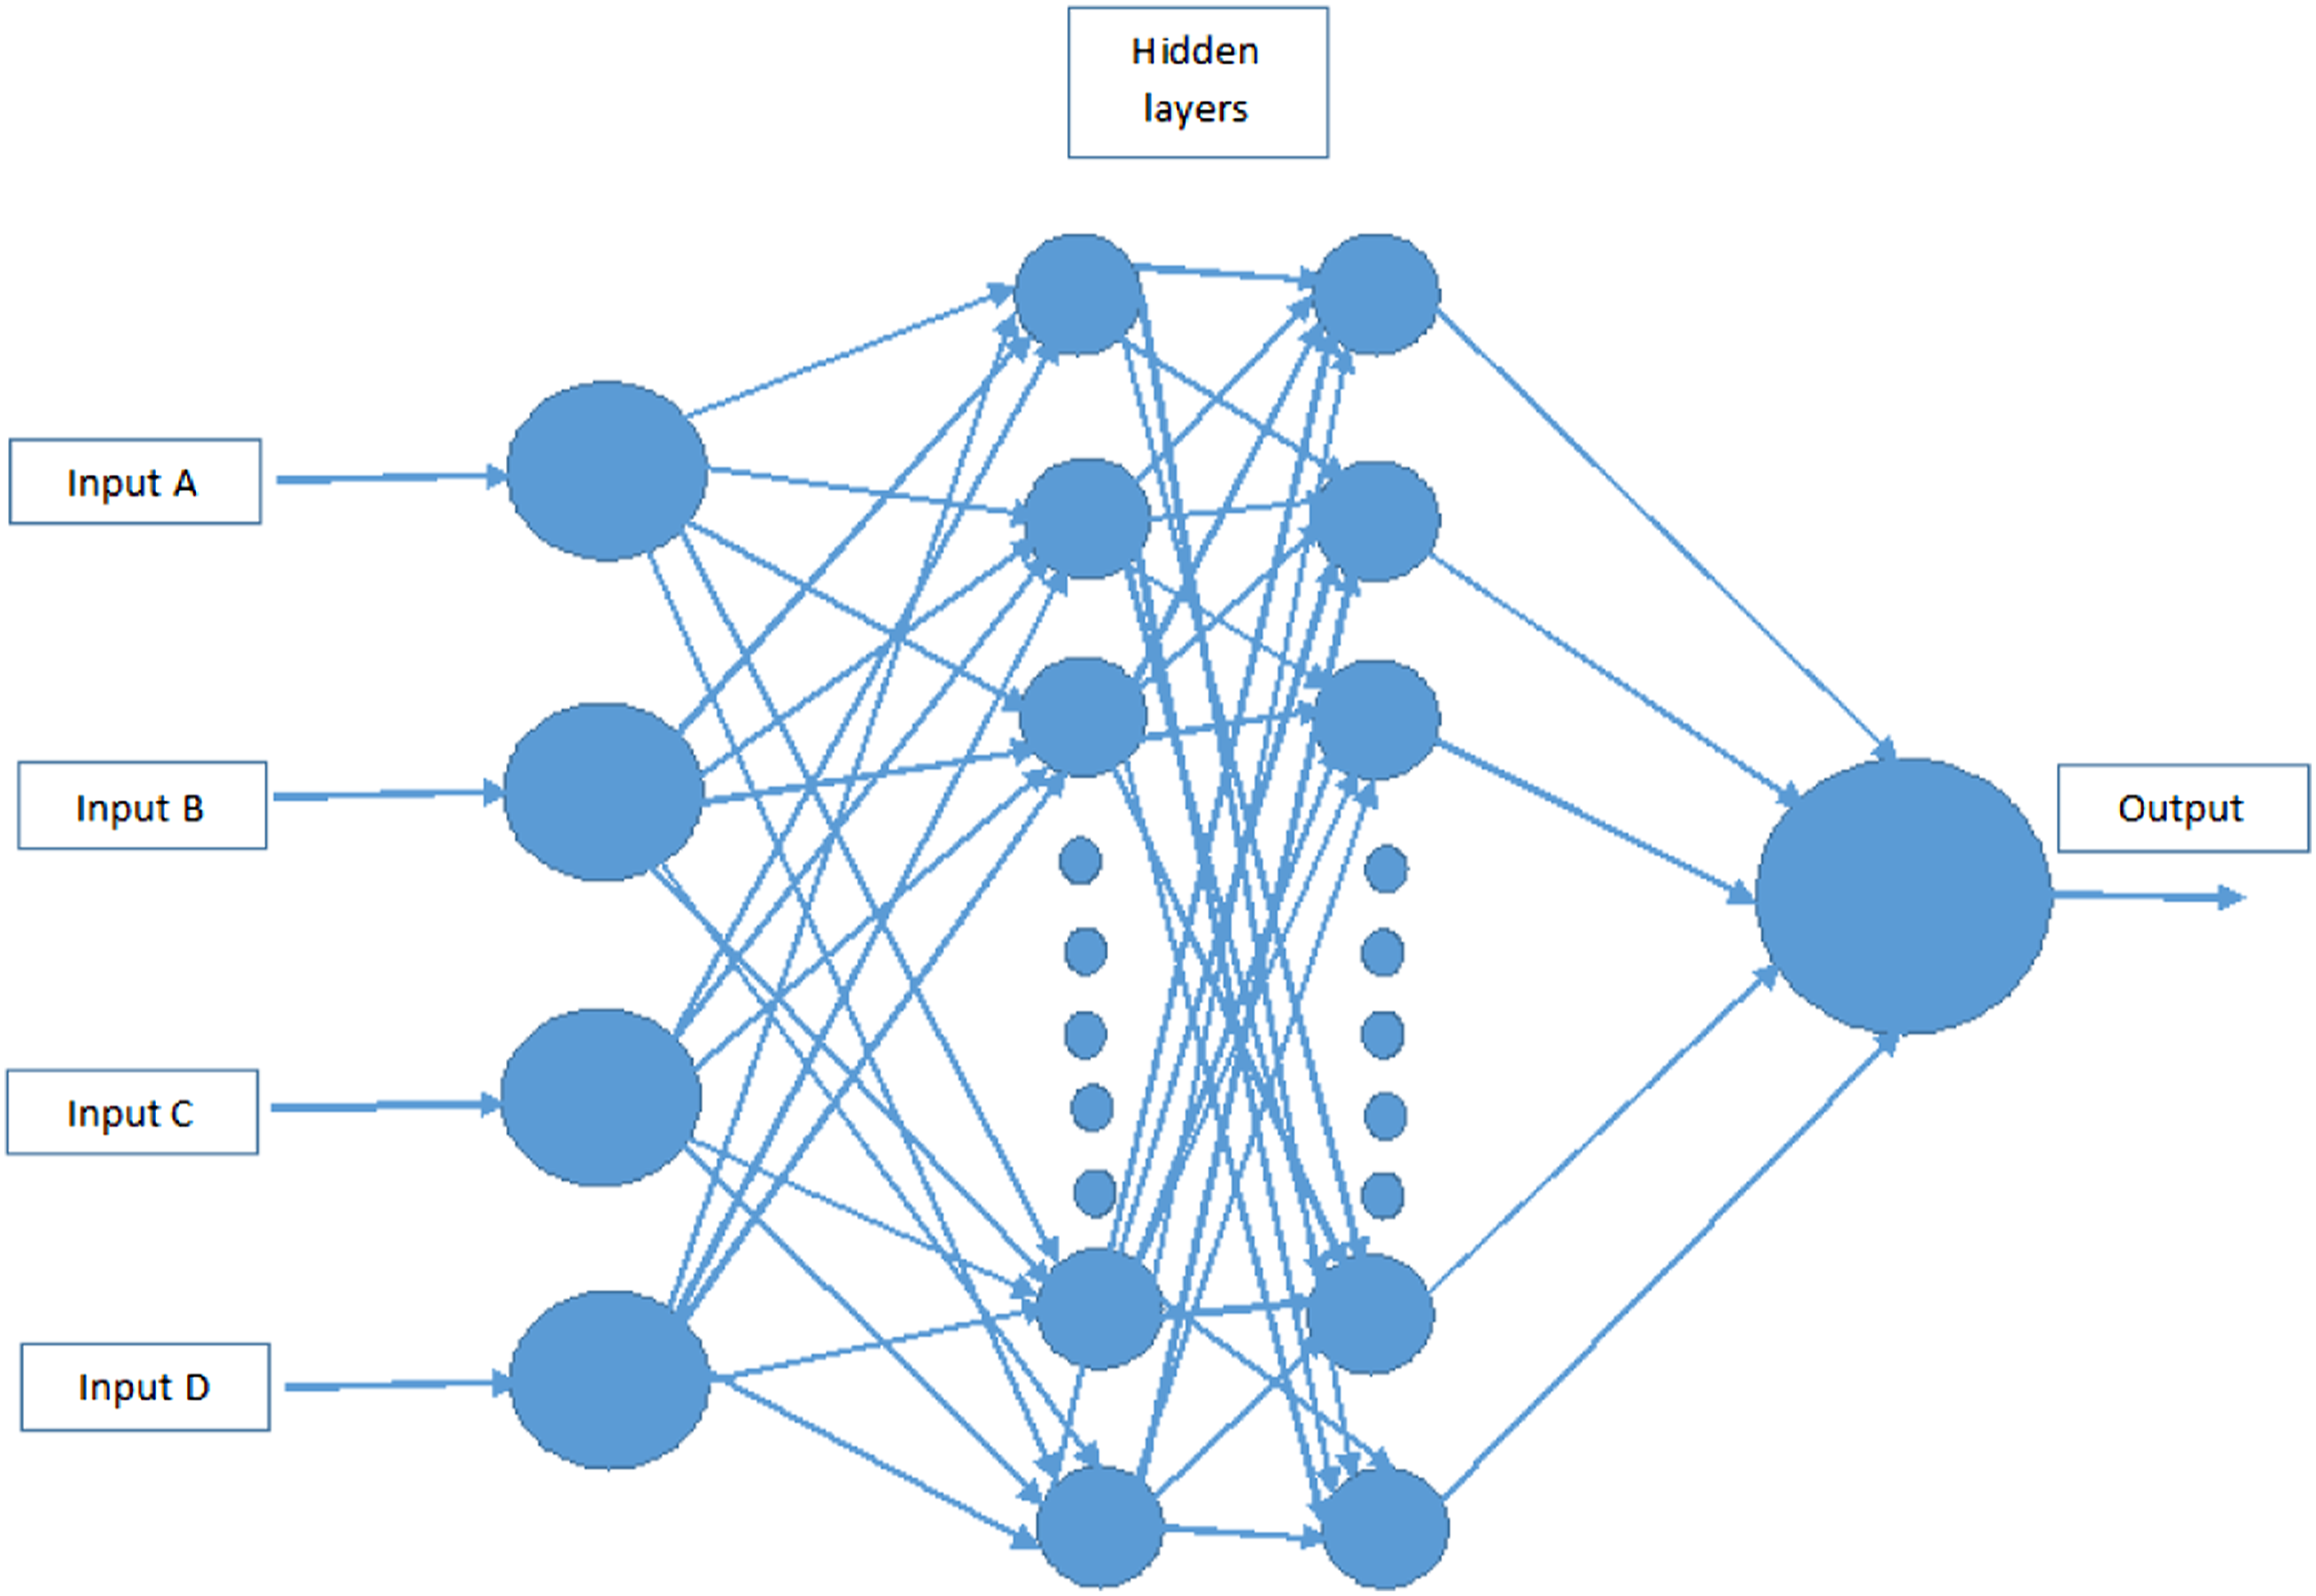
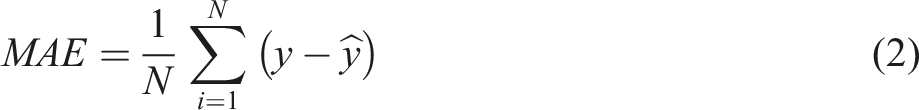
The TensorFlow’s “adam” optimizer was used to train the model, and the loss function was Mean Squared Error (MSE). Based on MAE and MSE values, the optimal iteration and outcome were decided. The actual disparity among the real and anticipated values in the dataset is represented by the Mean absolute error. It calculates the dataset’s average loss. The formula of MAE is represented below in.
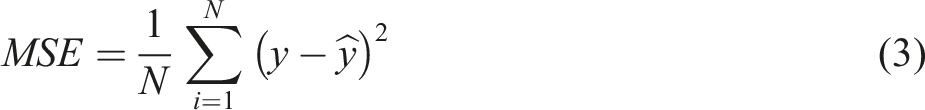
The formula of MSE is described below in.
The standard deviation of residuals is calculated using the Root Mean Squared Error.

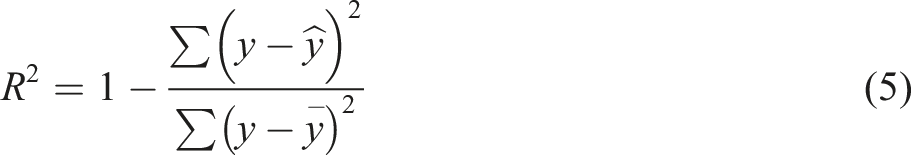
The R-squared coefficient of prediction shows the fraction of the variation in the dependent variable that the linear regression model can explain. It is a magnitude score, meaning that regardless of how little or huge the values are, the R square will be lesser than one. The formula to calculate R2 can be represented in the
The following equation (6) describes the weight updation formula using the gradient descent algorithm.
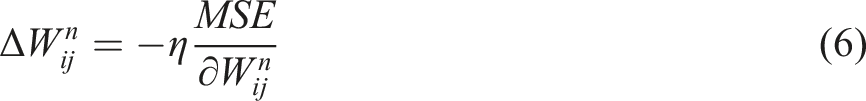
The hyperparameter tuning approach was used to design the best ANN structure, where η is the learning rate. The linear model (regression) is a common example of this type of problem, and the regression concern’s main characteristic is that the dataset’s goals only comprise actual values. The errors reveal how often the model makes incorrect predictions. The fundamental purpose of the precision analysis is to use a set of criteria to compare the actual target to the projected one.
Performance evaluator metrices for regression model
The MSE, MAE, RMSE, and R-Squared statistics are frequently used in regression evaluation to assess predicted error rates and model performance. • MAE is referred to as the difference between the actual and predicted values calculated by averaging the relative variance over the data set. • MSE is stated as the anticipated values, calculated by squaring the mean difference over the data set. • The square root of MSE multiplied by the rate of error yields RMSE. The correlation of prediction R2 illustrates how strongly the values match when compared to the original data. The number is expressed in a range of 0 to 1. If the value is greater, the model is more accurate.
The selection and appropriate analysis of the evaluation metrics utilized for analyzing and judging model abilities is based on the training and testing dataset. It is one of the most important aspects of constructing a data-driven model. A range of assessment metrics is used to examine the model. 23
A user should be aware of a metric’s limits and assumptions before selecting a set of assessment metrics that is appropriate for a particular predictive/data-driven modeling assignment. The coefficient of determination (R2), which measures the degree of change in objectives that can be described by a predictive model, is a prominent assessment metric for regression projects. R2 is a metric that determines how effectively a predictive/data-driven model can explain changes in targets/outputs (y) by altering features/inputs (x). The R2 measurement is focused on the premise that good models have the fewest residuals possible. The R2 denotes the strength of a linear connection among two variables. The following are some of the R2 restrictions and assumptions: 1. It is unable to measure the model’s prediction bias. 2. Only linear correlations between targets and characteristics are taken into account. 3. Unless the targets are suitably modified, it ignores the nonlinear relationships among the objective and characteristics. 4. A high R2 suggests a linear relationship between the model and the dataset employed to construct it. 5. The presence of a high R2 does not necessarily imply a connection. It’s nothing more than a correlation marker (association). 6. R2 is a comparative rather than an absolute metric since it is reliant on the number of data points, feature ranges and order of variables utilized to create the model.
R2, mean absolute error (MAE), and root-mean-square error (RMSE) are superior assessment measures. 24 Model performance is shown by MAE and RMSE values that are nearby to zero. The error range is more responsive to the RMSE and variation in errors than MAE and provides greater weight to samples where the model has significant mistakes. MAE is a more stable statistic than RMSE and allows for easier interpretation; the MAE is influenced by each specimen in direct proportion to the sample’s absolute error of expectation. The big discrepancy among RMSE and MAE suggests that the error distribution is more variable. MAE is appropriate for errors that are evenly distributed. When the errors have a normal distribution, RMSE is preferable over MAE. When the model’s estimations are significantly inaccurate or biased, both MAE and RMSE are ineffective. The most prominent difficulty with the usage of the RMSE and MAE is their sensitivity to outliers. MAE employs absolute values, which makes calculating the gradient or sensitivity of a model parameter challenging.
Data set description
The data for this research work is procured from the study of dielectric properties of banana fiber reinforced polypropylene composites. Dielectric constant, tan δ, and AC conductivity values were measured with respect to temperature and frequency by using LCR impedance analyzer. Then the obtained data must first be pre-processed to confirm that it is in a useable version and free of errors like missing data, anomalies, and inaccurate data values. Feature extraction is required in the following stage to determine the independent variables for the model inputs. Four unique characteristics (e.g., filler content, polymer content, frequency, and temperature) were discovered in this example to predict the dependent variables such as (a) dielectric constant, (b) tangent loss and (c) AC conductivity of the BF/PP composite materials.
The input layers will have four input nodes and the output node which will be giving the dielectric parameters as output. It’s essential to split the data set into a training set and a test set after pre-processing and attribute selection. Splitting the dataset is done using the train_test_split () function from the Scikit-learn python toolkit. The training subset is used to create the model, whereas the testing subset is used to assess the model’s performance on unseen data.
Results and discussion
A proposed frame work to predict the optimal values of dielectric parameters of BF/PP composites.
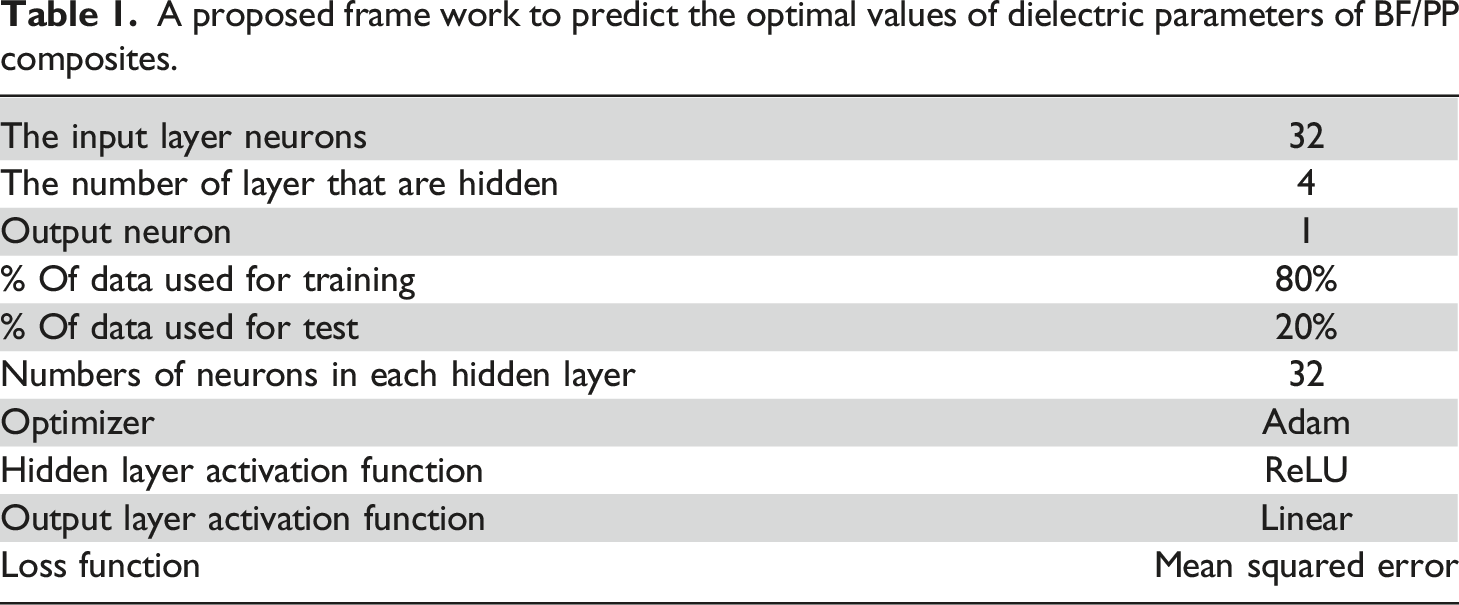
During the estimation stage, the constructed ANN model was put to the test to determine the best dielectric parameters for banana fiber augmented PP composites, including dielectric constant, tangent loss, and AC conductivity. The created ANN model was tested numerous times to ensure that the resulting ideal filler concentration was accurate, robust, and reliable. In addition, the calculated standard deviation revealed how widely the results deviated from the mean. In this present study, the dielectric properties of banana fibers reinforced PP composites were predicted using the ANN model. The R2 value, MSE, MAE, and RMSE values of dielectric constant (ɛI), tan δ, and AC conductivity of the blends were determined and reported. The created ANN model was used to forecast the dielectric characteristics of a banana fiber/PP composite material with great efficiency. The ANN model was capable to establish a strong link among dielectric characteristics and the quantity of banana fiber, and PP content in the composite material under consideration. It was discovered that increasing model efficiency requires a large number of neurons and epochs during hyperparameter adjustment. MSE was used to assess the model’s stability based on the values of the training and validation loss functions. Because of the large density of neurons and the epoch, the connection between the independent factors, in this case, dielectric characteristics and the dependent variable, was complex. Because of this intricate relationship, also the absence of data points, determining the dielectric constant, tangent loss, and AC conductivity based on dielectric parameters may be difficult. Higher neuron counts combined with fewer data points can lead to model overfitting.
To avoid this, the dense layer was employed in conjunction with the dropout strategy throughout training, which altered the amount of activated neurons in the input layer to eliminate any undesired biases. To ensure model dependability, the ANN model was run at least five times for every prediction. In addition, the intended mechanical properties were changed on purpose to see if the model was fixed to a specific solution (due to overfitting) or if they were flexible and adequate by changing the random variable. The dataset is separated into three portions for model training, testing, and validation in controlled learning. In all three splits, there should be no samples that are identical. The testing dataset should be handled as if it were completely new, and it should only be used during model training in exceptional circumstances. Validation data helps to avoid overfitting by reducing the number of training and testing datasets. The dataset is divided into two portions for this study: training and testing datasets. To avoid overfitting, we employ a normalization term in the error function rather than a validation dataset. As a result, more data is accessible for the training and testing phases, which is advantageous for building data-driven models while staying within the data quantity constraints of the study.
Figure 3(a), (c), and (e) represents the variation of the dielectric constant, tan δ, and AC conductivity versus a number of data points. The graph was plotted for both real data and the predicted data. Real data of dielectric constant was obtained by LCR impedance analyzer and predicted data was obtained by ANN model. The aforementioned graphs show that there is a significant agreement between the real and forecasted data. Prediction of Dielectric constant using ReLU.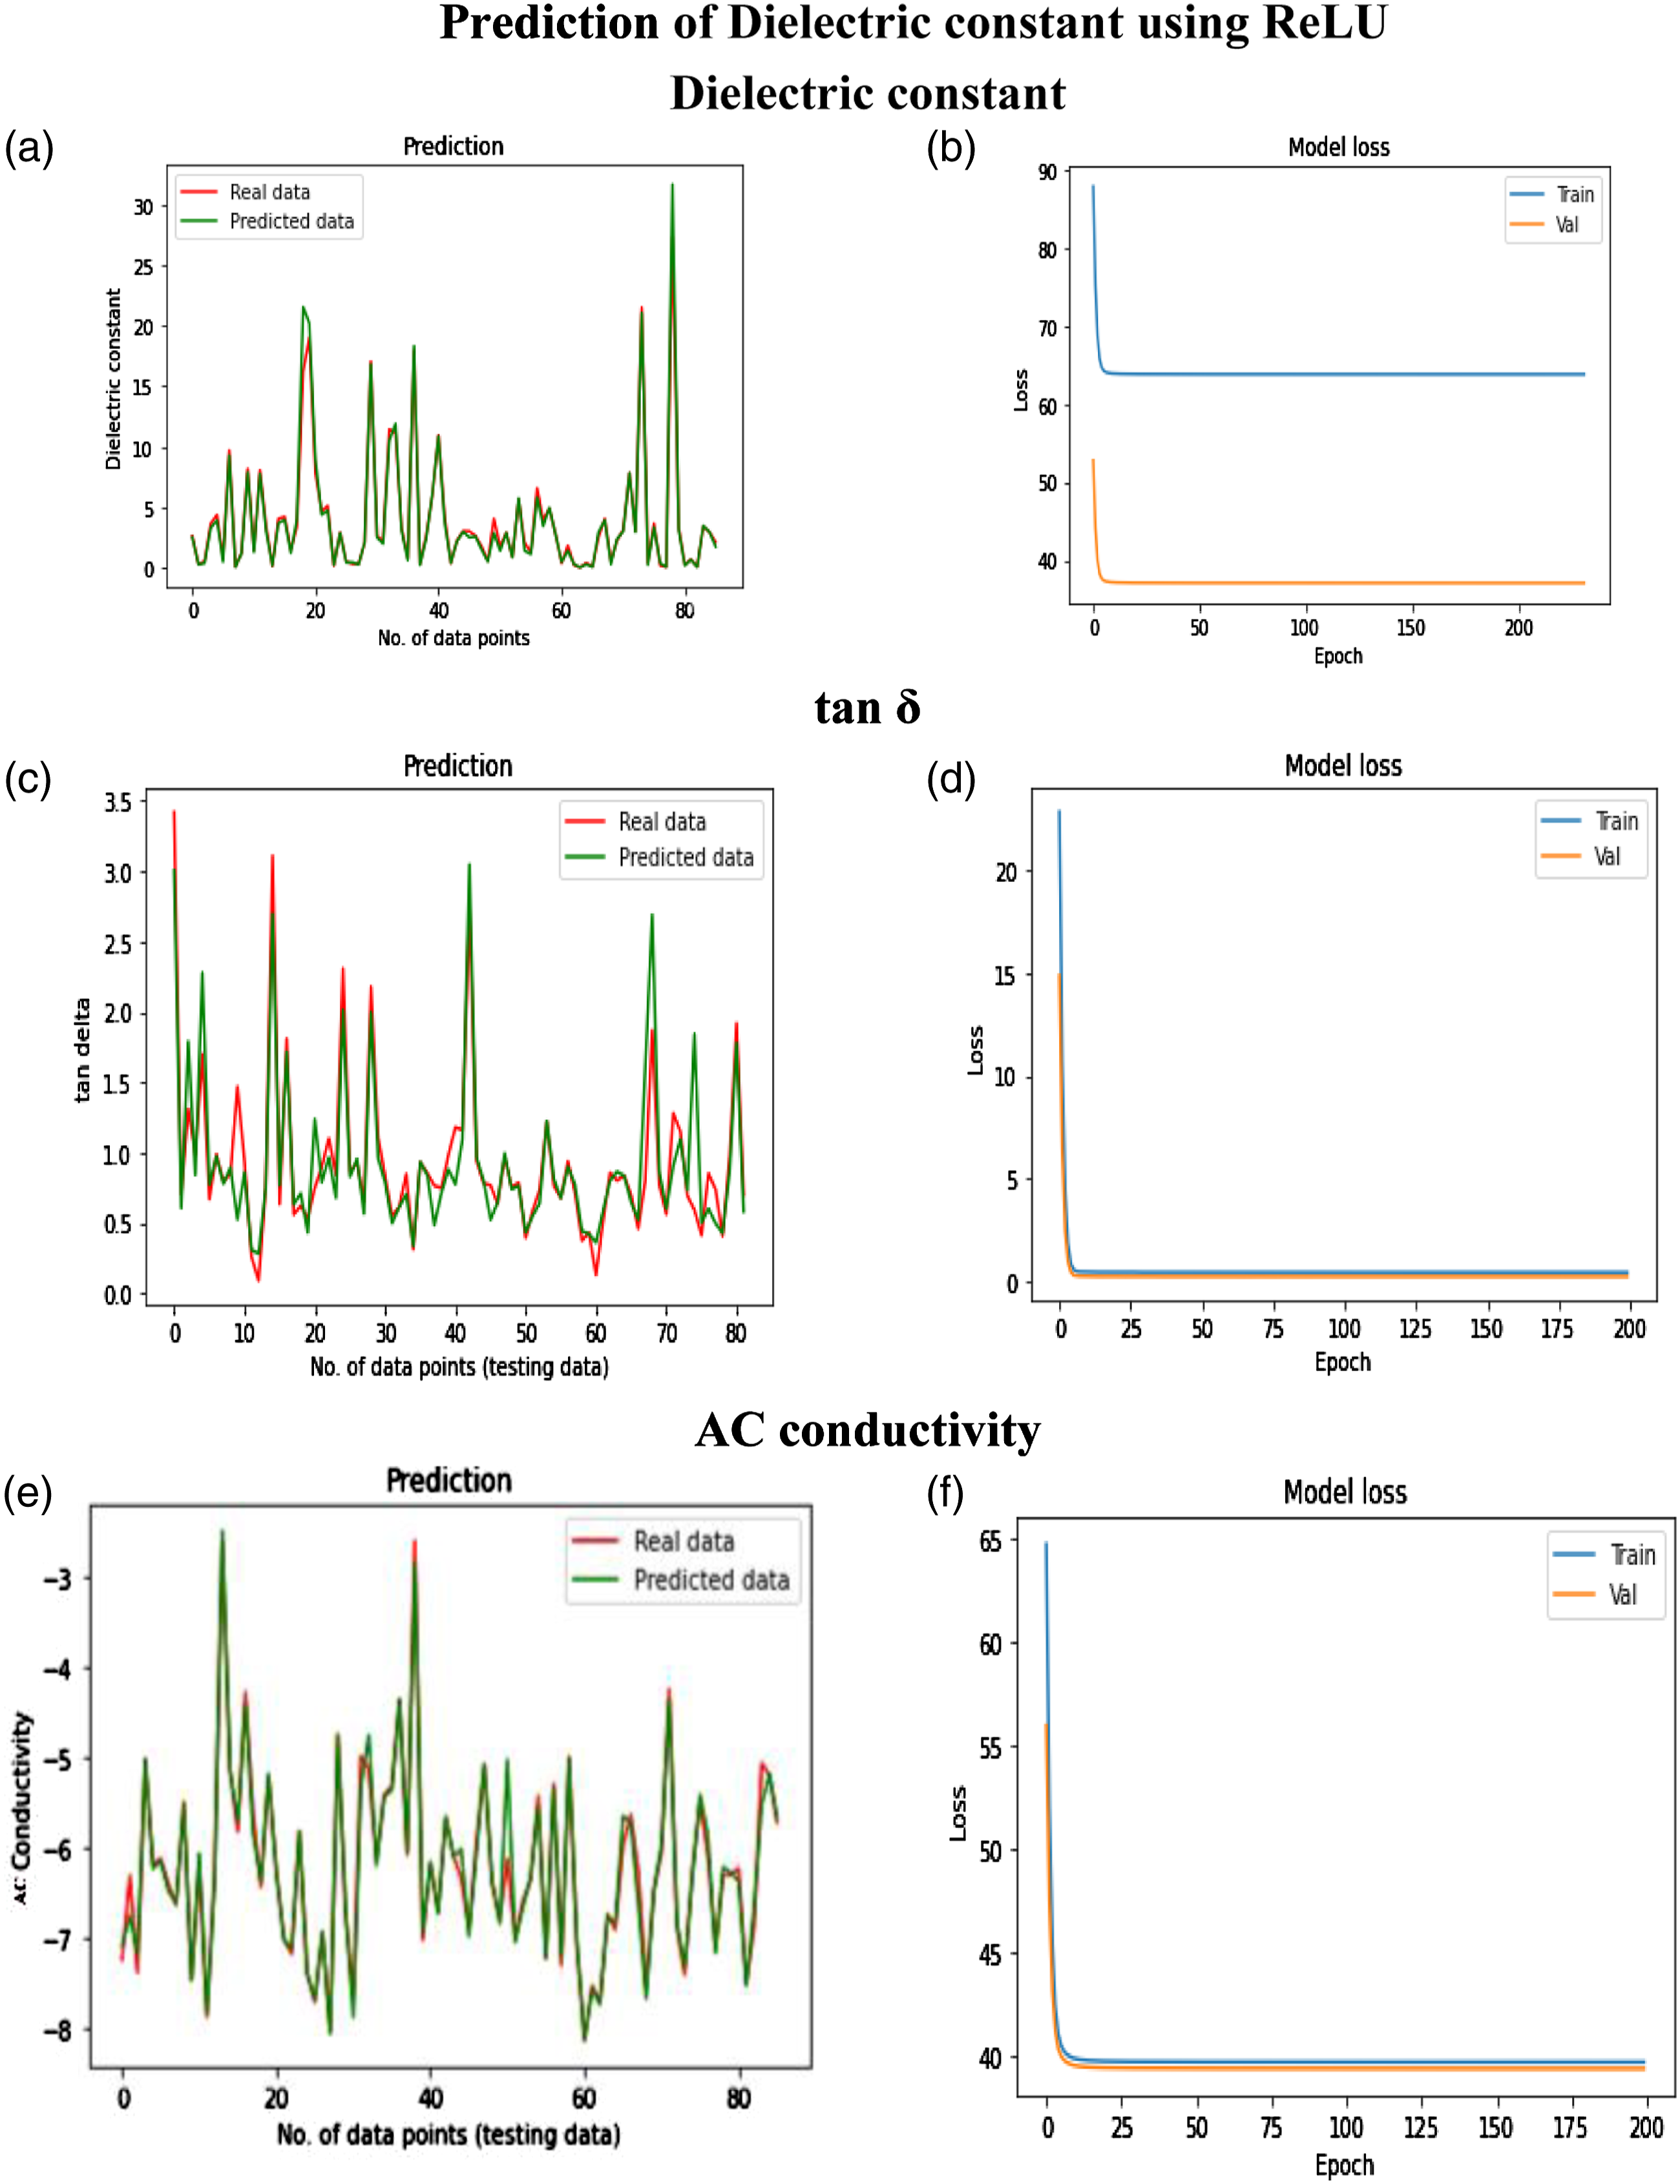
Figure 3(b), (d), and (f) represent the variation of model loss v/s epoch. A loss function is used to optimize a machine learningmachine learning algorithm. The loss is calculated on training and validation and its interpretation is based on how well the model is doing in these two sets. It is the sum of errors made for each example in training or validation sets. Loss value implies how poorly or well a model behaves after each iteration of optimization. As shown in graphs, as the number of epochs increases the model loss decreases gradually. The training loss measures how successfully the model fits the training data, while the validation loss measures how effectively it fits new data. For the best ANN model validation loss should be less compared to training loss. This can be achieved by using an appropriate number of neurons, hidden layers, batch size, and epochs. The validation loss is significantly lower than the training loss, indicating that the validation dataset estimates better than the training dataset.
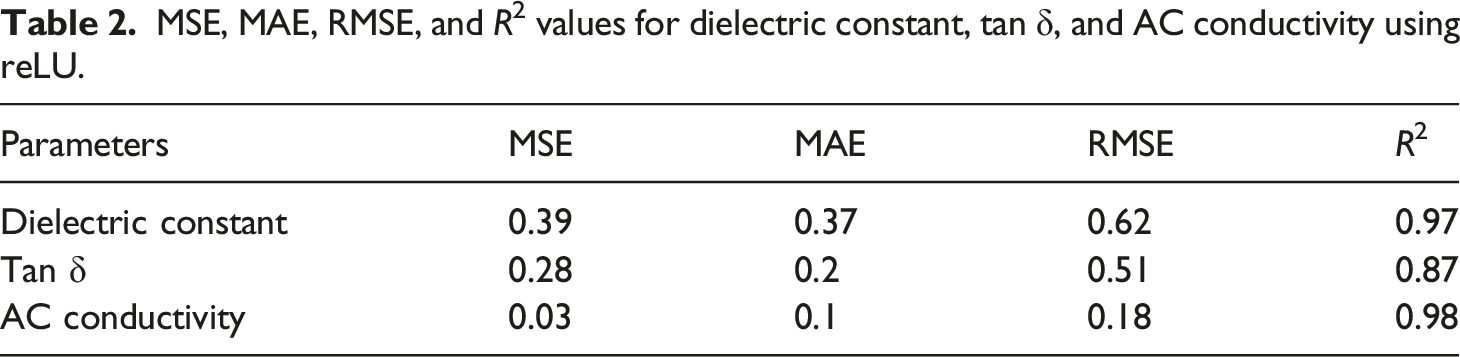
MSE, MAE, RMSE, and R2 values for dielectric constant, tan δ, and AC conductivity using reLU.
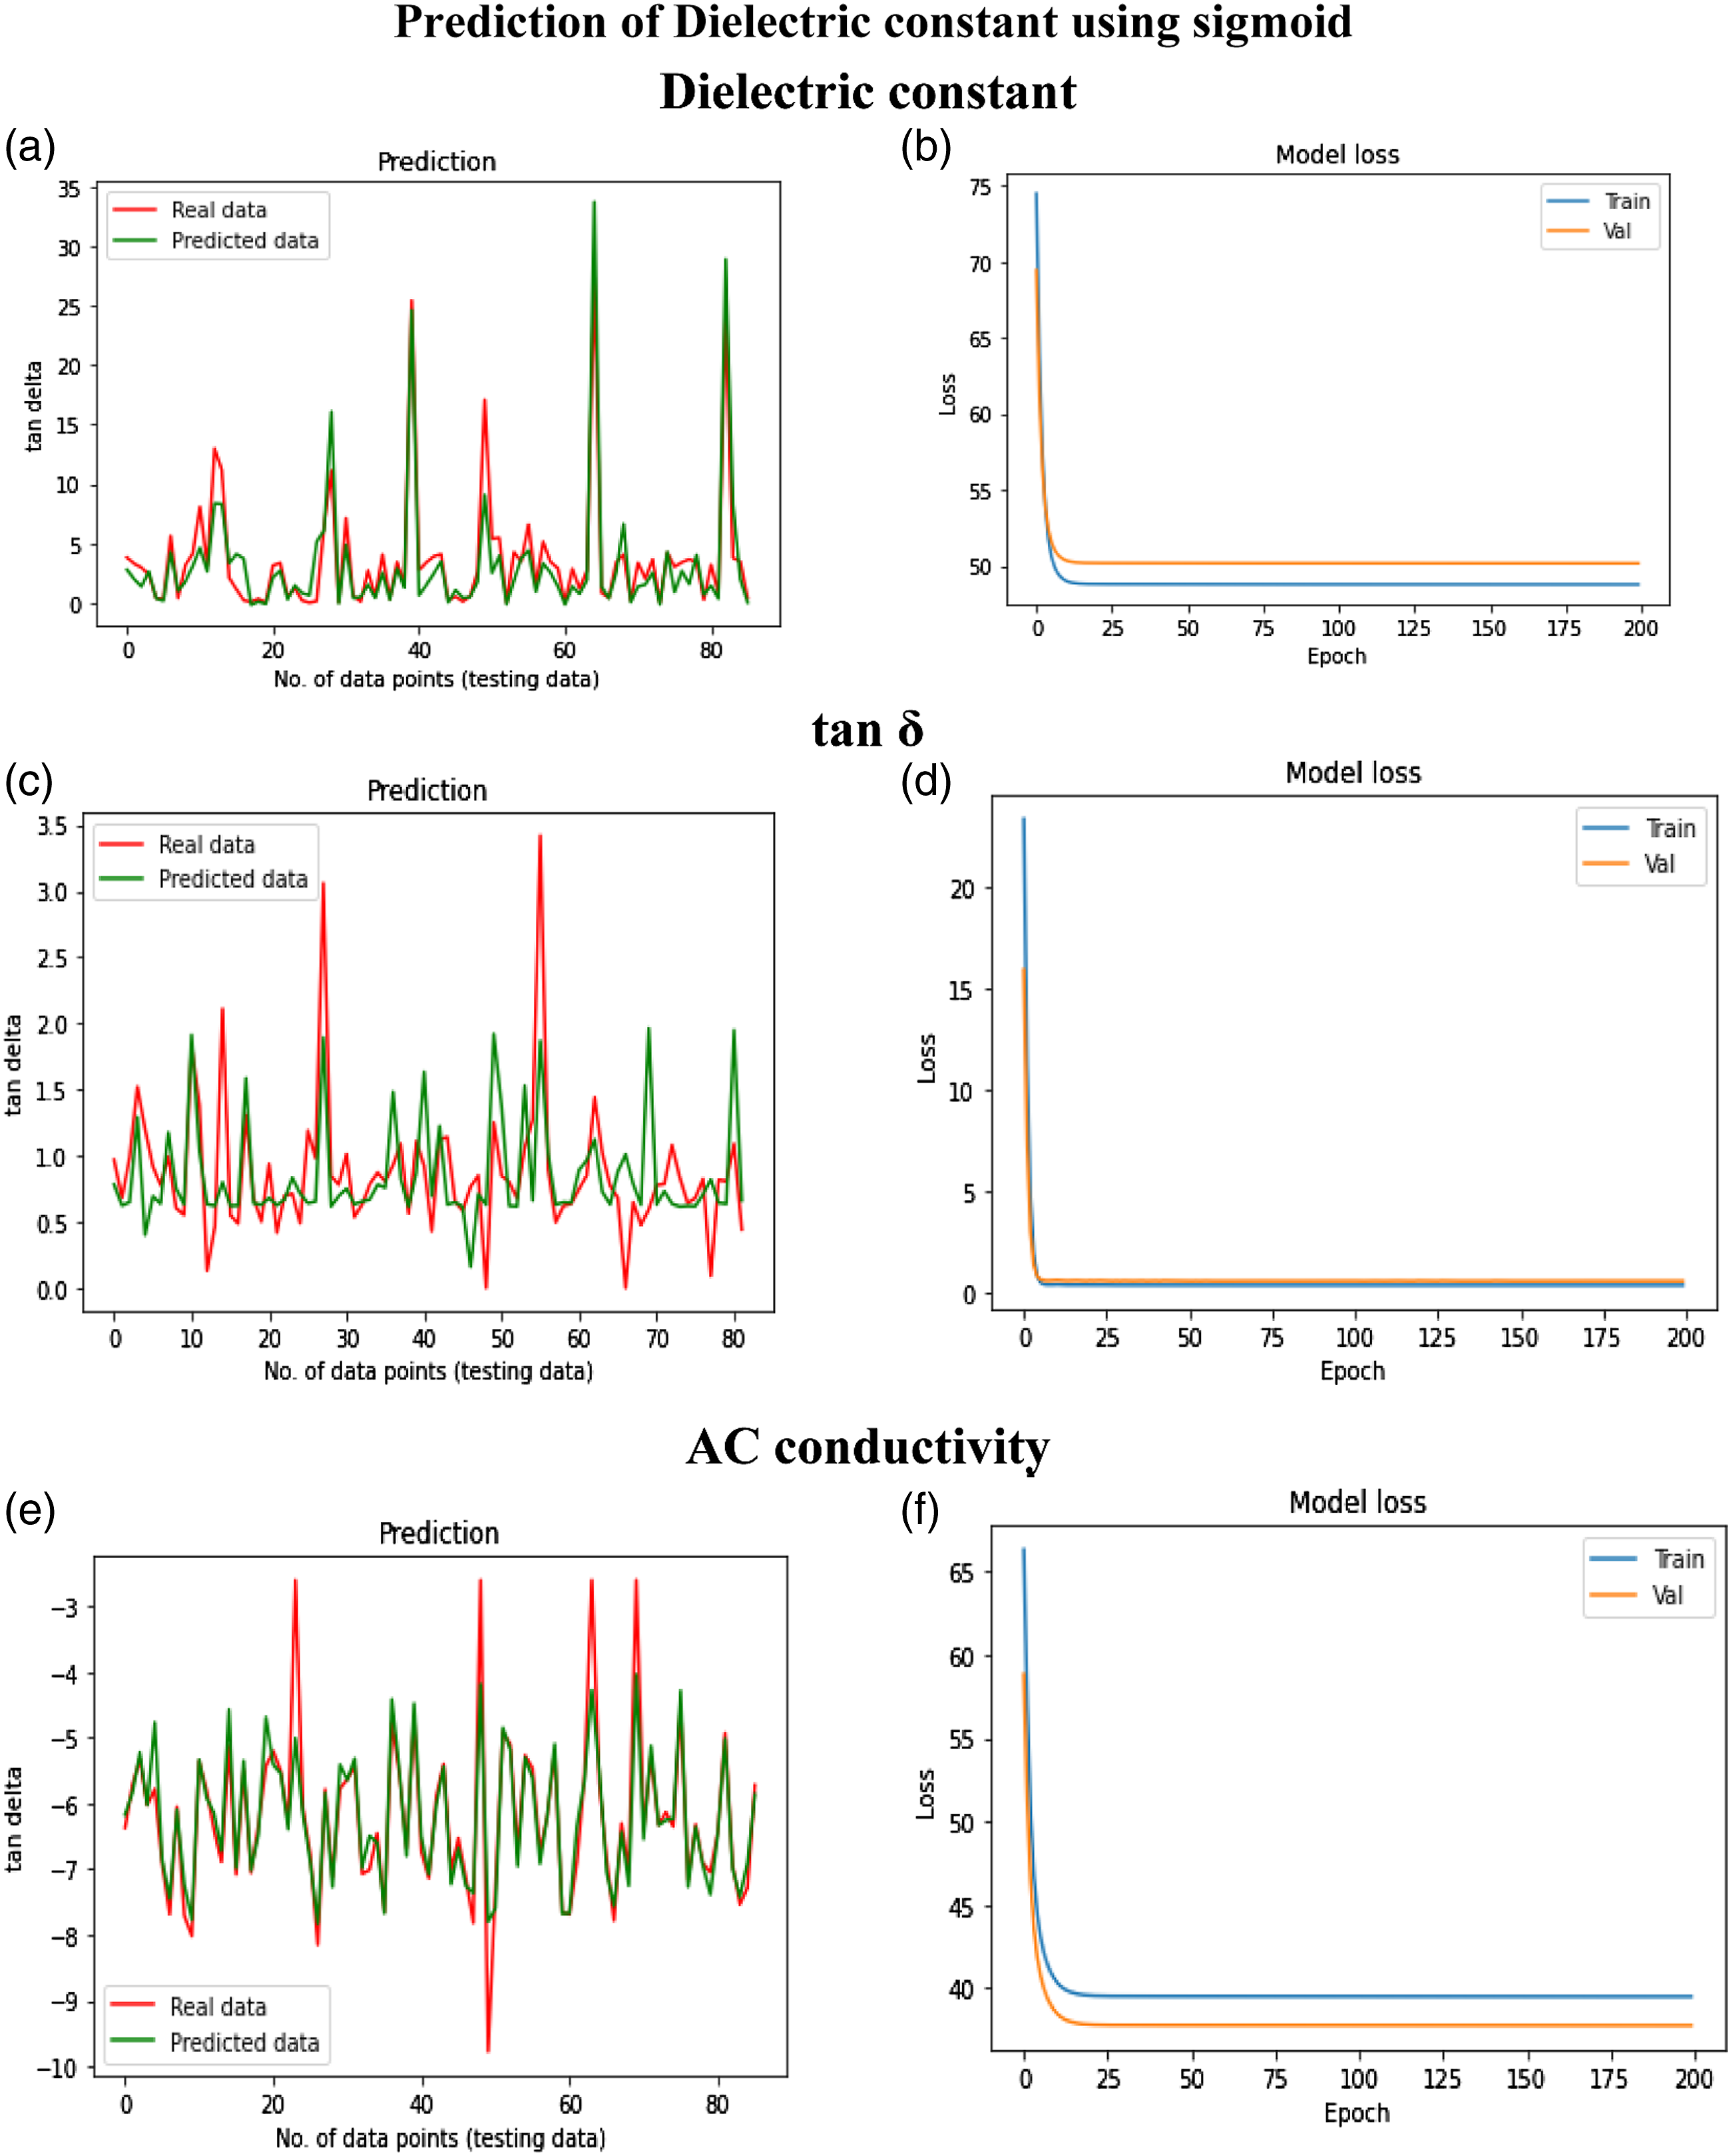
Prediction of Dielectric constant using sigmoid.
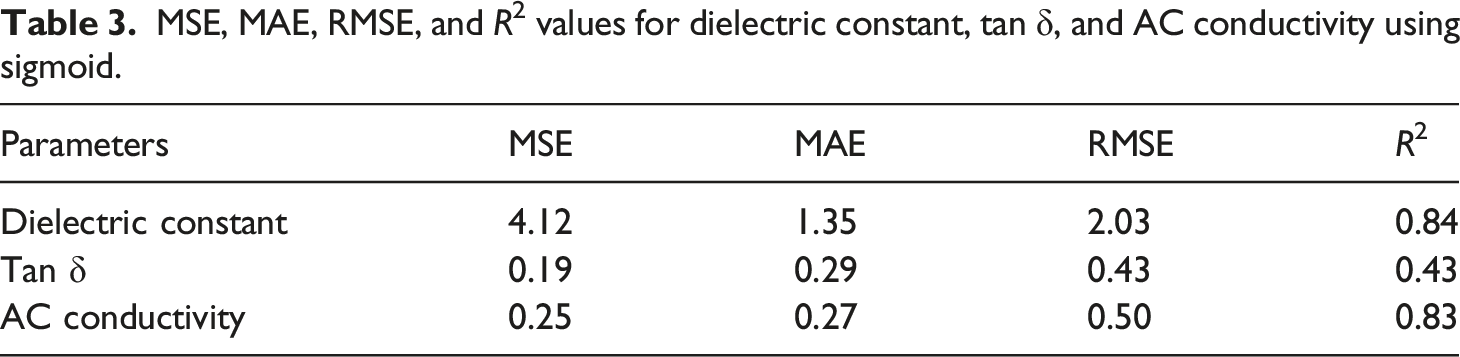
MSE, MAE, RMSE, and R2 values for dielectric constant, tan δ, and AC conductivity using sigmoid.
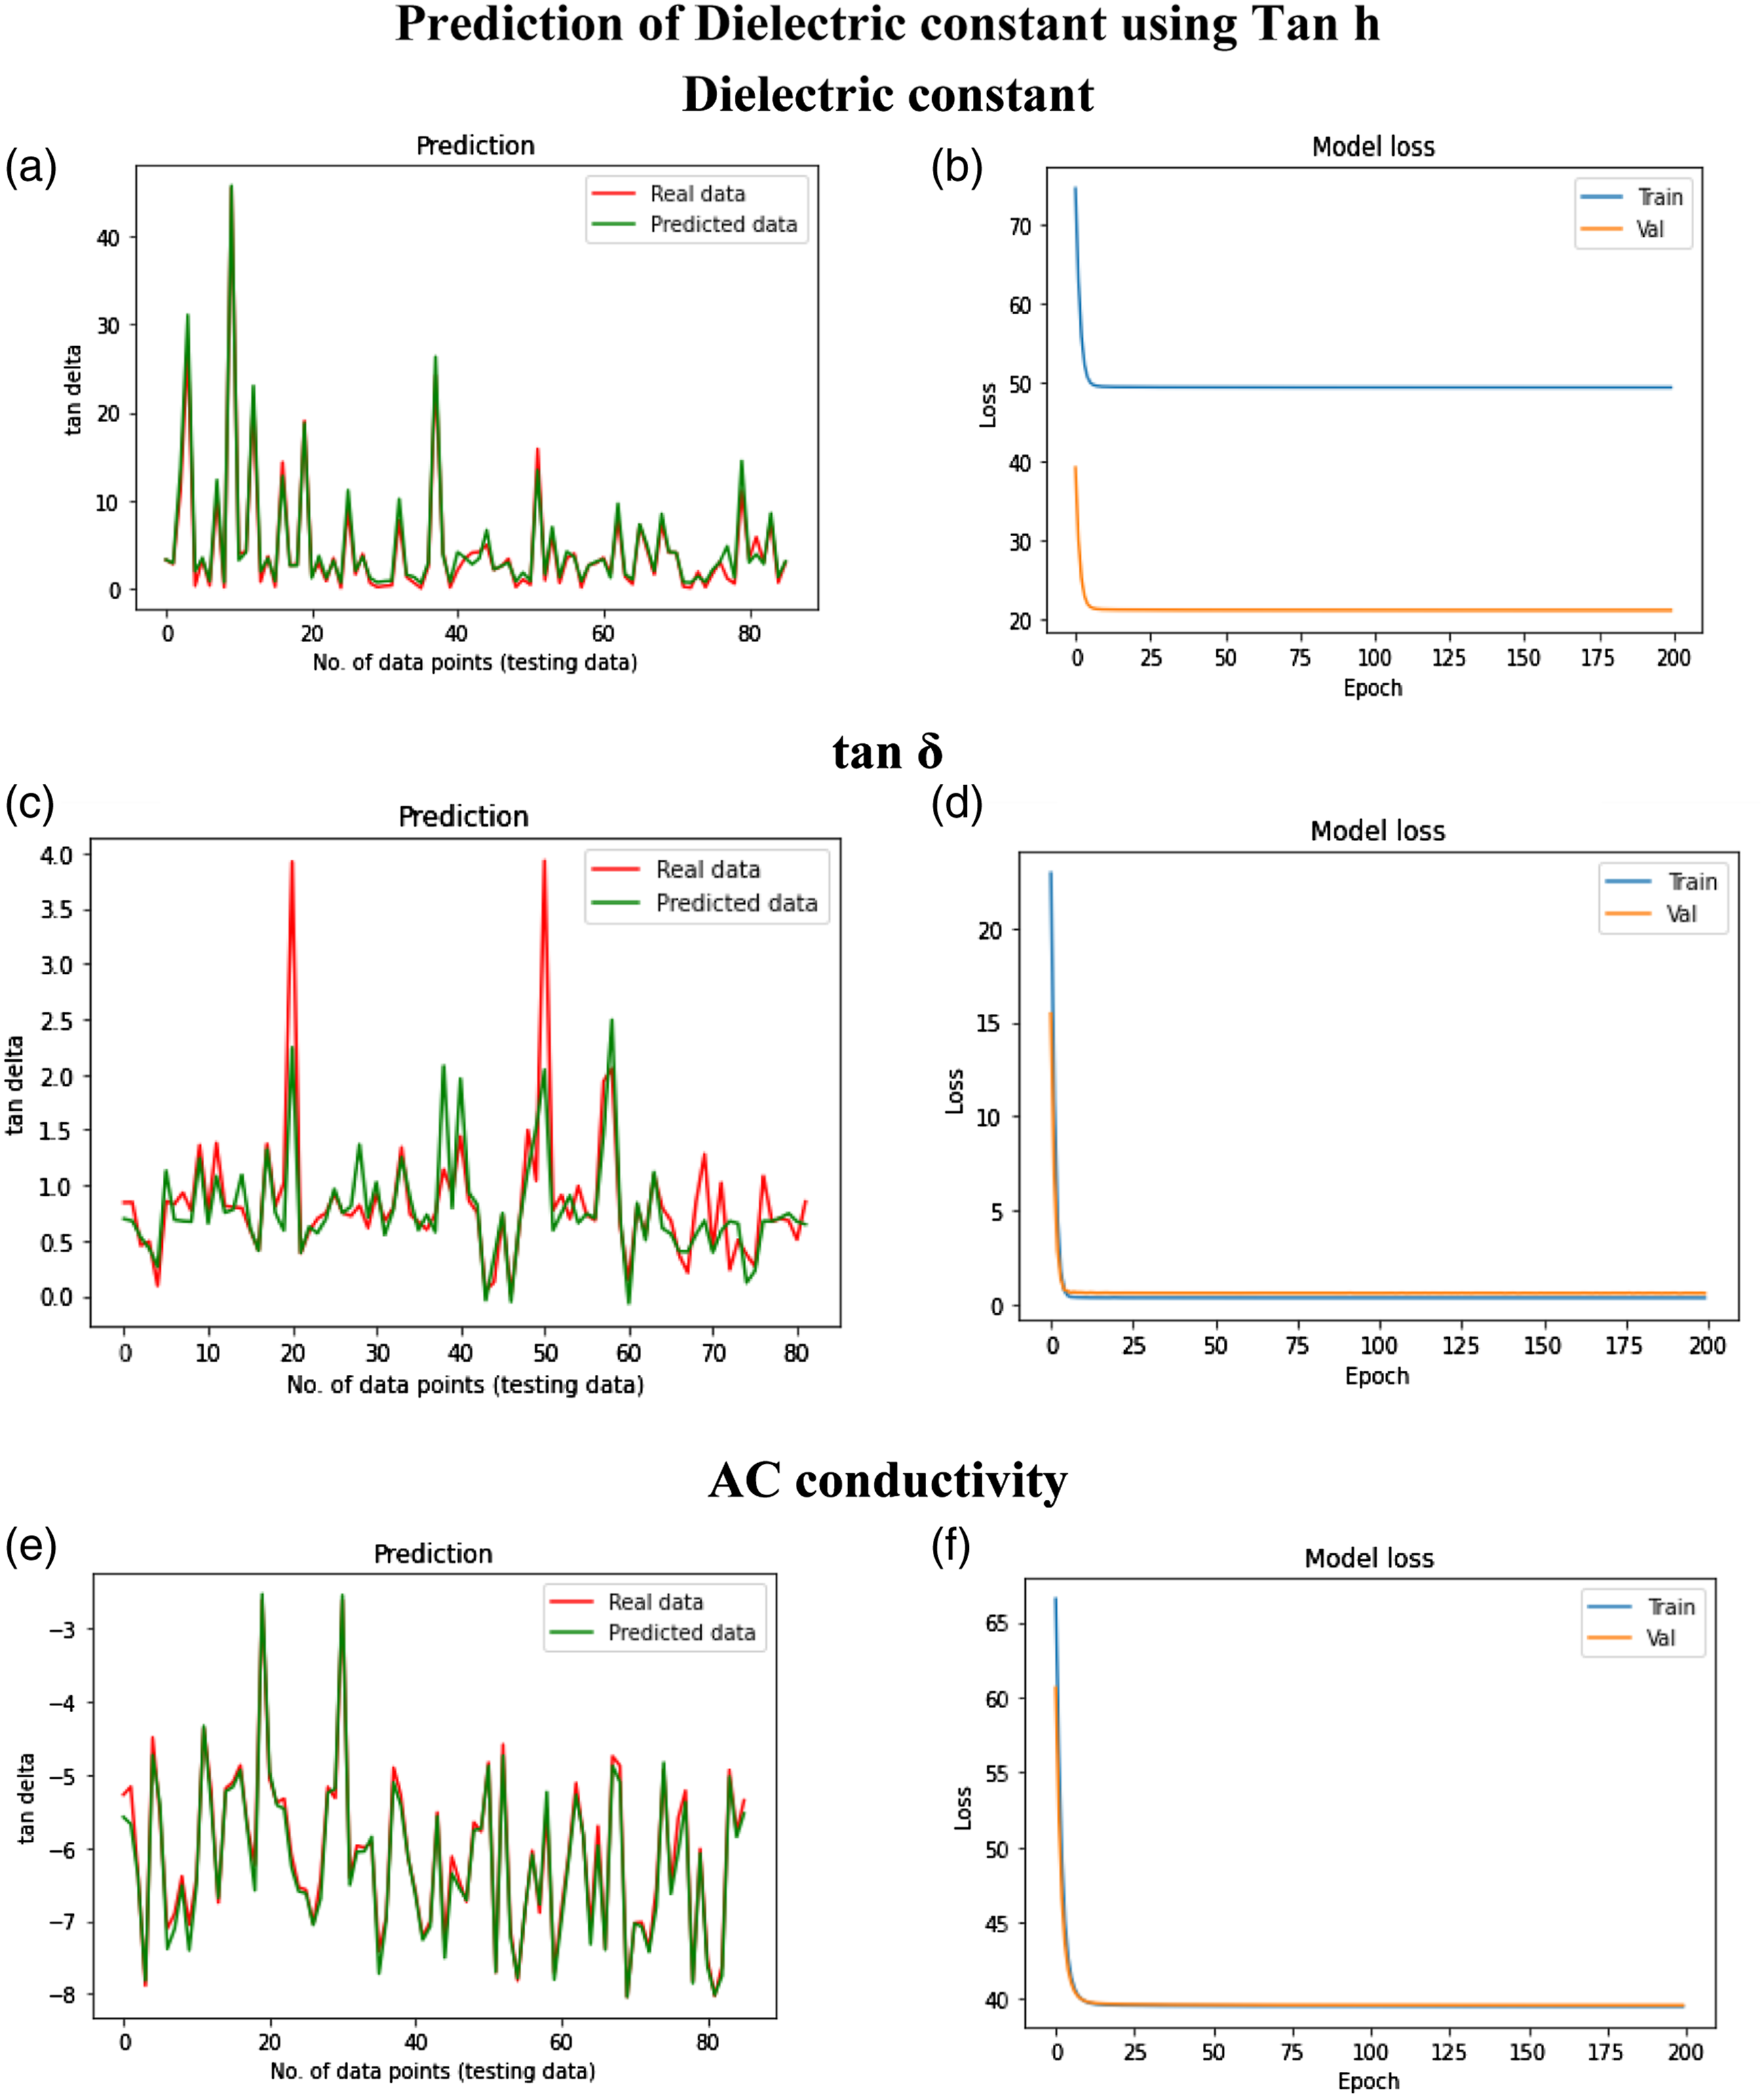
Prediction of Dielectric constant using Tan h.
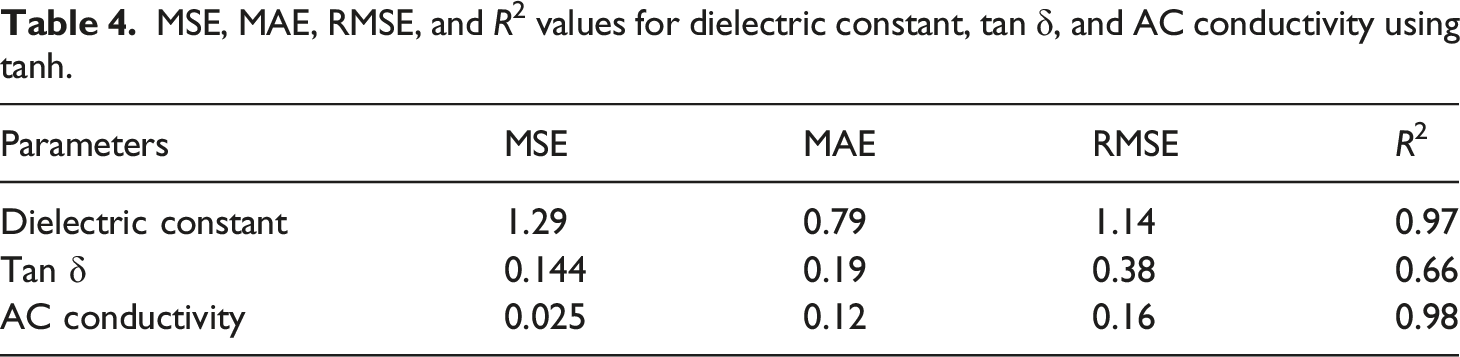
MSE, MAE, RMSE, and R2 values for dielectric constant, tan δ, and AC conductivity using tanh.
Comparative study
The predicted ANN approach for the dielectric parameters such as dielectric constant, tanδ, ac conductivity shows a very good agreement with the experimentally determined variables. The three activation functions namely ReLU, sigmoid, and tanh were implemented for the present data set in the regression model. As per the Table 4, it was found that for retrieving data, the activation function ReLU is most suitable to determine dielectric parameters as per the obtained RMSE, MSE, MAE & R2 values.
Conclusion
Hence, using this technique, one can successfully reduce the anthropogenic participation in the experimental procedure of finding dielectric parameters of the fiber reinforced composites. Also, this approach minimizes the inaccuracy within short duration. This merely represents the initial step in developing a more complex modelling strategy and progressing toward the creation of increasingly dependable computational tools capable of identifying and meeting various decision-making needs. In fact, it is well recognized that the experiment-based technique rarely allows the user to control every parameter, making it practically impossible to arrive at the best performing alternative. Multi-objective optimization problems are frequently encountered, particularly in the case of innovative materials to be introduced to the market. These difficulties propose objectives that can also be in conflict with one another, such as regulatory compliance, manufacturing costs, environmental impact, etc. Future research should specify variables, objectives, and restrictions to guarantee that the issue is properly handled to benefit from Artificial Intelligence (AI) support.
Footnotes
Acknowledgements
We would like to thank Dr. Kestur Sathyanaraya G who helped and supported the initial ideas on the preparation of composites. The authors would also thank to Dr. Jobish Johns affiliated to Raja Rajeshwari College of Engineering for giving methodology to examine dielectric properties of the composites. The authors express their sincere gratitude to the Management and the Principal of Global Academy of Technology, Bengaluru for their encouragement and support to conduct this research work.
Declaration of conflicting interests
The author(s) declared no potential conflicts of interest with respect to the research, authorship, and/or publication of this article.
Funding
The author(s) received no financial support for the research, authorship, and/or publication of this article.