
Abstract
Elium® is a novel liquid Methylmethacrylate thermoplastic (TP) matrix that can be cured at room temperature. Elium® resin provides the properties of TP polymer composites and is a competitive alternative to epoxy-based composites. In this work, a quadriaxial non-crimp (NC) glass fabric/Elium® based polymer composites were manufactured using vacuum assisted resin transfer moulding (VaRTM). The static mechanical properties of these composites were evaluated under the tensile and flexural loads. Further, interfacial properties like interlaminar shear strength (ILSS) and fracture toughness (Mode-I and Mode-II) were characterised. To study the influence of ageing on the mechanical properties of glass fabric/Elium® (GF/E) based composites, the test samples were aged in distilled water at a temperature of 60°C for 60 days. The obtained mechanical properties were compared between dry samples (control) and post-water immersed (aged) samples. It was found that water ageing degraded the properties of tensile, flexural strength, ILSS and Mode-II toughness by 30%, 59%, 46%, 37%, respectively. On the contrary, Mode-I fracture toughness of aged samples was 90% higher, indicating significant fibre bridging due to ageing. The microscopy and scanning electron microscopy (SEM) revealed significant failure as the degradation of fibre/matrix interface due to hygrothermal ageing. The overall performance of GF/E composites with infusible TP resin is sensitive to hygrothermal ageing.
Keywords
Introduction
Fibre-reinforced polymers (FRPs) are used for various structural/industrial applications due to their high strength/stiffness to weight ratios. FRP composites have broader applications in marine, automobiles, aviation and waterborne transport. They combine high mechanical properties and low density and can improve performance and increase the longevity of structures. Typically used fibres are glass, carbon, basalt, Kevlar etc. 1 These FRP laminates are manufactured using either thermoset (TS) or TP matrix materials. 2 Both the matrix materials show some merits and demerits in manufacturing and mechanical properties. 3 Compared to TS resins, the advantages of TP resins are improved toughness, affinity against chemical attacks, high impact resistance, re-formability, weldability, repairability and recyclability. However, the major demerit of TPs is their high-processing temperatures, as they are available in pellet or film form and must be melted before the injection process. 4
Among types of FRPs, the GF reinforced polymer (GFRP) composites have excellent performance and economic. The GFRPs are widely used in marine applications like ships and vessels. There are various advantages of using GFRP for shipbuilding, such as weight reduction, increased cargo carrying capacity, improved corrosion resistance and reduced maintenance cost. 5 Most of the studies reported the performance of GF reinforced epoxy, vinyl ester or TP resins which require high temperature.6–10 Therefore, there is a need for the development of GFRPs with a TP resin that can be manufactured at low processing temperature without compromising the mechanical properties. A few studies11–17 reported in the following discussions show that Methylmethacrylate (MMA) Elium® is the only liquid TP resin that can be processed at room temperature without compromising its properties.
Arkema, France, developed a novel liquid acrylic TP resin (Elium®), which can be cured at room temperature. The acrylic resin comprises 2-propenoic acid, 2 methyl-, methyl ester or methyl methacrylate monomer (MMA). Also, an acrylic copolymer in which MMA undergoes free radical polymerization to its polymer poly methyl methacrylate (PMMA). 14 The Elium® composites are manufactured by impregnating the laminates with the liquid resin at room temperature. After that, MMA monomer is mixed with a compatible inhibiter system and some heat stimuli using microwave or ultraviolet to start the polymerization process.
Davies et al. 11 reported that the tensile modulus for unreinforced TP is ∼3 GPa, comparable to the standard epoxy resins. The same research group also reported the tensile failure stress and strain percentage as ∼55 GPa and ∼2, respectively, at room temperature for dry samples. The researchers reported changes in mechanical properties within the range of 20%. However, the values are reversible after drying the matrix. There are few studies on the fracture toughness of carbon fibre reinforced Elium® resin, reporting the value to be 0.3–0.6 kJ/m2. 18
The use of the Elium® matrix for shipbuilding applications is still under development.16,19 During the service life of marine composites, the composites maintain their mechanical properties. However, water absorption is inevitable as its presence may cause swelling, plasticization and debonding of fibres from the matrix, thereby shortening the service life composites.17,20–25 Few researchers have reported the effect of mechanical properties degradation on GF reinforced Elium® composites due to water absorption.11,16,26
Davies et al. 11 studied the influence of seawater ageing on the mechanical behaviour of acrylic matrix and GF composites. These composites were manufactured using VaRTM technique with woven cross-ply (0°/90°) and off-axis (±45°) arrangements. It was reported that the cross-ply laminates of showed 50% retention of tensile strength in wet and 62% retention of strength in post-dried conditions. Whereas off-axis laminates showed 58% retention of tensile strength in wet and 92% retention of strength in post-dried conditions. It was concluded that drying aged samples does not provide complete recovery of the laminates due to some permanent damage at either fibre/matrix interface or on the GFs. Nash et al. 15 used unidirectional non-crimp glass fabric as reinforcement and Elium® 150 Arkema as a matrix. The laminates were produced using a symmetric stacking sequence of [0°]2s. The samples were soaked in deionized water for 28 days at 35°C temperature. The flexural strength decreased by 17–18% for aged samples. Nash et al. 16 studied the ILSS response of GF/E composites manufactured using the VaRTM technique. The results obtained for TP laminates were compared with the TS (epoxy, polyester and vinyl ester) based laminates. The laminates were immersed in deionized water for 28 days at 35°C. Due to ageing, the ILSS of TP, polyester and epoxy composites reduced by 37%, 21% and 16%, respectively. This strength reduction in TP laminate was due to poor fibre-matrix interface in the wet condition. Gobikannan et al. 26 studied the flexural properties and failure mechanisms of TP and TS-based composites for marine applications. Composite laminates with Elium® 150 matrix reinforced with GF [0°]2s were manufactured using VaRTM technique. The samples were soaked in deionized water for 28 days at 35°C. The flexural strength test results for TP-based laminates were compared with epoxy, polyester and vinyl ester. It was reported that water immersion reduces the flexural strength of the TP, epoxy, polyester-based laminates by 17%, 19% and 23%, respectively.
It is clear from the literature that the mechanical properties of composites change due to hygrothermal ageing. However, more studies are required to prove, explain and understand the mechanisms involved. The studies in the literature were limited to tensile, flexural and ILSS properties. Fracture toughness and the influence of ageing on interface properties have not yet been reported in the open literature. Specifically, interfacial studies and the influence of ageing on Elium®-based composites are very few. These characteristics are crucial for these composites to be applied in any industry, specifically marine.
Therefore, the present study aims to evaluate the mechanical properties of the quadriaxial non-crimp GF Elium® (GF/E) based composites. The effect of hygrothermal ageing on the mechanical properties was evaluated by performing tensile, flexural, ILSS, double cantilever beam (Mode-I) and end notched flexure (Mode-II) tests. The mechanical properties in dry condition (control) and post-water immersion (aged) in deionized water were compared.
Materials and methods
Materials
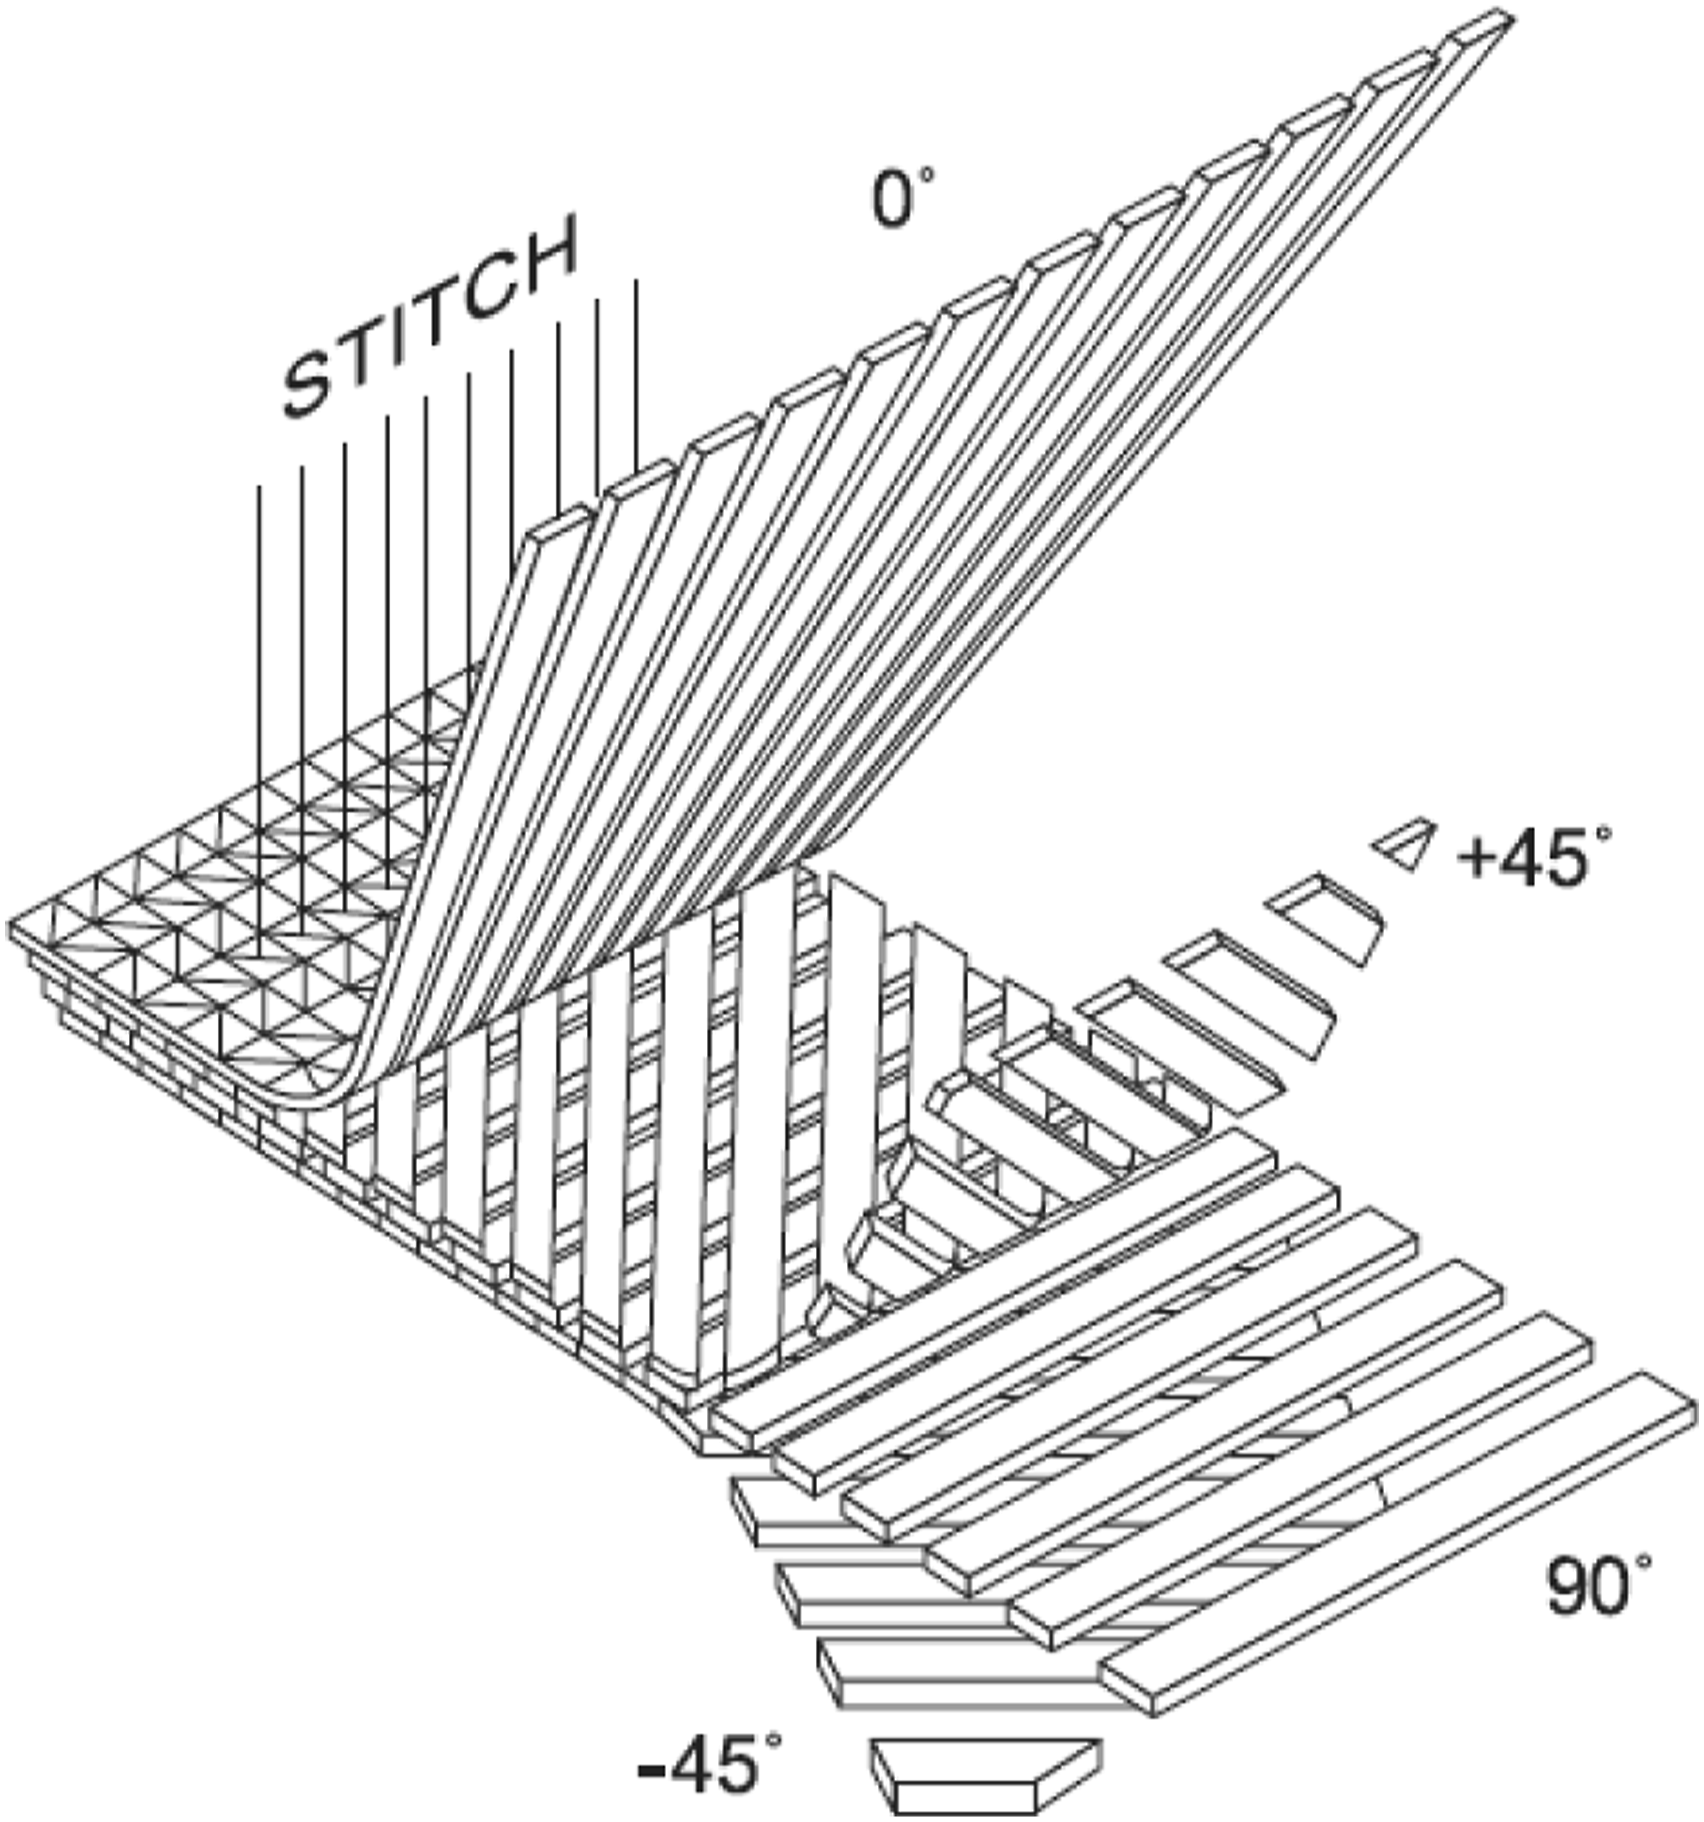
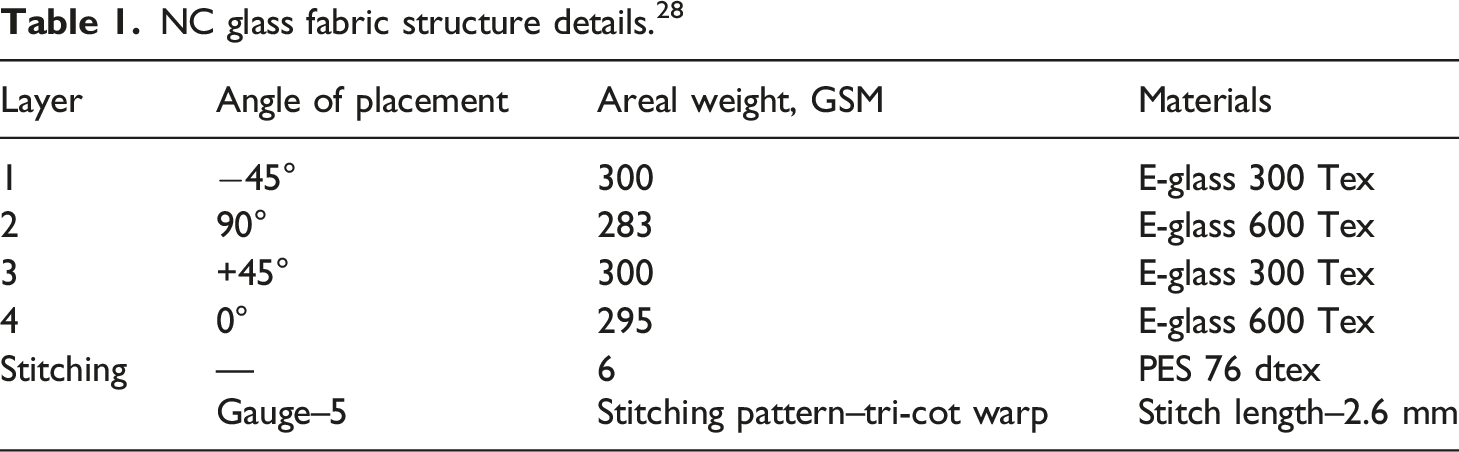
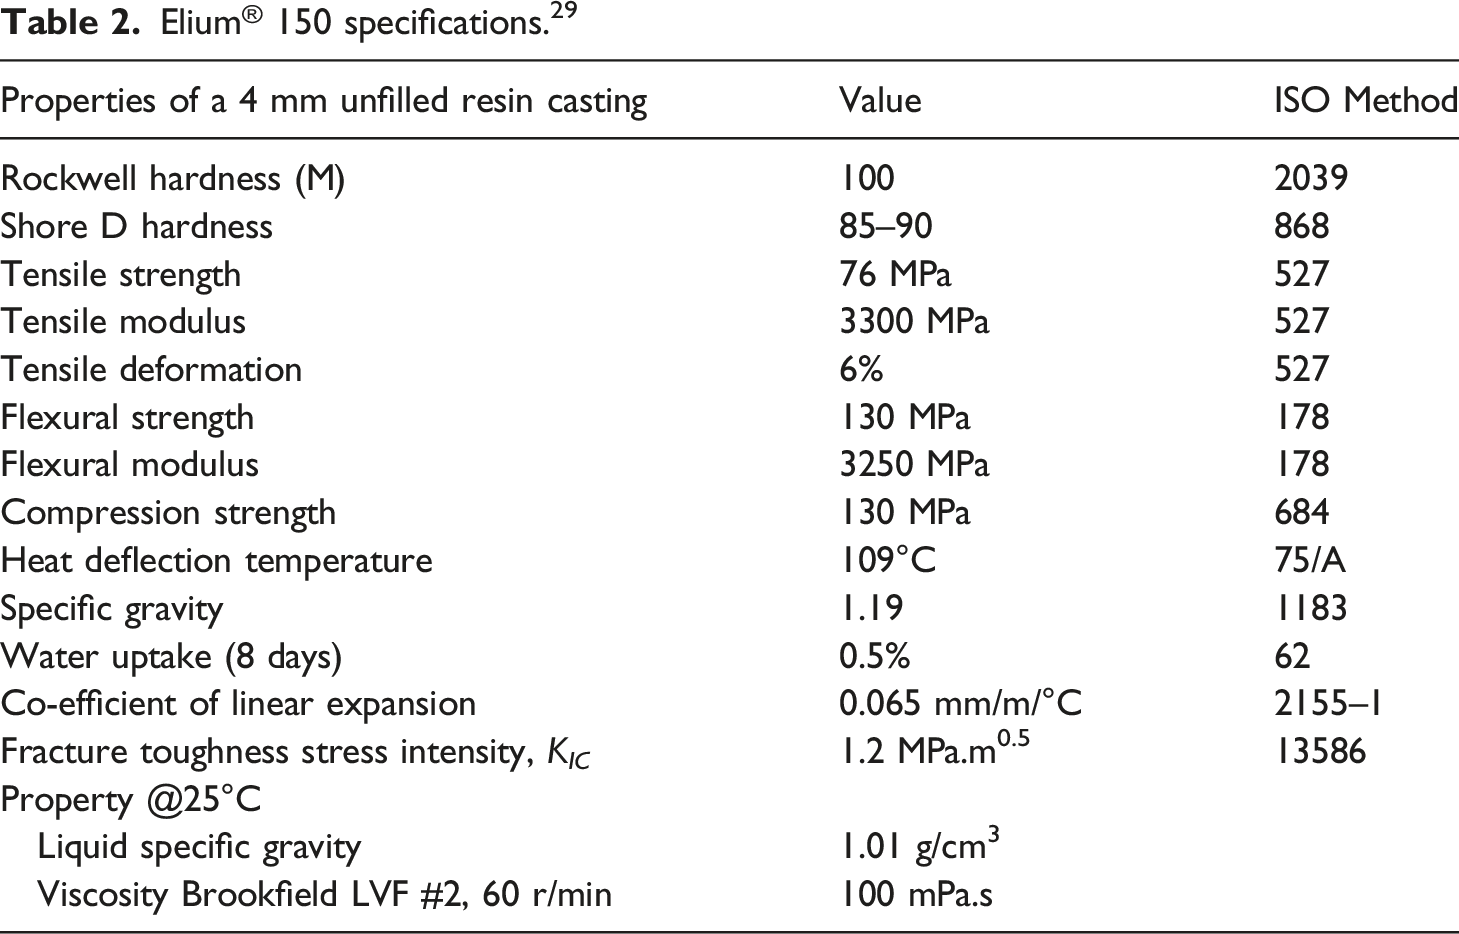
The non-crimp (NC) quadriaxial glass fabric with an areal density of 1200 GSM was used and the schematic view is shown in Figure 1. The structural details of the NC quadriaxial glass fabric are provided in Table 1. The matrix used for this study was MMA TP resin (Elium® 150) supplied by Arkema, France. The polymerization can be initiated in MMA resin to make it Poly methylemethacrylate (PMMA) by adding a peroxide compound such as dibenzyl peroxide (PERKADOX CH-50). In this study, the percentage of peroxide compound used was two wt% of the MMA resin. The specifications and curing details of the TP resin are summarized in Table 2. NC quadriaxial glass fabrics.
27
NC glass fabric structure details.
28
Elium® 150 specifications.
29
Laminates manufacture
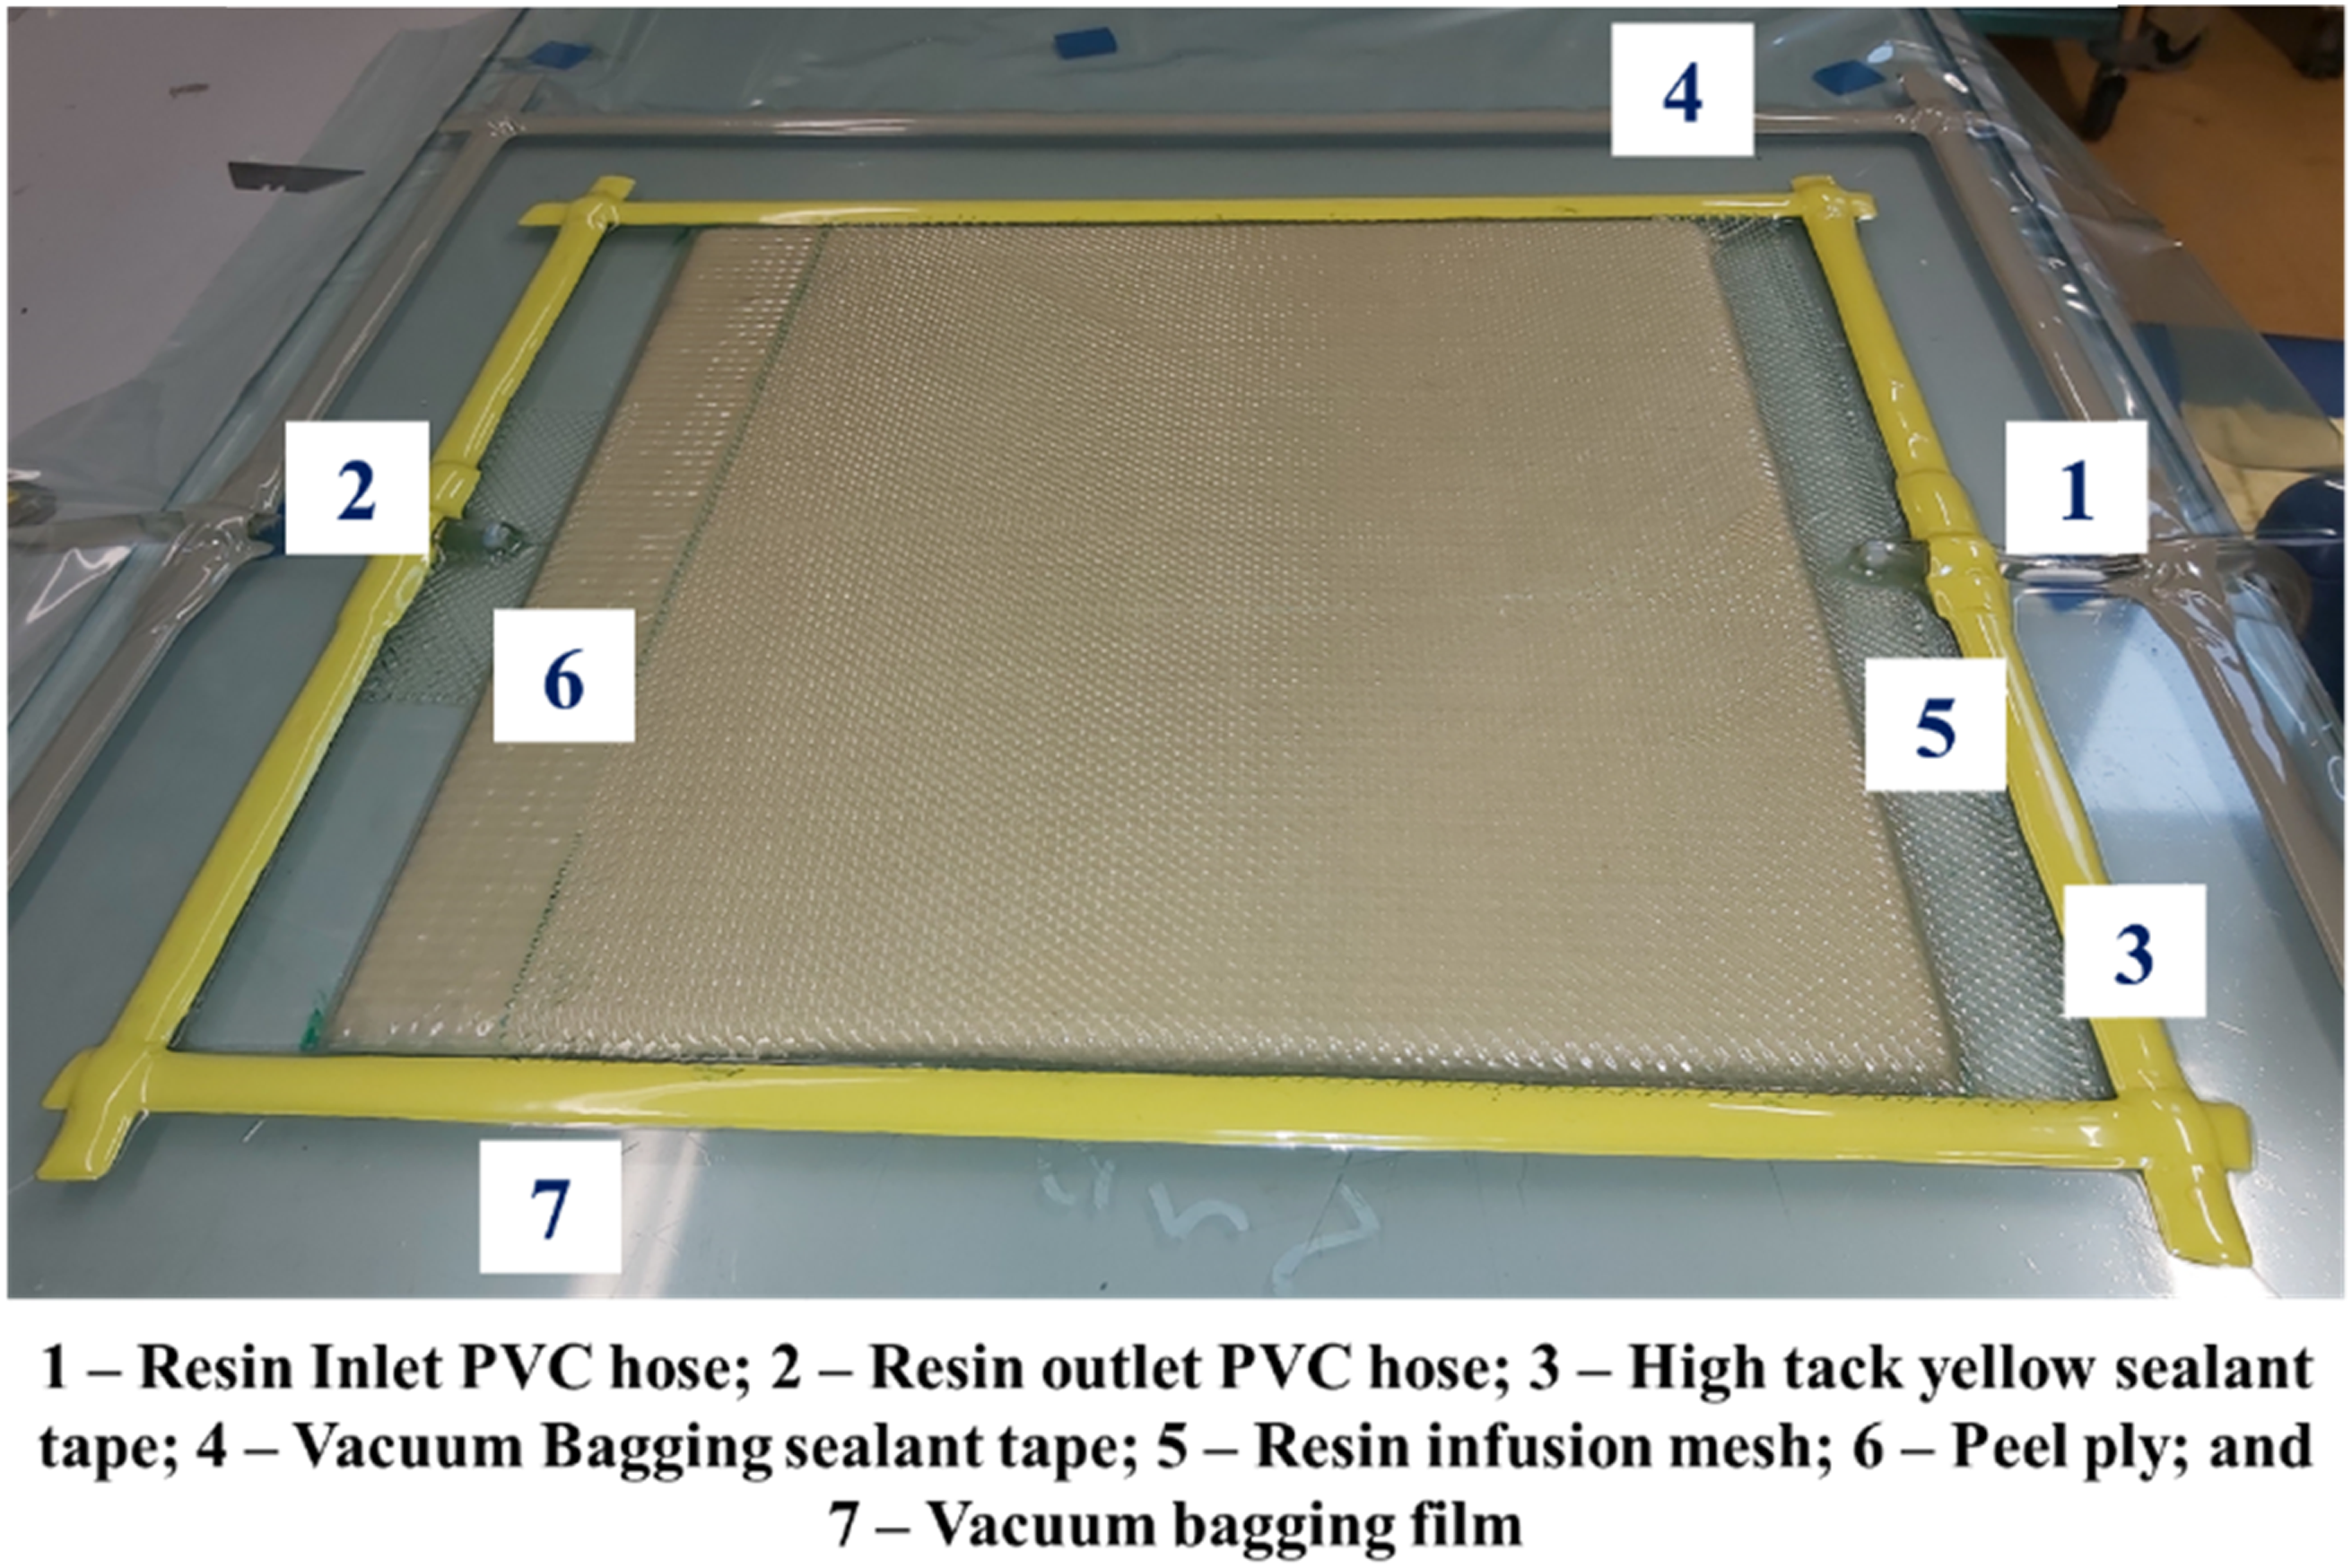
All the laminates were manufactured by placing the dry reinforcement fabric (with a [0°]2S stacking sequence), peel ply and flow medium on a glass tool. The lay-up was then enclosed beneath a flexible membrane secured to the glass tool using sealant tape. The resin suspension was infused without prior degassing at ambient temperature (approximately 20°C). A vacuum pump was used to obtain pressure in the vacuum bag’s 10–20 mbar (absolute). The infusion time was measured from the resin inlet’s opening to the outlet’s closure (the outlet was closed upon observing bubble-free resin in the outlet tube). Test coupons were prepared using a water jet cutting machine. The schematic of the composite manufacturing process is shown in Figure 2. This manufacturing approach is generally auspicious for manufacturing marine vessel components. Setup of VaRTM process.
30
Environmental conditioning
The samples were dried for 4 h at 45°C prior to performing the tests. Samples for ageing were immersed in deionised water at 60°C for 60 days according to the procedure mentioned in Ref. 31. Based on the literature,13,32 deionised water shows more detrimental effects on mechanical properties. The samples were immersed vertically in distilled water. For a particular time, water uptakes were measured through the gravimetric method. This method consists of removing the samples from water and weighing them at regular intervals with a digital balance of 0.00001 gm. The moisture sorption process continued for the duration of ageing, i.e. for 60 days. The mass of the moisture intake or weight gain at a given duration was determined as33,34
Physical properties
Physical properties of the laminates like fibre volume fraction (FVF), density and void content were measured as per ASTM and ISO standards. The thickness of each sample was measured at six different points. The density was measured using a Sartorius density measurement apparatus (0.00001 units) based on the water displacement method as per ASTM D792. The FVF of each sample was estimated as per ISO 14127. Based on the FVF, void content was estimated.
Experimental methods
This section describes the testing methods used to evaluate the mechanical properties of control and aged samples. The test methods include tensile, flexural, ILSS, Double cantilever beam (DCB) and End notched flexure (ENF). Five samples were tested for each configuration and their average value is presented. For all the tests, failure was assessed through a high-definition digital camera. In the case where failure was not apparent via camera images, SEM was used.
Tensile
The samples for tensile testing experiments were prepared according to ASTM D3039. These tests were performed under quasi static loading conditions at a loading rate of 2 mm/min using a Tinius Olsen bench-top tester (Model H25K-S UTM, 50 kN load cell). The gauge length of the sample was 80 mm and aluminium tabs were attached to the samples to provide a firm grip between the machine and the sample.
Flexura
The three-point bend test was performed as per ASTM D7264. A Tinius Olsen bench-top tester (Model H25K-S UTM) with a 10 kN load cell was used. Thesamples were prepared and tests were carried out, maintaining a span-to-thickness ratio of 16:1. The test speed was 1.0 mm/min for both the control and aged samples. The setup of the three-point bending test involved the upper roller of 10 mm diameter and the lower roller of 4 mm diameter.
The flexural stress, flexural strain and flexural modulus were calculated using the equations (2)–(4)
The peak strain at the outer surface occurs at mid-span and it is calculated using following
The flexural modulus, E
f
, is the chord modulus of elasticity. It is given by the ratio of the stress range over the corresponding strain range
Interlaminar shear strength
The ILSS tests were performed using benchtop type Tinius Olson: Model 25ST UTM with 10 kN capacity load cell as per ASTM 2344. The dimensions of the samples were 20 mm × 10 mm × t mm (t-thickness of the sample) and the loading rate was 1 mm/min. The diameters of the upper and bottom rollers were 10 mm and 5 mm in diameter, respectively. The tested samples were examined under SEM to identify the change in interlaminar failure mode due to water ageing. The ILSS values were calculated using the following equation 
Double cantilever beam
Mode-I fracture toughness (G
Ic
) test, using DCB test sample, was performed as per ASTM D5528. The G
Ic
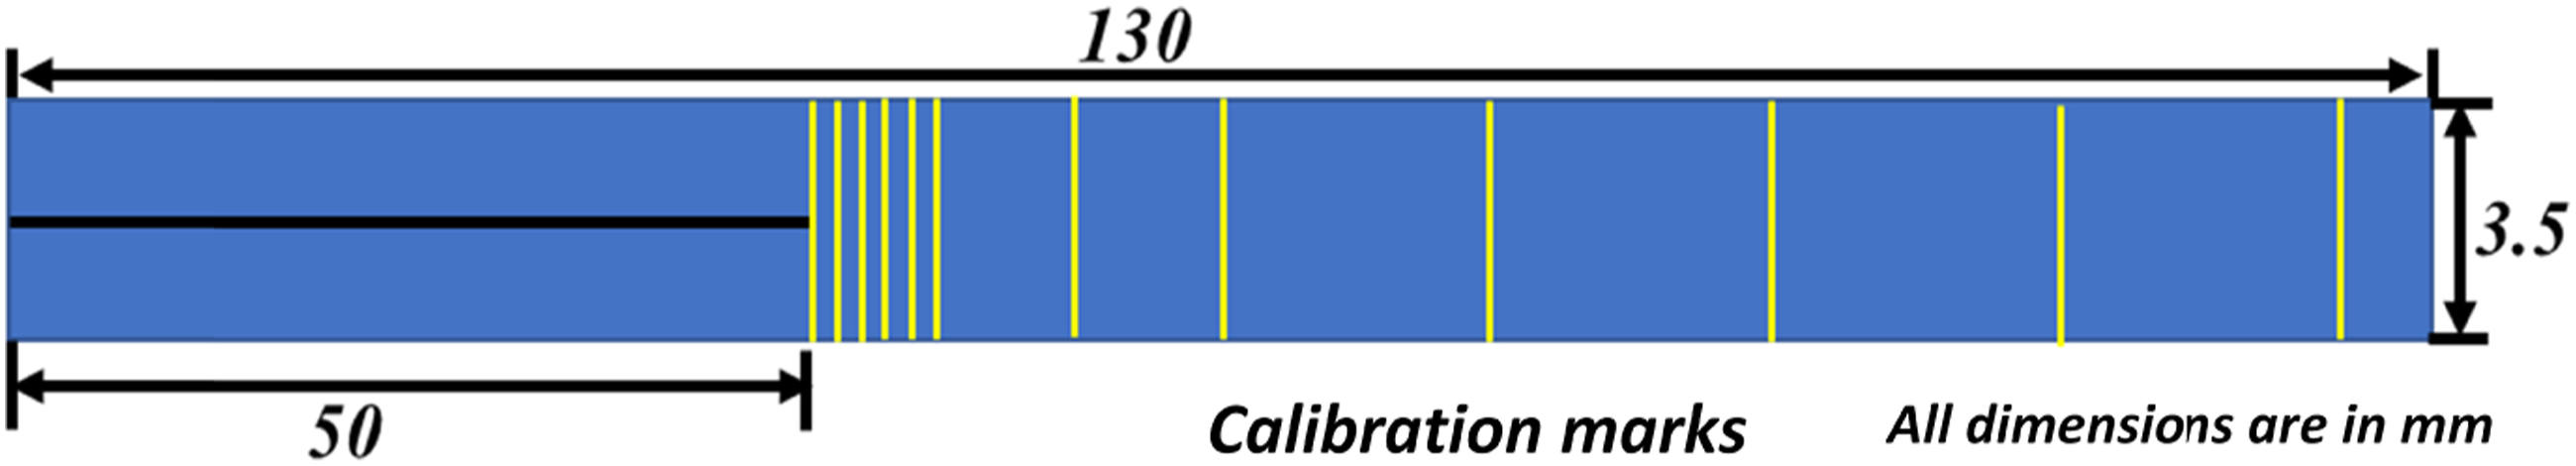
was obtained using modified beam theory, based on initiation and propagation values for critical Mode-I strain-energy release rate. Tests were performed using Tinius Olsen H25KS test machine with a load cell of 5 kN (expected accuracy of 0.5%). A polyimide tape of 60 mm in width and 15 μm thick was inserted to generate pre-crack. This width corresponds to an initial delamination length of approximately 50 mm plus the additional length necessary to bond the loading blocks. Loading blocks of 25 mm × 12.5 mm were adhered to the samples using an adhesive. The load was applied at a displacement rate of 5 mm/min as shown in Figure 3. Calibration markings were made along the thickness of the sample from the crack tip to capture the propagation of the delamination. A digital camera was used to record crack propagation and these images were successively used to measure the crack length. Mode-I fracture toughness, G
IC
, was calculated using modified beam theory using the following equation Schematic of DCB test sample.
End notched flexure
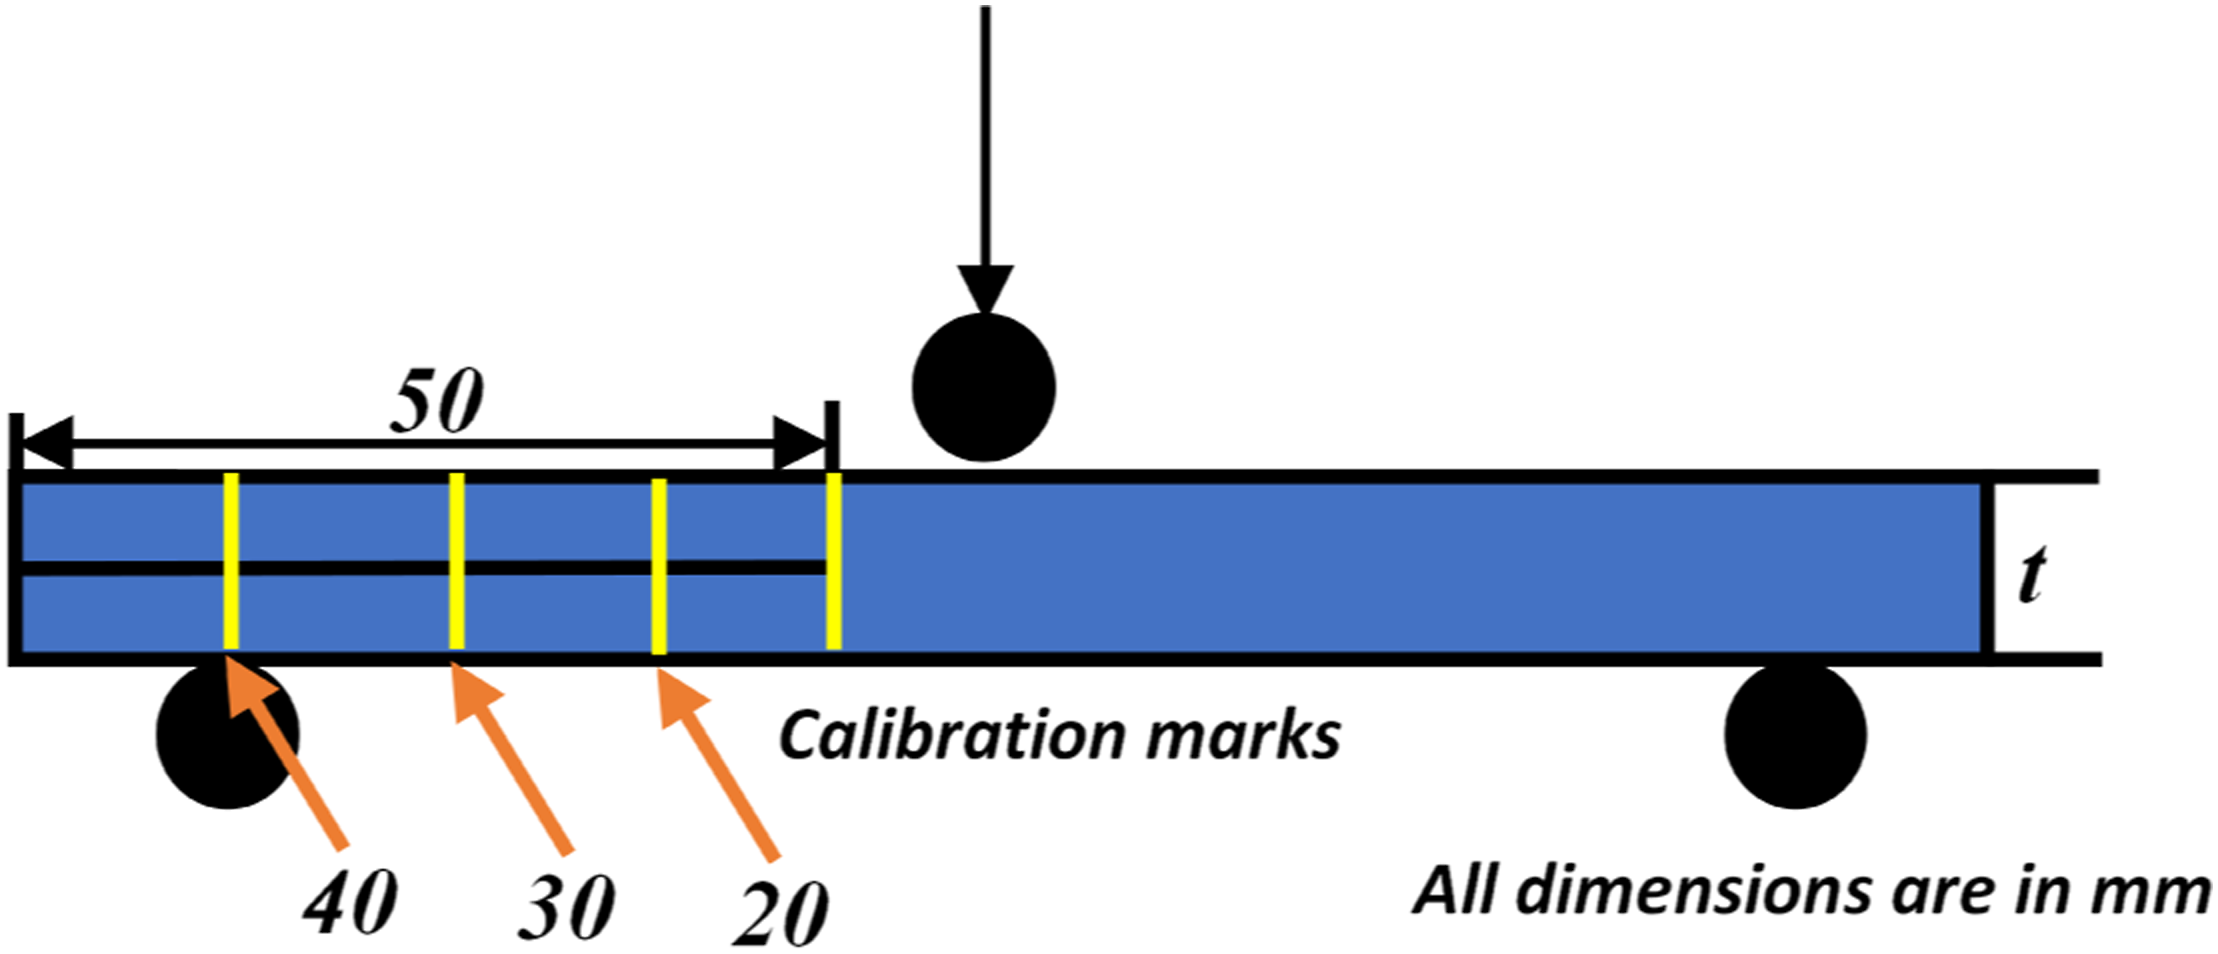
The Mode-II fracture toughness, ENF tests were carried out as per ASTM D7905. Samples were supported from the bottom by cylindrical rollers of 5 mm diameter. A roller of 6 mm diameter was placed on the top aligned with the centre of the sample to apply the load. Calibration markings were made on the sample, as shown in Figure 4, to assist the visual detection of the delamination tip and to make the compliance calibration (CC). Along the thickness of the samples, the edges were marked with three vertical CC markings, at distances of 20 mm, 30 mm and 40 mm from the tip of the insert (Figure 4). Loading was applied under displacement control at a rate of 0.5 mm/min for all CC markings. Mode-II fracture toughness, G
IIc
, was calculated using the CC method from the following equation Schematic of Mode-II test sample.
Dynamic mechanical analysis
To evaluate any change in viscoelastic behaviour and glass transition temperature (Tg), the composite coupons were tested using dynamic mechanical analysis (DMA) in a TA instrument Q800 as per ASTM D7028. The experiments were conducted under displacement control (10 μm) at a nominal frequency of 1.0 Hz, a heating rate of 3°C/min up to a maximum of 140°C. The storage modulus is a measure of elasticity: the onset temperature is the temperature at which the storage modulus drops dramatically, indicating a loss in rigidity and hence defining the service temperature ceiling of the material. Tan delta indicates the viscoelastic damping behaviour of the material. The storage modulus (E′) is the ratio of the in-phase stress to the applied strain, representing the energy stored in the materials in every cycle of deformation. 35 The loss factor, tan δ, is the ratio between loss modulus and storage modulus. The peak in the tan δ curve occurs due to the relaxation of the polymer chains and the corresponding temperature is considered as the Tg. 35
Results and discussions
Physical properties
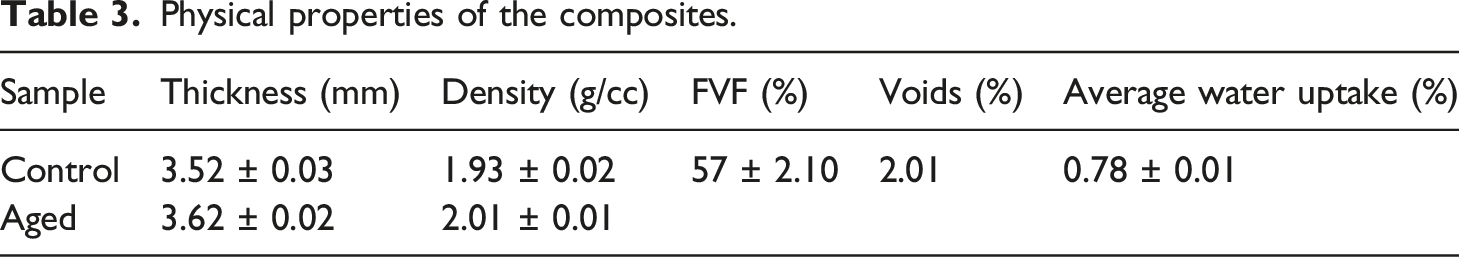
Physical properties of the composites.
Environment conditioning
The aged and control samples had a similar thickness ranging between 3.5 and 3.6 mm and FVF was maintained at ∼57%. The weight of each sample was measured before and after immersion to calculate the water intake and expressed in percentage. The water uptake of the present GF/E samples was 0.78%. By measuring the weight gain percentage, the performance of the samples due to immersion was calculated based on the protocols of the marine classification society Lloyds 2013. Diffusion kinetics of the water intake was not studied in the present work.
Tensile properties
The tensile load-displacement response of control and aged samples is shown in Figure 5. The tensile test was performed until failure of the sample, as depicted in the graphs. The initial linear displacement was almost the same in control and aged samples up to a displacement of 1 mm. After 1 mm, there was a slight variation in the slope of the plastic region and the load uniformly increased with displacement up to a threshold value. After reaching the threshold point, a sudden drop in load was observed for all the samples. In Figure 5, the aged samples exhibited lower load-bearing capacity than the control ones. The aged samples failed at 25 ± 0.64 kN peak load and ∼4 mm elongation before failure, providing a tensile strength of 286.53 ± 15.64 MPa. Load-displacement graphs for tensile testing of aged and control samples.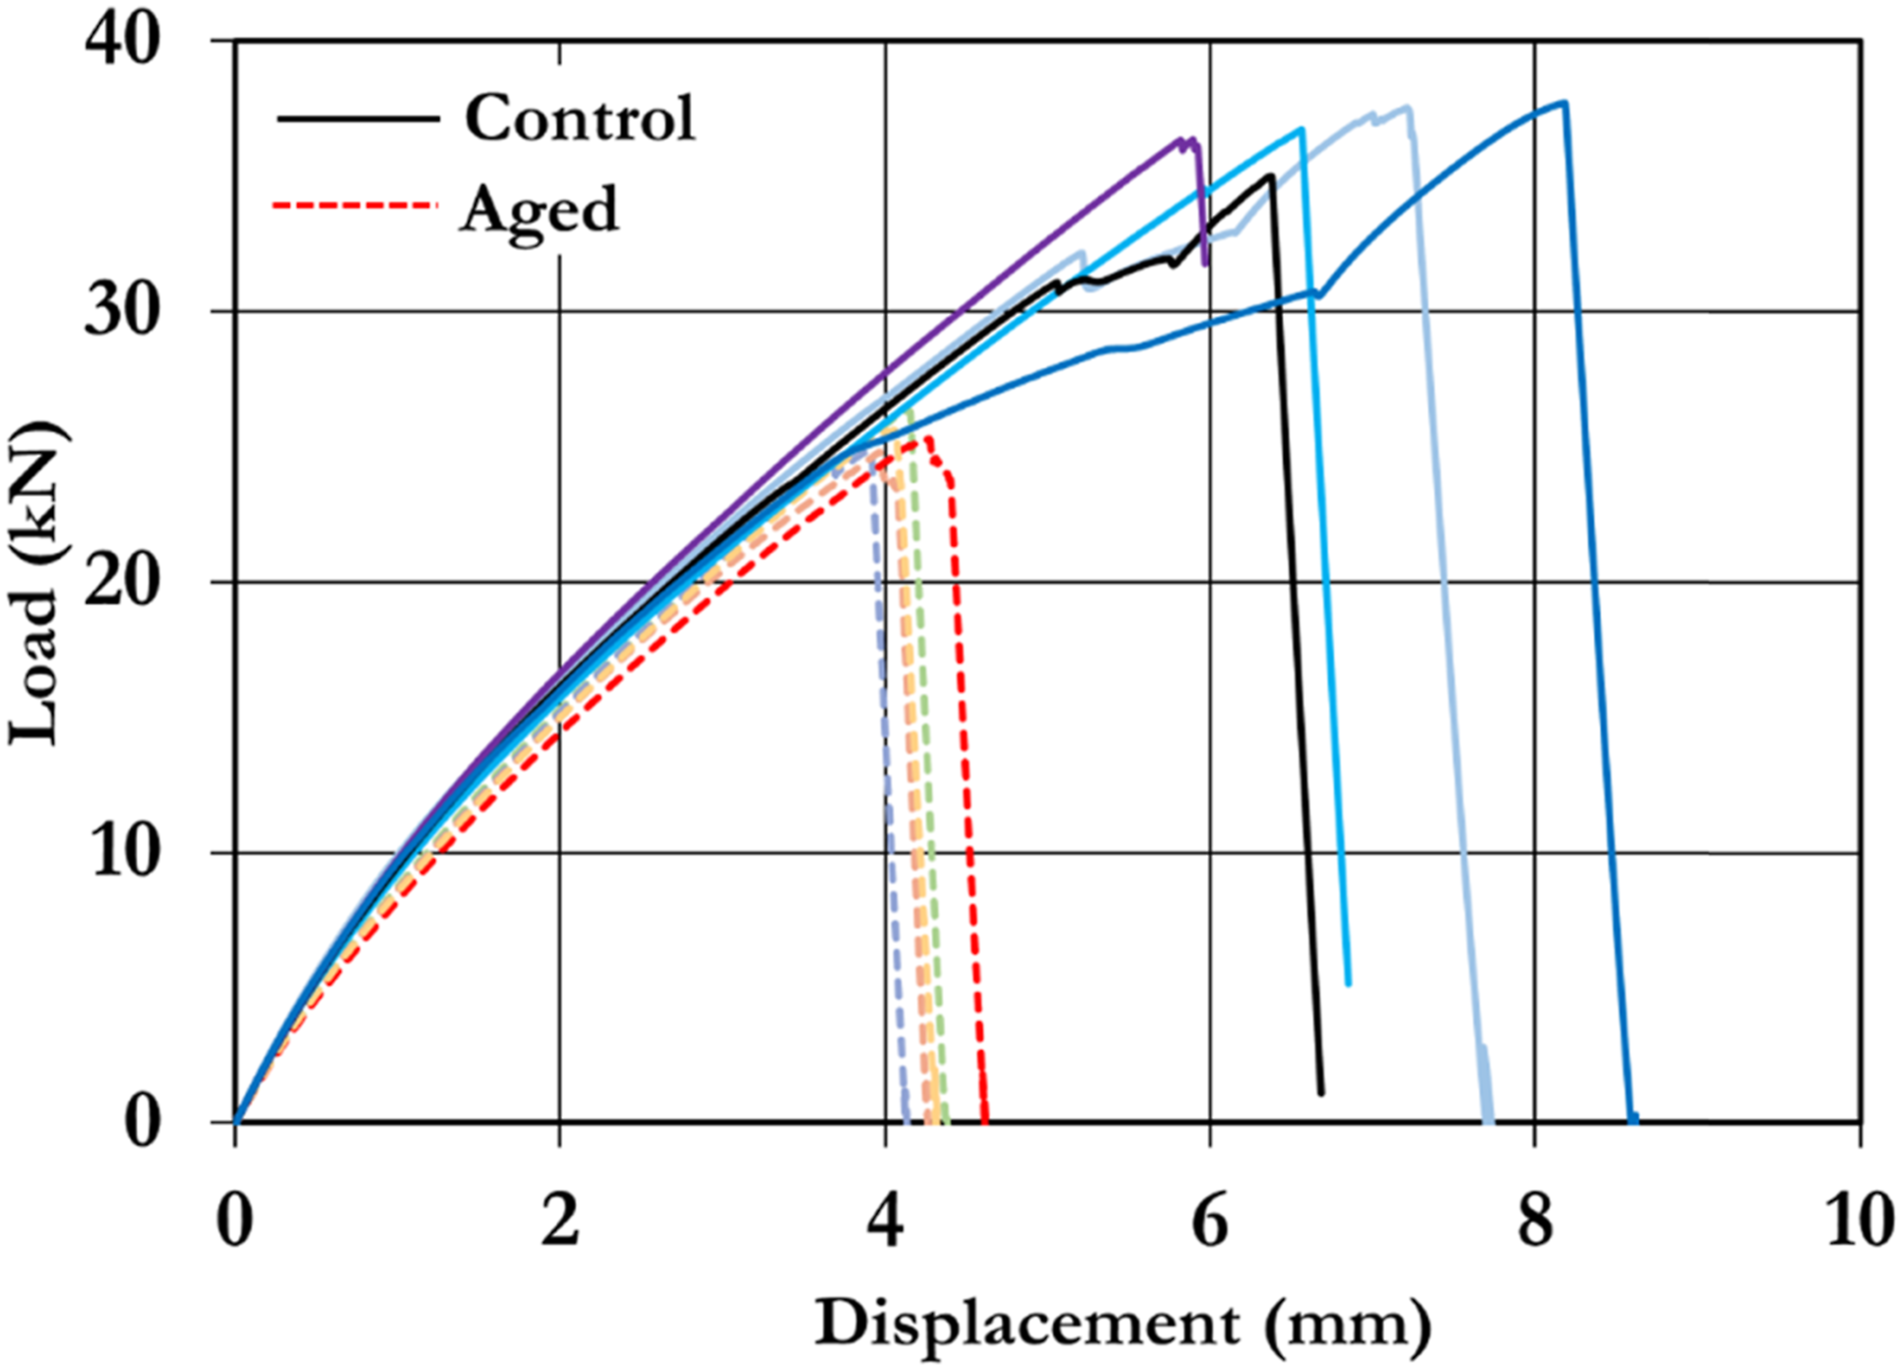
In contrast, the control samples failed at 36.6 ± 1.08 kN and ∼8 mm elongation at failure providing a tensile strength of 413.71 ± 20.70 MPa. The results showed that ageing reduced the load-bearing capacity and tensile strength of the GF/E composites by ∼30% and elongation before breakage by ∼50%. These results confirm the study of,11,12 where tensile properties of Elium® based glass composites degraded due to ageing.11,12
The tensile failure was analysed by considering two sides of the sample, such as failure in the thickness direction at different locations and failure on the surface of the samples. In both samples, the fibre failure was imminent, extending from the centre towards the grips. The extent of fibre failure was significant in aged samples due to moisture ingress leading to deterioration in mechanical properties. The amount of water intake influenced the intensity of deterioration in the composite material.
In the control samples (Figure 6), failure was initiated from the centre and fibres were peeled off towards the edges. In the thickness direction (Figure 6(a)), at the centre of the sample, the damage was due to fibre, matrix, shear, fibre/matrix debonding and delamination failure. The delamination slowly diminished halfway (after approximately 30 mm from the centre on either side) to the edges. On the surface of the control sample (Figure 6(b)), due to the quadriaxial nature of the fabrics, damage occurred in a trapezoidal form. Fibres in the 0° and 45° failed, exposing the fibres in the transverse direction. In addition, matrix cracks, fibre crush, fibre shredding, fibre splitting and debonding were observed. Tensile failure at different locations of control sample.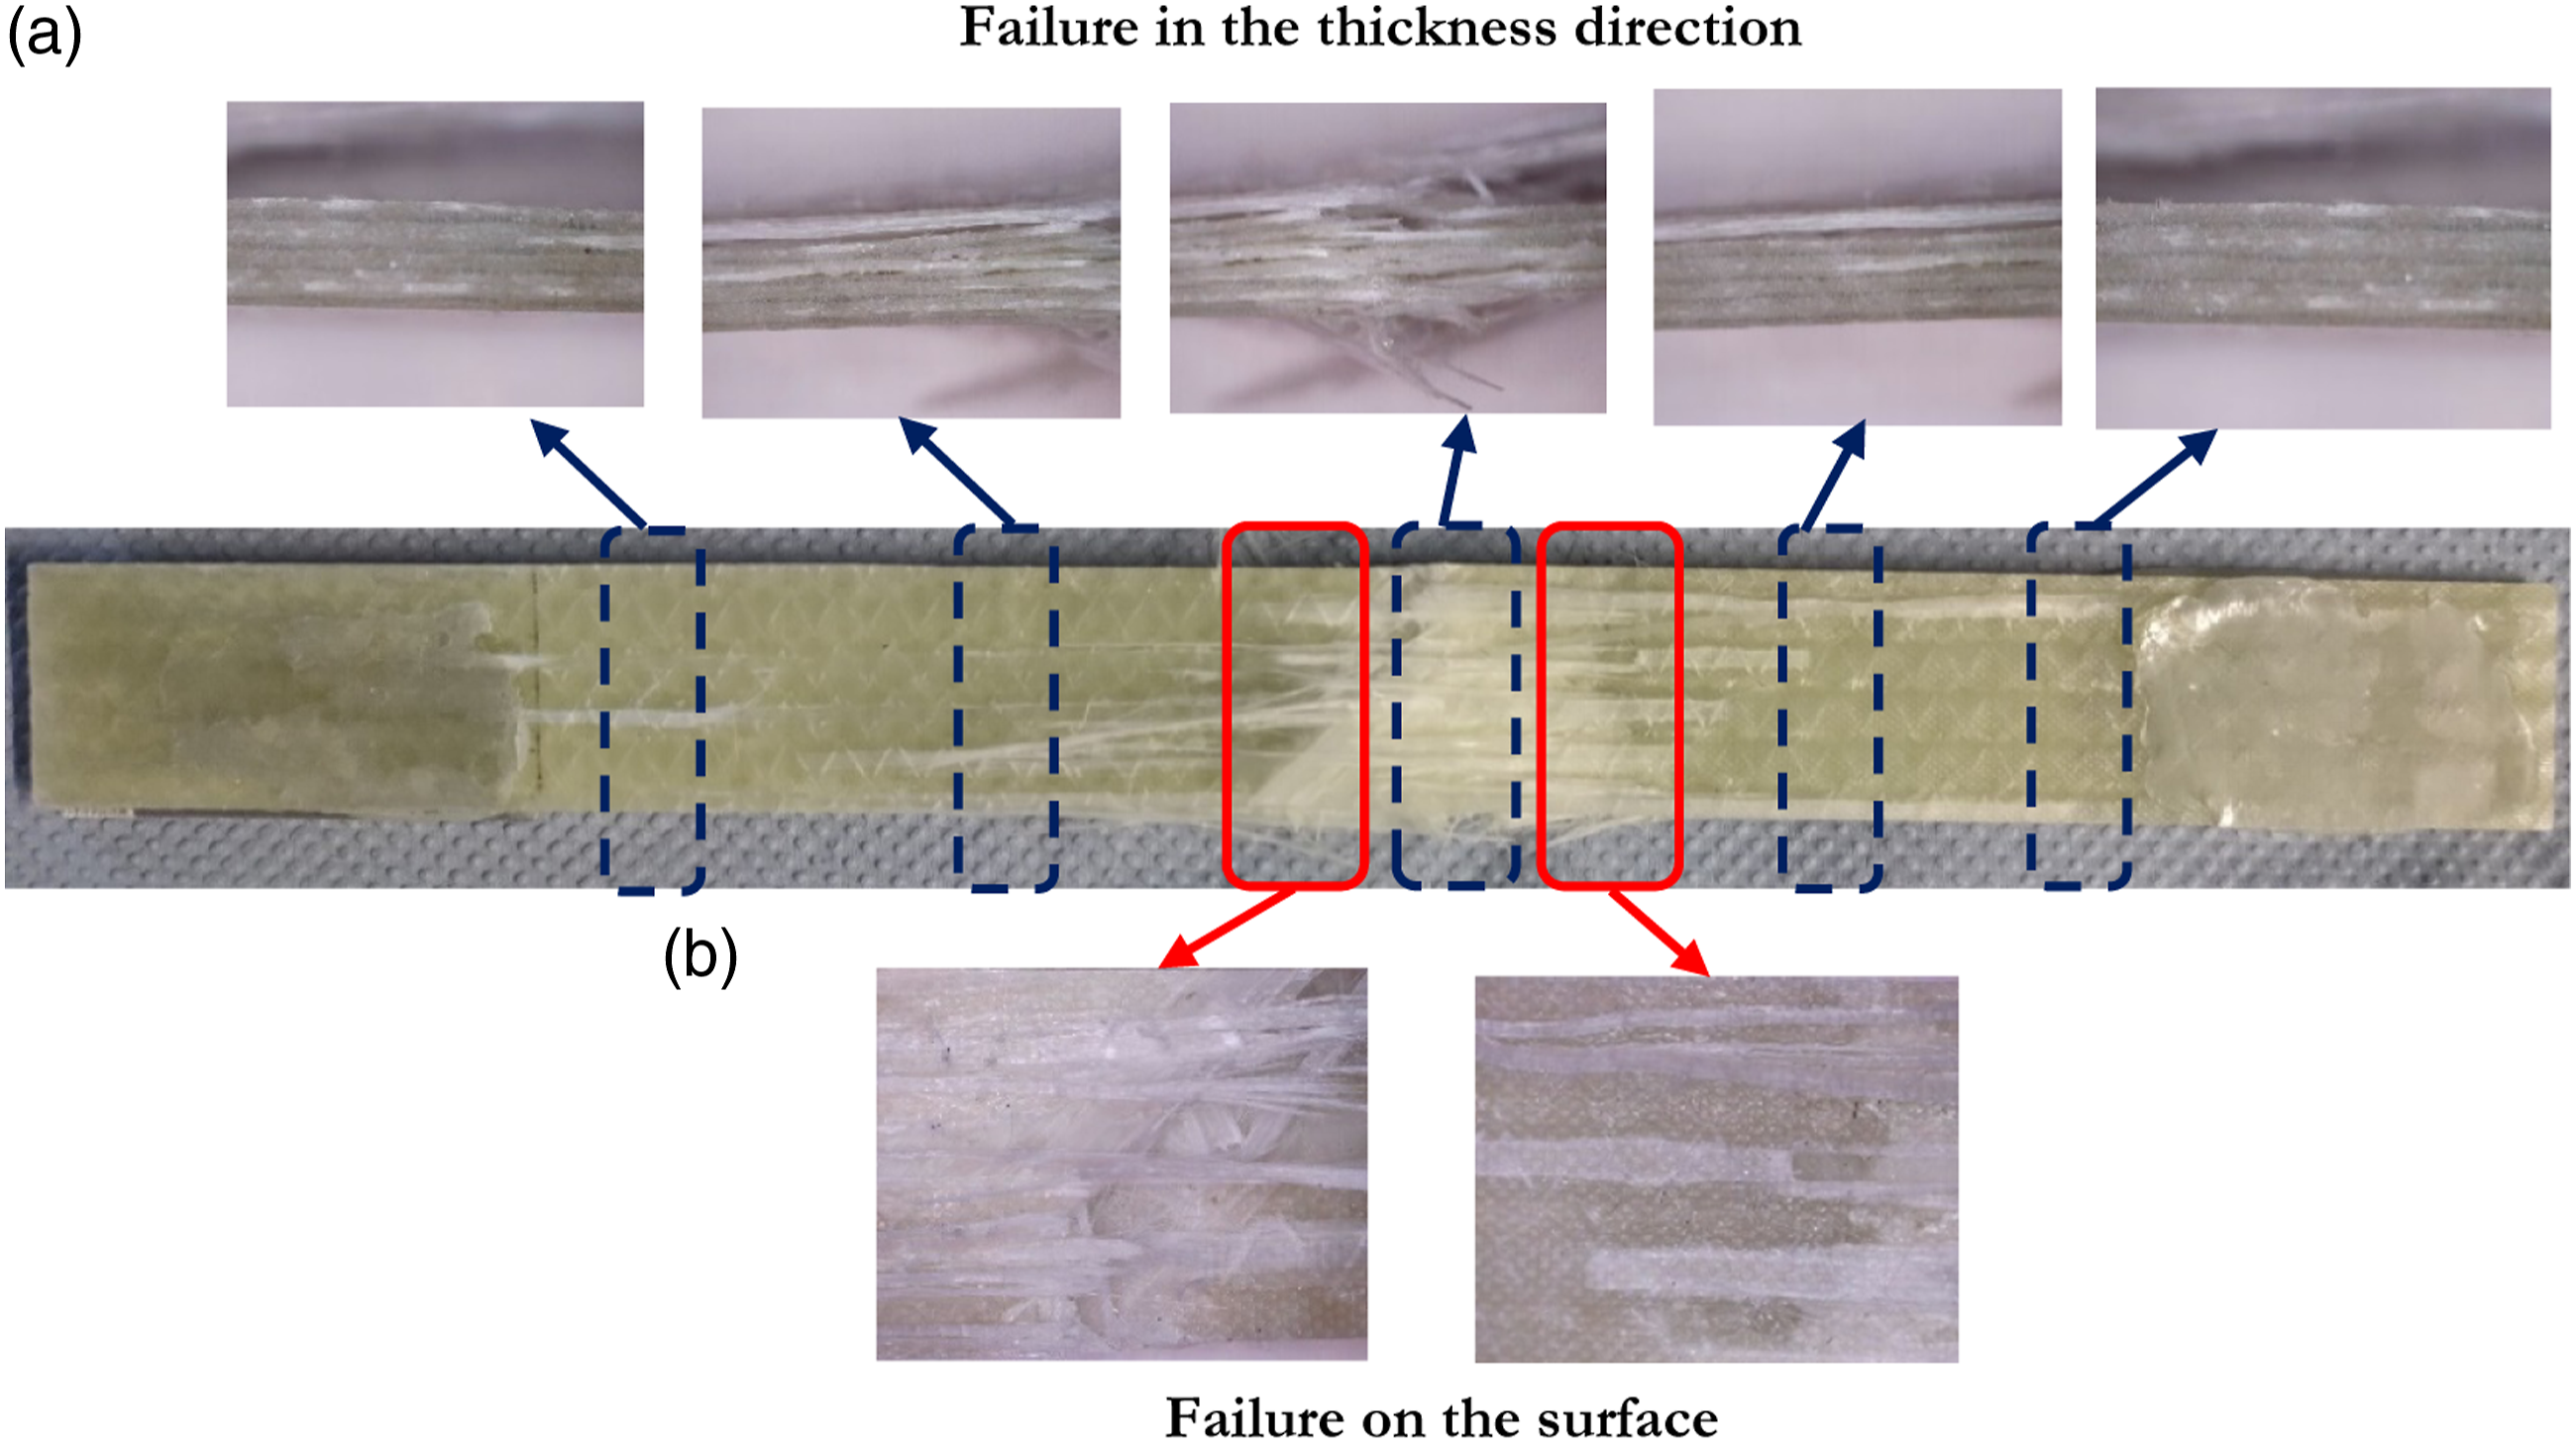
Tensile failure (Figure 7) in aged samples was symmetric from the centre of the sample. By seeing the fibres themselves, one can say that the tensile failure in aged samples was catastrophic. Fibre splitting was extensive in the transverse direction of the loading. In the thickness direction (Figure 7(a)), delamination at the centre was huge, along with fibre failure, shear failure and deformation. The delamination extended from the centre to the edges up to 50 mm from either side of the centre. At the centre of the aged sample (Figure 7(b)), fibre failure and matrix cracking were observed like in the control sample. Also, failure of the matrix due to ageing can be seen clearly on the failure surface. The moisture weakened the matrix, reducing the fibre/matrix interface and leading to more damage. Tensile failure at different locations of aged sample.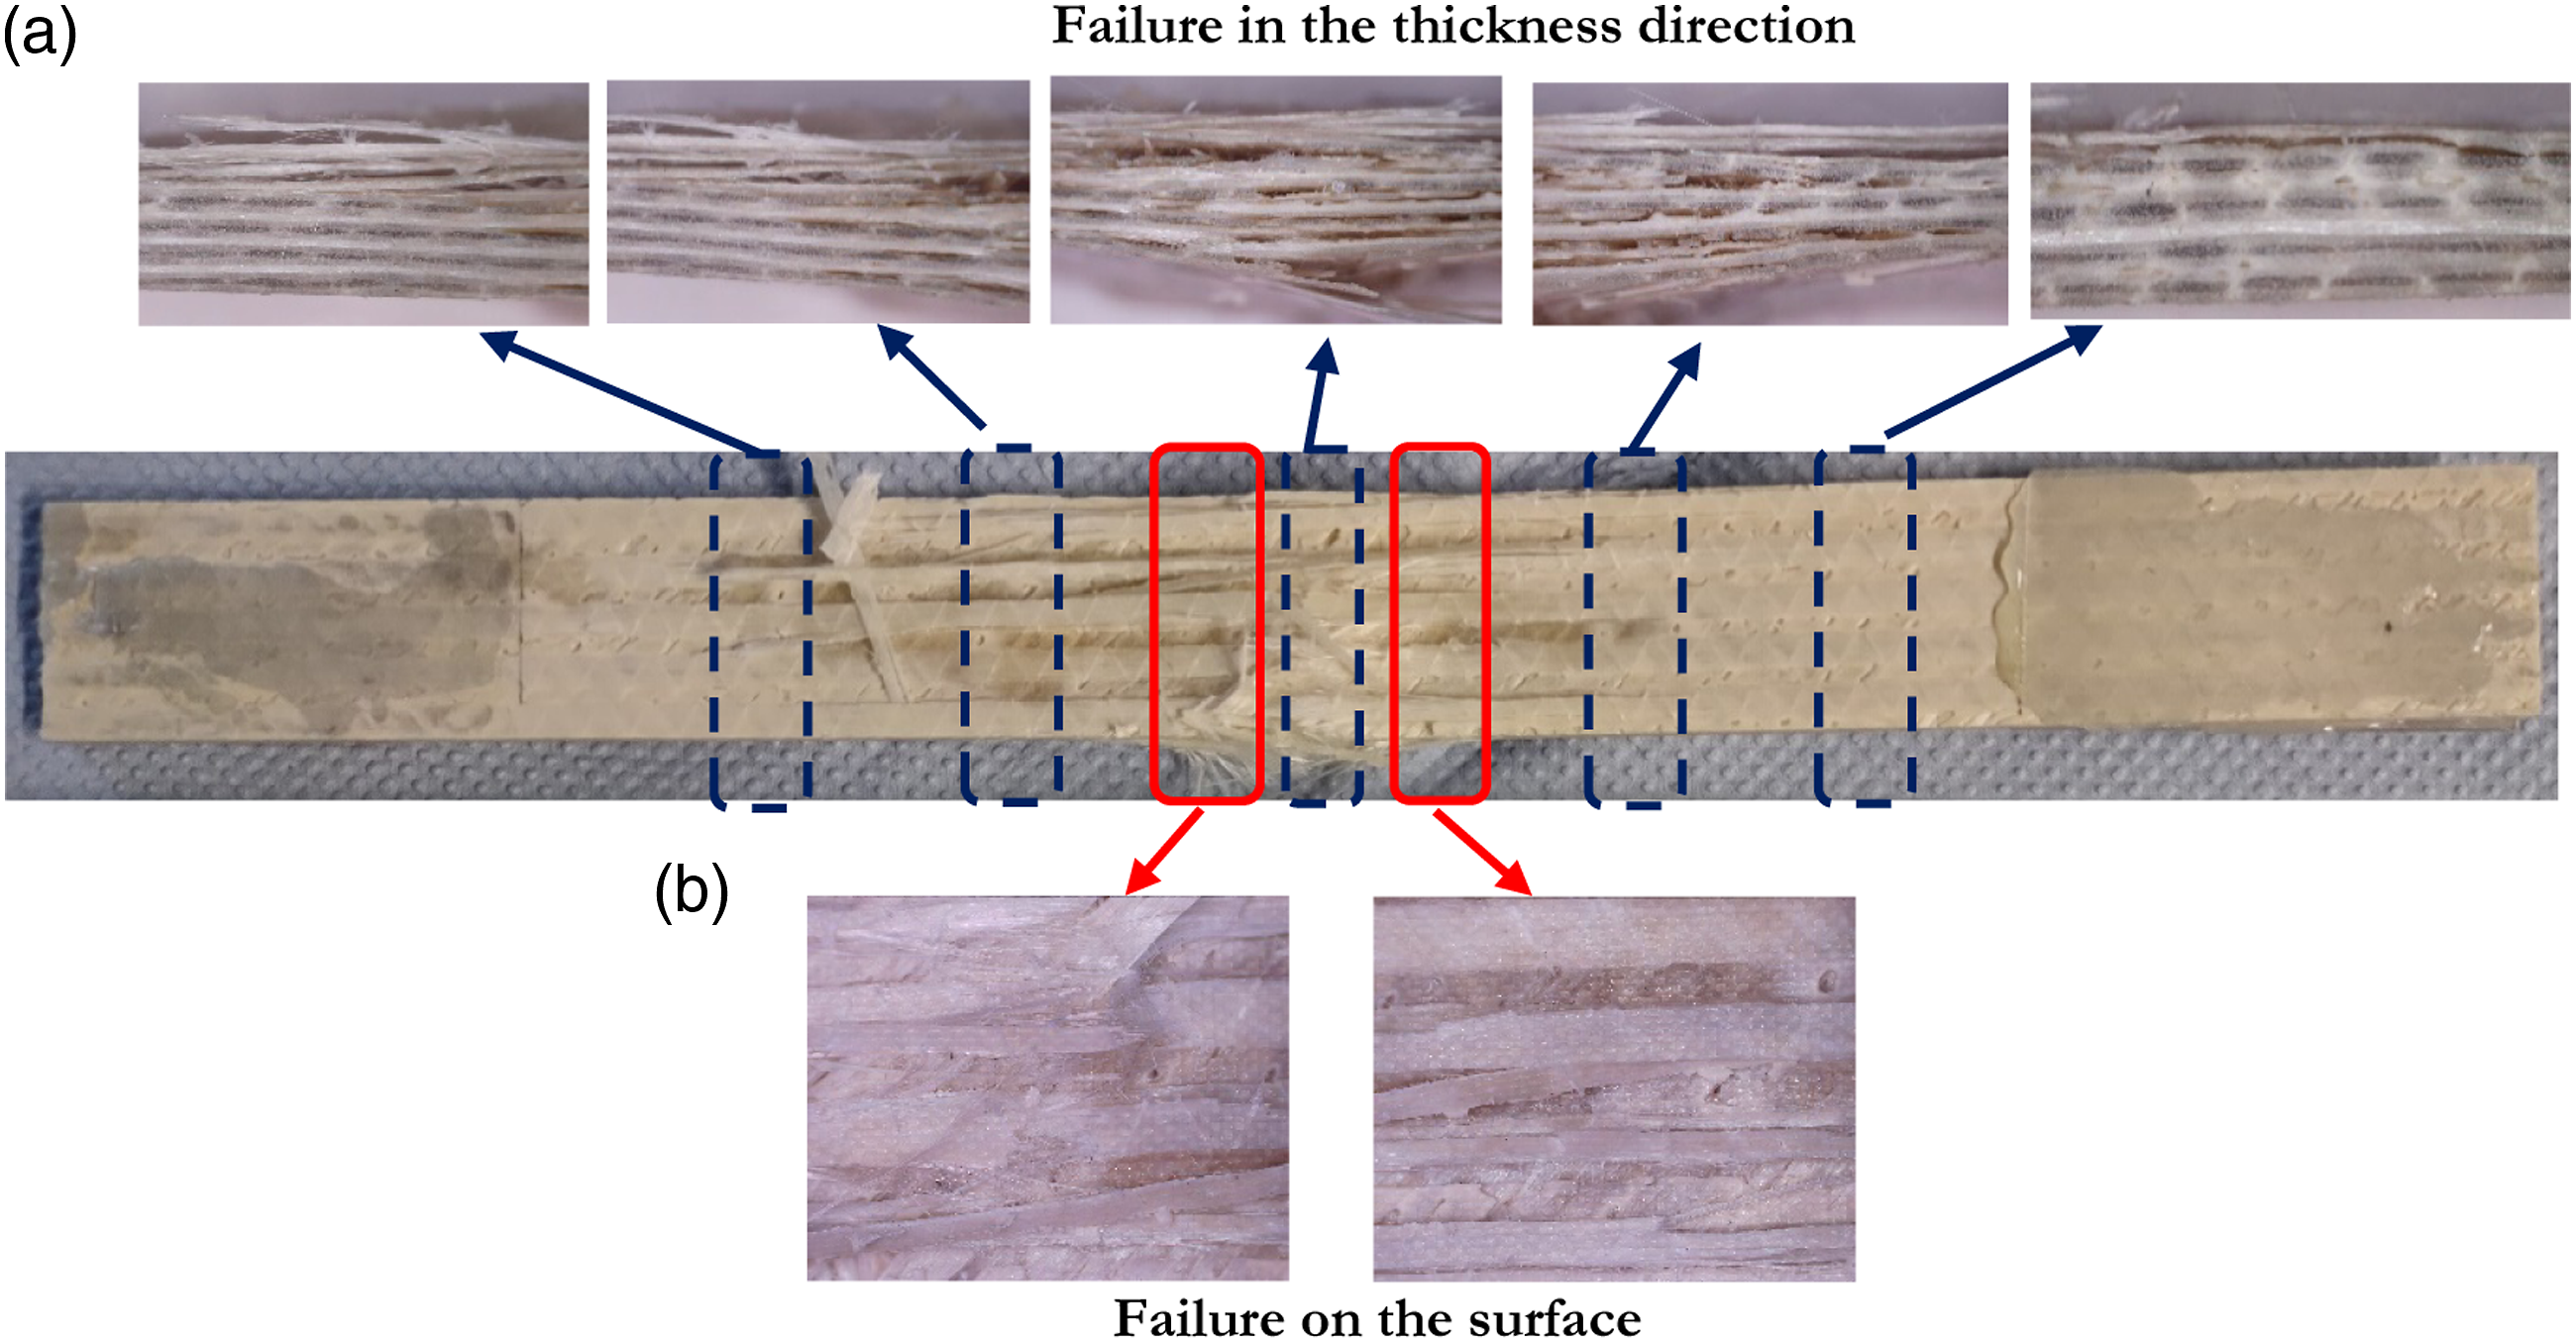
Flexural properties
Figure 8 shows the flexural stress-strain response of aged and control samples for GF/E composites. In Figure 8, the linear region represents the elastic region and the nonlinear region represents the plastic region. For both samples, just before peak stress, there was a minute fluctuation in the response, representing the failure of the first layer via matrix cracking and fibre damage. Beyond peak stress, a few minor fluctuations were attributed to the deformation of the further layers due to the initiation of buckling. Stress-strain graph for flexural testing of aged and control samples.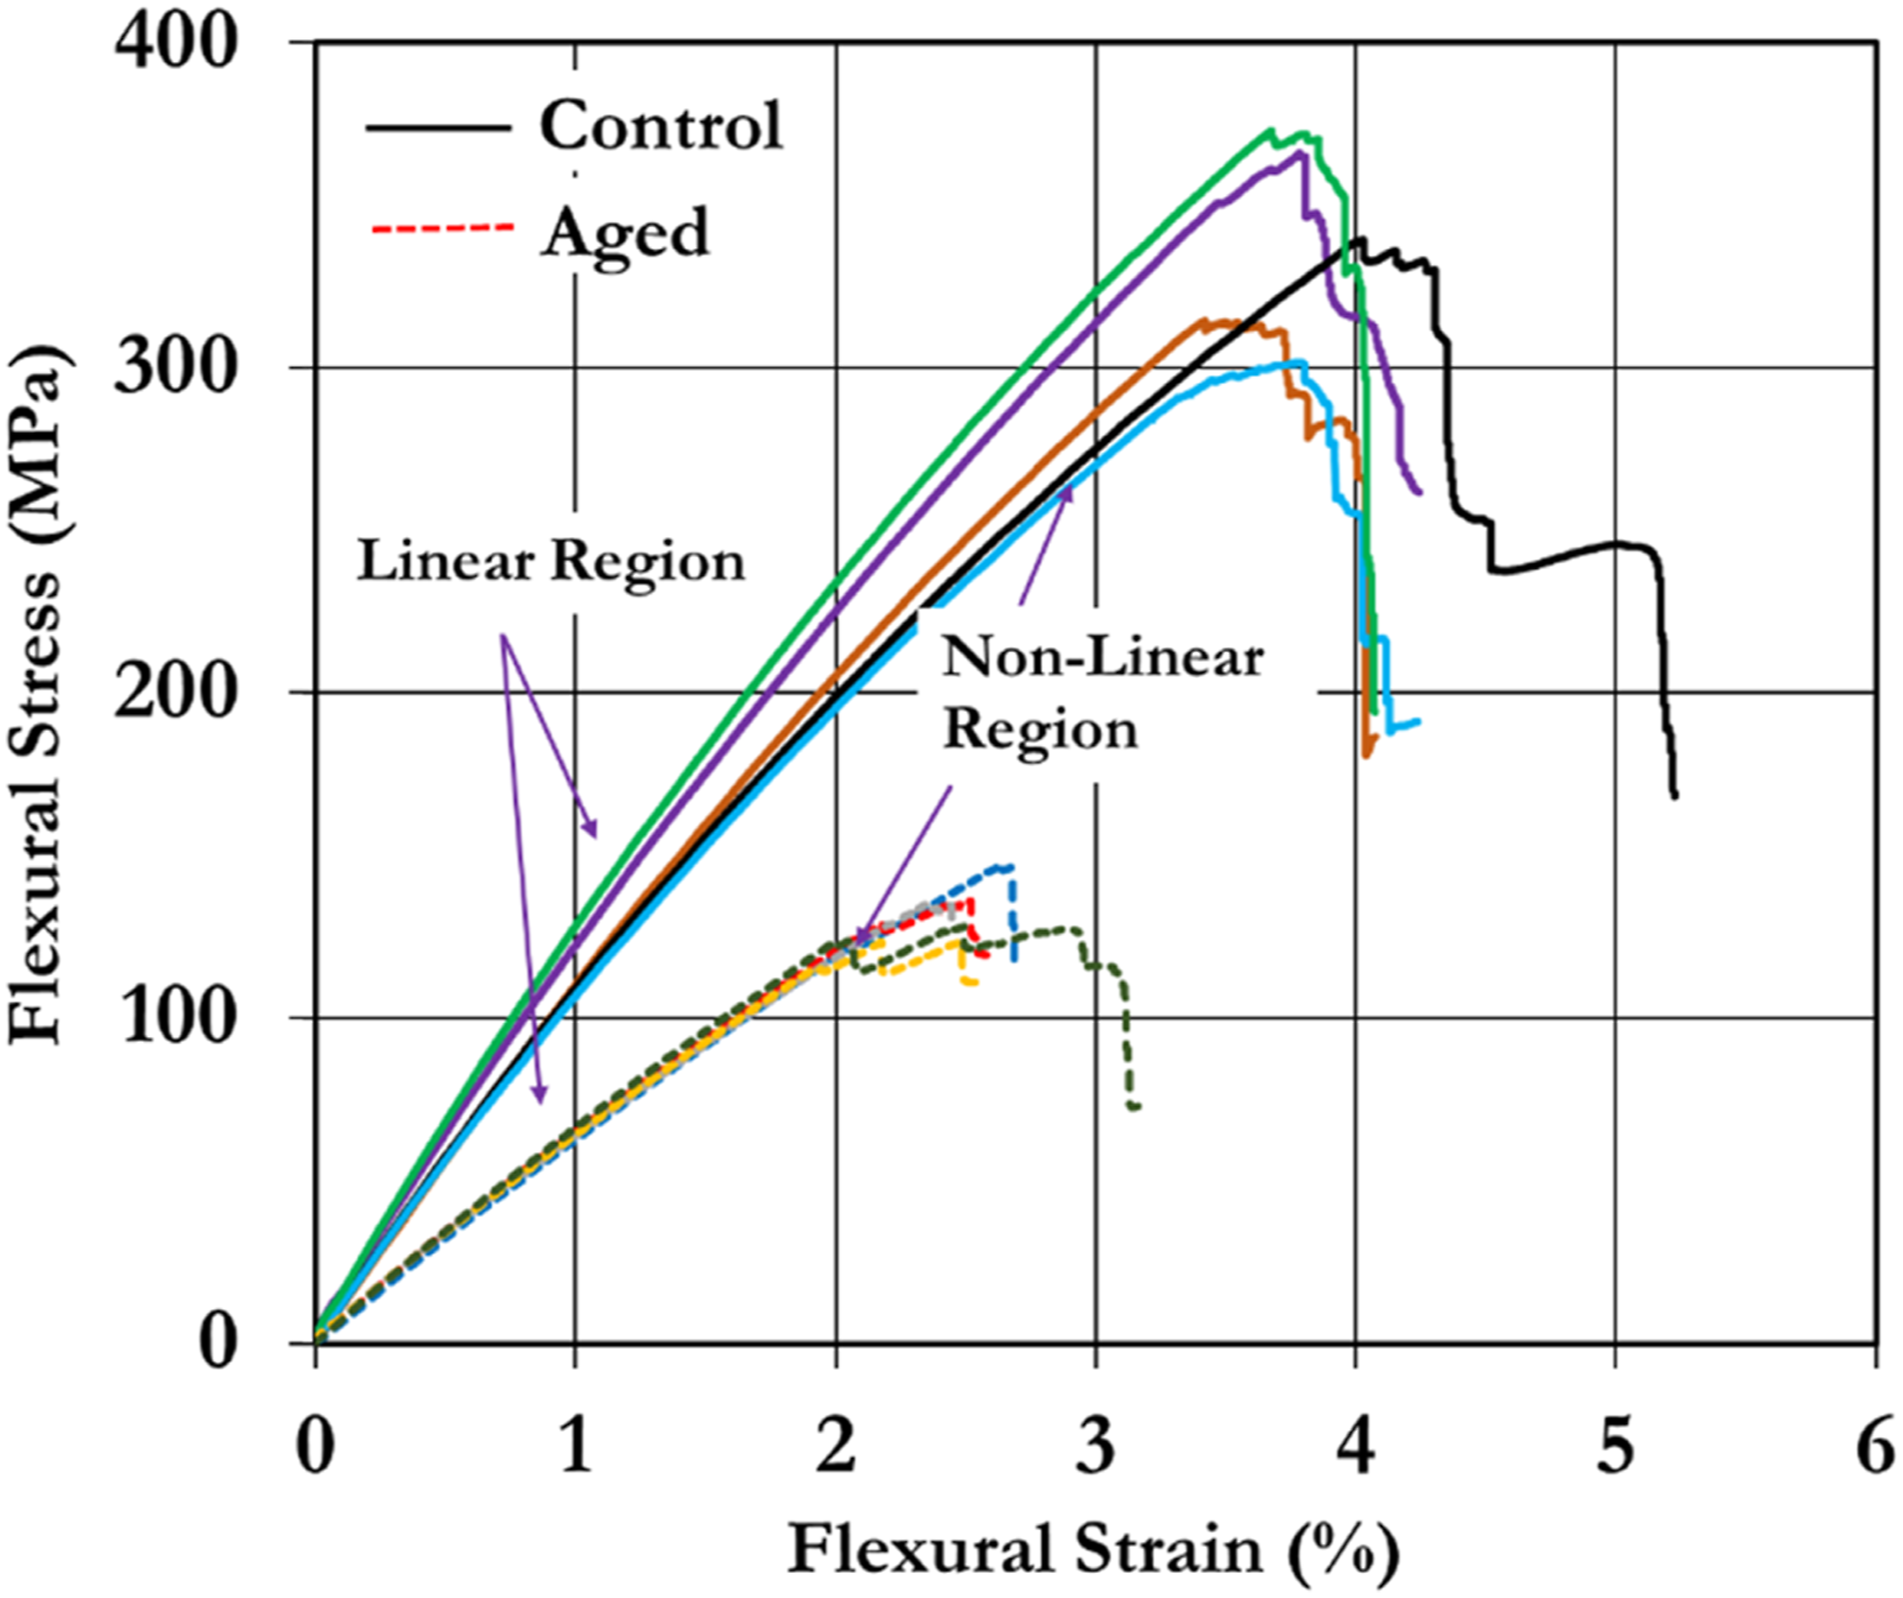
It is clear from the flexural response that there is an apparent deviation between the control and aged samples. The slope of the curve for aged samples depicts almost half the strain value as the control samples. This represents that higher strains are achieved for the aged samples at lower stress. The reduction in flexural properties was due to hygrothermal ageing. The flexural modulus of the control samples was reduced by 62.40% due to water uptake. The water molecules attack and degrade the polymer chain and reduce its stiffness.
Additionally, the water uptake causes swelling of the matrix in the presence of fibres which causes internal stress and reduces the sample’s strength. 6 The average peak load values under flexural testing for aged samples are 526.40 ± 35.18 N at the displacement of 3.76 ± 0.26 mm and flexural strength of 136.31 ± 13.26 MPa. In the control samples, the average peak load was 1278.80 ± 58.53 N at the displacement of 5.68 ± 0.27 mm with a flexural strength of 331.01 ± 25.38 MPa. The decreased flexural strength and elongation were observed to be ∼59% and ∼32% for the aged samples.
Figure 9 shows the flexural failure in control and aged samples. Both samples exhibited fibre failure along with splitting and matrix failure on the compression side. Both the samples also exhibited fibre buckling and it was limited to the top layer. In the control samples (Figure 9(a)Figure 9(a)), though damage initiation occurred on the compression side (loading side), there was no evidence of failure on the tension side and zero deformation was observed. Fibre failure was observed at different locations (highlighted). In the case of aged samples (Figure 9(b)), buckling fibres on the top layer, followed by fibre breakage, were evident on the compression side. Unlike control samples, interlaminar failure was initiated between the top two layers of aged samples. Also, minor delamination was observed on the tension side of the aged sample. Flexural failure of control and aged GF/E composites.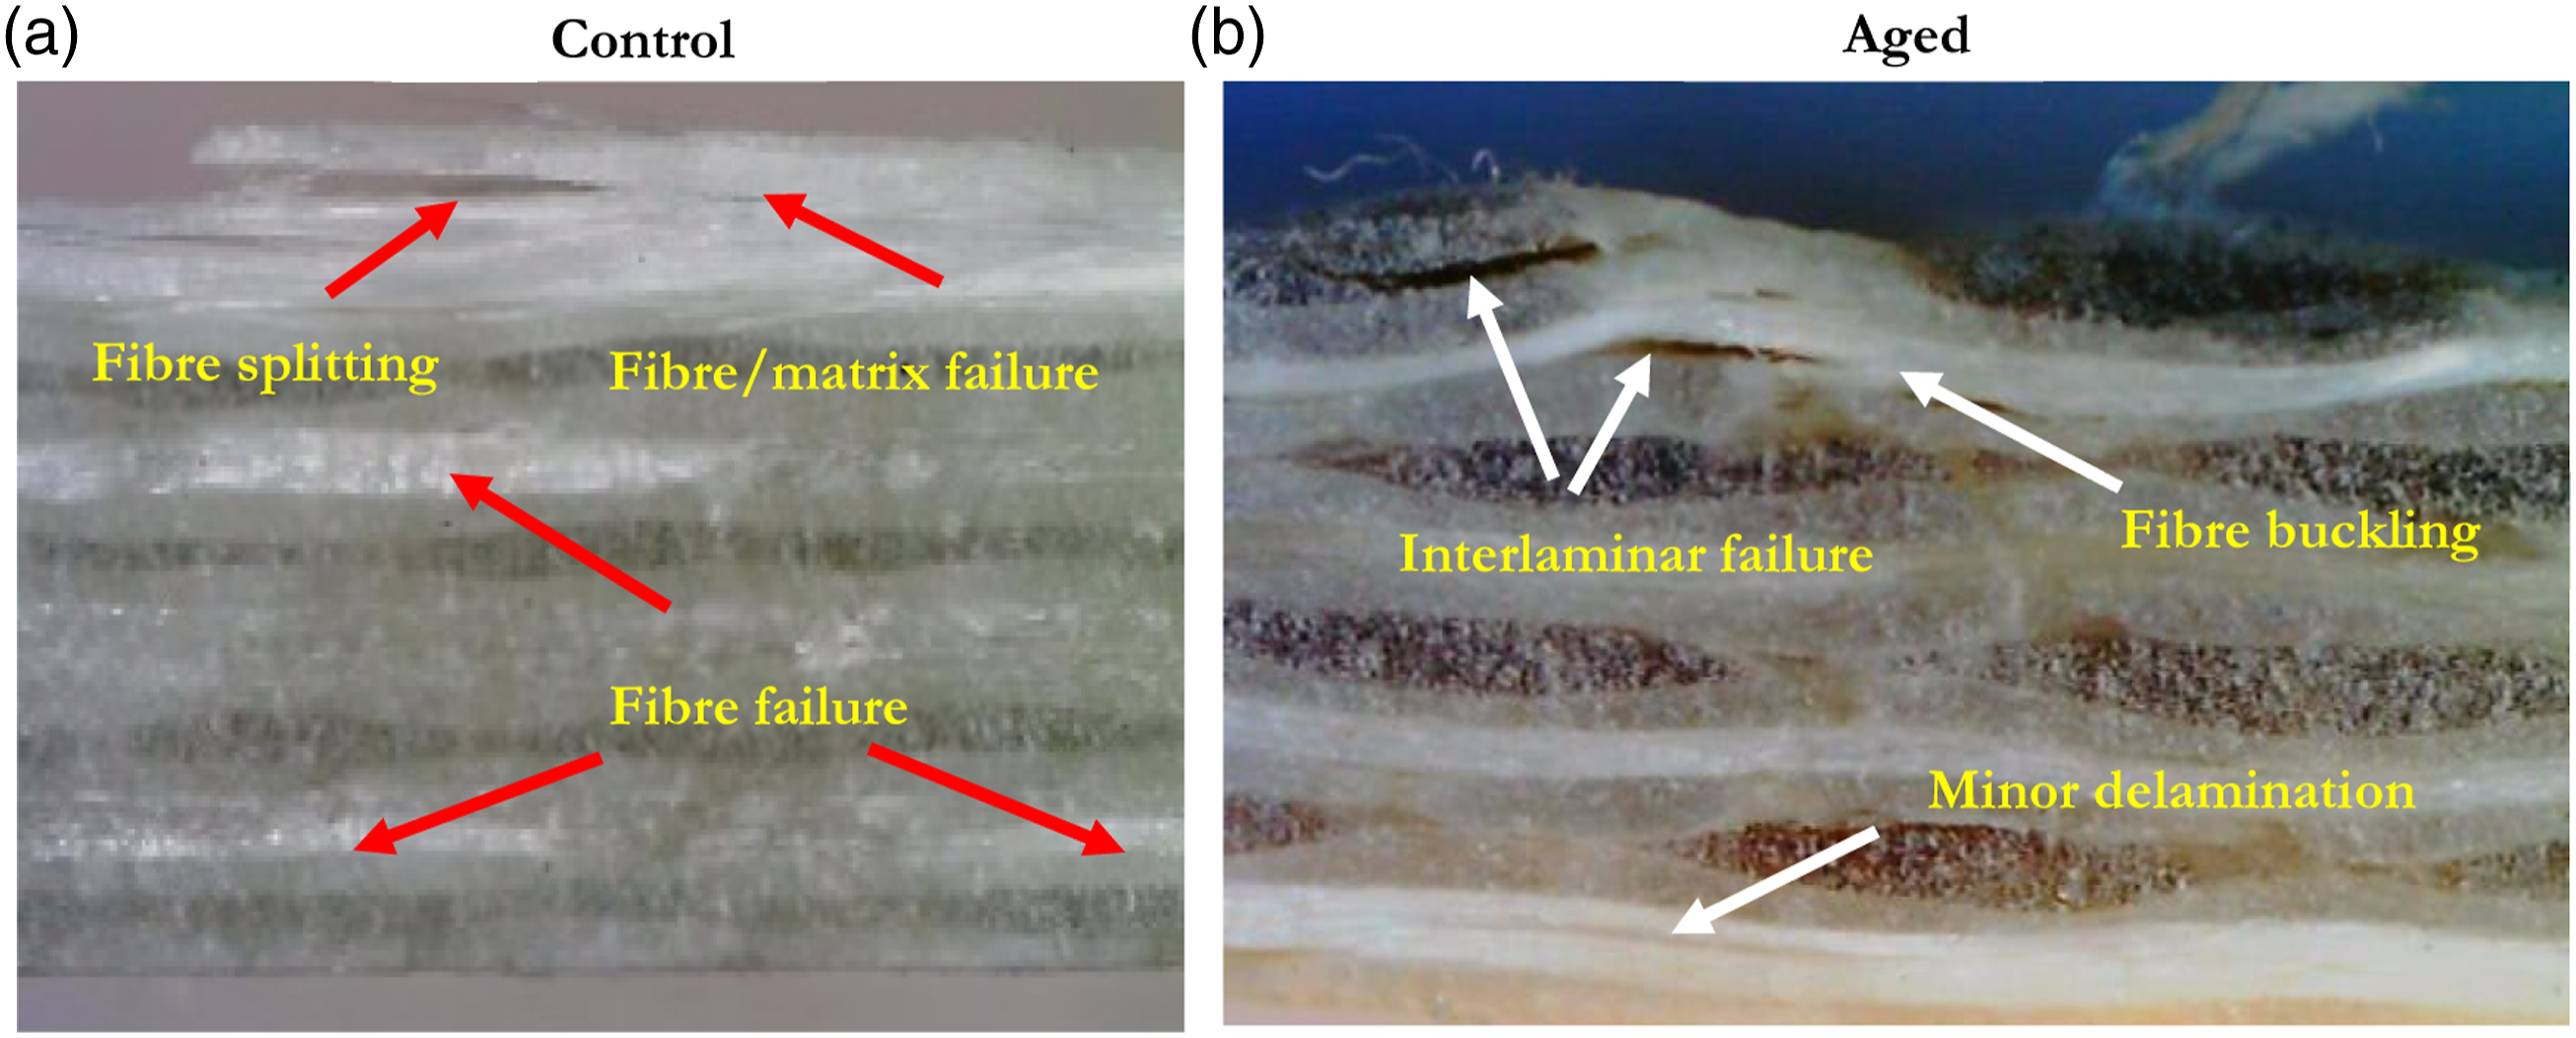
Interlaminar shear strength
Figure 10 shows the load-displacement response of the control and aged samples for the ILSS test. Interlaminar failures were observed when both samples were tested and the majority exhibited unacceptable failure modes like tension failure or plastic deformation. The response was linear up to 0.2 mm displacement in all the samples. After 0.2 mm, the slope was changed between the control and aged samples. In the control samples, non-linearity started, followed by plastic deformation of the fibres at ∼0.3 mm displacement. After that, the nonlinear behaviour of the curve continued till 0.9 mm displacement. This was due to the matrix failure followed by plastic deformation of the fibre at 0.3 mm of displacement. Load-displacement graphs for ILSS testing of aged and control sample.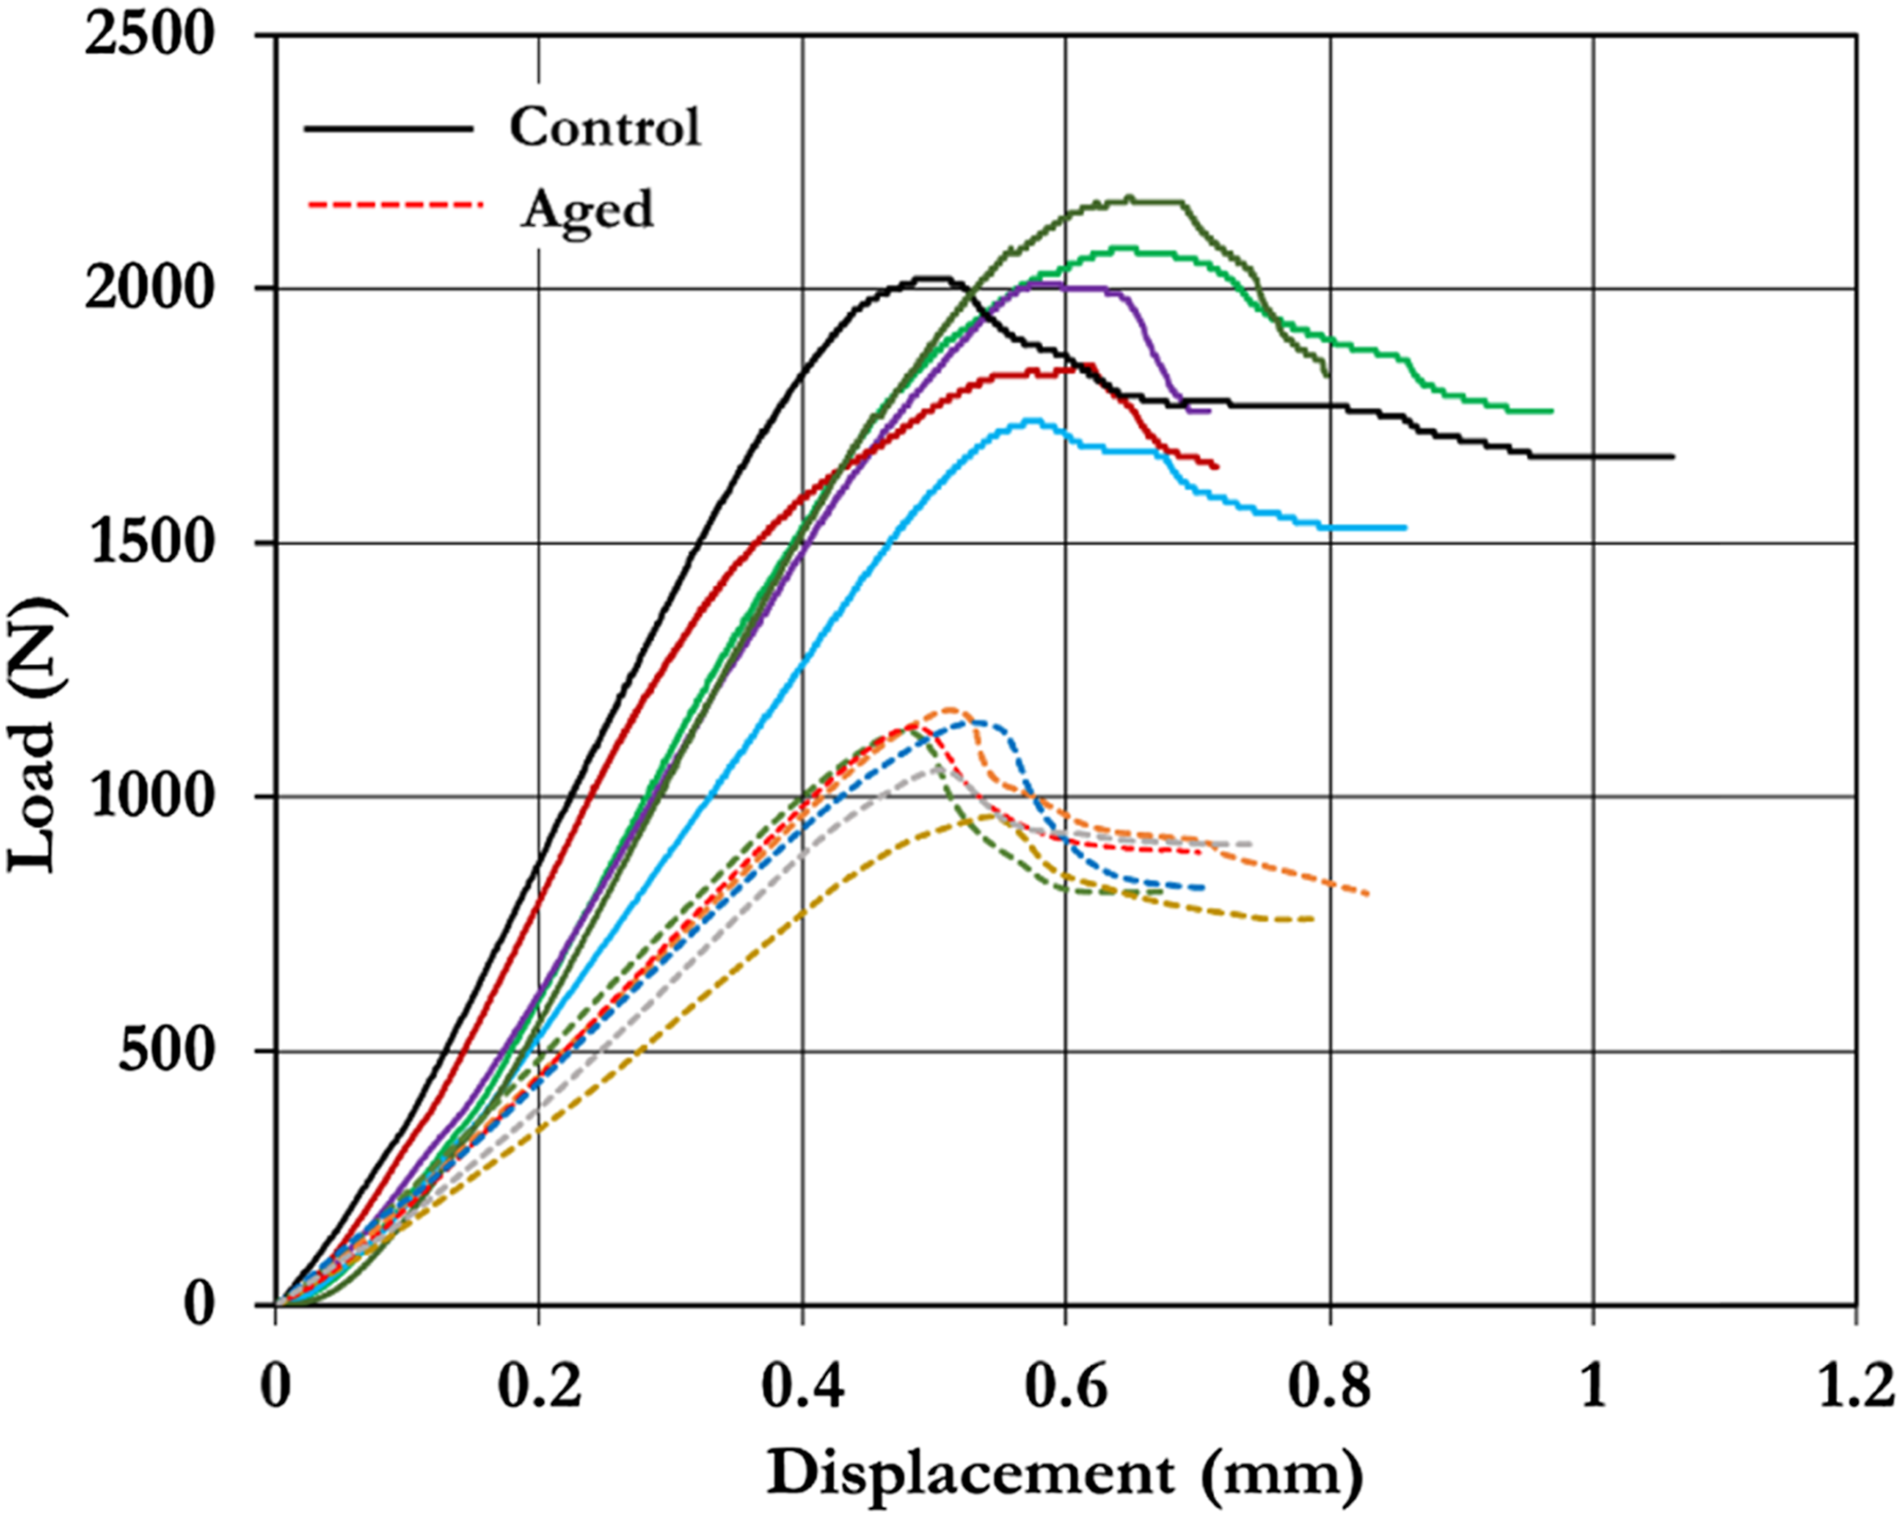
In the case of aged samples (Figure 10), after 0.4 mm displacement, the slope decreased, indicating plastic deformation due to the non-linear responseof the sample. There was no abrupt load drop in the aged samples. The average maximum load changed from 2072.50 ± 78.05 N at the unaged (control) state to 1128.20 ± 44.14 N after ageing, representing 45.56% of the load loss. The ILSS values calculated were 39.37 ± 2.53 MPa and 23.53 ± 1.69 MPa for control and aged samples, respectively. The significant loss of ILSS for control and aged samples was due to the water uptake, which weakens the fibre/matrix interface.
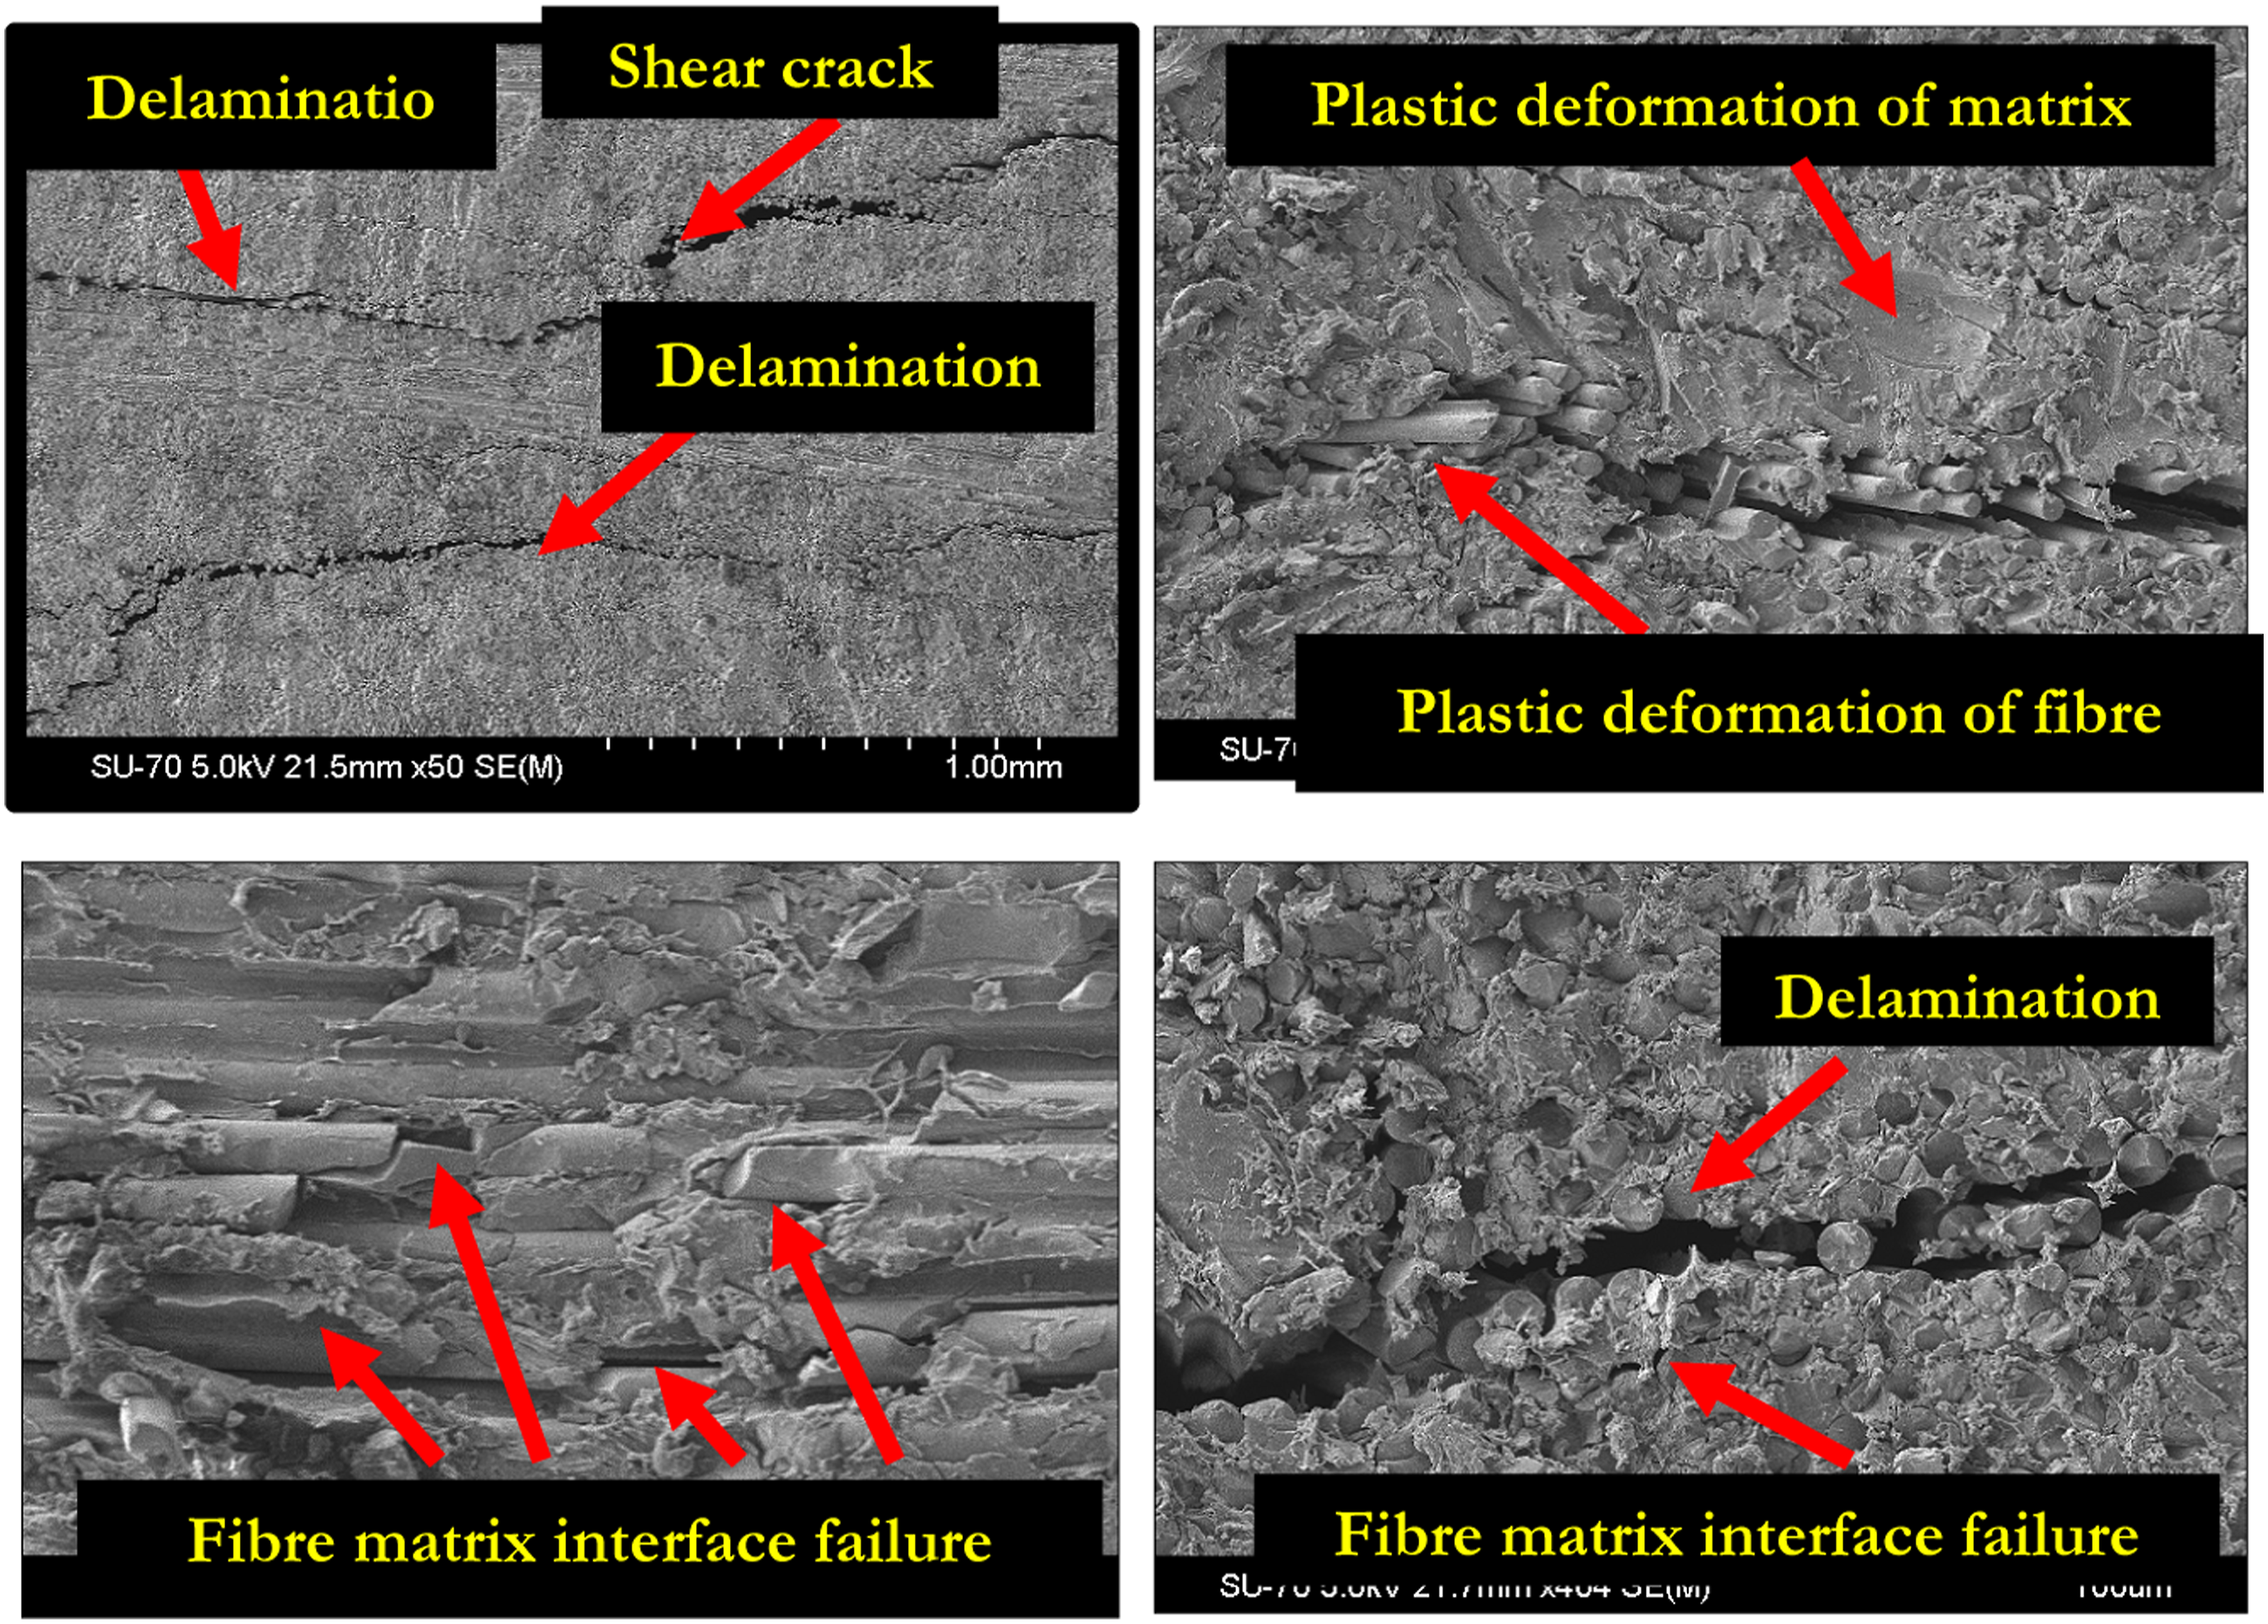
Figures 11 and 12 show the SEM micrographs of ILSS samples. In both samples, failure was initiated at the weak fibre-matrix interface. These samples exhibited a failure changing from matrix to fibre/matrix interface. The control samples (Figure 11) failed due to matrix-dominant crack growth, matrix/fibre failure, plastic deformation of fibre/matrix, interlaminar shear and delamination. Aged samples (Figure 12) failed due to matrix deformation, fibre/matrix interface failure and delamination. The plastic deformation of the matrix, as well as fibres, were observed post-failure. The delamination of the layers was also observed in the SEM images for the aged samples. Interlayer shear cracks were also observed in the SEM images. SEM images of ILSS tested control GF/E samples. SEM images of ILSS tested aged GF/E samples.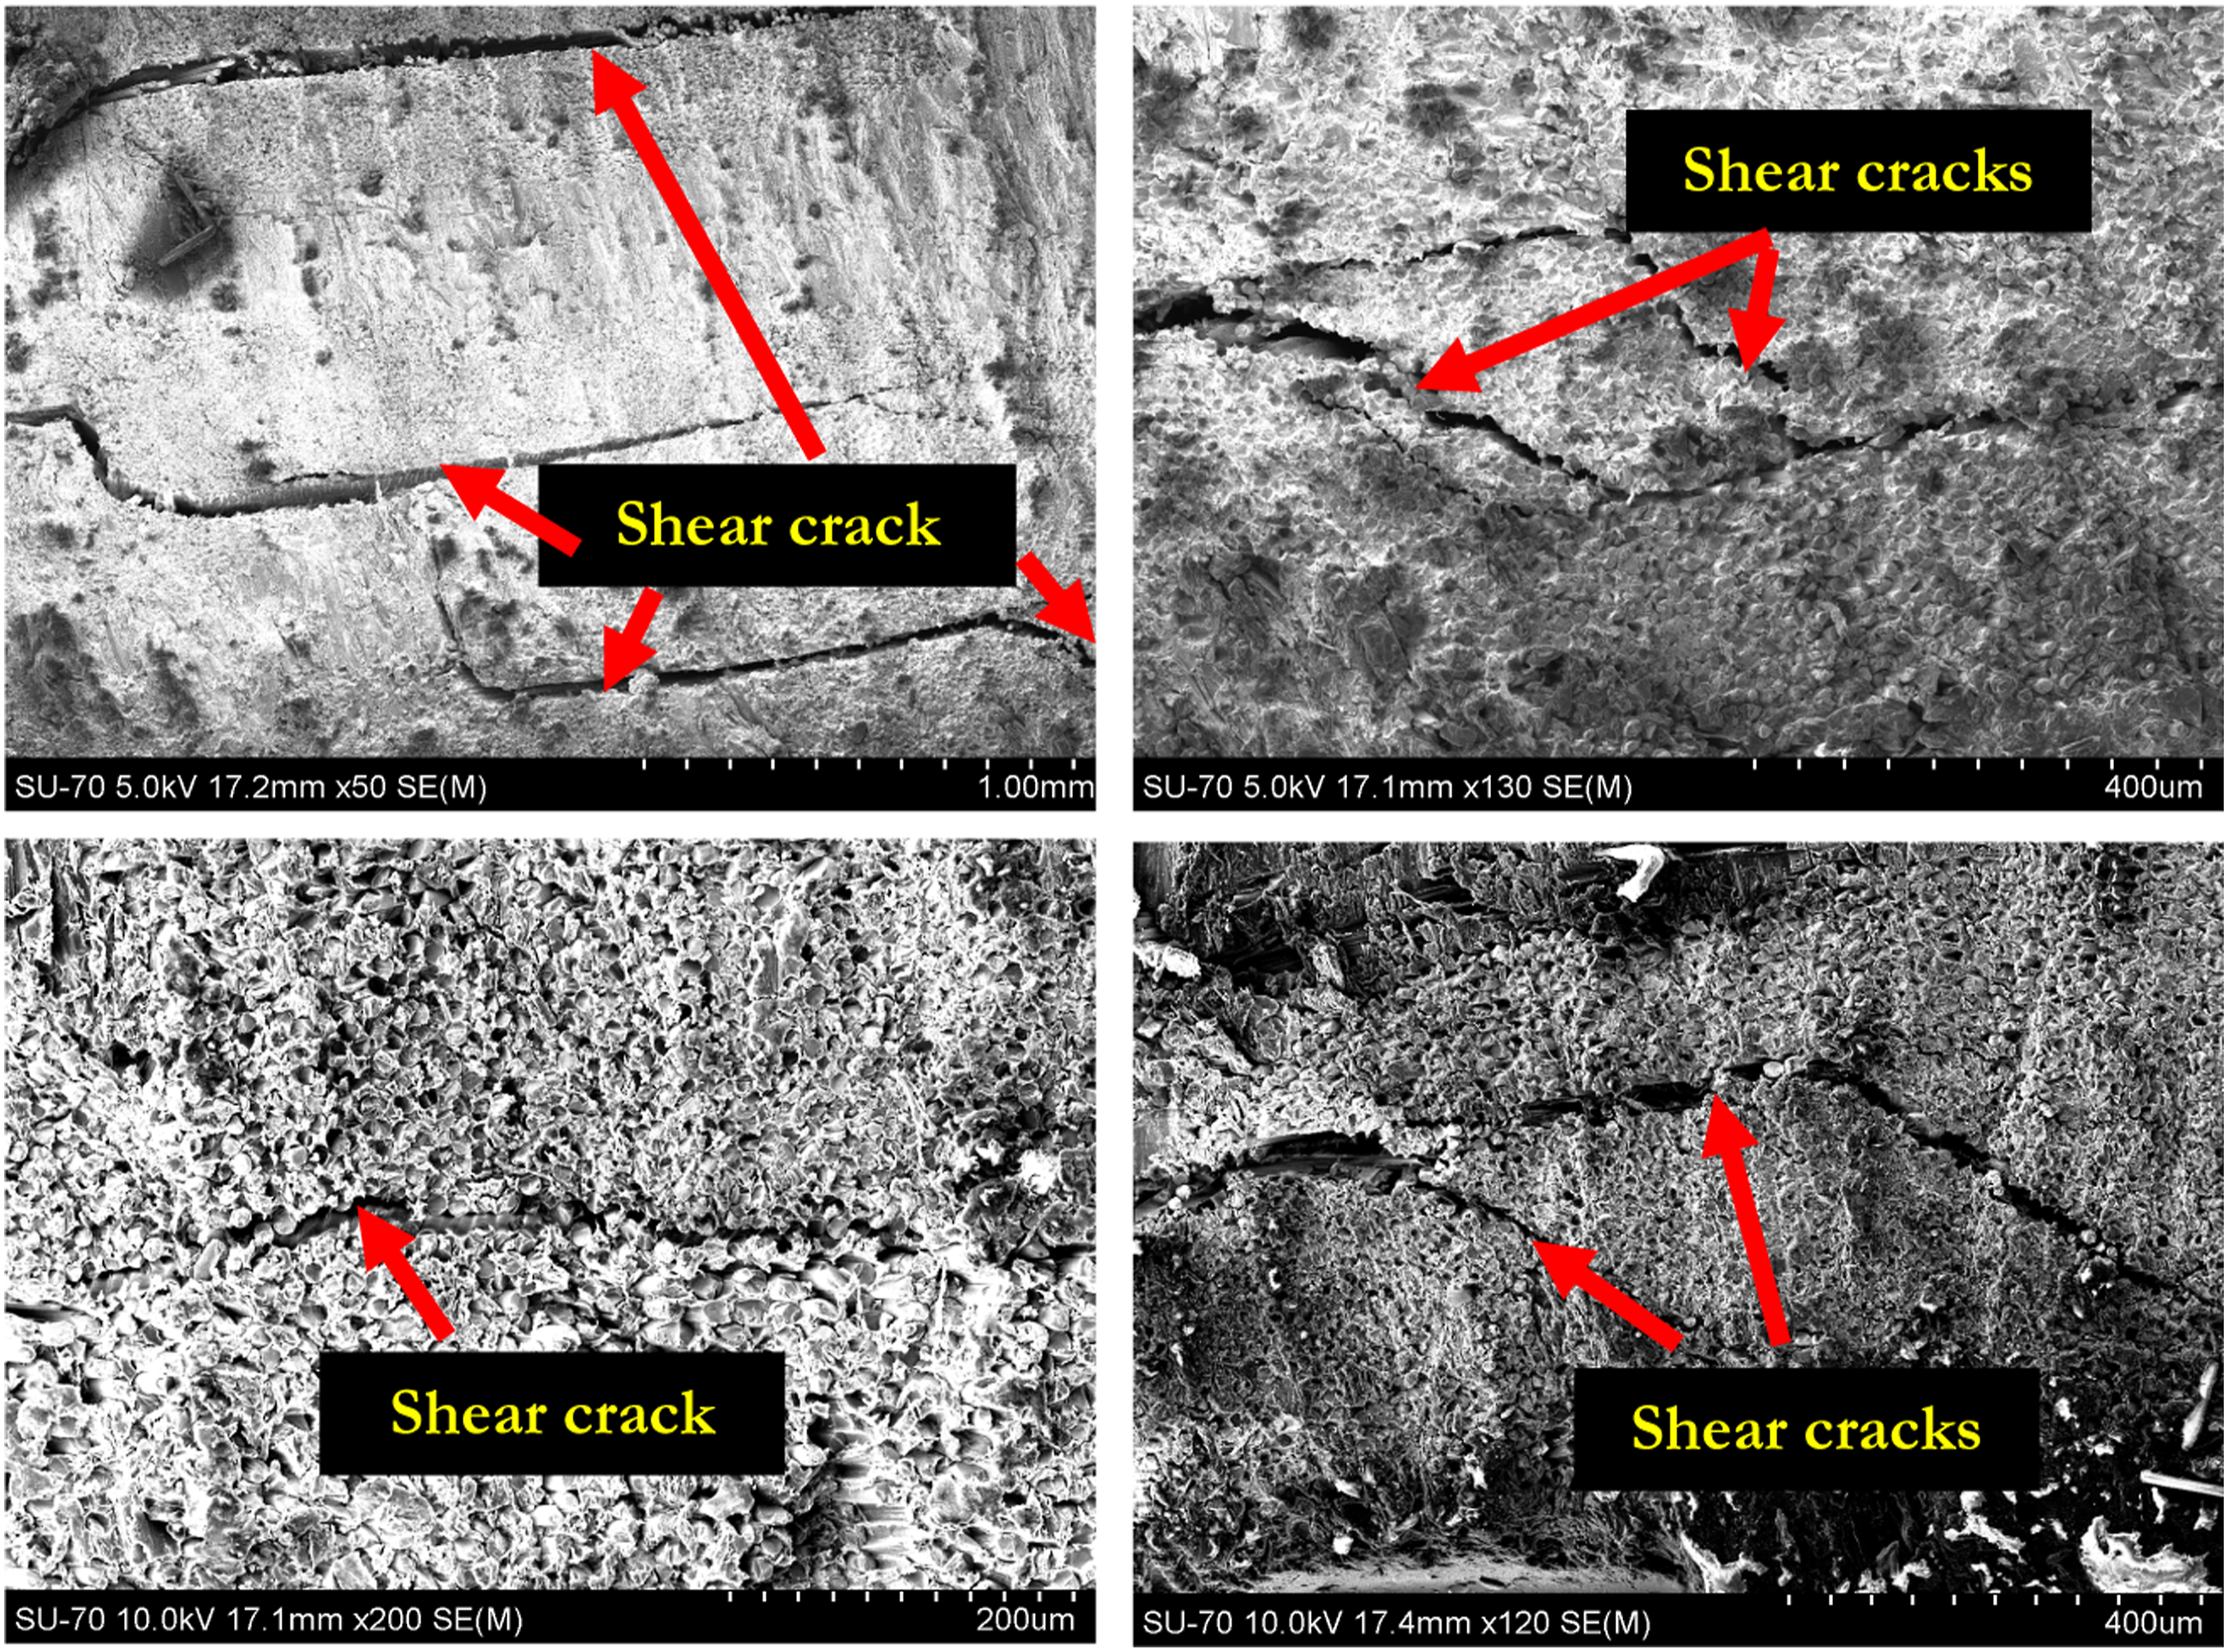
Mode-I fracture toughness (DCB results)
The load-displacement response of DCB tests is shown in Figure 13. The response of the samples increased linearly until the crack’s initiation, then dropped steadily as the crack propagated. After that, the load drops quickly as the crack propagates rapidly. The load-displacement response exhibited ‘saw-tooth’ behaviour associated with stick-slip crack propagation, which was associated with regions of varying toughness in the sample.36,37 A significant difference in response was observed between the control and aged samples. A higher crack initiation load, as well as crack propagation load, was required for the control samples as compared to the aged samples. Mode-I (DCB) load-displacement response of GF/E samples.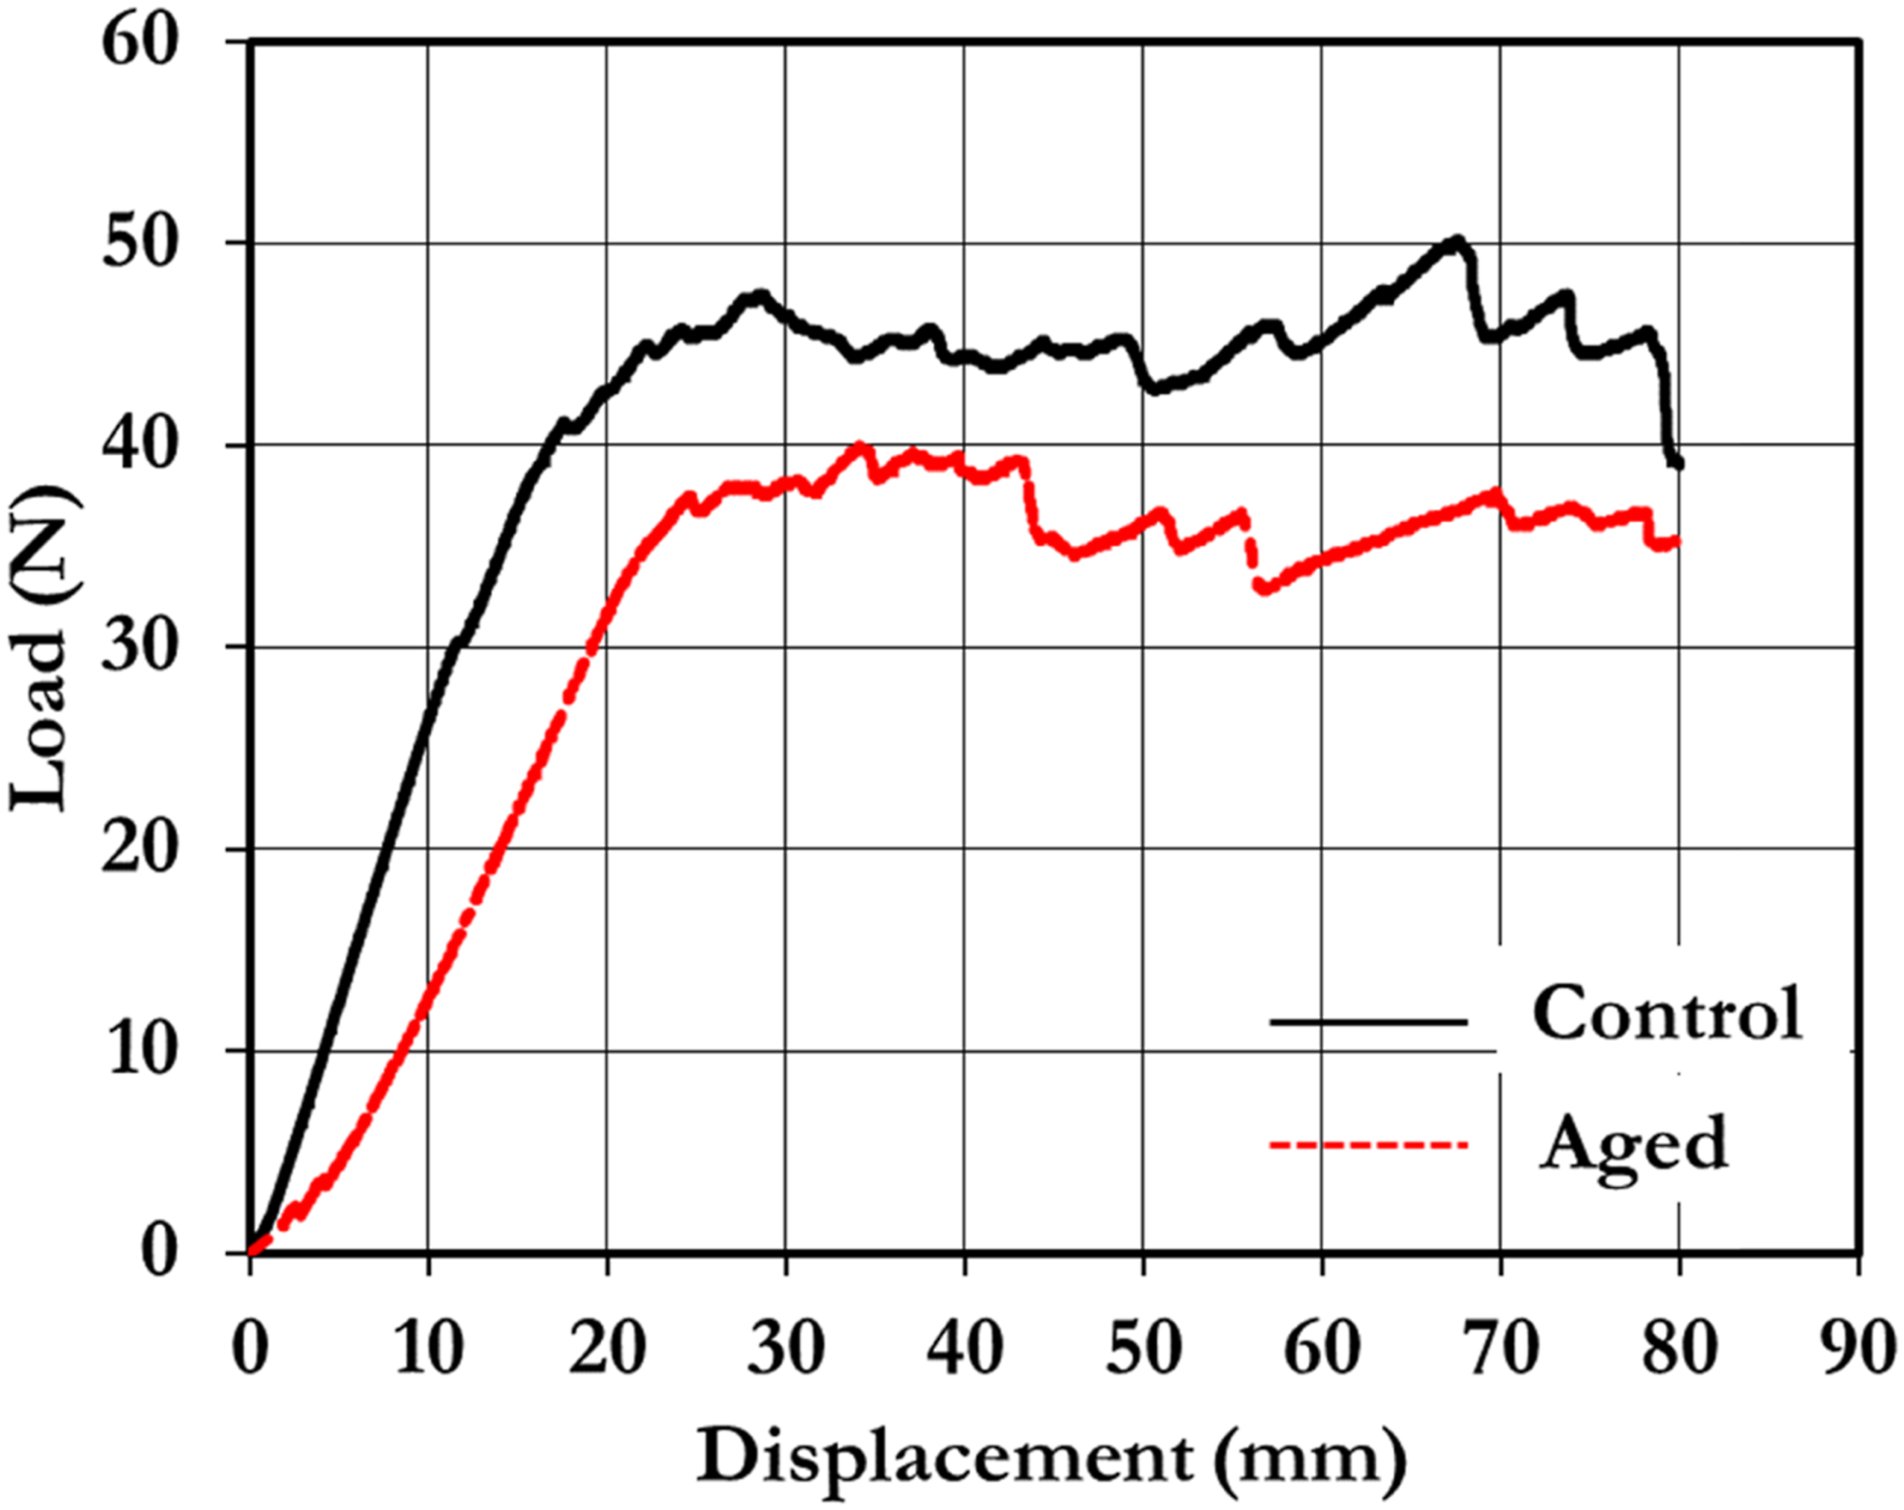
The delamination resistance curve (R-curve) shown in Figure 14 depicts an increase in the G
IC
(Mode-I interlaminar fracture toughness) value with increased crack length. The visual examination of the tested samples reveals that the fibre bridging occurred at the crack tip opening area, due to which the G
IC
value increased. In the case of aged samples, at crack initiation, G
IC
increased with a minor change in the crack length. After that, the G
IC
gradually increased within the crack length and a rising R-curve was observed. The crack propagation and critical energy release rate increased until 85 mm of crack length. The G
IC
release rate decreased slightly till the 95 mm crack length; beyond this crack length, the G
IC
decreased sharply. The G
IC
of aged samples was higher than the control samples due to the more fibre bridging (shown in Figure 14), which formed due to the degradation of the fibre/matrix interface.38 While the higher toughness of the aged sample matrix is responsible for the high G
IC
; the laminate is weak in opposing the crack growth. This happens due to the interface strength of the fibre/matrix, i.e. weak interface strength leads to more fibre bridging at the crack face. The critical energy release rate was lower for the control samples and only a rising R-curve was observed. Since the fibre bridging was significantly less in the control samples, as seen in Figure 15(a), the G
IC
values were also lower than in the aged samples. Mode-I fracture toughness vs. crack length curves for GF/E samples. Mode-I fracture failure in control and aged GF/E samples.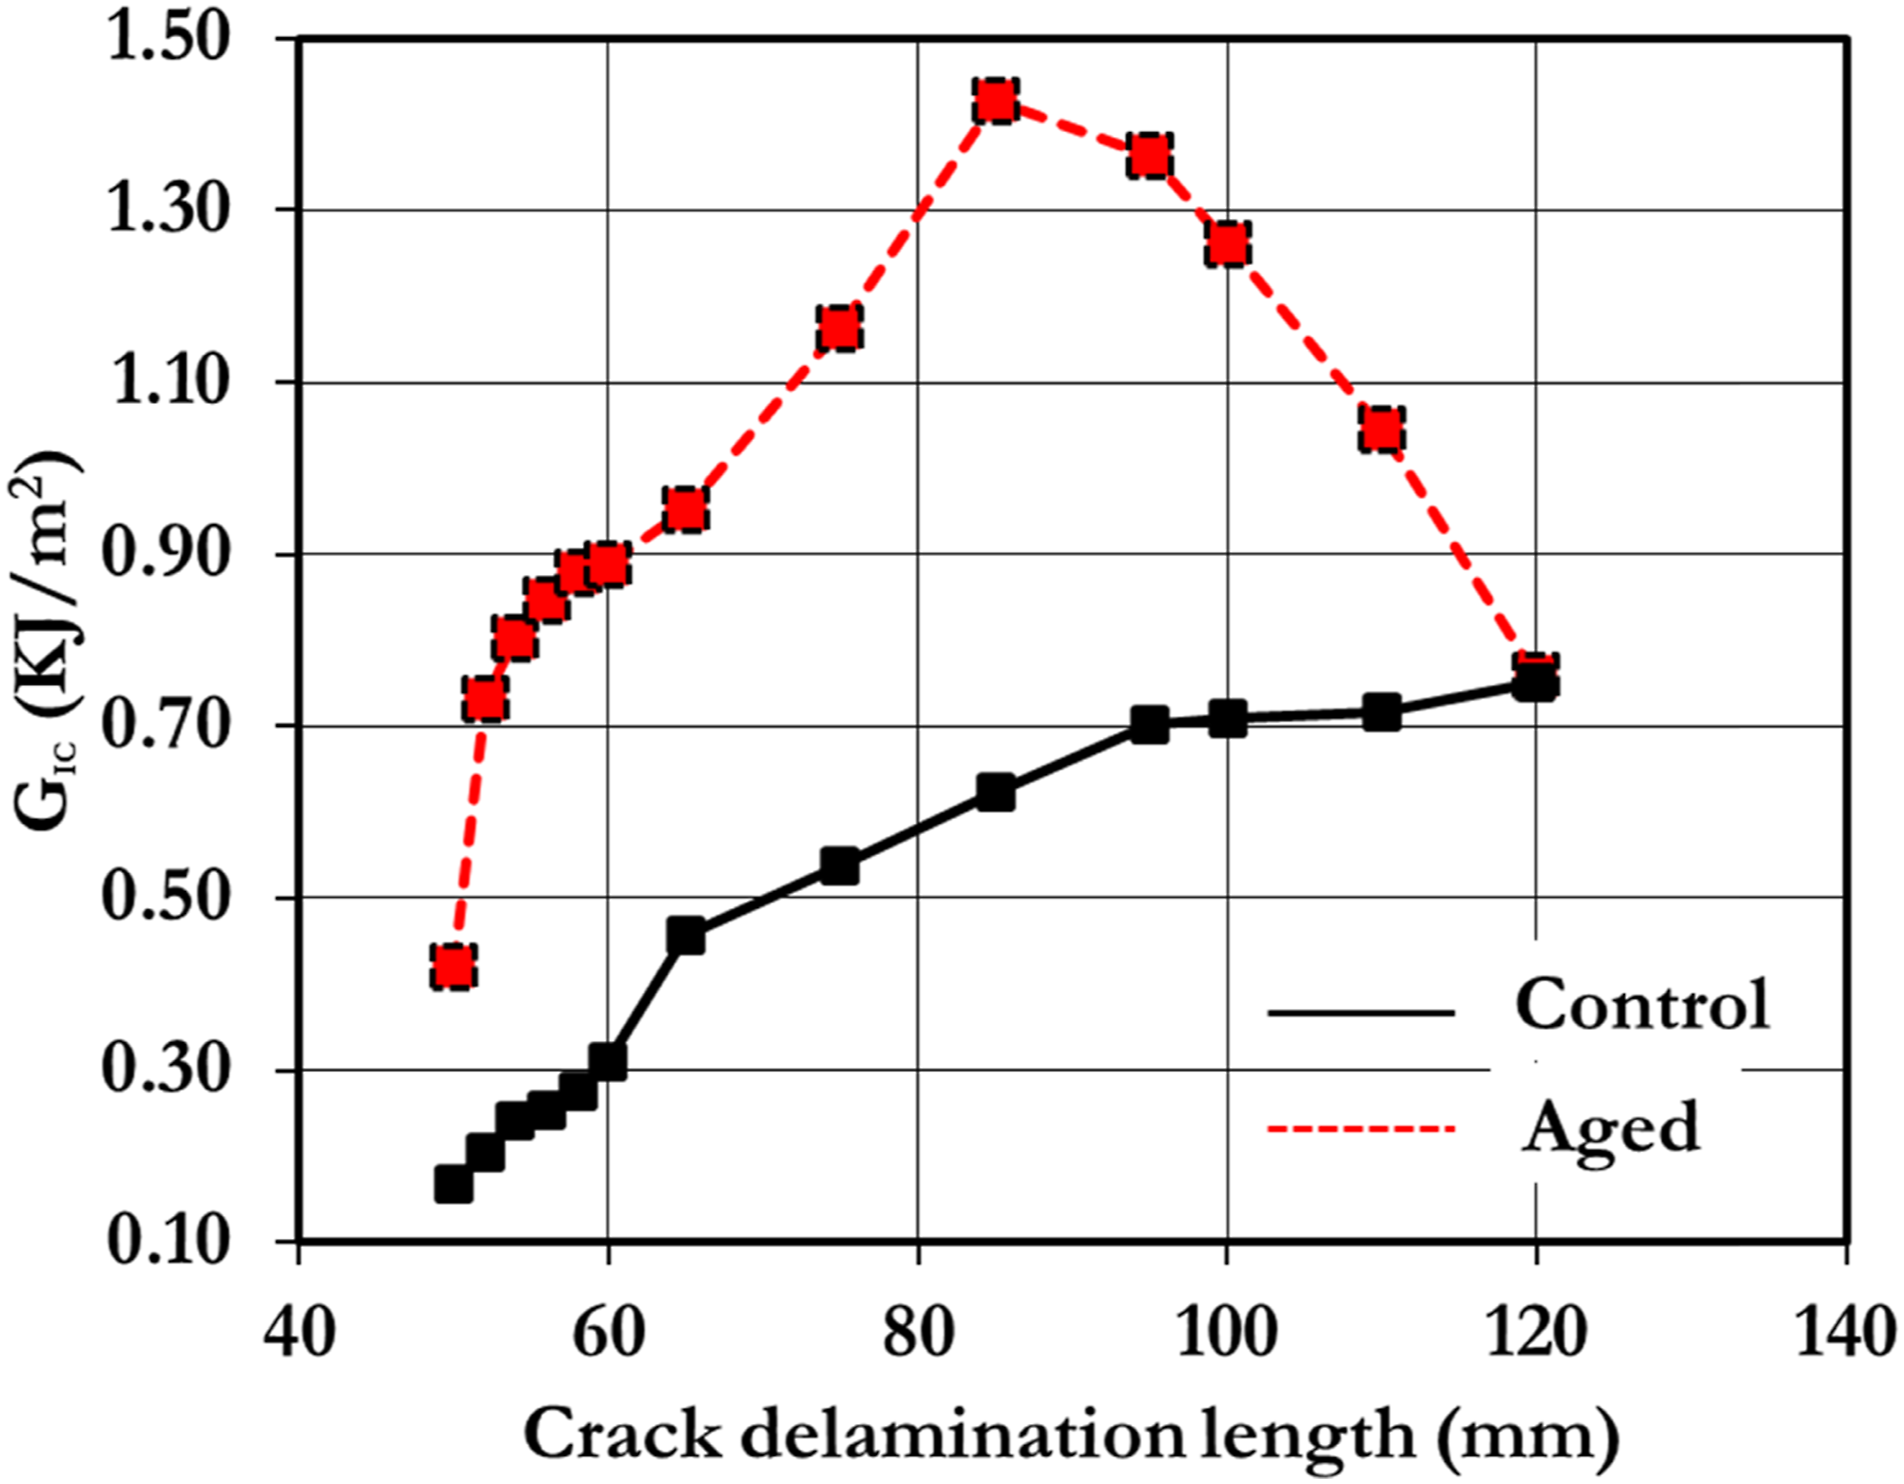
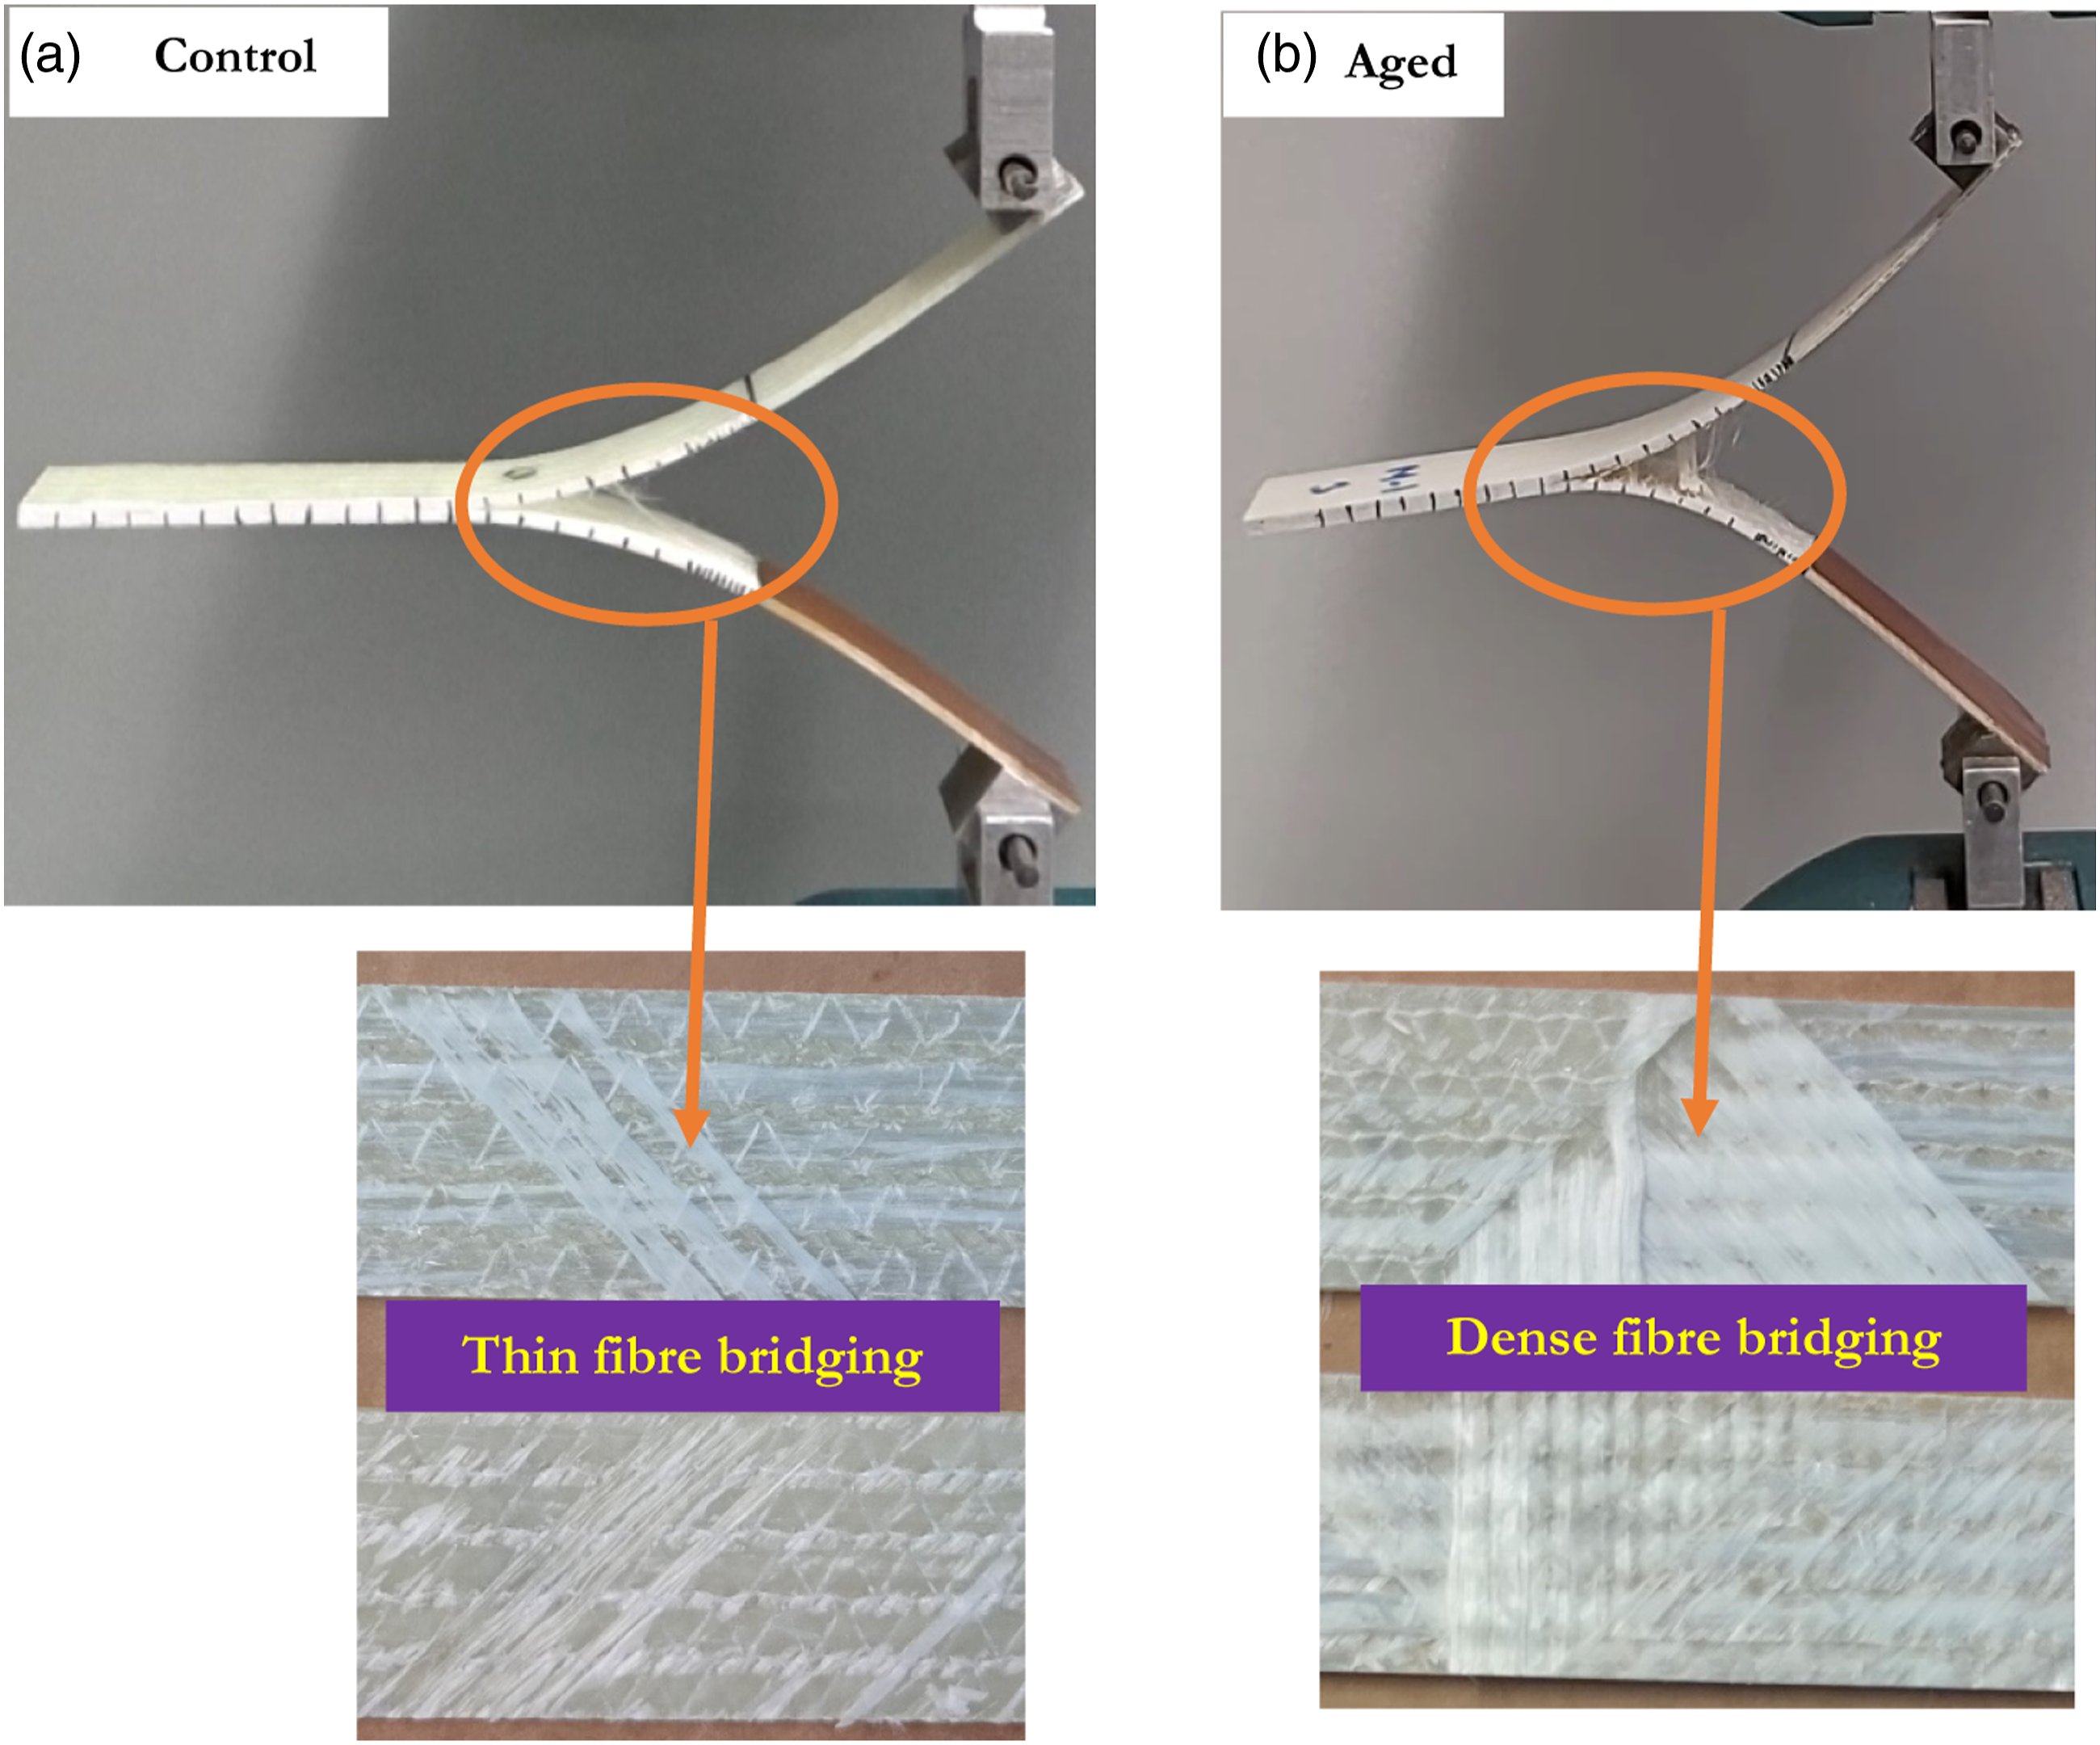
Figure 15 shows the DCB sample fracture surface. In both samples fibre bridging was observed, which is typical for glass/Elium® under Mode-I loading condition [38]. The control samples (Figure 15(a)) showed a clean appearance of the crack surface and debonded fibre marks, attributing to the crack progression through the fibre/matrix interface. In the case of an aged sample (Figure 15(b)), due to a weak fibre/matrix interface, the resistance to crack propagation resulted in high fibre-bridging, making fibres vulnerable to getting pulled out from the matrix. The same can be confirmed in Figure 15(b), where all the fibres were pulled out from the fibre/matrix interface, thereby contributing to dense fibre bridging. On the other hand, control samples underwent very minute fibre bridging. This does not change the toughness behaviour of the samples compared to aged samples.
Mode-II fracture toughness
The Mode-II fracture toughness test represents the interlaminar fracture toughness G
IIC
under Mode-II shear loading using the ENF test. Figure 16 shows the load-displacement curve for the control and aged samples. The peak load was higher for control samples than the aged ones. In control samples, after reaching peak load, there was a sharp drop in the load and then an increase in displacement with a minor increase in load. Mode-II (ENF) load-displacement response of GF/E samples.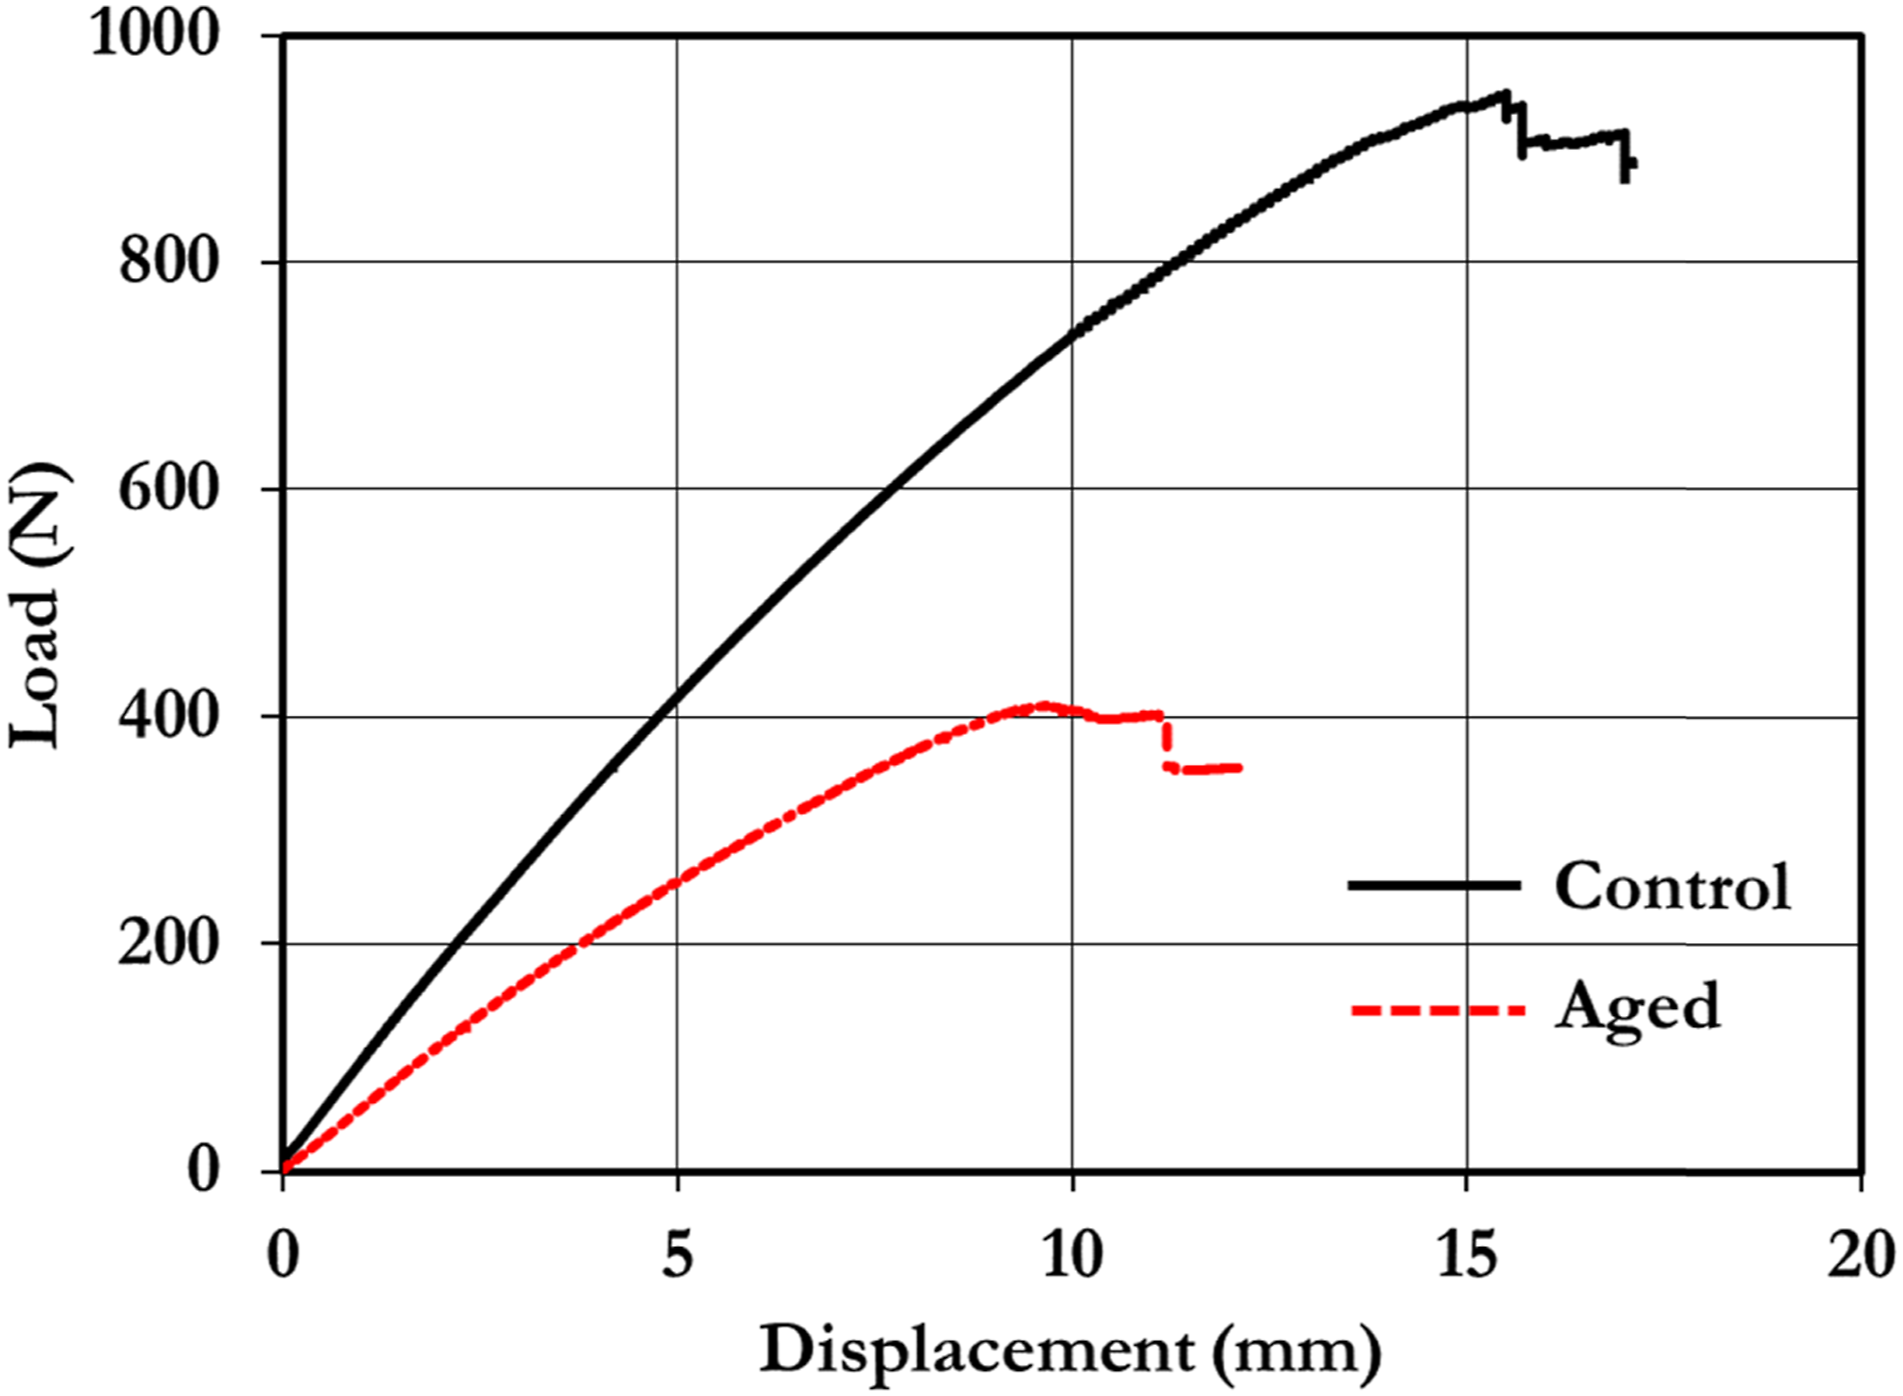
In aged samples, after reaching the peak load, there was a slight drop in load with an increase in the displacement. The sharp load drop indicates occurrance of an unstable crack propagation. After that, there was a sharp drop in load with no displacement, followed by a rise in displacement with no load. Both samples’ ENF response showed a nonlinear curve segment after reaching peak load. This was due to the TP matrix system in the composite samples in which the unstable crack propagation was delayed due to the higher displacement value.
Furthermore, the magnitude of the load dropped in both the samples representing the effectvness of Elium® matrix in controlling the magnitude of load drop and arresting unstable crack propagation. It is the capability to suppress the occurrence of delamination in the Elium® matrix. In both the samples, the Elium® matrix showed higher resistance to crack propagation.
Figures 17(a-b) show the compliance graph versus crack length cubed for control and aged Elium® composites. It is depicted from the graph that the compliance versus crack length cubed is higher for aged samples as compared to control samples, as shown in Figure 17(b). Figure 17(c) shows the comparison of average compliance versus crack length for control and aged samples depicting that compliance increase is higher in aged samples. In both samples, compliance increased with the crack length. However, in control samples, the compliance became almost stable after a certain crack length. Whereas in aged samples, the compliance increased with crack length. Figure 17(d) depicts the Mode-II interlaminar fracture toughness G
IIC
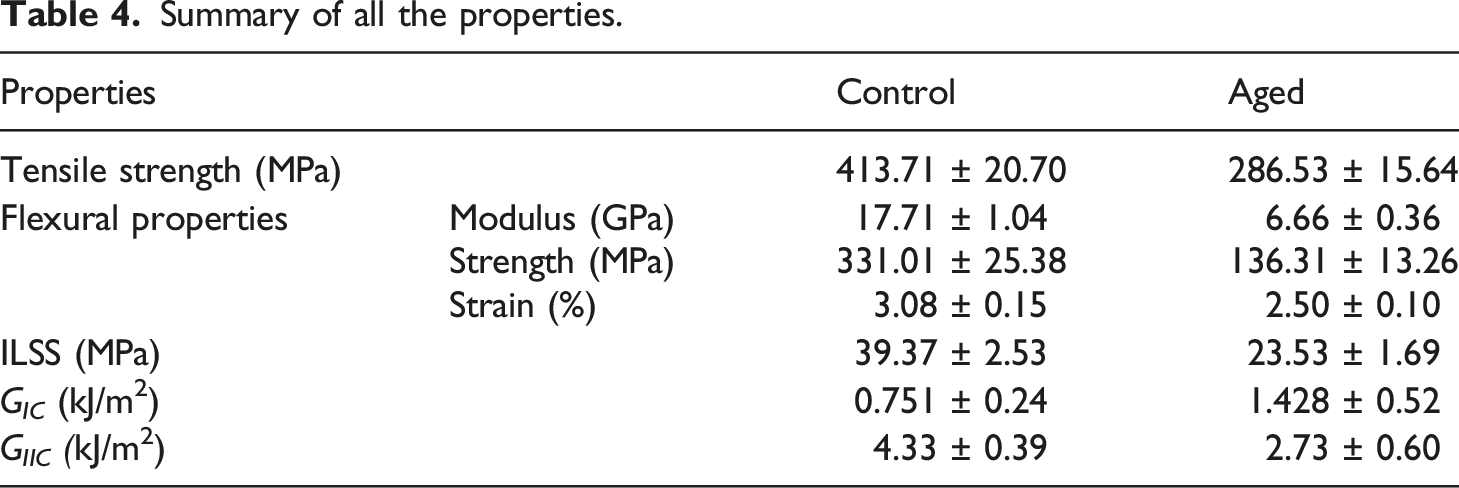
for aged and control samples at 30 mm crack length. It represents that the interlaminar fracture toughness was significantly higher for control samples than the aged ones. Table 4 summarizes all the properties of control and aged GF/E samples studied in the present work. Compliance versus crack length cubed: (a) control samples, (b) aged samples, (c) control versus aged samples and (d) comparison of Mode-II fracture toughness. Summary of all the properties.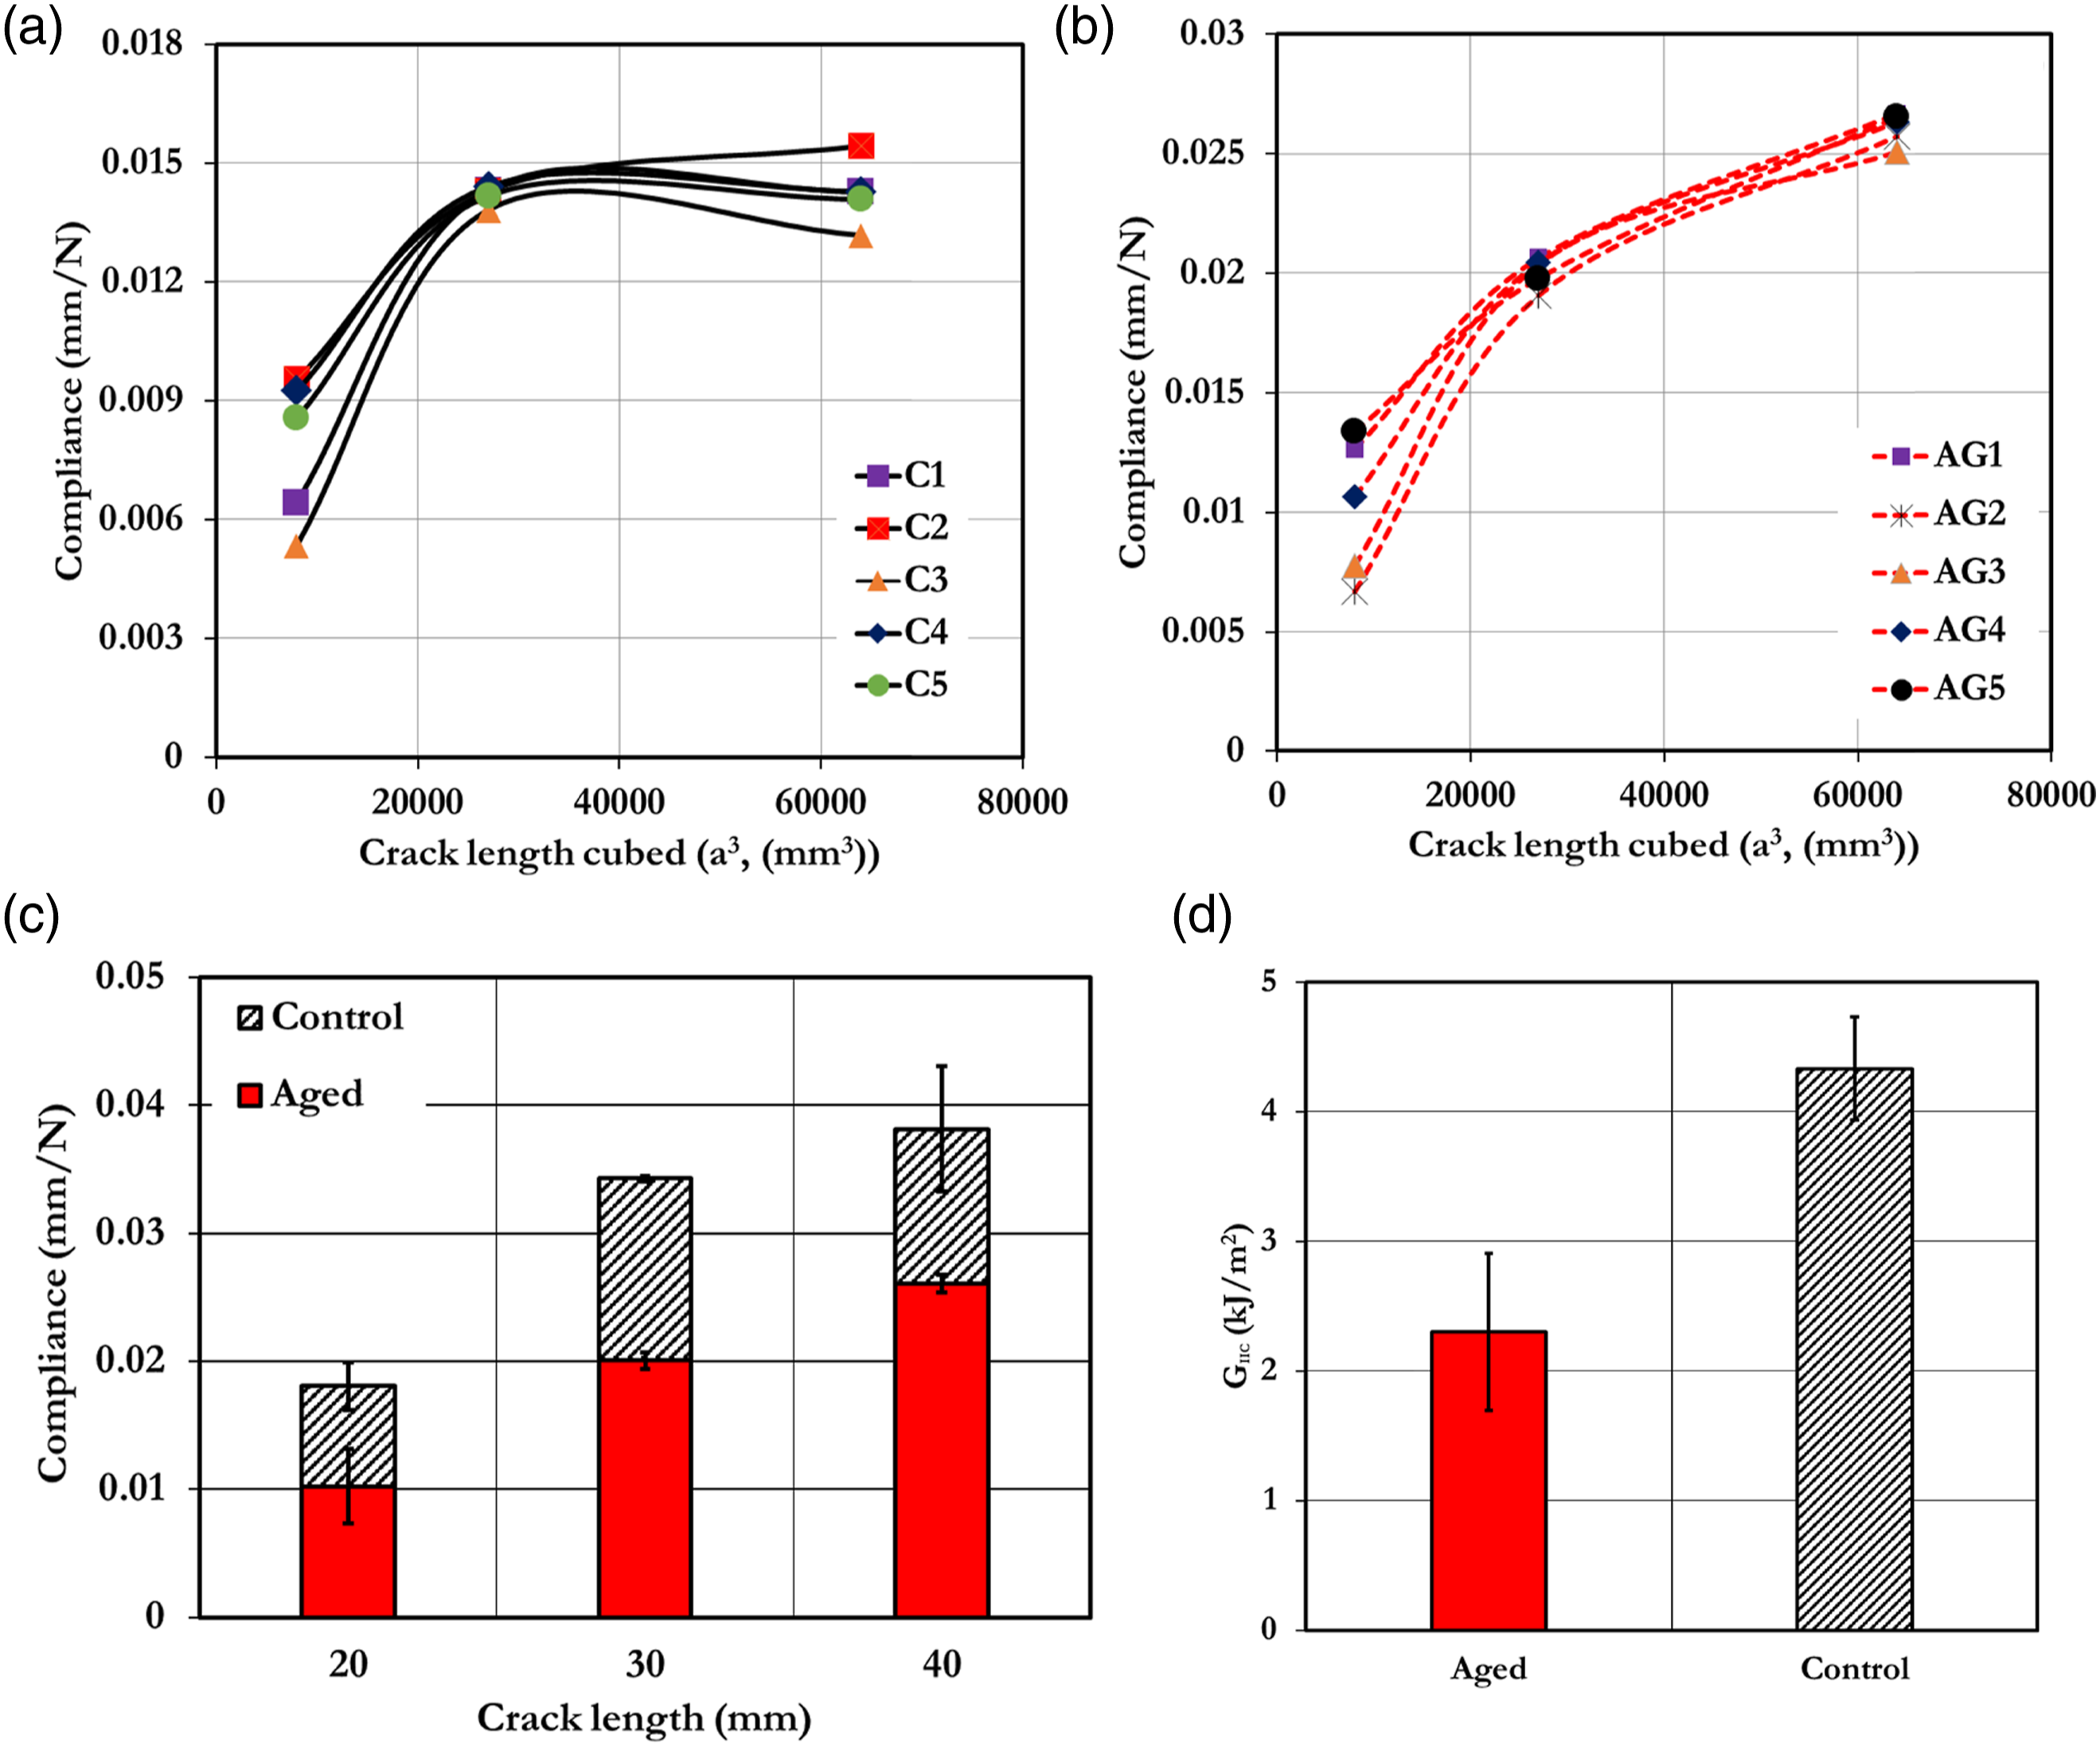
DMA results
The DMA results in terms of E′ and tan δ for control and aged samples are shown in Figure 18. The Tg value was taken as the peak temperature in the tan δ curve. The E’ (Figure 18(a)) showed a “shoulder” in the temperature range of 90–110°C. The onset temperature (i.e. the temperature at which E′ drops abruptly) was high for control samples. The water uptake reduced the onset temperature for aged samples. However, the onset temperature difference between the control and aged sample was very minimal (3.4%). Once the E′ started dropping, control and aged samples followed a similar path. The tan δ amplitude (Figure 18(b)) of the control and aged samples was 0.43 and 0.42, respectively, showing no significant difference. The Tg of aged samples (124.51°C) was high compared to control samples (117.70°C). This may be due to polymerisation, which increases the chain length and weight of the polymer due to hygrothermal ageing. DMA results (a) storage modulus and (b) loss factor (tan δ).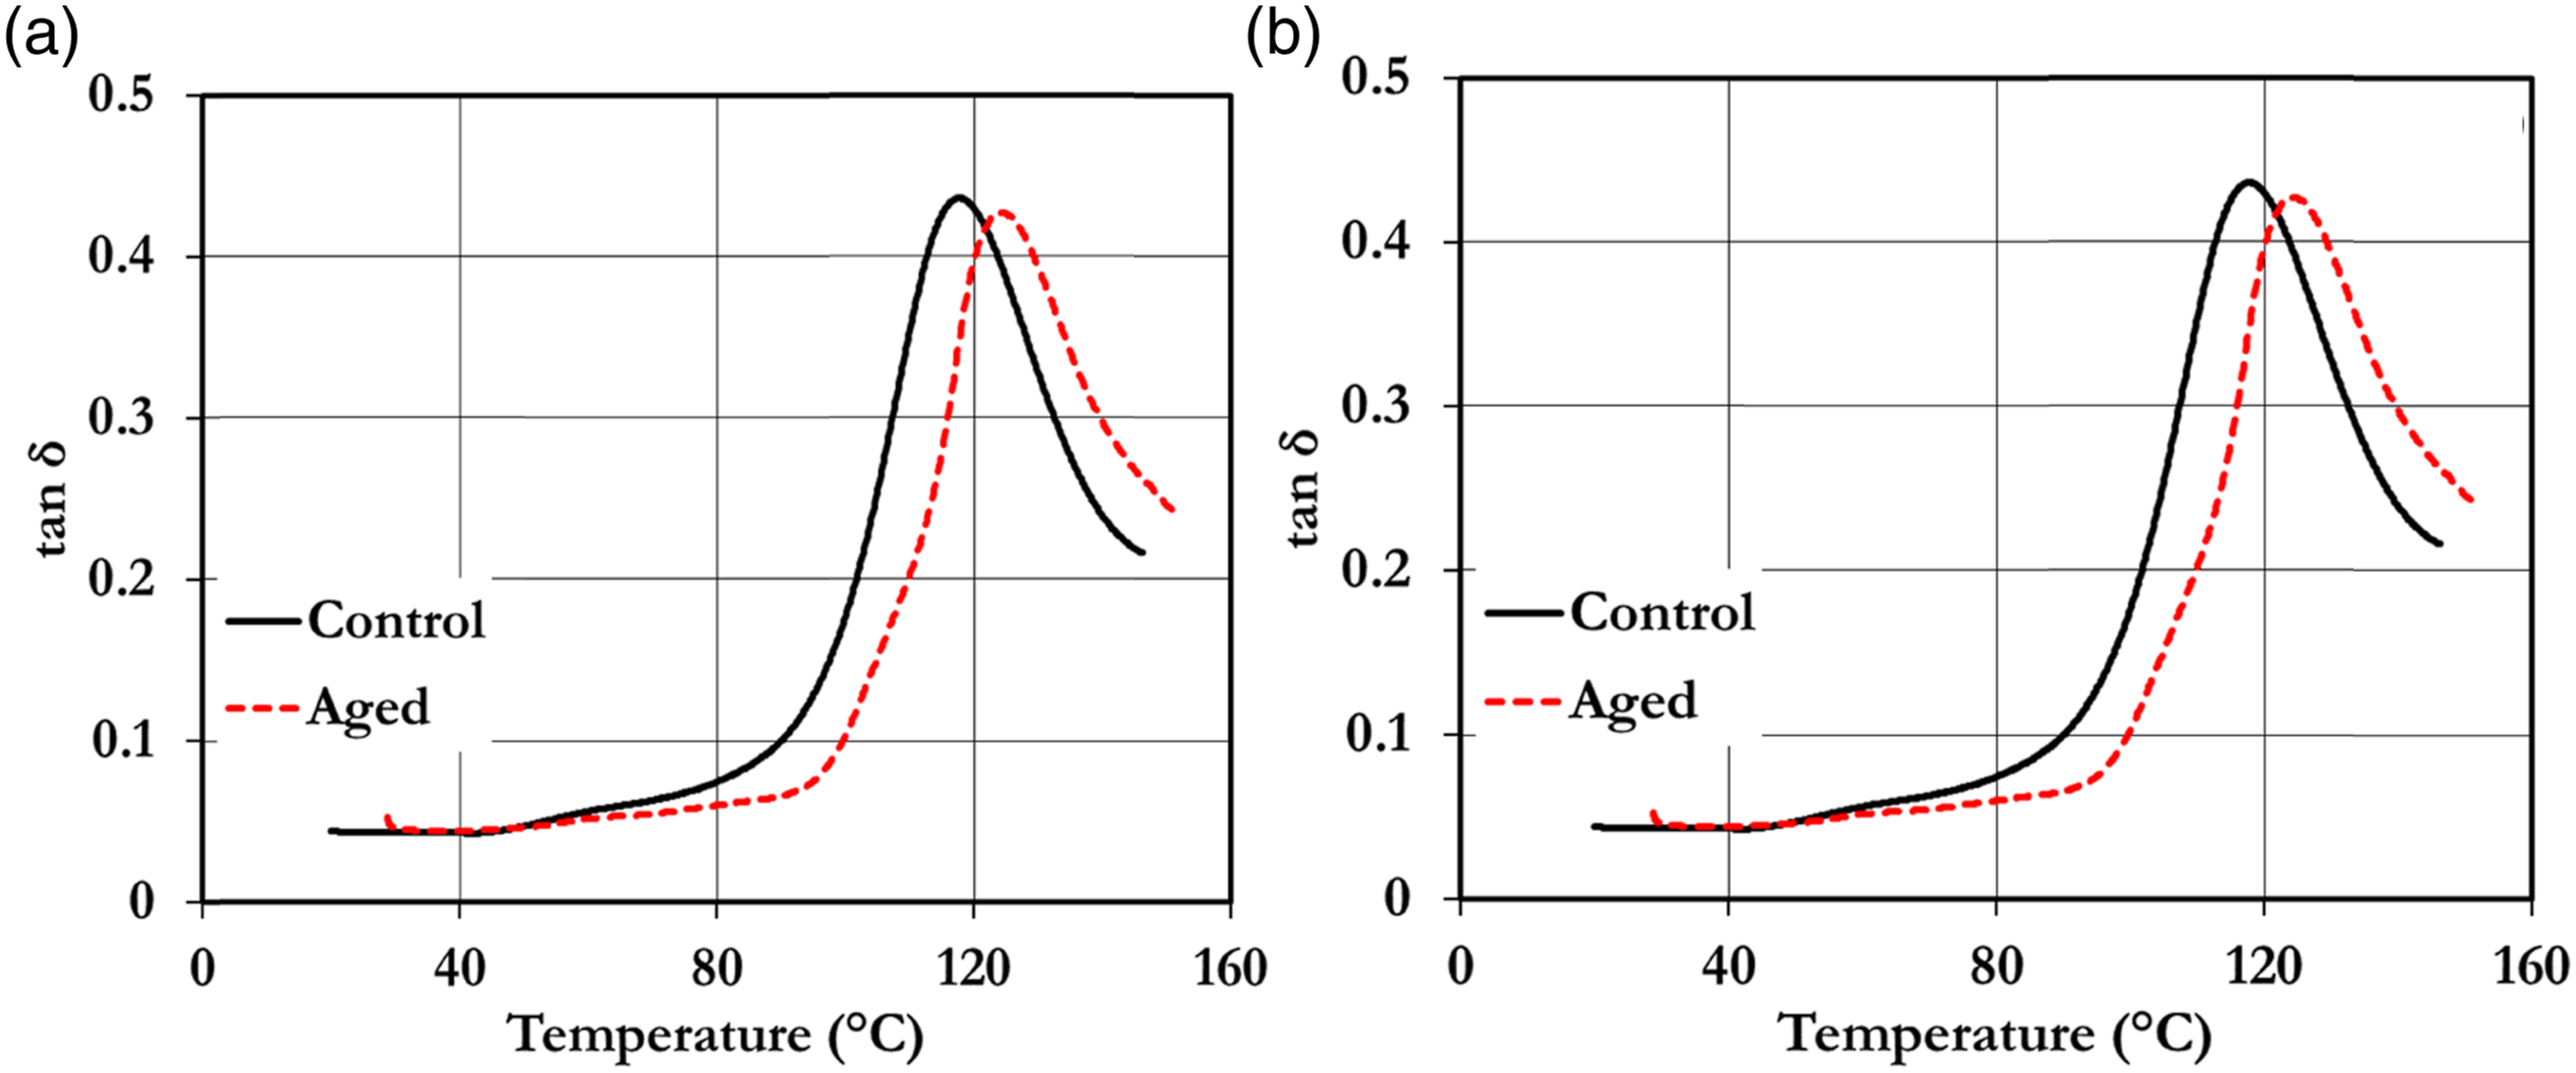
Conclusions
The quadriaxial NC GF/E based polymer composites were manufactured using VaRTM technology. The developed composites were tested for their mechanical properties under unaged (control) and post water immersed (aged) conditions. Based on the results obtained following conclusions can be drawn: • Tensile strength, flexural strength and ILSS were reduced by ∼30%, ∼59% and ∼40%, respectively, due to hygrothermal ageing. • Fibre splitting with delamination was a significant failure mode in tensile samples. The fibre buckling and interlaminar failure occurred in both the samples on the compression side observed for flexural samples. In ILSS samples, control samples failed due to dominant matrix failure, while aged samples failed due to fibre/matrix interface failure and delamination. • Mode-I fracture toughness depicts weak fibre matrix interface failure causing the fibre bridging at the crack, thereby superficially increasing the fracture toughness aged composites. • Mode-II fracture toughness reports higher compliance values aged composites. The compliance increases with the increased crack length for aged samples, whereas the compliance becomes stagnant after a certain crack length for control samples. The Mode-II fracture toughness was found to be lower for the aged samples. • The hygrothermal ageing reduces the fibre/matrix interface and subsequently reduces the stiffness of the GF/E composites under different loading conditions. The water uptake makes the matrix undergo plasticization and debonding, causing internal stresses at the fibre/matrix interface. This form of change in the matrix due to water uptake reduces the load-carrying capacity of the composite. • The present study demonstrated that the infusible TP system could be a candidate for use in marine structures with the added benefit of recycling nature. The fibre-matrix interface can be improved through compatibilizers over various environmental conditions. • The future works involve performing fatigue studies on the aged glass/Elium® composites.
Footnotes
Declaration of conflicting interests
The author(s) declared no potential conflicts of interest with respect to the research, authorship and/or publication of this article.
Funding
The author(s) received no financial support for the research, authorship and/or publication of this article.