
Abstract
During thermoplastic pultrusion, increasing the pulling speed generally leads to a melted polymer pressure rise in the pultrusion dies. Yet, it was not clear if the polymer pressure’s increase would result in a faster impregnation flow that would compensate for the lower residency time inside the heating dies. Thus, the aim of this study was to verify if the speed-induced pressure can counterbalance the decrease in residency time that is required for impregnation quality and to analyze possible pultrudate morphology’s reconfiguration. Three distant pulling speeds were selected: namely 50, 500 and 1000 mm/min. Using a model, the polymer pressure in the pultrusion dies was computed to reach up to 1.0, 10.42, and 20.6 MPa for the respective pultrusion pulling speed. The morphology’s characterization showed a reconfiguration of the pultrudate at a higher pulling speed leading to larger unimpregnated agglomerations and polymer rich areas. The highest tensile strength achieved was 233.4 ± 1.5 MPa at 50 mm/min and dropped by around 20% when the pulling speed was raised to 1000 mm/min. The pultrudate reconfiguration at higher speed, attributed to delayed melting of PP fibers in underfilled dies, is deemed responsible for the loss in impregnation and mechanical properties.
Introduction
Talc, glass fibers and mica are all examples of inorganic fibers and fillers that are frequently used to reinforce the thermoplastic polymers in the in the automotive industry. 1 However, the manufacturing and discarding of these materials have a hostile impact on the environment. Due to growing environmental awareness, new environmental regulations were announced to help decrease the issue of excessive inorganic waste. 2 These new initiatives are putting pressure on the auto businesses to substitute inorganic fillers with biodegradable alternatives. In addition, fuel consumption can be decreased by around 8% when a 10% weight reduction is achieved as lighter matters require less energy to get transported compared to heavier vehicles. 3 Thus, lighter materials offer improved vehicle fuel efficiency as well as lessening greenhouse gas emissions. In response, several carmakers are using larger amounts of natural fiber-reinforced composite materials. Similarly, several other industries such as medical, pharmaceutical and food packaging are discovering more ways to use natural fiber-reinforced composite materials for both structural and non-structural applications. 4
The use of flax fibers is becoming popular in industrial applications as a result of their low environmental impact as well as their light weight. Compared to other natural fibers, flax fibers are composed of relatively high cellulose content (65-83%), moderate hemicellulose content (11-23%), and low lignin content (0.9-6%). 5 Typically, cellulose decomposition occurs at temperatures above 300°C while hemicellulose decomposition at temperature above 220°C. Lignin decomposition, on the contrary, occurs around 150°C. 6 The high cellulose content makes flax more resistant to the thermal degradation relative to other natural fibers. Additionally, flax is also favoured due to its higher tensile strength attributed to its high cellulose content. In fact, it is said that flax fibers have the highest Young’s modulus among all natural fibers. 7 Thus, the use of flax-reinforced composite materials is beneficial for sustainable industrial applications.
In comparison to thermoset polymers, thermoplastic polymers have very high melt viscosity. This high viscosity makes it difficult to impregnate reinforcement fibers and mould the final product in one-step processes. 8 Consequently, an additional step such as bulk charge or pre-impregnated pellets is needed before the final production, which is usually done using compression or injection molding process. Fibre-reinforced thermoplastic composite materials are frequently categorized based on their fiber reinforcement lengths. For example, long fibre-reinforced thermoplastic (LFT) are composite materials which have thermoplastic polymer and discontinuous reinforcement fibres having a length-to-diameter aspect ratio longer than the critical aspect ratio. 8 LFT pellets are frequently produced using a thermoplastic composites (TPC) pultrusion process.9,10 Pultrusion has drawn recent interest from academics after overcoming persistent impregnation and cooling problems.11–14 Through the TPC pultrusion process, strand precursors that contain the reinforcement and polymer fibers are wound into bobbins that are positioned in a creel. The reinforcement and polymer fibers are then dragged together via a cascade of dies that are heated in order to liquefy the polymer fibers. The yarns which enter the dies contain excess of polymer fibers relative to the die’s volume. The excess polymer, therefore, creates a backflow that helps raise the impregnation pressure. During pultrusion, damage to the reinforcement fibers can be avoided. As a result, the fibers stay continuous after they get processed. Angelov et al. 15 produced Flax/Polypropylene (Flax/PP) pultrudates at different pulling speeds, heating-die temperatures, and fiber volume fractions. The Charpy test fractured coupons images showed pultrudates having dry surface finish and appeared unimpregnated in the fractured areas. The tensile and shear tests were not conducted on these Flax/PP pultrudates. Oswald 16 produced Flax/PolyLactic-Acid (Flax/PLA) rods having a fiber volume fraction around 50% using a multi-die system. Parameters such as pulling speeds and heating-die temperatures were varied. The lowest void content achieved was 2.5% at a pulling speed of 50 mm/min. The pultrudates produced at that speed had a tensile strength of 300 MPa and shear strengths of 20 MPa. Linganiso et al. 17 produced Flax/PLA rods having a volume fiber fraction of 40%. The highest tensile strength achieved was around 75 MPa and belonged to the samples that were produced at 500 mm/min.
When pultruding at high pulling speeds, attaining low void contents in the pultrudates can be challenging since there appears to be a trade-off between increasing the pulling speed and decreasing the void contents. 18 This also can be attributed to the high viscosities of the thermoplastic polymers. Lapointe et al. 18 observed a significant rise in void contents in Carbon/Polyetheretherketone (C/PEEK) pultrudates after the TPC pultrusion’s pulling speed was increased from 50 to 100 mm/min. In fact, the void contents increased by more than 85%. Wiedmer et al. 19 pultruded Carbon/Polymide-12 (C/PA-12) and tested the pultrusion process at different pulling speeds. The void content increased by around 300% after the pulling speed increased from 100 to 400 mm/min. Ghaedsharaf et al. 20 pultruded Carbon/Polyetherimide (C/PEI) of commingled braided yarns. The void content surged after the pulling speed was raised from 50 to 150 mm/min. This finding implies that the void rise was likely due to the polymer flow time which became too short to fully infiltrate through the carbon fiber agglomerations after the pulling speed was raised to 150 mm/min.
Interlacing is a process that periodically interlocks fibers by blowing aligned fiber bundles using compressed air. Saito et al. 21 used Glass-reinforced-polyamide-66 (Glass/PA-66) braided yarns and the interlacing process was applied to some points of the braided yarn. Thus, there were still non-interlaced regions within the yarn. Interlacing was found to reduce the likelihood resin-rich areas. However, the pultrusion speed was limited to 150 mm/min. Linganiso et al. 17 manufactured Flax/PLA rectangular “sandwich” beams using die temperature up to 290°C and speed of 400 mm/min without reporting flax degradation. However, they reported insufficient bonding between fibre and polymer, as well as insufficient polymer penetration in some areas. Bechtold et al. 22 used pultrusion to process Glass/PP commingled braids. Contact heating was tested to increase the pulling speed while maintaining a low void content. Yet, frictional forces were increased, and this resulted in reducing the pulling speed. They suggested that the reason of the high pulling forces was related to the die length which was too long. In order to increase the impregnation level and pulling speed while maintaining the pulling friction low, they recommended replacing the long die with a cascade of shorter dies.
Babeau et al. 23 modeled the heat transfer and polymer flow during a TPC pultrusion process. Their model predicted that the time of residency required for impregnation is inversely proportional to the speed. In other words, when the pulling speed increases, a balance between the increase of pressure and the decrease of the residency time occurs; therefore, the impregnation quality would stay the same as long as the thermal conditions remain the same. Kim et al. 24 proposed a model to predict the pressure inside the heating die as well as impregnation quality in a TPC pultrusion process. This model was subdivided into two polymer flow sub-models, the axial backflow around yarns and the radial impregnation flow sub-models. They were both based on Darcy’s law and each sub-model had a different permeability. The axial backflow sub-model was used to predict the pressure along the die longitudinal axis by modeling the polymer’s backflow induced by the excess polymer. On the other hand, the radial impregnation sub-model was utilized to determine impregnation polymer flow through the fibers’ agglomerations. The models were verified and tested experimentally, and they were proven to be accurate in determining the impregnation quality in TPC pultrusion. Babeau et al. 23 and Kim et al. 24 models both showed that the pressure-speed relationship was linear. Later, Lessard et al. 25 proposed a model, based on Kim et al.’s 24 approach, to predict the pulling force and degree of impregnation of a multi-die pultrusion system. They used Carbon/Polyetherimide (C/PEI) commingled fibers for their validation experiments. In their model, they assumed that backflow did not completely fill the die, thus creating an effective die length shorter than the actual die length. The accuracy of the model was proven to be adequate such that the predicted pulling forces and degree of impregnation agreed with experimental data for low pulling speeds. However, at higher pulling speeds and higher taper angles, their model did not match the experimental data due to non-isothermal conditions.
During a typical TPC process, the preheating stage and dies are heated according to a set process temperature. However, the actual temperature reached by the pultrudate depends on the apparatus’ geometry and residency time. This can create significant discrepancies between the set and the actual material temperatures especially when the pulling speed is high. Alsinani et al. 26 pultruded Flax/PP rods at four distant speed between 50 to 1000 mm/min. The pultruded rods were then cut into pellets for subsequent injection molding. The pulling speeds of 50 and 250 mm/min led to void content increase up to 8% and the rods resulted in well consolidated pellets. Flax/PP rods produced at 500 mm/min and 1000 mm/min led to void contents above 15% as the polymer did not fully melt during the pultrusion process. While a follow-on thermocouple was not used to confirm if the polymer had the same thermal history at all pulling speeds, the microscopic images showed that middle region of the pultrudates produced at 500 mm/min and above did not melt. Thus, at high pulling speeds, it was concluded that the polymer temperature did not reach the melting point and had a different thermal history compared to the low-pulling-speed experiments. Conversely, Babeau et al. 23 adjusted their pultrusion line set temperatures to obtain the same thermal conditions irrespective of the speed. They confirmed the consistency of the thermal conditions at different speeds; namely 100, 500 and 1000 mm/min, using a follow-on thermocouple inserted with the pultruded materials. They observed that an increase in pulling speed caused an increase in pressure that induced local compaction of the tows. This compaction decreased the tows’ permeability since individual reinforcement fibers were closer to each other in the fiber agglomerations. These observations indicate that the reconfiguration of the fiber agglomerations during pultrusion must be considered to achieve proper consolidation.
The objective of this study is to verify if the speed-induced pressure can offset the decrease in residency time that is required for impregnation quality and observe possible pultrudate morphology’s reconfiguration. Flax/PP precursors were pultruded at 50, 500 and 1000 mm/min. To ensure consistency in the thermal conditions at different pulling speeds, the dies’ temperatures were adjusted to obtain similar pultrusion thermal conditions at every pulling speed. The pressure in the pultrusion dies was estimated using an approach developed by Lessard et al. 25 The pressure estimations were used to support the pultrudates’ cross-section morphology, tensile and shear strength variations for different pultrusion pulling speeds.
Experimental
Materials
Pure PP yarns (Normal tenacity PP multifilament yarn, Guangzhou Chemical Fiber Co.) in the form multifilament fiber yarns of 100 Tex size were used for the pultrusion. The glass transition temperature of PP was in the range of −18 to −13°C.
27
The melting point of the PP was 166.5
Pultrusion experiments
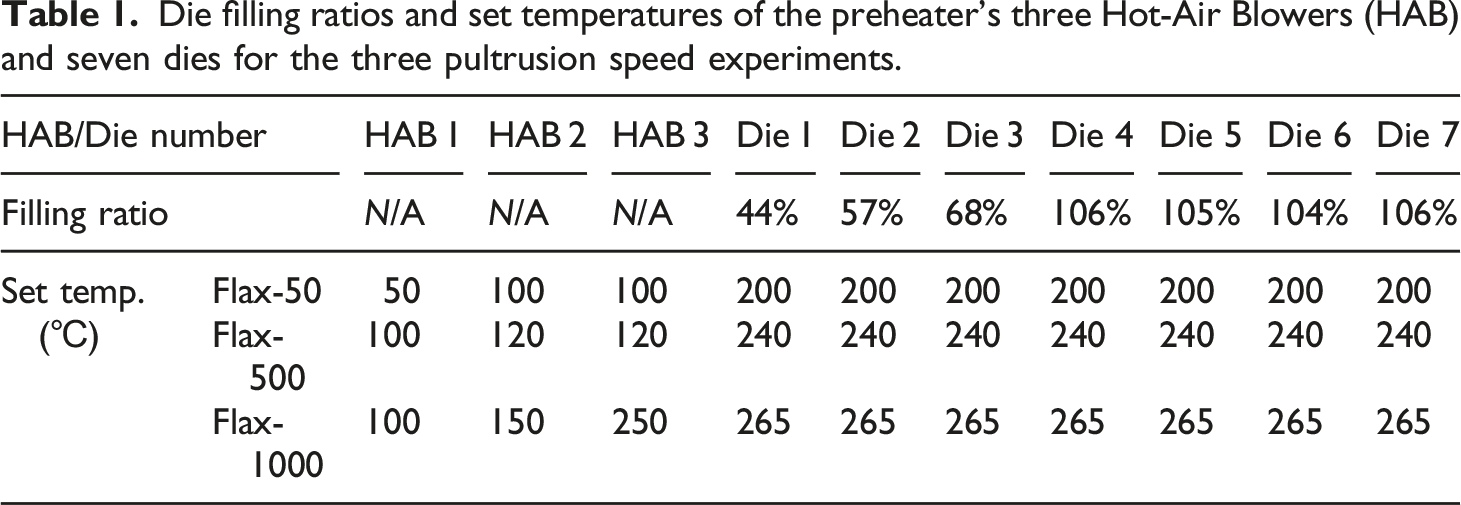
Figure 1 presents the schematic for the pultrusion system used in this study. The pultrusion apparatus contained a creel, a guide, a preheater, seven heating dies, a cooling die, a load-cell and a pulling system. The creel allowed for individual adjustment for each of the bobbins’ tensions. One Newton tension was applied to each bobbin that contained flax while no tension was applied to the bobbins that contained the PP fibers. The 1 m-long preheater had a square cross-section of 300 mm in width and was equipped with three Hot-Air Blowers (HAB, VT-752C, Varitemp Heat Gun) installed in sequence. The HAB were all manually controlled, and their temperature was measured using thermocouples at HAB exit. All seven heating dies had a 31.75 mm-long conical cavity followed by a straight 6.35 mm cylindrical cavity (total length of 38.1 mm). The dies’ conical opening angle ( A schematic of the multi-die pultrusion system used in this study. The pultrusion system included a creel, a pre-heater, seven pultrusion dies with a 10° taper angle and reducing exit diameter, a thin-walled tube, a cooling die, a load-cell and a pulling system. Die filling ratios and set temperatures of the preheater’s three Hot-Air Blowers (HAB) and seven dies for the three pultrusion speed experiments.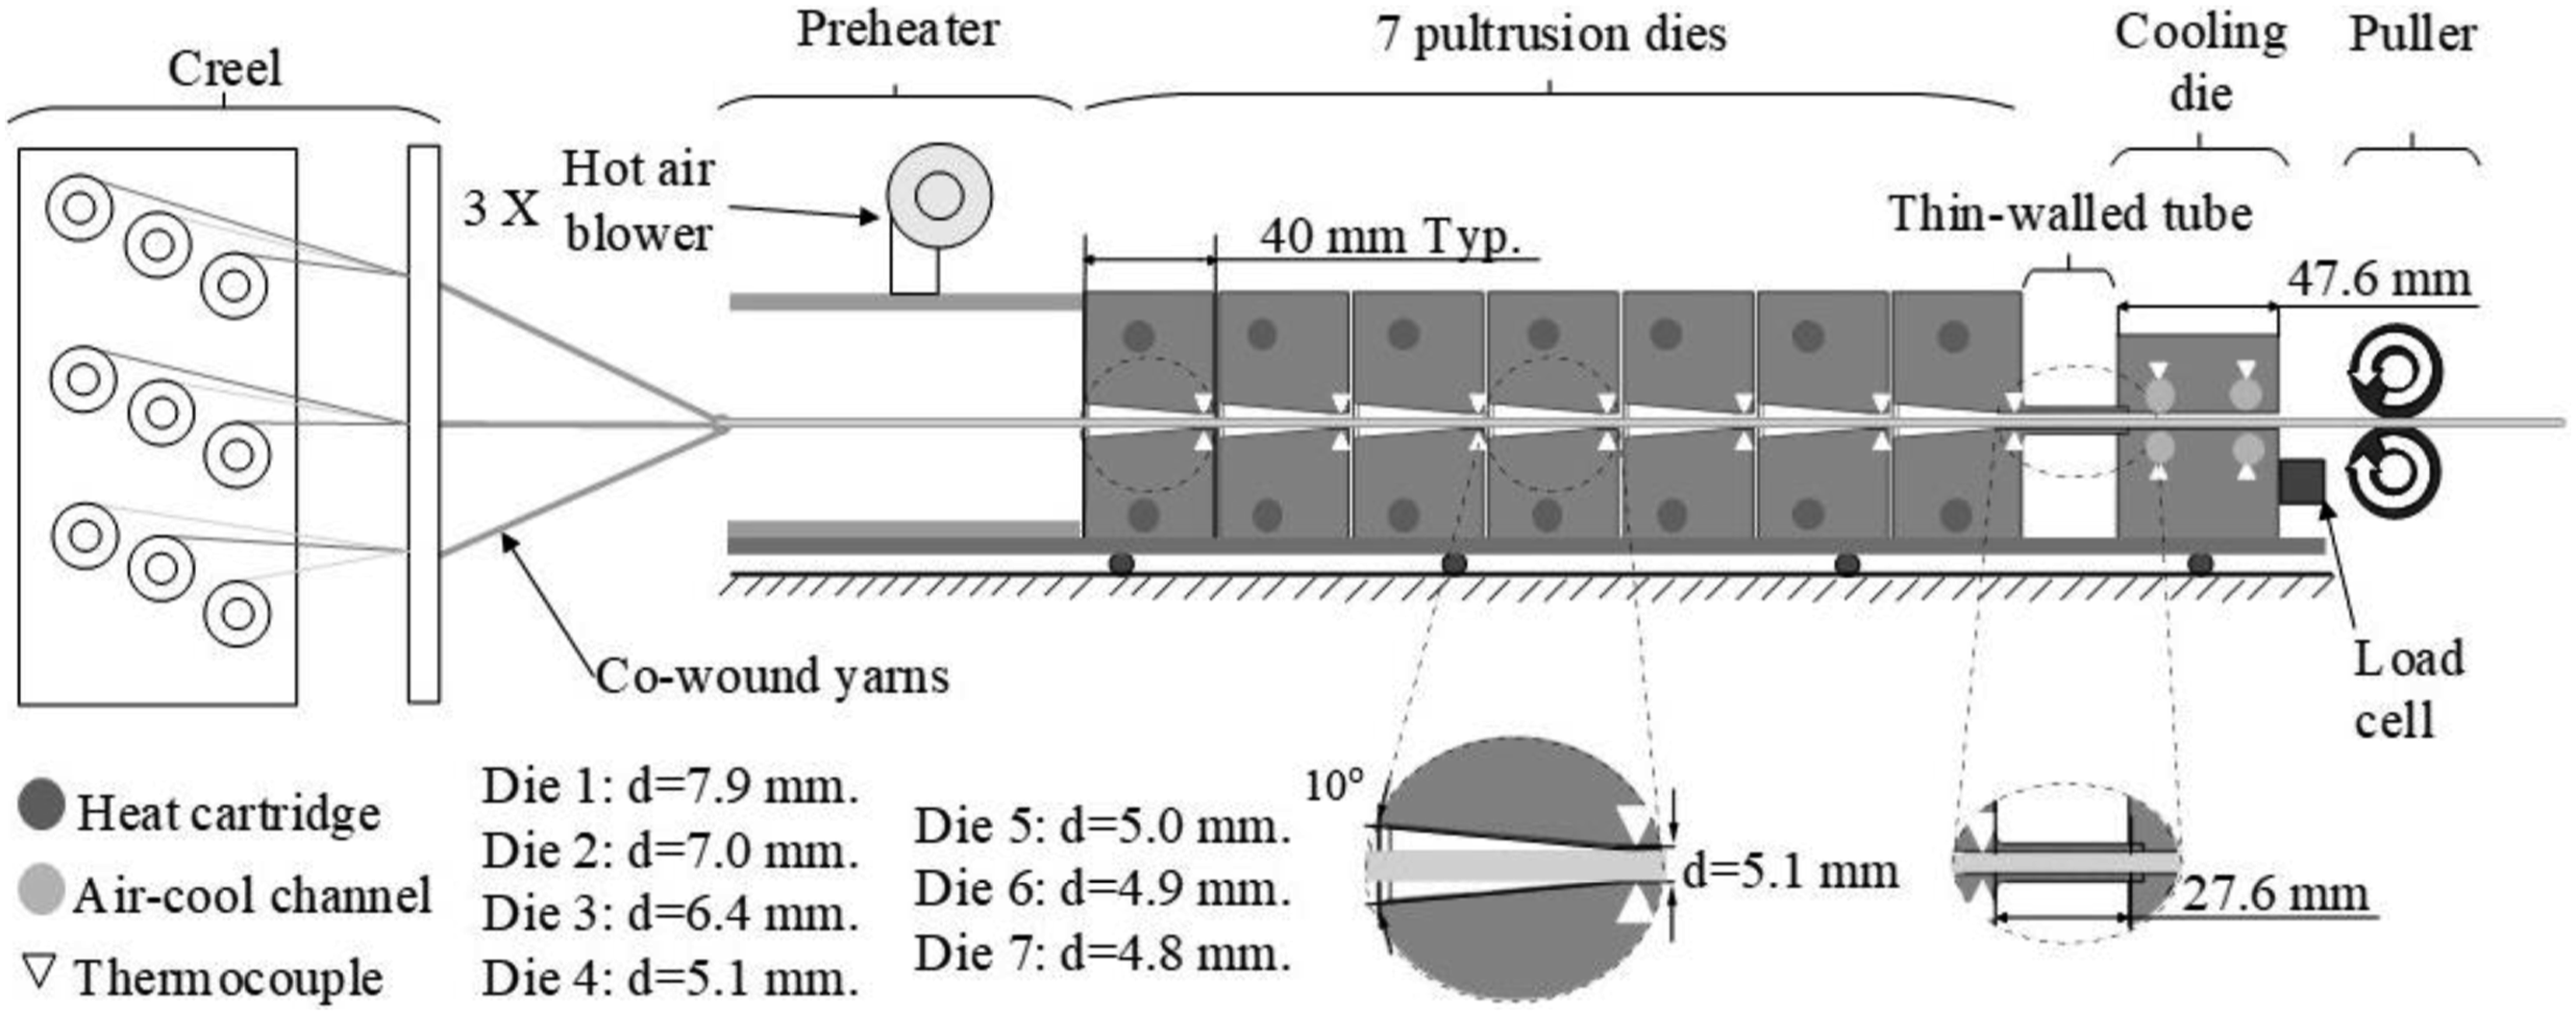
Characterization
Cylindrical samples were made using a precision saw. The cylindrical samples were polished and analyzed under a microscope (Metallovert, Leitz). Photos of 200 X magnification were taken and then stitched to form the whole cross-section of pultrudate. The void content was measured according to ASTM2734-09 Method C. The shear tests were conducted according to ASTM D3914-02 and the tensile tests were conducted according to ASTM D3916-08. More details on the testing procedures can be found in Oswald. 16
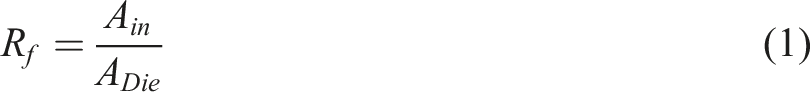
Modeling
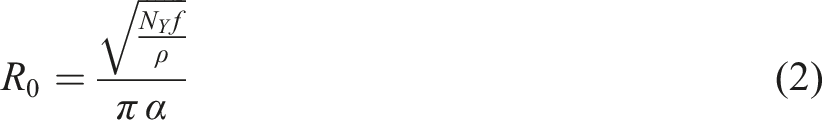
Models’ constants and parameters.
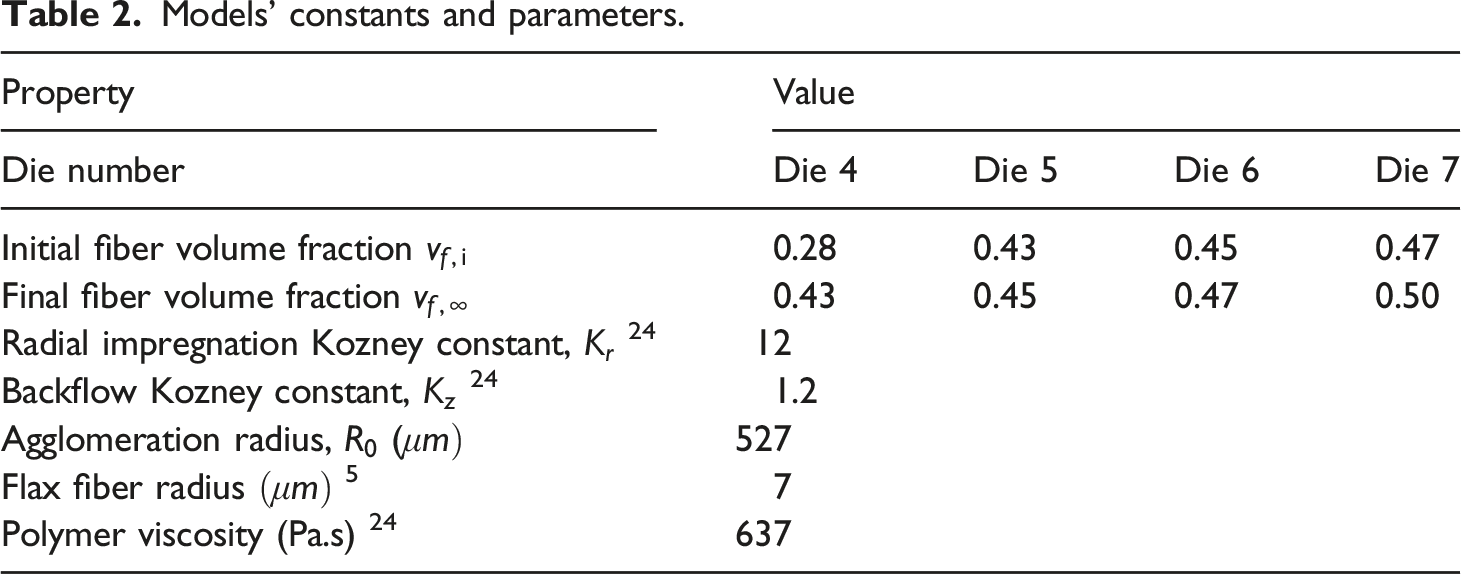
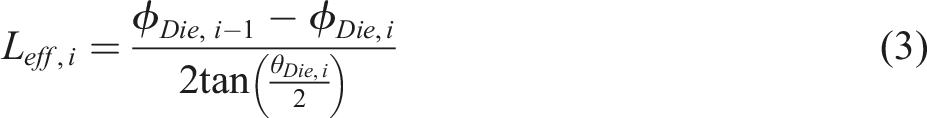
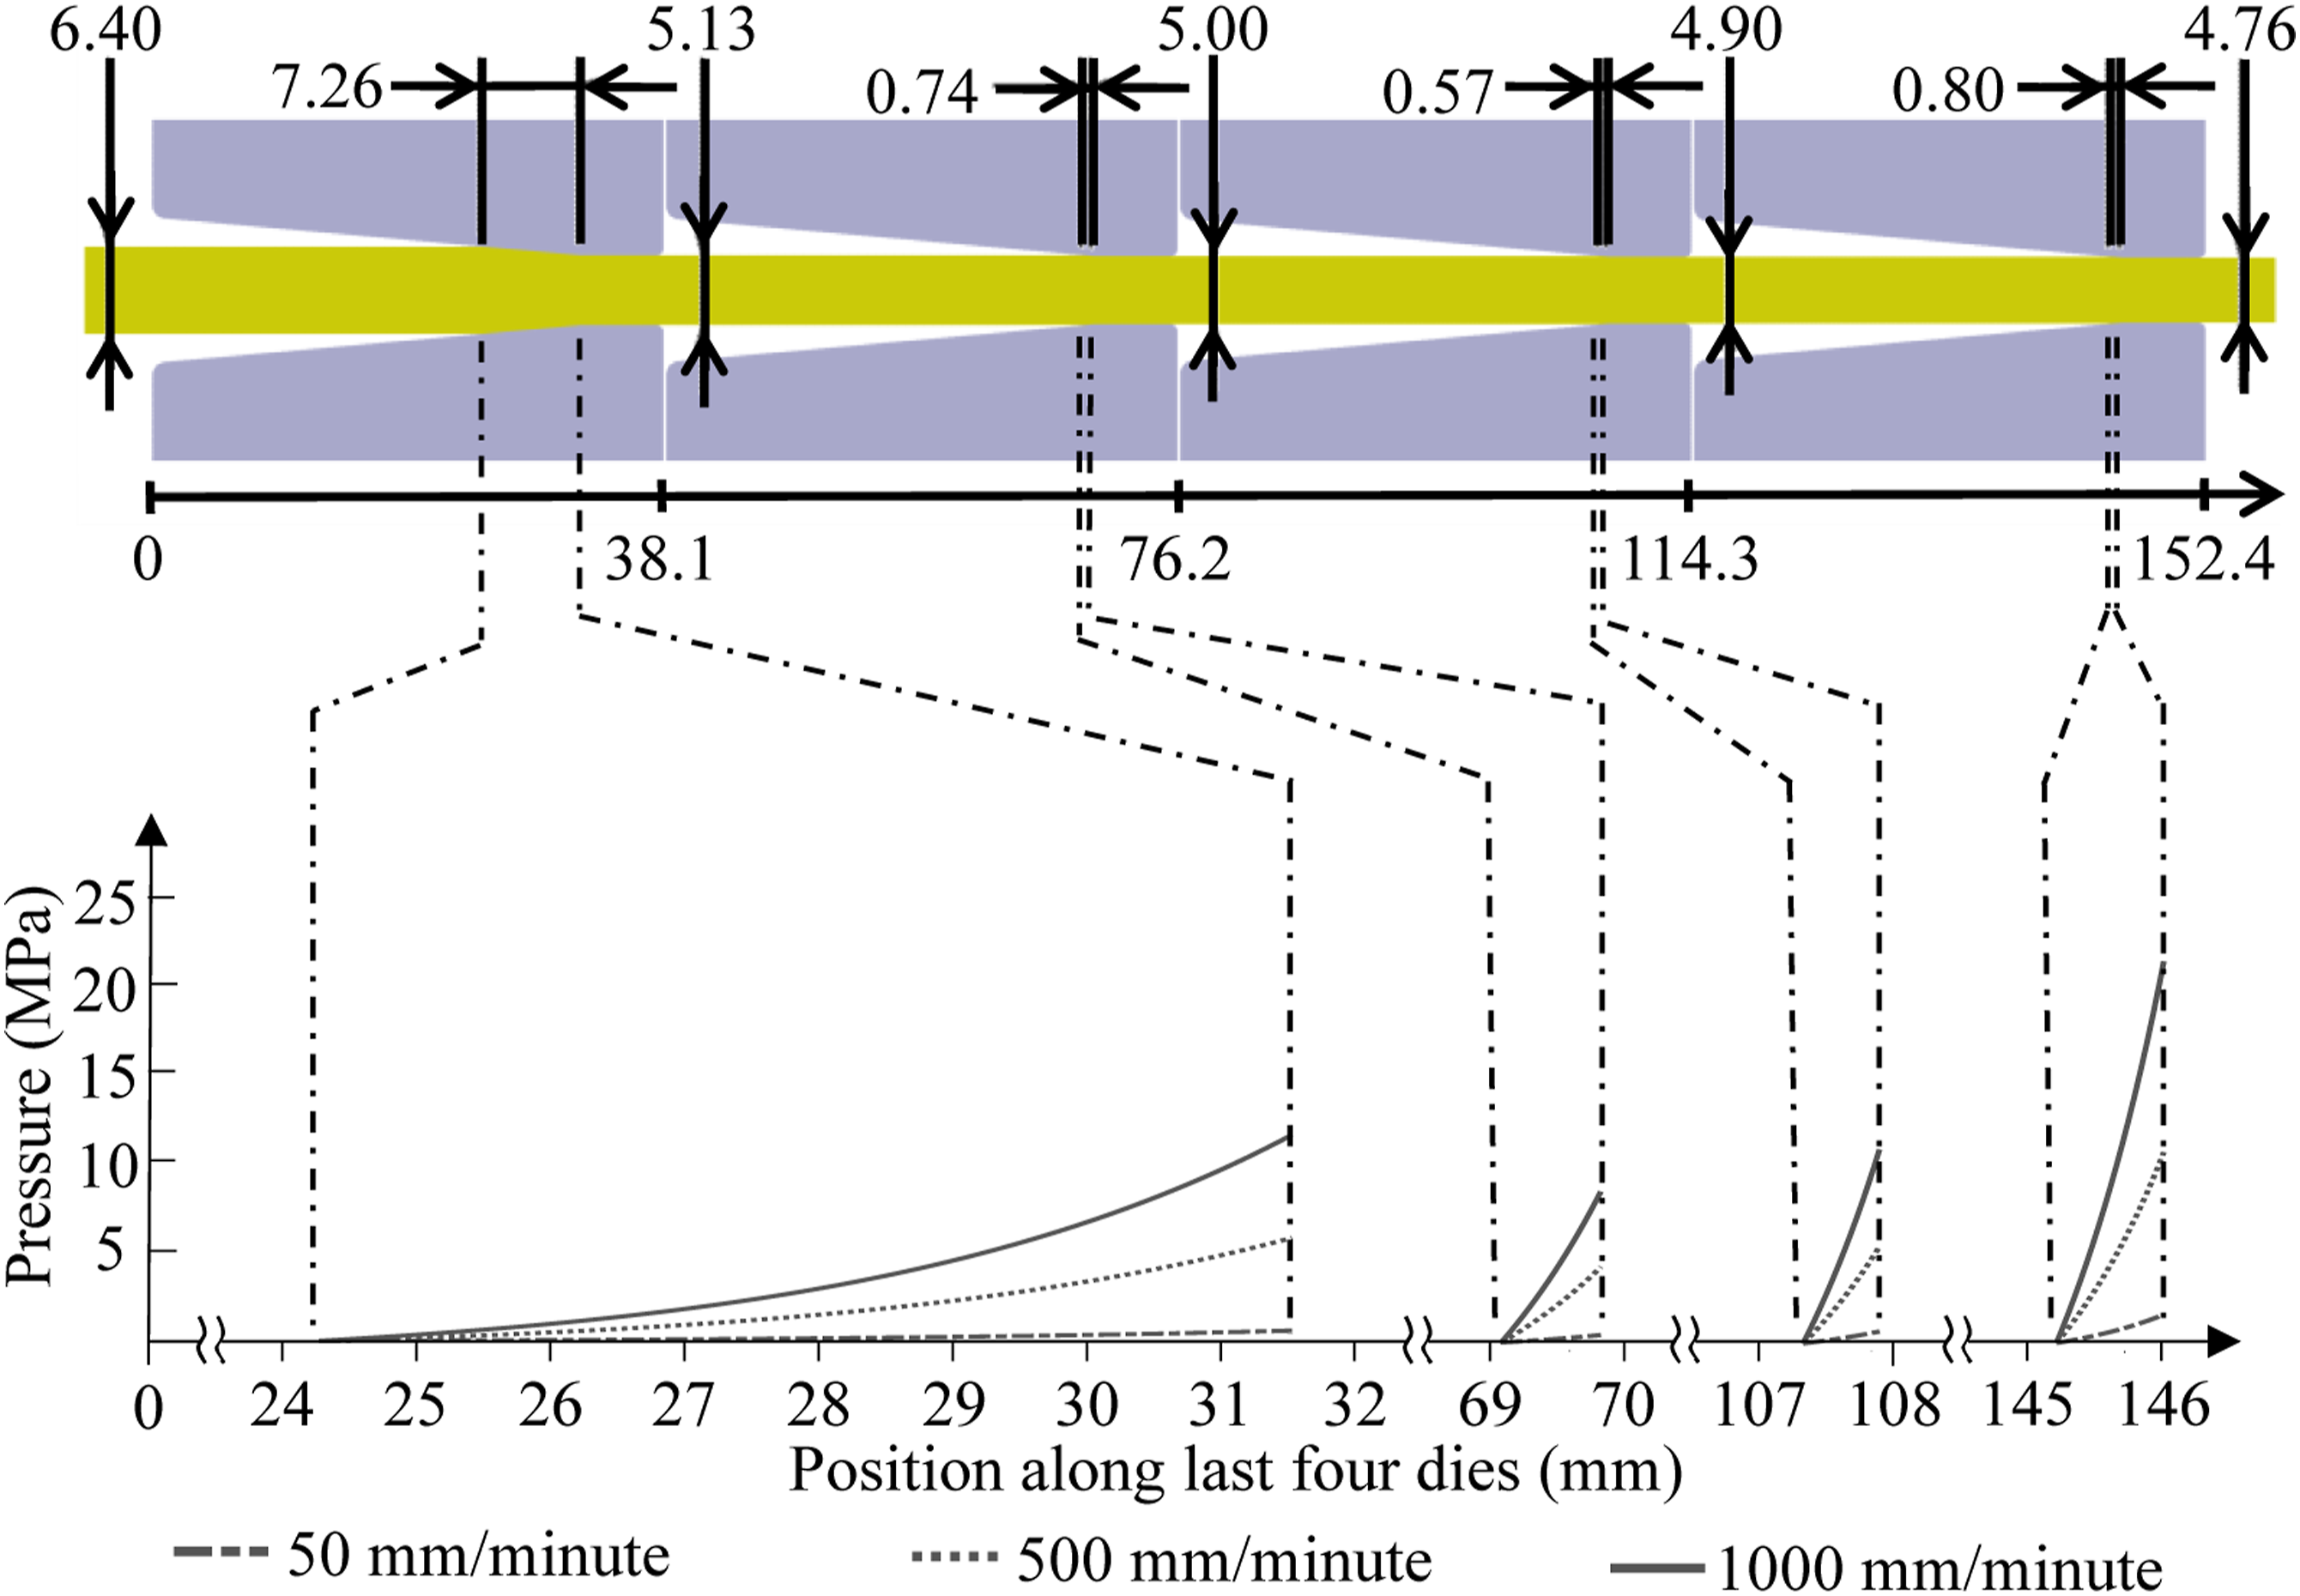
Figure 2 shows the computed pressure evolution in the tapered region of the last four dies, which are the only dies that had overfill for the three pultrusion speeds. As seen in Figure 2, the effective die length was calculated to be 7.26, 0.74, 0.57 mm and 0.80 for Dies 4 to 7 respectively. Despite having a larger exit diameter, the pressure in Die 4 reached higher pressures compared to Dies 5 and 6, for each pulling speed. This can be attributed to the longer effective die length of Die 4 compared to Dies 5 and 6. Die 7 resulted in the highest pressure. From Dies 5 to 7, the effective die length values are similar when compared to the effective die length of Die 4. For a given pultrusion speed, it is seen that progressive outlet diameter reduction from Dies 5 to 7 resulted in progressive maximal pressure increase. Finally, it is seen that faster pulling speeds made the computed maximal pressure in the seventh die to increase. The polymer pressure in the pultrusion dies was computed to reach only 1.0 MPa when the pulling speed was 50 mm/min. This pressure raised to 10.4 and 20.6 MPa when the speed was increased to 500 and 1000 mm/min, respectively. The pulling force was considered here to be the force opposite to the polymer pressure application onto the filled dies’ surface ( Computed pressure evolution in the tapered region of the Dies 4 to 7. Higher effective die length and smaller exit diameters made the pressure go higher.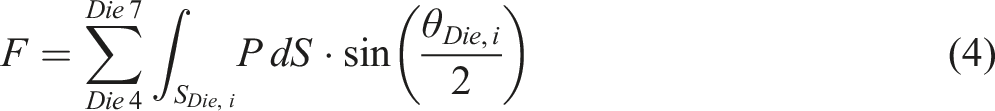
The solid line in Figure 3 shows the computed force using (Equation (4)). The computed pultrusion force values are 2.4 N, 23.6 N, and 47.2 N for 50 mm/min, 500 mm/min, and 1000 mm/min, respectively. Moreover, the pulling force shows a linear increase with respect to pulling speed. A comparison between measured pultrusion force and computed pultrusion force in Dies 4 to 7. The measured pultrusion force is higher and it’s slope with respect to pultrusion speed steeper than the computed one. The measured force slope changes before and after the 500 mm/min point, while the computed one is constant.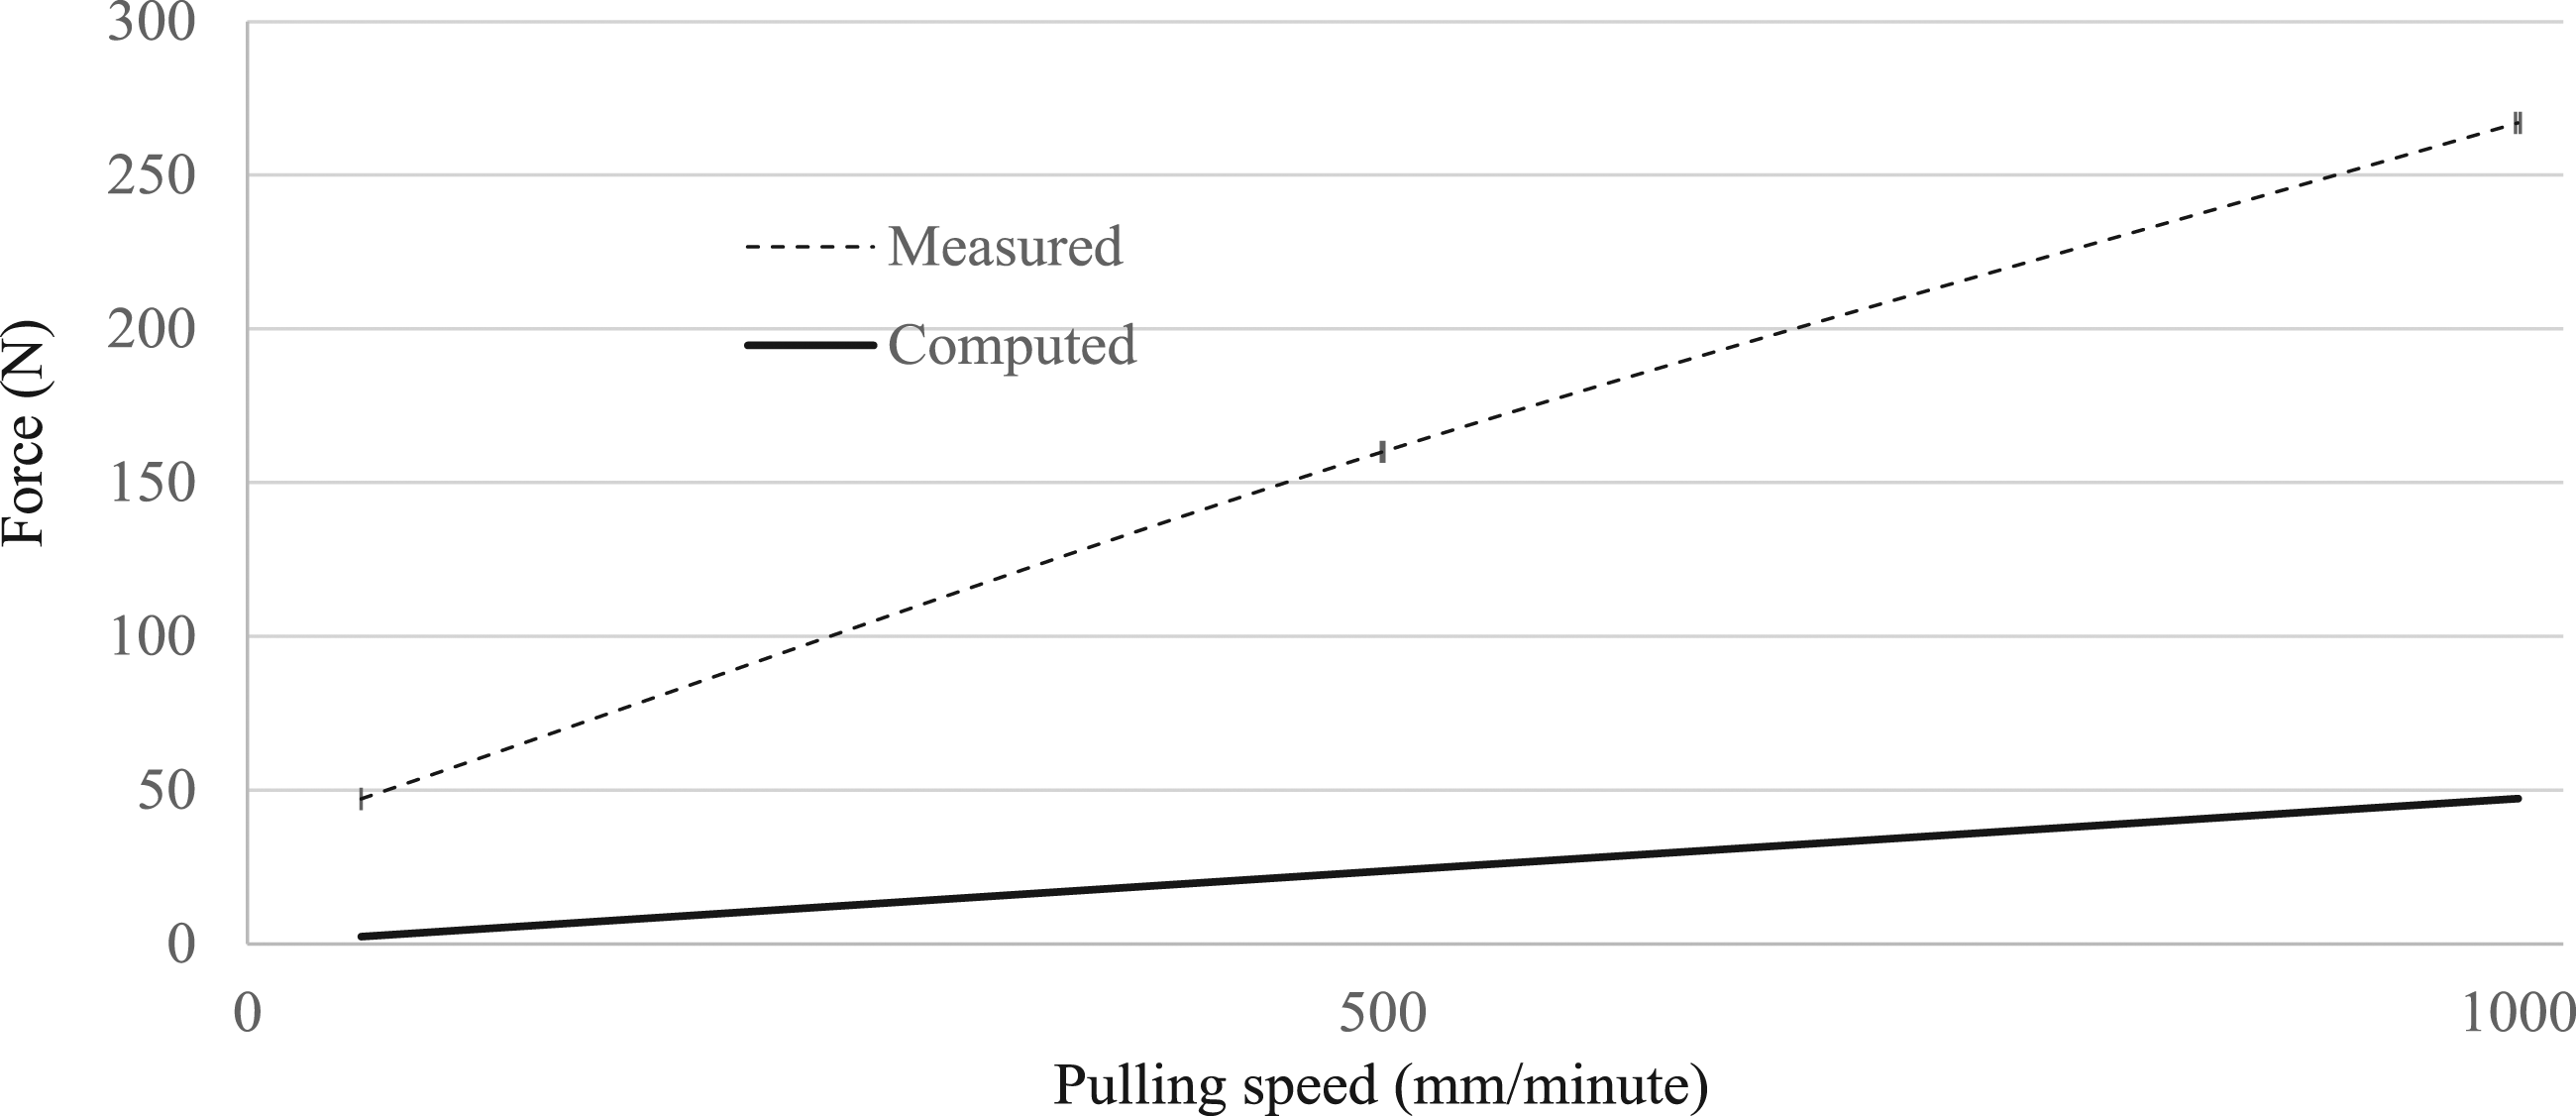
Results and discussions
Pultrusion experiments’ observation
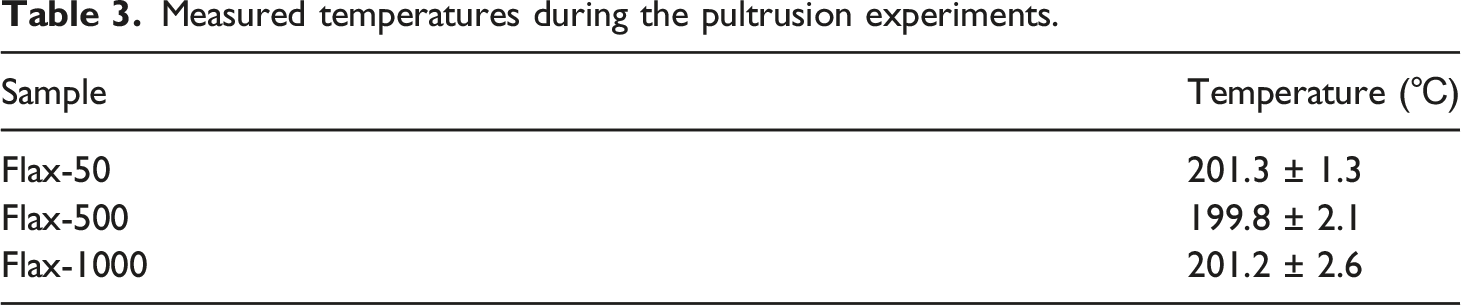
During all the three experiments, there was no incident of fiber breakage. It is also important to note that the pulling speed was gradually raised especially during the high pulling speeds experiments. This reduced the probability of having fiber breakage. Figure 4 (a), (b) and (c) show the temperature measurements taken during Flax-50, Flax-500 and Flax-1000 experiments respectively. Before entering Die 1, the temperature in all cases was well below the melting point. The highest temperature reached was 133, 108 and 96°C for Flax-50, Flax-500, Flax-1000 respectively. This implies that the polymer did not melt before entering Die 1. Furthermore, the curves demonstrate that the pultrudates reached the processing temperature, i. e. 200°C by the fourth die, for all speeds. Table 3 shows the measured temperatures during the pultrusion experiments. The average temperatures in the last four dies were 201.3 ± 1.3, 199.8 ± 2.1, 201.2 ± 2.6°C for Flax-50, Flax-500, and Flax-1000 respectively. At the higher pulling speed experiments, the set temperatures were 245 for Flax-500, and 265°C for Flax-1000 (see Table 1). The temperature stopped raising towards the set temperatures once the precursor entered the fourth die. The temperature stabilization is attributed to the overfilled state of the pultrudate beginning at the fourth die. The thermocouples were placed in the middle of precursors. Once it entered the last four dies, it became encapsulated in the low thermally conductive Flax/PP composite. The first three dies worked as preheaters with filling ratios below 100%. Since the pultrudate was unconsolidated, it is supposed that heating could reach the separated fibers. The temperature gradient between the die surface and the pultrudate’s core, where the thermocouple was located, was not characterized due to technical difficulties. The pultrudate temperature was considered constant along the radial direction. Future work should consider the temperature gradient in the radial direction at high pulling and study its influence on impregnation and pulling force. The temprature measurement during a typical: (a) Flax-50. (b) Flax-500. (c) Flax-1000. The process temperature is reached at Die 2 for Flax-50 while being reached at Die 4 for Flax-500 and Flax-1000. All three experiments reached 200°C process temperature in Dies 4 to 7. Measured temperatures during the pultrusion experiments.
Flax-50 pultrudate spent 3.2 min in the last four dies while Flax-500 spent 0.32 min and Flax-1000 spent 0.16 min. Figure 4 also indicates the exit temperature (T out ) of the pultrudate for the different pultrusion speed. Flax-50’s T out was 47.6°C, Flax-500s was 101.4°C and Flax-1000s was 156.8°C. The increasing pultrudate’s T out with respect to pultrusion speed is attributed to improper adjustment of the cooling die temperature. The compressed air cooling flowing through the cooling channels was insufficient to keep the same cooling conditions irrespective of pultrudate speed. Water cooling could be used to improve the cooling efficiency. Figure 3 also shows the measured pultrusion force for all experiments compared to the computed force using equation (3). Flax-50 resulted in 47.1 ± 0.1 N pulling forces while Flax-500 and Flax-1000 resulted in 160.2 ± 0.5 N and 266.5 ± 1.1 N respectively. The measured forces are one order of magnitude higher than the computed forces at their corresponding speed. The primary explanation is related to the fact that the model neglected the fiber-to-die-wall friction forces in all pultrusion and cooling dies. Friction forces are independent of relative speed between friction surfaces. However, in Figure 3, the measured pulling force differences with the computed force is seen to increase with increasing pulling speed. At 50 mm/min, the measured pulling force is 44 N higher than computed pulling force, while at 1000 mm/min, it was 217 N higher than the computed forces. According to Figure 4, the polymer temperature rise was steeper at 50 mm/min than the other speeds. It is suspected that the polymer melted earlier at 50 mm/min than at the faster experiments. Therefore, the polymer acted as a lubricant that lowered the friction forces. Moreover, at higher speed, the unmelted polymer fibers in the first dies exerted higher pressure on the die surfaces upon compaction. Finally, it suspected that the cooling section also contributed to the increasing measured-to-computed difference in pulling force with respect to speed. As seen in Alsinani et al., 12 the polymer adheres to the die surface when cooling from the processing temperatures until it shrinks and separates. The adhesion length is directly related to the distance on which the polymer cools. At higher speed, the pultrudate adhesion length with cooling die’s surface became higher. This likely added more frictional forces opposing the pulling action. The significantly higher actual pultrusion force at 1000 mm/min is an indication that the model cannot capture all phenomena occurring during pultrusion.
The increase in pultrusion force indicates higher impregnation pressure with increasing pulling speed. However, contrary to the computed pultrusion forces, the increase in measured force does not follow a linear relationship with speed. The apparent force increase rate was 0.25 N/(mm/min) from 50 mm/min to 500 mm/min, and 0.21 N/(mm/min) from 500 mm/min to 1000 mm/min. In comparison, the computed force in Dies 4 to 7 was linear at an increase rate of 0.06 N/(mm/min). The non-linear increase observed experimentally is contradictory with behaviors predicted by Kim et al., 24 Babeau et al. 23 as well as the modeling done in this study. Future improvements to pultrusion models should address this contradiction. For example, the polymer viscosity should be considered non-Newtonian. Moreover, the viscosity should be modeled differently for the highly sheared polymer at die wall and the lower speed micro-flow within the fiber bundles.
Morphological analysis of the pultrudates
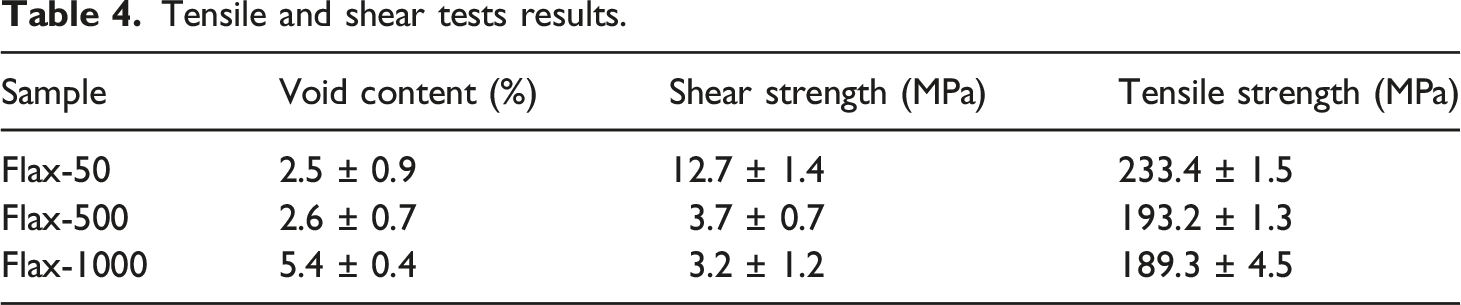
Tensile and shear tests results.
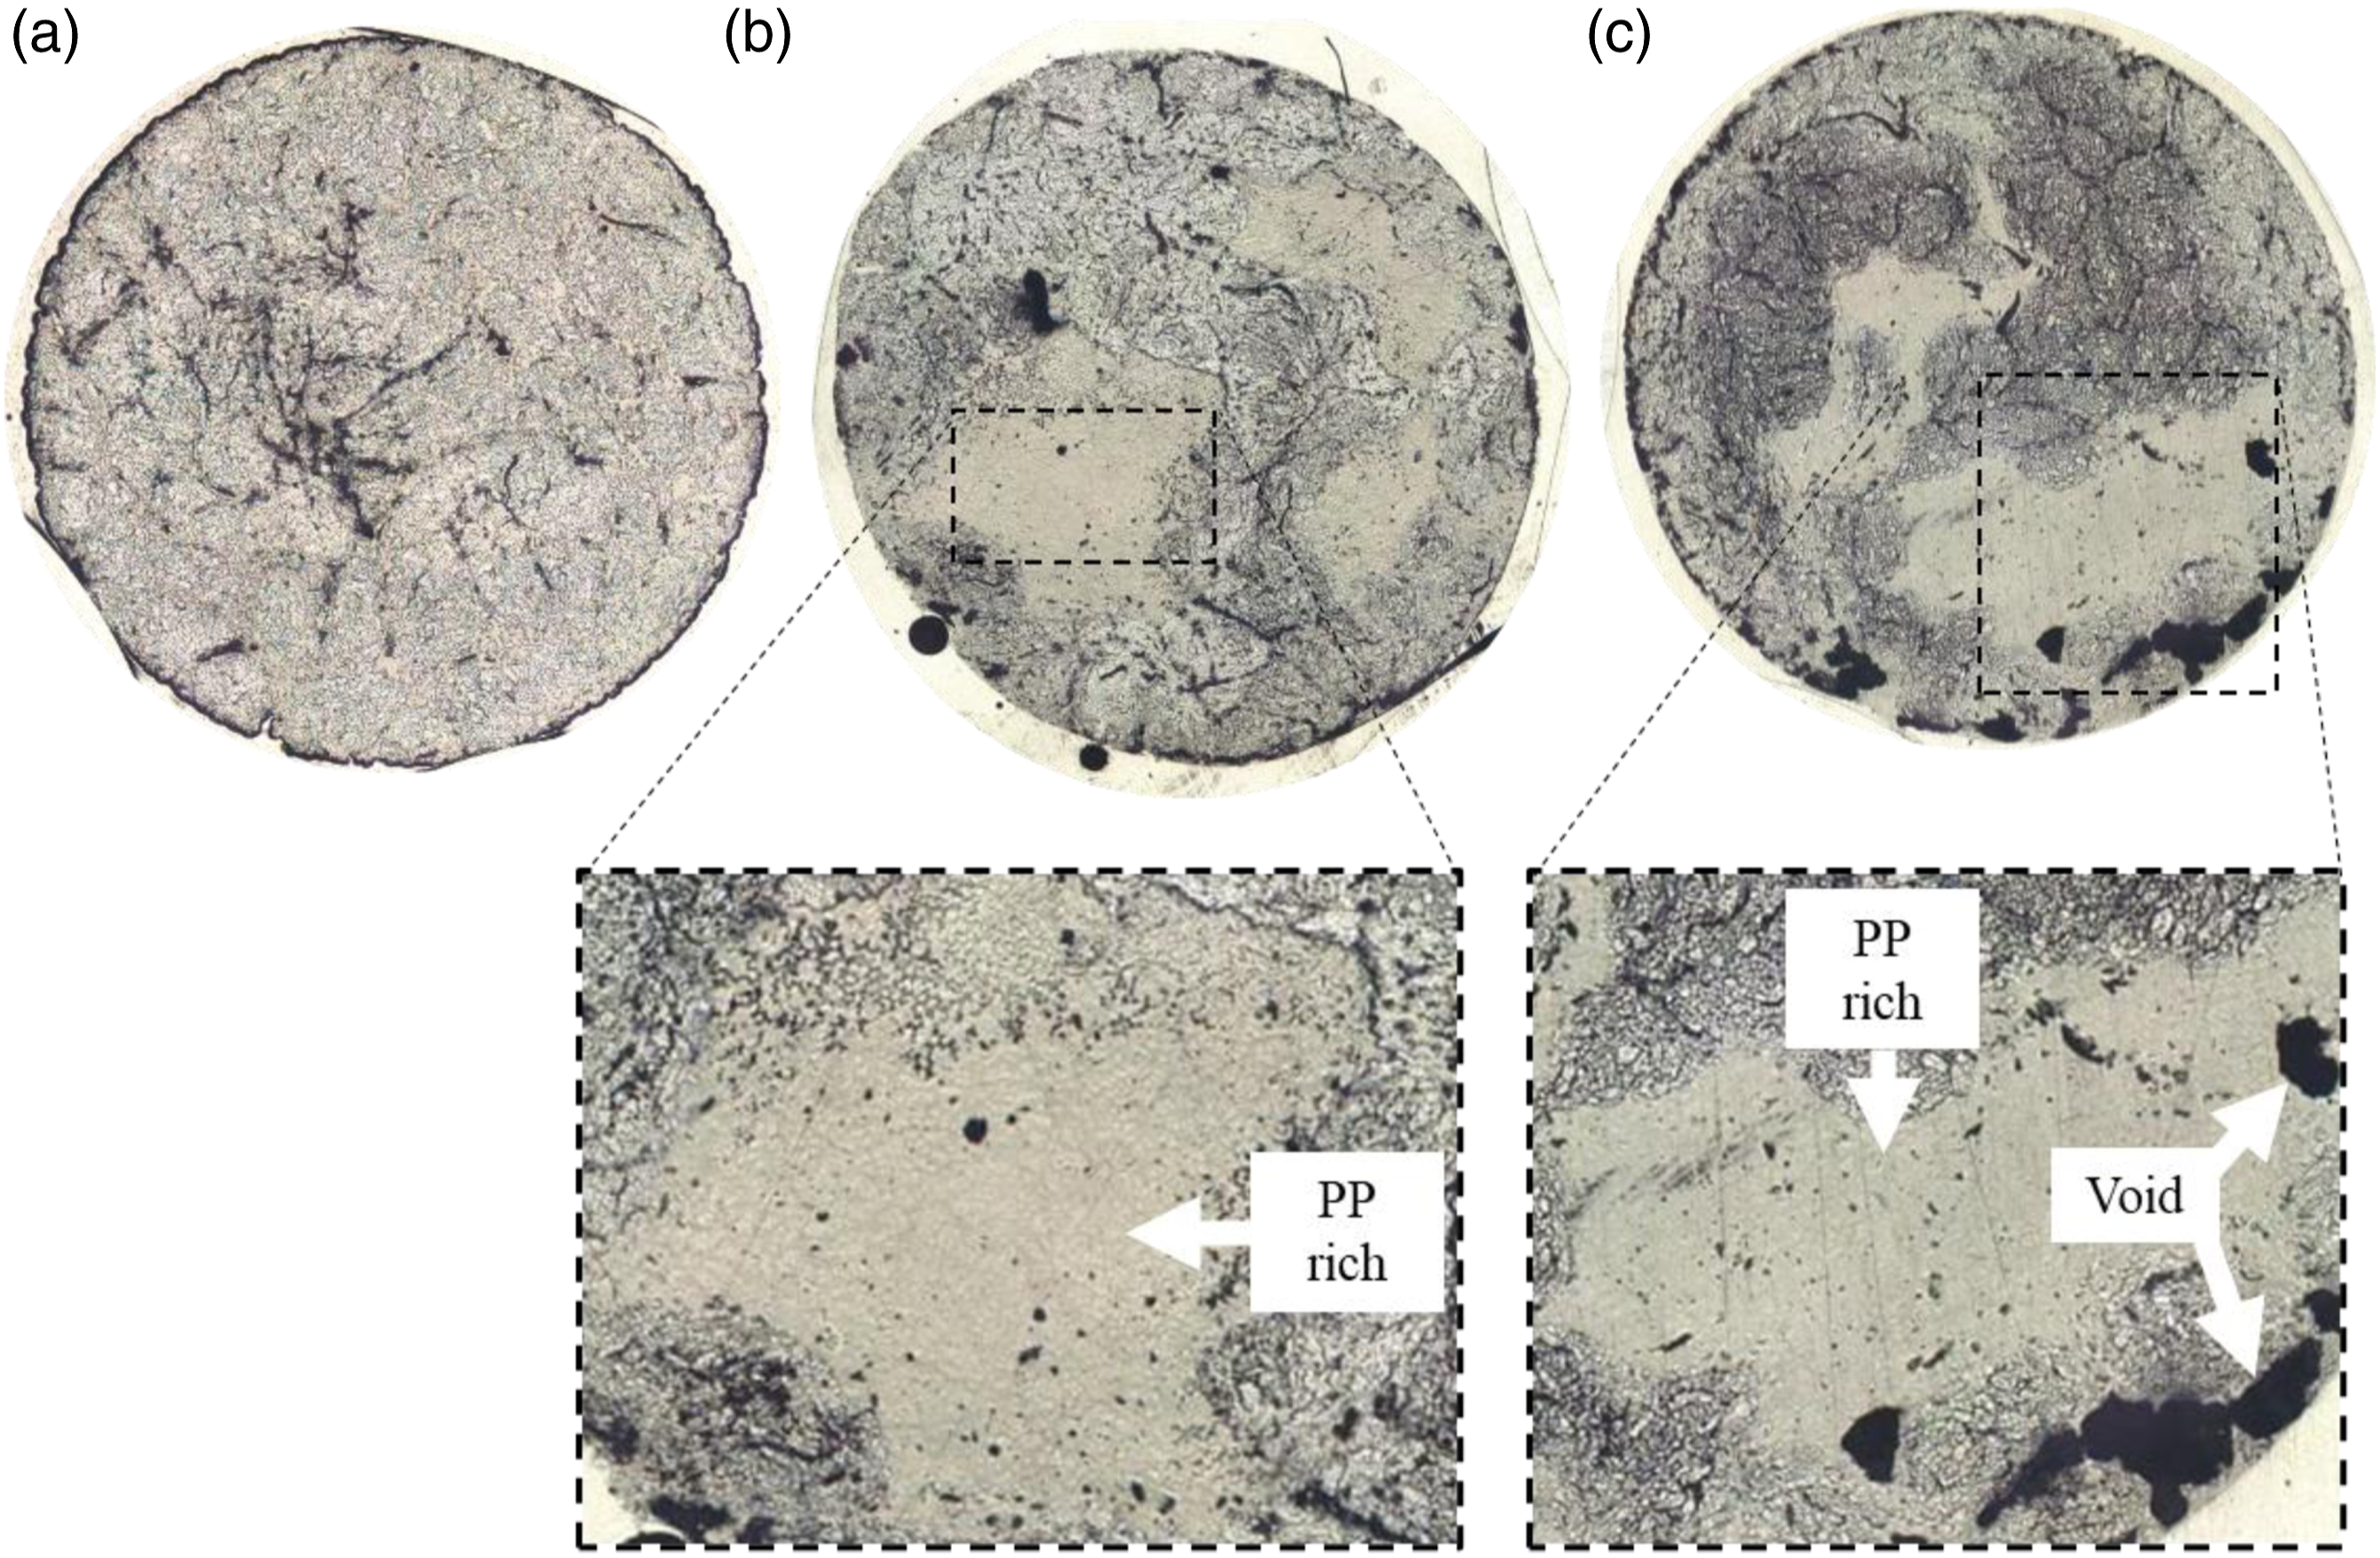
The microscopic photos of flax/PP pultrudates. (a) Flax-50. (b) Flax-500. (c) Flax-1000. Flax-500 and Flax-1000 are showing large polymer rich areas.
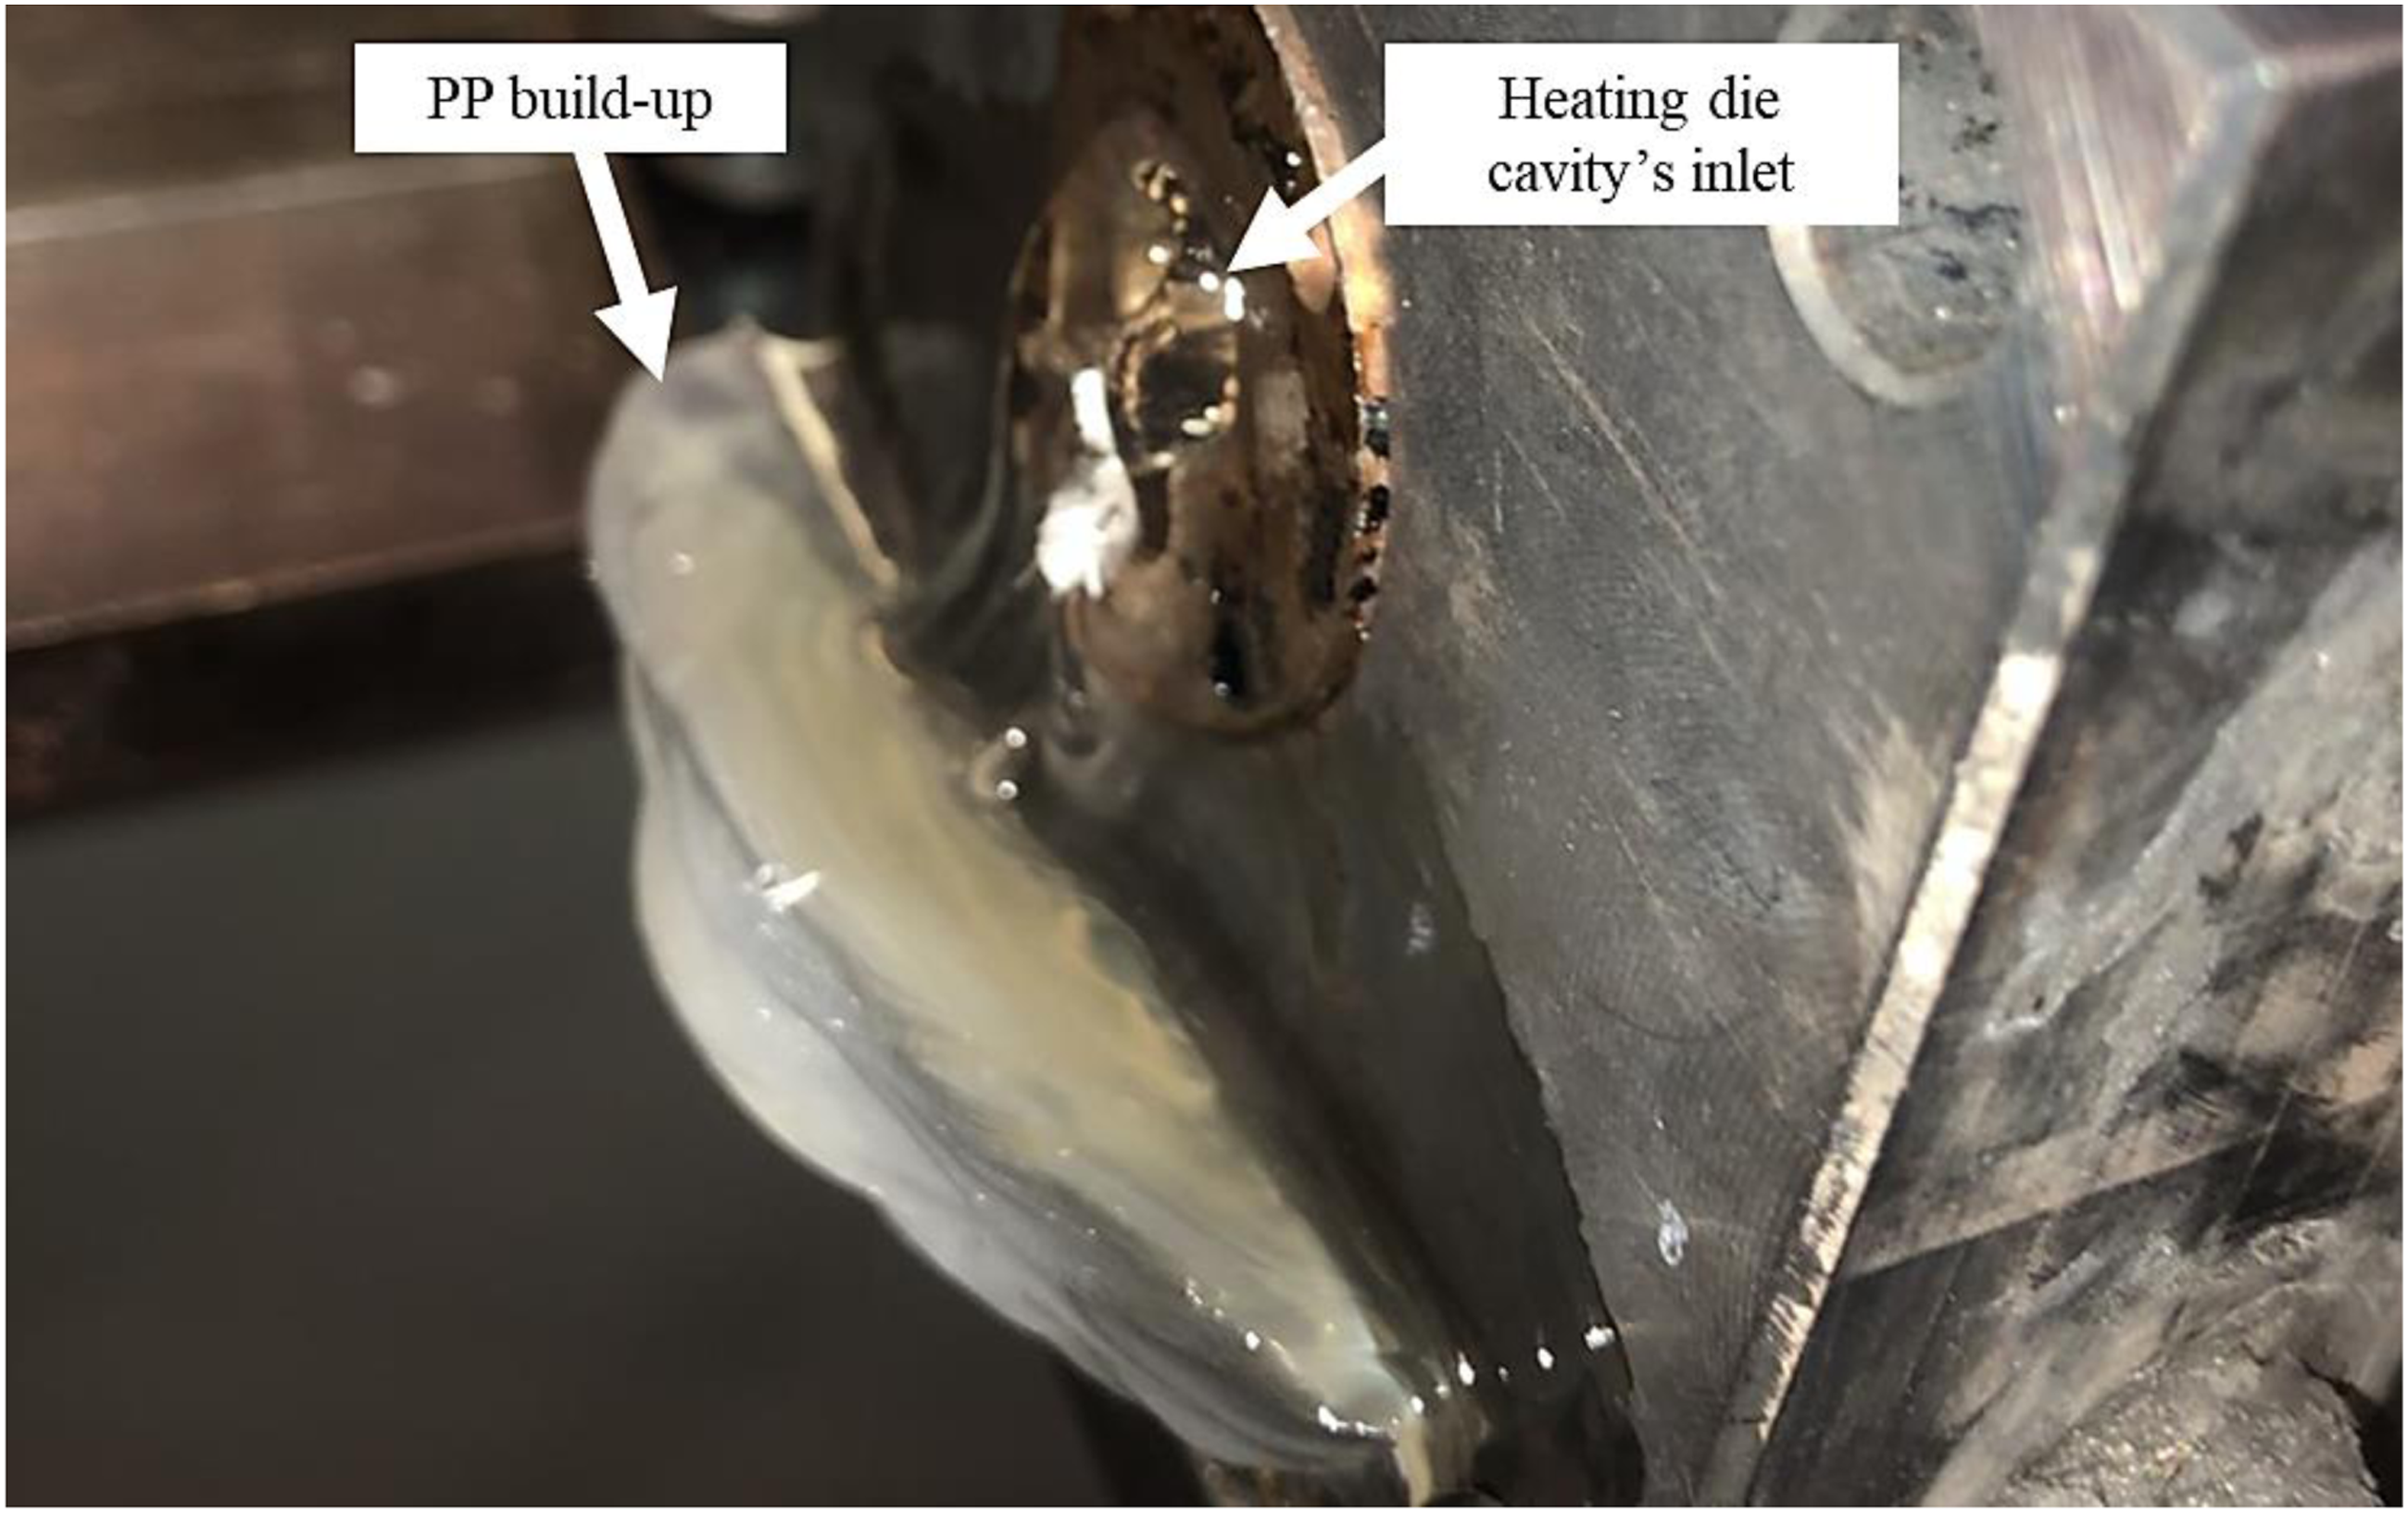
PP build-up at the heating die cavity’s inlet in a typical Flax/PP pultrusion process.
Flax-50 microscopic image shows well distributed and well impregnated fibers. Figure 5 (b) and c) shows pultrudates produced at higher pulling speeds. Large polymer rich areas are seen. It seems that the increase in pulling forces, induced by higher pulling speeds, led to an increase in the fiber agglomeration compaction. The agglomeration compaction was not considered in the model. This observation indicates that it must be included to improve model accuracy. Also, the pultrudates produced at high pulling speed experiments were reconfigured in large groups of yarns. Therefore, the effective agglomeration radius to be impregnated was larger at higher speed than at lower speed. A plausible explanation for this rearrangement can be deduced by analysing the temperature reading of the follow-on thermocouple in Figure 4. The temperature rise in the first three dies show that the maximum temperature is reached much faster in Flax-50 than the Flax-1000 experiment. This created a delay in polymer melting at higher speed. Moreover, as observed in Nawaf et al. 26 the PP polymer melts progressively from the die surface to the center of the pultrudate. Therefore, since un-melted polymer fibers cannot flow around flax agglomerations, the area they occupied effectively compressed and pushed the flax yarns into the melted PP in contact with the die. Then, the PP fiber rich areas finally melted before entering the fourth die leading to polymer rich regions seen in Figure 5 (b) and (c). The above explanation behind the fiber reconfiguration will be investigated thoroughly in future studies. In any case, it can be affirmed that a co-wound yarn precursor structure is more likely to result in such a rearrangement since the unimpregnated fiber agglomeration movement relative to each other is not secured by any mechanical feature once the polymer is melted. Future work must develop a precursor structure for high speed pultrusion that is structured in a way that prevents polymer rich creation. Another possible solution would be to use preheating dies with low or no taper angle. These preheating dies would bring the polymer fibers to melt without compression, while securing them to prevent their separation from the pultrudate at die entrance.
Mechanical properties of pultrudates
Figure 7 (a) presents a pultruded sample prepared for shear test; (b) presents a typical shear stress versus displacement result for pultrudates produced at 50, 500, 1000 mm/min. The 50 mm/min curve exhibited the highest peak value which was 12.7 ± 1.4 MPa. The pultrudates, produced at higher speeds, achieved much lower shear strengths of 3.7 ± 0.7 and 3.2 ± 1.2 for Flax-500 and Flax-1000 respectively. The shear strength variation between Flax-500 and Flax-50 can be calculated by normalizing their difference with respect to Flax-50 result. The variation is −71%, while measured void contents for the same experiments do not show a significant difference when considering the standard deviation. This −71% variation in shear strength is attributed to the apparition of large unreinforced resin-rich regions in the Flax-500 pultrudates, as seen in Figure 5(b). The large resin rich regions are mostly located in the center of the pultrudate, where the larger shear stress is occurring when testing per ASTM D3914-02. When comparing Flax-1000 to Flax-50, the shear strength variation is −75%. In this case, the void content difference is significant, and the void content of the Flax-1000 is approximately twice the Flax-50 value. The other contributing factors could be the lower impregnation of the flax fiber bundles combined with large voids in the resin rich regions, as seen in Figure 5(c). Table 4 presents the tensile and shear strength values. Following the same trend, the highest tensile strength value was achieved for Flax-50 and was 233.4 ± 1.5 MPa. The higher speed pultrudates achieved much lower tensile strengths: 193.2 ± 1.3 and 189.3 ± 4.5 MPa for 500 and 1000 mm/min respectively. These values are significantly lower than the Flax-50. The lower tensile and shear strengths can be attributed the polymer rich regions and bad impregnation quality as reported in the Results and Discussions Section. (a) Pultruded sample prepared for shear test. (b) A typical Shear stress-displacement result of shear test for 50, 500, 1000 mm/min. The 50 mm/min sample is showing a higher shear strength value compared to the other samples.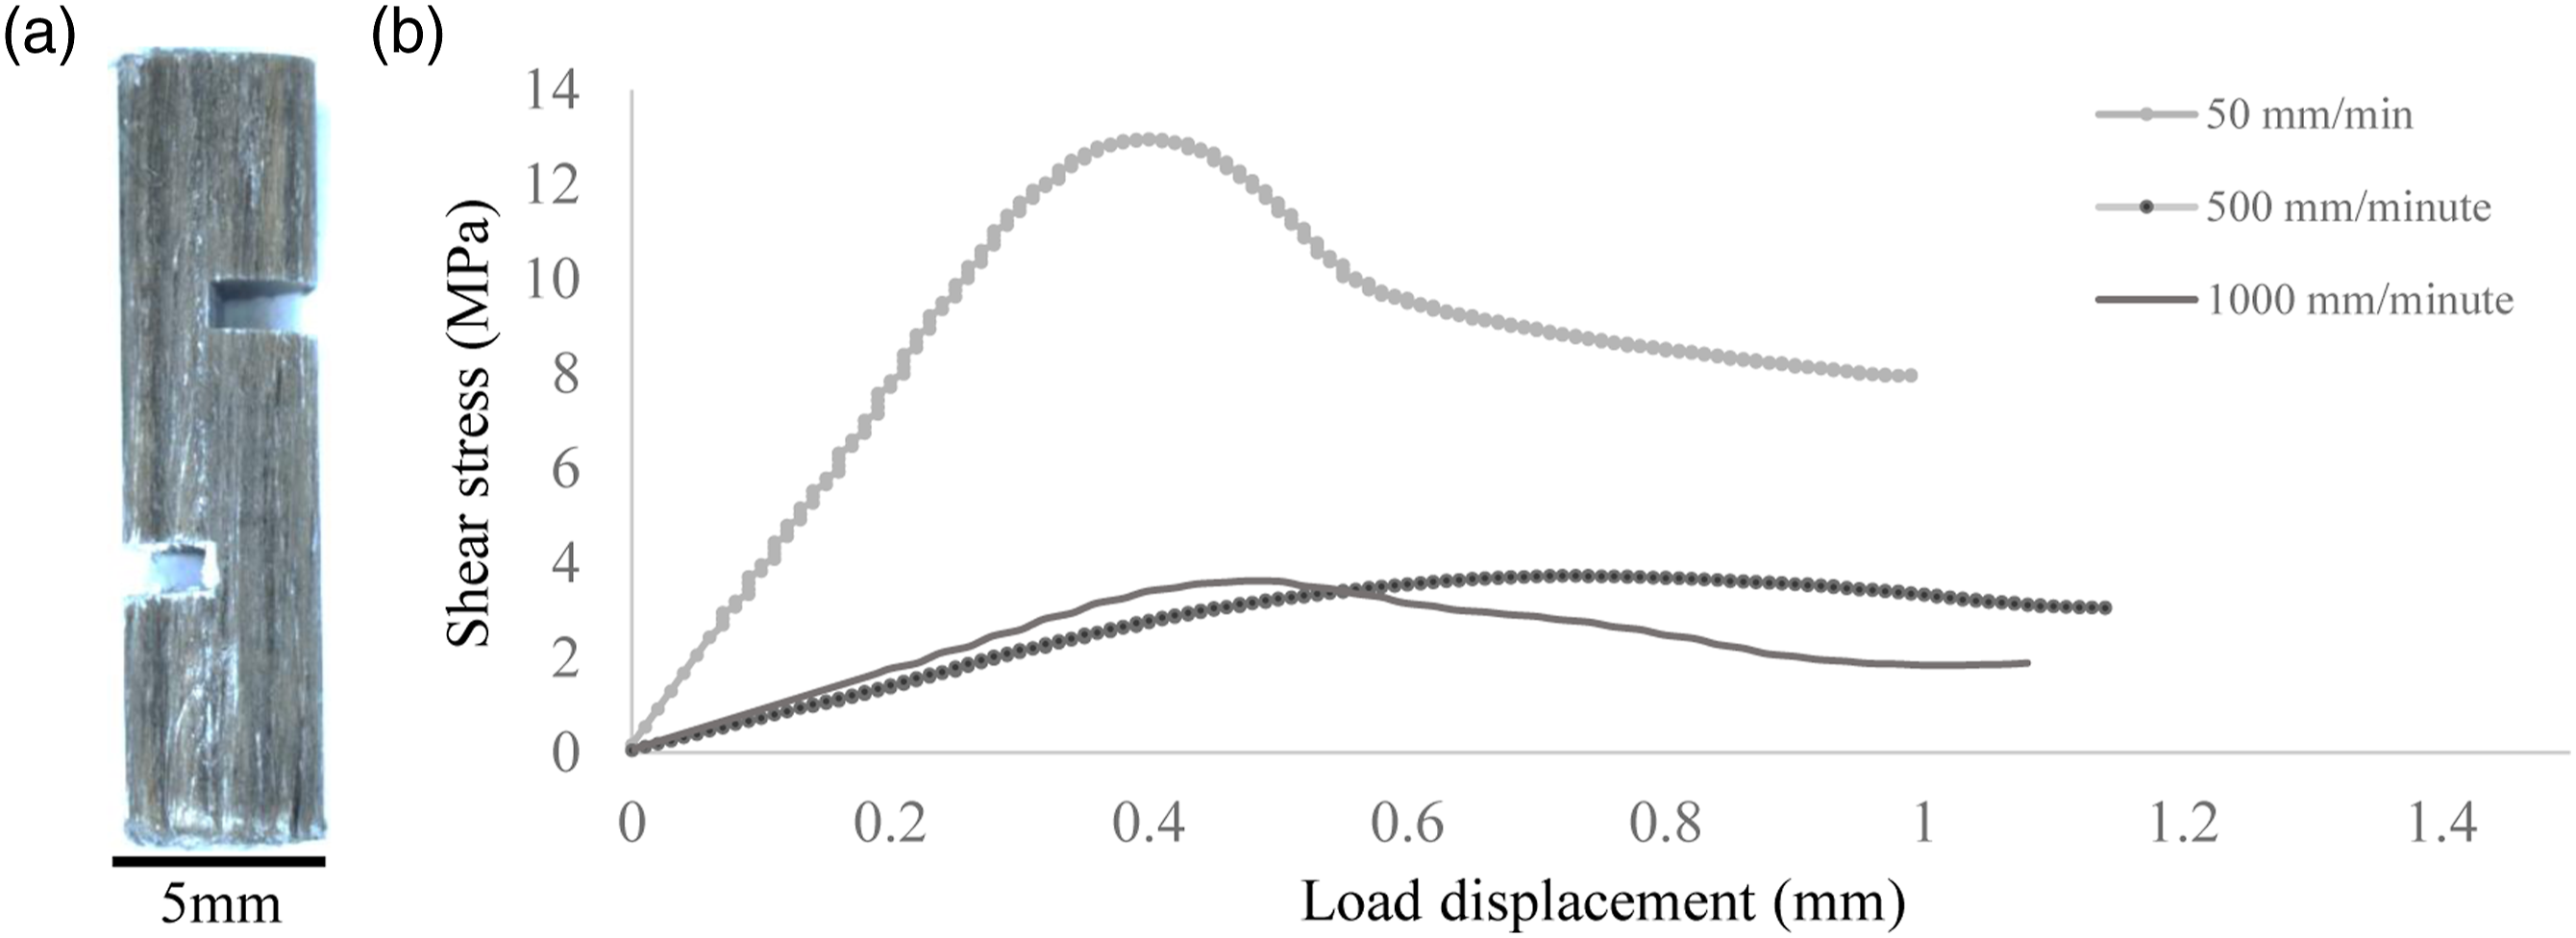
Conclusions
Three different pulling speeds were selected to study the effect of high pulling speeds on the morphologies of pultrudates in a TPC pultrusion process. To ensure consistency in the thermal conditions at different pulling speeds, the dies’ temperatures were adjusted to obtain similar pultrusion thermal conditions at every pulling speed. The cross-section morphology characterization showed well-distributed reinforcement fibers for the low pulling speed experiment of 50 mm/min. On the contrary, the pultrudates that were produced at high pulling speed had compacted and clustered flax yarns, which resulted in polymer rich areas and more voids. Also, during Flax-500 and Flax-1000 experiments and when the polymer fibers melted, the melted polymer was not able impregnate the reinforcement fibers since they were more compacted when compared to Flax-50. It is important to note that the pulling forces during Flax-500 and Flax-1000 experiments were significantly higher than Flax-50. At every speed, the measured pulling forces were higher than the computed value. The significantly higher actual pultrusion force at every speed is an indication that the model cannot capture all phenomena occurring during pultrusion; it is also indicative that more realistic modeling approaches must be developed. The microscopic images showed well distrusted yarns for pultrudates produced at 50 mm/min. While at higher pulling speeds, reconfiguration of the reinforcement fibers occurred. The pultrudate reconfiguration at higher speed, attributed to delayed melting of PP fibers in underfilled dies, is deemed responsible for the loss in impregnation. The reconfiguration was confirmed by mechanical property characterization. Tensile properties deteriorated when a faster pulling speed was used. The highest tensile strength achieved was 233.4 ± 1.5 MPa at 50 mm/min and dropped by around 20% when the pulling speed was raised to 1000 mm/min. The shear strength also dropped by 75% when the pulling speed was raised from 50 to 1000 mm/min. Future work should find mitigation strategies to counter the reconfiguration mechanism. For example, the use of the interlacing technique could be investigated. Also, using low-angle Flax/PP braids might help secure the position of the flax yarns in the pultrudate, while still allowing fiber separation in LFT pellets when they are being processed during injection molding.
Footnotes
Acknowledgements
The authors would like to thank Danielle Szydlowski for her experimental help. We would like also to thank Bombardier Aerospace, Pultrusion Technique.
Declaration of conflicting interests
The author(s) declared no potential conflicts of interest with respect to the research, authorship, and/or publication of this article.
Funding
The author(s) disclosed receipt of the following financial support for the research, authorship, and/or publication of this article: This work was supported by the Saudi Arabia’s Saline Water Conversion Corporation and Ministry of Education (KSP12014087), NSERC (CRDPJ488387-15) and Prima Quebec (R10-009).
Data availability statement
The raw/processed data required to reproduce these findings cannot be shared at this time due to technical or time limitations