
Abstract
Films based on starch (ST) have been widely used for food packaging; however, it is necessary to improve their mechanical properties. In this context, eco-friendly starch films incorporated with cellulose nanocrystal (CNC) were prepared using the casting method. CNCs were isolated using acid hydrolysis from rice straw (RS) as raw material and characterized by FESEM, TEM, FIIR, XRD, TGA and zeta potential analyzer. The isolated CNC presented a rod-like structure, high crystallinity (75%) with a diameter of around 12 nm. Subsequently, the starch-based films reinforced with various concentrations of CNC (2, 5, 10, and 15 wt%) were characterized for their morphological features, mechanical, barrier, and thermal properties and compared with control film. It was shown that the addition of CNCs to the film improved the mechanical properties and decreased the water vapor permeability, as important characteristics in food packaging materials.
1. Introduction
The common materials for food packaging are synthetic polymers from petroleum source, while the use of these polymers gives rise to environmental problems due to their non-biodegradability. In recent decades, many efforts have been made to use biopolymers for the production of packaging materials owing to their biodegradability, non-toxicity, low cost, sustainability, and non-petroleum based source.1-5 Among the biopolymers, starch is a widely used food packaging material due to its high availability, low cost, rich yield and edibility, along with excellent film-forming properties.6, 7 It is one of the most abundant natural polysaccharides widely available in several natural sources such as corn, potatoes, rice, and wheat, among others, and can be obtained from different leftovers of harvesting and industrial processes.
8
Amylose and amylopectin are the two major components of starch.
9
Amylose is a linear chain of glucose, bonded to each other through
There are several methods to improve the thermal stability and mechanical and barrier properties of starch films, including blending with other synthetic polymers (polyvinylalcohol, polybutylene succinate, and polyester amide), chemical modification of starch (esterification and crosslinking), and incorporation of reinforcing nanofillers into the starch matrix.15,16 As an example of this good compatibility with different biomaterials, Li and coauthors 17 used cellulose nanofibers to improve the mechanical and thermal properties of starch film. Their results showed that the hydrophilicity of starch film was reduced. 17 Mittal et al. 18 investigated the effect of the addition of cellulosic material into poly (vinyl alcohol)-starch film. They found that mechanical and barrier properties and the biodegradation rate of the composite films were improved. Cellulose nanocrystals (CNCs) obtained from renewable resources may be a promising alternative to improve the mechanical and thermal properties and decrease the permeability of starch films while preserving the biodegradability.19,20 Noshirvani et al. 21 reported that the incorporation of cellulose nanocrystals improved the mechanical and barrier properties of starch-polyvinyl alcohol nanocomposite films. Similarly, Coelho et al. 22 studied the effect of CNCs, isolated from grape pomace, on the starch composite, and the results showed that the addition of CNC to thermoplastic starch improved the mechanical properties and decreased water vapor permeability. In another research, composite films were produced using TPS reinforced with cellulose nanofibers. 23 The results indicated that the mechanical properties were improved when cellulose nanofibers were added in the TPS matrix. Thus, the incorporation of CNC into ST films may result in an eco-friendly nanocomposite with excellent mechanical and water barrier properties due to strong hydrogen bonding interactions between the CNC and ST. 24 Cellulose is one of the most abundant biopolymer resources composed of linear homopolysaccharides with repeating units of β-1,4-D-glucose. 25 It is found in plant cell walls in the form of microfibrils consisting of crystalline and amorphous domains such as pectin, lignin, and hemicellulose. 26 The application of cellulose as reinforcement material in starch composites has attracted much attention due to the chemical similarity between cellulose and starch, which can lead to good interfacial adhesion of matrix cellulose. 27 Recently, the application of cellulose fibrils as reinforcement in starch-based films appears to be of particular interest due to its large aspect ratio, high modulus, renewable sources, low density, biodegradability, and low cost.28,29
The amorphous domains of cellulose can be removed during the manufacturing processes of CNCs by various methods, including acid hydrolysis, mechanical refining, chemical treatment, enzymatic hydrolysis, and combined processes.30,31 Among all, acid hydrolysis is a well-known approach for preparing CNCs from native celluloses, which have an orderly and dense crystalline structure. 32 CNCs are composed of rod-like particles with a large specific area and high aspect ratios with average diameter and length ranging from 4–25 nm and 100–1000 nm, respectively.33,34 Various types of CNCs can be produced from wood, bamboo, cotton, sugarcane bagasse, wheat straw, and waste mango wood scrap. 35 Rice straw (RS) is an agricultural waste with enormous potential for use as a renewable cellulosic resource. It is mainly consisted of cellulose (40%), hemicellulose (35%), lignin (10%), and silica (5%). 36 Rice is known to be third-most important cereal crop, with a worldwide production of about 800 to 1000 million tons per year, of which about 600–800 million tons are produced in Asia. 37 RS is usually burned, either dumped into rivers or used as animal feed and bedding material. 38 The utilization of RS as an eco-friendly biodegradable composite for food packaging applications is one way to reduce its environmental impacts. So, this study highlights the application of isolated nanocellulose from RS as a potential reinforcement for a starch-based matrix. Although there are many studies about the reinforcement effect of CNC from various agro-wastes on the mechanical properties of starch films, to the best of our knowledge, there are few reports available about the usage of isolated CNC from RS as potential filler for starch-based films.
In the present work, CNC was isolated from RS using the combined acid hydrolysis and ultrasonic method. The obtained CNC was characterized in terms of its chemical and physical properties, and its potential use in the preparation of nanocomposites as a reinforcement agent was examined. The TPS was used as a matrix biopolymer and CNC was adopted as a nanoreinforcing filler of TPS/CNC nanocomposite. Various compositions of TPS and CNC were made and their properties were investigated using ultraviolet-visible spectrometry (UV), Fourier transform infrared spectroscopy (FTIR), scanning electron microscope (SEM), X-ray diffraction (XRD), thermogravimetric (TGA), and water absorption testing. The mechanical and physical properties of the nanocomposites were analyzed by determining the tensile strength, Young’s modulus and elongation at break.
2. Materials and methods
2.1 Materials
The rice straw was collected as an agro-waste from a local farm (Mazandaran, Iran) and used as feedstock for the isolation of CNC. The straws were chopped into small pieces with a length of 3–5 cm, washed thoroughly to remove dust, and subsequently, oven-dried at 50°C for 24 h. The dried samples were ground to fine size and sieved to a particle size of 425–850
For the preparation of TPS, potato starch and glycerol were obtained from Merck (Darmstadt, Germany). For CNC isolation, sodium hydroxide, sulfuric acid (97.0%) and glacial acetic acid (99.9%) were purchased from Merck (Darmstadt, Germany), and sodium chlorite (80%) was obtained from Sigma-Aldrich Co. (St Louis, MO, USA). All chemicals were analytical grade and used directly without any further purification.
2.2 Isolation of CNC from rice straw
The CNC was isolated from RS according to the methodology reported by Perumal et al.
39
Initially, RS powder was alkali treated using a 4 wt% sodium hydroxide solution for 3 h under continuous stirring at 80°C (this treatment was repeated twice). After that, the sample was filtered, and the residue was washed with distilled water several times until the residues were neutralized. The alkali-treated fiber then was bleached using a mixture of equal parts of acetate buffer solution, sodium chlorite (1.7% w/v), and water at 80°C for 4 h. The bleaching step was conducted repeatedly three times until the color of sample completely turned white. It was then filtered and washed with distilled water several times to become neutralized. The bleached fiber was subjected to acid hydrolysis using 65 wt% H2SO4 at 55 °C, under constant stirring for 45 min, in the solid loading of 6 g bleached sample:100 mL acid solution. The hydrolysis process was stopped by dilution with ice. The recovered mixture was then centrifuged at 10,000 r/min for 10 min to concentrate cellulose material and to remove the excess sulfuric acid. The coagulated CNC suspension was then dialyzed against distillate water using dialysis membranes (Sigma-Aldrich-D9402-100FT) until a neutral pH was reached. Subsequently, the suspension was sonicated using an ultrasound probe (Sonics VibraCell Ultrasonic) set at 400 W for 15 min. The main preparation procedure is depicted in Figure 1. The use of an ice bath was necessary to avoid overheating. Finally, the collected CNC suspension was freeze-dried and stored for characterization analyses. The yield of nanocellulose isolation, Y was calculated using the following equation Schematic illustration for isolation process of CNC from rice straw.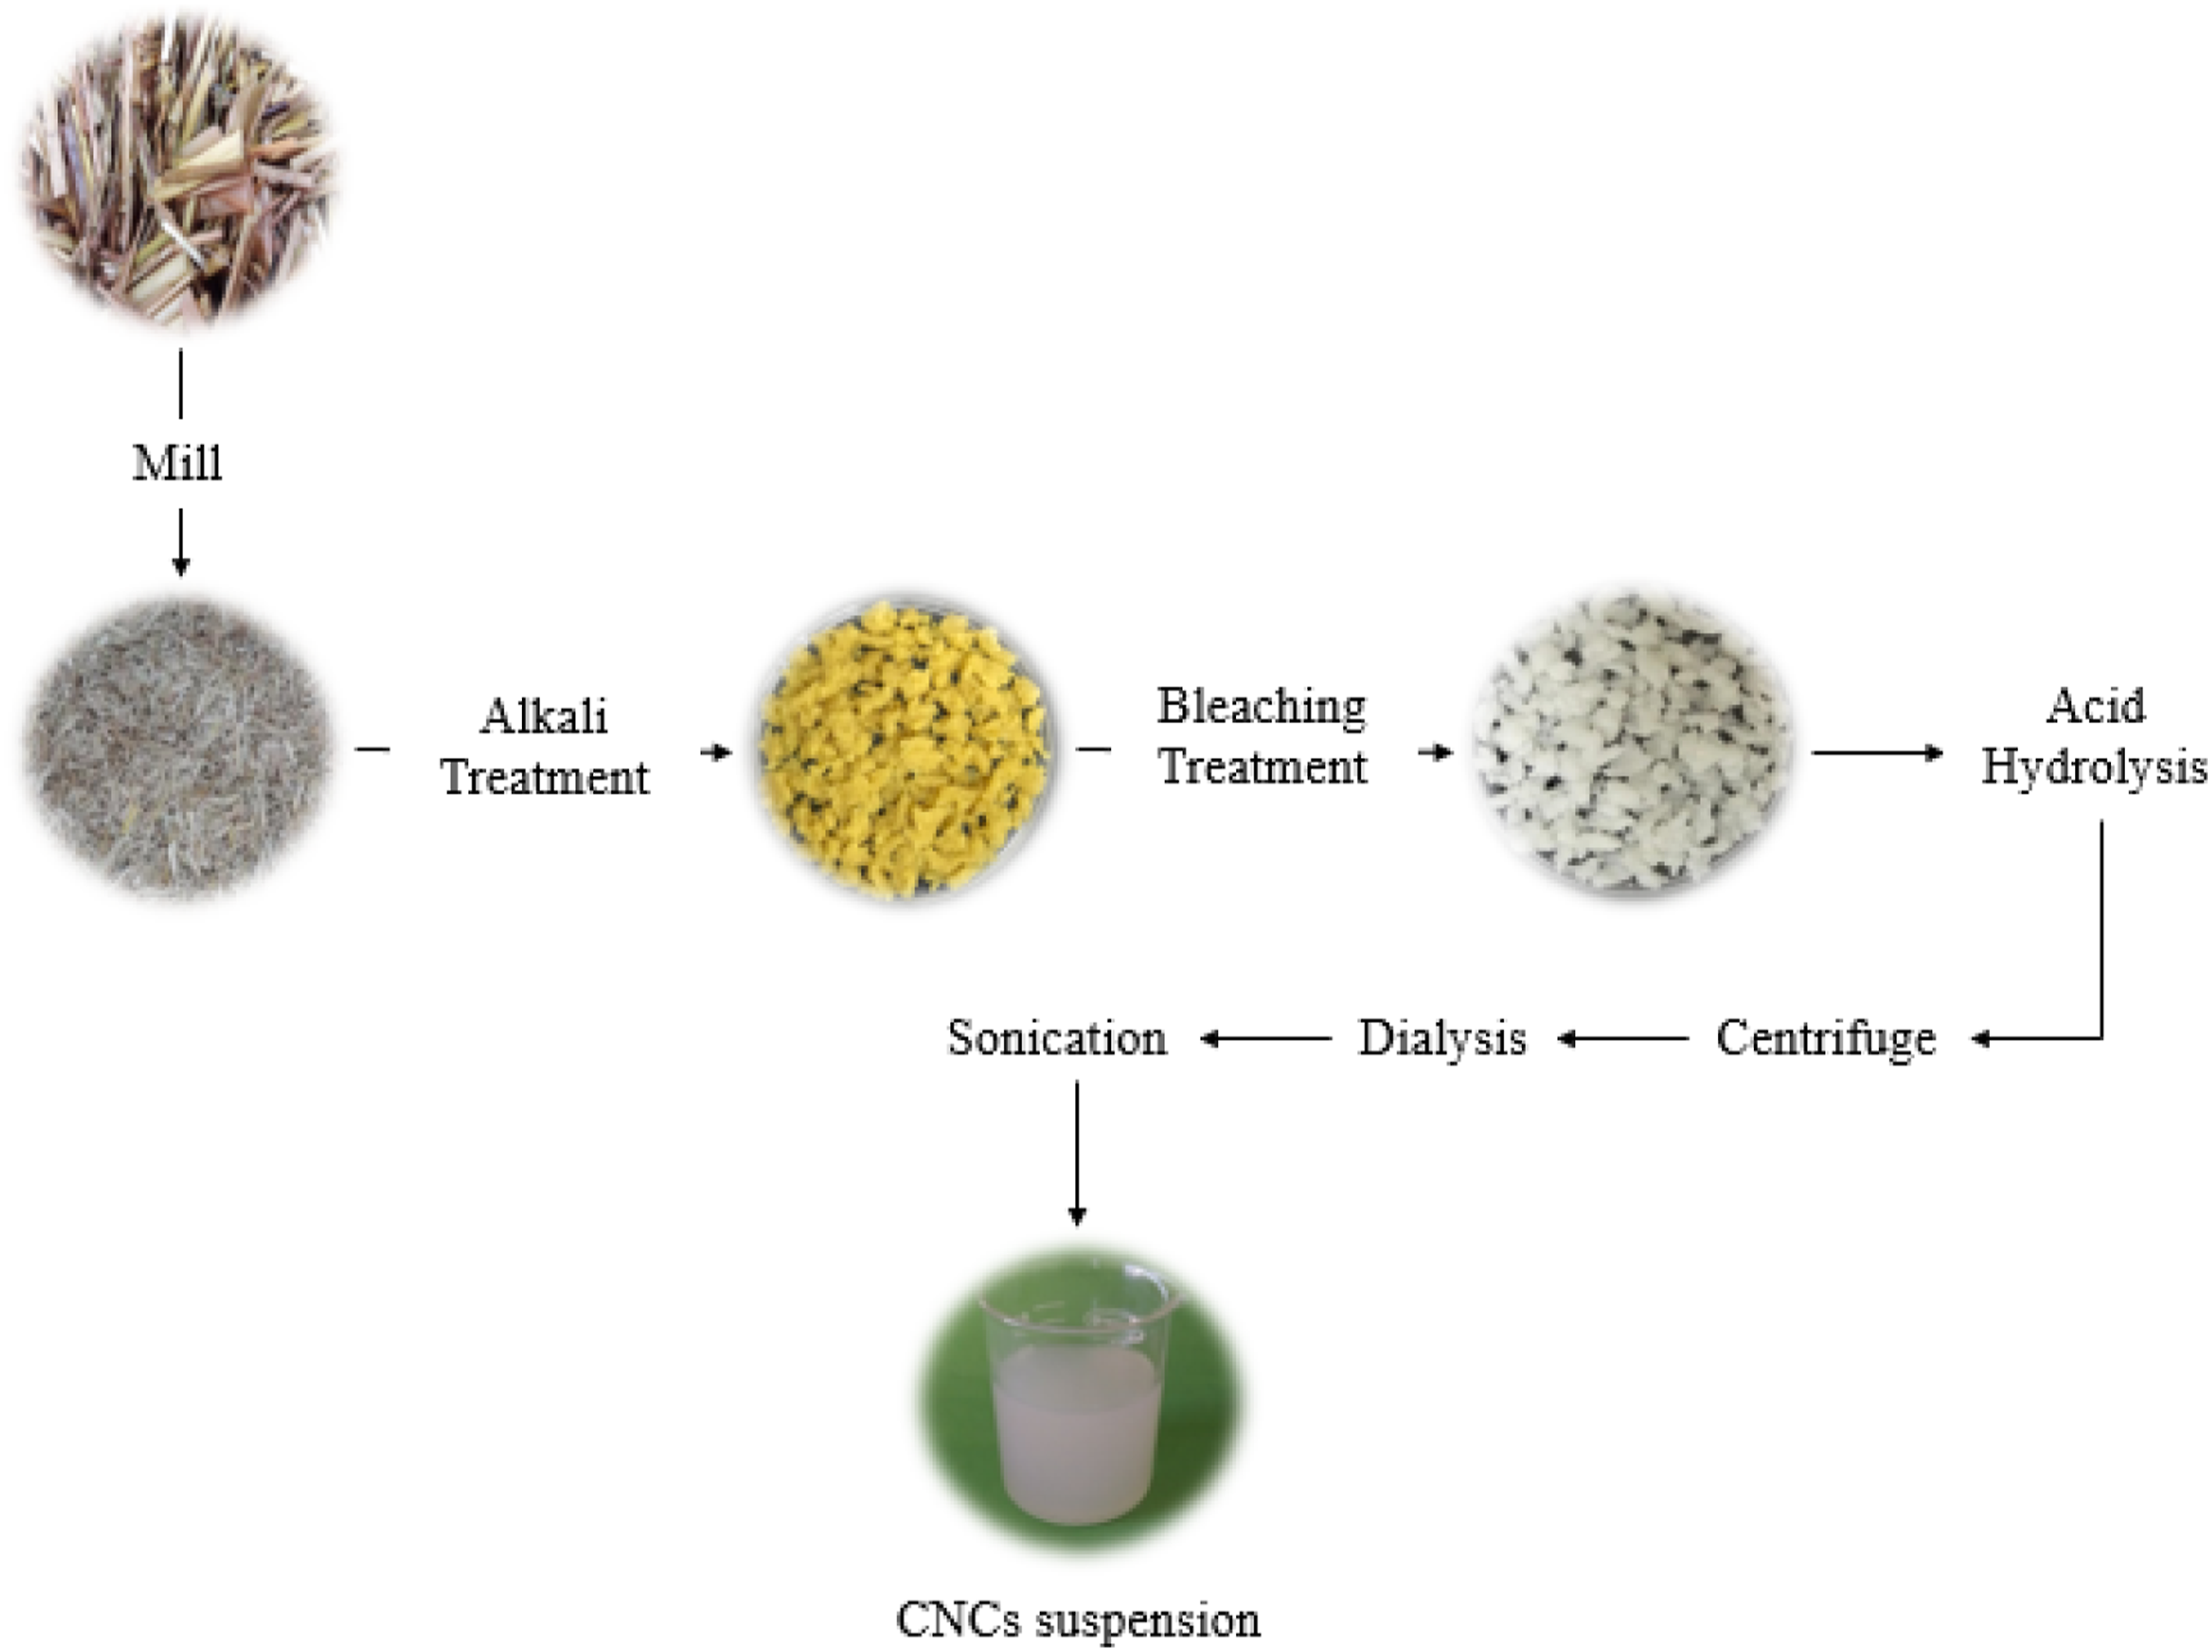
2.3 Preparation of the neat TPS and TPS/CNC nanocomposite films
The TPS film and TPS/CNC composite films were manufactured using the solution casting method that was reported by Montero et al.
40
For TPS film (control film), the base solution was prepared by dispersing 3 g of starch into 100 mL of distilled water with vigorous mixing and heating at 90°C for 30 min. For the preparation of TPS/CNC composite films, the desired amount of CNCs was firstly subjected to ultrasonic (Model T18, IKA Group, Staufen, Germany) treatment in an ice bath for 15 min. After that, CNCs were used at different 2, 5, 10, and 15% (w/w, dry basis) to develop TPS/CNC composite films. The suspension of CNC was added to the starch-water mixture and mixed with constant stirring at 400 r/min for 30 min at a temperature of 90°C. Subsequently, the mixture was sonicated using a high-intensity ultrasonic processor for 15 min. Then, 0.9 g of glycerol (30 wt% of starch) was added as a plasticizer and the resulting mixture was treated with ultrasonic homogenizer for 15 min. The film-forming solution was degassed under a vacuum to remove bubbles in the solution. Finally, all the film-forming solutions (with a constant amount) were cast in round Teflon plates and dried at 50°C in an oven. The film samples were labelled as TPS/CNC2, TPS/CNC5, TPS/CNC10, and TPS/CNC15, corresponding to the weight percentage of CNC used for their preparation. The steps for film-forming solution development are represented in Figure 2. Schematic diagram representing the preparation of TPS/CNC nanocomposite films.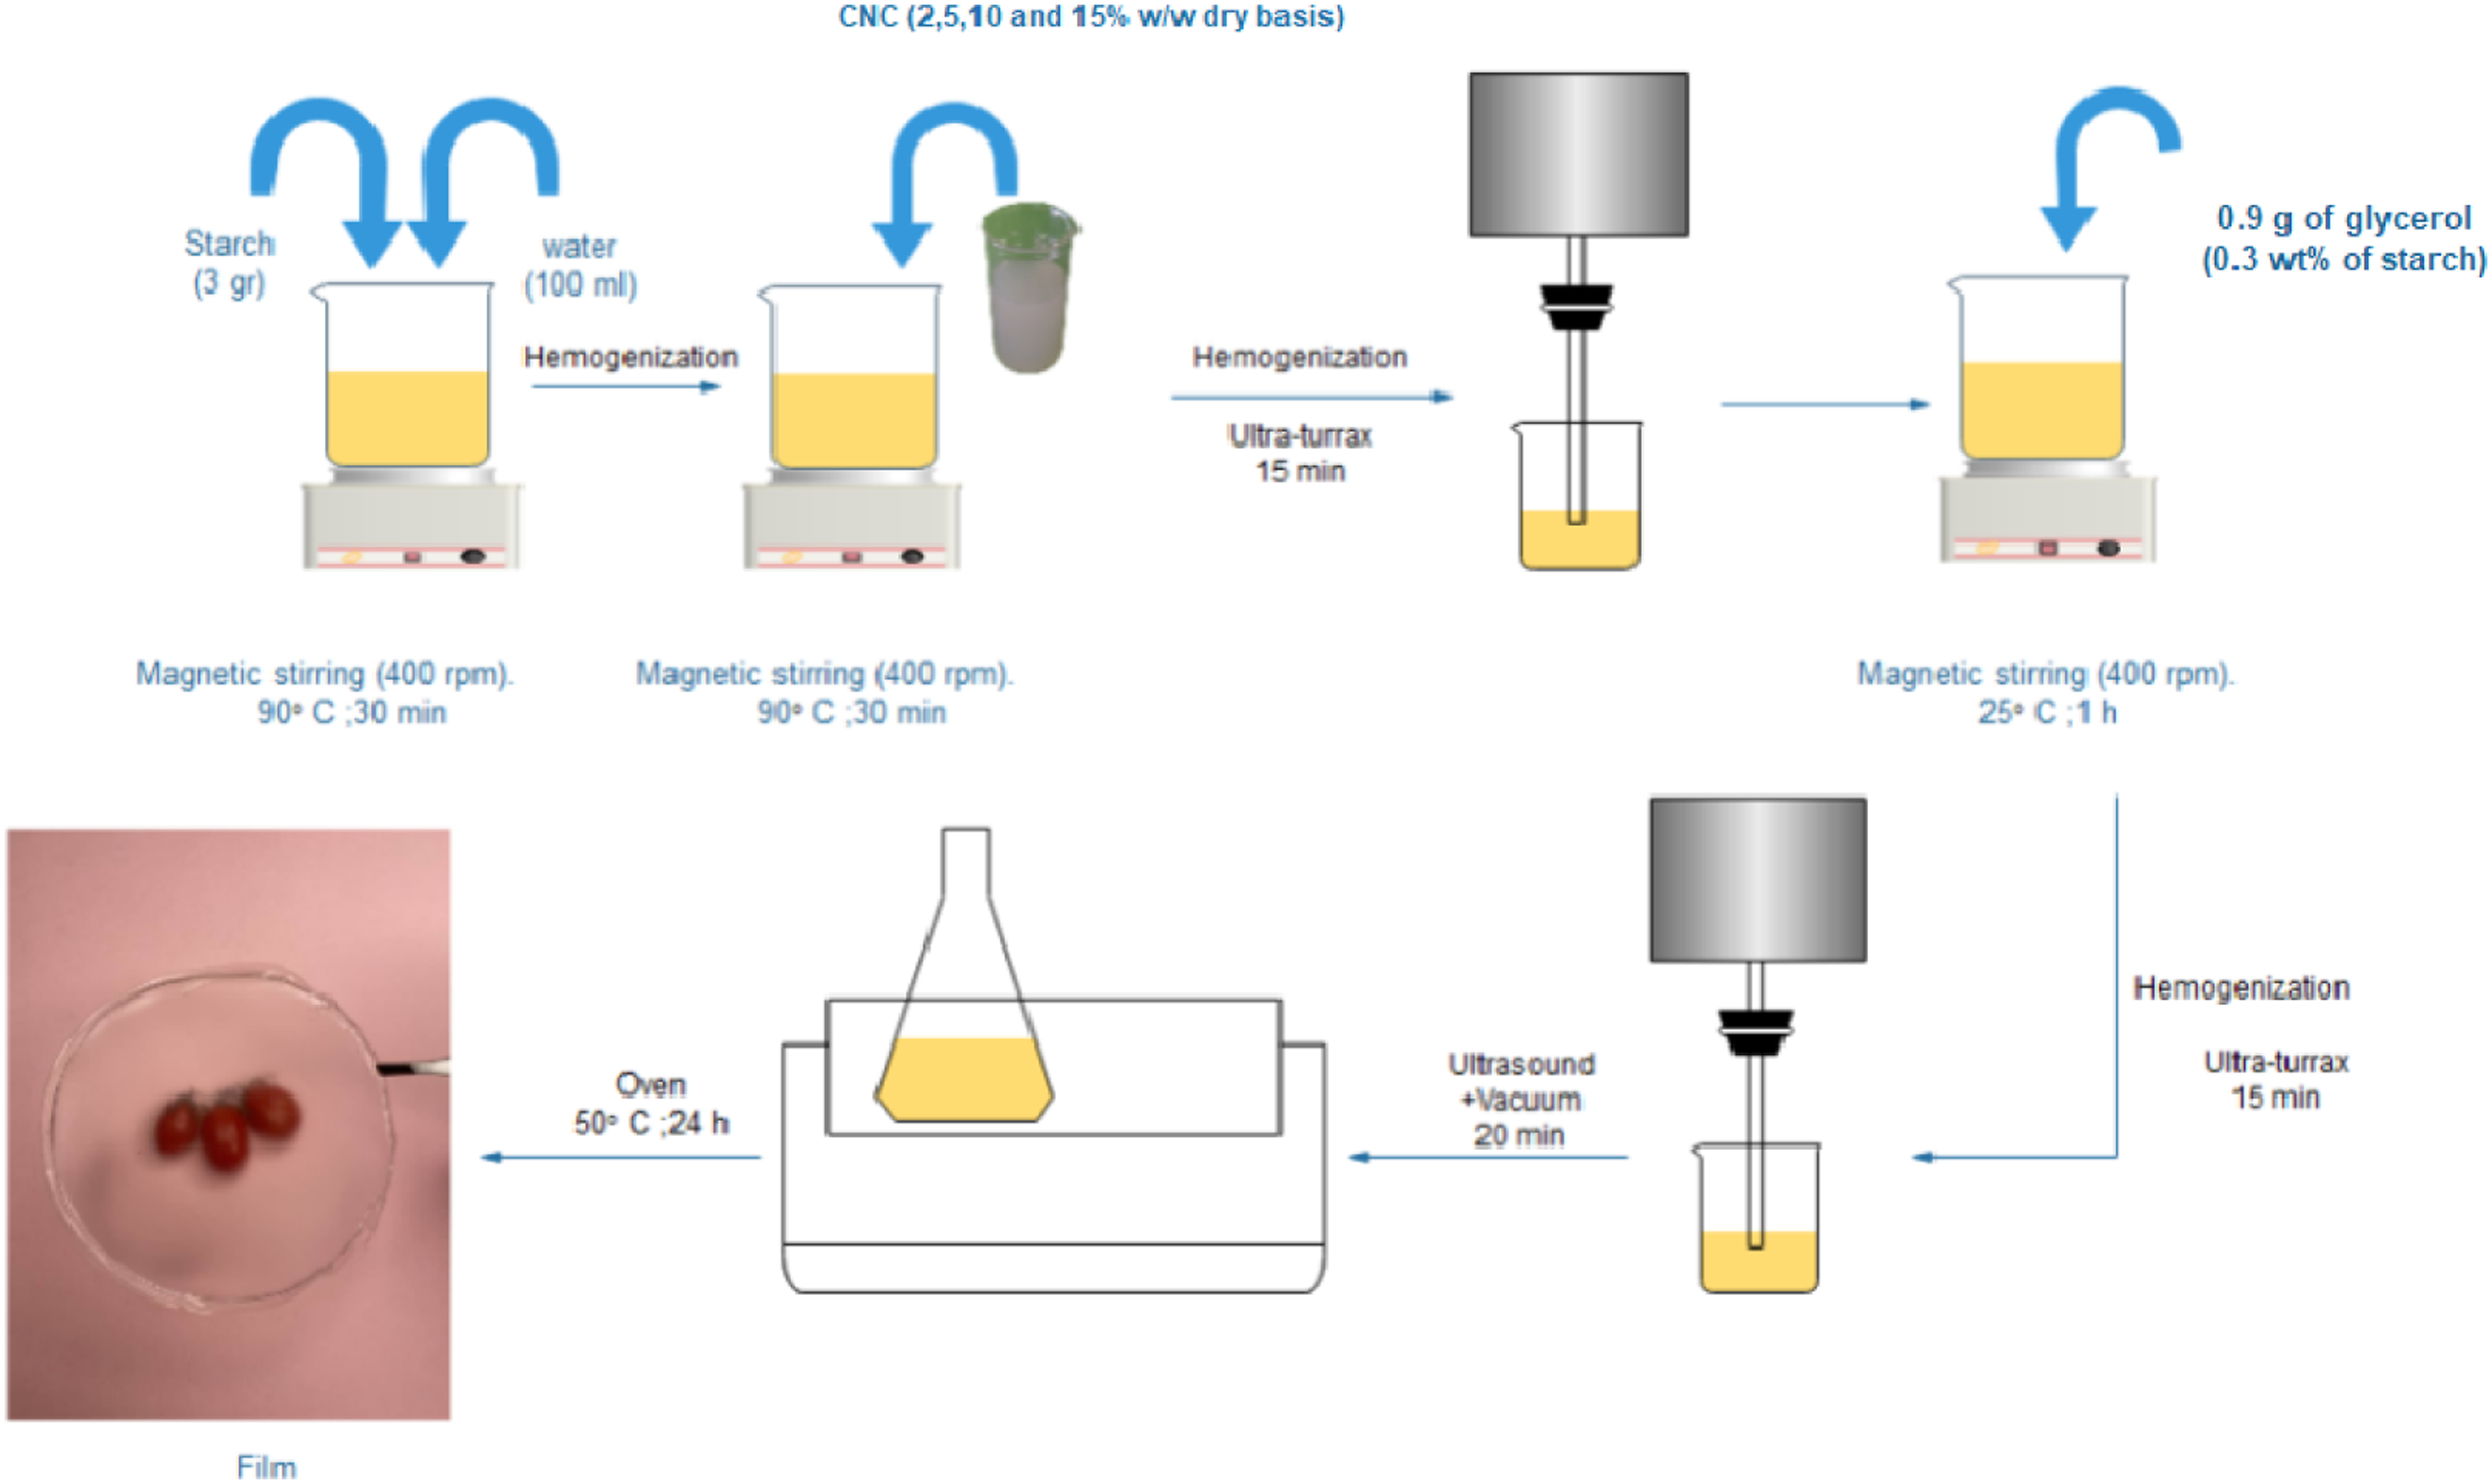
2.4 Characterization of raw RS, treated RS and CNC
2.4.1 Scanning electron microscope (FESEM)
The morphologies of the samples after each pretreatment step were analyzed by a Field Emission Scanning Electron Microscope (TESCAN, Republic Czech, EU) with an accelerating voltage ranging from 1 kV to 30 kV.
2.4.2 Transmission electron microscopy (TEM)
The morphology of isolated CNC was analyzed using a transmission electron microscope (TEM) (JOEL Inc., Tokyo, Japan) with an accelerating voltage of 200 kV. A highly diluted (0.001%, w/v) CNC suspension was placed for 15 min in an ultrasonic disperser. Thereafter, a drop of the suspension was deposited on a Cu grid covered with a thin carbon film, and then dried at room temperature for 24 h. The sample was negatively stained with 2 wt% aqueous uranyl acetate solution to enhance the contrast of the image. The length and diameter of CNC were measured from the TEM images using an image analysis system (TDY-V5.2, Beijing Tianhong Precision Instrument Technology Co. Ltd, China). To determine the mean length and diameter of CNC, the size of at least 50 nanocrystals was analyzed.
2.4.2 Zeta potential
The zeta potential of CNC was measured using a Zeta sizer-NanoZS100 analyzer (Malvern Instruments, Worcestershire, UK) at 25 and 90° angles. The CNC suspensions were diluted to a concentration of 0.01 wt% with deionized water. Prior to analysis, the diluted suspensions were sonicated for 10 min, and the measurements were conducted in triplicate.
2.4.3 Fourier transform infrared (FTIR)
The functional groups of all samples were monitored using an FTIR spectrometer (Agilent Technologies Inc., Palo Alto, CA, USA). The pellets were prepared from powder samples using a KBr method. The spectra were recorded in the infrared range of 500–4000 cm−1.
2.4.4 X-ray diffraction (XRD)
The X-ray diffraction pattern of the samples was measured using an X-ray diffractometer (D/MAX 2550PC, Japan) with a Cu
2.4.5 Thermogravimetric analysis (TGA)
The thermal property of the samples was evaluated by TGA-2000 automatic analyzer (Navas Instruments, South Carolina, USA). Each sample was placed on the balance system and heated at a range of 30–700°C with a heating rate of 10 °C/min under a nitrogen atmosphere.
2.5 Characterization of TPS and TPS/CNC nanocomposite films
2.5.1 Thickness
Film thickness was measured by a digital micrometer (±0.001 mm, Mitutoyo, Japan). The measurements were taken at five random positions around each film, and the average value was used for water vapor permeability determinations and mechanical properties calculations.
2.5.2 Moisture content (MC)
A sample of 20 mm × 20 mm film was initially weighed (w1) before being placed in an air-circulating oven at 105°C for 24 h. The mass of the film after drying was again weighed (w2). The moisture content of the film was calculated using equation (3)

2.5.3 Water solubility (WS)
The film was cut into a square shape (30 mm × 10 mm) and oven-dried at 105°C for 24 h. Then, the sample mass (w0) was recorded using an analytical balance. After that, the sample was immersed in 50 mL of distilled water, and shaken for 24 h at 25°C. Finally, the undissolved part of the sample was removed and dried in the oven at 105°C for 24 h. The weight of the resultant dried sample was measured and recorded as (wf). The water solubility (WS) of the films was determined using equation (4)

2.5.4 X-ray diffraction (XRD)
X-Ray analysis was performed as described previously (in Sec. 2.4.4) to determine the crystalline structure of the nanocomposites and their phase. The patterns were detected at ambient temperature in the angular region of 2θ from 10° to 50° with a step time of 4 s and an angular increment of 0.005°.
2.5.5 Fourier transform infrared (FTIR)
The chemical structure of prepared nanocomposite films was analyzed by similar method that described in previous section (Sec. 2.4.3), in the range of 400 cm−1 to 4000 cm−1. The preparation of the samples was done by KBr method.
2.5.6 Scanning electron microscopy (SEM)
The influence of CNC incorporation in the TPS film was evaluated in relation to surface morphology using a scanning electron microscope (VEGA 3, Tescan, Czech Republic) with an acceleration voltage of 20 kV under vacuum conditions. A thin layer of gold was coated on the specimens prior to the test.
2.5.7 Color and opacity
The color parameters of the films were measured using a digital colorimeter model Chroma Meter CM-5 (Konica Minolta, Tokyo, Japan). The instrument was calibrated using black, and the colorimetric parameters were measured. All of the values were the averages of 10 measurements on different sections of each film. The total color difference (ΔE) was calculated with the following equation

The films’ opacity was determined by measuring their light absorption at a selected wavelength using a UV-Vis spectrophotometer (Perkin-Elmer, LAMBDA 365, USA). The samples were cut for obtaining a rectangle piece and directly placed perpendicular in a glass cuvette. The absorbance value was recorded at a wavelength of 600 nm. The opacity of the films was calculated by the following equation

2.5.8 Mechanical properties
The mechanical properties, including tensile strength (TS), modulus of elasticity (EM), and percentage of elongation at break (E) were determined using an Instron 3365 universal testing machine (High Wycombe, England), equipped with a load cell of 500 N, according to the ASTM D882-18 (2010) method. The tests were carried out with a crosshead speed of 2 mm/min at 25°C and 68% relative humidity (RH). The dimensions of the film sample were 1 cm× 1 cm in a rectangular strip shape. Five specimens were tested for each sample and their average value was reported.
2.5.9 Water vapor permeability (WVP)
The WVP of the prepared films was gravimetrically measured based on the ASTM E96–95 method, with little modifications as reported by Ilyas et al.
44
The sample was sealed over the circular mouth of a permeation cell (diameter 30 mm) containing distilled water (100% RH; vapor pressure of 2337 Pa at 25°C). All of the cells were placed into a desiccator, containing silica gel at 25°C and 0% RH (0 Pa water vapor pressure). The weight of each covered cell was regularly recorded during 8 h. The amount of transferred water through the film was measured from the weight loss of the permeation cell. The water vapor transmission rate (WVTR) of the samples was obtained from the slope of the plot of the cell’s weight versus time and the WVP was determined according to equation (7)

2.5.10 Contact angle (CA)
The contact angle on the film surface was measured using a digital optical goniometer DSA 100 (KRUSS GmbH, Germany) by the sessile drop method. 45 Each measurement was taken within 10 s with a 500 μL syringe and 0.75 mm diameter needle. At least 10 measurements were taken for each sample at ±25°C.
2.5.11 Thermogravimetric analysis (TGA)
The thermal stability of TPS and TPS/CNC nanocomposites was evaluated by TGA analysis using a TGA-2000 automatic analyzer (Navas Instruments, South Carolina, USA). Approximately 10–15 mg of samples were heated from 50°C to 600°C at a heating rate of 10 ºC/min under an inert atmosphere with a flow rate of 20 mL/min. The TG curves and their first derivatives, the DTG curves, were recorded in each test.
3. Results and discussion
3.1 Characterization of raw RS, treated RS and CNC
Visually, the raw RS was brown, but after alkaline treatment, its color changed yellow-like. Subsequent bleaching made white fiber (Figure 1). This color changes indicates the level of elimination of lignin from fiber. The yield of CNC isolation was approximately 78.10±1.8%.
3.1.1 Morphological analysis of raw RS, treated RS and CNC
FESEM analysis was used to monitor the morphological changes of RS during the isolation process of CNC. FESEM images of pristine, alkali-treated, and bleached RS are presented in Figures 3(a) to (c). As indicated in Figure 3(a), raw RS has an ordered and homogeneous structure and is clearly composed of individual fibers due to the presence of lignin and hemicelluloses as cementing components around the fiber bundles. The appearance of a rougher surface in the alkali-treated sample may be due to the partial removal of non-cellulosic components from the raw RS (Figure 3(b)). The alkali-treated RS revealed that this process caused partial removal of non-cellulosic binders around the fibers, which caused an opening in the matrix of fibers that will enhance the penetration of the bleaching agents during the subsequent treatment. As observed in Fig. 3(c), bleaching resulted in partial fibrillation and fiber bundles separated into very thin individual fibers with different diameters. The presence of chlorine during the bleaching process leads to lignin oxidization and the formation of hydroxyl, carbonyl and carboxylic groups, which allow lignin solubilization.
46
Similar morphological changes in various lignocellulosic materials were reported in other studies.47,48 To produce CNC, bleached RS was treated with H2SO4, which removes the amorphous regions from the bleached fibers. The size and morphology of CNC isolated from bleached RS were examined using TEM at the nanoscale and shown in Figure 3(d). The isolated CNC have a short, uniform rod-like structure and many agglomerations. The agglomeration occurred due to the strong intermolecular hydrogen bonds between the crystallite sites.
49
In addition, it arises due to evaporation of dispersed medium to dry CNC for TEM observation.
50
Similar results reported for CNCs from different cellulosic wastes50,51 and The average diameter and length of isolated CNC were 12.4 ± 3.1 nm and 159.2± 61.8 nm, respectively, with an aspect ratio (L/D) of 12.8. FESEM micrographs of the (a) raw RS, (b) alkali-treated RS, (c) bleached RS, and (d) TEM images of the CNC.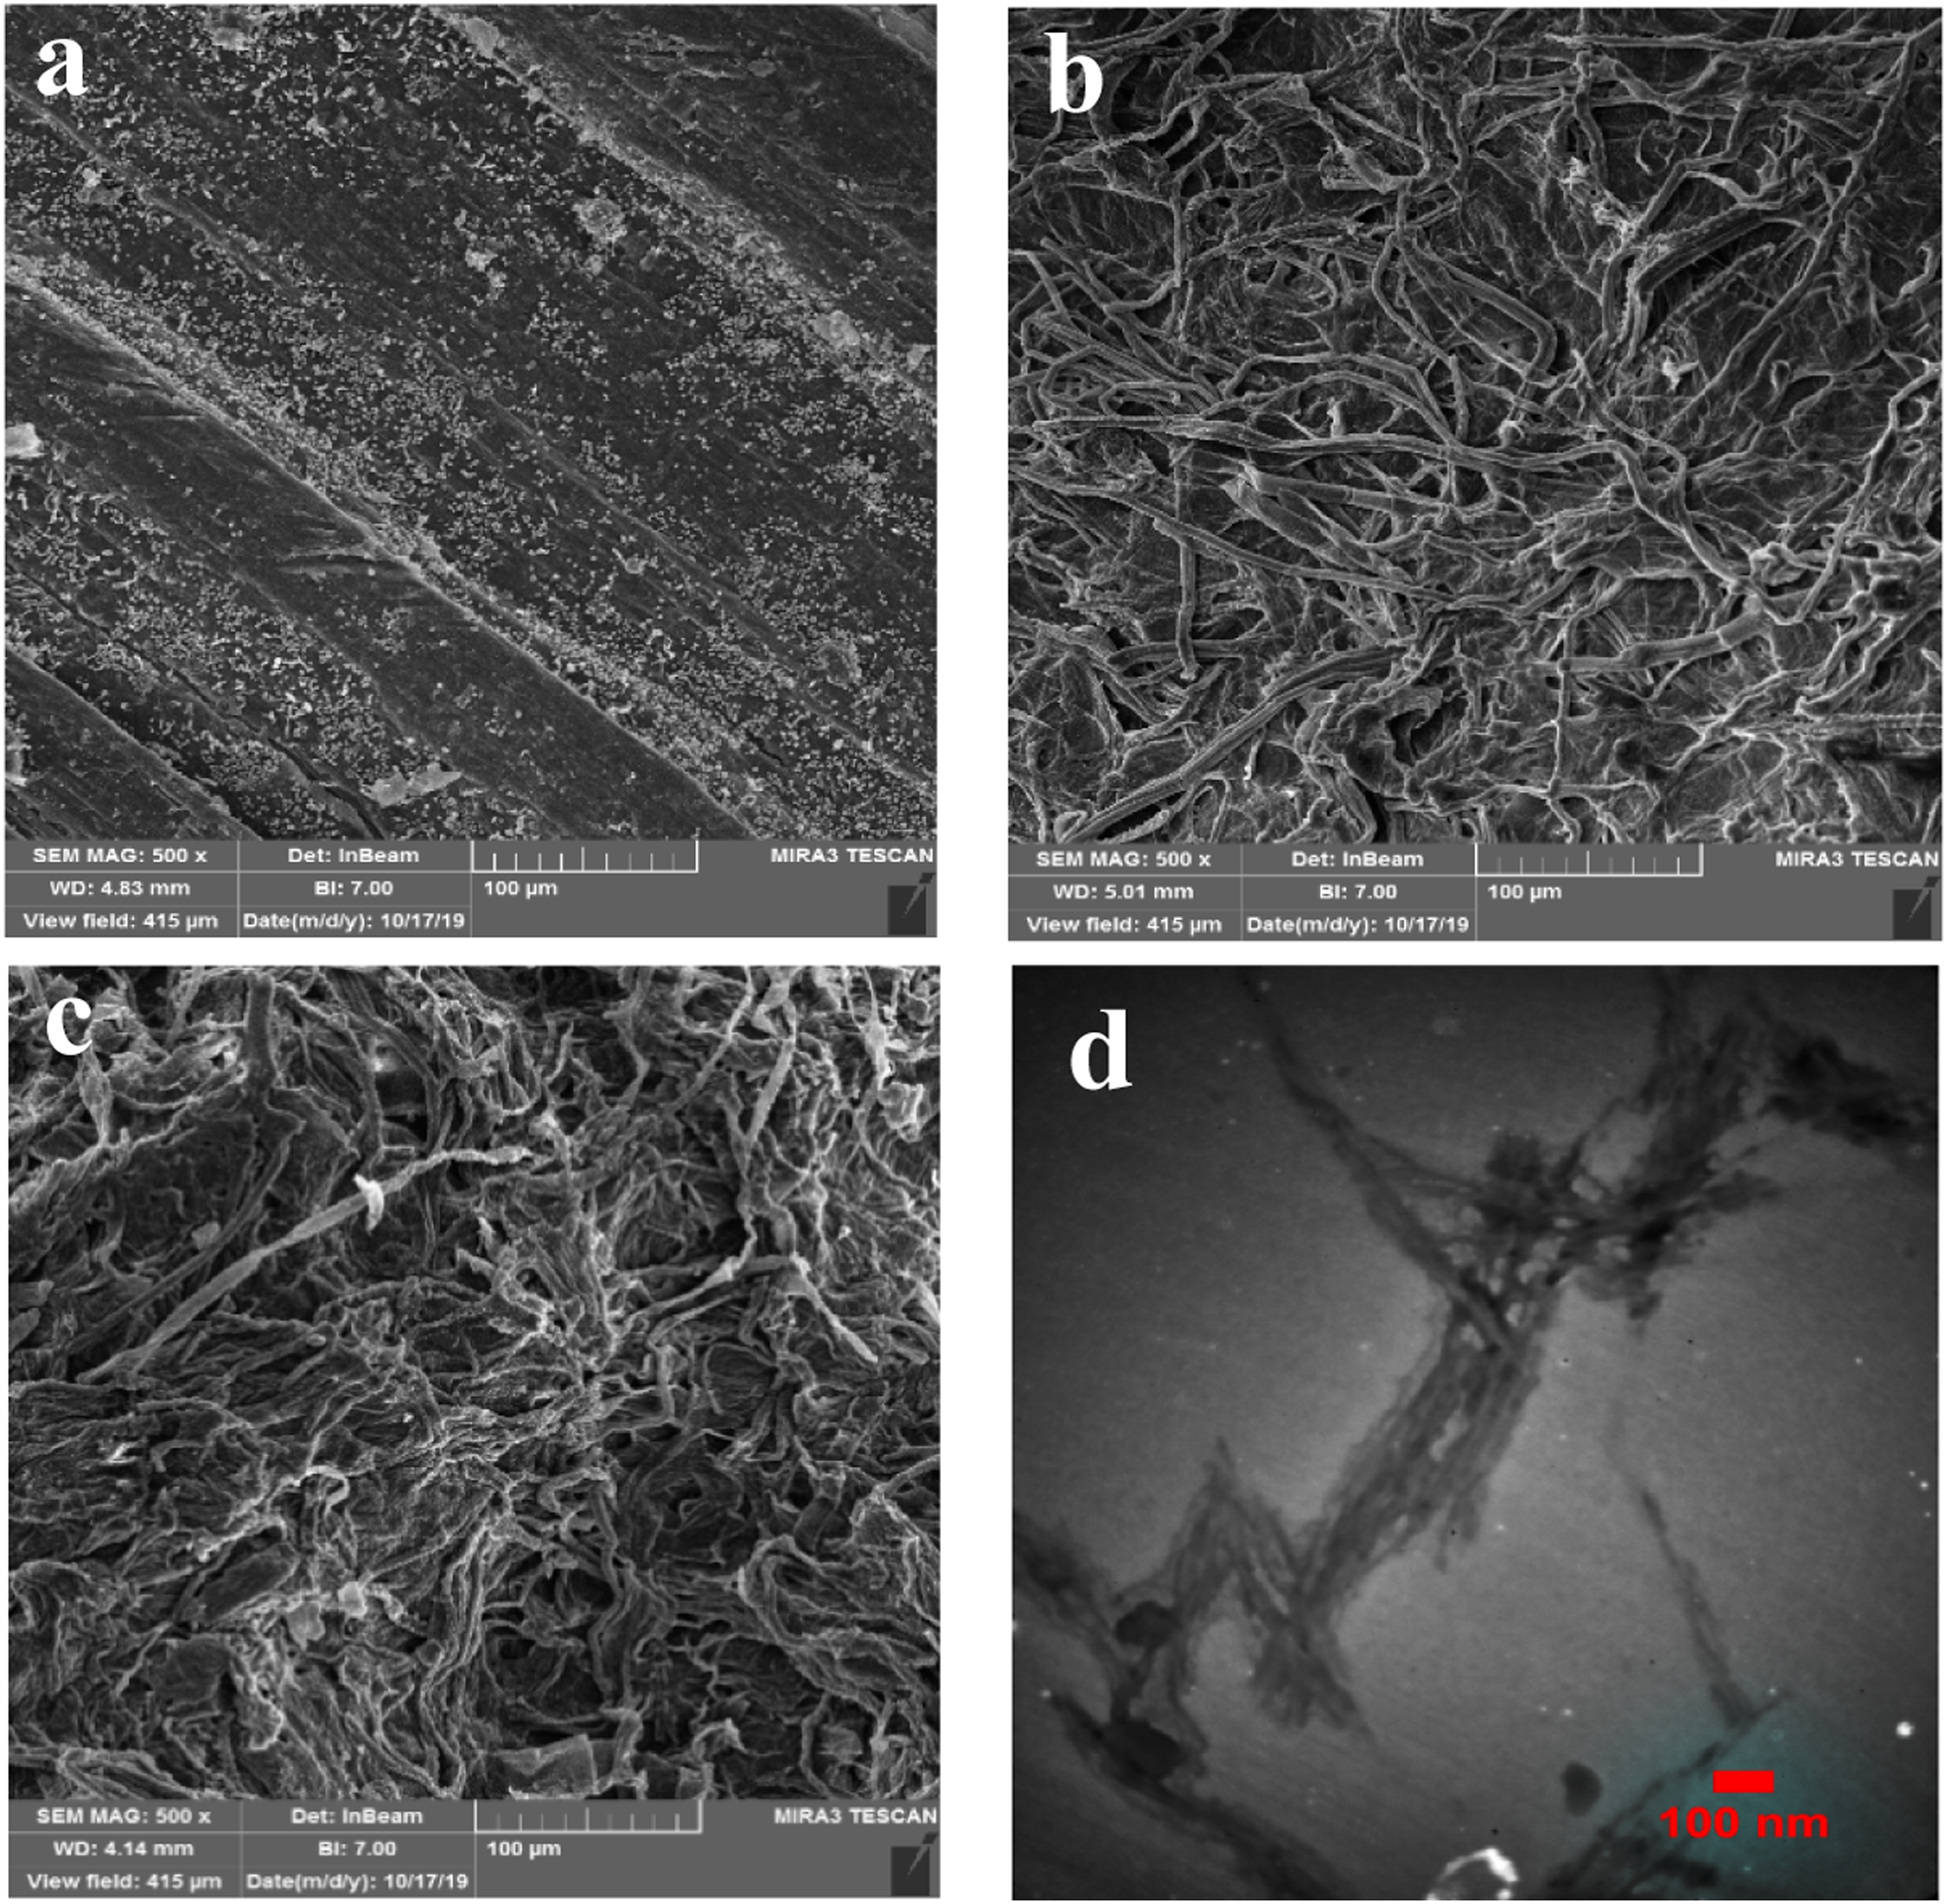
3.1.2 Zeta potential
The stability of CNC suspensions is an important factor in obtaining a desirable dispersion of CNC as filler in the preparation of nanocomposites. The zeta potential value can be considered a suitable indicator for the stability of the CNC suspension that can be measured by DLS analysis. In the present study, the zeta potential of the isolated CNC suspension was a negative value of −32.73 mV, which might be related to the presence of SO3- groups attached to CNC during the acid hydrolysis step. 52 This result confirmed the potentiality of isolated CNC to disperse freely in the aqueous phase.
3.1.3 FTIR analysis
FTIR analysis was used to study the changes that happen in the chemical composition during the different stages of the treatment, starting from raw RS fibers until the production of the CNC. The FTIR spectra of the raw RS, alkali-treated, and bleached RS, and the isolated CNC are represented in Figure 4(a). The peaks at 3660–3000 cm−1 and 1634 cm−1 observed in all spectra are attributed to the O–H stretching vibration and the O–H bending of the adsorbed water, respectively. The C-H stretching vibration was also observed at 2879 cm−1.
53
Additionally, the peak centered at 1155 cm−1 observed in all spectra can be ascribed to C–O–C asymmetric stretching of the cellulose that the intensity of this peak increased after the bleaching step.
54
The absorbance peak around 1428 and 1315 cm−1 are attributed to the presence of cellulose in the studied samples. In addition, the ether linkages of the cellulose or the C-O-C pyranose ring skeletal vibration caused the prominent peak at 1030 cm−1.
55
The intensity of this peak was slowly increased from raw RS to CNC, indicating that the cellulose content was increased during different chemical treatments. In all samples, the observed peak at 899 cm−1 is associated to glucose ring stretching. Other than the aspect, several evident changes can be found in the spectra of bleached and acid hydrolyzed fibers compared to the untreated RS fibers. Other than the aspect, several obvious changes can be found in the spectra of bleached and acid hydrolyzed fibers compared to untreated RS fibers.
56
The band located at 1733 cm−1 in the spectrum of raw RS fibers is attributed to C=O stretching vibration of the carbonyl and acetyl groups in the xylan component of hemicelluloses. This band weakened in the bleached cellulose fibers and the CNC due to the considerable removal of hemicellulose and lignin from RS during alkali treatment and the bleaching process.
44
The removal of silica from the raw RS can also be observed after delignification owing to the disappearance of the peak at 798 cm-1. The Si–O symmetric stretching of silica is observed in this region.
57
Thus, from these findings, it is obvious that the alkali treatment and bleaching process removed hemicellulose and lignin from RS; finally resulted in purified cellulose RS. There are no significant differences in the corresponding spectrum of bleached RS and CNC (hydrolysis results). Results indicated that the characteristics of cellulose molecular structure did not change significantly during the hydrolysis step. This result is consistent with previous studies.49,58 (a) FTIR spectra of the raw RS, alkali-treated RS, bleached RS, and CNC; (b) XRD pattern of the raw RS, bleached RS, and CNC.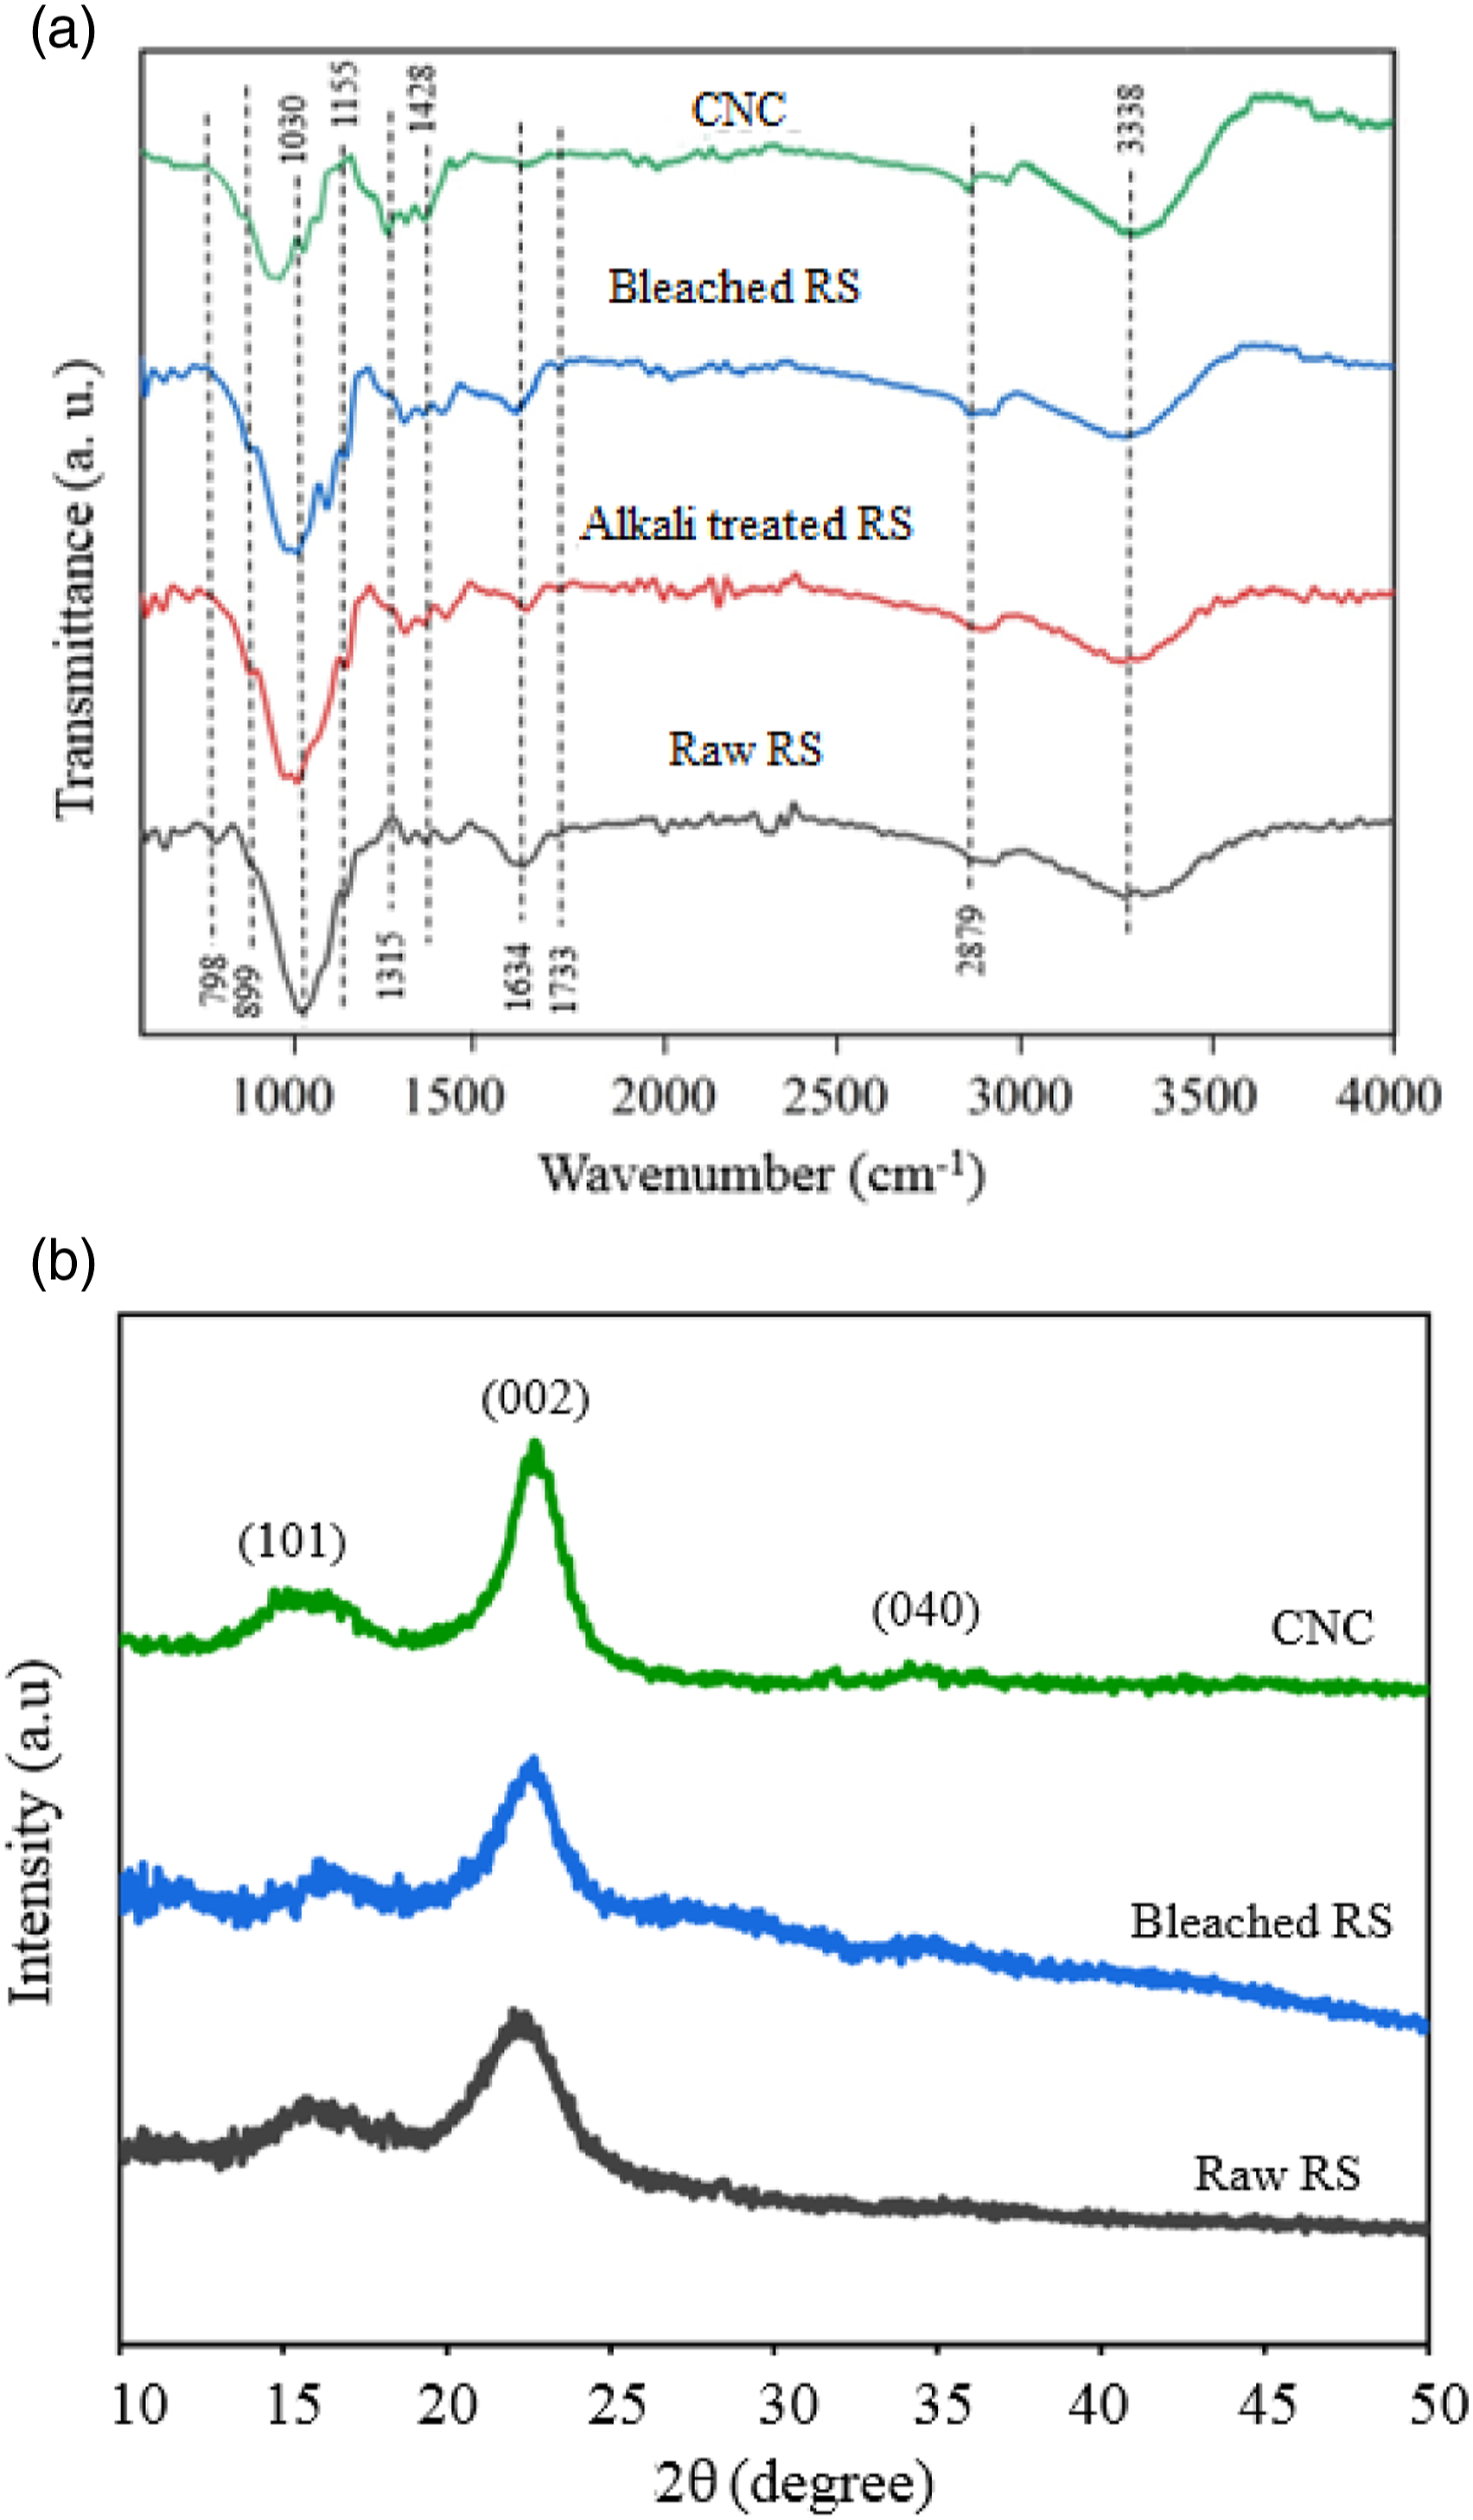
3.1.4 XRD analysis
The changes in the crystalline structure of RS after the different treatments were determined by XRD analysis. The XRD patterns of the untreated and bleached RS fibers and isolated CNC are illustrated in Figure 4(b). The results show that the major peaks at 2θ=16.2°, 22.5°, and 34.5° correspond to the (101), (002) and (040) planes, respectively. All these crystal planes are characteristic of cellulose I.
59
The diffraction peak at 2
3.1.5 Thermal stability analysis
The thermal degradation behavior of raw and bleached RS, and CNC samples was investigated by TGA/DTG, and the obtained results are shown in Figure 5. It is noticed that each sample has different thermal properties. This difference can be explained by different compositions of the samples, where cellulose, hemicellulose and lignin degrade at different thermal ranges. The first weight loss at about 100°C was observed for all the samples, related to the moisture evaporation on the surface and/or inside the cellulosic materials and the elimination of some volatile compounds. As observed from Figure 5(a), the degradation temperature considerably increased after bleaching. For raw RS, the onset temperature (Tonset) was observed at 180°C, and the corresponding maximum temperature (Tmax) was observed at 303°C. The low Tonset temperature observed for raw RS could be ascribed to the disintegration of all organic compounds, such as cellulose, lignin and hemicellulose, presented in the raw RS sample. The bleached sample showed higher Tonset (208°C) and Tmax (374°C) than the raw RS. This may be attributed to the elimination of hemicellulose and other substances by chemical treatments.
61
Tonset (167°C) and Tmax (297°C) of the CNC were lower when compared to other samples. This finding was expected that the insertion of sulfate groups during sulfuric acid hydrolysis decreases the thermal stability of CNC.
59
Previous studies indicated that sulfate groups are capable of altering the thermal stability of nanocrystals because activation energy is smaller with a higher amount of sulfate groups, thus suggesting a catalytic action on the effect of degradation reactions.62, 63 The last peak of decomposition (at around 600°C) for the raw RS is related to the decomposition of the residual lignin. A similar result was reported by Peruml et al.,
39
where the Tmax (304°C) of CNC isolated from RS using sulfuric acid hydrolysis was lower than the Tmax of treated RS (358°C). After thermal degradation, the final residues left at 600°C varied for the raw fibers, bleached fibers, and CNC. The relatively minute quantity of residue left in the cellulose fibers may be due to the presence of sulfate ester groups, partial elimination of hemicelluloses and lignin from the fibers and higher crystallinity of the cellulose.
44
(a) Thermal properties (TGA) and (b) DTG curves of raw and bleached RS, and isolated CNC.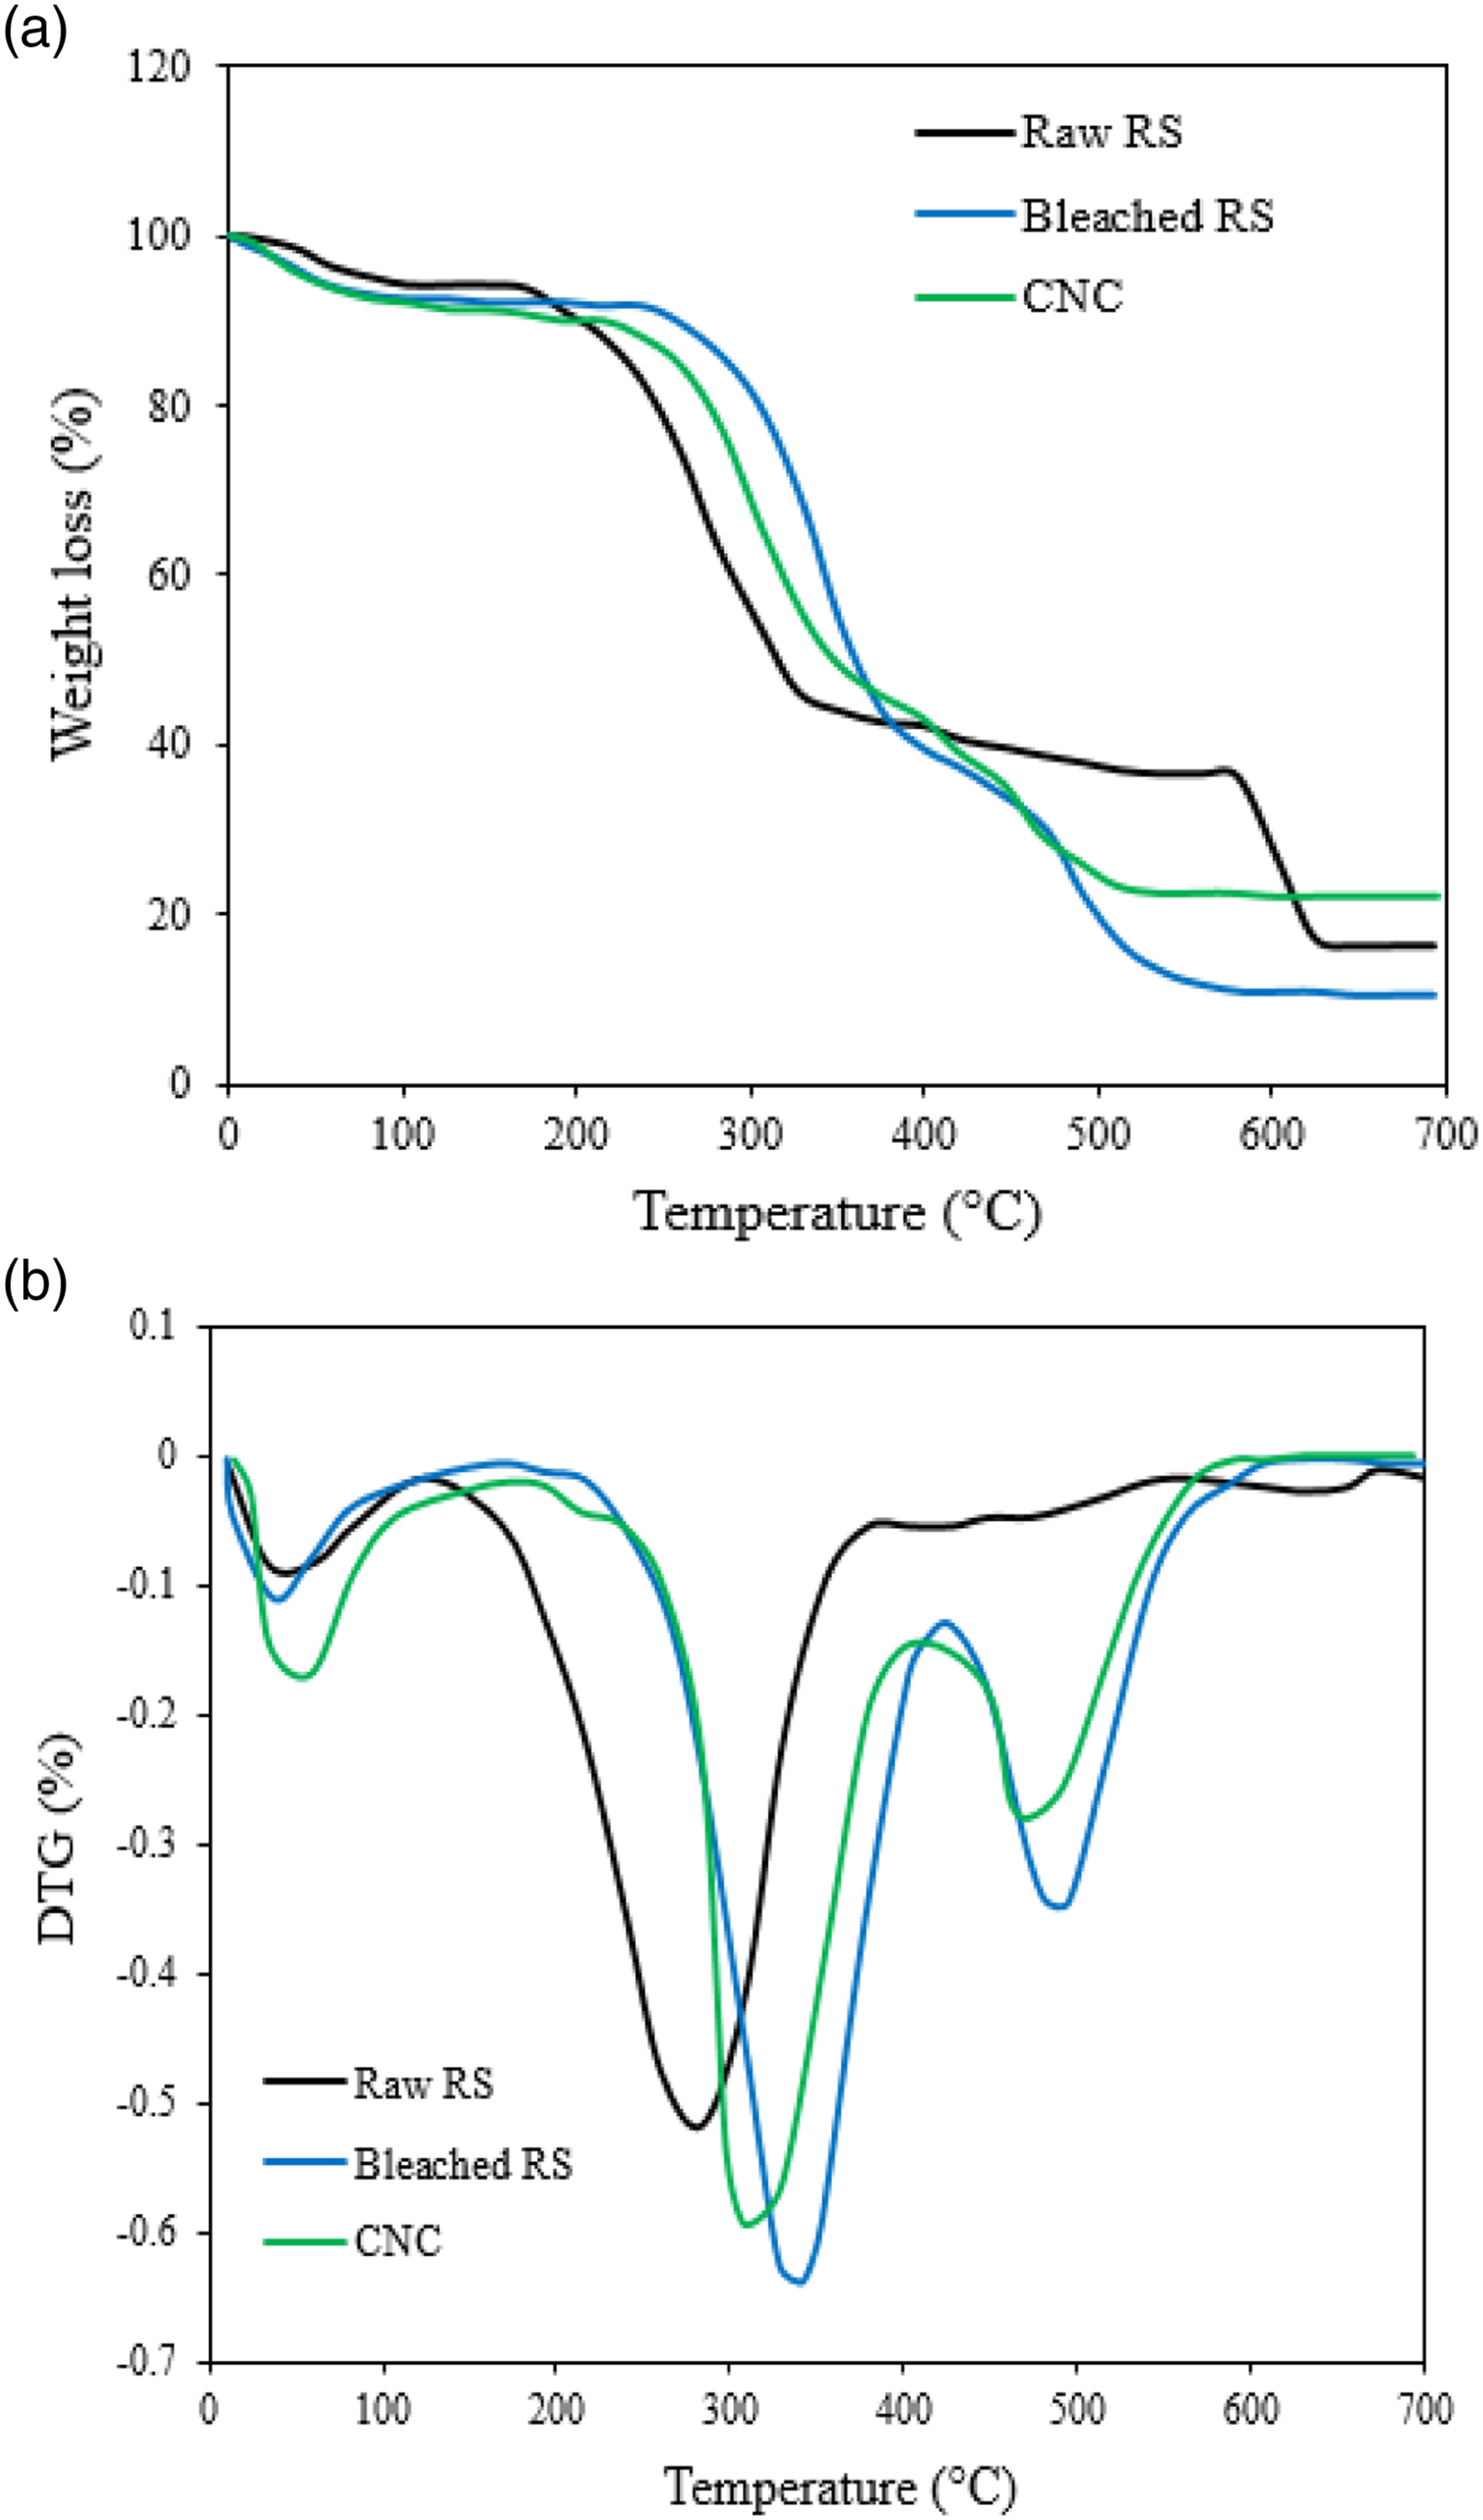
3.2 Characterization of the films
3.2.1 Thickness, MC, WS and contact angle (CA) of nanocomposite films
The thickness, moisture content (MC), water solubility (WS), contact angle (CA) and water vapor permeability (WVP) of TPS/CNC films.

Values are the mean ±SD of five replicates.
A significant difference exists at p < 0.05 within each column.
The incorporation of CNC reduced the moisture content in the nanocomposites (Table 1). This behavior is due to the strong hydrogen bond between CNC and starch, which forbids the water to interface with starch molecules. 27 Similar findings were found by Pelissari et al. 65 They reported that the moisture content of composites declined from 15.9% to 14.5%.
Solubility of films in water is one of the important properties good of attention in food packaging applications, and higher solubility of films could show lower water resistance. The applications of starch are commonly limited due to its high water solubility. Hence, the reinforcement of TPS with CNC is attended to overcome this limitation. 27 As presented in Table 1, regardless of the percentage of CNCs, WS of CNC-reinforced films significantly reduced (p<0.05) when compared to control film. When the CNC percentage in the starch film increased, WS significantly decreased (p<0.05). The addition of 15% CNC in TPS film presented the lowest WS value of (13.15%). It is an indication of strong interactions between individual nanofiller-CNCs and TPS chains within the film matrix. This may be related to the hydrogen bond formed between starch and hydroxyl groups of CNCs, which leads to the creation of three-dimensional cellulose networks. 66 This generated network raises the water-resistance and stability of TPS/CNCs films. Vaezi et al. 67 reported that the incorporation of various nanoparticles in cationic starch films decreased the WS due to the formation of a strong hydrogen bond that hinders water molecules. Other researchers also reported that the incorporation of CNC into starch matrix can provide lower WS compared to pure film.27, 68
Contact angle test is used to analyze the hydrophobicity or hydrophilicity of polymeric films. The low value of CA displays better hydrophilicity of the surface and vice versa. 17 The CA value of control film and TPS/CNC nanocomposite film with various percentages of CNC is listed in Table 1. Starch is a polysaccharide that has good hydrophilicity. The presence of starch in the matrix of the film enhances the hydrophilicity of film and hence reduces the CA of film. According to Table 1, the CA of the CNC-containing composite films significantly increased compared to the control film. By increasing the percentage of CNCs in the TPS film, the CA was significantly increased (p<0.05). This is probably due to the strong interaction between starch and CNCs, which decreases the interaction between water and the composite films. 69 Similar results were obtained by Noshirvani et al. 7 They reported that as CNC content increased from 3% to 20%, The CA of starch/PVA/CNC nanocomposites increased from 39.02 to 47.71, respectively. Yadav et al. 70 also reported a major improvement in hydrophobicity of nanocomposite films based on chitosan and CNCs obtained from cellulose microcrystal, when compared to control film.
3.2.2 Morphological analysis of nanocomposite films
SEM images of the surface and cross-section of the prepared films are presented in Figure 6. As indicated in Figure 6(a), the control film has a smooth, continuous, and homogenous surface. Therefore, glycerol proved to be a suitable plasticizer for TPS. The appearance of irregular spots for CNC-reinforced films (Figures 6(b) to (e)) revealed the presence of CNC in the structure of films. It is evident that the incorporation of CNCs increased the surface roughness of the (TPS/CNCs) nanocomposite films compared to the control film. The distribution of CNCs in the nanocomposite films containing 15% CNCs is worse than their distribution in films containing 10% or less of CNCs. This showed that the low concentration of CNCs organized a strong interaction with TPS than high concentration CNCs, and dispersed more homogeneously within TPS matrix. Furthermore, no large aggregates and a homogeneous distribution of the CNCs in the TPS matrix were observed in all the nanocomposite films. Ilyas et al.
27
observed that the incorporation of 0.1–0.5 wt% of CNCs, obtained from sugar palm in starch films produced smooth and homogenous nanocomposite films. However, when reinforcement concentration was increased to 1 wt% CNC, small voids and discontinuities appeared in the nanocomposite. They reported that this roughness is due to the aggregation of particles. Similar results have been reported for the starch nanocomposites containing CNCs in published studies.6,17,22 SEM cross-sectional image of the neat stach film (Figure 6(f)) indicates discontinous gaps in the matrix, which may facilate the passage of water vapor. It is evident from SEM micrograph of the cross-section of PTS/CNC5 that the roughness of film increased when 5 wt% CNC was added. The addition of CNC into starch film provided rough structure without phase separartion (Figure 6(g)). This result shows excellent compatibility between both components of film, starch and CNC. SEM images of (a) TPS/CNC0, (b) TPS/CNC2, (c) TPS/CNC5, (d) TPS/CNC10, and (e) TPS/CNC15 films. SEM cross-sectional images of (f) TPS/CNC0 and (g) TPS/CNC5.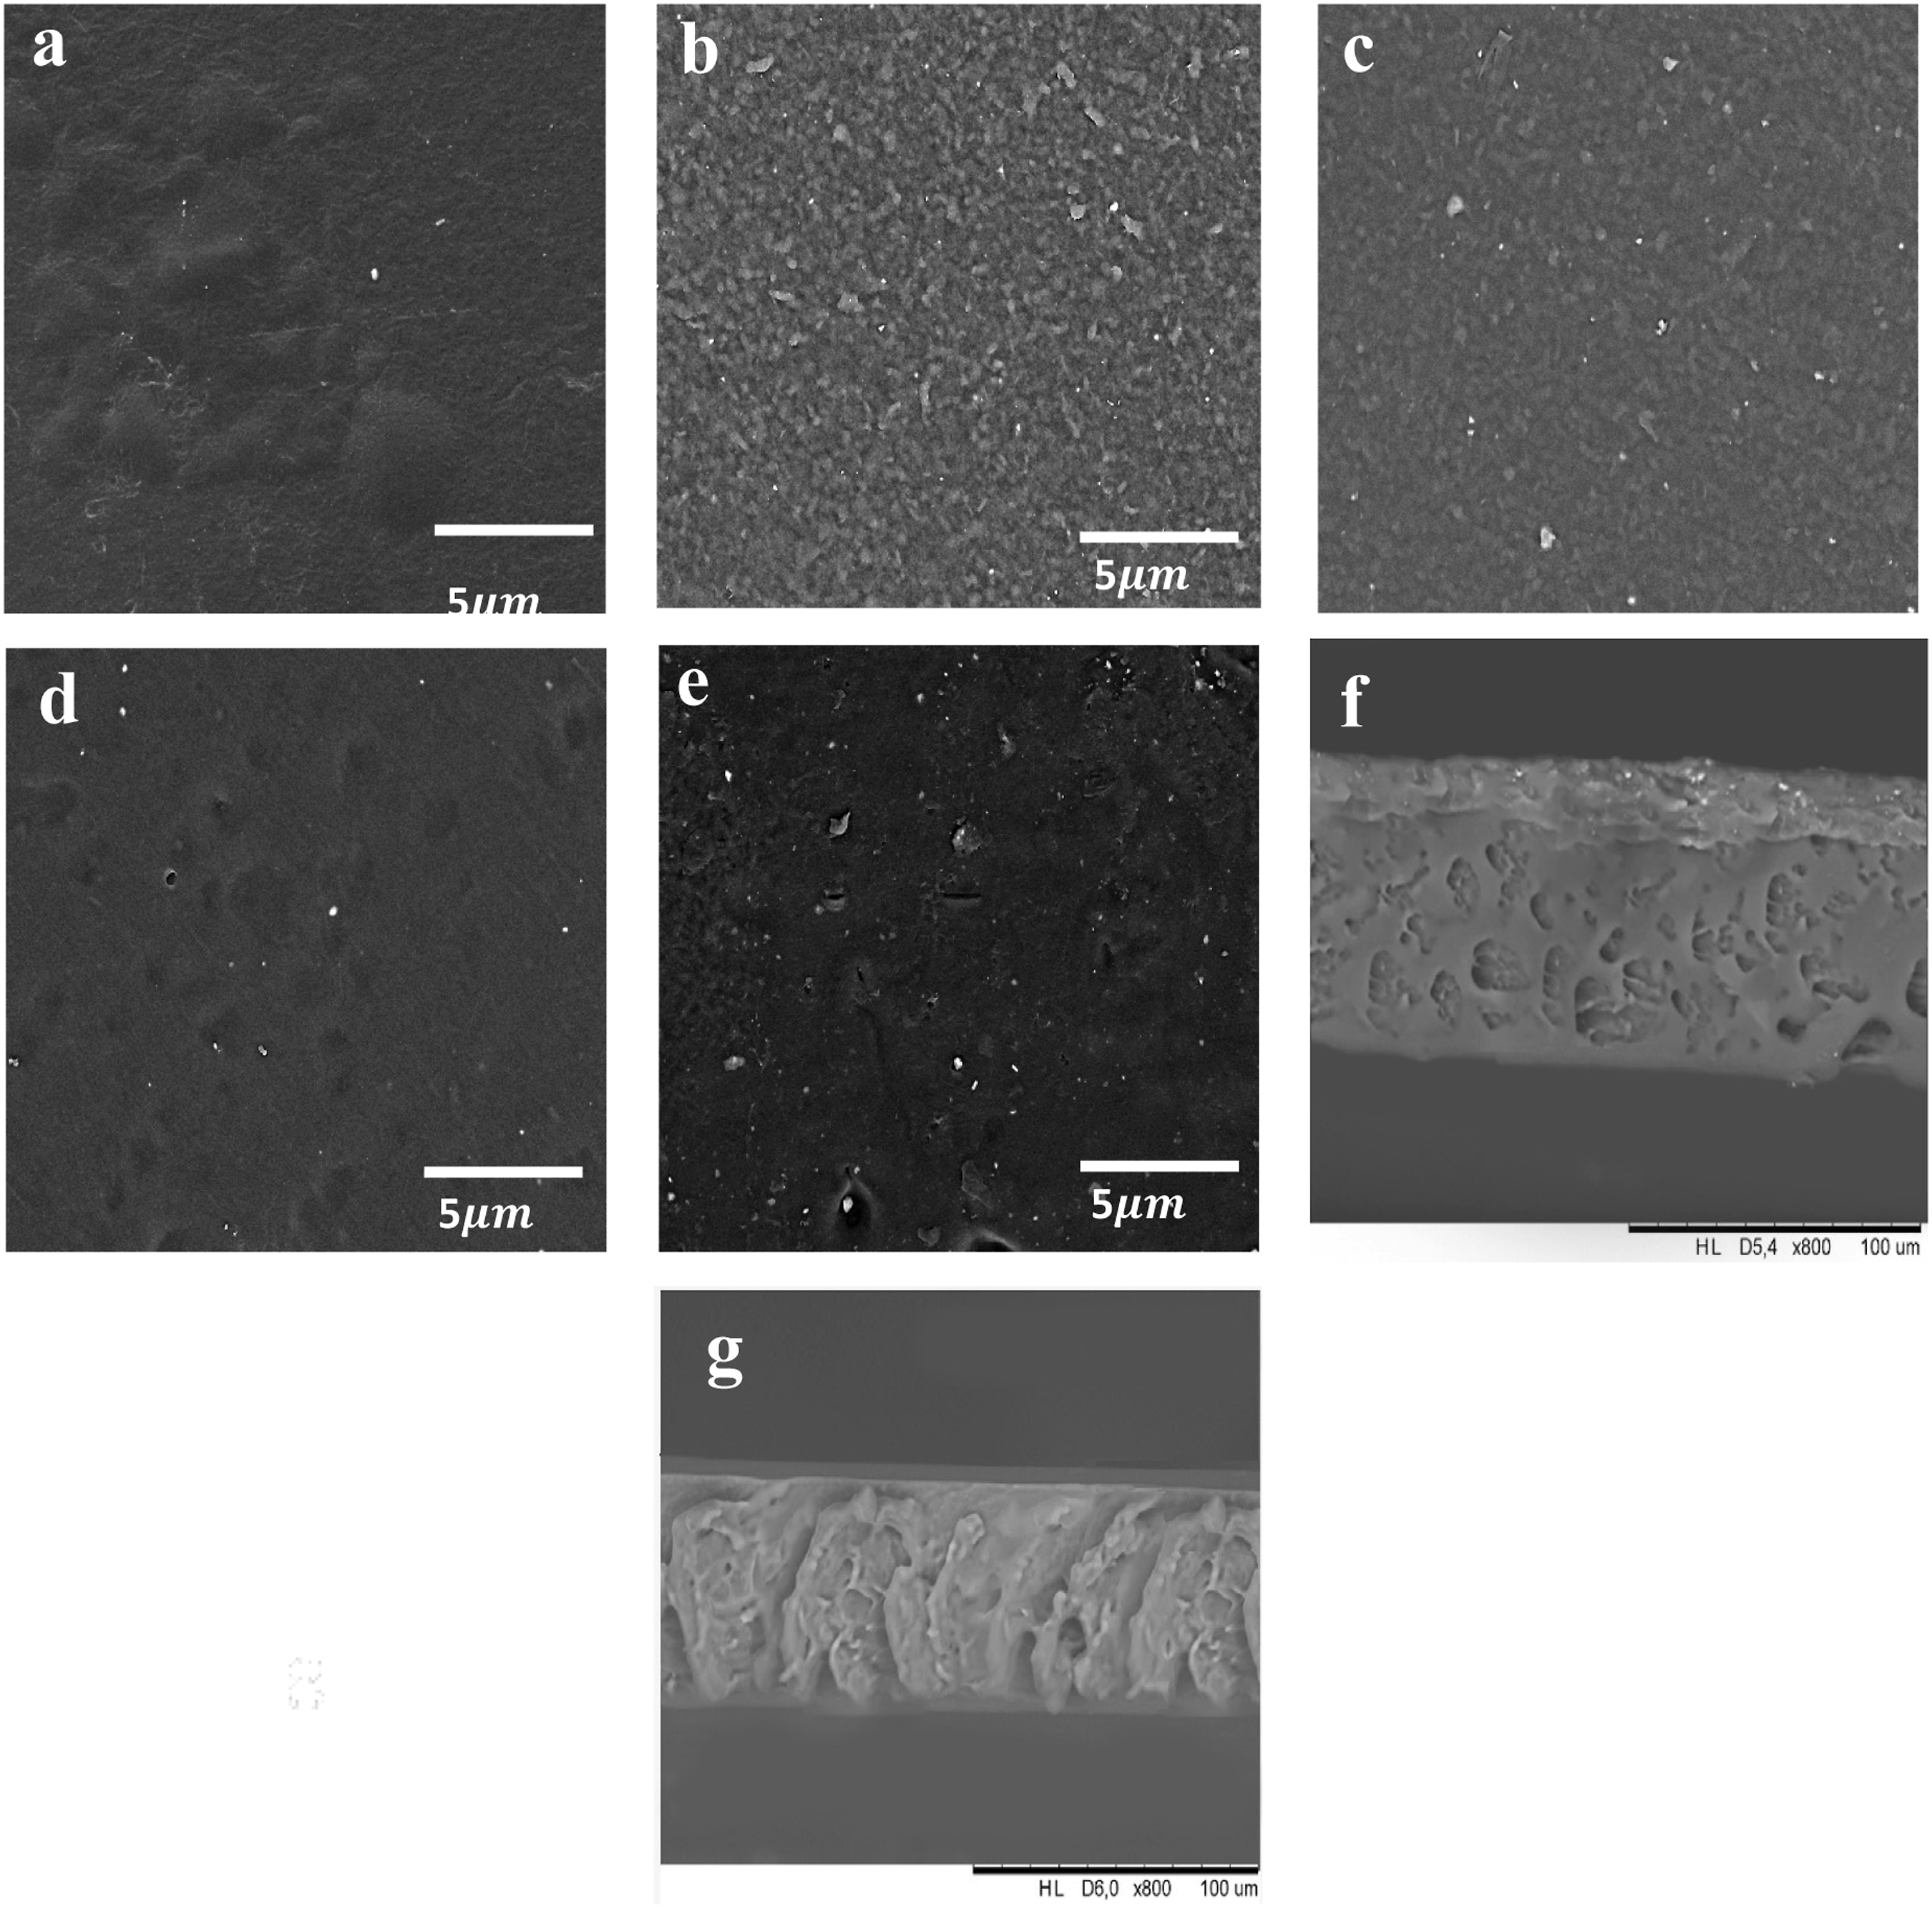
3.2.3 X-ray diffraction (XRD) analysis of the nanocomposites films
The X-ray diffraction patterns of all prepared films are shown in Figure 7(a). The control film presented a typical diffraction pattern with characteristic peaks at 2θ=5.9°, 17°, and 22.5°, corresponding to type B polymorphs. These findings are similar to previous studies by Ghanbari et al.
71
and Chen et al.
72
After thermal processing, TPS can present two crystalline structures: (i) residual crystallinity and (ii) processing-induced crystallinity. Residual crystallinity can happen due to incomplete melting of starch during the casting process or even by the reorganization of starch molecular chains in their native arrangements. Processing-induced crystallinity can appear by the crystallization of amylose chains complexed with plasticizers (such as glycerol), which presents a crystalline structure of a single helix maintained through hydrogen bonds formed between starch and the plasticizer.40, 73 Three diffraction peaks located at 2θ=16–17°, 19°, and 22.5° were obtained for nanocomposites, which may be attributed to cellulose I typical structure, as observed in previous CNC analysis. The intensity of these peaks enhanced with the increase of CNC content. Coelho et al.
22
and Perumal et al.
39
also reported intensity enhancement of these peaks with increasing CNC content. Although the diffraction peak intensity of the sample films changed with the CNCs content, no attestation of any new peak or peak change in the diffraction angles was observed. Therefore, it can be deduced that the diffraction of the nanocomposite films was only superimpositions of the diffraction of ST and CNC, and the CNC did not change the crystal of TPS. (a) XRD pattern, and (b) FTIR spectra of TPS/CNC0, TPS/CNC2, TPS/CNC5, TPS/CNC10, TPS/CNC15.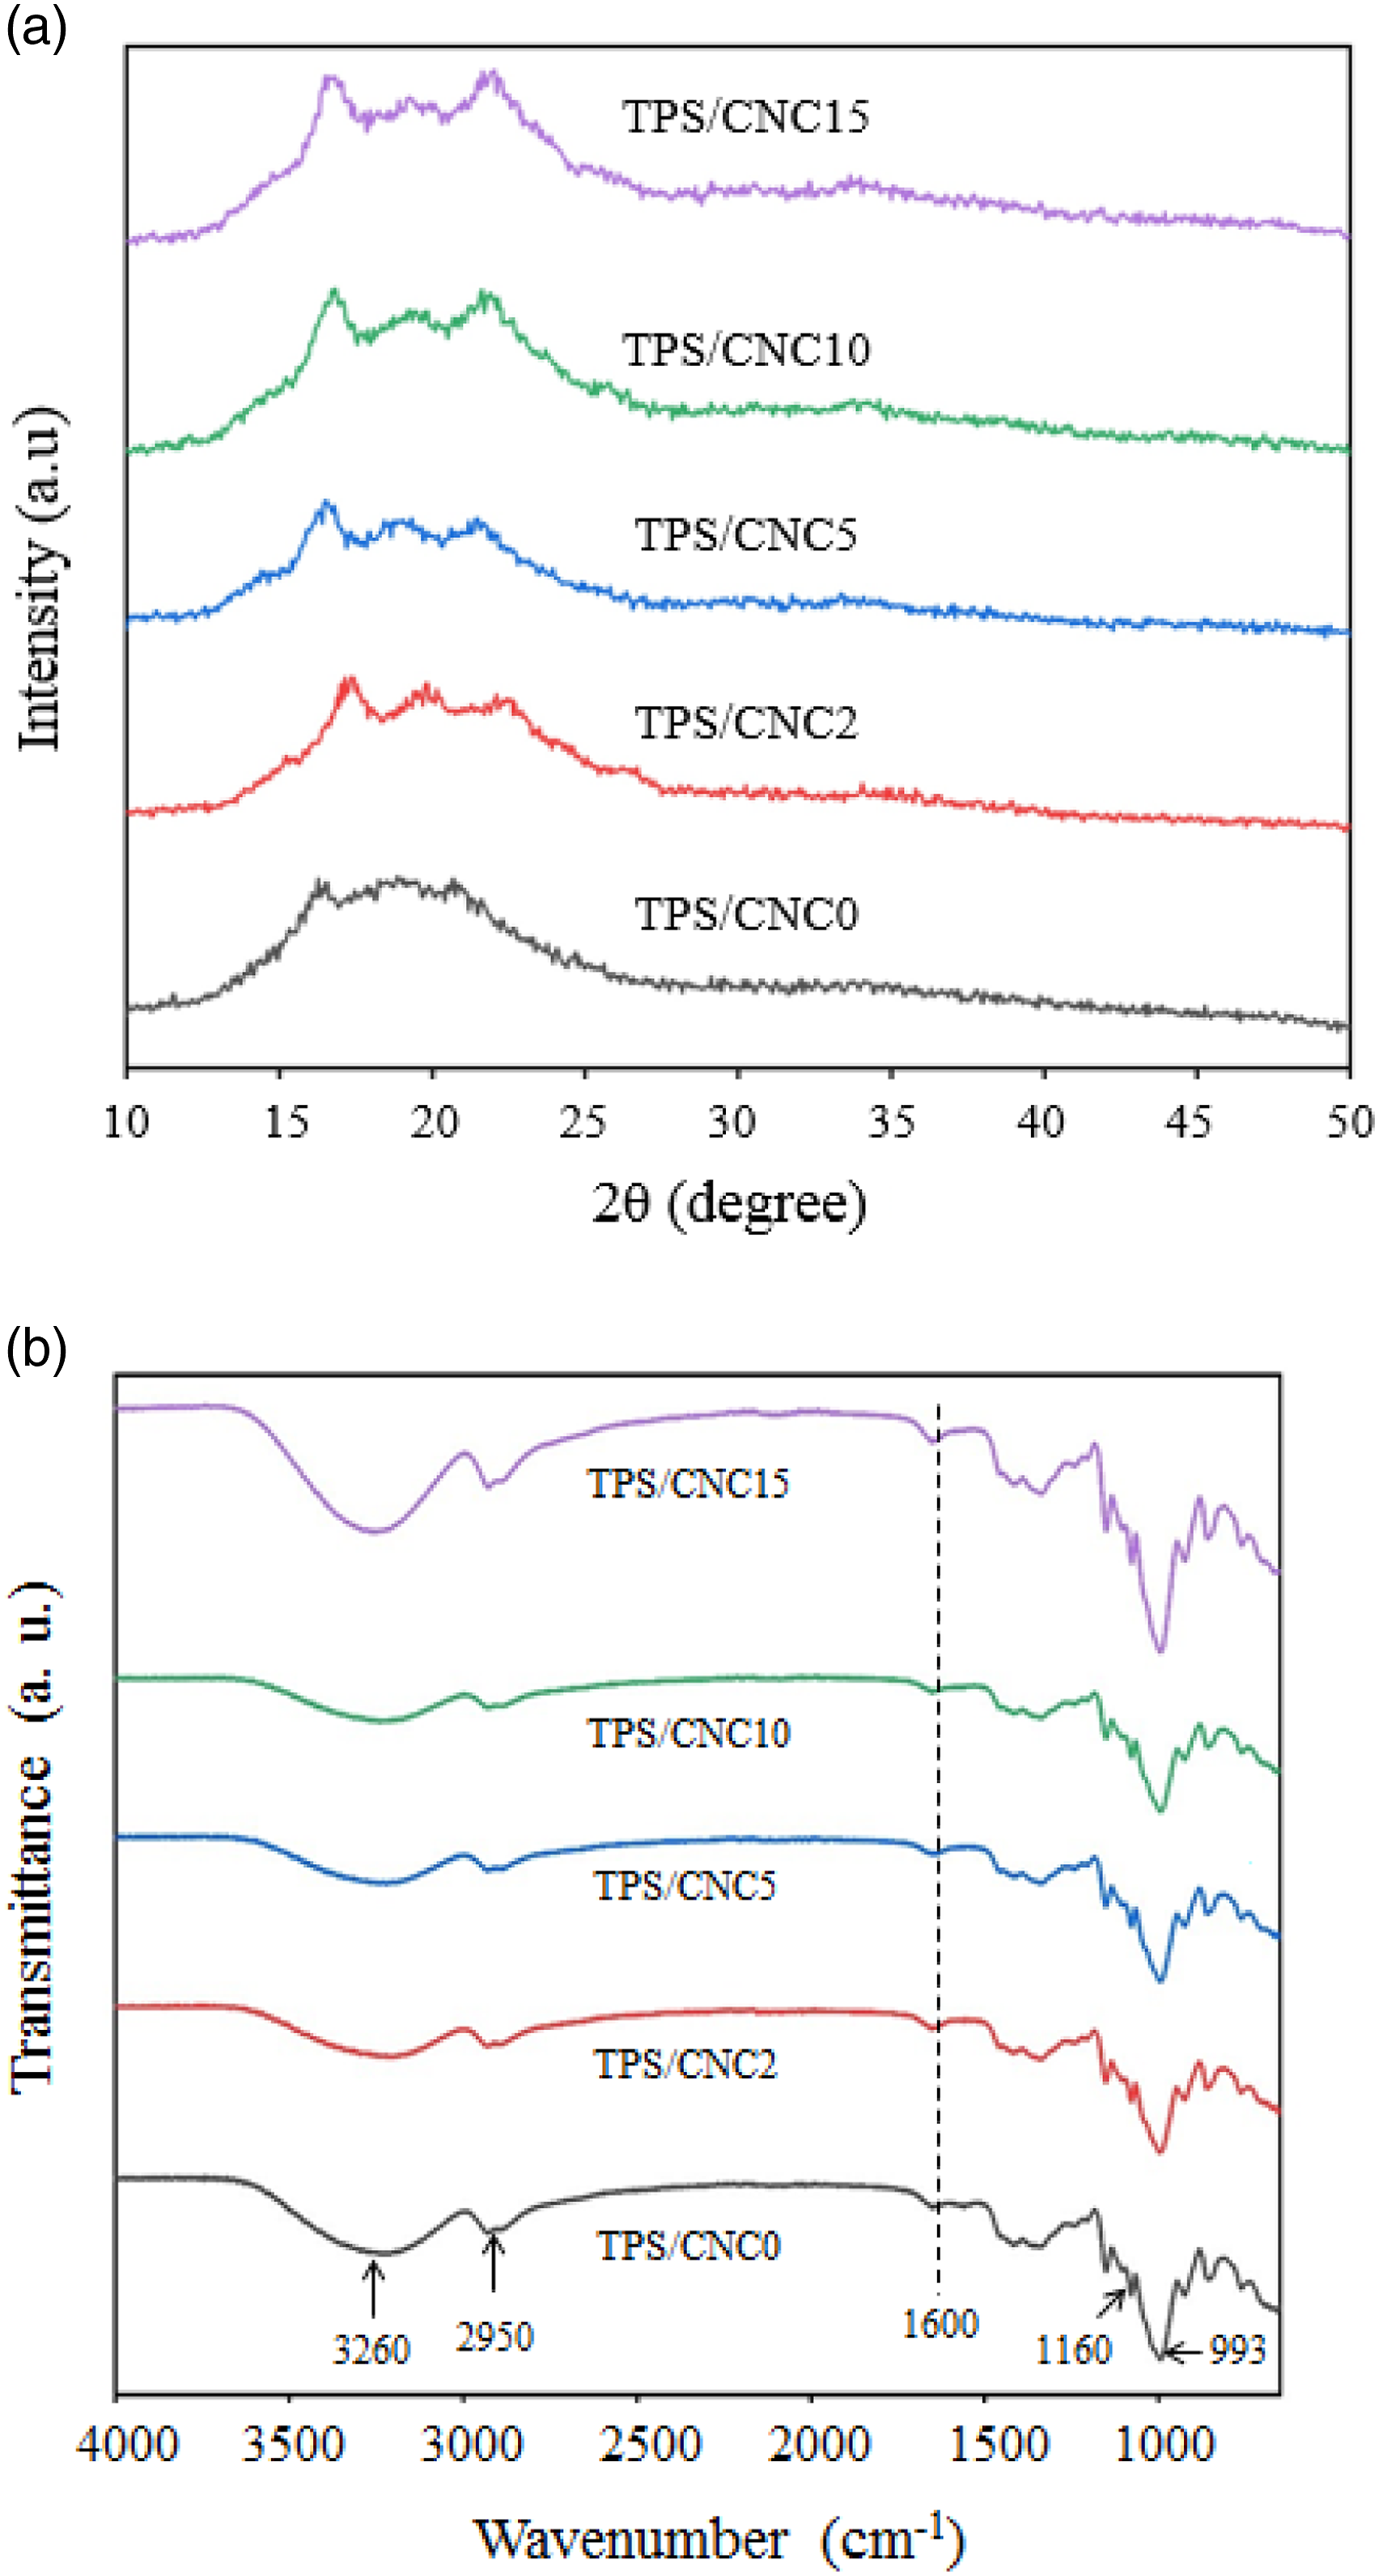
3.2.4 FTIR of the nanocomposites films
FTIR spectra of control film and TPS/CNCs nanocomposite films are illustrated in Figure 7(b). The peaks at 3200–3400 cm−1 and 993 cm−1 in the spectrum of TPS are attributed to the stretching vibrations of the hydrogen bonding –OH groups and C–O stretching vibrations in starch, respectively.74, 75 All nanocomposite films displayed almost the same FTIR spectra as the control film due to the similarities between starch and cellulose chemical structures. Furthermore, the wavenumber of the peak for C–O stretching vibrations changed from 993 cm−1 to 982 cm−1 as CNCs content increased from 2 to 15 wt%. This might be due to the new interactions between cellulose and starch molecules. 76 The peaks at 2950 and 1160 cm−1 corresponding to C–H stretching and C-O stretching of the TPS sample were transferred to 2930 and 1152 cm−1, respectively. The peak around 1600 cm−1 is attributed to the hydroxyl (-OH) group of water in all nanocomposite films. 67 The peak at 1150 cm−1 is characteristic of the C–O–C asymmetric stretch vibration in the cellulose. 76 No obvious change in the location of the OH stretching band for TPS/CNCs was found with the addition of CNC. Besides that, this phenomenon affirmed that inter-and/or intra-molecular interactions existing between the starch and CNCs are likely through the hydrogen bonding or the van der wall force, and this interaction increased with the enhancement of CNCs. Pelissari et al. 65 reported similar results for nanocomposites based on banana starch reinforced with cellulose nanofibers.
3.2.5 Color and opacity of the nanocomposites films
Color parameters and opacity for TPS/CNC films.
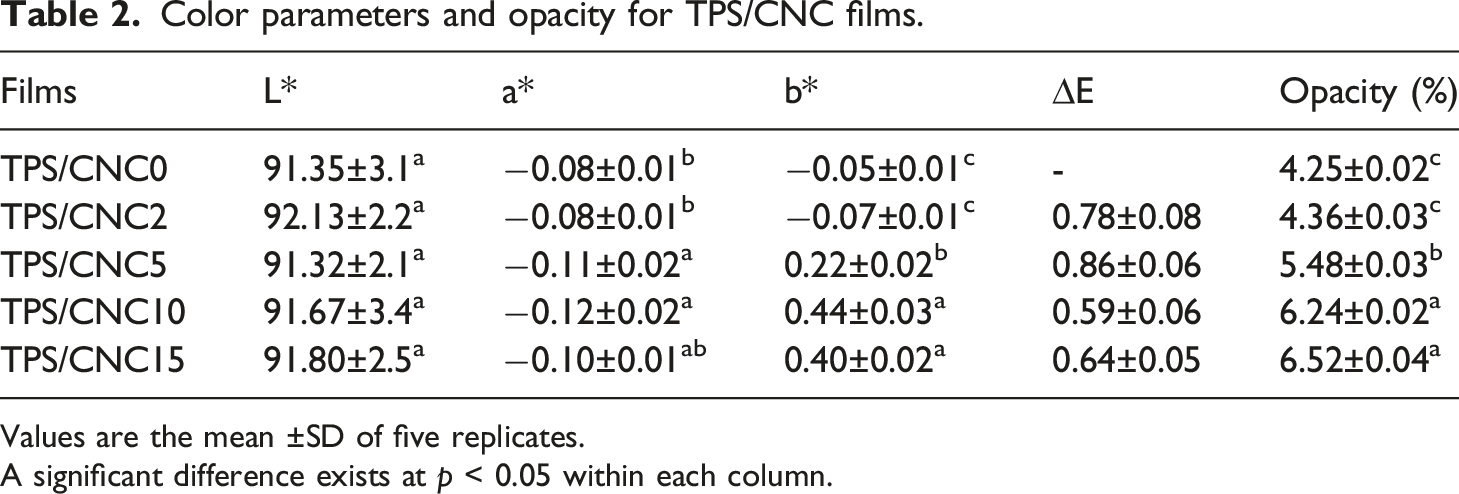
Values are the mean ±SD of five replicates.
A significant difference exists at p < 0.05 within each column.
Control film (TPS/CNC0) and nanocomposite with 2% CNC displayed the least opacity, but the addition of CNC (5, 10, and 15%) significantly increased opacity and decreased the transparency of the nanocomposite films. Therefore, TPS/CNC nanocomposite films are more opaque than control films. This result confirmed that the CNC was dispersed within starch matrix. It is directly related to interactions between the starch and CNC, as evidenced by FTIR analysis. According to Nascimento et al., 78 nanocomposite films exhibit opacity enhancement due to the interaction between the starch matrix and CNCs, as well as the light scattering of added CNCs. Similar results were reported by Li et al., 17 who noticed a considerable increase in film opacity when 20% CNC was added to the starch film. In general, starch/CNCs films are opaque films and limit UV and visible light transmission. This property makes them suitable packaging materials to decrease food oxidative deterioration, which leads to discoloration, nutrient losses and off-flavors.
3.2.6 Mechanical properties
Mechanical properties of the prepared nanocomposite films.
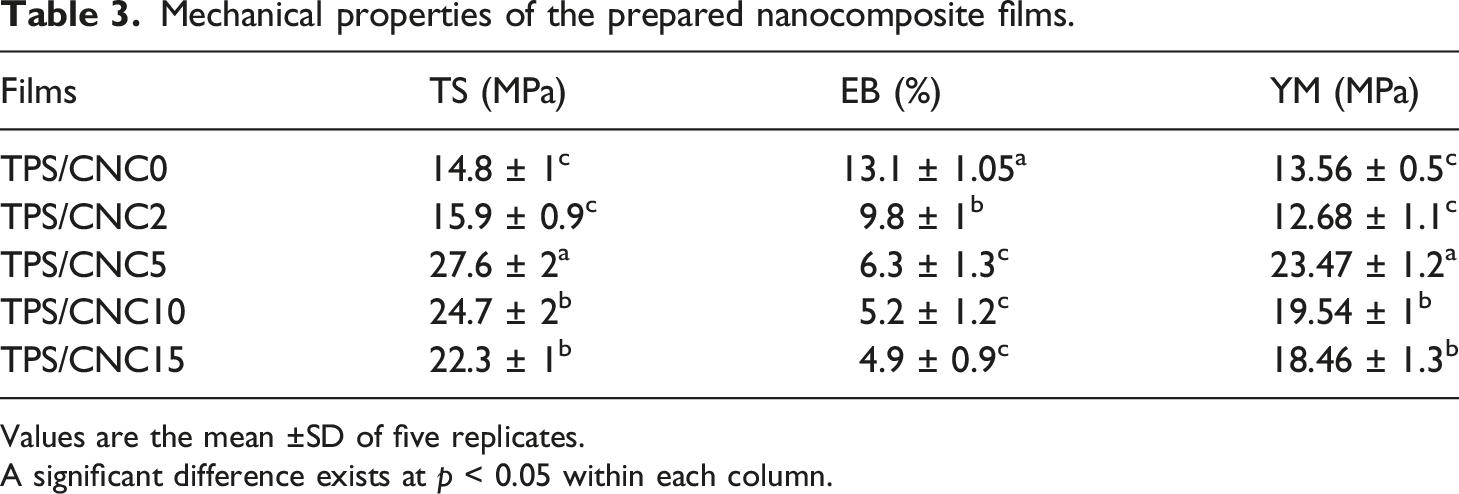
Values are the mean ±SD of five replicates.
A significant difference exists at p < 0.05 within each column.
As indicated in Table 3, the EB of the control film reduced with the incorporation of CNC. The addition of a low value of CNC, TPS/CNC2, was able to reduce EB (9.8%), whereas TPS/CNC5, TPS/CNC10, and TPS/CNC15 films exhibited lower amounts of EB, 6.3, 5.2, and 4.9%, respectively. The low values of EB in prepared nanocomposite films can be explained by the rigid structure of CNC. This finding was supported by past results published in the literature.15, 77, 80
On the other hand, higher amounts of CNC led to the enhancement of YM values of nanocomposite films that can be ascribed to the raised rigidity of the films with the incorporation of CNCs. The YM of the TPS/CNC10 and TPS/CNC15 films (19.54 MPa and 18.46 MPa, respectively) were lower compared to the TPS/CNC5 film. The reduction of YM at higher CNC loadings may again be attributed to poor CNC dispersion. So, it can be inferred that TPS/CNC5 film is a good composition for obtaining a significant improvement in the mechanical properties of nanocomposites. Similarly, Coelho et al. 64 found the improved properties of the thermoplastic starch nanocomposites by CNC incorporation. Ilyas et al. 27 concluded that a concentration of 1.0 wt% CNC did not help to further improvement of the mechanical properties of the starch film. They observed that these properties were considerably improved by CNC addition. However, they verified poor dispersion and aggregation of the CNC particles above a certain concentration in the starch matrix.
3.2.7 Water vapor permeability (WVP)
A key criterion of composite films is WVP that can evaluate the appropriateness of films for their application in food packaging. The water resistance of packaging films affects their efficiency. In other words, the transfer of moisture between the surroundings and package should be avoided or at least decreased by films. Therefore, films with low water vapor permeability are appropriate for food packaging applications. 17 The WVP of prepared films are listed in Table 1. It can be seen that the highest WVP was observed in control film, which was 8.46 g.h−1. m−1. Pa−1. The WVP of the prepared films decreased by increasing the CNC content from 2% to 15%. This was due to the attendance of CNCs that increased the compactness of the film network owing to the filling of the void space of the starch films. The greater compactness in the structure of the starch films suggested greater resistance to the diffusion, solubility, and permeability of the water molecules and finished into lower WVP values. 81 The addition of 2% CNC in TPS films presented the lowest WVP values (5.2 g h−1 m−1 Pa−1). Therefore, at this concentration (2% CNC), CNC could well diffuse in the starch matrix, providing a tortuosity increase of water molecules in the polymeric matrix, thus decreasing WVP. However, the WVP increased at the film with higher concentration of CNC loading. This might be due to the aggregation and self-condensation of CNC particles in higher concentrations (5, 10, and 15%) and therefore making voids in the composite matrix. 82 The barrier properties of the starch film improved after CNC addition in film. This reveals that CNC dispersed successfully into the starch matrix and could enhance the average path length of water vaper molecules and create tortuous paths for their diffusion into nanocomposites, as observed in SEM cross-sectional images. In general, the barrier properties can be enhanced by the addition of reinforcing filler on a nanoscale with a large aspect ratio when dispersed sufficiently in the matrix. 83 Sung et al. 53 reported that the loading of 1 and 3 wt% of CNCs into the PLA nanocomposites was efficient for the remarkable reduction in WVP. However, for the PLA film reinforced with 5% CNCs, there was no significant difference in WVP compared with that of the PLA/CNC3% nanocomposite. Similar researches have reported that the strong hydrogen bonding interactions between cellulose crystallites and starch matrix can be formed and the hydrogen bonding resulted in the decrease of the diffusion coefficient of composite.84,85
3.2.8 Thermogravimetric analysis (TGA)
The thermal degradation and stability of TPS and TPS/CNC films were assessed by TGA, where the mass loss because of the volatilization of the degradation products was monitored as a function of temperature. Figure 8(a) shows the thermogravimetric curve (TG) and Figure 8(b) the derivative thermogravimetric curve (DTG). Weight loss during heating of TPS materials occurred mainly in two stages. The first degradation step occurred at around 80–120°C and this was attributed to evaporation or dehydration of loosely bound water and low molecular weight molecules (first water and then glycerol). Further heating, the DTG of the control film showed a sharp peak at 305.14°C, corresponding to almost 79.13% weight loss which is maybe due to the degradation of saccharide rings of the neat TPS. Control film displayed a higher mass loss in comparison to the TPS/CNCs nanocomposite films at a temperature lower than 100°C. These phenomena can be attributed to the reality that control film contained higher moisture content than TPS/CNCs nanocomposite films.
86
The second step of the thermal degradation, around 270–400°C, could be attributed to the TPS thermal decomposition coupled to CNC degradation that happens at similar temperatures.
27
Control film presented higher value of Tonset, but when CNC was added in concentrations of 2–15% this parameter decreased. The decomposition temperature, Tmax was higher in TPS/CNC2 film; however, it was not significantly different from neat starch and PTS/CNC5 films. Higher CNC incorporated films (PTS/CNC10 and PTS/CNC15) exhibited lower Tmax that was not significantly different from TPS/CNC2 film. Tmax of TPS and TPS/CNC2 was 305.14°C and 316.92°C, respectively. The results showed that similar value of Tmax was shown for all films, with difference of just 10°C. It can be concluded that CNC did not significantly improve the thermal stability of TPS/CNC films, which provides an inconsistent results that Tmax of the nanocomposites effectively changes with an increase of CNC content in the ST matrix with previous literature.40, 87 (a) TGA and (b) DTG curves of TPS/CNC0, TPS/CNC2, TPS/CNC5, TPS/CNC10, TPS/CNC15.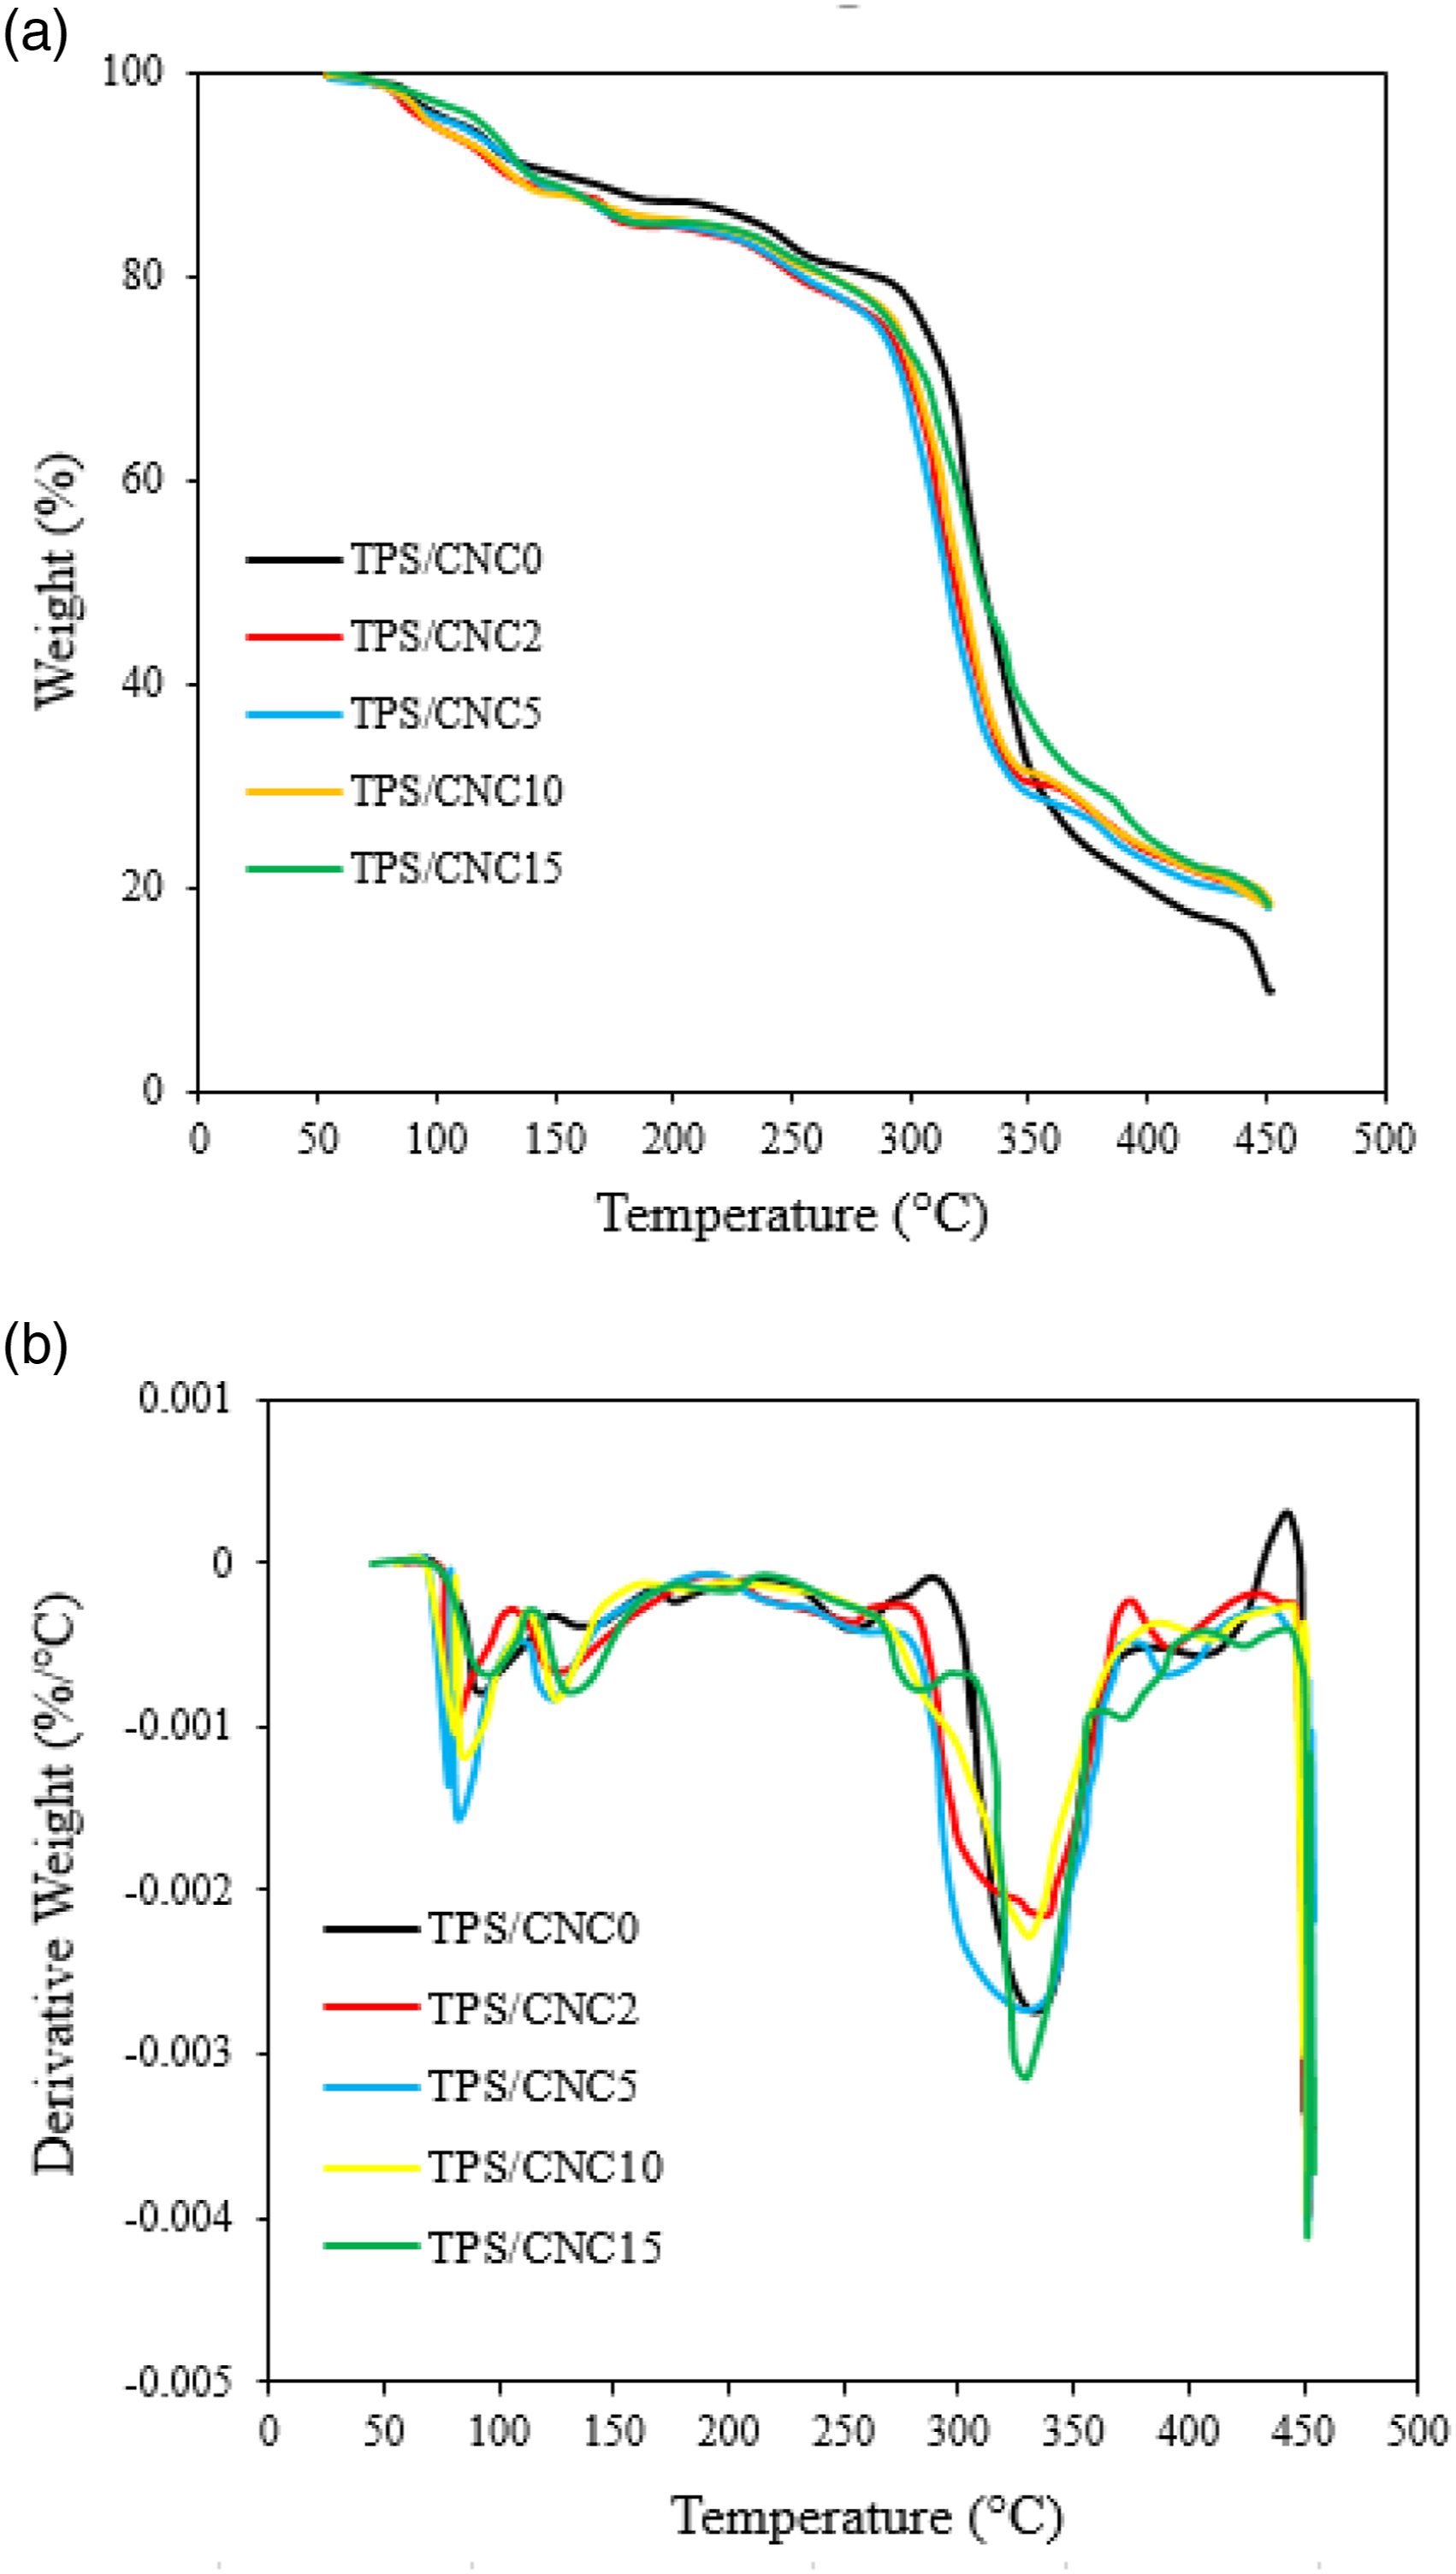
4. Conclusion
In this study, rod-like CNC was successfully isolated from RS by acid hydrolysis and used as a reinforcing filler in starch-based film. The applied pretreatment method was successful in removing non-cellulosic components of RS. The isolated CNC had high stability (Zeta potential=−32.73 mV) in aqueous media. FTIR and XRD analyses revealed that the chemical structure of cellulose was maintained and that crystallinity was 75% after acid hydrolysis. The incorporation of CNC into the TPS matrix improved the mechanical, barrier, and thermal properties of TPS films through hydrogen bonding. Both Young’s modulus and tensile stress were increased by the CNC addition. Contrastingly, their EB, moisture content, solubility in water and water vapor permeability were reduced by increasing the CNC incorporation. Therefore, TPS/CNC nanocomposite has excellent potential in the food packaging industry. As a result, this study can help smooth the way for the large-scale production of novel environmentally friendly packaging materials.
Footnotes
Acknowledgements
The authors are grateful to Iran Vice-Presidency for Science and Technology for providing support.
Author Contribution
Data availability
The raw/processed data required to reproduce these findings cannot be shared at this time as the data also forms part of an ongoing study.
Declaration of conflicting interests
The author(s) declared no potential conflicts of interest with respect to the research, authorship, and/or publication of this article.
Funding
The author(s) disclosed receipt of the following financial support for the research, authorship, and/or publication of this article: This work was supported by the Babol Noshirvani University (BNUT), Iran [Grant Program No. BNUT/964115028/1401].