
Abstract
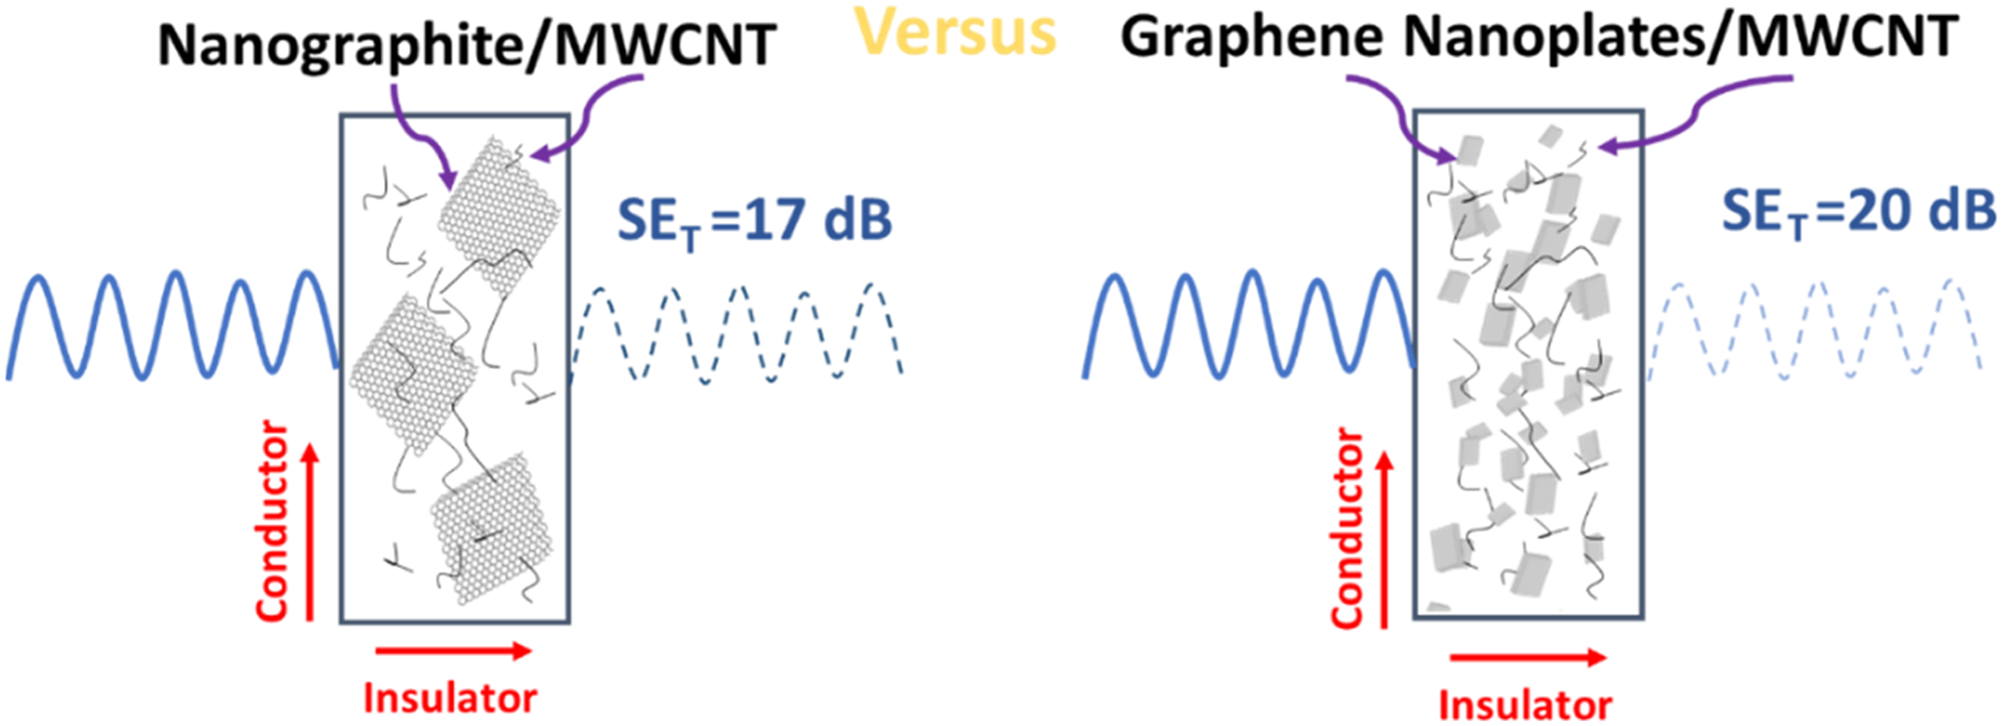
Graphene-related materials (GRM) are promising materials to improve mechanical, electrical, and optical polymer properties. Adding multi-wall carbon nanotubes (MWCNT) on GRM nanocomposites promotes synergistic effects on its electrical properties and electromagnetic interference shielding effectiveness (EMI SE). This study focused on evaluating the addition of MWCNT on three different polycarbonate (PC)/acrylonitrile butadiene styrene (ABS)/GRM nanocomposites. These hybrid nanocomposites were prepared by melt mixing using extrusion and injection-mold processes. The morphologies of the nanocomposites were evaluated by field emission gun scanning electron microscopy (FEG-SEM), and their proprieties were characterized by X-ray diffraction (XRD), oscillatory rheological, dielectric spectroscopy, and EMI SE analyses. The electrical behavior of all hybrid nanocomposites was anisotropic due to the injection-molded preparation process. The lateral size, thickness, and production method of the GRM were indicated to be critical factors for the electrical and EMI SE behaviors of these composites. The nanocomposites with GRM2, which had the smallest lateral size and thickness (graphene nanoplatelets), promoted total attenuation levels around 20 dB with 1.5 wt% of MWCNT, matching the EMI SE required for some commercial applications.
Keywords
Highlights
• Commercial levels of EMI SE (20 dB) were achieved for hybrid nanocomposites of graphene nanoplatelets and MWCNT in a PC/ABS polymer matrix prepared by extrusion and injection-molded processes. • The effect thickness and lateral size of different graphene-related materials were discussed from the complex dielectric constant associated with the morphology of the nanocomposites. • The anisotropic AC electrical conductivity behavior of injection-molded GNP/MWCNT nanocomposites was observed and correlated with the EMI SE of those materials.
Introduction
Graphene is an excellent material consisting of a single flat layer of sp 2 hybridized carbon atoms arranged in a hexagonal lattice, presenting exceptional mechanical, electrical, and optical properties. However, since graphene was first isolated in 2004, its production in its ideal form has been a scientific and industrial challenge. That challenge has led to a range of materials called Graphene Related Materials (GRM).1,2
Graphene related materials are a family of 2D carbon materials that deviates from the ideal single-layer graphene but seeks to preserve some of the exceptional properties of graphene. The GRM may be classified considering three parameters: lateral size, number of graphene layers (related to the thickness), and carbon/oxygen (C/O) atoms ratio.1,2 Some popular materials of the GRM family are few-layer graphenes (i.e. 2–5 layers) graphene nanosheets (GNS), graphene oxide (GO), and graphene nanoplatelets (GNP), 2 all those already commercialized. Recently, a new and complete framework of commercial graphene materials was created by The Graphene Council, 3 wherein 16 parameters to consider to classify the commercial material that might be adequate for each application.
Among the GRM, the GNP have been highlighted to modify polymer properties since they present excellent electrical and thermal conductivities related to the graphene structure, easy processability, ability to be processed by conventional methods (extrusion and injection molding), and potentially low-cost since this nanofiller might be produced by mechanical and chemical exfoliation of natural graphite.4,5
Previously, the term graphene nanoplatelets was considered an equivocate nomenclature since “nano” should indicate a nanosized lateral dimension. 6 However, due to the intensive commercial and literature use, that term and its abbreviation GNP have been recently added to some graphene standards.7,8 According to the ISO/TS 21356-1:2021, 7 GNP can be defined as graphene layers forming a nanoplate (also called nanoplatelets) that have a thickness of approximately 1–3 nm, a number of graphene layers of 10 or less, and lateral sizes between 100 nm to 100 μm.7,8 Furthermore, graphite is defined as an allotropic form of carbon consisting of graphene layers stacked in parallel long-range order forming a 3D crystalline structure. 7 Although there is still no consensus on graphene-based materials nomenclature, nowadays, GNP are being commercialized as a black powder consisting of a few layers of graphene in the form of nanoplatelets and some thicker nanosized graphite (nanographite). 5 Moreover, nanographite might be an abundant subproduct of GNP and a few-layer graphene production process, 5 so finding applications for that subproduct could be a way to promote GNP production more affordable.
Among the various fields of application for GNP, the development of housings for electronic components can significantly increase the demand for using graphene technology. Polycarbonate (PC) and its blends, like PC/acrylonitrile-butadiene-styrene copolymer (ABS), are attractive candidates for polymer matrices to be modified with GNP.4,6–9
Many efforts have been made to promote the Electromagnetic Interference Shielding Effectiveness (EMI SE) of these materials to produce multifunctional materials for electronic housing and other applications.10,11 PC/ABS blends are commonly applied in portable electronics 12 industries due to the excellent balance of properties of these two polymers. On the one hand, PC is an engineering thermoplastic that presents excellent mechanical and thermal properties, but it is difficult to process using common industrial methods. On the other hand, ABS is easier to process but presents lower mechanical properties than PC. Together, as PC/ABS blends, these polymers possess good processability, excellent thermal, and excellent mechanical properties with synergistic impact strength.13–17
In the portable electronics scenario, some polymer parts need the addition of metallic components, or a posterior metallization process, to promote electromagnetic compatibility (EMC) of the electronic enclosures. The EMC requires a minimum EMI SE of 20 dB 18 for electronics applications. An alternative and affordable way to improve the EMC in PC/ABS blends, and develop multifunctional materials, is the addition of conductive fillers as GNP and multi-wall carbon nanotubes (MWCNT). 11
According to the literature, besides carbon-based nanostructured materials, some other conductive fillers and strategies might be added to seek EMC. Some examples are conductive polymers (such as Polyaniline (PANI) 19 and Polypirrol (PPy) 20 ), metallic particles (such as copper and silver),21,22 and also combinations of both types (such as Barium hexaferrite-polypyrrole (BHF-Ppy)20,23 and PANI-Ag/ZnS nanoparticles 24 ). Although these materials achieve high attenuation values, the carbon-based nanocomposite materials present some advantages over those strategies, such as longer-term chemical stability than the conducting polymers,21,22 and act mainly as EMI absorbents, not reflecting and causing secondary EMI pollution.21,25,26
The MWCNT is another nanomaterial based on sp 2 -hybridized carbon. In MWCNT, the carbon atoms form tubes with a diameter in nanoscale and length lengths that can vary from hundreds of nanometers to several centimeters. 22 The MWCNT are already commercial, 27 and their different grades vary on their configuration, length of the nanotubes, number of walls, and presence or type of functionalization, for example. Both GNP and MWCNT have advantages like chemical resistance, thermal stability, and high electrical and thermal conductivities, making them excellent candidates to promote electromagnetic properties in polymer matrices. However, the addition of these two fillers with such different shapes and aspect ratios promotes different behaviors of polymer matrices.
The addition of lower content of MWCNT is needed to improve the mechanical, electrical, and EMI SE properties of the polymer matrices. Once its 1D linear shape facilitates the mechanical and electrical percolation threshold, it is better than the 2D plate shape of GNP. 28 Otherwise, the GNP has the advantage of allowing higher contents (around 20 wt%) without increasing the matrix viscosity significantly. That is critical for the traditional melt mixing process. GNP also has the potential to reduce the nanocomposite production costs compared to MWCNT since it is produced from natural graphite.4,28 Furthermore, according to some studies, the use of both carbon nanoparticles together in hybrid GNP/MWCNT nanocomposites could be an alternative way to achieve the synergistic effects of these fillers. The synergy effect between GNP and MWCNT is primarily associated with their complementary shape that may form 3D nanostructures18,21,22,29–31 in polymer matrices that are especially advantageous for EMI SE.18,32–34
Hybrid nanocomposites can be prepared using different polymer matrices such as thermoplastics,30,32–37 elastomers, 38 and thermosets.39,40 Especially for electronic component housings, PC and PC polymer blends are highlighted for the preparation of hybrid nanocomposites due to possible π-π bonds interaction between the PC’s polymer chains and both fillers.10,18,22,41–43
Seeking to improve the electrical conductivity, Xiao et al. 30 pointed out that the addition of MWCNT on GNP nanocomposites improved the electrical conductivity, drastically reducing 10 times the filler content to achieve the electrical percolation threshold in polyvinylidene fluoride (PVDF)/GNP nanocomposites. 30 For EMI SE, many works pointed out that adding around 1.5–3.0 wt% of MWCNT into polymer/GNP nanocomposites might lead to commercial levels of EMI SE.18,32–34
In our previous work, the properties of MWCNT, 44 GNP, 9 and hybrid of GNP/MWCNT 45 systems as nanofillers for PC/ABS blend melt mixed nanocomposites were studied. These works were conducted using the same GRM product. However, with the advancement of research and classification of GRM, in this present work, we are proposing to evaluate the effect of MWCNT addition to improve the electrical and EMI SE properties of PC/ABS/GRM nanocomposites obtained with three different GRM, with different numbers of layers/thickness and lateral size. This study seeks to understand the effect of each parameter associated with the different GRM on the electrical and electromagnetic properties of the processed nanocomposites.
Experimental
Materials
Three different GRM samples were used to evaluate the effect of the lateral size and thickness of the GRM nanoparticles on the properties of the nanocomposites:
GRM1
Nanographite supplied by the MGgrafeno® Project (Belo Horizonte, Brazil), produced by mechanical exfoliation of natural graphite with a lateral size smaller than 200 μm, thickness higher than 3 nm, and purity of 98%. According to the suppliers, this material is a subproduct of few-layer and GNP materials.
GRM2
Graphene nanoplatelets supplied by the MGgrafeno® Project (Belo Horizonte, Brazil), produced by mechanical exfoliation of natural graphite in a liquid medium. This GRM possesses an average lateral size of 1 μm, 6–10 layers, centered at 6 (average thickness of 2 nm), and purity of 94%.
GRM3
Commercial nanofillers supplied by Cheaptubes® (USA) with the name graphene nanoplatelets, produced by chemical exfoliation of natural graphite, with lateral size dimension higher than 2 μm, average thickness of 8–15 nm, and purity of 97%.
Comparison of the graphene related materials (GRM) specifications and classification according to the ISO/TS 21356-1:2021. 46
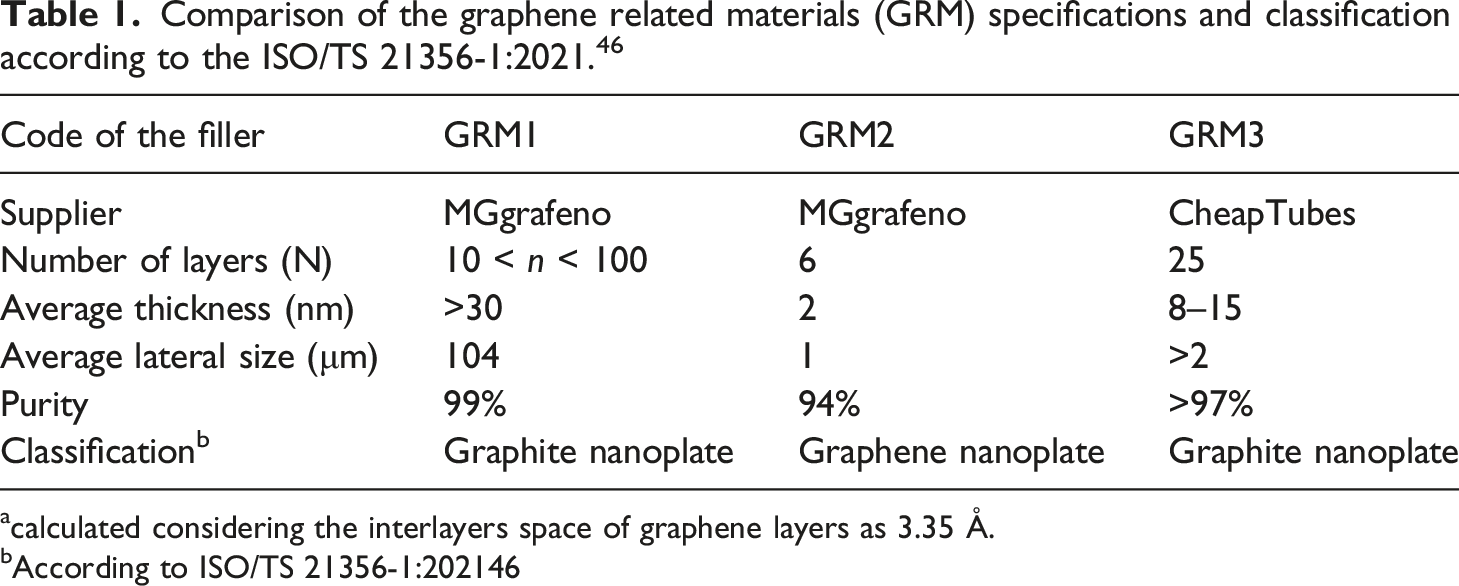
acalculated considering the interlayers space of graphene layers as 3.35 Å.
bAccording to ISO/TS 21356-1:202146
Only a single grade of MWCNT, NC 7000 supplied by Nanocyl S.A. (Belgium), was chosen to mix with those GRM materials. The NC 7000 material was produced by chemical vapor deposition (CVD) with an average length of 1.5 μm, an average diameter of 9.5 nm, and a minimum purity of 90%.
The PC/ABS blend was prepared with commercial-grade polymers: polycarbonate (PC) (UNIGEL- Durolon IR-2200, Brazil), with an MFI of 12.0 g/10 min (300°C/1.2 kg) and density of 1.20 g/cm3; and the acrylonitrile-butadiene-styrene copolymer (ABS) (TRINSEO - Magnum 3404, USA) with an MFI of 2.0 g/10 min (230°C/3.8 kg) and density of 1.05 g/cm3.
Nanocomposites processing
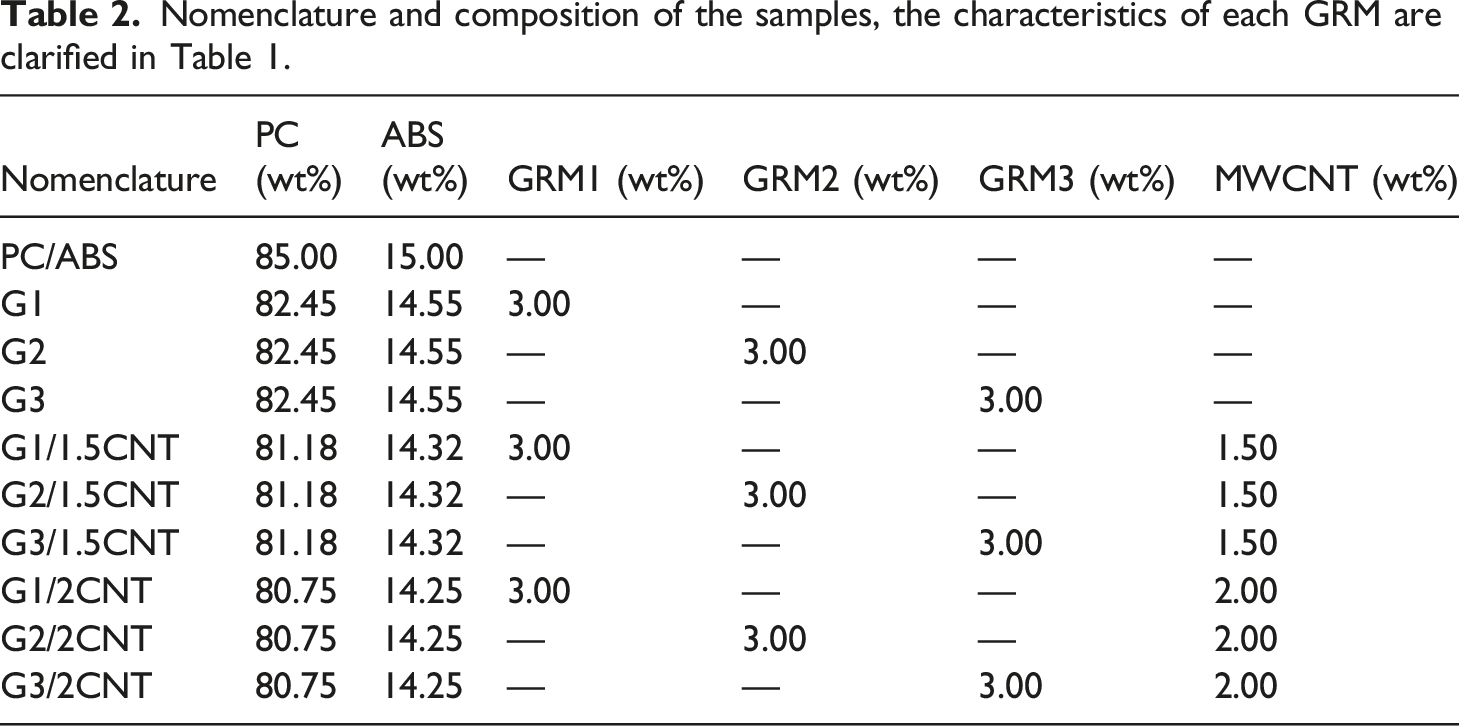
Nomenclature and composition of the samples, the characteristics of each GRM are clarified in Table 1.
The extrusion process was performed in two steps: First, PC masterbatches were prepared by adding the nanofillers (GRM and MWCNT). In a second extrusion step, the PC masterbatches were mixed with the ABS. This blending protocol was adopted based on our previous work, seeking an adequate dispersion of the fillers at the PC phase of the matrix. 44
Polycarbonate and ABS were dried in a vacuum oven for 4 h at 90°C before processing. The extrusion processes were performed in a co-rotational twin-screw extruder with D = 16 mm and L/D = 40 mm (AX Plásticos, model AX16:40DR). The extrusion parameters were fixed as screw speed of 80 r/min, the temperature profile of 225/235/245/245/255°C (from feed zone to die), feeding screw speed of 15 r/min, for both extrusion steps, and pelletized at maximum speed (80 r/min).
After the extrusion process, the pellets were dried in a vacuum oven at 100°C for a minimum period of 4 h. Finally, the pellets were molded by the injection molding process in a Battenfeld (35 ton) injection machine as rectangular tests specimens, with the process parameters set as injection speed of 42 cm³/s, profile temperature of 270/280/290°C, and a mold temperature of 70°C (Figure S1 – supplementary material).
Characterization of the nanocomposites and raw materials
X-ray diffraction
A Rigaku diffractometer (model Ultima IV) with CuKα radiation (λ = 1.54056 Å) and a filter of Nickel for Kβ was used to analyze the diffraction patterns of the GRM, MWCNT, the PC/ABS blend, and the nanocomposites. The set parameters were 2 ϴ range from 5° to 90°, speed of 10°/min, the tension of 40 kV, and electric current of 30 mA. From the X-ray diffraction patterns, the average number of graphene layers in the GRM materials and in the nanocomposites was obtained as a ratio of the distance between the layers (dhkl, calculated with Bragg’s law (equation (1))) and the average thickness size (Dhkl, calculated from Scherrer equation (equation (2)))
47

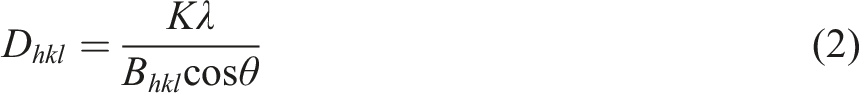
In equation (2), D hkl represents the average thickness size, K is a constant associated with the crystalline structure, normally taken as 0.9 due to the graphitic planar structure. 47 B hkl represents the full width at half maximum (FVHM) of the graphitic diffraction peak.
Morphological characterization using field emission gun scanning electron microscopy (FEG-SEM)
The morphology of the injection-molded samples of PC/ABS blend, nanocomposites, and GRM powders was evaluated using a TESCAN - MIRA3 field emission gun scanning electron microscope, operating at 5 kV. First, the GRM powder samples were dispersed in acetone with sonication, and then, a drop of that solution was placed onto the stubs. For the injection-molded samples, the preparation followed the procedure: first, a perpendicular notch of 5 mm was done in the perpendicular injection-flow direction; second, the notched samples were cooled with liquid nitrogen for 15 min; then, a cryogenic fracture was done in the same direction of the notch; and finally, the sample was placed onto the stub with a carbon tape and coated with a thin layer of gold by sputtering.
Rheological characterization in the oscillatory regime
A stress-controlled rotational rheometer from Thermo Scientific, model HAAKE RheoStress 6000 (model ARG2), was used to analyze the rheological behavior of the PC/ABS blend and the nanocomposites. First, a stress sweep test was performed to select the stress amplitude value inside the linear viscoelastic range (30 MPa for all samples).
The analyses were performed under an inert nitrogen atmosphere with parallel-plates geometry (20 mm of diameter and gap of 1 mm) at 260°C. The complex viscosity (η*), shear storage modulus (G′), and shear loss modulus (G′′) were measured in frequency sweep experiments (between 0.01 and 100 rad/s).
Broadband dielectric spectroscopy (impedance spectroscopy)
Impedance spectroscopy measurements of the PC/ABS blend and the nanocomposites were performed in a Solartron SI 1260 impedance analyzer, operating at a voltage amplitude of 0.5 V at room temperature. The volumetric electrical conductivity on alternating current (AC) and the complex permittivity (ε*) were evaluated in the frequency range of 10–105 Hz.48,49
Injection-molded samples with a thickness of 3.0 mm–3.5 mm were obtained by cutting injection-molded rectangular specimens in two different directions (perpendicular and parallel to the injection-mold flow) once the literature indicates anisotropy for injection-molded MWCNT-containing nanocomposites.
50
Gold layer electrodes were deposited by sputtering on both parallel faces of the samples. From the real (Z′) and imaginary (Z′′) impedance components, the following mathematical considerations were done to calculate the AC electrical conductivity (σAC)48,49

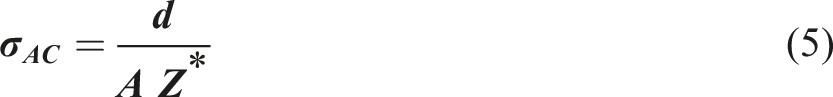

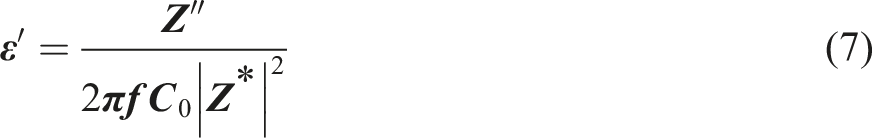
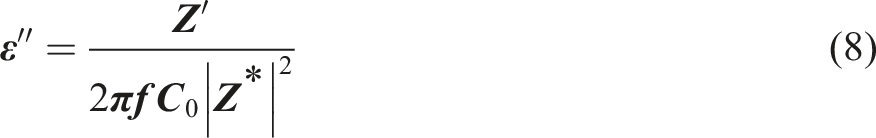
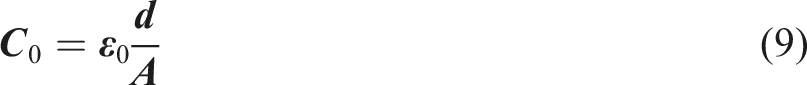
In equations (6) to (9), ε0 represents the vacuum permittivity (8.854 × 10⁻¹² F/m), the ε′ the real component of the complex relative permittivity, ε′′ the imaginary component of the relative permittivity, and C0 represents the geometric free-space capacitance.
Electromagnetic interference shielding effectiveness
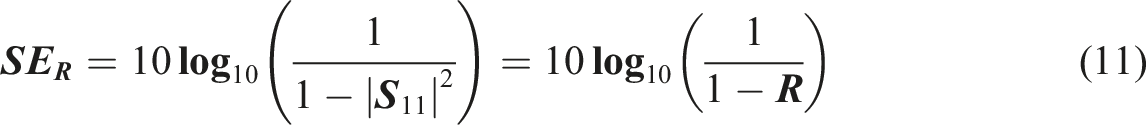
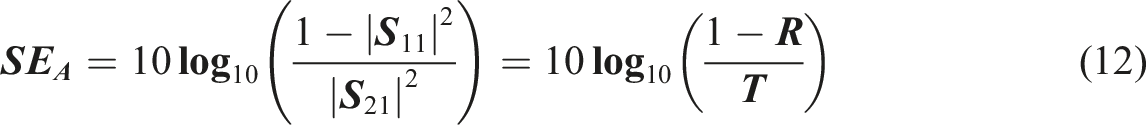
The EMI SE and the dielectric analysis (relative permittivity (εr) and relative permeability (μr)) in the X-band (8.2–12.4 GHz) of injection-molded samples were measured in a vector network analyzer (VNA, Agilent Technologies, model PNA-L N5235 A) with a coupled waveguide (WR-90) (Figure S2 – supplementary material). The sample thicknesses were 3.5 ± 0.1 mm. The complex scattering parameters S11 and S21 were obtained from the analyses, correlated to the reflectivity (R) and the transmissivity (T) of the waves through the specimen, respectively. From the complex scattering parameters, the total shielding effectiveness (SET), reflection shielding effectiveness (SER), and absorption shielding effectiveness (SEA) were calculated according to equations (10)–(12):
45
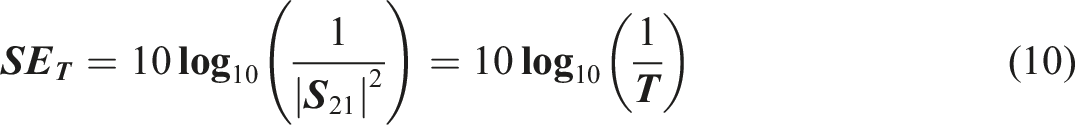
The multiple internal reflections shielding effectiveness (SEM) component was neglected.
Results and discussion
X-ray diffraction and FEG-SEM of the raw materials and the nanocomposites
Figure 1(a) presents the X-ray diffractograms of the three GRM samples. The higher peak observed for all three materials was centered near 2θ = 26.5°, which could be associated with a typical graphitic structure with interlayer spacings close to 3.354 Å.51,52 Although GRM1 and GRM2 presented diffractograms similar to those of graphite structure,
53
the main peak of GRM1 is slightly narrow than GRM2 one and is dislocated to the right, which indicates a smaller dhkl and a higher average thickness associated with the Dhkl parameter, as shown in Table 3. (a) X-ray diffractograms of raw GRM1, GRM2 and GRM3 materials, (b and c) FEG-SEM images of GRM1, (d and e) FEG-SEM images of GRM2, and (f and g) FEG-SEM images of GRM3. Results obtained from X-ray diffraction of the raw GRM and the nanocomposites.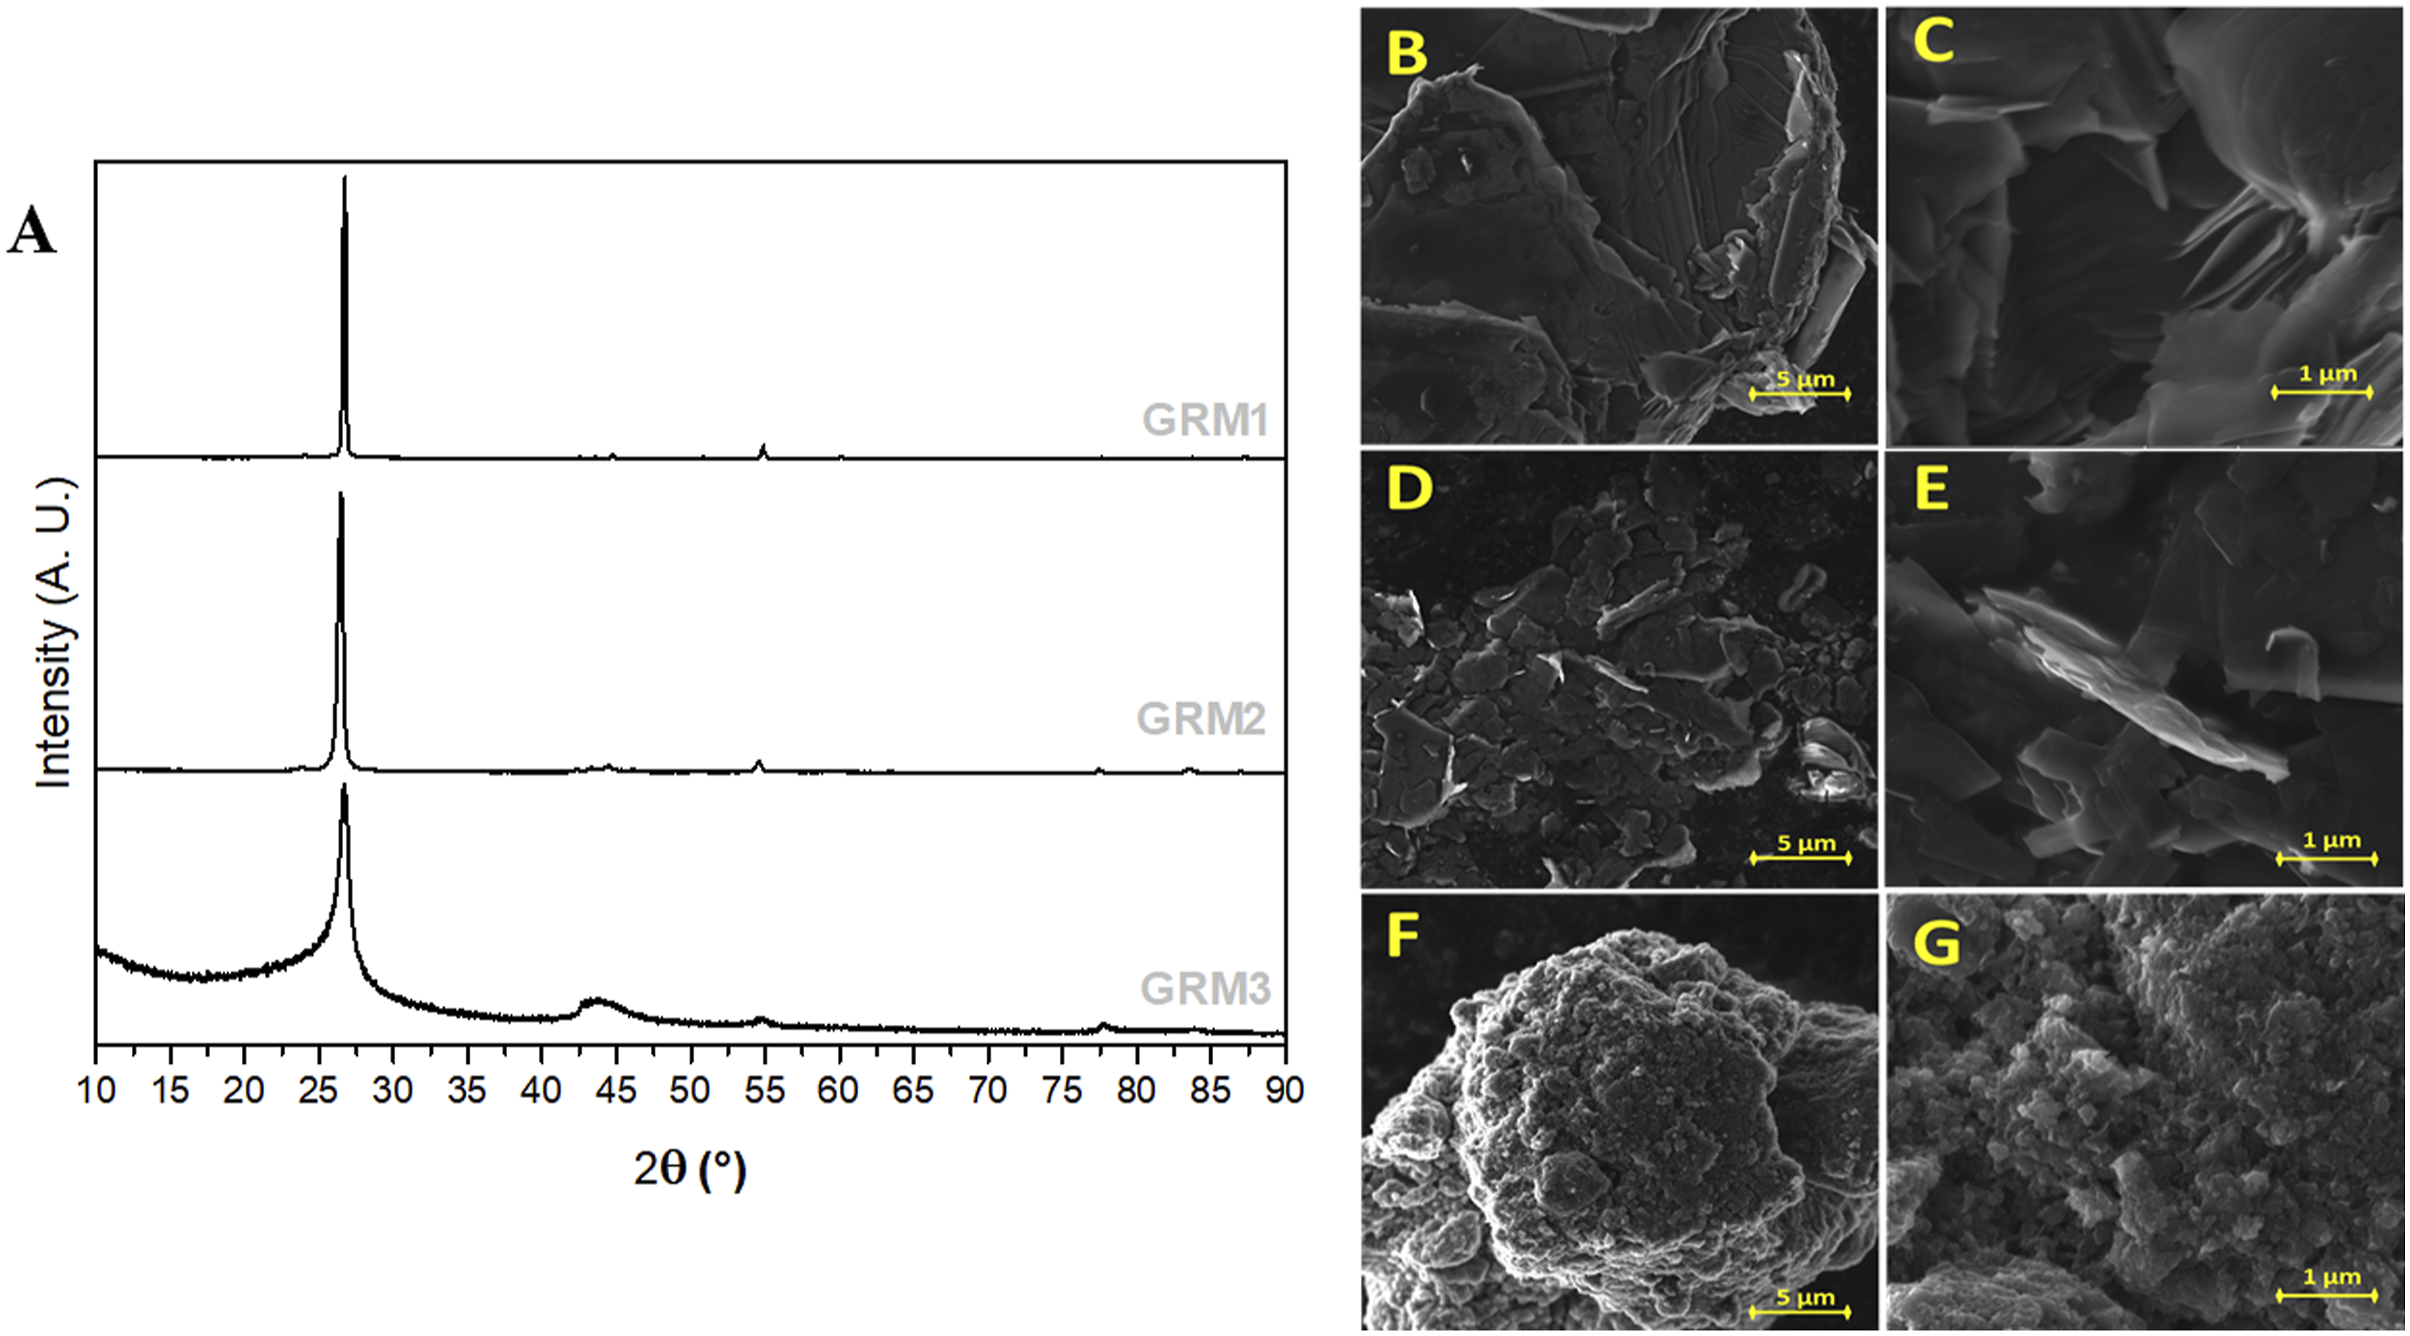
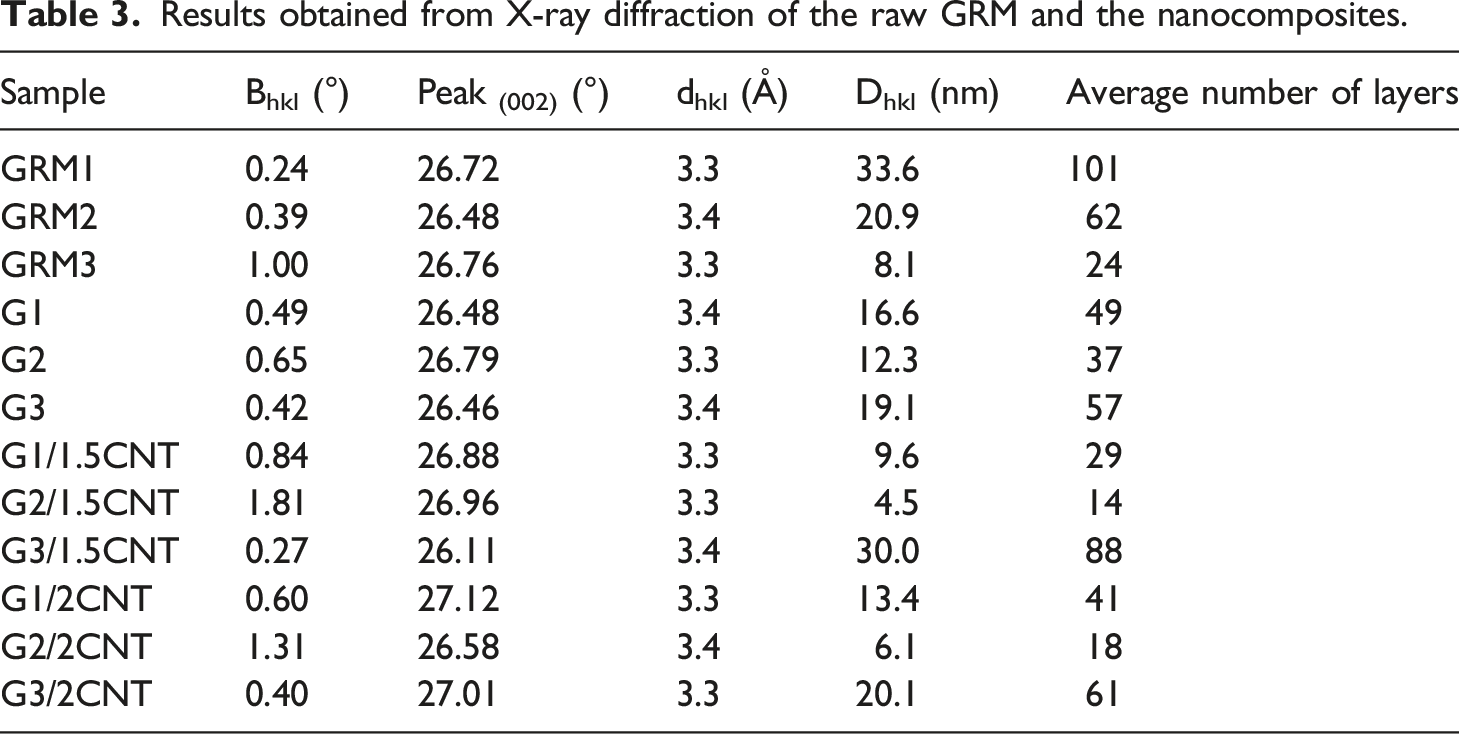
According to the supplier, the GRM2 was classified as GNP and presented a thickness of around 1–3 nm. The Dhkl of 20.9 nm calculated from the Scherrer equation (equation (2)) can be related to the agglomeration of many GNP particles in the raw powder or to the lower purity of that GRM, which contains at least 6% of other graphitic materials. The diffractogram of GRM3 was closer to that of a graphene-like material, showing the presence of a wider main peak associated with a smaller Dhkl of 8.1 nm compared to the other GRM materials.51,52 Therefore, it can also be related to the higher purity of GRM3, higher than 97%, obtained by the chemical exfoliation process.
Field emission gun scanning electron microscopy images of each raw powder of GRM corroborate with these data. GRM1 and GRM2 presented a structure similar to GRM in other works,22,35,54 where it was possible to observe higher stacks of nanographite plates with many different sizes with gaps between them (Figure 1(b) and (c)). In addition, for GRM2, the GNP particles observed on the top of stacks had smaller and flatter surfaces with a smaller average thickness than the GRM1 particles. The GNP particles were probably agglomerated during the drying processes due to their elevated superficial area (Figure 1(d) and (e)). Finally, analyzing Figure 1(f) and (g) for the GRM3, many particles are observed, some smaller than 1 μm, sticking together, forming irregular surface agglomerates, which can be associated with the chemical process exfoliation applied in the production process.
Figure 2 shows the diffractograms for the PC/ABS blend and nanocomposites. For all compositions, the amorphous peak corresponding to the PC/ABS polymer blend regions was observed around 2θ = 17°.
22
Typical graphitic (002) peaks around 2θ = 26–27° was observed for all nanocomposites indicating the presence of GRM nanoparticles. Furthermore, the shape distortions and the small shifting in the positions of the 26–27° peaks in the nanocomposites XRD patterns compared to those of GRM neat powders can be related to interactions between the GRM, MWCNT, and/or the polymer matrix.
18
Consequently, these peak changes might be associated with the dispersion of the fillers into the polymer matrix and with the MWCNT addition.
38
X-ray diffractograms for the PC/ABS blend and the nanocomposites.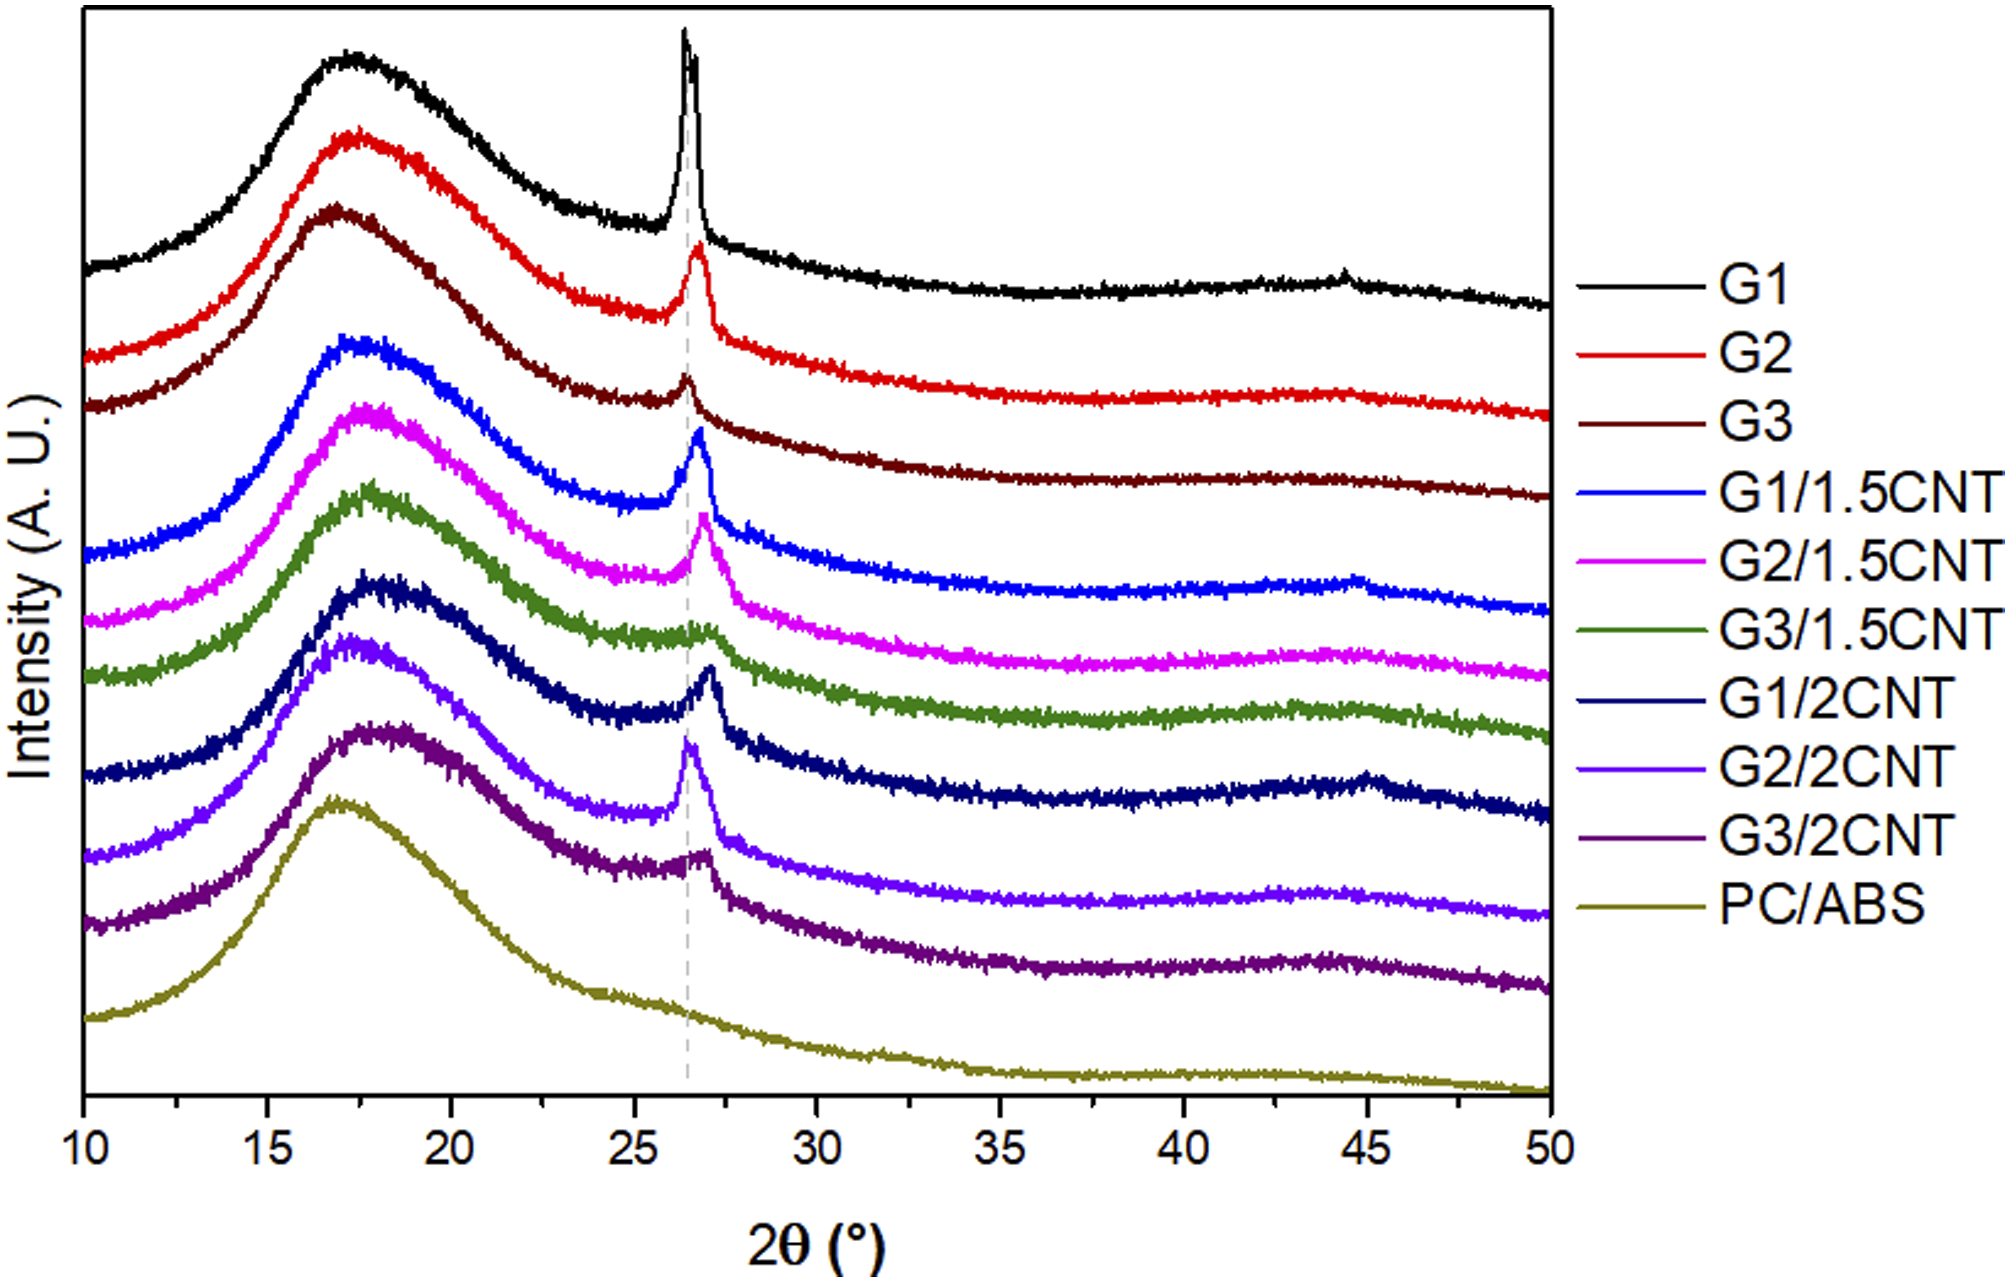
The lattice spacing parameter and the thickness of GRM nanoparticles or GRM agglomerates were calculated from equations (1) and (2), respectively, and are shown in Table 3. First, it was observed that the two-step extrusion process results in a significant additional exfoliation of GRM1 and GRM2 inside the polymer matrix, which was expressed by the changes in the average number of layers going from 101 (GRM1) to 49 layers (G1) and 62 (GRM2) to 37 layers (G2). For GRM3-based composite, however, the average number of graphene layers doubled from 24 in GRM3 to 57 in G3. A hypothesis for explains this result may be related to the presence of high content of GRM3 agglomerates in the extrusion process that could be contributing to the compaction of the layers or even might be associated with the presence of functional groups introduced during the chemical exfoliation production process of the GRM3 material. The chemical exfoliation process leads to the formation of functional groups as carbonyl (C = O) and hydroxyl (-OH) at the GRM3 surface, for example, which might lead to a higher attraction between GRM3 nanoplatelets and a strong tendency to restack and agglomerate inside the polymer matrix. 38 The same trend was observed for the hybrids G3/1.5CNT and G3/2CNT.
The addition of MWCNT improved the dispersion of GRM1 and GRM2 nanoparticles. As a result, the average number of layers decreased for the hybrid GNP/MWCNT when compared to binary G1 and G2 nanocomposites. The additional exfoliation of graphene stacks in the hybrid nanocomposites may be explained by two factors as observed by Araby et al. 38 for ethylene–propylene–diene monomer rubber (EPDM)/GNP/MWCNT melt mixed nanocomposites. The first factor is the attachment of MWCNT and GRM nanoparticles through π-π interactions, which inhibits the restack between the graphene nanoplatelets; and the second factor is the increase of melt viscosity of the matrix with the MWCNT addition, which increases the shear stress transfer at the extrusion process making it powerful to disperse the graphene stacks. 38
Figure 3 shows the FEG-SEM images of the PC/ABS blend. The immiscibility of the PC/ABS blend was confirmed with the multi-phasic structure for the blend, with ABS domains dispersed in a PC matrix (Figure 3(a)–(c)).9,44,55 PC presents a higher melt viscosity than ABS, so, during melt mixing, the blend ratio (85/15) and the viscosity ratio (ratio between melt viscosity of the dispersed phase (ABS) and melt viscosity of the matrix (PC)) contribute to the adequate dispersion and distribution of the ABS domains, that have mainly a submicrometric size (>2 μm).
55
SEM-FEG images of the PC/ABS blend with different magnifications.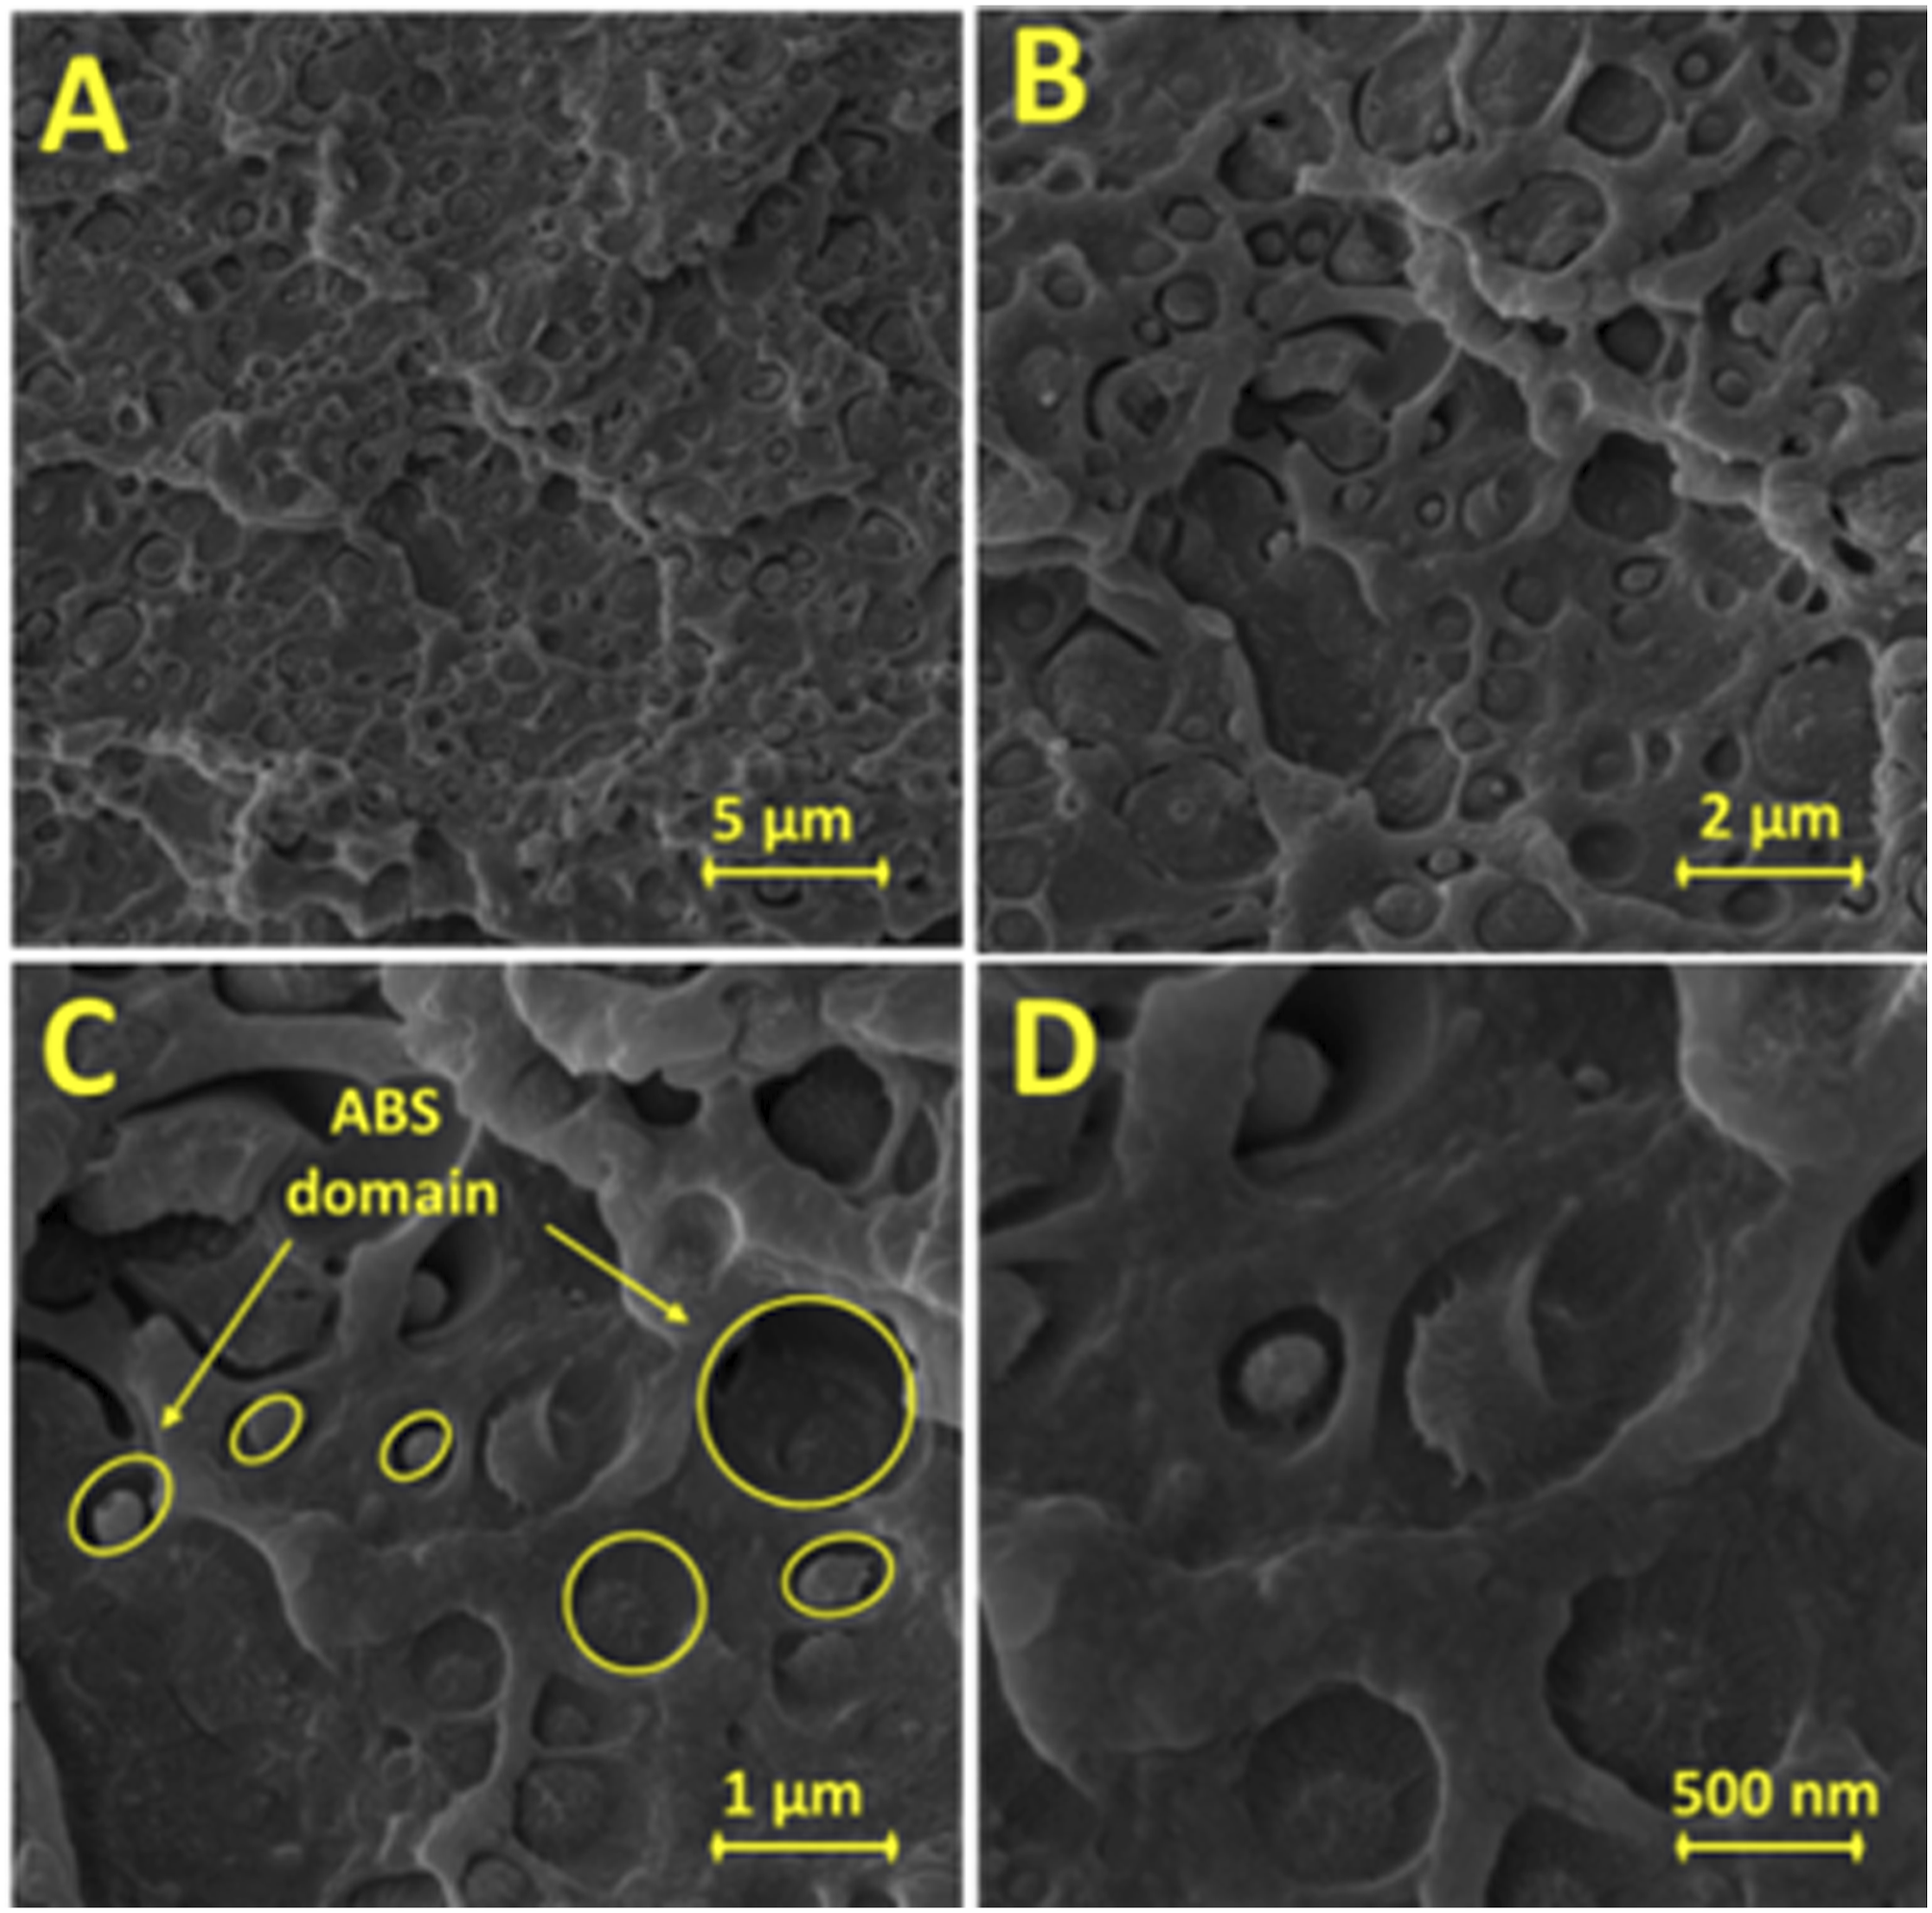
Figure 4 presents the SEM-FEG images of the PC/ABS/GRM nanocomposites with the GRM indicated by yellow arrows. The G1 nanocomposites presented stacks of graphite with an enormous lateral size (>5 μm), higher than the ABS phases dispersed in the PC matrix. Those clusters of graphite were distant from each other, and the plates were preferentially aligned with the injection-mold flow direction.
9
Also, it is observed gaps between the nanoplatelets (Figure 4(a)–(c)). Figure 4(d)–(f) present the FEG-SEM images for the composition G2, and the GRM2 appeared to be well dispersed and distributed inside the matrix, and a thinner thickness could be observed compared with the raw GRM2 as the suppliers' specification (Figure 1(d) and (e)). The G3 nanocomposite (Figure 4(g)–(i)) presents a morphology with the GRM3 covered by the polymer matrix, indicating a stronger interface related to the possible presence of polar groups in the GRM3 surface. SEM-FEG images: (a–c) - G1 nanocomposite (PC/ABS/GMR1), (d–f) - G2 nanocomposite (PC/ABS/GMR2), and (g–i) G3 nanocomposite (PC/ABS/GMR3). The SEM-FEG images of the same samples present different magnifications.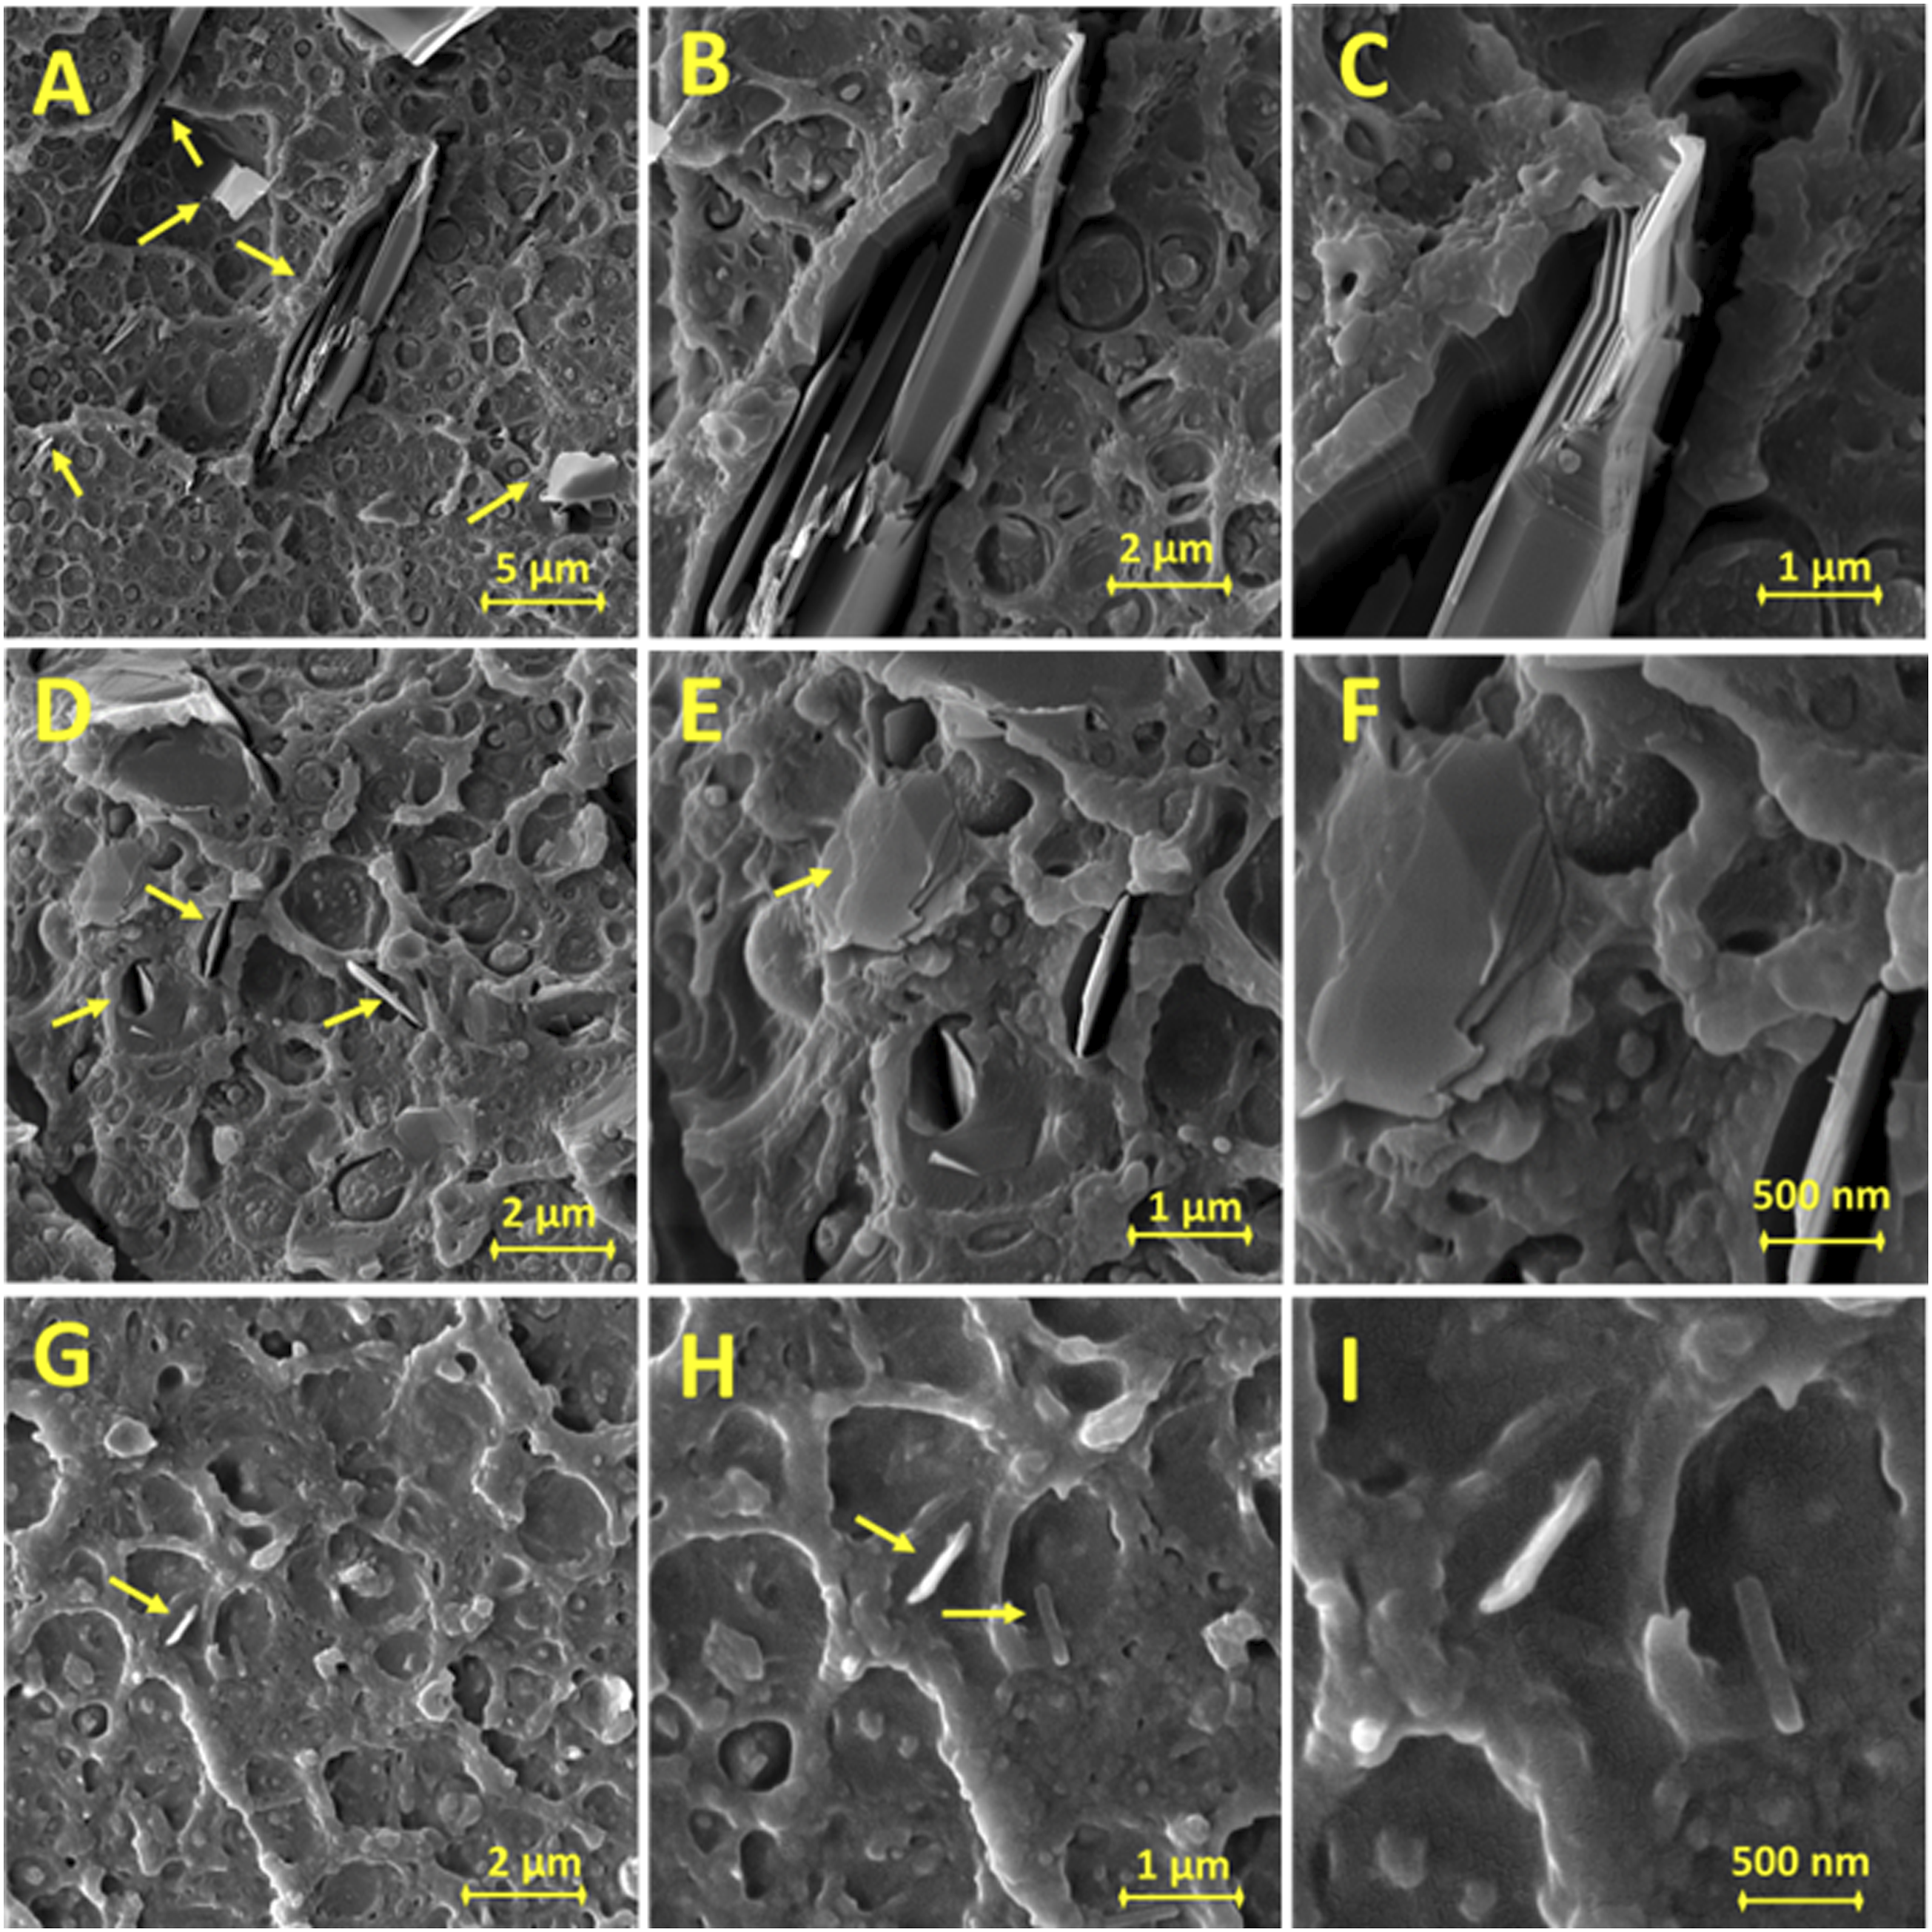
The morphologies of the hybrids with 1.5 wt% of MWCNT are shown in Figure 5, with the MWCNT pointed by red arrows. The MWCNT was well dispersed into the PC/ABS matrix in polymer phases for all hybrid nanocomposites. As expected, many MWCNTs were localized close to the GRMs due to their chemical similarity and possible π-π interactions.
30
For the G1/1.5CNT nanocomposite, the stacks of graphite with large lateral sizes were observed with some MWCNT around them (Figure 5(a)–(c)). In the G2/1.5CNT nanocomposite, the GRM2 were well dispersed with small thickness, and MWCNT was observed close to the GRM2 nanoplatelets also in contact with them (Figure 5(d)–(f)). The GRM3 was better observed in the G3/1.5CNT nanocomposite with an intermediate lateral size and thickness; the nanoplatelets were better dispersed, with the MWCNT close to them and dispersed along with the PC/ABS matrix (Figure 5(g)–(i)). Similar morphologies were observed for the hybrid nanocomposites with 2.0 wt% MWCNT (Figure S3 – supplementary material). SEM-FEG images: (a–c) - G1/1.5 nanocomposite (PC/ABS/GMR1/MWCNT), (d–f) - G2/1.5 nanocomposite (PC/ABS/GMR2/MWCNT), and (G, H, and I) G3/1.5 nanocomposite (PC/ABS/GMR3/MWCNT). The SEM-FEG images of the same samples present different magnifications.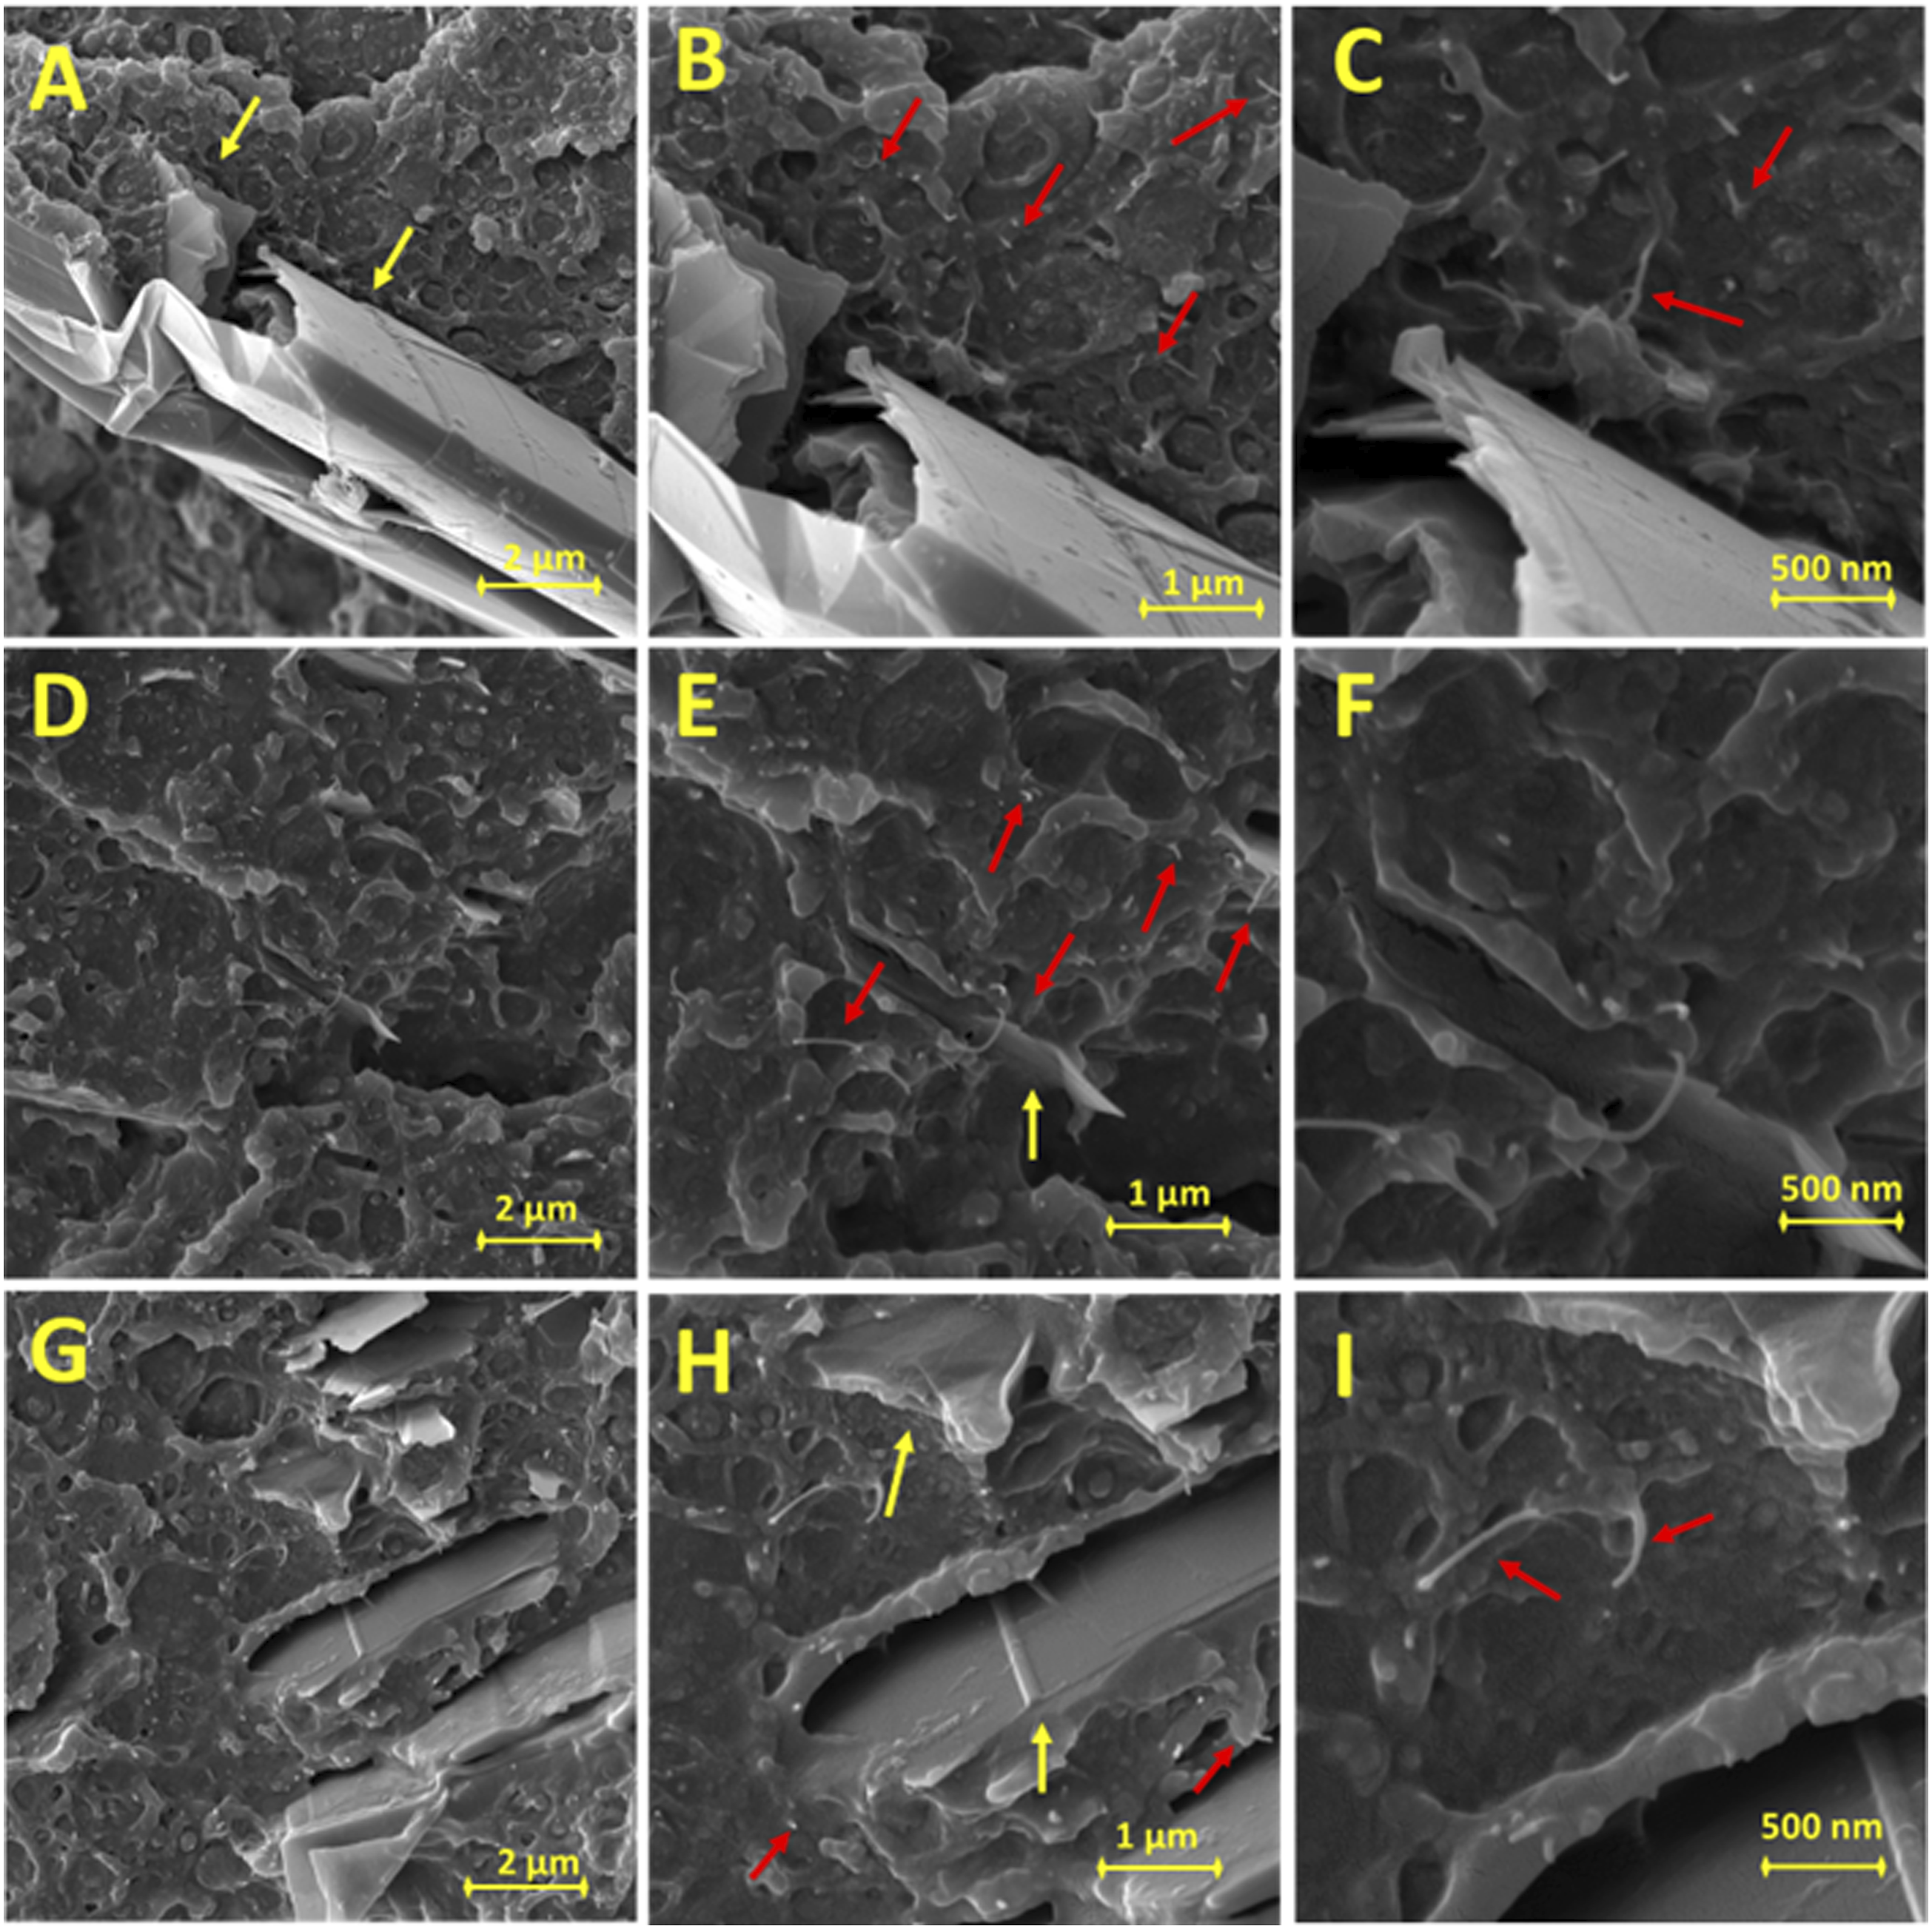
Correlation of rheological behavior and the morphology of the nanocomposites
The oscillatory rheological behavior was analyzed to complement and to understand the formation of the morphology. Evaluations focusing on lower frequency values of this behavior can be related to the dispersion, distribution, and interaction of the nanofillers into the polymer matrix.56–59 This behavior is shown in Figure 6, and it is presented in terms of the complex viscosity (η*) and the Cole-Cole plot of shear storage moduli (G′) and shear loss moduli (G′′) for all compositions. Oscillatory rheological behavior: (a) complex viscosity (η*), (b) Cole-Cole plot of shear storage modulus (G′) and shear loss modulus (G′′) for all compositions.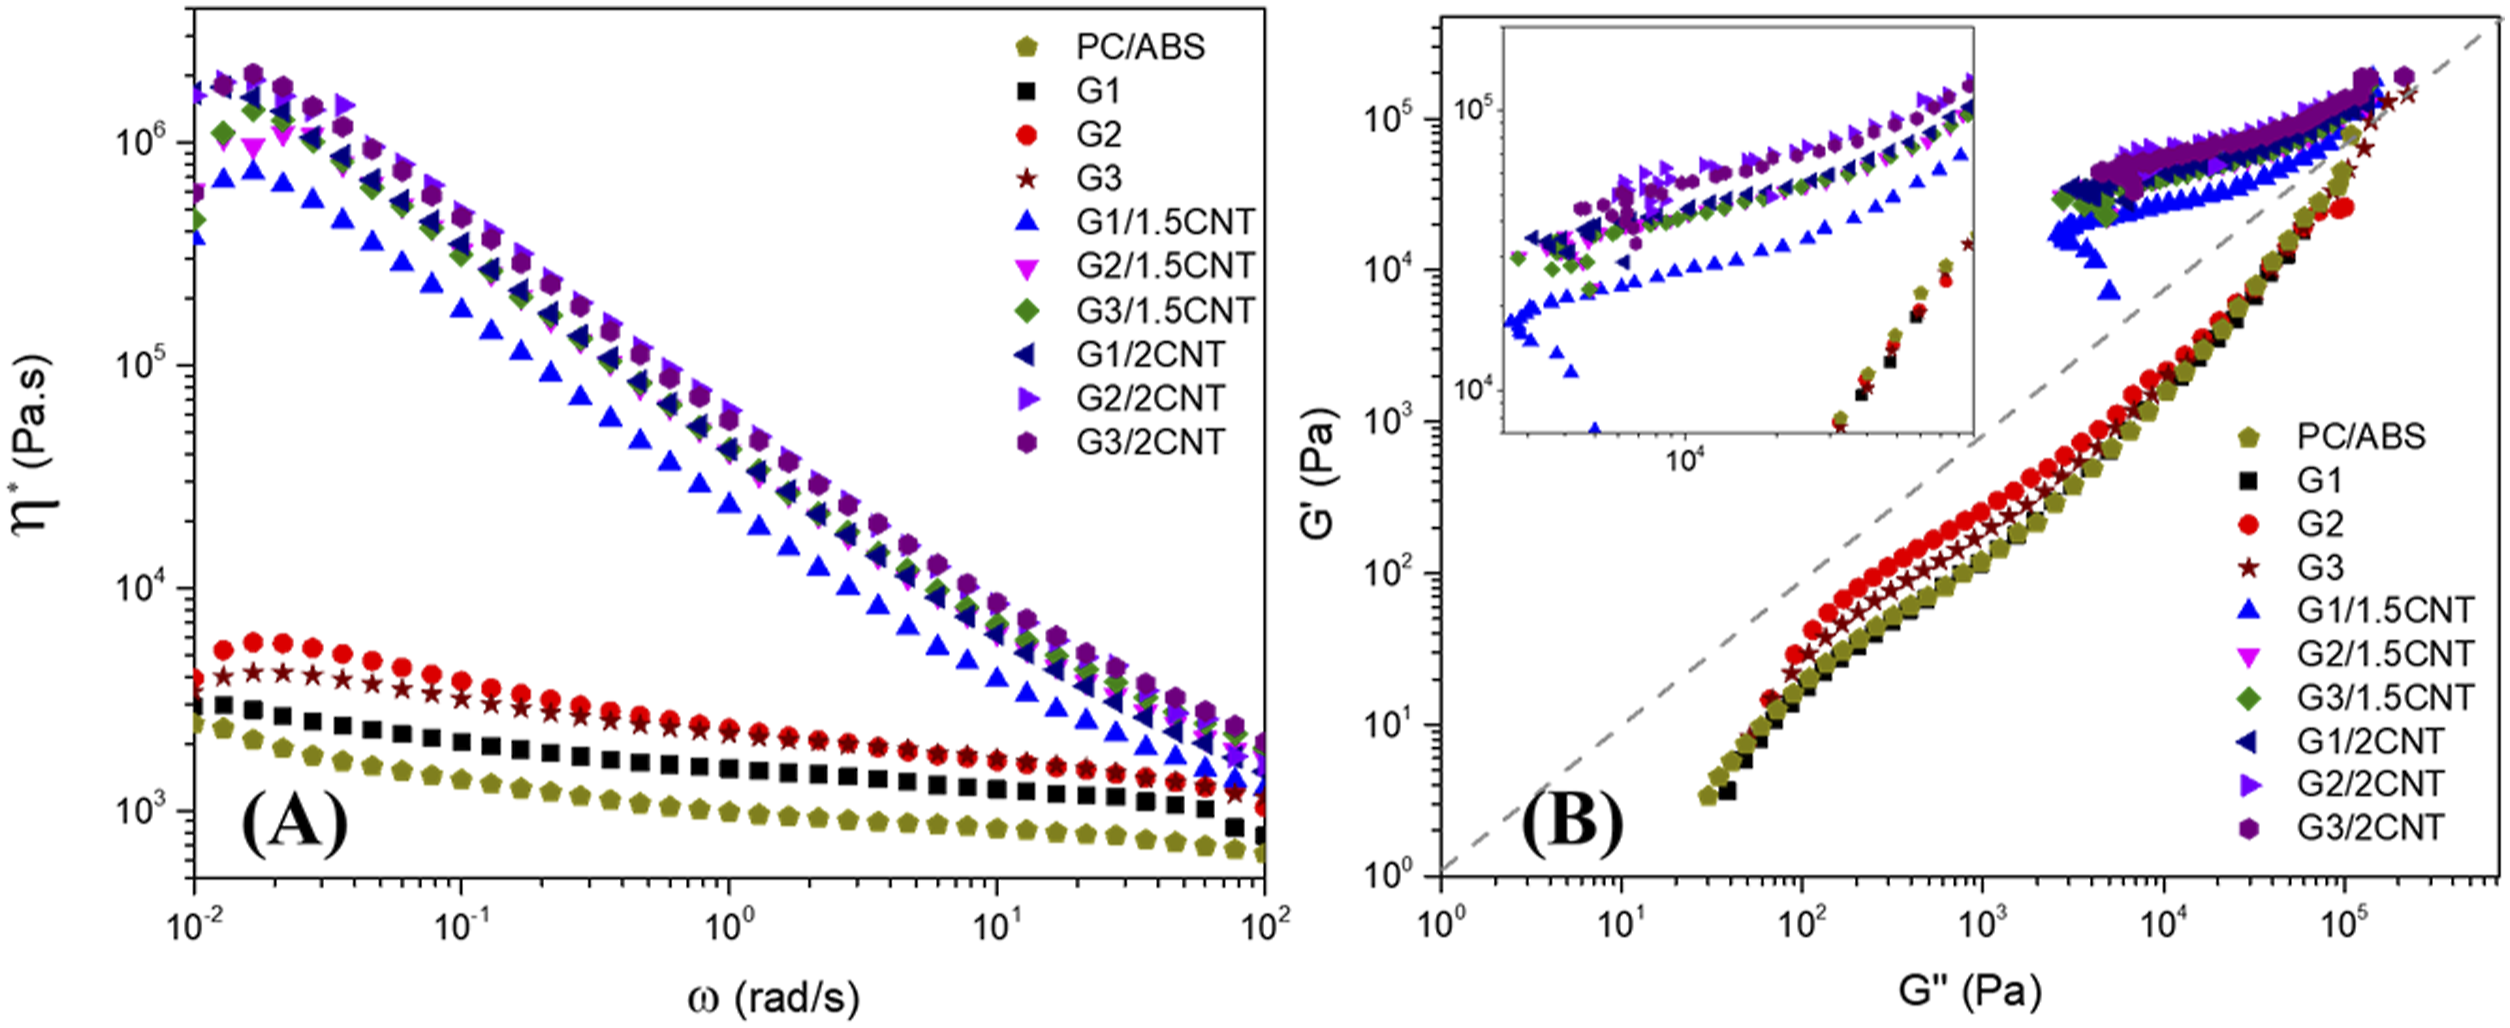
Analyzing Figure 6(a), it is possible to observe that the addition of all the GRM slightly increased the viscosity of the nanocomposites preserving a Newtonian-like behavior; once those nanofillers appear to be aligned to the shear flow direction due to their plate-like shape. 9 The addition of 1.5 wt% of MWCNT increased around one hundred times the η* values for lower frequencies in the hybrid nanocomposites. There are two effects of MWCNT addition that might be related to these changes: the MWCNT high entanglement with the matrix polymers chains due to its tube-like shape 60 ; and the interactions type π- π of the carbon atoms chemical bonds, between the GRMs and the MWCNT, due to its chemical similarity, forming a 3D network into the matrix for the hybrid nanocomposites. 30
In the Cole-Cole plot (Figure 6(b)), the addition of the GRM had a lower influence in the G′ component, maintaining the liquid-liked behavior (G′′ > G′) of the PC/ABS matrix. In addition, comparing the G1 with the other two GRM nanocomposites (G2 and G3), the increment into the complex viscosity was lower, which might be related to the large lateral size and thickness of the GRM1 that promotes less interfacial interactions between the nanoplatelets with the polymers chains when compared to the other two GRM, which would also affect these nanocomposites mechanical properties. 54 The addition of 1.5 wt% of MWCNT also changes the behavior for solid-like (G′ > G′′) for the hybrid nanocomposites, with a significant increase in both shear moduli components.
Supplementary, the nanocomposites G1/1.5CNT and G1/2CNT presented lower η* and shear moduli values than the other nanocomposites with the same MWCNT content. Again, that might be related to the larger lateral size and lower surficial area that reduces the possible interactions of those fillers with the polymer chains of the matrix and with MWCNT as well. Finally, all the rheological properties evaluated converge to the same values in higher frequency values, where the behavior is mainly influenced by the polymer matrix behavior dependence of the higher shear rates for those frequency values. 58
Broadband dielectric properties
The dielectric spectroscopy analyses could be a powerful technique to evaluate the complex electrical properties of polymer nanocomposites with MWCNT that might correlate to the dispersion, distribution, and process conditions of the MWCNT.49,61,62 Specifically for injection-molded nanocomposites with the addition of MWCNT, recent studies suggested the possibility of an anisotropy generated by the high shear flow of this process.48,63 Therefore, the broadband dielectric spectroscopies of the nanocomposites in the 101–106 Hz frequency range were performed to obtain the electrical conductivity AC (Figure 7), and the Complex Relative Permittivity (Figure 8) in two different directions of the materials studied (σx in the direction parallel to the injection molding flow and σy in the direction perpendicular to the injection molding flow). Dielectric spectroscopy results in volumetric conductivity AC by frequency obtained by impedance spectroscopy: (a) σx in the parallel direction to the injection molding flow and (b) σy in the perpendicular direction to the injection molding flow of the samples. Complex Relative Permittivity (ε*) by frequency obtained by dielectric spectroscopy of PC/ABS blend and the nanocomposites: (a) in the parallel direction to the injection molding flow and (b) in the perpendicular direction to the injection molding flow of the samples.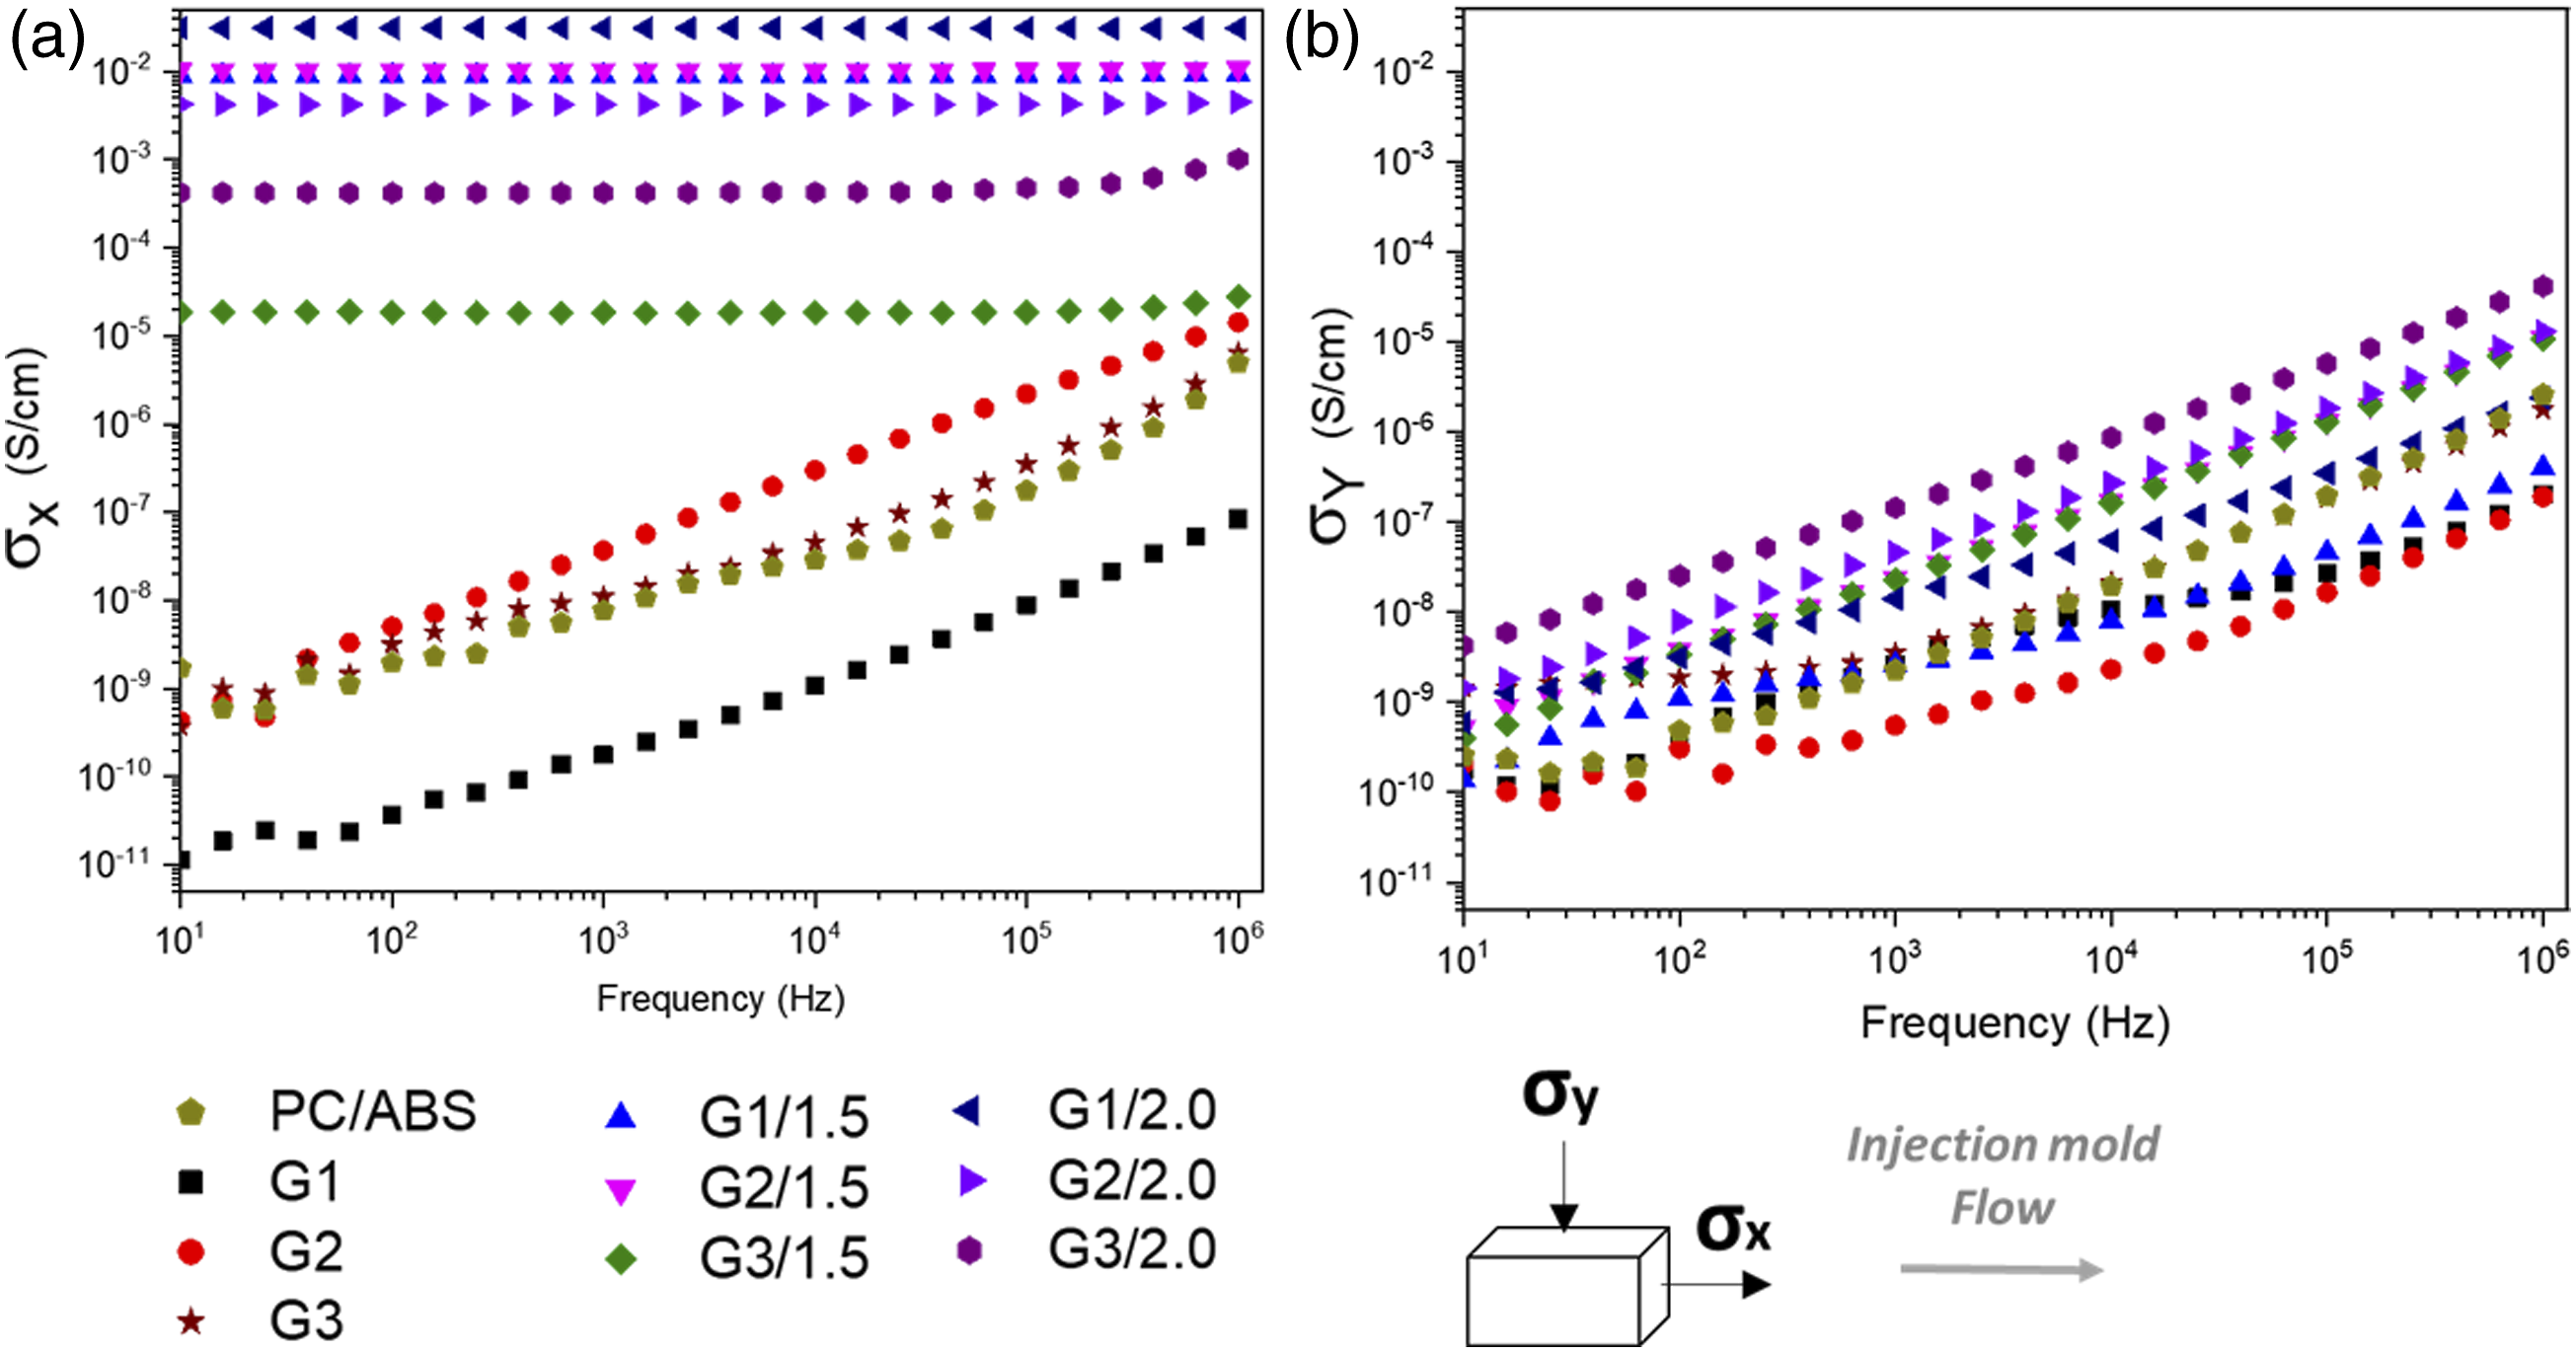
The AC electrical conductivity (σAC) of the nanocomposites presented anisotropy, with the injection molding flow direction being preferential to the formation of the electrical percolation threshold of both fillers (GRM and MWCNT). According to the literature, the high shear promoted by the injection molding flow in the perpendicular direction (Y) can difficult the formation of electrical percolation paths. 48 For the injection mold flow direction (X), in order to obtain an optimal configuration of nanofillers in the polymer matrix that forms an electrical percolation path where the graphene nanoplatelets and MWCNTs form a three-dimensional structure. Which the injection molding process interferes in the formation of this morphology since it can favor the orientation of the graphene nanoplatelets in the direction of the molding flow, hindering or even destroying the ideal three-dimensional formation. 48 Thus, significant changes in electrical properties can occur when measured in different directions of injection molded samples.
From Figure 7(a), the G1 nanocomposite presented a decrease in the σAC of the X-direction compared to the PC/ABS blend, which may be explained by the capacitive-like charge storage behavior of the larger stacks of nanographite with gaps observed for this composition, also called intra-cluster charge confinement. On the other hand, the σAC of the injection mold flow direction (X-direction) for other GRM nanocomposites (G2 and G3) had not changed significantly, which probably is associated with dispersed and separated nanoplatelets inside the insulator polymer matrix, promoting no electrical interaction of the nanofillers in these nanocomposites. The 3 wt% content of GRM added to all three nanocomposites was too low to achieve the electrical percolation threshold, which is generally achieved above 10 wt% of GRM according to the literature. 54
An expressive change of the σAC of the injection molding flow direction was observed for the hybrid nanocomposites, promoting a constant quasi-DC electrical conductivity behavior. The quasi-DC behavior may be activated for nanocomposites by inter-clusters efficient charger transfer, meaning the formation of efficient electrical percolation threshold paths in this direction. These paths were formed from the MWCNT increased the electrical conductivity for all hybrid nanocomposites was also proportional to the MWCNT content. 62
The effect of GRM lateral size and thickness on the electrical behavior of the hybrid nanocomposites was analyzed for the compositions with the same MWCNT content. Conversely, in the G1/1.5CNT the GRM1 addition possesses a larger lateral size and thickness, resulting in higher electrical conductivity for the hybrid nanocomposite. However, the G2/1.5CNT presented lower electrical conductivity compared to the G1/1.5CNT, even with the smaller thickness. These results were related to the Evgin et al. 54 study, which evaluated how lateral size and thickness influence the electrical properties of polyethylene (PE)/GNP nanocomposites. As a result, the authors observed that the larger average lateral size GNP achieves the DC electrical percolation limit for lower fillers content, and that parameter might be more important than the thickness (or the number of layers) for electrical conductivity. 54
Another effect of the GRM can be observed for G3/1.5CNT and G3/2CNT compositions, which presented significantly lower electrical conductivity values than the other nanocomposites, again this can be related to the chemical exfoliation process that inserts defects into the GRM3 surface, decreasing its electrical resistivity. Moreover, the G3/2CNT presented a slightly higher electrical conductivity for the Y direction, probably due to stronger dipolar interactions between oxygenated groups in the MWCNT surface and the same defects into the GRM3 surface.
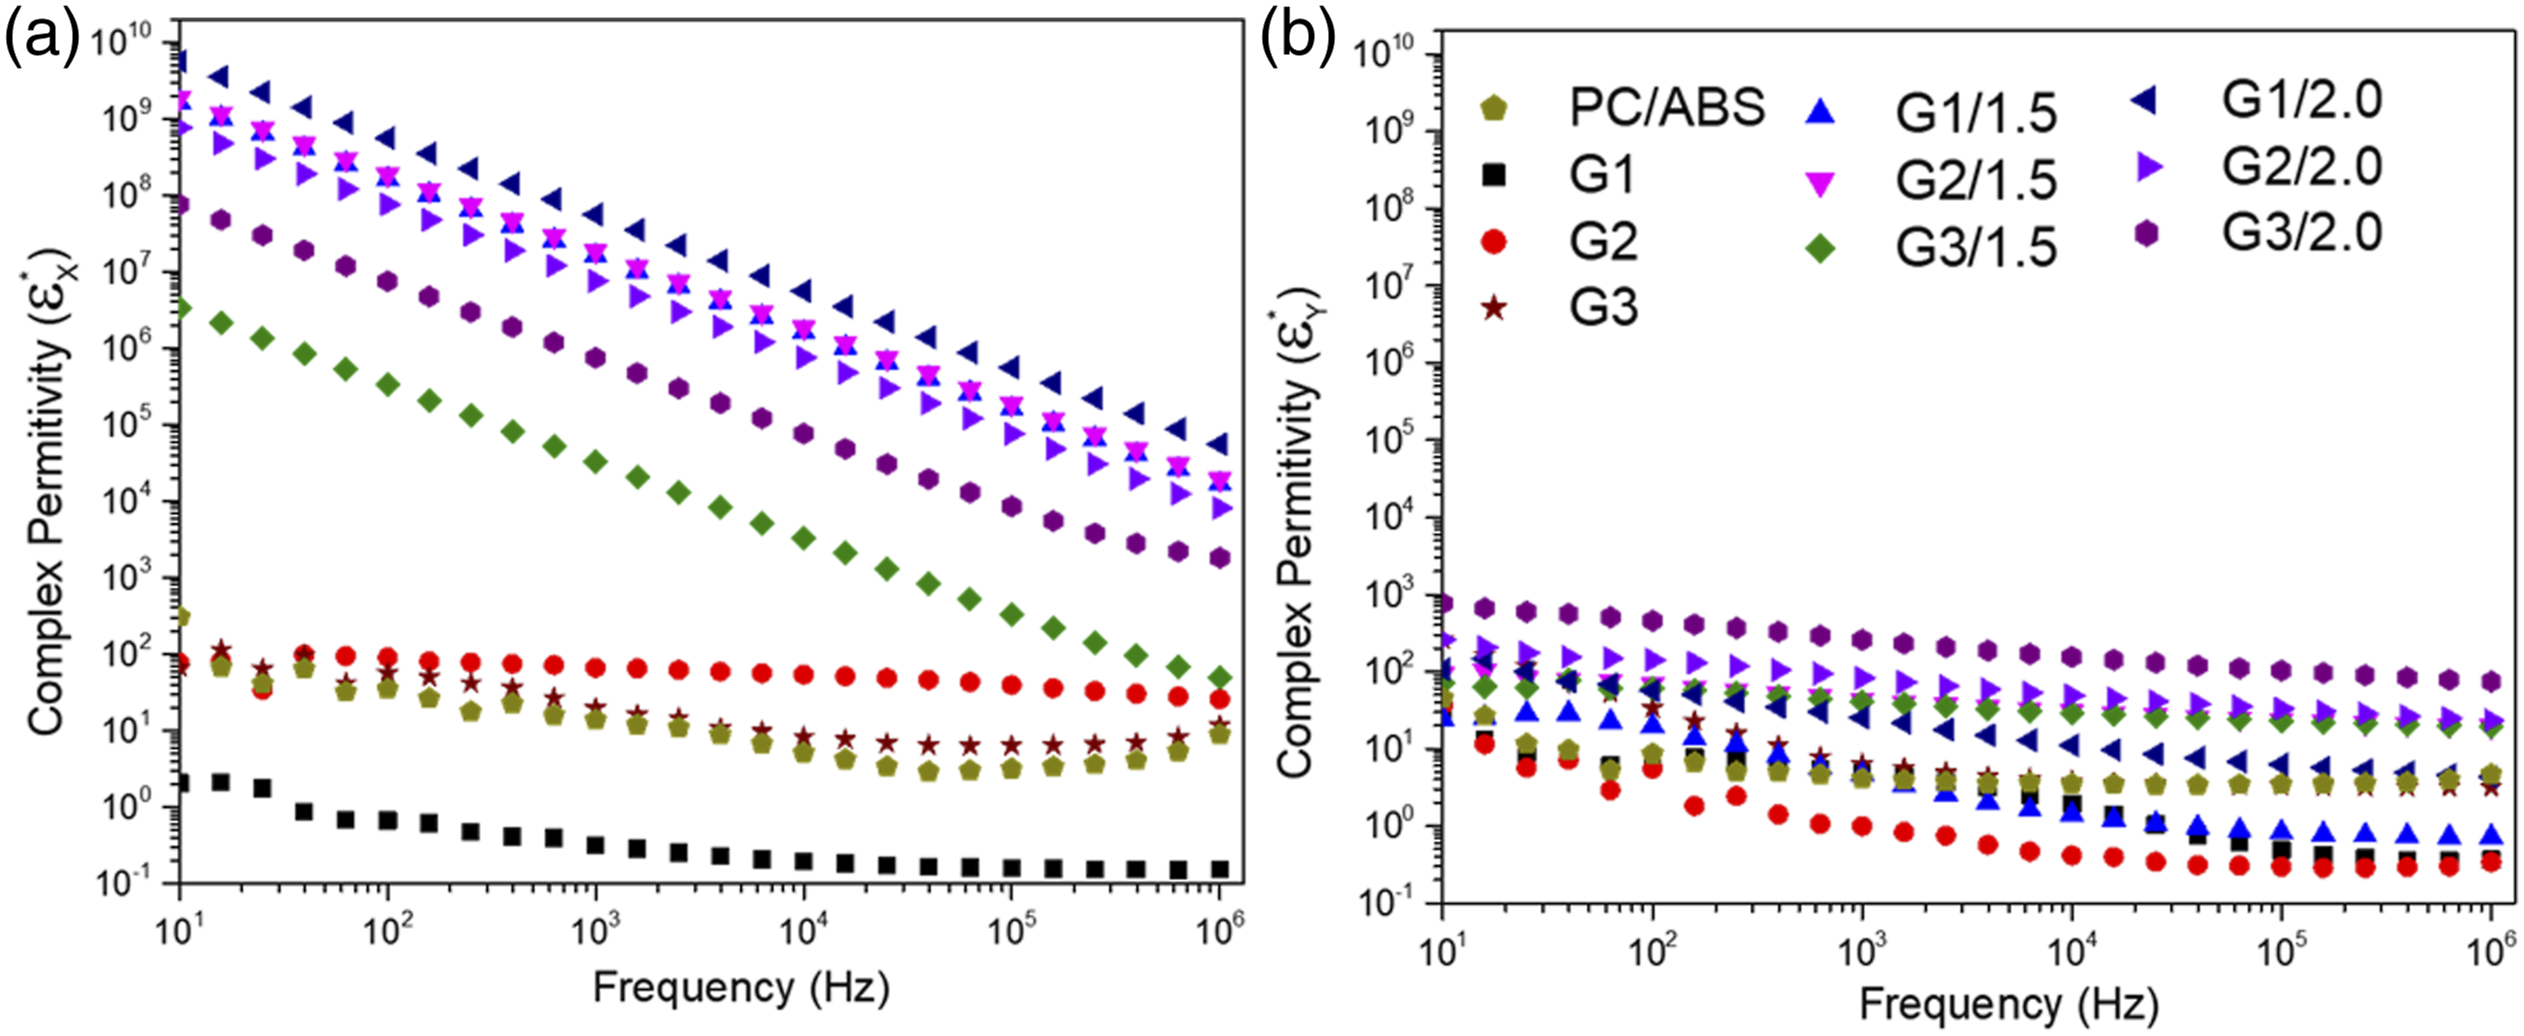
The dielectric spectroscopy was also applied to evaluate the ε* of the nanocomposites in both directions (Figure 8). The permittivity can be understood in this context as a complex electric property of the material that quantifies the magnitude of the interaction of the material with an electrical field applied to it. Dielectric materials as polymer nanocomposites might interact with the electrical field by different polarization mechanisms, such as interfacial polarization, charge hoping among neighbor clusters, and nano capacitive effects for fillers closer and separated by the matrix in a distance of nanoscale. 62 These mechanisms are frequency-activated and dependent.
Especially for the nanocomposites, the different phases of the material contribute to the permittivity, also adding a new polarization mechanism called interfacial polarization mechanism, and mathematically described by the equation of Maxwell-Wagner-Silas (MWS).49,61 Therefore, for these nanocomposites, the polymers (PC and ABS) have dielectric insulator behavior, and the nanofillers GRM and MWCNT are expected to be electrical conductive. 62
The ε* values measured may also be associated with the dispersion of fillers in the nanocomposites and the σAC. From Figure 8(a), the ε* compositions can be divided into two groups: first, a group with lower ε* composed of the PC/ABS blend and nanocomposites with the addition of GRM without the formation of a percolative path (PC/ABS, G1, G2, and G3 samples in the X-direction). And a second group with high ε* decreases with the frequency composed by the hybrid nanocomposites, with a behavior similar to the MWS equation. In this case, the network formed by the GRM and the MWCNT interact with the electric field, allowing long-range charge transfer with a quasi-DC electrical conductivity. These networks propagating the electric field also constitute higher interfacial polarization component, inductive and capacitive effects among nearby clusters, which increased orders of magnitude the ε* at lower frequencies possible by increasing ohmic losses associated to the ε″.
Analogously for the σAC, the ε* measured in the Y-direction has not presented as the second group behavior for any composition (Figure 8(b)) because no electrical percolation paths were formed. From those results, all the hybrid nanocomposite samples were expected to have high absorption attenuation values at the EMI SE. These efficient networks created in the X-direction might interact with the higher frequency electromagnetic waves (GHz) that will penetrate the materials in the analyses.
Electromagnetic interference shielding
The EMI SE of all samples was evaluated in the X-band (8.2–12.4 GHz) with injection-molded samples positioned in the Y-direction, i.e. the perpendicular direction of the injection molding flow. The parallel direction of the injection molding flow (X) corresponded to the thickness of the sample, being smaller than the required format to feat the waveguide, so other processes would be necessary to prepare samples in the parallel direction (X), which should change the samples morphology. However, the perpendicular direction (Y) corresponded better to real-world applications once the electronic housing and other injection-molded protective parts were injected similarly.
The EMI SE behaviors of all compositions studied are shown in Figure 9 in terms of total shielding effectiveness (SET), shielding effectiveness from reflection (SER), and shielding effectiveness from absorption (SEA). The attenuation may be related to the morphology of the nanocomposites, the filler’s content, and the shape of the filler. As shown in Figure 9, the total attenuation for the PC/ABS is around 2 dB, which could be classified as a nearly transparent material, in which most of the incident EM is transmitted. Total shielding effectiveness (SET), Shielding effectiveness from reflection (SER), and Shielding effectiveness from absorption (SEA) measured in the X-Band for the PC/ABS blend and nanocomposites.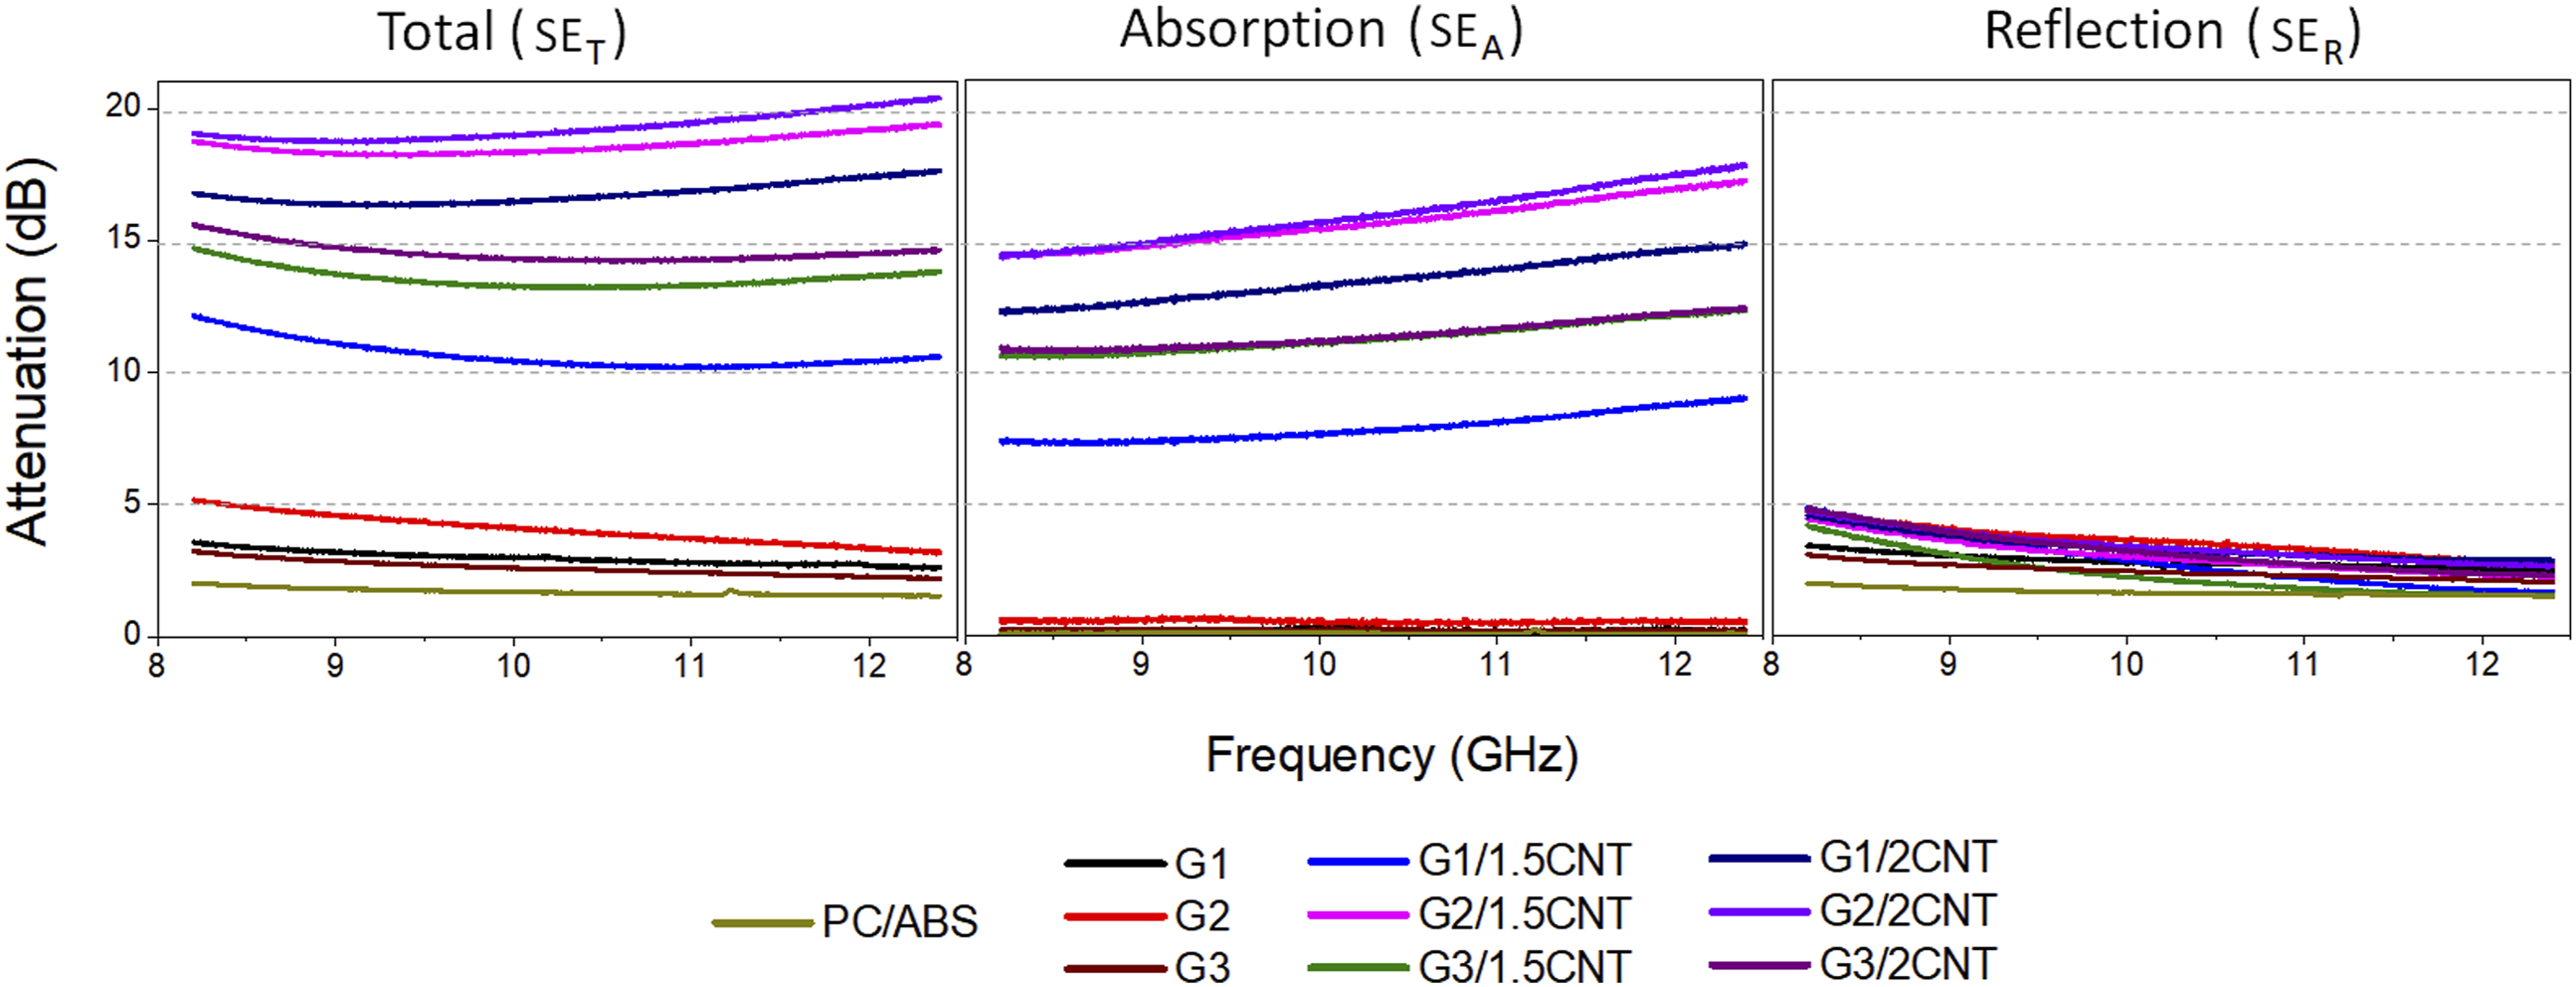
Each GRM presented different attenuation behavior; the G2 nanocomposite has the higher SET among the PC/ABS/GRM nanocomposites, around 5 dB, which might be related to the better dispersion and distribution observed for this nanocomposite, which possesses the lowest number of layers and the smallest lateral size. Nevertheless, all three GRM probably act by reflecting the EM inside the nanocomposite, resulting in a majoritarian SER response for the nanocomposites G1, G2, and G3.
For the hybrid nanocomposites, different SET behaviors were observed among the GRM studied. For GRM1, the composition G1/1.5CNT achieved an average SET around 12 dB and the G1/2CNT around 17 dB. For GRM2, both compositions achieved near commercial 20 dB SET values, approximately 19–20 dB, the highest values of all nanocomposites. For GRM3, both compositions, G3/1.5CNT and G3/2CNT had also closed the SET average values of 14 and 15 dB, respectively.
For all the hybrid nanocomposites, the addition of 1.5 wt% of MWCNT forming hybrid networks increased the SET of all hybrid nanocomposites, as a resultant SEA component that emerges from a synergistic effect of the GRMs and MWCNT interactions. 32 A further increment of 0.5 wt% of MWCNT had promoted around 5 dB from G1/1.5CNT to the G1/2CNT. However, a different trend was observed for G2/2CNT and G3/2CNT compared to the respective G2/1.5CNT and G3/1.5CNT nanocomposites, in which the addition of 0.5 wt% of MWCNT resulted in a slight increase of the SET, with no practical effect. Some related works using other polymer matrices have also found that the SEA component may not be directly proportional to the content of nanofillers added.18,32,34,64
The attenuation results of hybrids indicated that GRM with the lower number of layers and lateral size (GRM2) might be more efficient once these fillers were better dispersed into the polymer matrix and presented a higher surficial area to interact with the MWCNT. The attenuation behavior for the GRM with an elevated number of layers and higher lateral size (GRM 1 – Nanographite) was related to the MWCNT content because of the less surficial area and a lower dispersion in the PC/ABS.
In the hybrid nanocomposites, the SEA occurs as different combined phenomena, including internal waves reflection 32 and the interaction of the incident wave with the conductive nanofiller network formed in the injection molding direction. 65 Both phenomena might result in ohmic losses by the interaction of the EM with the π bonds of sp 2 hybridized carbon atoms of the GRM and the MWCNT and/or in interfacial polarization of these nanofillers in the matrix, which can also be propagated for nearby clusters (inter-clusters). The ohmic losses and the interfacial polarization can dissipate the EM waves’ energy by transforming it into other types of energy 32 as heat or/and capacitive/inductive losses from the propagation between clusters.
The dielectric analyses of the complex permeability (μr) and permittivity (εr) (Figure 10) in the X-band frequency range could be associated with the latest cited phenomena
65
and complement this discussion. On the one hand, as Figure 10(a) shows, the μr of all compositions were close to one, as expected, once all the conductive carbon-based fillers are not expected to have active magnetic segments or magnetic dipoles. However, on the other hand, the complex permittivity (ε*) measured in the X-band varies broadly: for the nanocomposites G1, G2, G3, and the PC/ABS, the ε* were lower than five; the hybrids had higher ε* values, up to 22, that observations might be correlated with the observed in the dielectric spectroscopy (Figure 8). (a) Complex permeability (μr), (b) Complex permittivity (ε*) and (b) dielectric loss tangent (Tan δε) for all compositions.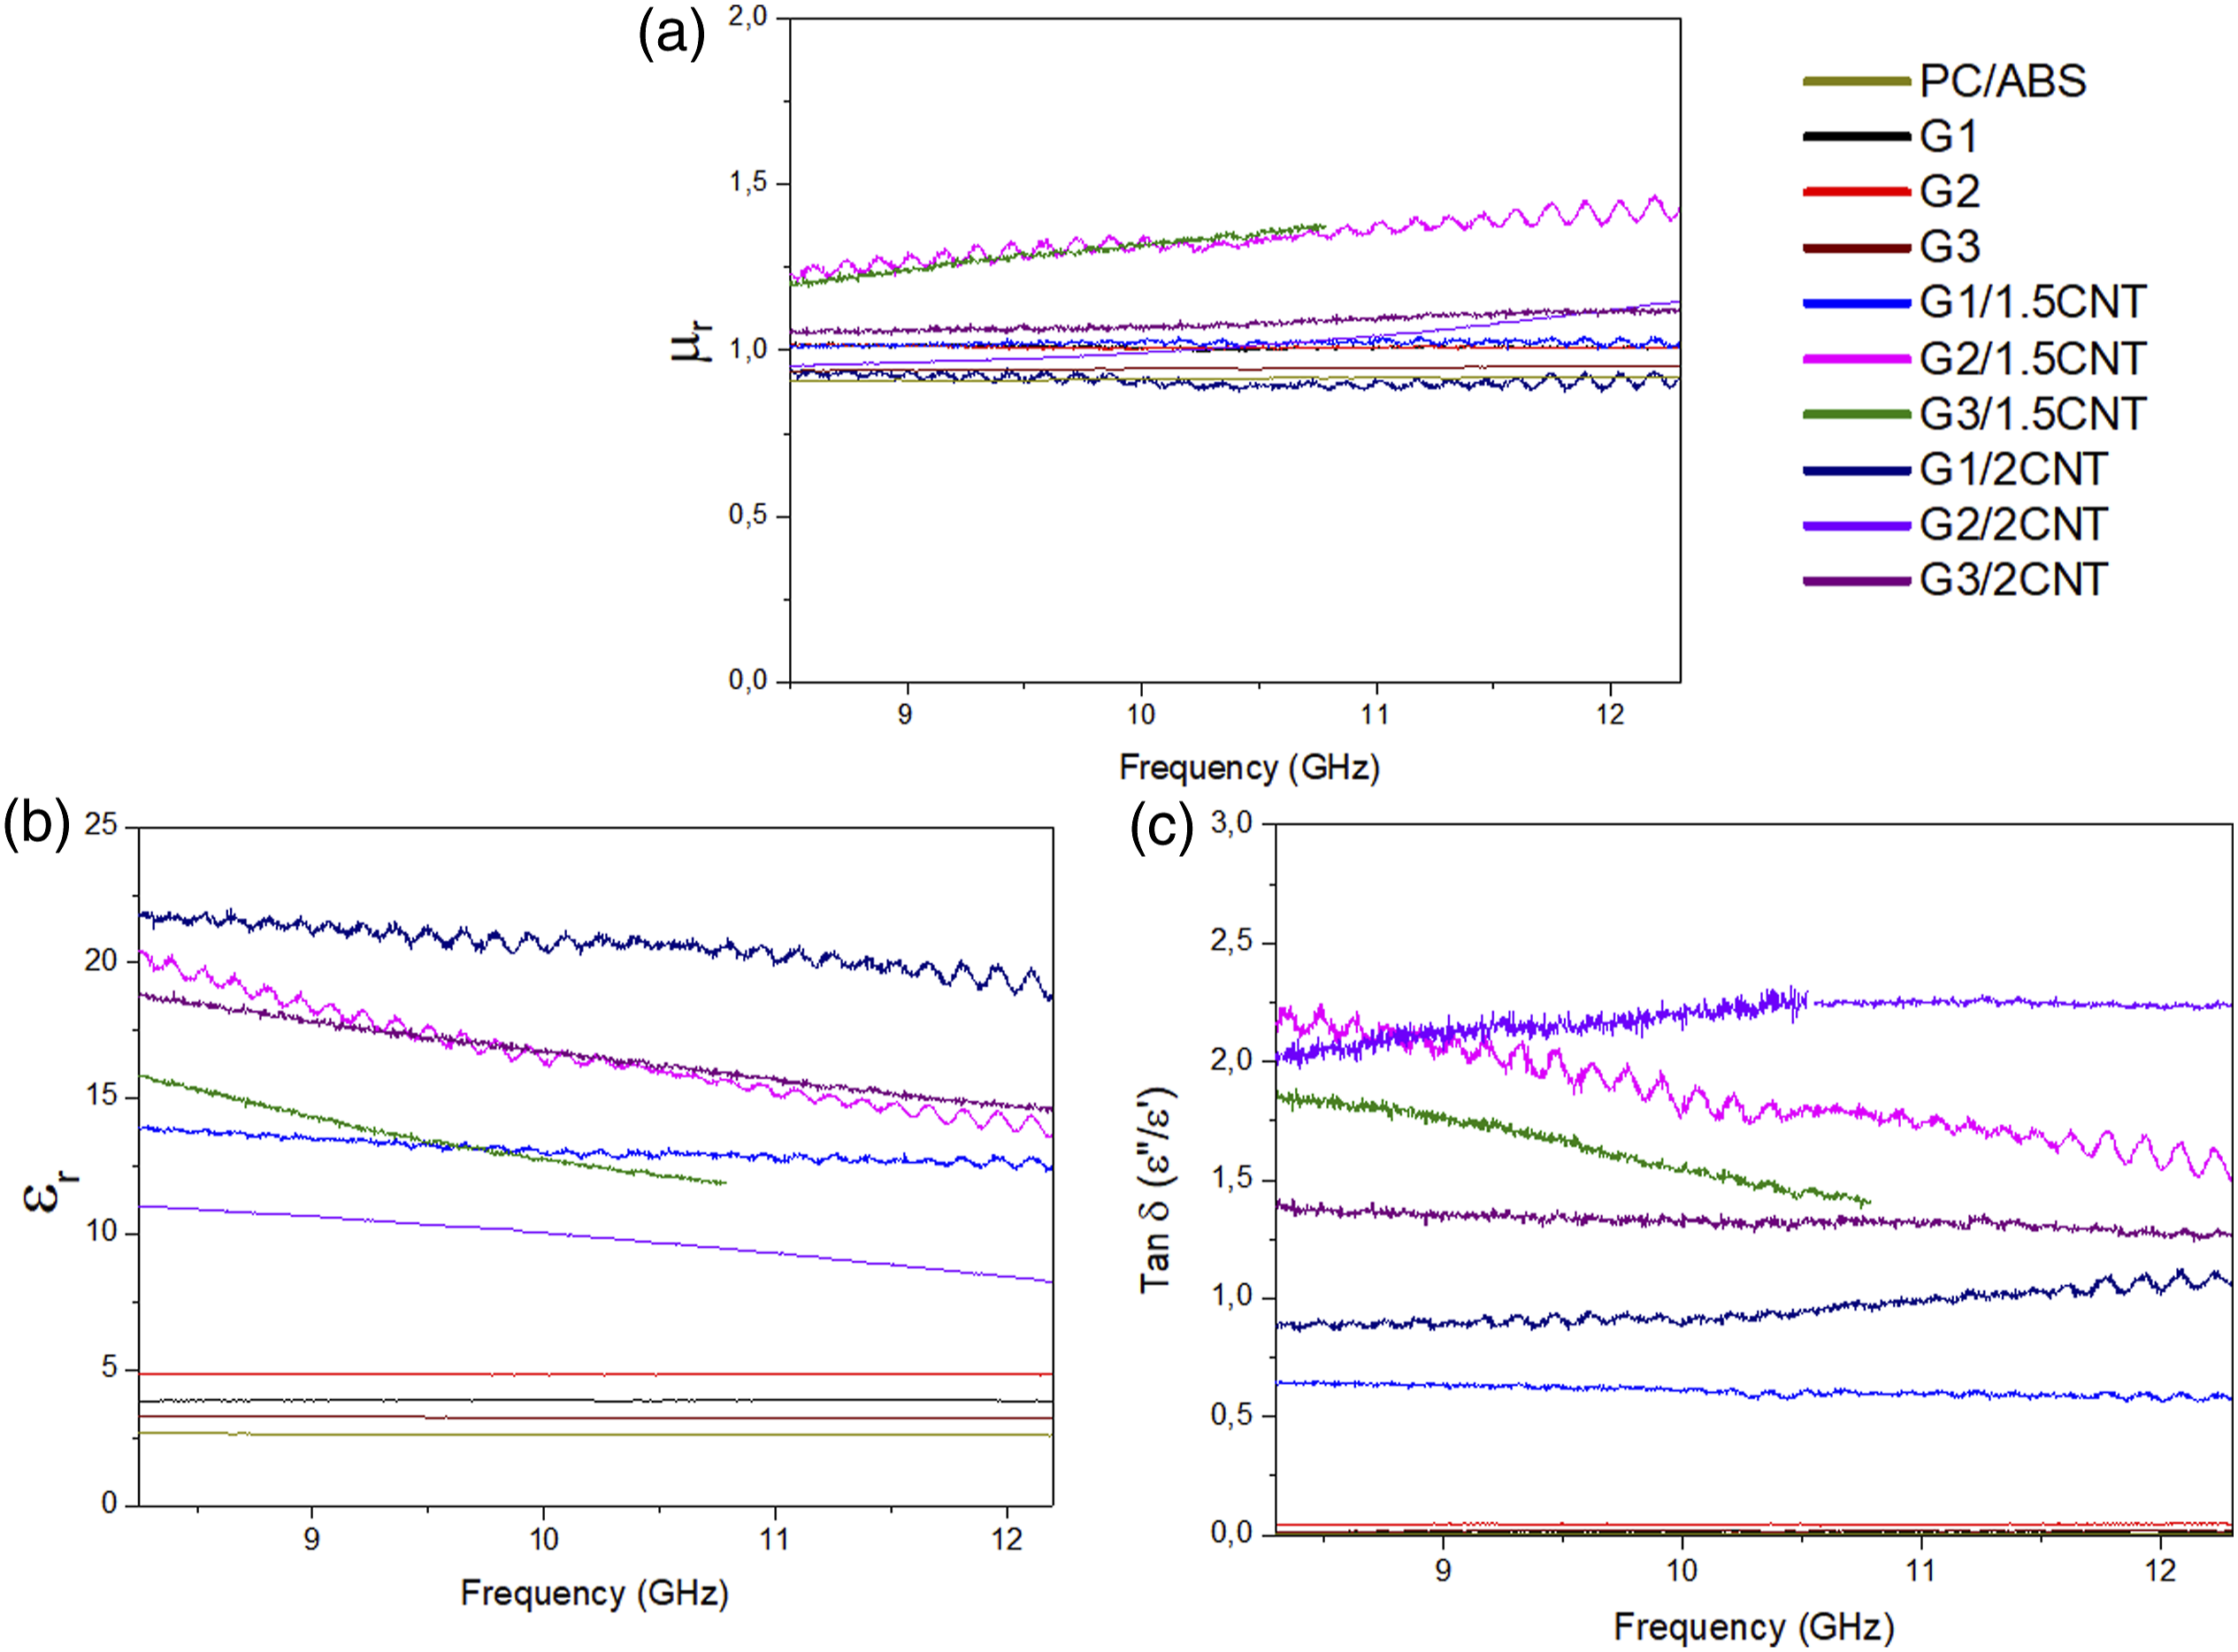
Besides the ε* magnitude values, a direct correlation of the SET values might be explained by the tan δε, which consists of the ratio of the loss dielectric component (ε′′) and the real dielectric component (ε′) 65 (Figure 10(b)). Elevate tan δε values with high complex permittivity results in efficient absorption components, while low values mean preferential reflection. For the composition G3/1.5CNT, a mathematical discontinuity was observed for higher frequencies that were replicated four times for this composition sample. However, the curve trends of the 8.24–10.5 GHz frequency range corroborate the conclusion of this section.
Conclusions
The effect of the addition of MWCNT on three different PC/ABS Graphene Related Materials (GRM) nanocomposites had proven to be an efficient way to improve the electrical and EMI SE properties. The lateral size, thickness, and the production method of the GRM influenced the dispersion of the GRM in the polymer matrix, which was evaluated and confirmed by XRD analysis, FEG–SEM microscopy, and oscillatory rheological analyses. The addition of 1.5 wt% MWCNT resulted in an effective conductive network in the injection-mold flow in the parallel direction, while in the perpendicular direction showed insulating behavior. Each GRM resulted in different complex electrical and EMI SE behavior, which can be explained by the different morphology and shape of the nanofillers. For GRM1 nanocomposites, which consisted of nanosized graphite, an adequate dispersion into the PC/ABS polymer matrix was achieved, resulting in a highly conductive behavior and EMI SE intermediate, which was more dependent on the MWCNT content for those hybrid nanocomposites. The GRM2 consisted of graphene nanoplatelets well-dispersed at the matrix using melt-mixing methods, resulting in a conductive behavior and EMI SE that a further 0.5 wt% addition has not much influenced. GRM3 consisted of reduced graphene oxide produced by the chemical exfoliation process, presented lower electrical conductivity for its hybrid nanocomposites, and lowered EMI SE compared to GRM2. The hybrid nanocomposites studied in this work are a promising material for future EMI SE applications with a more substantial attenuation by absorption component and being prepared by extrusion and injection molding.
Supplemental Material
Supplemental Material - Role of adding carbon nanotubes in the electric and electromagnetic shielding behaviors of three different types of graphene in hybrid nanocomposites
Supplemental Material for Role of adding carbon nanotubes in the electric and electromagnetic shielding behaviors of three different types of graphene in hybrid nanocomposites by Erick GR dos Anjos, Nayara Kd Moura, Eduardo Antonelli, Mauricio R Baldan, Newton AS Gomes, Natália F Braga, Adelina P Santos, Mirabel C Rezende, Luiz A Pessan and Fabio R Passador in Journal of Thermoplastic Composite Materials
Footnotes
Declaration of Conflicting Interests
The author(s) declared no potential conflicts of interest with respect to the research, authorship, and/or publication of this article.
Funding
The author(s) disclosed receipt of the following financial support for the research, authorship, and/or publication of this article: This study was financed in part by the Coordenação de Aperfeiçoamento de Pessoal de Nível Superior - Brasil (CAPES) - Finance Code 001. The authors are grateful to FAPESP (process 2020/12501-8) and CNPq (Conselho Nacional de Desenvolvimento Científico e Tecnológico, processes 440132/2021-3, 307933/2021-0, and 305123/2018-1).
Supplemental Material
Supplemental material for this article is available online.
References
Supplementary Material
Please find the following supplemental material available below.
For Open Access articles published under a Creative Commons License, all supplemental material carries the same license as the article it is associated with.
For non-Open Access articles published, all supplemental material carries a non-exclusive license, and permission requests for re-use of supplemental material or any part of supplemental material shall be sent directly to the copyright owner as specified in the copyright notice associated with the article.