
Abstract
The mechanical properties of open-hole tensile (OHT) specimens made of 3D-printed continuous carbon-fiber-reinforced thermoplastics (CFRTPs) were investigated. The stacking sequence of the OHT specimens were [0/90]2s, and the as-printed specimens possessed higher porosity (15.19%) than conventional fiber reinforced composites. The OHT tests demonstrated that the tensile modulus and fracture strength of the as-printed specimens exhibited 36.7 ± 0.3 GPa and 226.0 ± 9.0 MPa, respectively. To evaluate the effects of voids on the OHT properties, the 3D-printed CFRTPs were hot-pressed, where fiber orientation and porosity (3.41 ± 0.10%) were improved. Additionally, the tensile modulus was increased to 45.1 ± 0.8 GPa, which is 23% higher than the as-printed specimens, even though the fracture strength were comparable or lower than that of as-printed specimens. To validate such OHT properties, a numerical multiscale model was introduced, with a microscale periodic unit cell (PUC) analysis for determining the effective tensile moduli and mesoscale extended finite element method (XFEM) analysis for OHT properties. In the PUC analysis, we considered a two-scale numerical model including a fiber-resin scale with fiber orientation for effective tensile moduli of a CFRTP filament, and filament-void scale for those of a CFRTP laminate. The porosity and fiber orientation were measured by X-ray computed tomography and digital microscopy observations, and the porosity for the 0° specimen were 14.86%. By substituting the effective tensile moduli of the filament-void scale and those of the fiber-resin scale into the XFEM, respectively, the stress-strain responses of the computational OHT models were found to be in good agreement with those of the experimental results of as-printed and hot-pressed CFRTP, respectively. Both the OHT models showed that the Weibull criterion was satisfied without significant delamination at the failure strain, corresponding to the brittle failure mode due to fiber breakage, which agreed reasonably well with the experimental observations.
Keywords
Introduction
Additive manufacturing (AM) is of considerable importance in machinery manufacturing and other related fields. One of the main advantages of this technology is that it does not require the preparation of a mold, which can significantly shorten the lead-time of product development. In addition, it can be used to develop complex shapes that are difficult to form using conventional processing. 1 Fused filament fabrication (FFF) is the most commonly used 3D printing method because of its convenience and simplicity. The advantage of FFF is that it does not require post-processing and simplifies the production line. However, one of the significant disadvantages of the method is that the mechanical properties of 3D-printed polymer materials (polyamide and acrylonitrile-butadiene-styrene, etc.) are poor, owing to which FFF cannot be applied for industrial applications and has been used in prototype products and science, technology, engineering, and mathematics (STEM) education. However, because of the aforementioned advantages, the application of carbon-fiber-reinforced thermoplastics (CFRTPs) to FFF has recently gained attention for reinforcing their mechanical properties. Notably, Markforged has been of interest since they developed the first-ever commercial FFF-3D printer in 2014 and launched the “Mark One” and “Mark Two,” which manufacture FFF parts reinforced by using continuous fiber filaments.
In this way, by introducing composite materials to the FFF process, the application of the FFF-3D printer will expand to various products that require high mechanical performance. Therefore, it is necessary to investigate the mechanical properties of CFRTPs fabricated by FFF to enhance the quality of 3D-printed products and the usability of the materials. Werken et al. 2 investigated the relationship between mechanical properties and infill pattern of continuous CFRTPs using by MarkTwo. They demonstrated that the geometry, infill pattern, and infill percentage significantly influence the failure strength and failure modes. Saeed et al. 3 predicted the elastic properties of various layups of 3DP-CFRTP using classical laminate theory. Their work showed that the mechanical properties of different stacking sequences could be predicted using the experimental result of the unidirectional specimen. A number of studies detailing the mechanical properties of such 3DP-CFRTP have been published,4–6 all of which employed a conventional tensile specimen with surface resin layers. Eliminating the neat polyamide 6 (PA6) layer or short fiber composite (onyx) layer, Todoroki et al. 7 fabricated the 3DP-CFRTPs by continuous carbon fiber filament (CFF) only, and evaluated the mechanical properties of the 0°, 90°, ±45°, and lay-up direction type specimens. Goh et al. 8 investigated the relationship between mode I intralaminar fracture toughness and the 3D printing conditions, and reported that low print speed and high printing temperature improve porosity and intralaminar fracture toughness. It indicates that the heat conditions in 3D printing affect the microstructure and mechanical properties. Therefore, understanding the association between 3D printing and mechanical properties requires considering the characteristic microstructure.
On the other hand, in aerospace engineering, the mechanical properties of composites with center holes have been investigated for decades. Composite structures contain numerous holes for fastening multiple components. The open-hole tensile (OHT) test is an effective method for evaluating the tensile strength of composite laminates with geometries such as circular holes; thus, many researchers have investigated the mechanical behavior of OHT in continuous carbon fiber-reinforced composites (CFRPs) fabricated by hot pressing and autoclaving. Here, 3D-printed parts do not require drilling to form holes or any other geometries,9,10 unlike the hot-pressed and autoclaved CFRPs. However, the OHT strength and nonlinear behavior of 3D-printed composites have few common features with traditional CFRPs, and there is insufficient understanding of the basic mechanical properties of 3D-printed composites with drilled holes similar to conventional CFRP open-hole specimens. In addition, a mesoscale (such as composite laminate scale) analysis that can predict the damage propagation and resultant strength of 3D-printed CFRTPs provides a deeper understanding of the fracture mechanisms.
In this study, continuous carbon fiber reinforced thermoplastics were fabricated using a commercially available 3D printer, and stress-strain responses and damage mechanisms of OHT specimens are investigated experimentally and numerically. The effective tensile modulus was predicted by periodic unit cell (PUC) analysis, and mesoscale analysis for OHT was conducted using the quasi-3D extended finite element method (XFEM). Finally, the obtained OHT results were compared with the experimental results, and the validity of the numerical analyses was evaluated.
Experimental procedure
Sample preparation
All specimens used in this study were fabricated using a commercially available Prusa MK3S printer (Prusa Research, Prague, Czech), using a pre-impregnated continuous carbon fiber/polyamide 6 (PA6) filament (which is referred to as CFF), a proprietary raw material supplied by Markforged (Cambridge, MA, United States). The fiber volume fraction of the CFF was 35%.11,12 The 3D printer was modified in terms of the feed extruder, printer head, and nozzle to print the CFF. The details of this modification have been described elsewhere. 13 The 3D printing cannot stop material feeding after it has begun; thus, a single-stroke path is generated with one continuous fiber for each layer as parameterized G-code scripts using Python scripts.
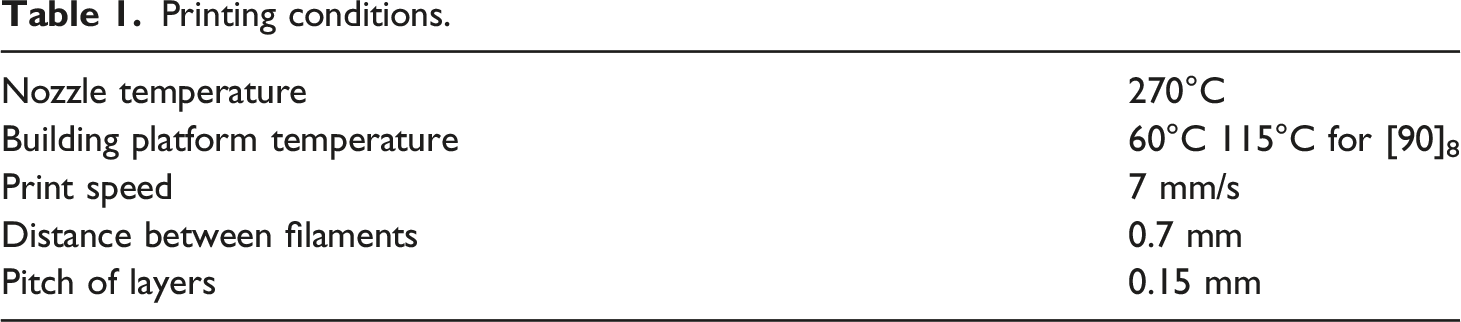
Printing conditions.
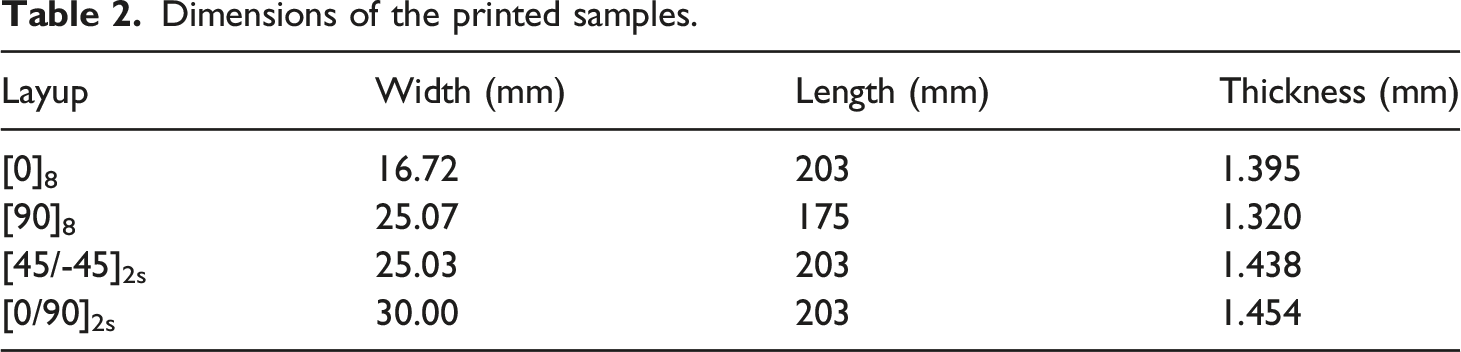
Dimensions of the printed samples.
To consider the effect of porosity within the 3D-printed 0°/90° specimen on the stress-strain response, the 0°/90° specimens were hot pressed. They were fitted inside a steel mold with dimensions of 200 × 30 mm and heated to 230°C. A pressure of 1.4 MPa was applied and held for 10 min when the mold reached the desired temperature (230°C). Subsequently, the pressure was increased to 5.0 MPa, maintained for 10 min, and left until the mold cooled naturally to room temperature. The pressure was unloaded when the mold temperature was below 200°C.
Characterization for microstructure
X-Ray computed tomography (X-ray CT, ScanXmate-L080TT, Comscantecno Corp. Japan) and digital microscopy (VH-5500SP1344, KEYENCE, Japan) were conducted to observe the internal and surface microscopic structures, respectively. The X-ray voltage and current were 70–80 kV and 90–100 μA, respectively. The porosity was characterized by professional image-processing software (ImageJ) using the obtained X-ray CT images. The 0° specimen was cut using a handsaw, polished with a diamond whetstone, and placed under the digital microscope to observe fiber orientation. In this study, assuming that the fibers in the 3D-printed specimens are inclined with respect to the printing direction, the angle distribution was measured. The orientation angle θ (−90° ≤ θ ≤ 90°) was evaluated as follows. First, a microscopic image of the specimen at the surface (2.84 × 2.28 mm2) was obtained from observation using the digital microscope. Next, the obtained images were divided into 111 × 111 μm2 pieces so that twisted fibers appeared as straight lines, as shown in Figure 1. Finally, the fiber orientation angles were measured in each divided area and a histogram for the fiber orientation angles was obtained. It was assumed that the obtained histogram characterized the fiber orientation distribution in the entire specimen. The measurement of fiber angle distribution.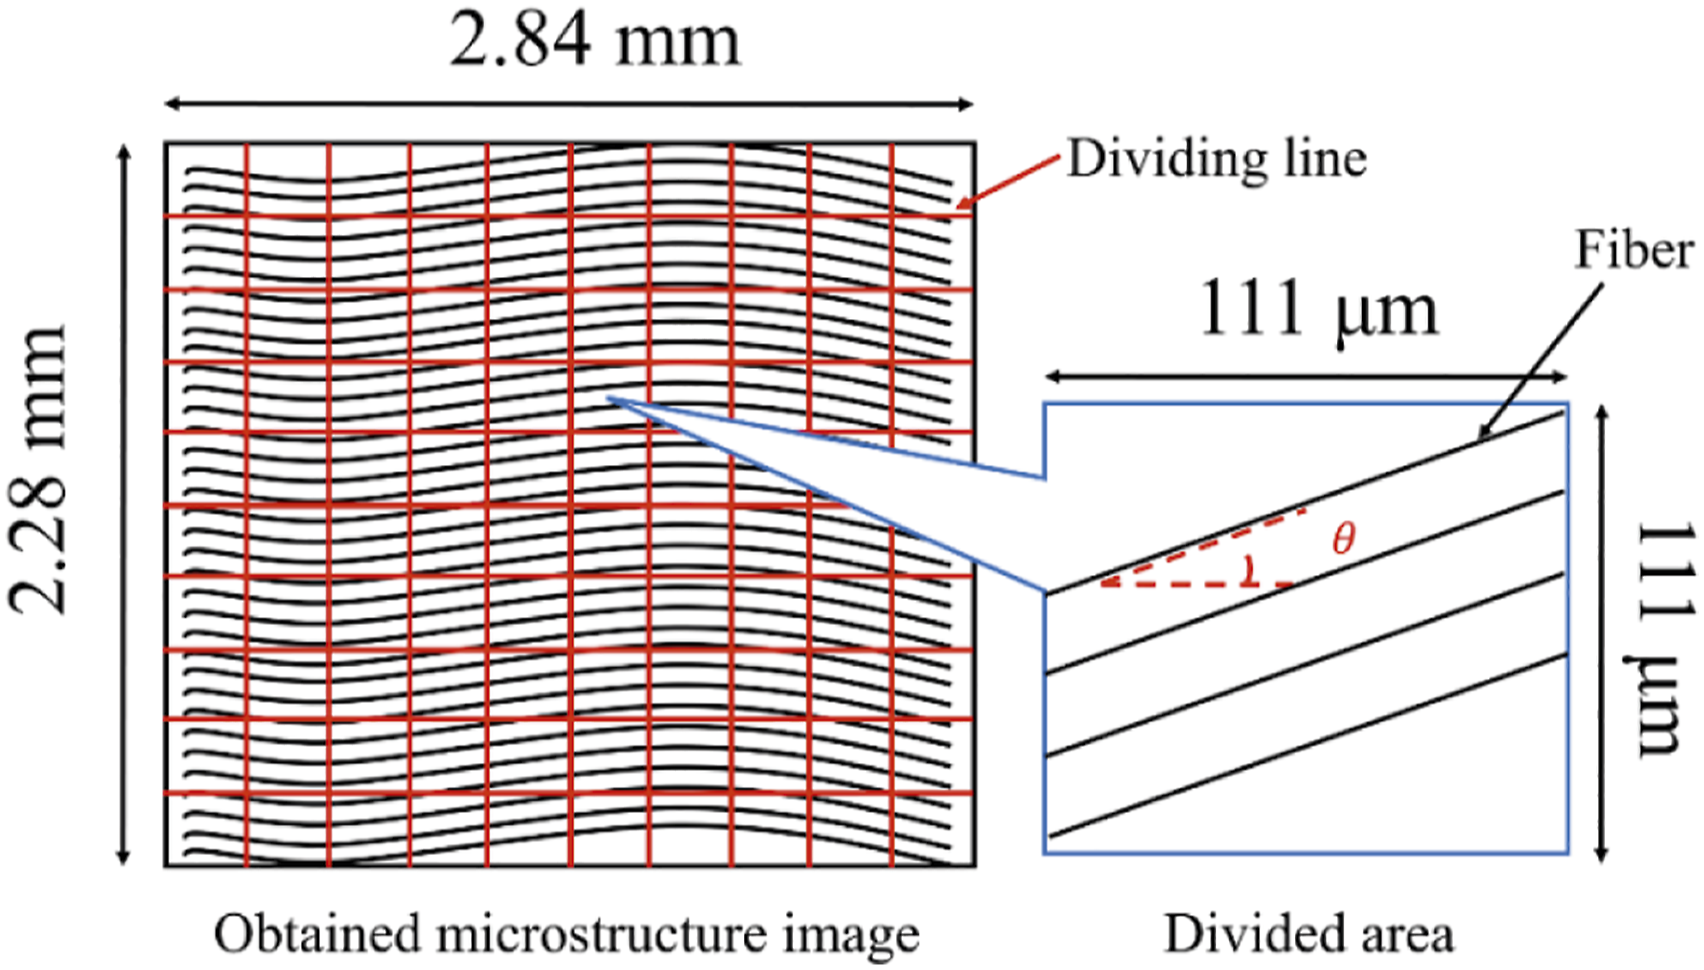
Testing method
We require five independent tensile moduli, three Poisson’s ratios, and three tensile strengths because continuous fiber-reinforced plastics are transversely isotropic. The longitudinal tensile modulus E11, longitudinal Poisson’s ratio ν12 (=ν13), and longitudinal tensile strength XT were obtained from the 0° specimens. Tensile tests were performed at 90° to obtain the transverse tensile modulus, E22 (=E33), and the transverse tensile strength, YT. Furthermore, the ±45° specimens provided longitudinal shear modulus G12 (=G13) and shear strength SLT. The transverse Poisson’s ratio ν23 is referred to as the result of the analysis described later, and the transverse modulus G23 is calculated from E22/2 (1+ν23). To obtain these mechanical properties, NHT tests were conducted using an Instron 5985 testing machine with a 250 kN loading cell and strain gauges (Kyowa Electronic Instruments Co., Ltd, Japan). Glass-fiber-reinforced polymer tabs were adhered to both ends of the 0° and 90° specimens using epoxy-adhesive to avoid premature failure during the tensile test for the 0° and 90° specimens. The gauge lengths of the 0° and 90° specimens were 103 and 125 mm, respectively. In the OHT tests of the 0°/90° specimens, strain gauges were attached for comparison with the stress-strain response by XFEM, which will be described later. The position of the strain gauge was determined to be 1 inch away from the center of the hole, referring to ASTM and SACMA standards, so that the effect of the disturbance of the stress field around the hole would be minimized. The tensile rate was maintained at 1 mm/min. The tests were conducted three times, and the average values were used. The tensile modulus was determined from the slope of the stress-strain curve when the tensile strain was between 0.1 and 0.3%. The tensile stress was obtained by dividing the load by the entire cross-sectional area, without considering the hole diameter.
Numerical analysis methods
Microscale analysis (PUC analysis)
Because the mechanical properties of materials manufactured via additive manufacturing depend on the processing parameters, it is challenging to predict their mechanical properties in advance. In addition, continuous-fiber composites have five tensile moduli, which require tensile/compression testing in each direction. It is important to develop an analytical model that can predict mechanical properties. In this study, the two-scale numerical model is divided into three steps based on the results of preliminary microstructure observations, as shown in Figure 2: (1-1) fiber-resin model, (1-2) implementation of fiber orientation, and (2) filament-void model. PUC analysis was conducted to obtain the effective tensile modulus of the filament based on the tensile modulus and Poisson’s ratio of the carbon fiber and resin, and the fiber volume fraction in step (1-1). Then, in steps (1-2), the fiber orientation caused by 3D printing is modeled based on the microstructure observation result, and the effective tensile modulus of the filament in the composite is corrected. Finally, in step (2), using the obtained effective tensile modulus in step (1), the final effective tensile modulus of the composite, including voids, was calculated by PUC analysis. The PUC analysis is first outlined in this section with the fiber-resin model. Subsequently, the numerical model was described in each step. The multiple steps analysis method to predict the tensile modulus.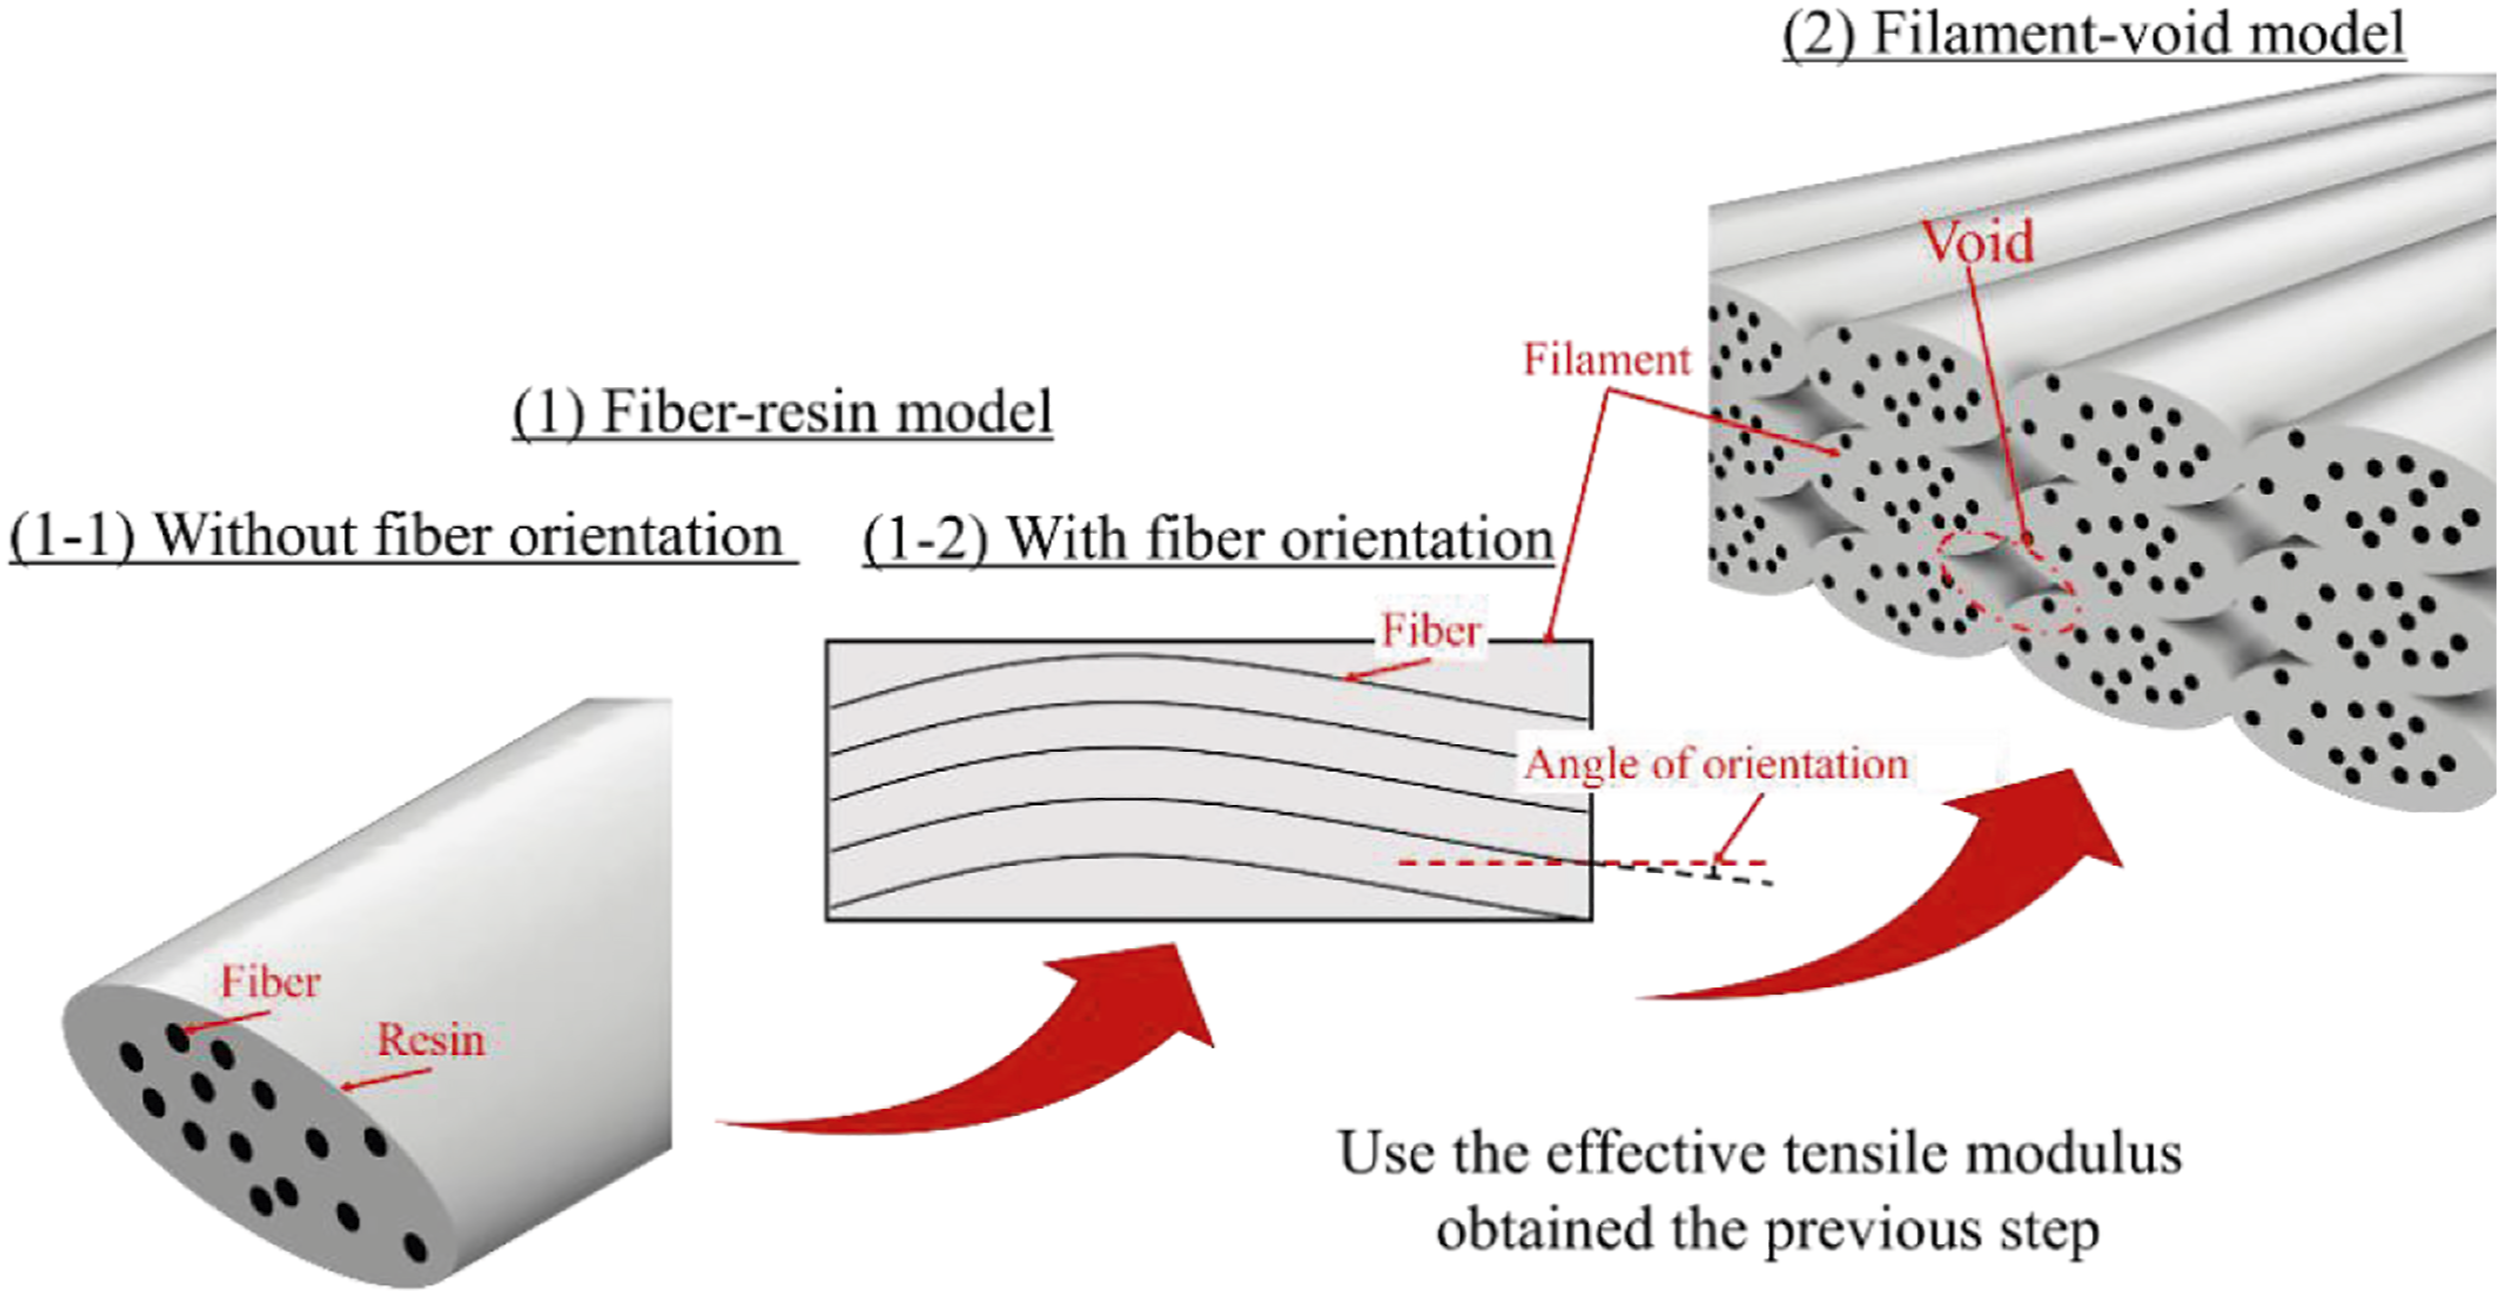
The PUC analysis approach used in this study was developed by Kumagai et al
14
. A three-dimensional unit cell model consisting of 30 carbon fibers and a polymer matrix was used to predict the effective tensile modulus of the filament. Figure 3 shows the geometry of the model used for the microscale FEM and applied periodic boundary conditions (PBCs). The fiber positions were determined based on the random sequential adsorption algorithm (RSA) method and satisfied the PBCs. This analysis model is referred to as the “fiber-resin model” in this study. The homogenized unit cell model was assumed to be orthogonal anisotropic because the fiber arrangement in the model results in slight anisotropy in the 23-plane shown in Figure 3. Therefore, the homogenized material constitutive relation of this model can be described as follows: The fiber-resin model for PUC analysis.
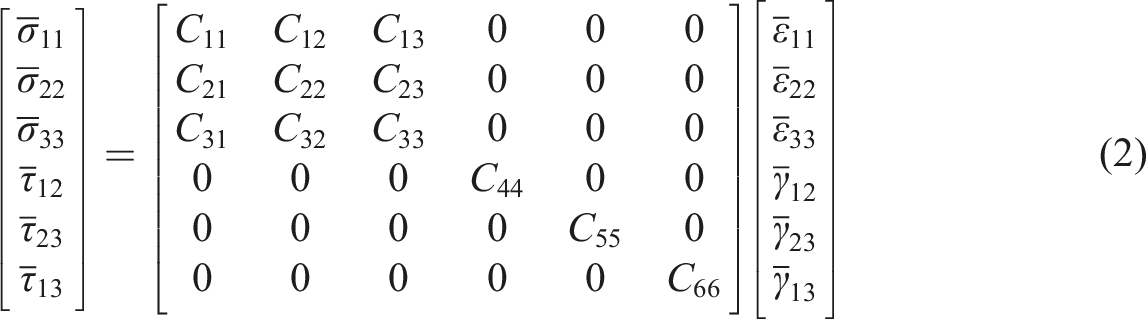

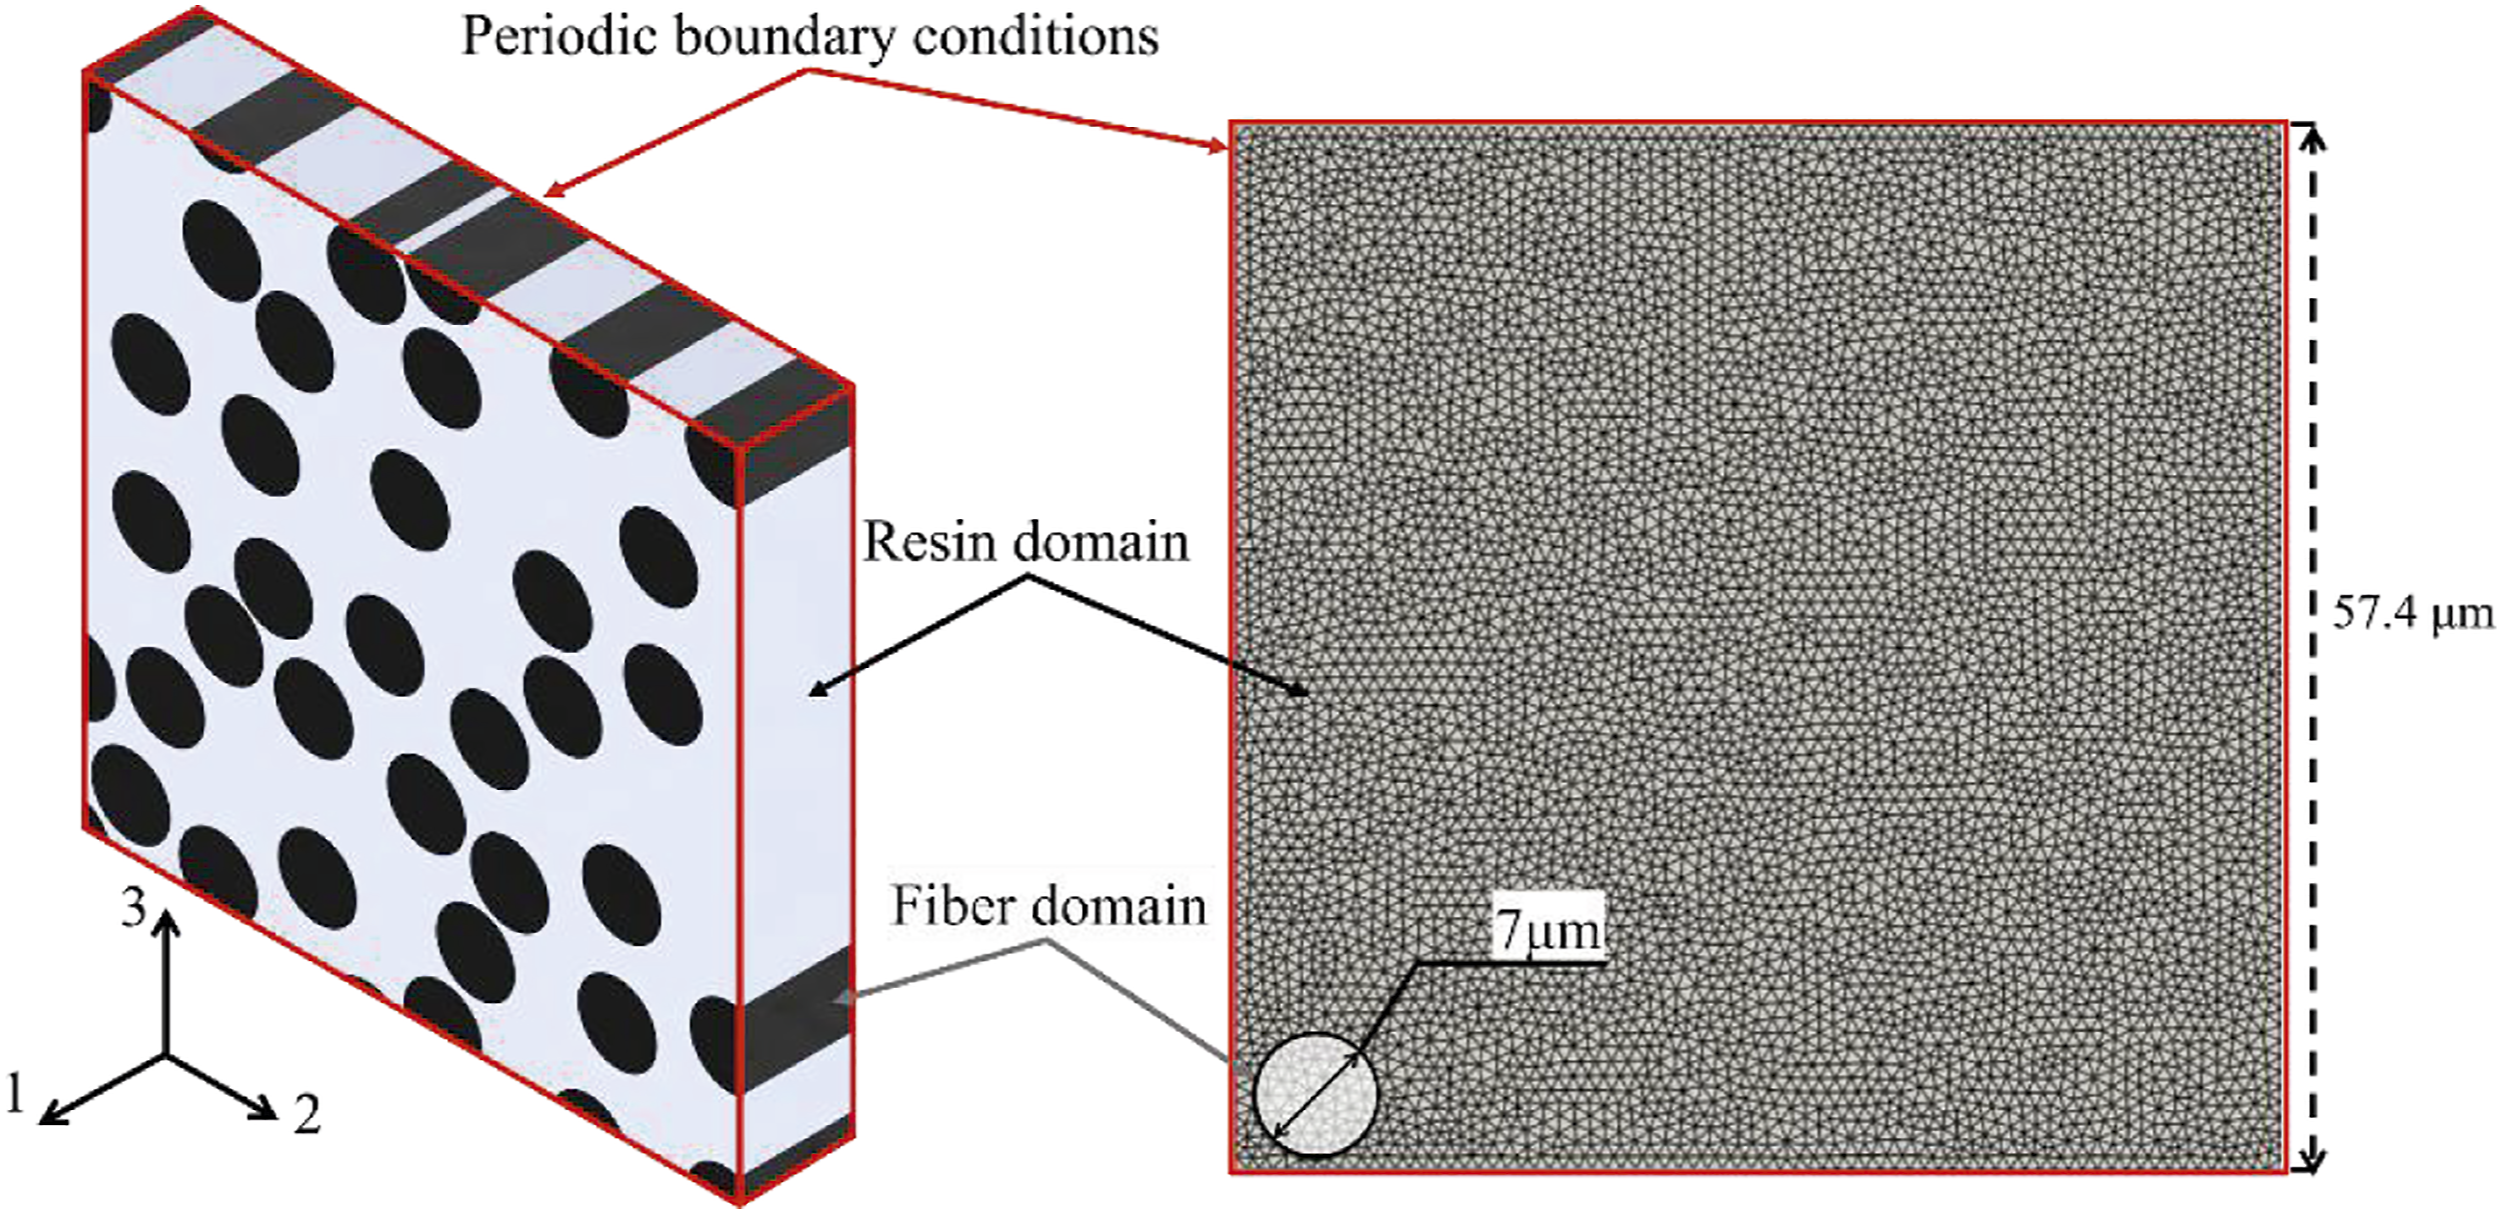
The effective stiffness matrix was determined by performing this calculation for the six strain components. A three-dimensional mesh of 114,917 node second-order tetrahedral elements was used for the unit cell. An FE code introducing the direct sparse solver PARDISO (ASTM International, 2012) was developed and used for the microscopic PUC analysis. This paper omits the modeling of PUC analysis, and a detailed derivation of the formula can be found in Ref.15,16
From a previous study, it is known that 3D-printed continuous-fiber composites exhibit scattering of fiber orientation because the filament is twisted.
7
Scattering of the fiber orientation affected the longitudinal tensile modulus. Hashimoto et al.
17
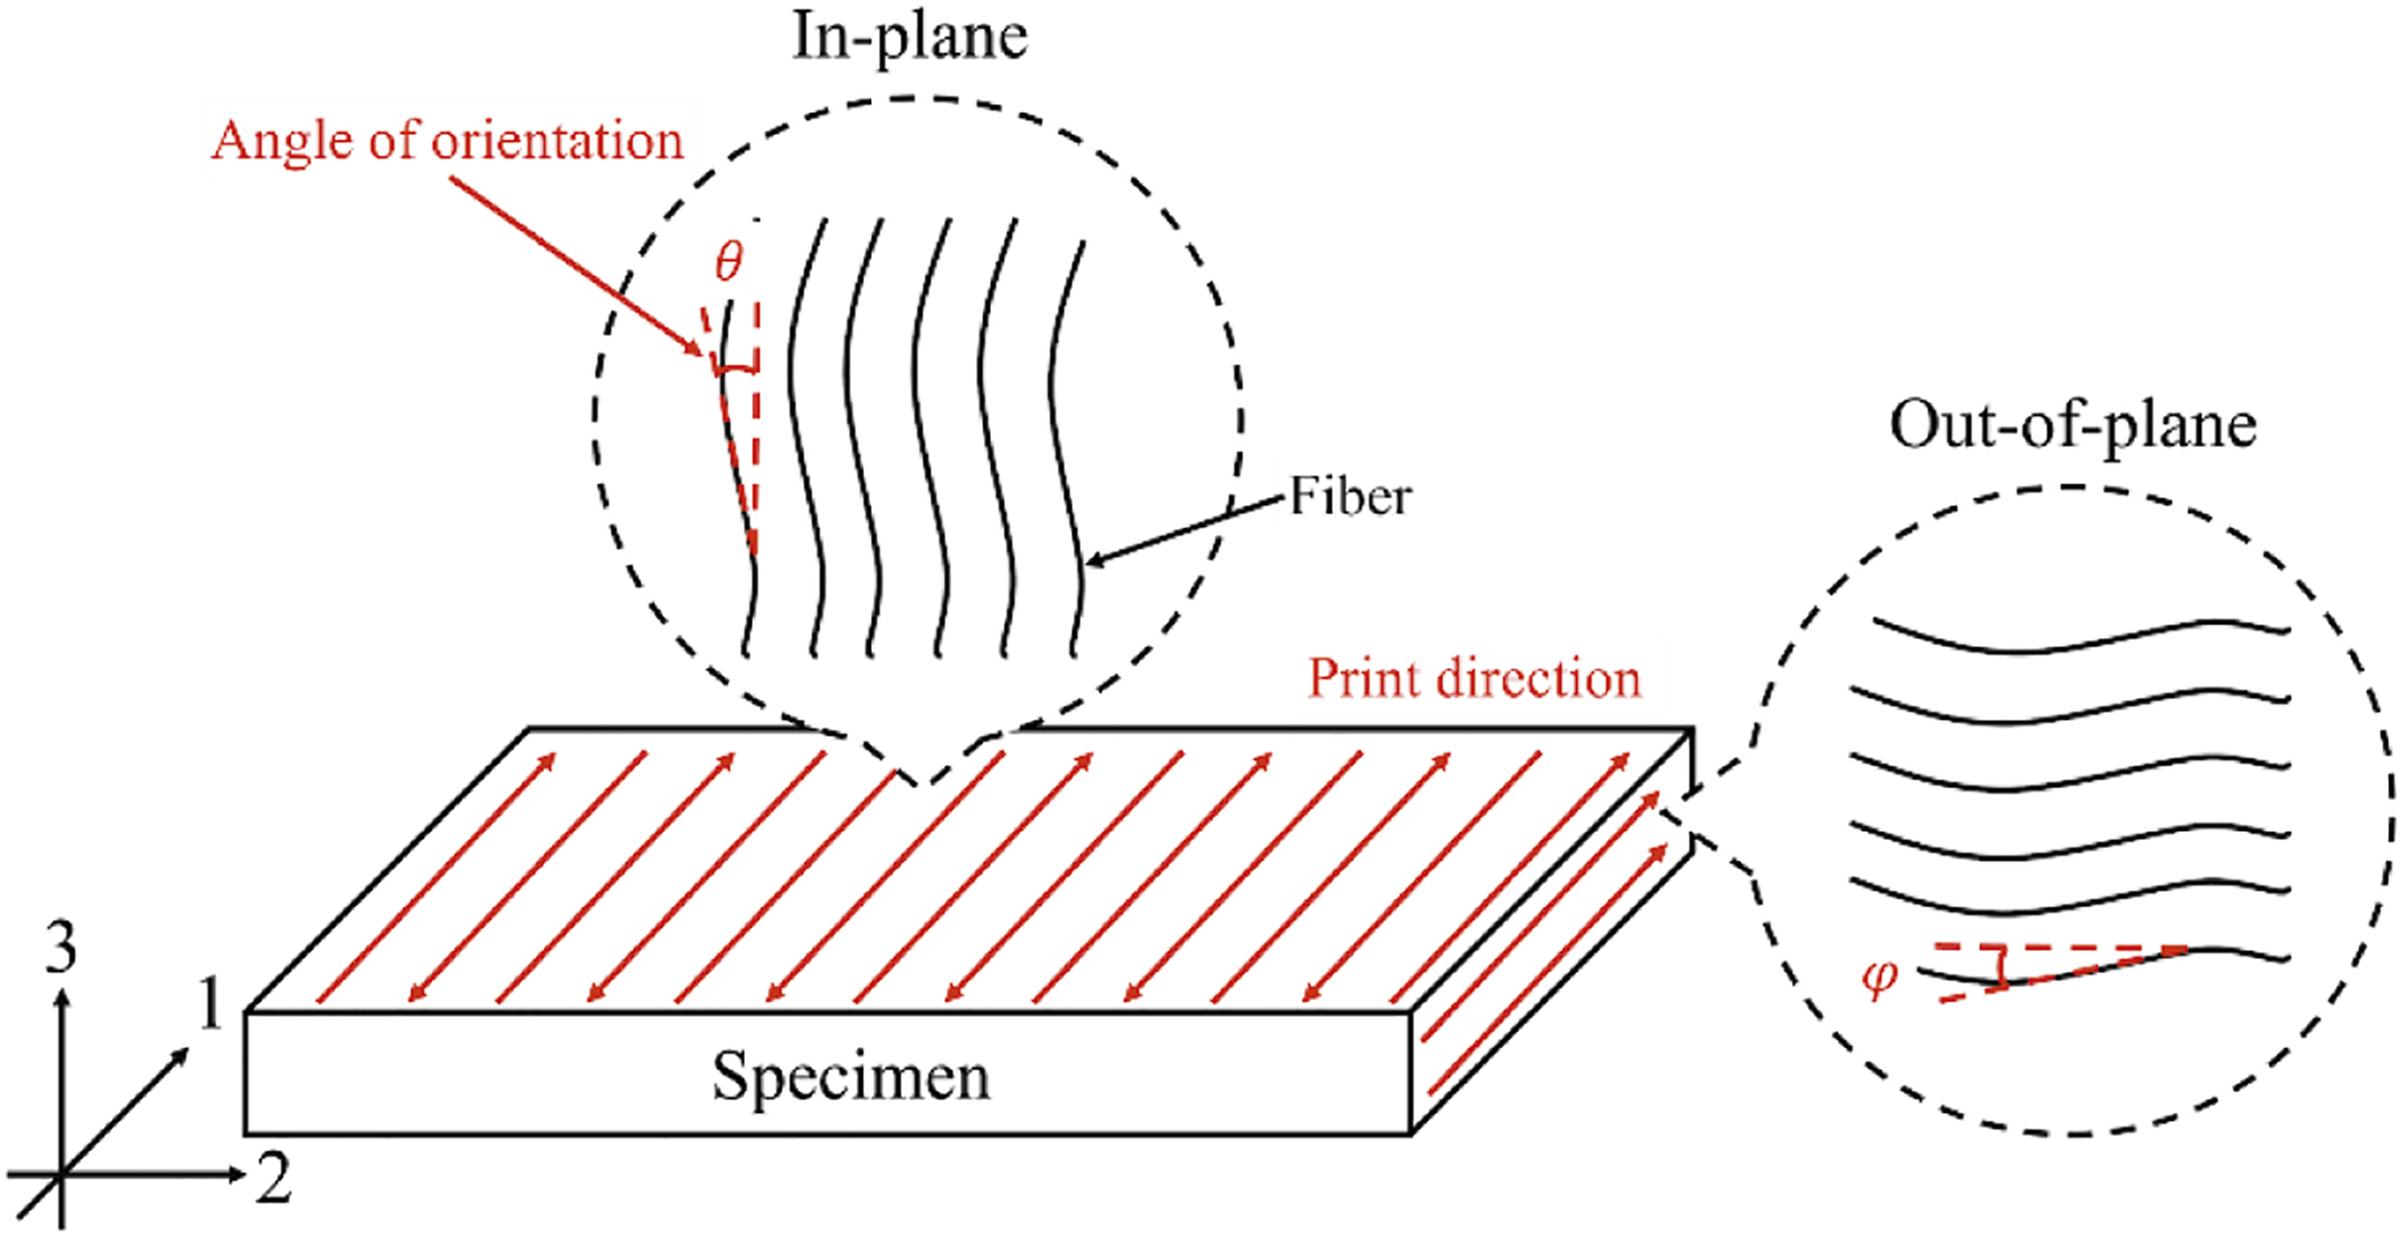
calculated the effective tensile modulus of discontinuous fiber composites with fiber orientation using the density function of the fiber orientation and rotation matrix. Based on the structural observation of the printed specimen, we assume that the fiber has in-plane and out-of-plane orientation angles, and the effective tensile modulus obtained by the fiber-resin model is transformed as follows: Fiber orientation of the 3D-oriented specimen.
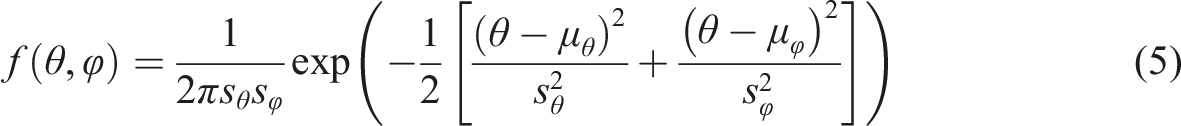

Equation (6) was evaluated via numerical integration using Simpson’s rule. The intervals of integration were ±
Polyzos et al.
18
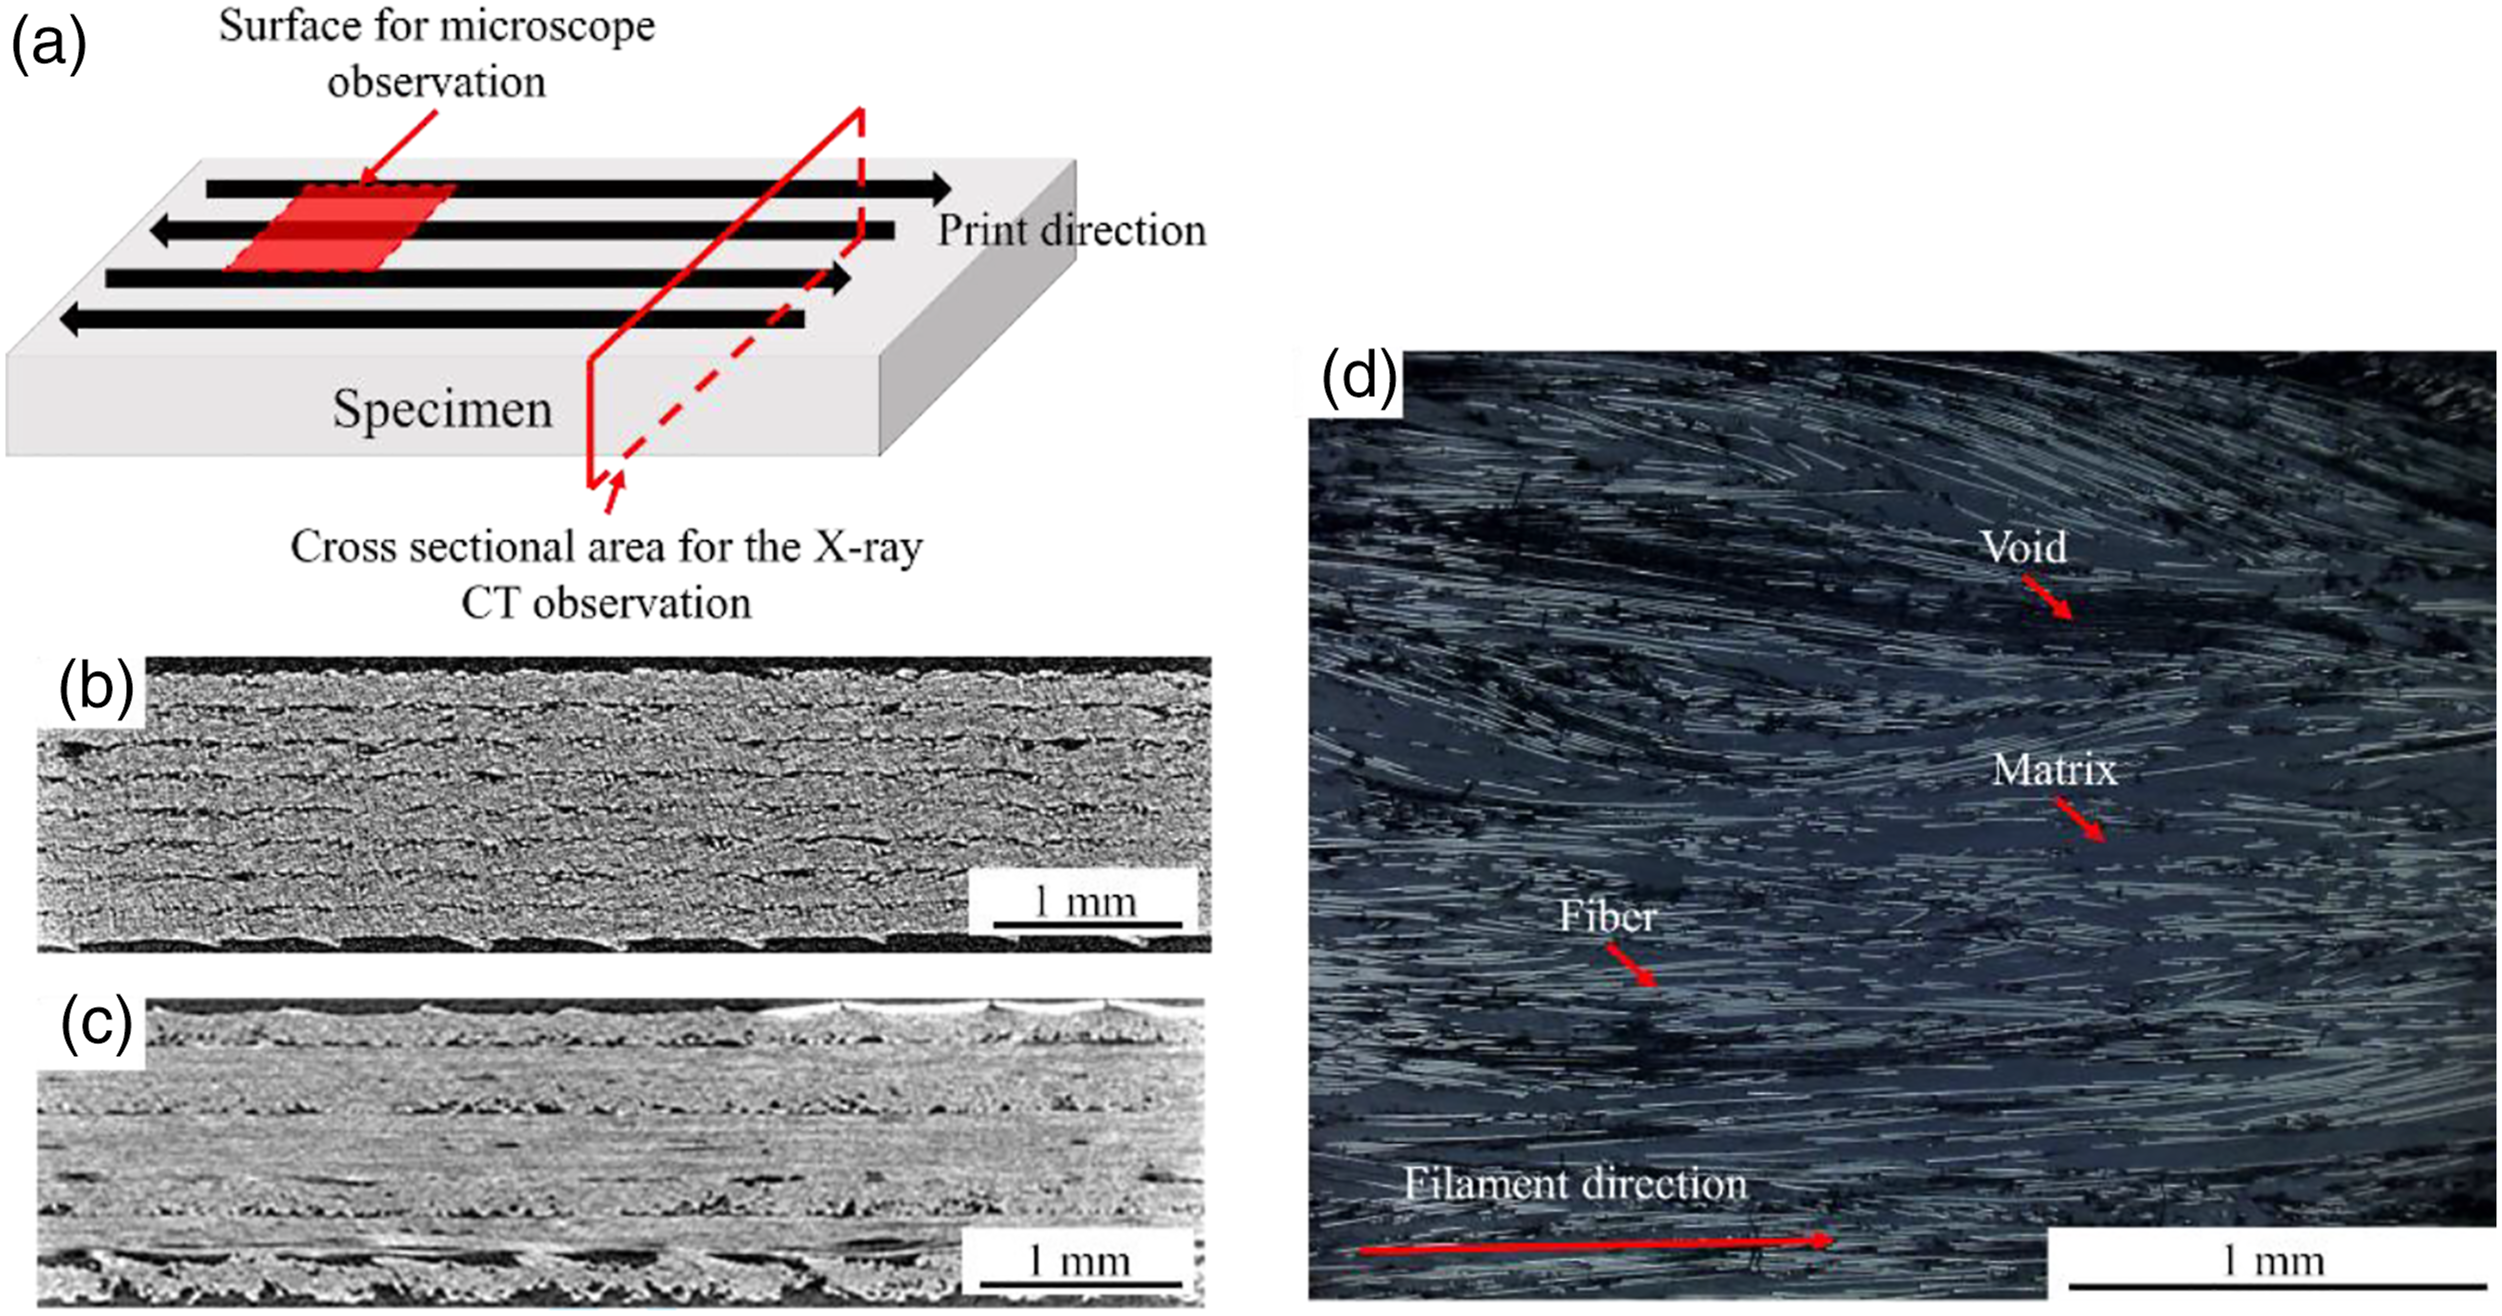
homogenized a filament as a void-less transversely isotropic material and predicted its effective stiffness using a representative volume element (RVE). The RVE model has an applied void geometry, as shown in Figure 5. The void geometry was a cylinder of infinite length. The RVE model applies periodic boundary conditions to the edges of the unit cell, where the void geometries prepared at the edges exhibit periodicity. The effective tensile modulus matrix Filament-void model developed in this study. (a) Illustration of the observation area and X-ray CT-images of (b) 0° and (c) 0°/90° specimens. (d) Digital microscope image of 0° specimen.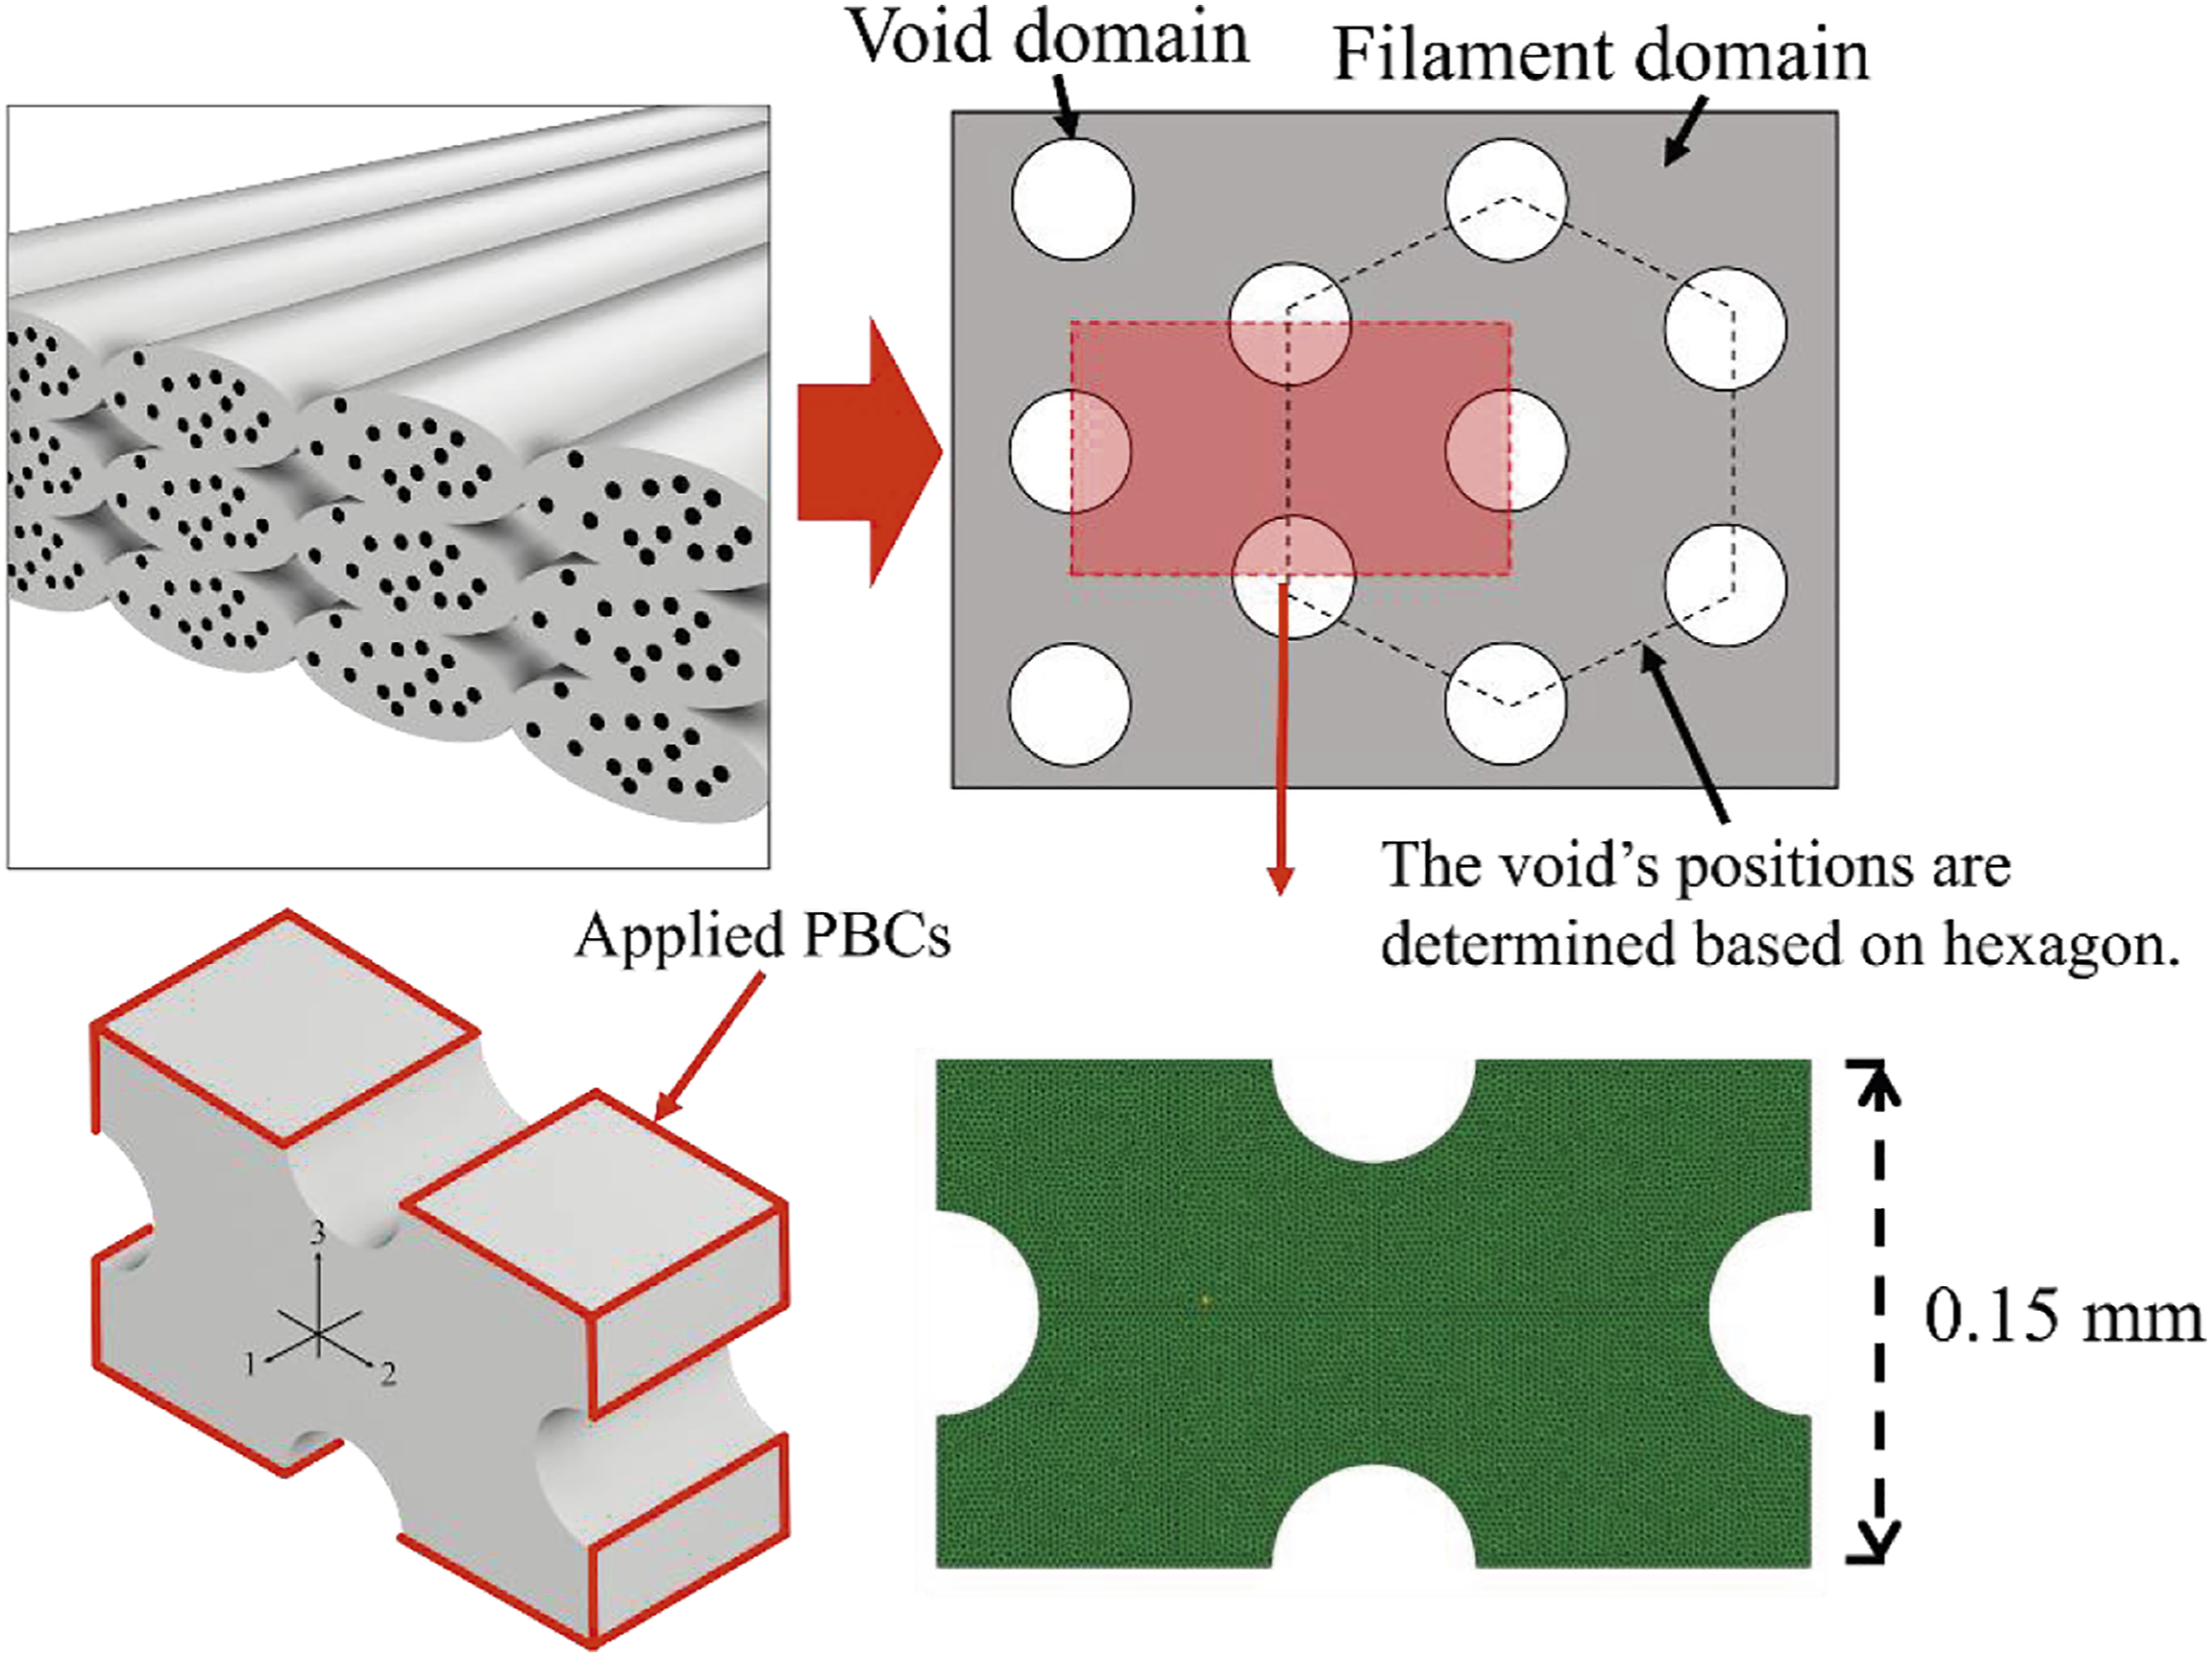
Mesoscale analysis
The objective of this section is to outline the applied numerical analysis method for predicting the OHT stress-strain responses of 3D-printed CFRTP. The quasi-3D XFEM developed by Higuchi et al. was used for the numerical simulation. 19 Based on the experimental observations, the method was modeled for multiple transverse cracking, delamination, and resultant failure. To date, an anisotropic pressure-dependent elastoplastic constitutive law proposed by Sun and Chen 20 and Yokozeki et al. 21 has been considered to take into account the nonlinear responses under tensile and compressive conditions.19,22,23 For the 0°/90° specimens in this analysis, however, the 0° and 90° plies showed a few plasticity deformations from the experimental results as described in the result section. Therefore, in this study, the XFEM analysis was conducted without plasticity deformation. Additionally, geometrical nonlinearity was not considered because the out-of-plane displacement before the maximum stress was small in the specimens. In the OHT simulations, only half of the laminate was modelled because the stacking sequence of the laminates was symmetrical. The laminate sizes were 103 mm long, 0.72 mm thick, 30.00 mm wide, and the center hole with a diameter of 6.00 mm was modeled. The mesh model consisted of 12,428 nodes and 24,317 6-node pentahedron elements. Considering the influence of thermal residual stress on the onset of damage and propagation, we conducted a thermal analysis before the incremental loading displacement. In the thermal analysis, the in-plane free shrinkage was acceptable, and only rigid motions were bound. After the thermal analysis, the loading analysis was performed using an implicit/static solver because the crosshead speed was sufficiently low to be treated as quasi-static. During the loading analysis, the strain was calculated from the displacement of the nodes at a distance of 25 mm from the center of the hole to compare the stress-strain diagram of the analysis with that of the experiment.
In this study, a cohesive zone model (CZM) with zig-zag softening law 24 for interlaminar cracks was applied using an interface element, 25 and that for the matrix crack was applied using the quasi-3D XFEM. 23 In this numerical analysis, multiple optional cracks were modeled without meshing and placed on the base 2D mesh that introduced the level-set functions. Subsequently, a quasi-3D mesh was created by pushing out the 2D mesh in the height direction. Additionally, discontinuous functions were added to the nodes to approximate the discontinuous displacement field in the elements, including the crack line. Furthermore, the crack line divides the elements with the crack into subareas and an interface element for numerical integration. In the sub-areas, the integral points and interface element were considered as the elastic model and CZM, respectively. This methodology of numerical analysis enabled us to conduct modeling separately from the mesh for several cracks in each layer, considering the influence of each damage mode. It should be noted that all the crack lines are pre-inserted, where damage is expected for initiation and propagation in each ply. This is because remapping the integral points is difficult with a numerical model that requires internal variable histories at each integral point. We adjusted the distance between the crack lines to 1.6 to improve convergence. Detailed formulations of the quasi-3D XFEM19,23 and descriptions of the CZM for delamination 26 can be found elsewhere.
The Weibull failure criterion proposed by Hallett et al.
27
has been introduced to predict the OHT strength.
19
This is the global criterion, which can evaluate the soundness of the entire layer, and can be expressed as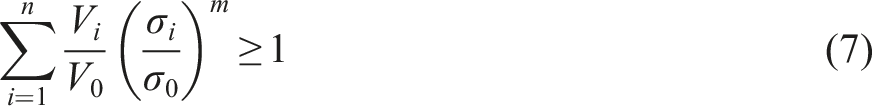

A finite element increment analysis of the 0°/90° specimen was conducted to investigate the validity of equation (8). The coupon was modeled using eight-node hexahedral elements (C3D8). Finite element increment analysis (FEM) code was applied to an elastic model, and the result was compared with the elastic model without equation (8).
Results and discussion
Microstructure
The microstructural characterization of 3D-printed CFRTPs provides information about the fiber alignment and void volume, which affect the mechanical performance, such as the tensile modulus and strength of the 3D-printed samples. The X-ray CT and digital microscopy images of the 3D-printed CFRTPs are shown in Figure 6. The void distribution can be evaluated from the X-ray CT images. As shown in Figure 6(b), voids are uniformly observed in the unidirectional specimen. On the other hand, the 0°/90° specimen presented voids between different layups (Figure 6(c)) because of the relatively poor adhesion between the 0° ply and 90° ply owing to the anisotropy of the thermal expansion coefficient. The porosities of the 0° and 0°/90° specimens were 14.86 ± 0.05% and 15.19 ± 1.28%, respectively. These values are in reasonable agreement with 3D-printed specimens reported previously (15.10 ± 0.35%
11
and 12.2% ± 0.9%
12
). Compared to conventional composite materials (2.5–3.7%,
28
0.02–3.75%
29
), these values are significantly larger and can negatively influence mechanical properties. Tang et al.
30
showed that an initial fiber misalignment angle of 7° in predicting the longitudinal compressive strength of unidirectional materials agreed with experimental values. They also mentioned that the initial misalignment angle was greater than that of conventional composite materials. Thus, the 3D-printed CFRTPs have more significant defects than the conventional fiber reinforced composite materials. Figure 6(d) shows a digital microscope image of the 0° specimen surface. Although the fiber directions were generally along the printing direction in the specimen, some of the carbon fibers twisted away from the printing direction. The in-plane and out-of-plane fiber orientation angles were −3.01 ± 8.42 and −0.52 ± 6.04°, respectively. A schematic diagram of the 3D printing process in this study is shown in Figure 7. Filaments heated by the nozzle are arranged to overlap with neighboring filaments, and the gaps created in this stacking process inside the specimen become voids (Figure 7(a)). In addition, since pressure is applied to the filaments, a flow (squeeze flow) is generated to spread the filaments in a transverse direction, resulting in a flattened shape. This squeeze flow causes waviness (Figure 7(b)). Schematic model of (a) microstructure of 3D printing of the unidirectional specimen and (b) fiber waviness caused by squeeze flow.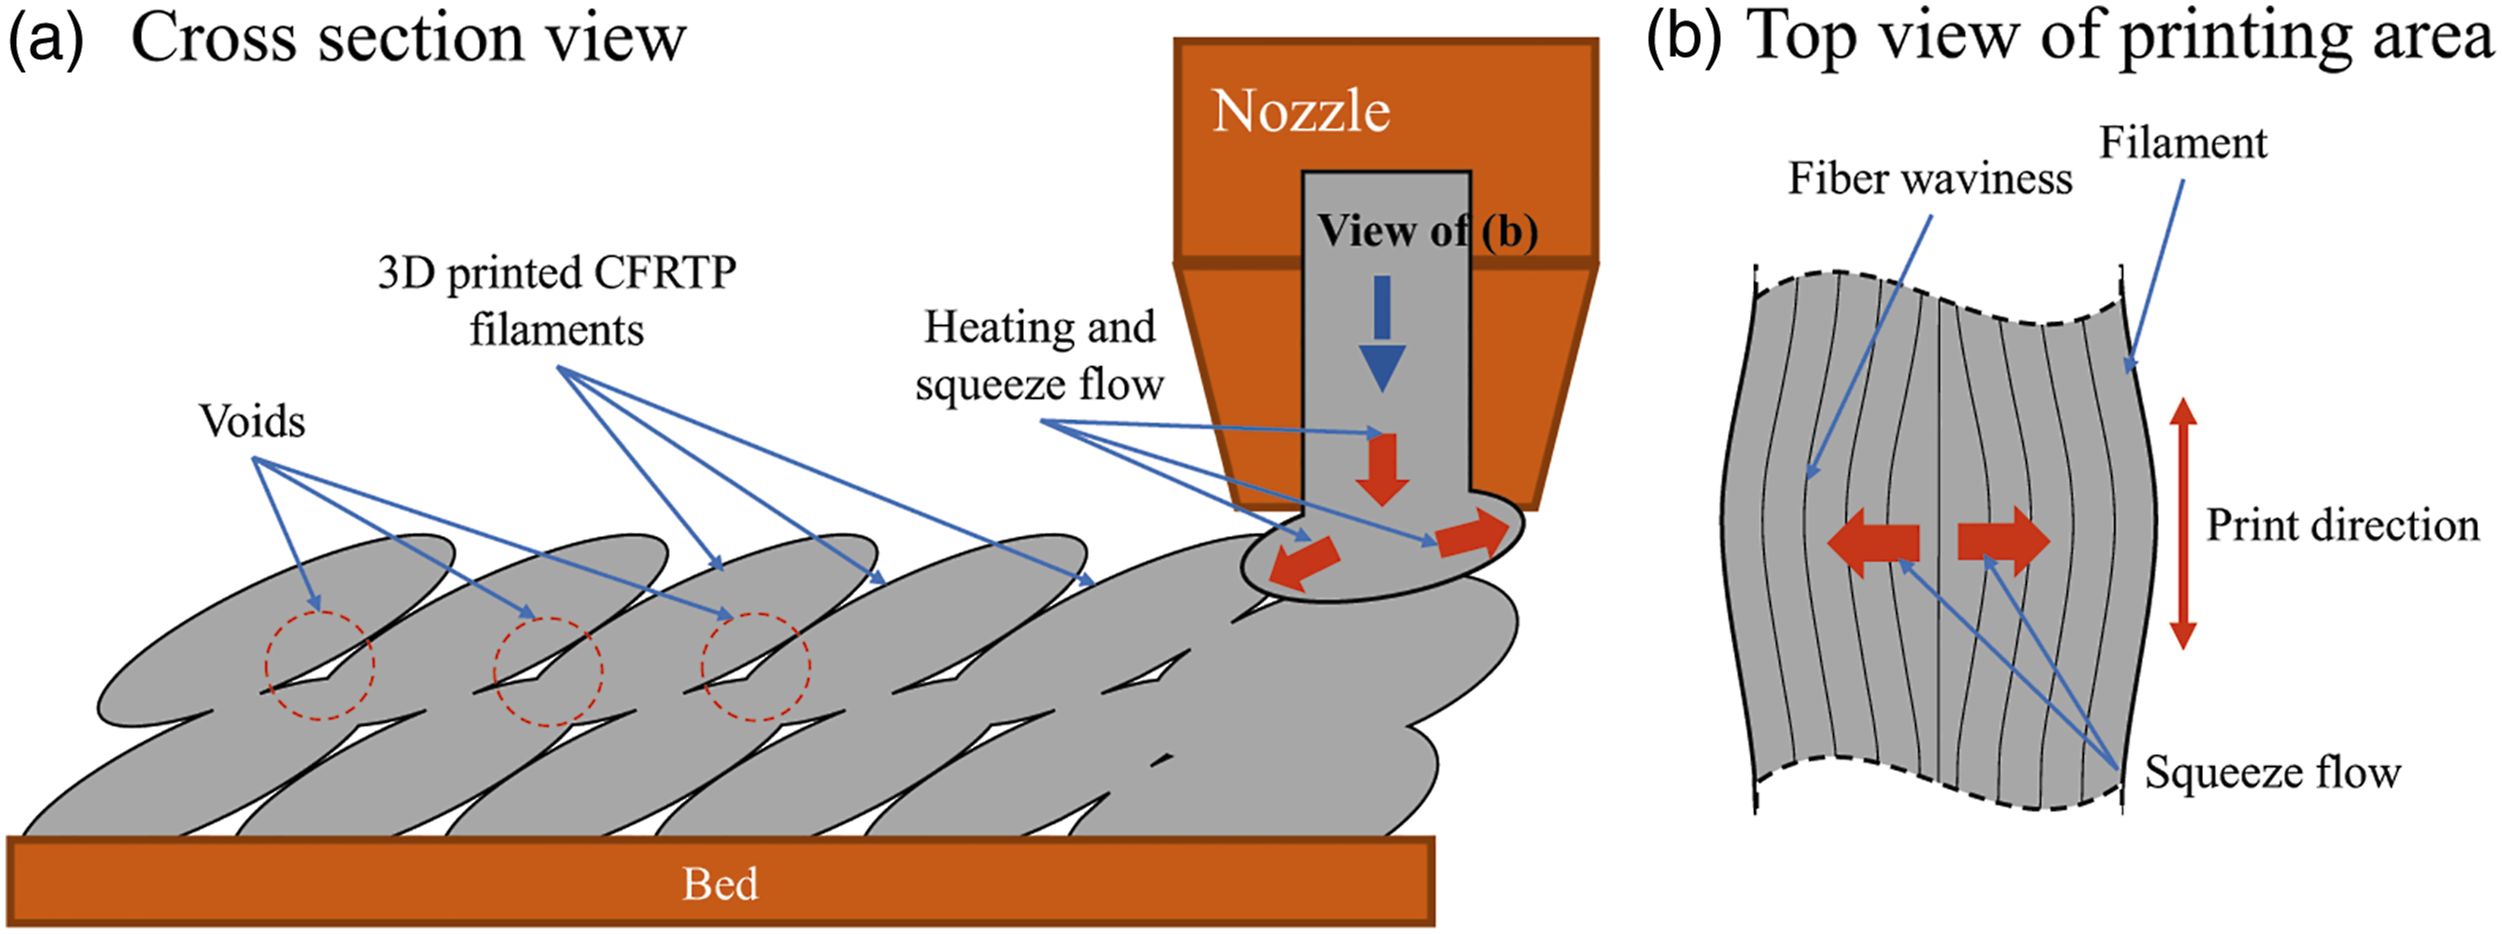
Non-hole tensile tests
Figure 8 shows the stress-strain curves for the uniaxial tensile tests. The experimental results (black solid lines) of the 0° and 0°/90° specimens show that even though an almost linear elastic regime is observed, the slope slightly increases as the tensile strain increases (Figure 8(a) and (d)), which arises from the slight orientation of the fiber bundle of the specimens, as shown in Figure 6(d), that is, the oriented fiber bundles straightened with the axial forces. This causes the rotation of the fiber angle with an increase in the tensile stress and brings about an increase in stiffness. The longitudinal tensile modulus, E11 and tensile strength, XT were 58.9 ± 1.6 GPa and 735.8 ± 68.2 MPa, respectively, which agree well with the previously reported literature,7,12 and the datasheet published by Markforged.
31
The tensile modulus and tensile strength of the 0°/90° specimens were 33.2 ± 0.5 GPa and 390.9 ± 16.1 MPa, respectively. On the other hand, the stress-strain curves for the ±45° and 90° specimens exhibit small plastic deformation with nonlinearity, as shown in Figure 8(b) and (c), respectively. The transverse tensile modulus (E22), tensile strength (YT), and failure strain were measured to be 4.7 ± 0.1 GPa, 28.9 ± 2.7 MPa, and 0.66 ± 0.07%, respectively. These values were slightly higher than those obtained in previous studies,7,12 suggesting that the tensile modulus and tensile strength of the PA6 matrix were different because of the high building platform temperature for the 90° specimen (Table 1). The initial slopes of the shear stress-shear strain curves and shear stress at failure shown in Figure 8(c) were taken as the shear modulus and shear strength, respectively, and these values were 2.0 ± 0.1 GPa and 45.9 ± 1.2 MPa, respectively. The shear strain at failure of the specimen prepared in this study was relatively small (=5.81 ± 0.30%), resulting in relatively smaller shear strength. Based on the literature, the shear strains of the ±45° specimen for thermoset CFRP (IM7/8552)
32
and thermoplastic CFRP (T700 G/LM-PAEK)
22
were 8.4% and 22.8%, respectively, which are significantly larger than that of the specimen in this study, suggesting that the ±45° specimen prepared in this study exhibited relatively smaller plasticity. Stress-strain curve for NHT tests: (a) 0° specimen and fitting curve using equation (8), (b) 90° specimen, (c) ±45° specimen and (d) 0°/90° specimen and FE analyses.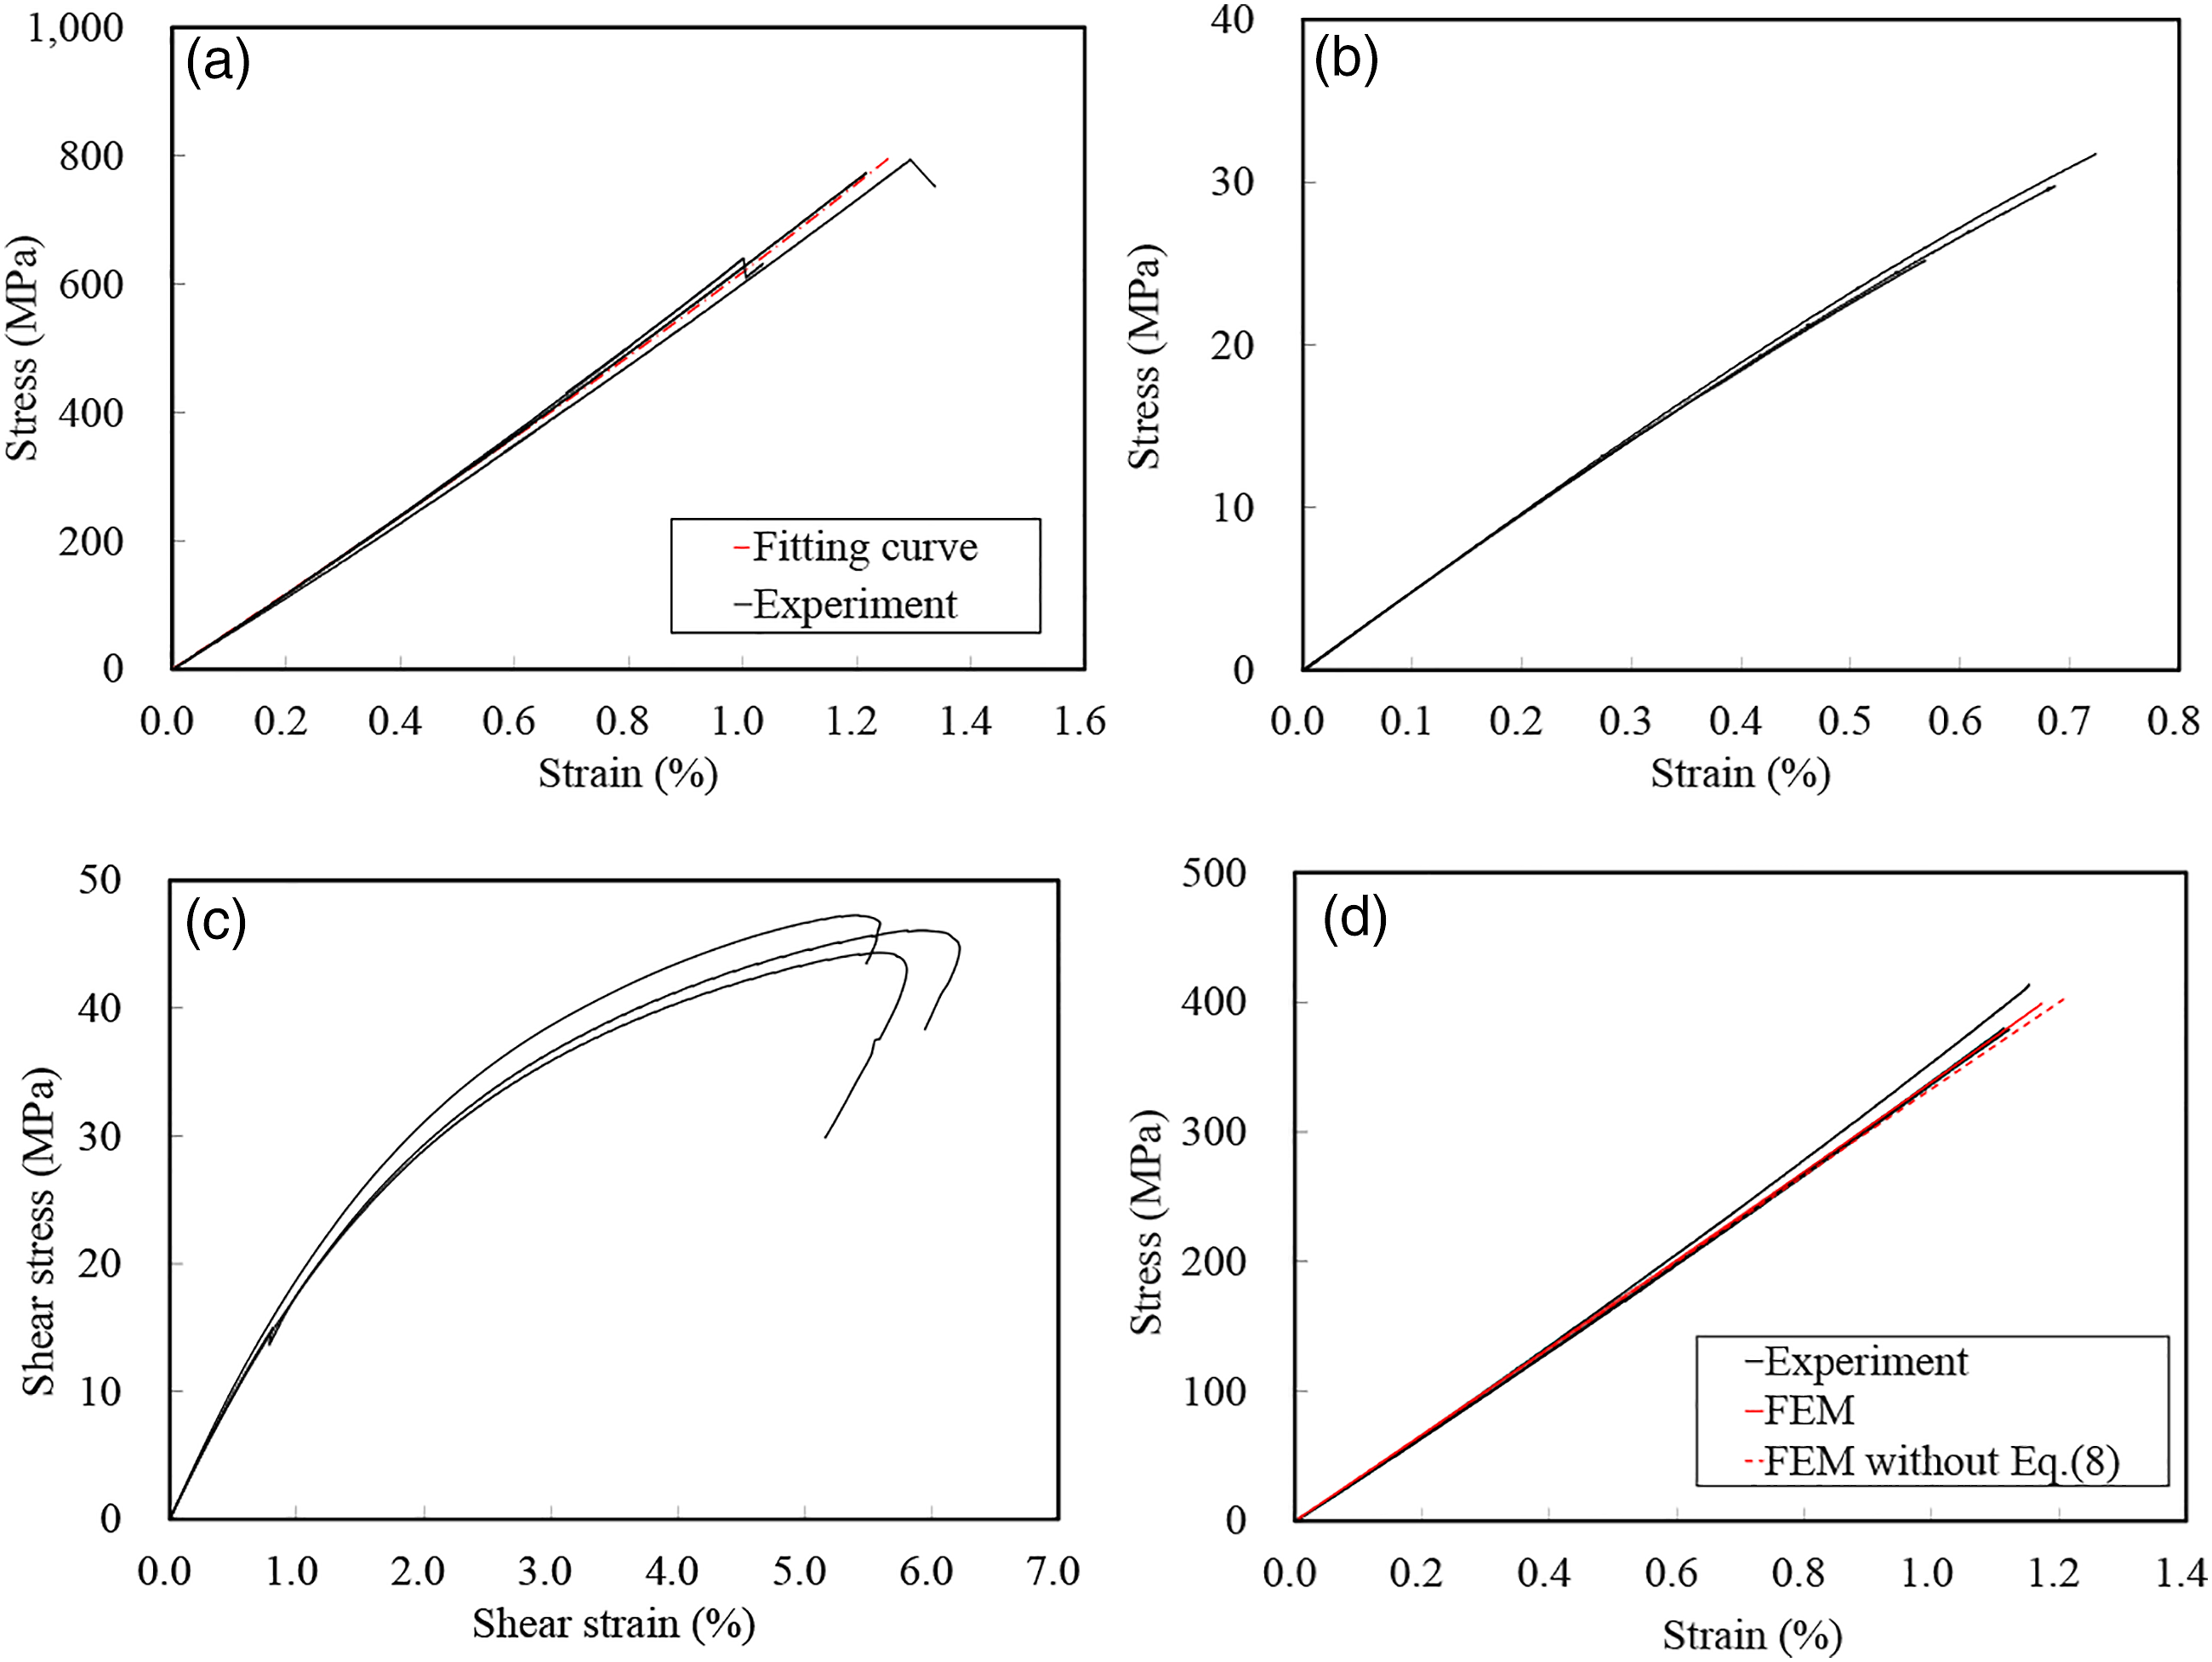
Prediction of effective tensile modulus
The parameter for prediction of effective tensile moduli.
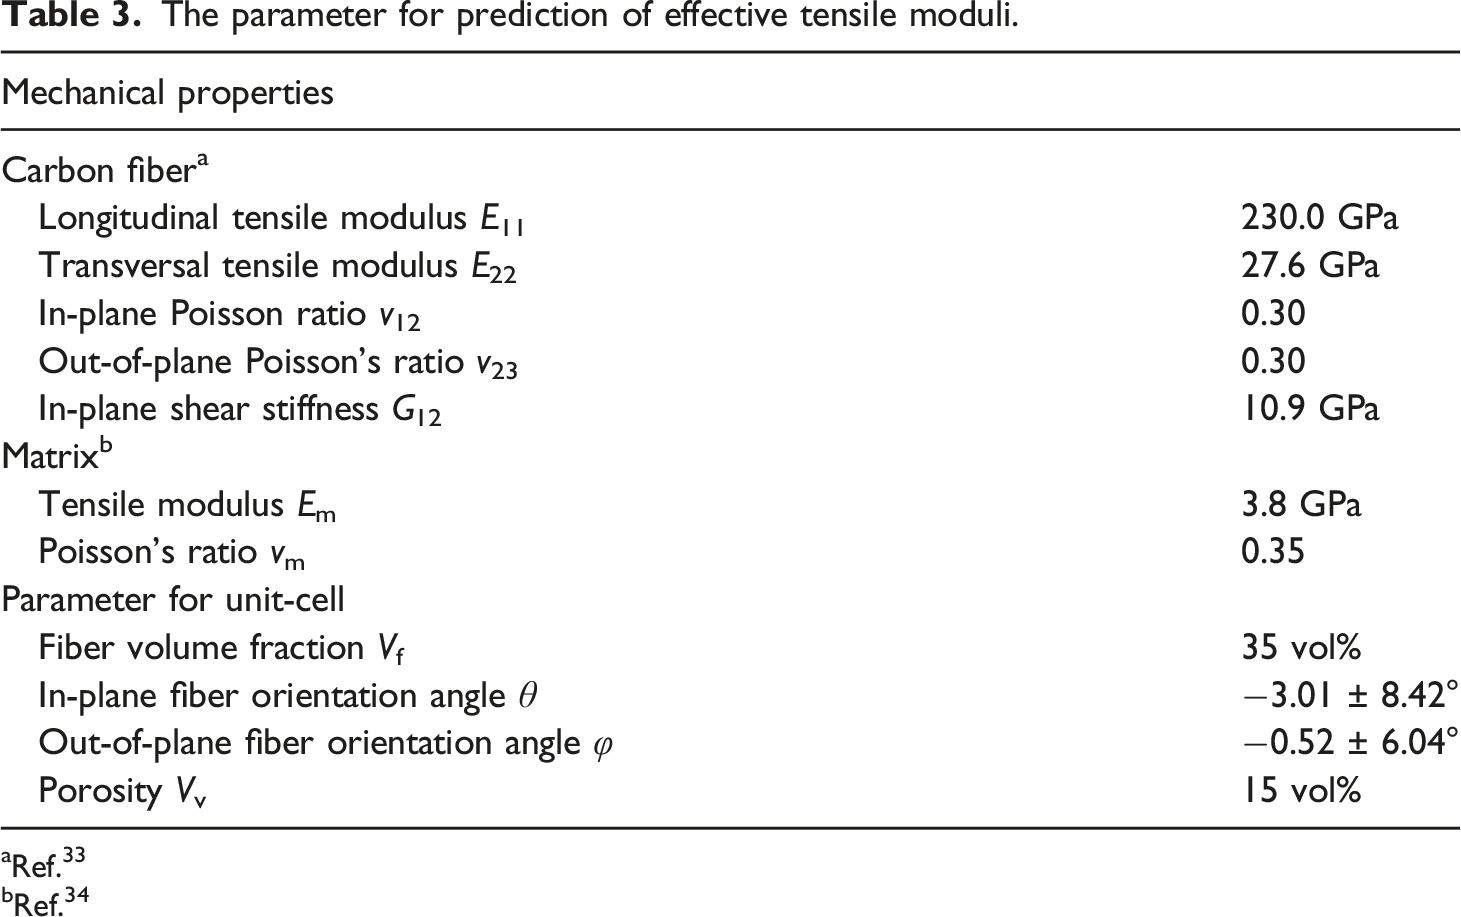
aRef. 33
bRef. 34
Comparison of the experimental and numerical results.
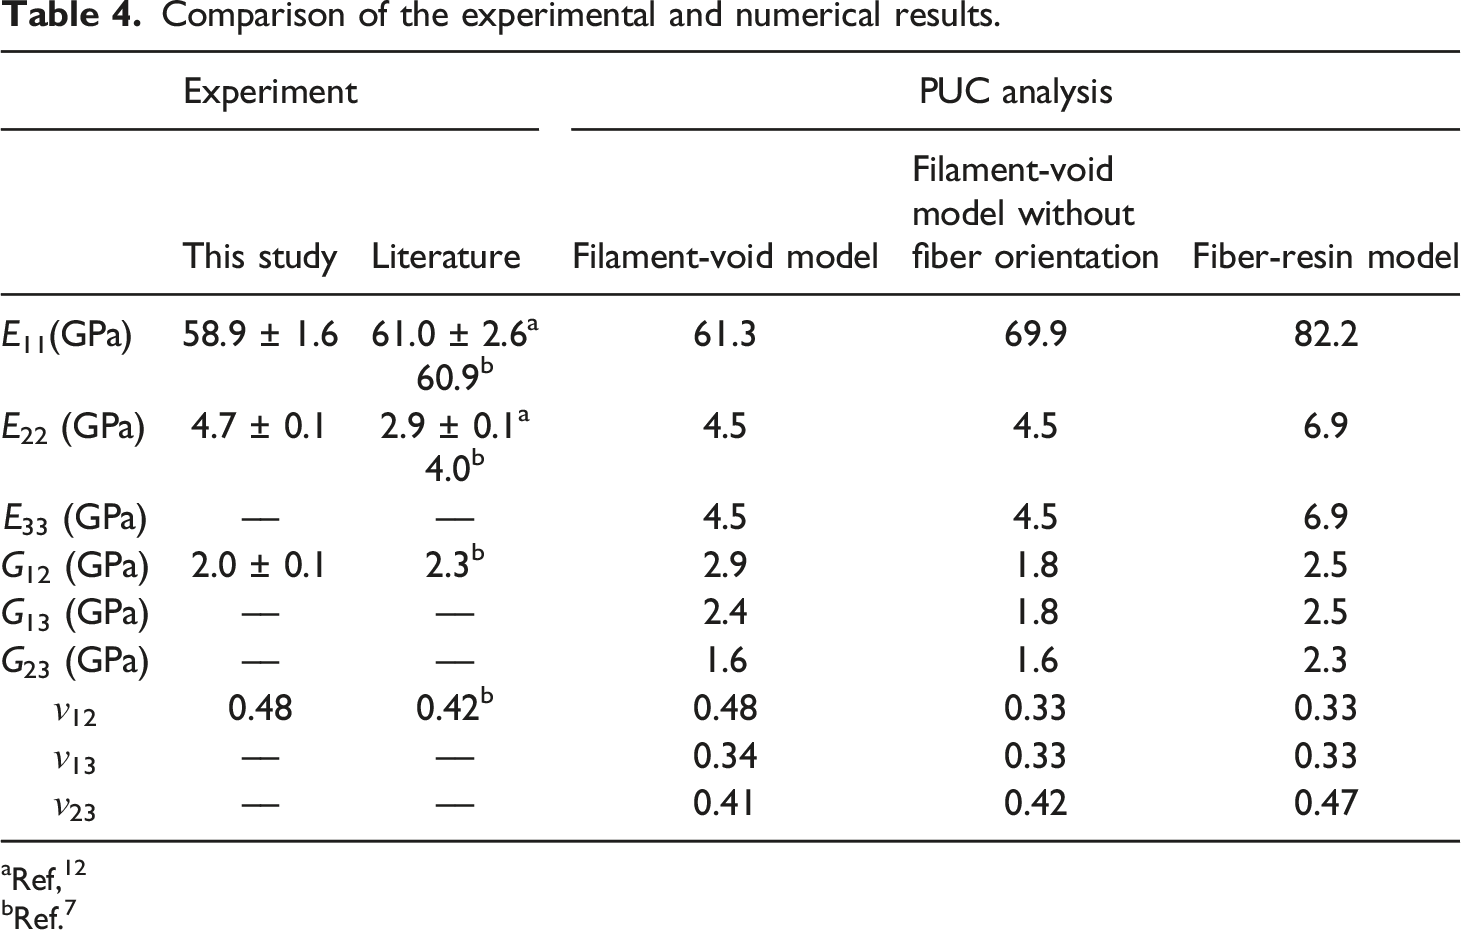
aRef, 12
bRef. 7
Open-hole tensile tests of 0°/90° specimen
The experimental and numerical results of the OHT tests of the 0°/90° specimen are presented in this section. The experimental and computational stress-strain curves for the OHT tests are shown in Figure 9(a). The experimental results (black solid lines) show that an almost linear elastic regime was observed up to the point of fracture strength of 226.0 ± 9.0 MPa at a strain of 0.57 ± 0.01%. The slightly nonlinear behavior is attributed to the fact that the fibers in the 0° plies were oriented in the load direction, and the stiffness increased. Fiber breakage, which is characterized by the Weibull statistical model in the XFEM analysis, is the main failure mode in the OHT specimen prepared in this study. The result of OHT tests prepared by FFF: (a) Stress-strain curve, (b) fracture surface, and (c) predicted damage distribution just before the judgment of failure.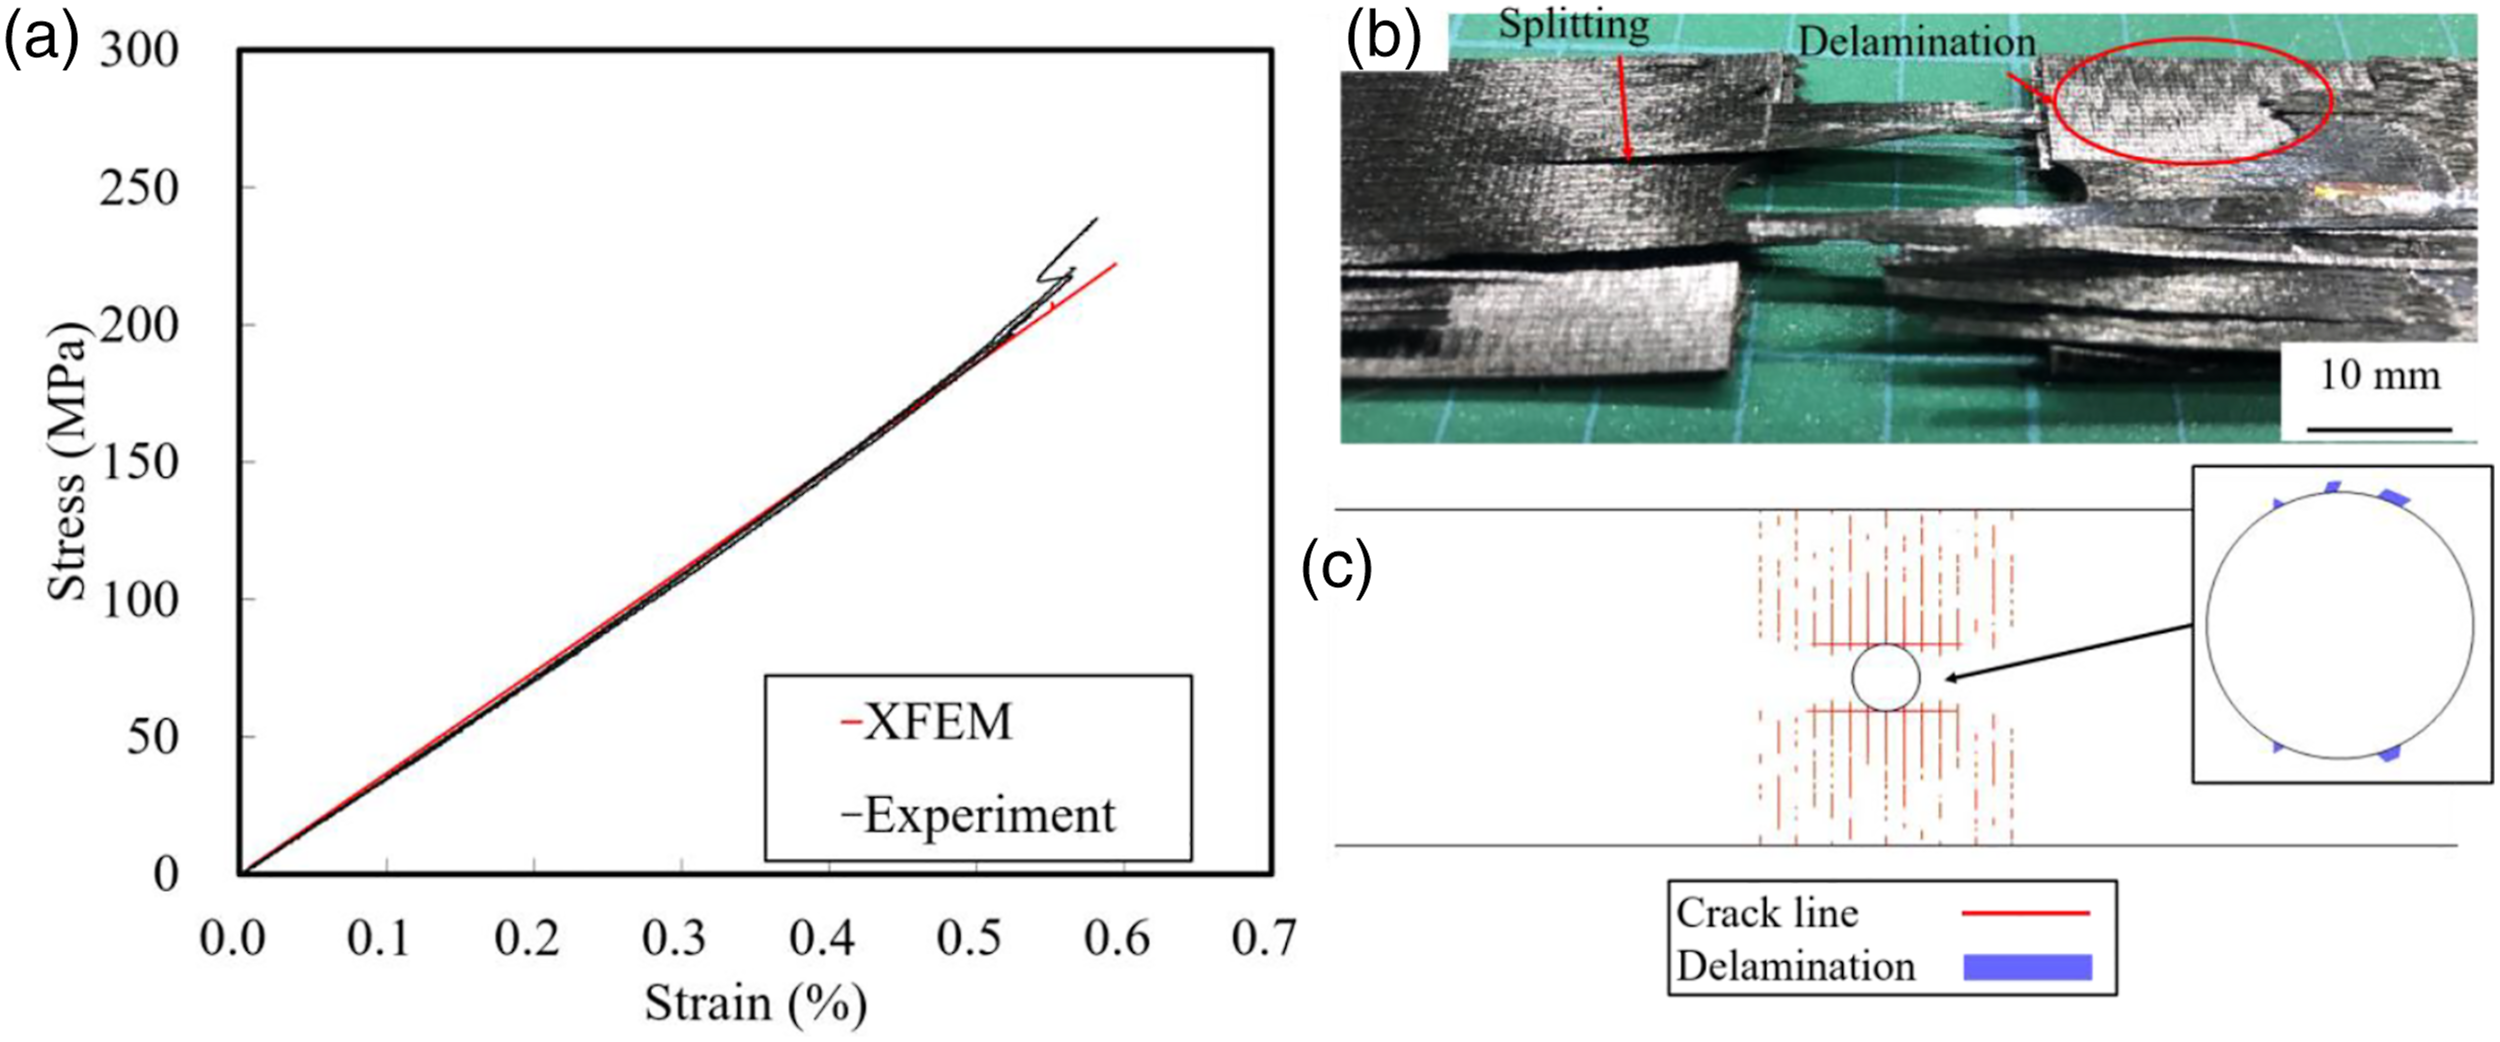
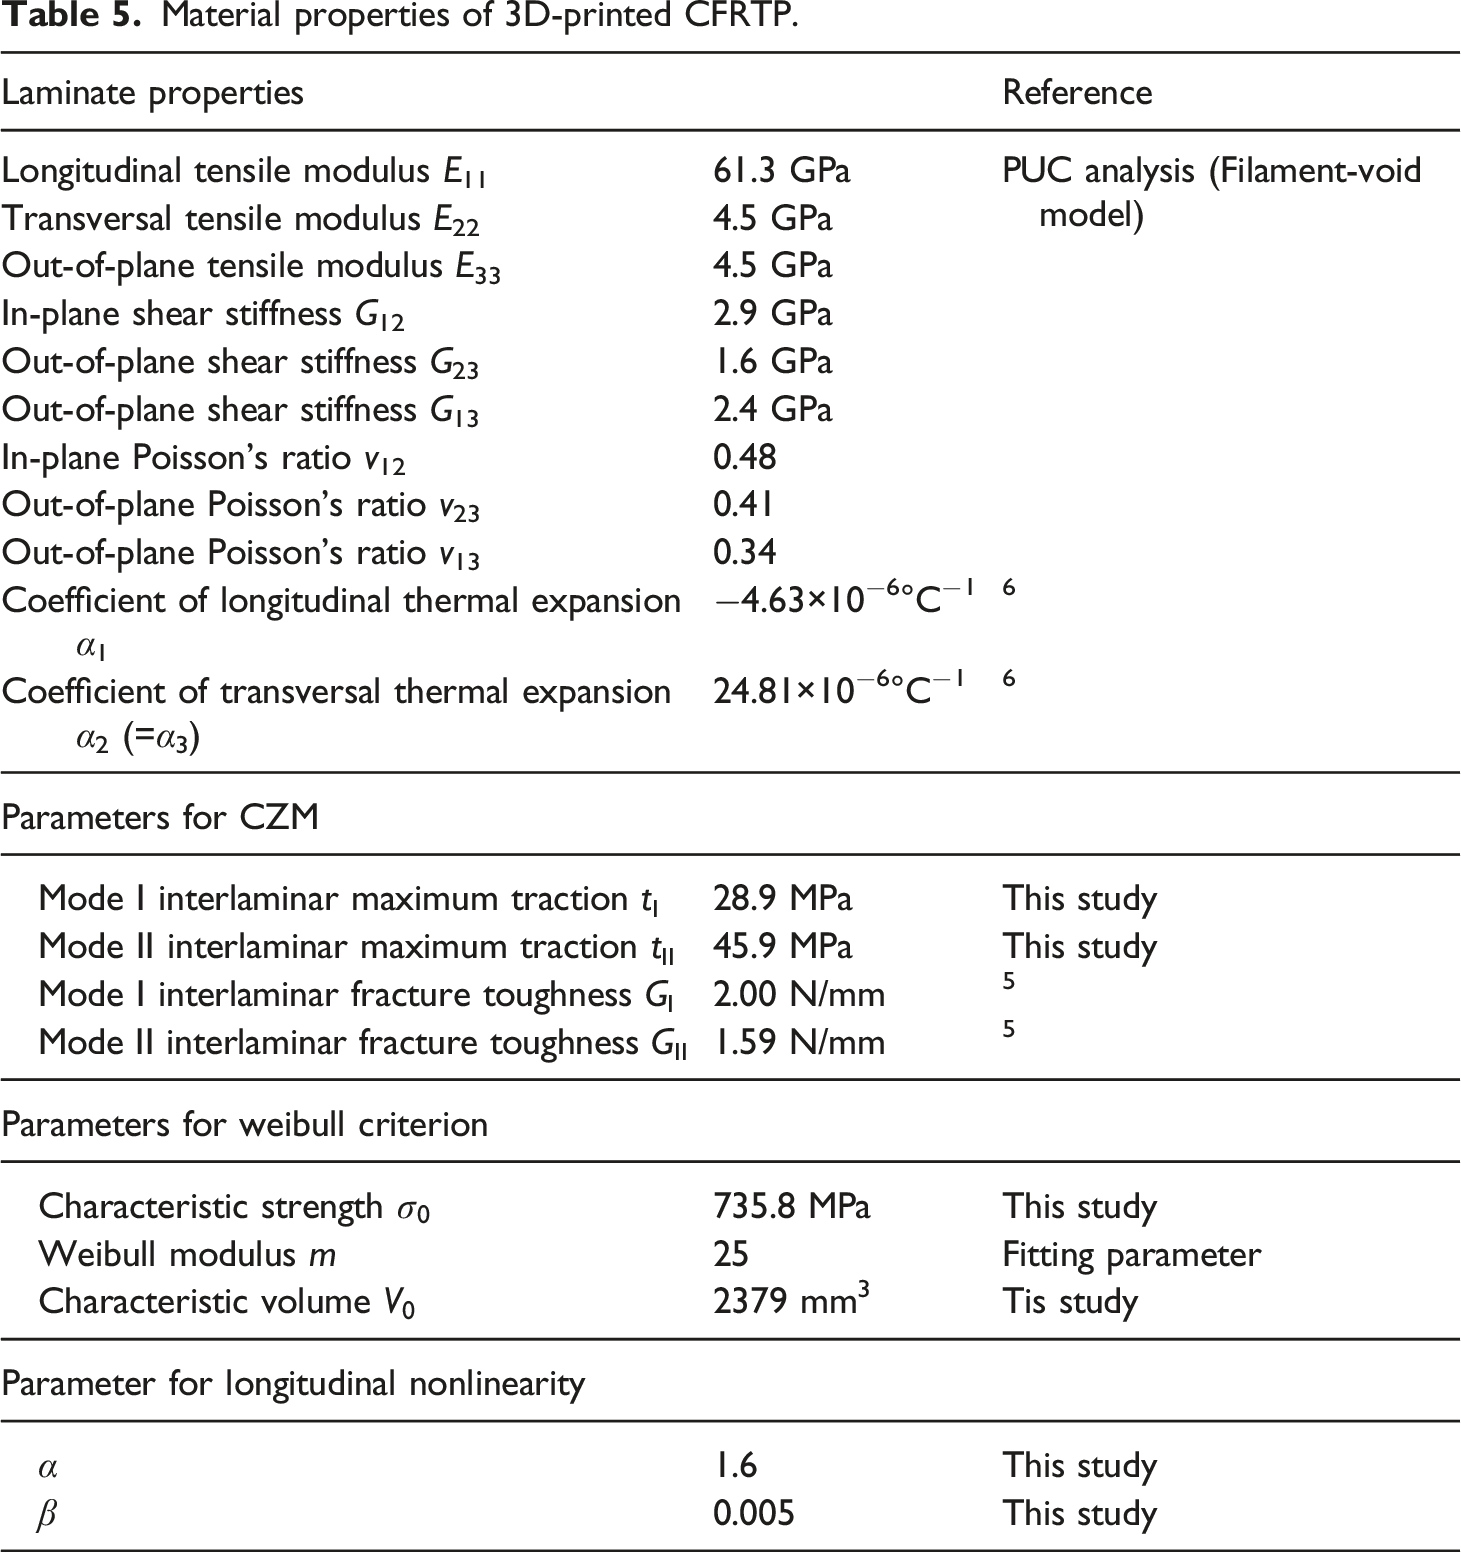
Material properties of 3D-printed CFRTP.
The prediction of the stress-strain response using the effective tensile modulus obtained in the microscale analysis is also useful for non-hole specimens. The solid red line in Figure 8 shows the FEM result for the 0°/90° laminate model, where the predicted tensile modulus (33.4 GPa) is in good agreement with the experimental result (33.2 GPa). The model with equation (8) can predict the nonlinearity until failure compared to an elastic model only.
Figure 9(b) shows the damage near the center hole after the fracture, where 0° ply splitting and delamination were observed. In the experiment, the crack propagates to the whole region immediately and the stress immediately decreases at the fracture point, it is challenging to observe damage initiation. To discuss the damage prior to the fracture, the predicted internal damage distributions just before the judgment of failure is shown in Figure 9(c). The transverse cracks and splitting have occurred, and a slight interlaminar delamination has expanded at the hole edge. Since the predicted stress-strain response agrees with the experiment (Figure 9(a)), it seemed that similar damage propagation happened in the experiment, leading to the final failure by fiber breakage. However, as shown in Figure 9(b), the damage distribution of the OHT fracture surface was more significant than the analysis, suggesting that the crack has propagated immediately through the voids after fiber breakage.
Additional discussion of the effects of hole diameter and ply thickness on OHT strength and stress concentration factor using XFEM. The stacking sequence was [0/90
n
]2s (n = 1, 2, 3), and hole diameter a to width b (=30 mm) ratio was considered as a/b = 0.1, 0.2, 0.4, and 0.6. The predicted OHT strengths are plotted with respect to the hole diameter to width ratio (a/b) in Figure 10(a). The estimated curves (dash-lines) in Figure 10(a) of OHT strength were created using an exponential function. For n = 1, the intercept of the estimated curve, i.e. the specimen without a circular hole, the predicted OHT strength is 365.4 MPa, which is approximately in agreement with the experimental results (Figure 8(d)), suggesting that we have obtained a reasonable strength prediction curve. The OHT strength decreased with the number of 90° plies (n = 2 and 3). It indicates that the stress of the laminate decreased since the stress on the 0° layer did not change despite the change in layer thickness, and fiber breakage was more likely to occur earlier. The relationship between stress concentration factor α and a/b is shown in Figure 10(b). The α is expressed as σN/σ0, the ratio of the average stress σN at the edge of the hole to the stress σ0 calculated using the actual cross sectional area of the specimen width subtracted by the hole diameter. The α increases with decreasing a/b from 0.6 to 0.2, but it decreases at a/b = 0.1 for n = 1 and 2. This may be due to high stress concentrations that facilitated the propagation of damage and reduced stress at the hole edges. Relationship between (a) OHT strength and (b) stress concentration factor (α) and hole diameter to width ratio (a/b).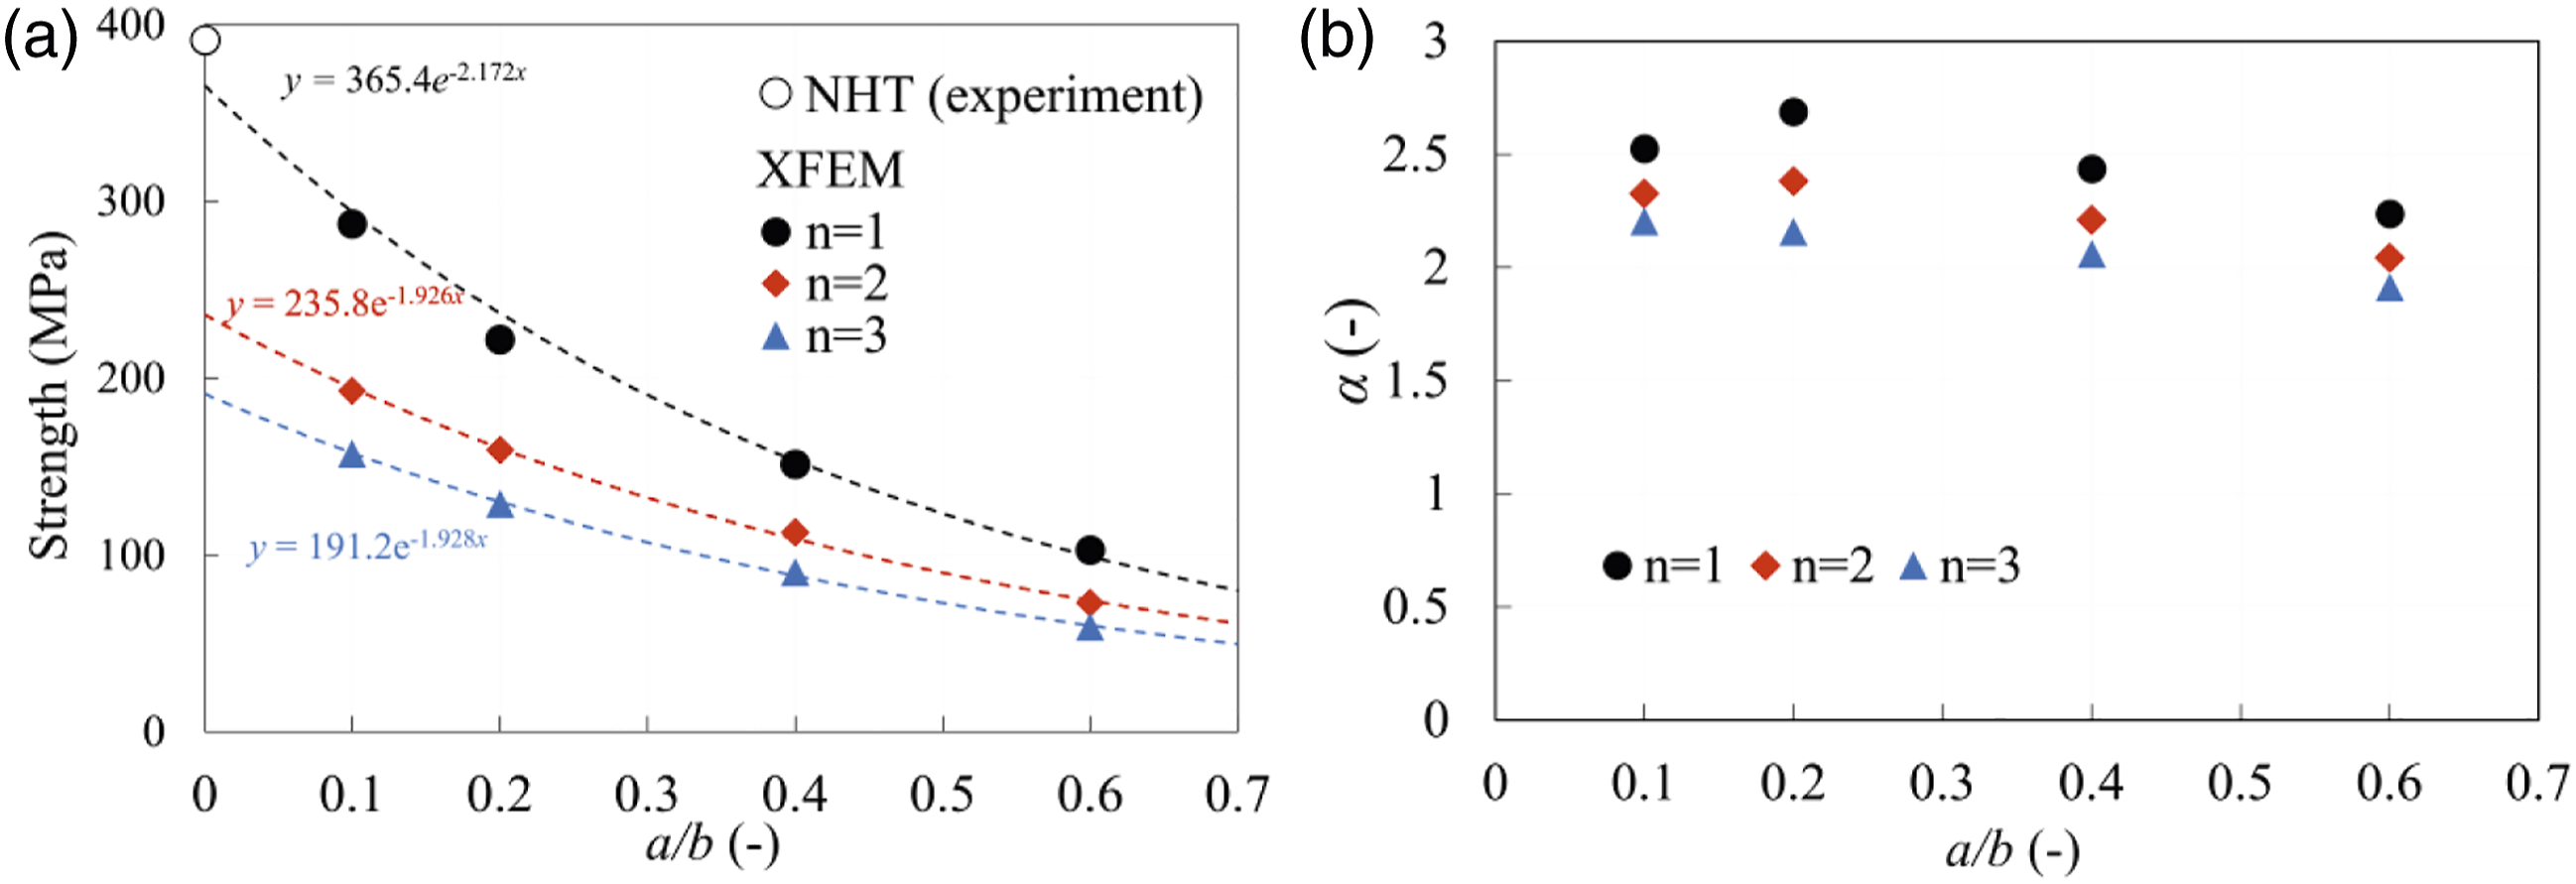
Hot pressing for 3D-printed specimens
Several researchers have demonstrated that hot pressing is an effective method to improve the mechanical properties of 3D-printed CFRTPs.12,35,36 In this section, hot-press molding was applied to a 0°/90° specimen as a post-process. Subsequently, OHT tests and XFEM analysis were performed, and the stress-strain response and fracture morphology were compared with those of the as-printed 0°/90° specimen.
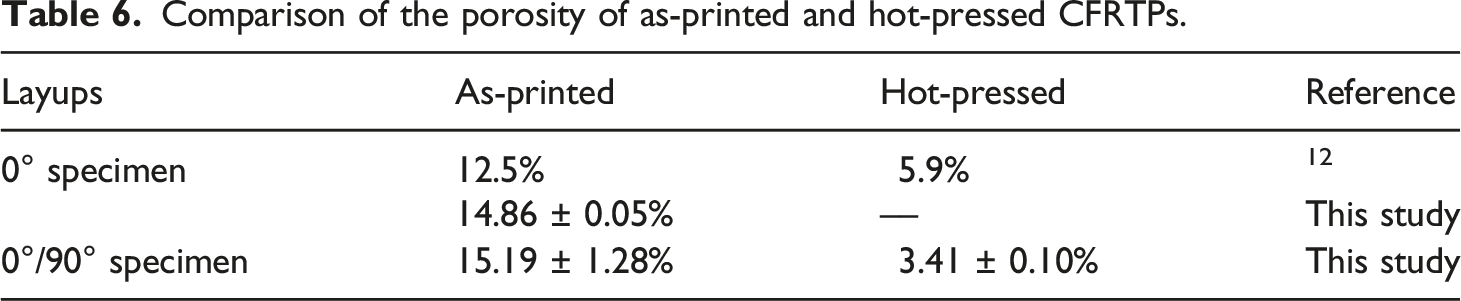
An X-ray CT image of the hot-pressed specimen is shown in Figure 11(a), where it was observed the voids decreased, that is, the porosity decreased from 15.19 ± 1.28% (as-printed specimen) to 3.41 ± 0.10%. Table 6 shows the porosity of as-printed and hot-pressed. It indicates that post-processing like a hot-press improves the microstructure of the 3D-printed specimen. On the other hand, the thickness of the 0° plies decreased compared with that of the 90° plies, and the total thickness of the specimens after hot pressing decreased by 17%. The thicknesses of the 0°and 90° plies were estimated from Figure 11(b), and the average values were 0.119 mm and 0.143 mm, respectively. Because the recurrence time of the extruder is longer in the printing 0° ply than in the 90° printing ply, the printed filaments easily lose their heat. When a 0° ply is printed on a 90° ply, the adhesive of the 0° ply is poor, and the amount of 0° ply filament decreases. Furthermore, the fiber orientation distribution was measured, and the out-of-plane and in-plane angles were −0.42 ± 3.06 and 0.11 ± 3.41° from Figure 11(b) and (c), respectively, which indicates that the hot press improves the fiber orientation distribution. (a) An X-ray CT image of hot-pressed 0°/90° specimen. (b) Low magnification cross-sectional view and (c) high magnification in-plane view showing 0° ply of hot-pressed 0°/90° specimen. Comparison of the porosity of as-printed and hot-pressed CFRTPs.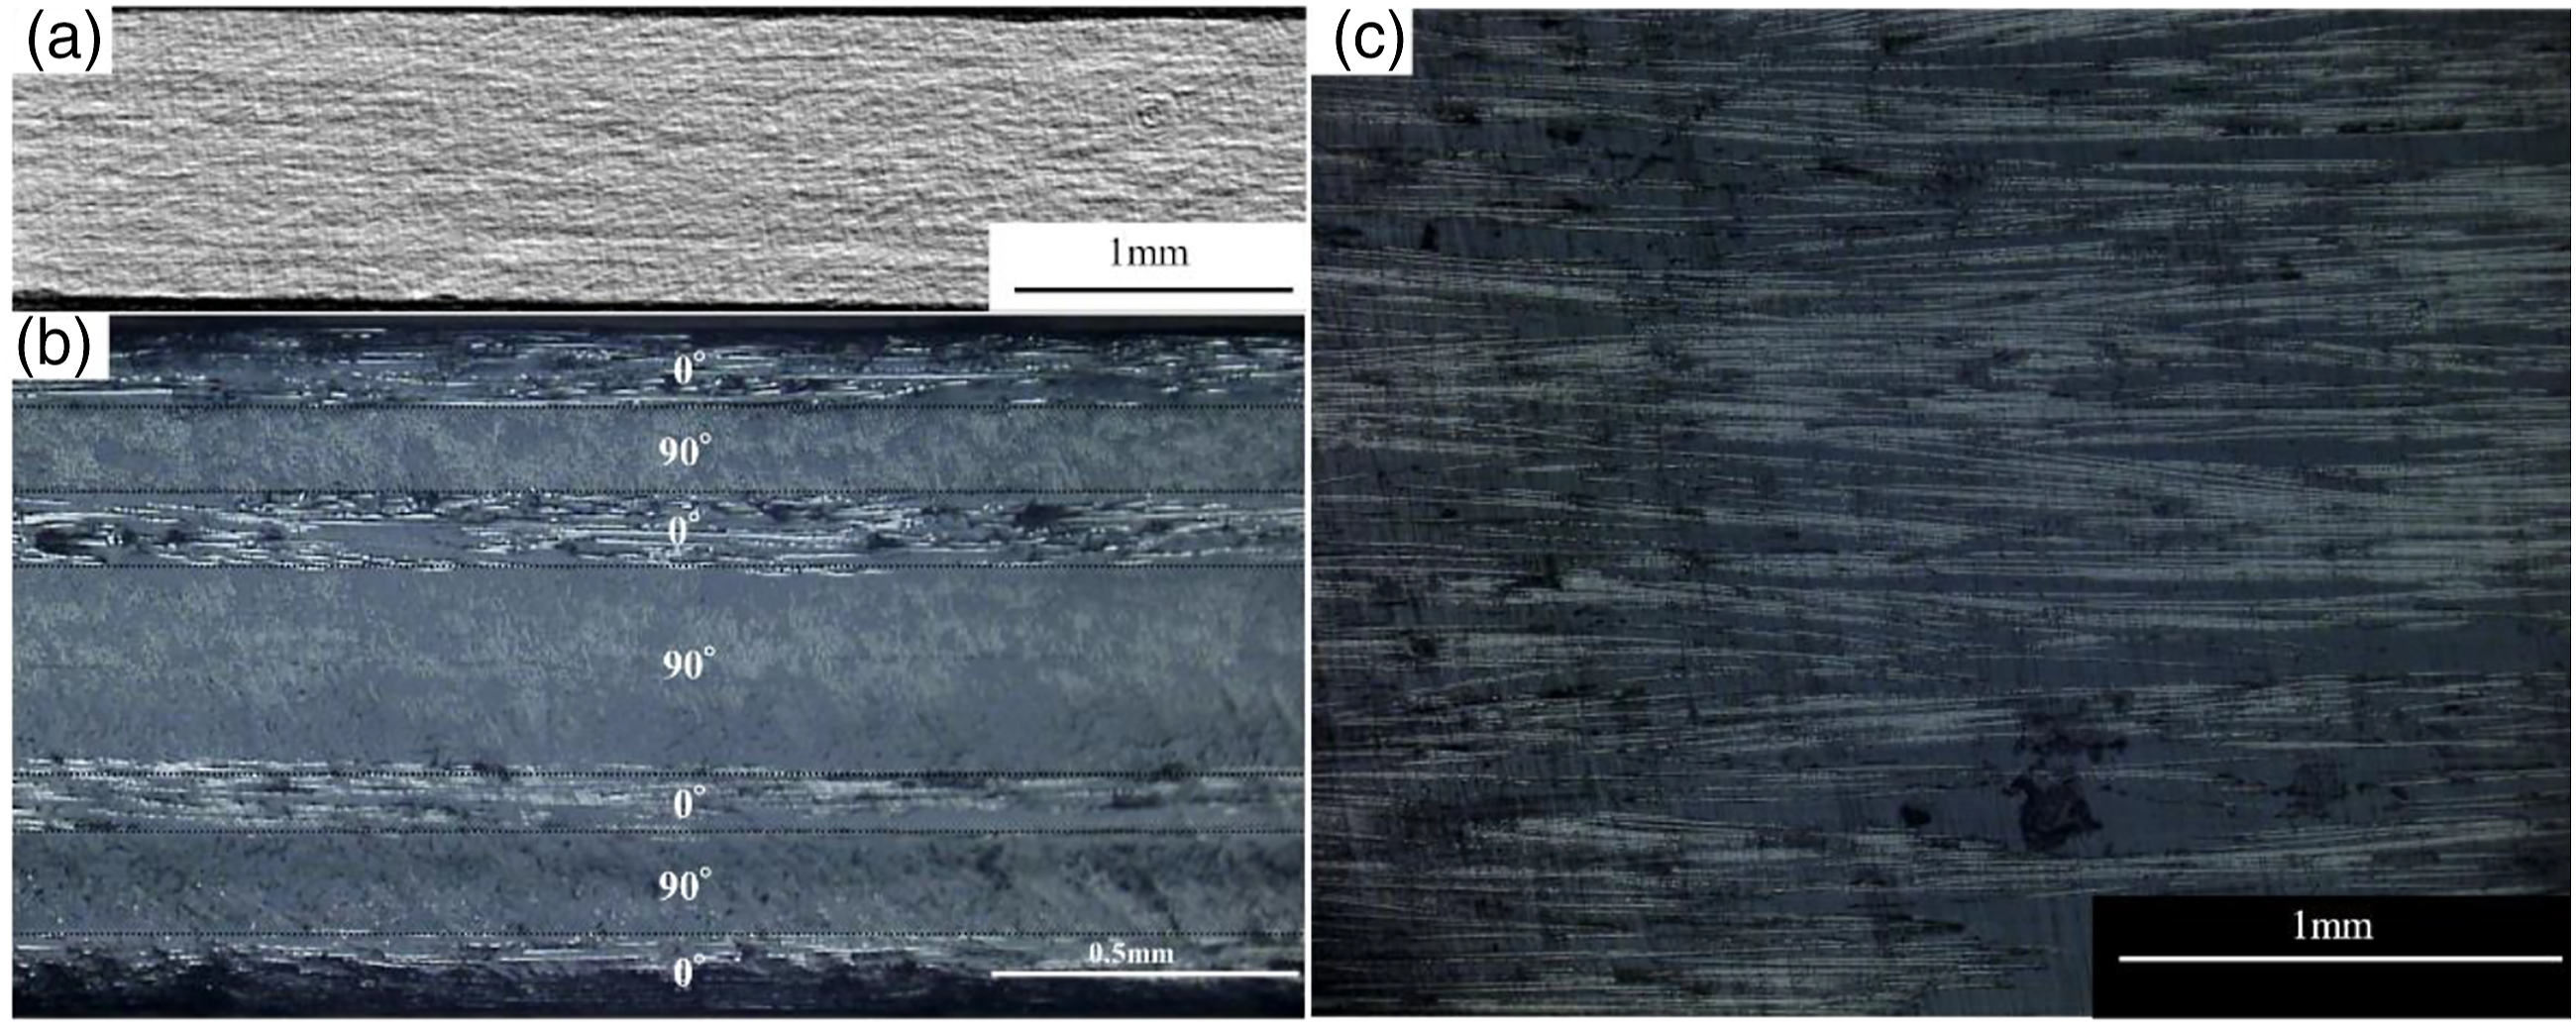
The hot-pressed specimens after the OHT tests are shown in Figure 12(b), where the fracture surface of the hot-pressed specimen was relatively flat, and no significant splitting or interlayer delamination was observed. In the XFEM of the hot-pressed model, there were a small number of cracks with no interlayer delamination at the failure strain, as shown in Figure 12(c), which is consistent with the experimental observations. The difference in the fracture surface and predicted damage distribution compared with that of the as-printed specimen was mainly due to the disappearance of the interlayer voids and the associated increase in interlaminar fracture toughness. (a) Stress-strain curve of the hot-pressed OHT specimen. (b) The fracture surface of the hot-pressed specimen after the OHT tests. (c) Predicted damage distribution at the failure strain.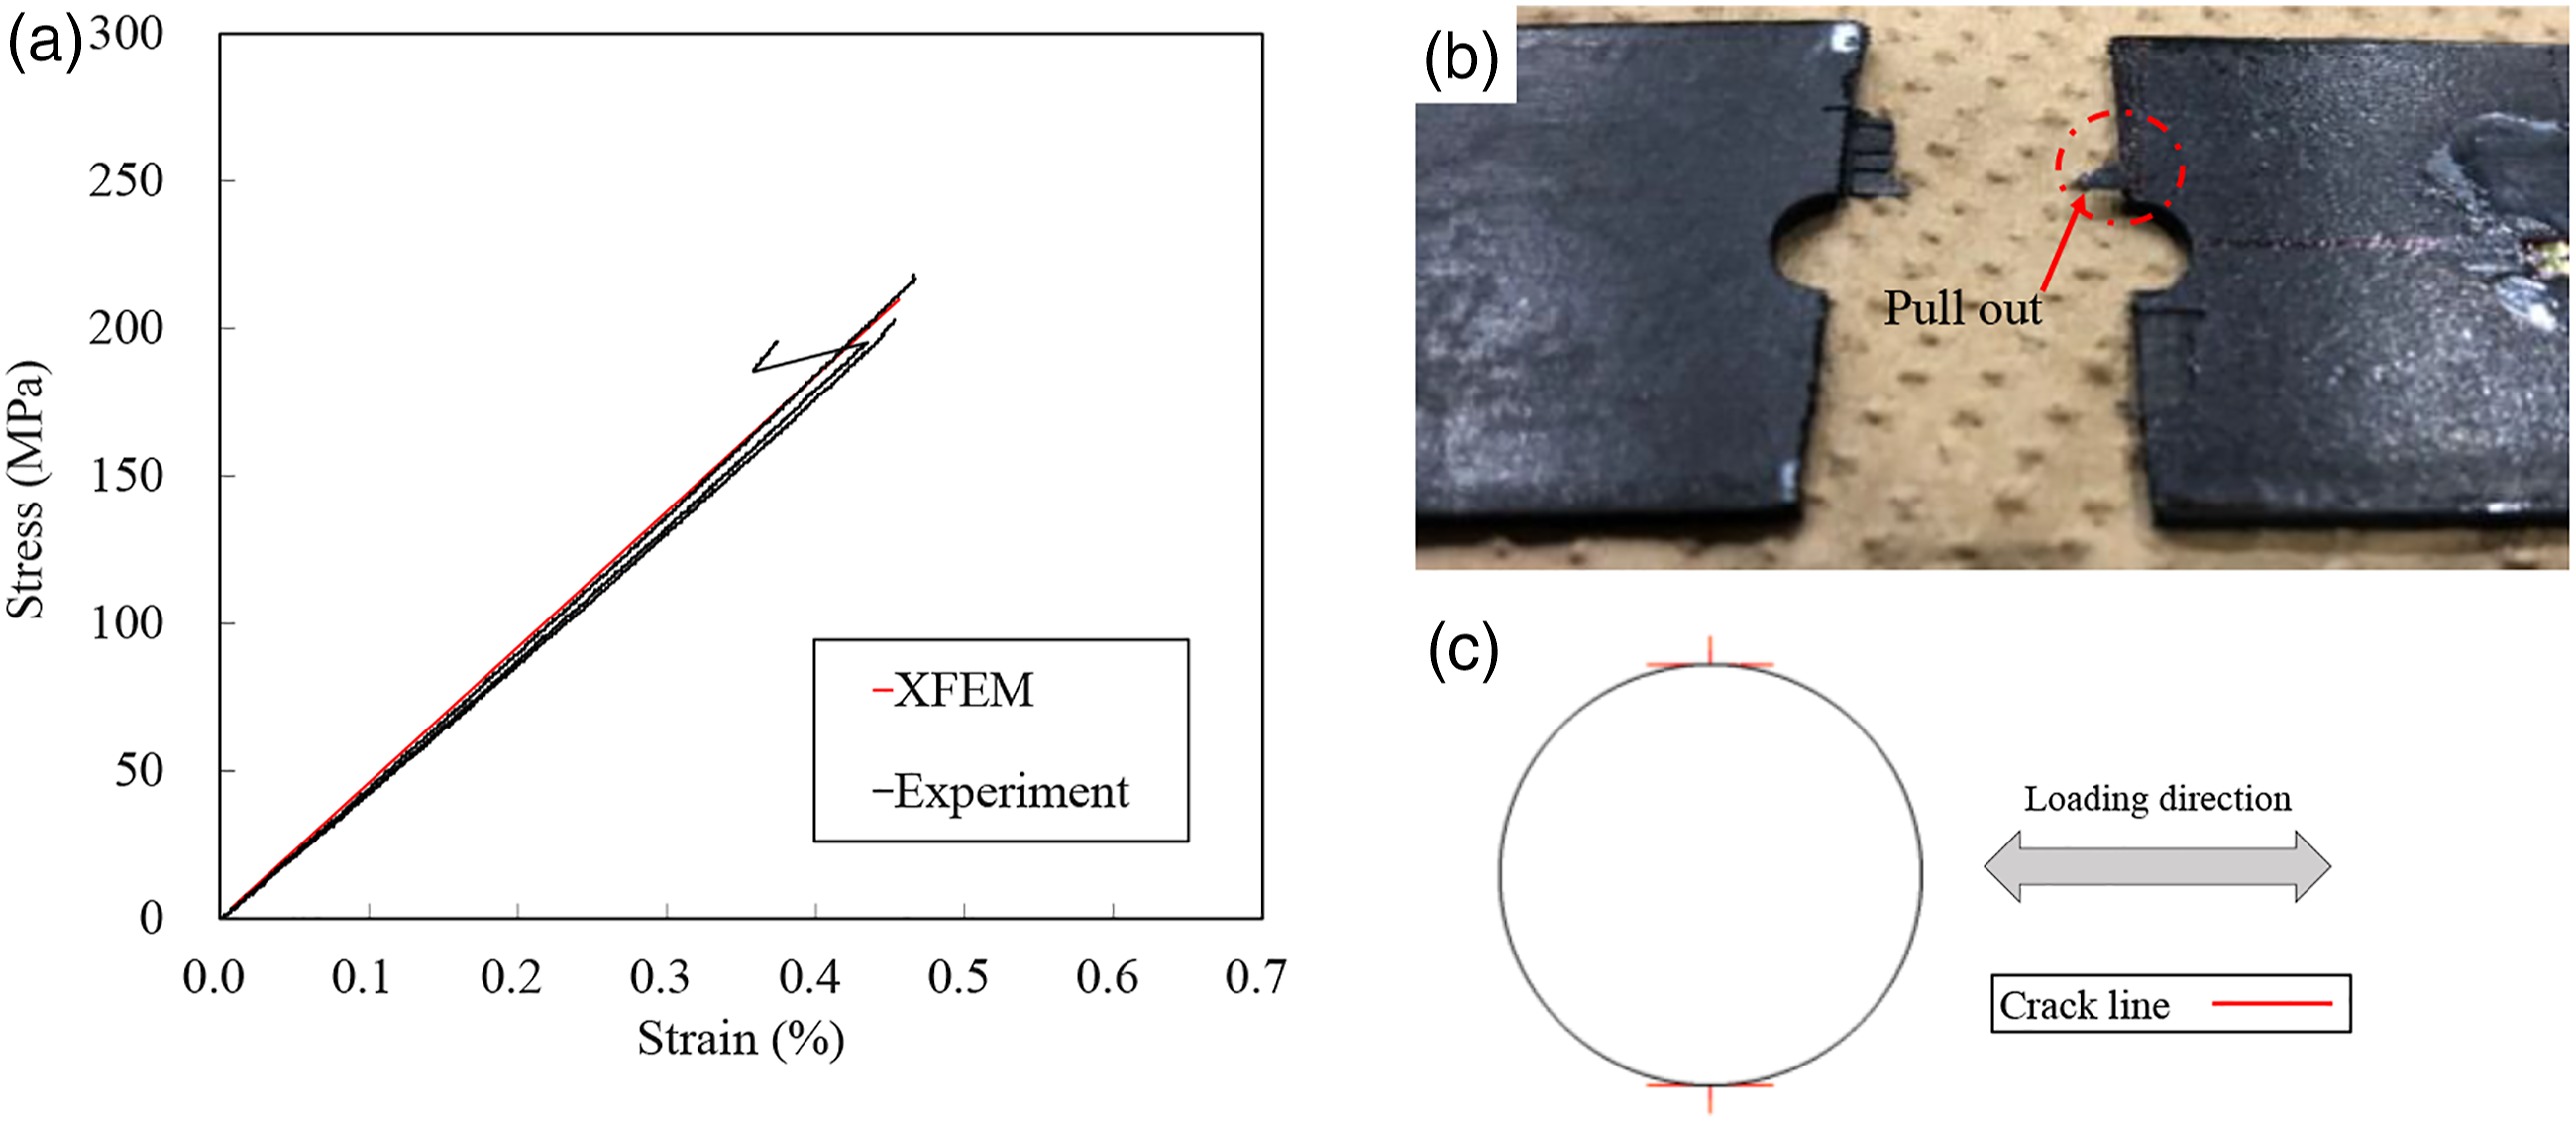
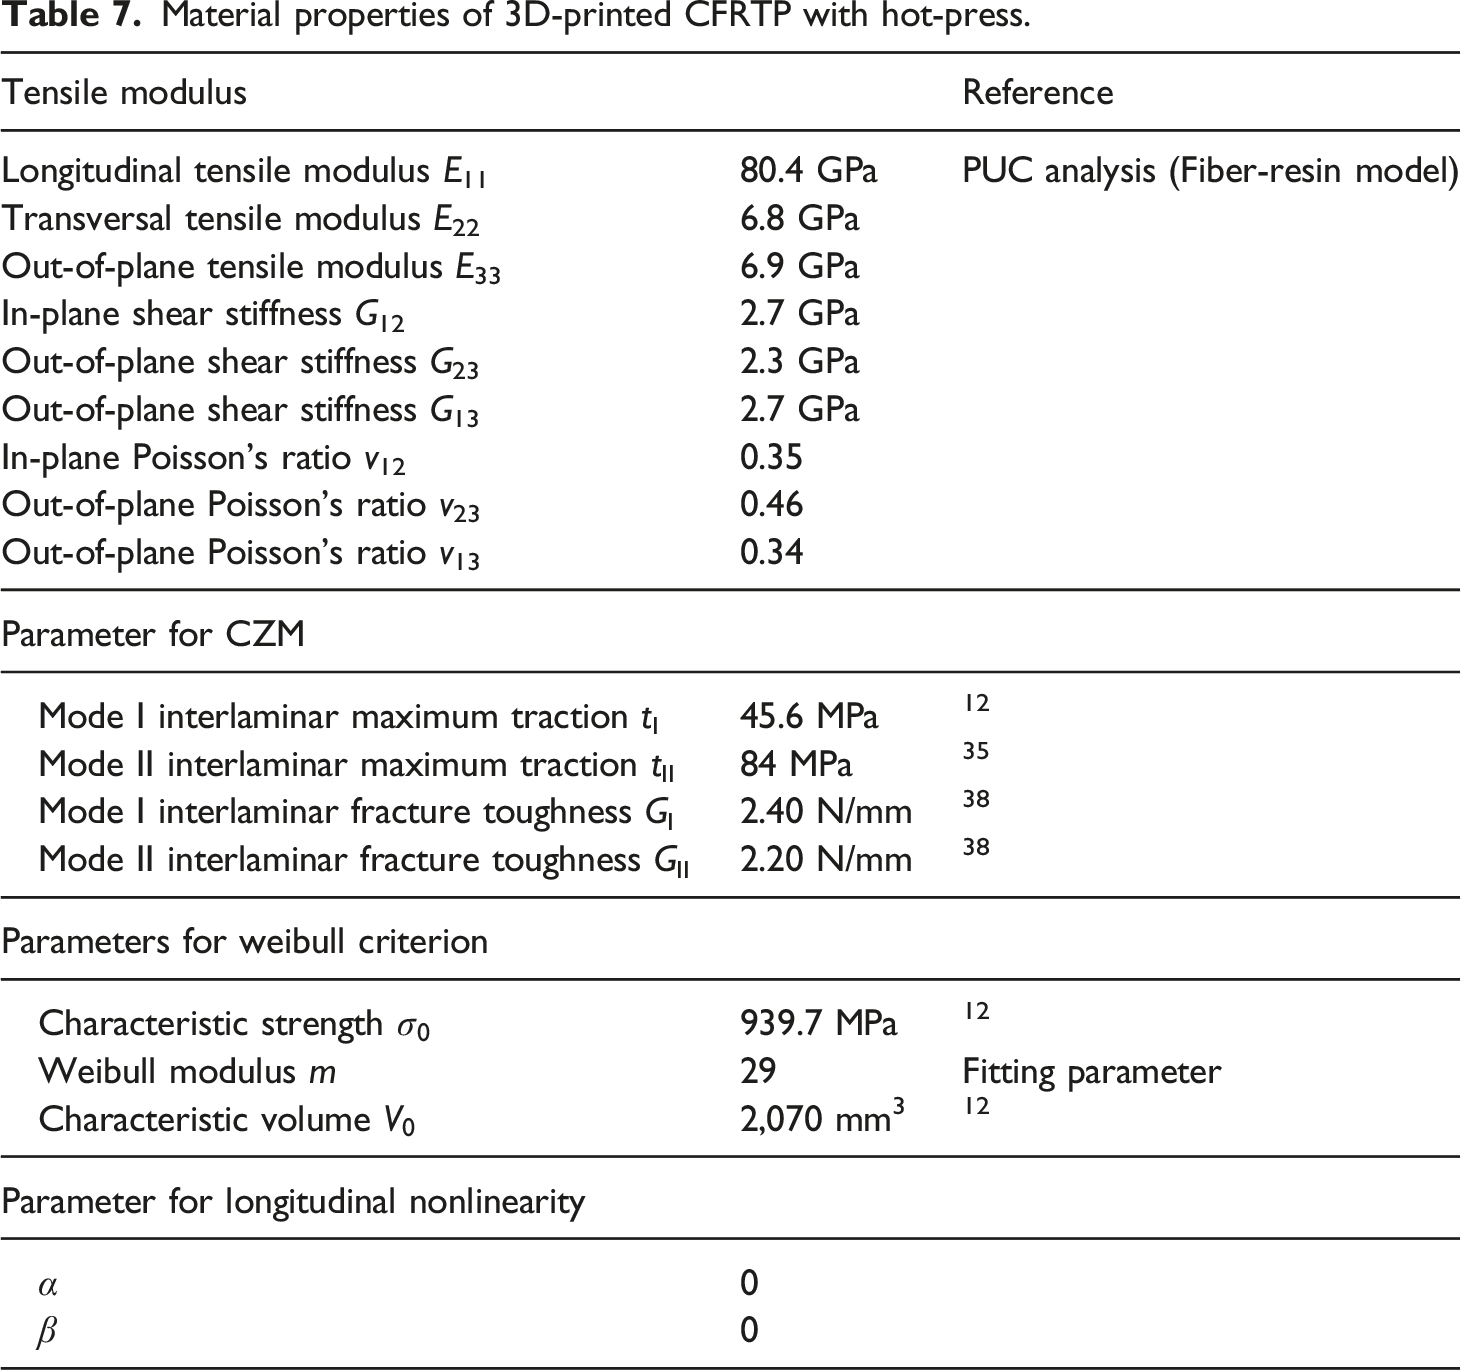
Material properties of 3D-printed CFRTP with hot-press.
The failure strength was calculated to be 209.8 MPa using the Weibull statistical model with m = 29. The OHT strength of hot-pressed specimens was lower than that of as-printed specimens. The stress and strain just before the failure of the hot-pressed specimen was predicted to be 844.1 MPa and 0.91%, respectively, indicating that the hot-pressed specimens showed higher stresses at smaller strain than the as-printed specimens. The stress concentration factor also increased from 2.69 (as-printed) to 3.23 (hot-pressed). This increase in the stress concentration factor may be attributed to the fact that the hot-pressed specimens possess the higher tensile modulus due to the reduction of voids and the smaller damage area at the edge of the center hole under tensile loading (Figure 12(c)). As mentioned above, the OHT strength of the specimen prepared in this study depends on local fiber breakage. Therefore, it is expected that the hot-press reduced voids and improved mechanical properties of the hot-pressed specimen itself, making it more difficult for damage to occur around the center hole and concentrating stress at the edge of the hole, leading to localized fiber breakage and final rupture of the specimens. As a result, the OHT strength is considered to have decreased.
Conclusions
This study experimentally and numerically elucidated the stress-strain responses and damage mechanisms of 3D-printed CFRTP. The 3D-printed CFRTPs had high porosity and fiber orientation distribution, which significantly affected the prediction of the tensile modulus. The porosity was 14.86 ± 0.05% in the 0° specimen, and the in-plane and out-of-plane fiber orientation distributions were −3.01 ± 8.42 and −0.52 ± 6.04°, respectively. The longitudinal and transversal tensile modulus, and shear modulus obtained by uniaxial tensile tests were 58.9 ± 1.6 GPa, 4.7 ± 0.1 GPa, and 2.0 ± 0.1 GPa, respectively. To calculate the effective tensile moduli of the CFRTP specimen, we introduced a two-scale PUC analysis, that is, the effective tensile moduli of the CFRTP filament calculated by the fiber-resin scale analysis with fiber orientation was substituted into the filament-void scale analysis. The comparison revealed a good correlation with the numerical results (E11 = 61.3 GPa and E22 = 4.5 GPa) and to the experimental results. Using the proposed model, the tensile moduli can be identified by the tensile modulus of the fiber and resin, the porosity, and the fiber orientation distribution in the laminate.
By substituting the effective tensile moduli of the filament-void scale into the XFEM, the computational model provided an accurate prediction of the stress-strain response in the OHT of the as-printed CFRTP with stacking sequence of [0/90]2s. The numerical tensile modulus of the OHT specimen was 37.0 GPa, which was in reasonable agreement with the experimental value of 36.7 ± 0.3 GPa. In addition to the evaluation of the as-printed laminates, OHT tests and XFEM analysis of hot-pressed specimens were conducted to evaluate the effects of voids and fiber orientation on the OHT properties. The porosity of 0°/90° specimens improved from 15.19% (as-printed) to 3.41% (hot-pressed). The experimental OHT tests showed that the tensile modulus of the hot-pressed OHT specimen was 45.1 GPa, which is 23% higher than that of the as-printed specimen (36.7 GPa). X-Ray CT and digital microscope observations showed that both void content and fiber orientation were improved by hot-pressing, suggesting that the effective tensile modulus can be predicted by fiber-resin-scale PUC analysis. The XFEM with the effective tensile modulus calculated using the fiber-resin model demonstrated that the predicted tensile modulus was 45.9 GPa, which is in reasonable agreement with the experimental value (45.1 GPa). Both the OHT models for the as-printed and hot-pressed laminates showed that the Weibull criterion was satisfied without significant delamination at the failure strain, corresponding to the brittle failure mode due to fiber breakage. This agrees reasonably well with experimental observations.
Footnotes
Declaration of conflicting interests
The author(s) declared no potential conflicts of interest with respect to the research, authorship, and/or publication of this article.
Funding
The author(s) disclosed receipt of the following financial support for the research, authorship, and/or publication of this article: This research was supported by the Council for Science, Technology, and Innovation (CSTI) and the Cross-ministerial Strategic Innovation Promotion Program (SIP), ‘‘Materials Integration for revolutionary design system of structural materials’’ (Funding agency: JST).