
Abstract
Polycarbonate (PC) /graphene nanocomposite was prepared using multilayer graphene (MLG) with loadings of 0.5, 1, and 3 wt% via melt mixing process. Morphological, structural, and thermal properties of the PC/MLG nanocomposites are investigated to look into the influence of MLG on the nanocomposite. A significant increase (∼6.4°C) in glass transition temperature is observed upon the addition of 3 wt% of MLG into the polycarbonate matrix. This increase in glass transition temperature may be due to the interaction between the MLG and polycarbonate polymer matrix. The specific heat capacity of pure PC and PC/MLG nanocomposites varies linearly with temperature below their glass transition. Upon the addition of MLGs, the overall thermal stability of PC/MLG nanocomposites increases with MLG loadings. A maximum increase about 29.23°C in Tonset of thermal decomposition is observed in PC/MLG nanocomposite having 3 wt% of MLG loading. The activation energy (Ea) of thermal decomposition is also calculated by kinetic analysis of thermal decomposition of the PC/MLG nanocomposites using Horowitz–Metzger and Broido’s methods.
Keywords
Introduction
Polycarbonate (PC) is one of the most important polymers in the family of thermoplastics. It possesses exceptional properties such as good temperature and flame resistance,1,2 high impact strength, excellent optical properties, dimensional and thermal stability.3,4 Due to these remarkable properties, PC has a diverse field of potential applications such as electronic components, construction material, data storage, automotive industries, aerospace industries, etc. In recent decades, polymer scientists and engineers have tried to obtain high performance polymeric materials with desired properties by incorporating nanofillers in the polymer matrix. The resulting polymeric materials are known as polymer nanocomposites (PNCs). The nanofillers used to prepare polymer nanocomposites are basically of two types—organic and inorganic. Out of the different inorganic nanofillers, carbon-based nanofillers such as carbon black, graphite, fullerene, carbon nanofiber, and carbon nanotube are commonly used fillers due to their high thermal and electrical conductivity.5–14 After discovering single layer graphene in the year 2004 by Andre Geim and Kostya Novoselov of the University of Manchester, graphene is taken as a new member in the group of carbon-based nanofillers. Graphene is a two-dimensional crystalline allotrope of carbon in which carbon atoms are sp2 hybridized and are densely packed in a honeycomb crystal lattice. Graphene is thought to be the thinnest and strongest material in the Universe, with tremendous thermal, electrical, and mechanical properties.15,16 Over the past few years, extensive research has been done on polymer/graphene nanocomposites and reported significant improvement in mechanical, electrical, optical, and thermal properties and thermal stabilities.12,17,18 Polymer composite containing graphene as a nanofiller also possesses exceptional antibacterial activity. 19 Dispersion and orientation of graphene into polymer matrix is an important mechanism as it influences the modification of different physical as well as electrical properties of the polymer. Several processing methods such as in-situ polymerization, solution blending, and melt mixing have been used to achieve better dispersion of graphene into the polymer matrix. Kim and Macosko 20 reported a relationship between the processing methods and the properties of PC/graphene composites. Considering the thermal properties, the glass transition temperature (Tg) is one of the most fundamental parameters for amorphous polymers and their composites as it is directly related to structural changes in a polymer. In recent decades, extensive investigations have been carried out to understand the effect of graphene on the glass transition (Tg) of polymer nanocomposites. It has been reported that the Tg of polymer composites exhibits positive 21 or negative 22 deviations as well as no difference 23 with the pristine polymer. The reason behind these diverse effects of graphene on Tg of polymer nanocomposite still remains unexplored. The thermal degradation behavior of PC and its blend with other polymers have been studied extensively.24,25 But a limited number of works have been reported on the thermal degradation behavior of polycarbonate composites with different nanofillers.5,26,27 Though Gedler et al. 27 reported the thermal stability of PC/graphene composite foam, detailed information on the thermal degradation behavior of PC/graphene composite is still lacking. Thus a detailed knowledge of the thermal behavior of nanocomposite is necessary not only to resolve the inconsistencies in the results as reflected in the literature but also to obtain information about the thermal parameters such as glass transition temperature (Tg) and onset temperature of thermal decomposition (Tonset) which can help assign the upper and lower temperature limit of the nanocomposite material for its end use applications.
In this work, we report morphological, structural, thermal properties, and thermal stability of polycarbonate (PC)/multilayer graphene (MLG) nanocomposites prepared via melt mixing process. Morphology of the PC/MLG nanocomposites has studied using scanning electron microscopy to examine the quality of dispersion of MLG into the PC polymer matrix. Raman spectroscopy measurements have been carried out to find the nature of interactions between the PC polymer matrix and MLGs. Thermal properties and thermal stability of the nanocomposite are studied using differential scanning calorimetry (DSC) and thermogravimetric analysis (TGA), respectively. Also, attempts have been made to explain the influence of MLGs on the observed changes in glass transition (Tg) of the PC/MLG composites. Furthermore, qualitative kinetics analysis of thermal decomposition of the nanocomposites has been made to calculate the activation energy (Ea) by employing Horowitz–Metzger and Broido’s methods.
Experimental details
Materials
Polycarbonate having density—1200 kg m−3 and melt flow index (300°C/1.2 kg)—10 g/10 min was purchased from Bayer Material Science, Germany. Multilayer graphene (MLG) having purity >99%, average thickness—3–8 nm, average lateral dimension—5–10 µm, number of layers—3–6 layers, and surface area ∼180 m2 g−1 was supplied by Ad Nano Technologies, Karnataka, India. All the materials were used as received.
Polycarbonate/graphene composite preparation
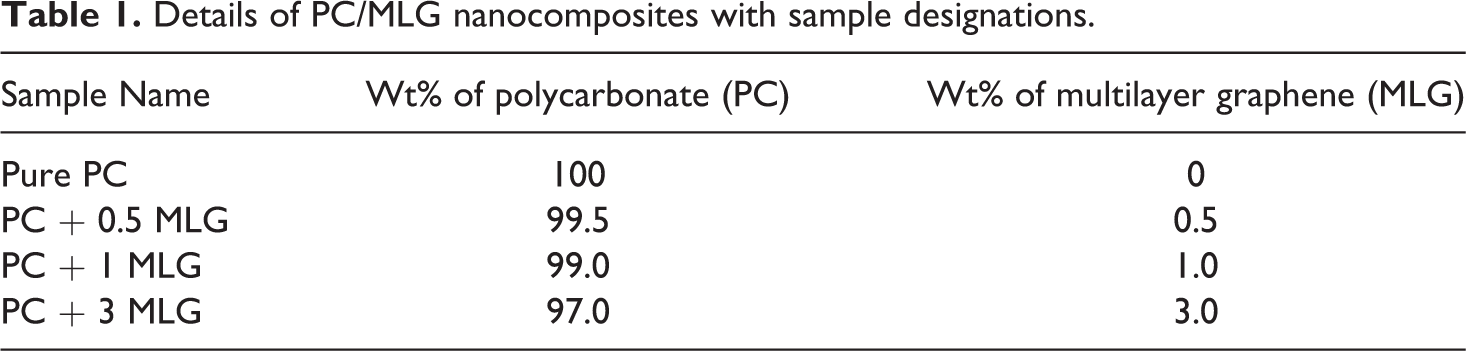
As received pure polycarbonate (PC) granules were first melt mixed using Brabender-33 internal melt mixer having a cavity size of 55 cm3 and at a chamber temperature of 230°C. Mixing was carried out at 60 rpm for 10 min. Polycarbonate (PC)/multilayer graphene (MLG) nanocomposites with MLG loadings 0.5, 1, and 3 wt% were also prepared by melt mixing process, keeping the processing condition same as that for pure PC sample. All the prepared samples, pure PC and PC/MLG nanocomposites were then compression molded by applying a pressure of 100 kg cm−2 at a temperature of 230°C and cooled to room temperature at the same pressure to obtain the samples in the form of sheets. The details of the composite samples with their designations are given below in Table 1.
Details of PC/MLG nanocomposites with sample designations.
Characterization
The surface morphology of the samples was studied using Nova NanoSEM 450 field emission scanning electron microscope. Prior to taking the SEM images, all the samples were coated with gold to avoid electron charging.
X-ray diffraction (XRD) measurements of all the samples were taken on a Rigaku (Model: Ultima IV, Japan) X-ray diffractometer using Cu-Kα (λ = 1.54 Å) radiation and the operating voltage and current were 40 kV and 20 mA, respectively. All the XRD patterns were taken from 2θ = 10° to 2θ = 60° using step scan mode with step size 0.01° and counting time 1 s per step.
Raman spectra were taken by confocal Raman spectrometer (Witec Alpha 300 R, Germany) using 532 laser excitation and tip diameter 6 µm.
Thermogravimetric analysis (TGA) of all samples was carried out using STA 449F3 (NETZSCH, Germany) simultaneous TG-DSC instrument. TGA measurements of all the samples were taken in accordance with the ICTAC recommendations. 28 All the samples were cut into small pieces such that they have a weight of 4–6.5 mg. The measurements were taken using Alumina (Al2O3) crucible in nitrogen (N2) atmosphere with a flow rate of 50 ml min−1 from 30°C to 800°C at a scanning rate of 10°C min−1.
Differential Scanning Calorimetry (DSC) measurements of all the samples were taken using DSC 200F3 Maia (NETZSCH, Germany). The DSC instrument was calibrated for temperature using zinc and mercury as standard. For DSC measurement, each sample was cut into suitable sizes such that they have a weight between 10 and 15 mg as specified for DSC. The temperature program for DSC measurements was as follows: Samples were first heated from room temperature to 180°C at the heating rate of 10°C min−1—remained isothermally at 180°C for 5 min—cooled to 20°C at the cooling rate of 10°C min−1—remained isothermally at 20°C for 5 min—again heated to 180°C at a heating rate of 10°C min−1—remained isothermally at 180°C for 5 min—finally cooled to 50°C at the rate of 10°C min−1. The second heating DSC thermograms were taken for analysis, and they were analyzed using NETZSCH Proteus thermal analysis software.
Results and discussions
Morphological analysis
Dispersion of graphene in the polymer matrix is an important mechanism as it influences the modification of different properties of the composite material. 29 In order to study the dispersion of multilayer graphene (MLG) in the polycarbonate (PC) matrix, FE-SEM analysis is carried out. FE-SEM images of MLG at different magnification, pure PC, and PC/MLG nanocomposites with different MLG loadings are shown in Figure 1. The FE-SEM images of
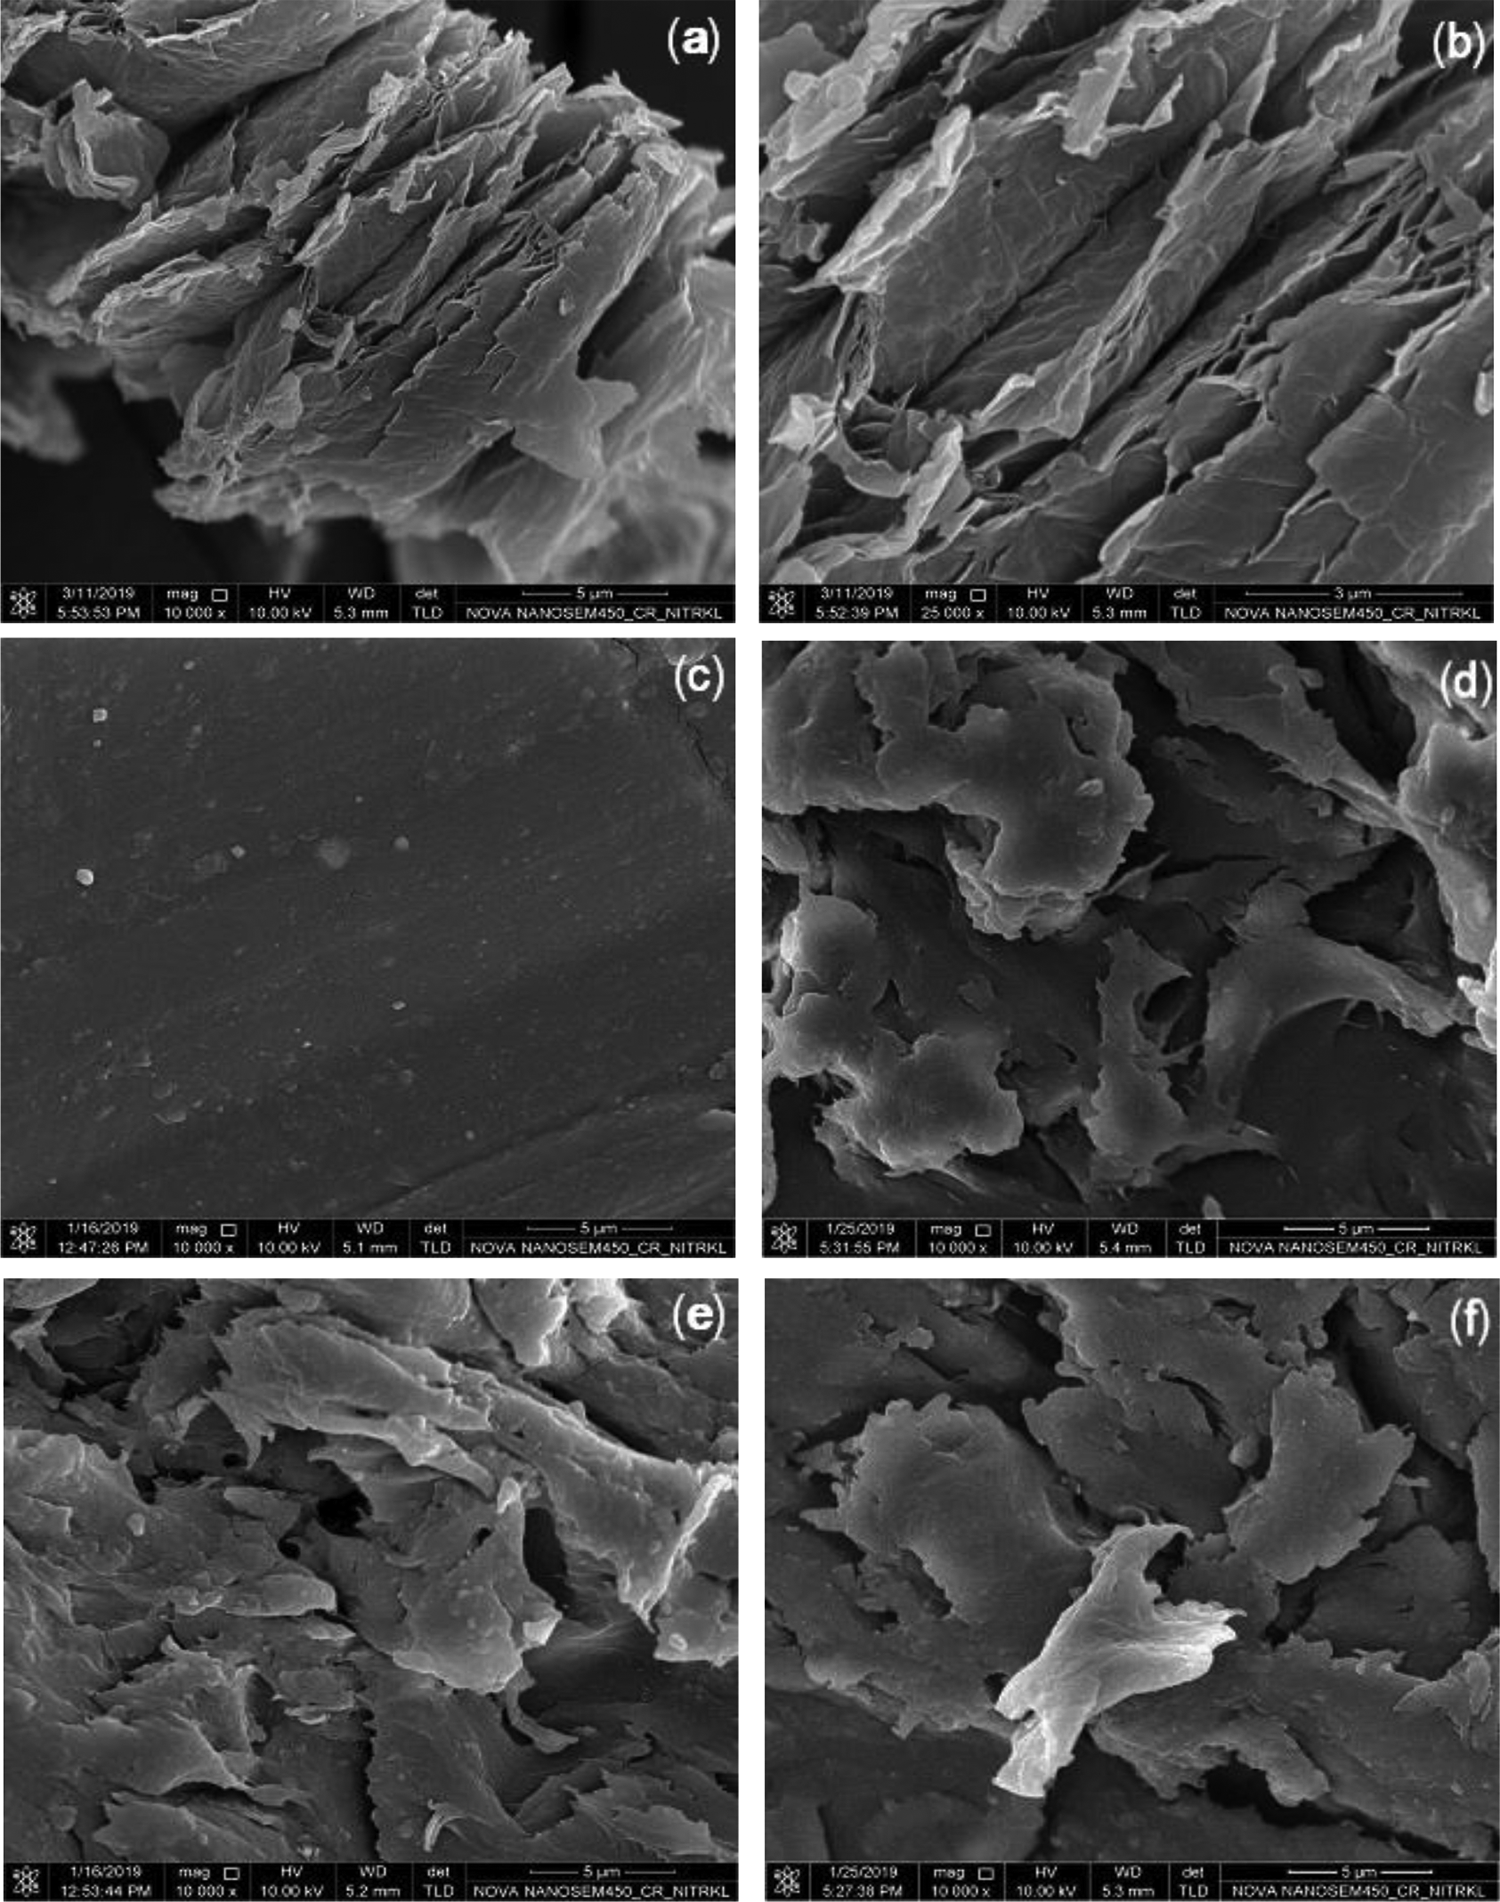
FE-SEM images of multilayer graphene (MLG) with (a) and (b) different magnifications and fracture surfaces of (c) pure PC, (d) PC + 0.5 MLG, (e) PC + 1 MLG, and (f) PC + 3 MLG.
PC/MLG composites (Figure 1(d) to (f)) clearly show that the MLGs are well dispersed in the polycarbonate matrix. It is clearly observed that the fracture surface of the pristine PC is very smooth, having some strips along the direction of fracturing forces. On the addition of MLGs in the polycarbonate matrix, the roughness of the fracture surface of the composite increases compared to that of the pristine PC. This increase in roughness of the fracture surface of the nanocomposite may be due to the good dispersion of MLGs throughout the polycarbonate matrix.
XRD analysis
The X-ray diffraction pattern of multilayer graphene (MLG), pure PC, and PC/MLG nanocomposites with different MLG loadings is shown in Figure 2. The pristine MLG (curve e) exhibits a very sharp and intense peak at 2θ = 26.47° with interlayer spacing (d-value) 3.36 Å. It also shows three other less intense peaks at 2θ = 42.39°,44.20°, and 54.53° with respective d-values 2.13, 2.04, and 1.68 Å. These peaks are the characteristics peaks of graphite. As the MLG sample used in this study consists of 3–6 layers, the XRD pattern of MLG reflects the graphitic peaks.30,31 The peaks at 2θ = 26.47°, 42.39°,44.20°, and 54.53°, are the characteristics graphitic (002), (100), (101), and (004) reflections, respectively (JCPDS File: 01-075-1621). The XRD pattern of pure PC (curve a) shows only a broad peak around 2θ = 17°, suggesting that the polycarbonate is a pure amorphous polymer. The XRD pattern of the three PC/MLG nanocomposites (curve b, c, and d) shows a diffraction peak at 2θ = 26.69°, 26.47°, and 26.44°. These peaks are the diffraction peaks of graphitic (002) reflection. The X-ray diffraction peaks due to (002) reflection in PC + 0.5 MLG and PC + MLG have very little intensity compared to that of PC + 3 MLG, and this is because of low concentrations of MLGs. The average crystallite size is calculated using Sherrer’s equation. It is found that the crystallite size of pristine MLGs is 211 Å, which is consistent with the result reported by Amaro-Gahete et al. 32 The Crystallite size of MLGs in PC + 3 MLG nanocomposite is 87 Å for (002) reflection.
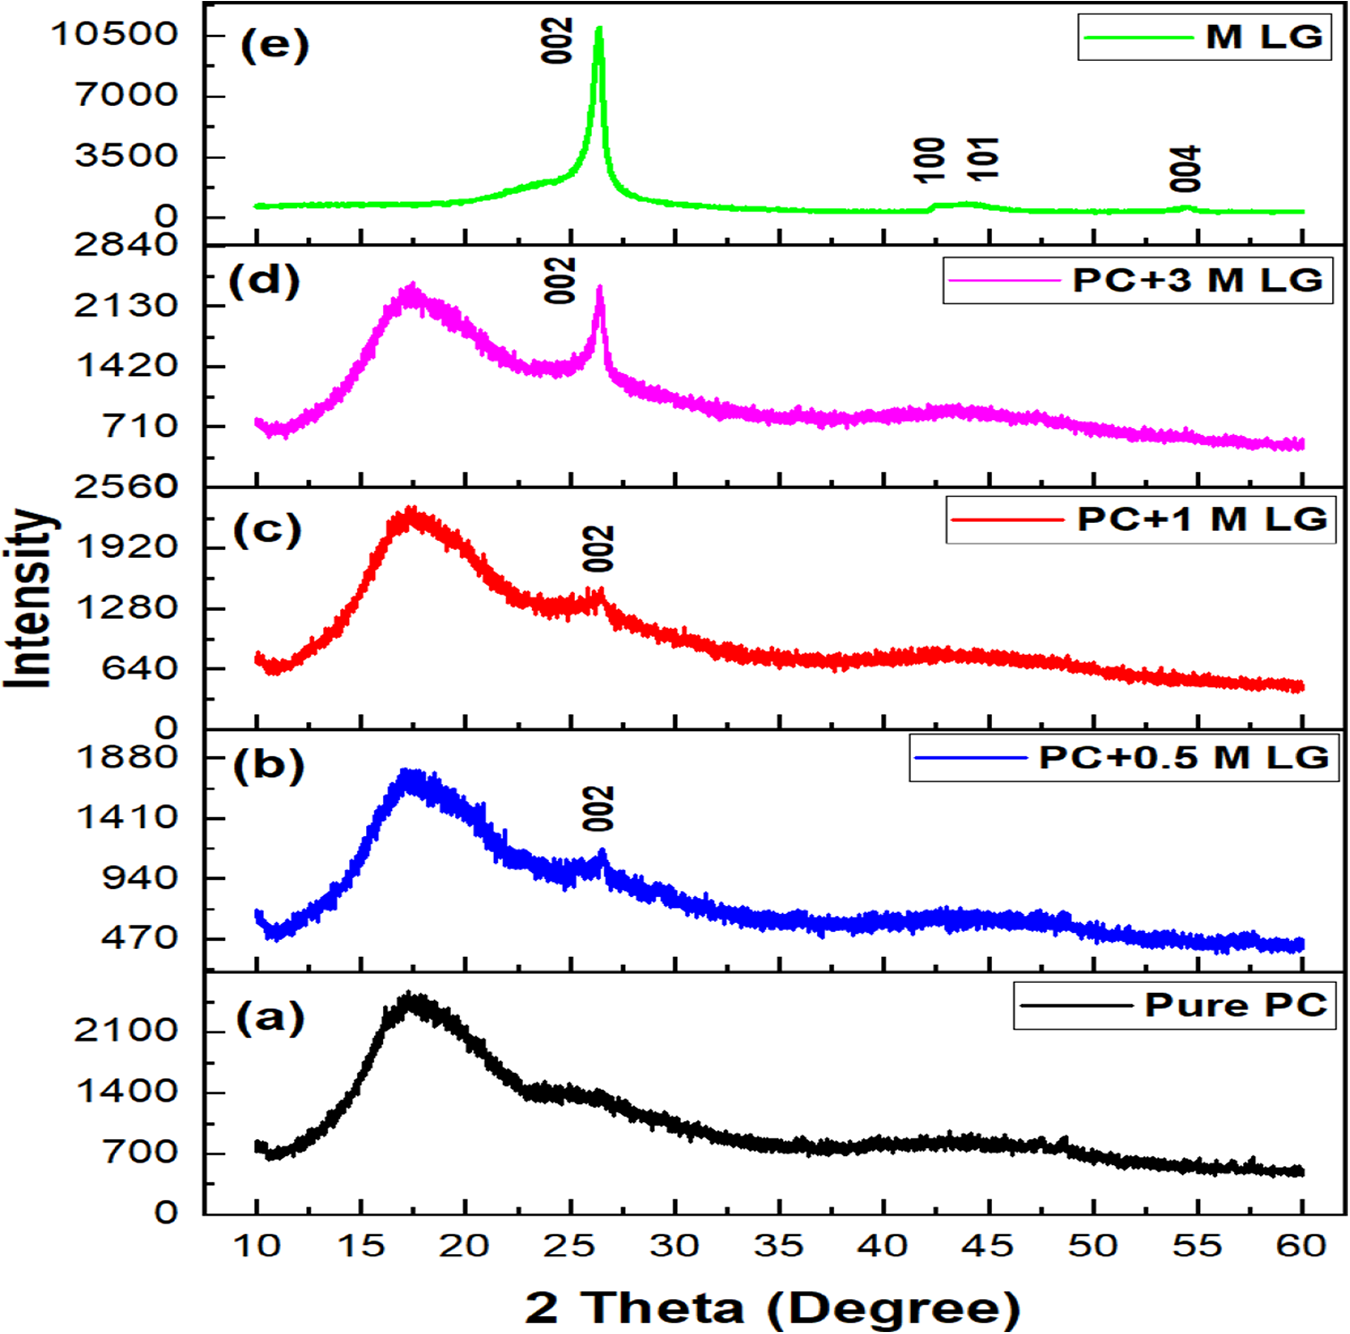
X-ray diffraction pattern of (a) pure PC, (b) to (d) PC/MLG nanocomposite with MLG loading 0.5, 1, and 3 wt%, and (e) MLG.
Raman analysis
Raman Spectroscopy is a technique that was used to characterize carbon-based nanofillers and their polymer nanocomposites. Using this technique, one can also understand the interactions between the nanofiller and polymer in the polymer nanocomposites.33,34 The interaction between the filler and the polymer is attributed to the shift in peaks or by the change in intensities of the peaks.35–37 Figure 3 shows the Raman spectra of multilayer graphene (MLG), pure PC, and PC/MLG nanocomposites with different MLG loadings. Figure 3 clearly shows that the Raman spectra of MLG (curve a) consists of three distinct peaks, namely D, G, and 2D bands. The D band, also known as the defect band of graphene, is located at ∼1357 cm−1 and arises due to the one phonon lattice vibrations. The other two bands, G and 2D, are located at 1577 and 2687 cm−1, respectively. The Raman spectra of pure PC (curve b) consists of several peaks at 632, 701, 884, 1108, 1178, 1230, 1430, 1461, 1602, 2975, 3052, and 3078 cm−1. The peaks in the range 2800–3100 cm−1 appear due to the C–H stretching vibration, and the other peaks are in accordance as assigned by Lee et al. 38 In the Raman spectra of PC/MLG composites (curve c and d), characteristic graphene bands (i.e., D, G, and 2D bands) are disappeared for the composite samples PC + 0.5 MLG and PC + 1 MLG. In contrast, in the sample PC + 3 MLG the characteristic graphene bands dominate over the peaks of pure PC. The disappearance of graphene characteristic bands in the case of the PC + 0.5 MLG and PC + 1 MLG composites may be attributed to good dispersion as well as the low concentration of graphene in the composites, support the XRD observations. The position of characteristics graphene
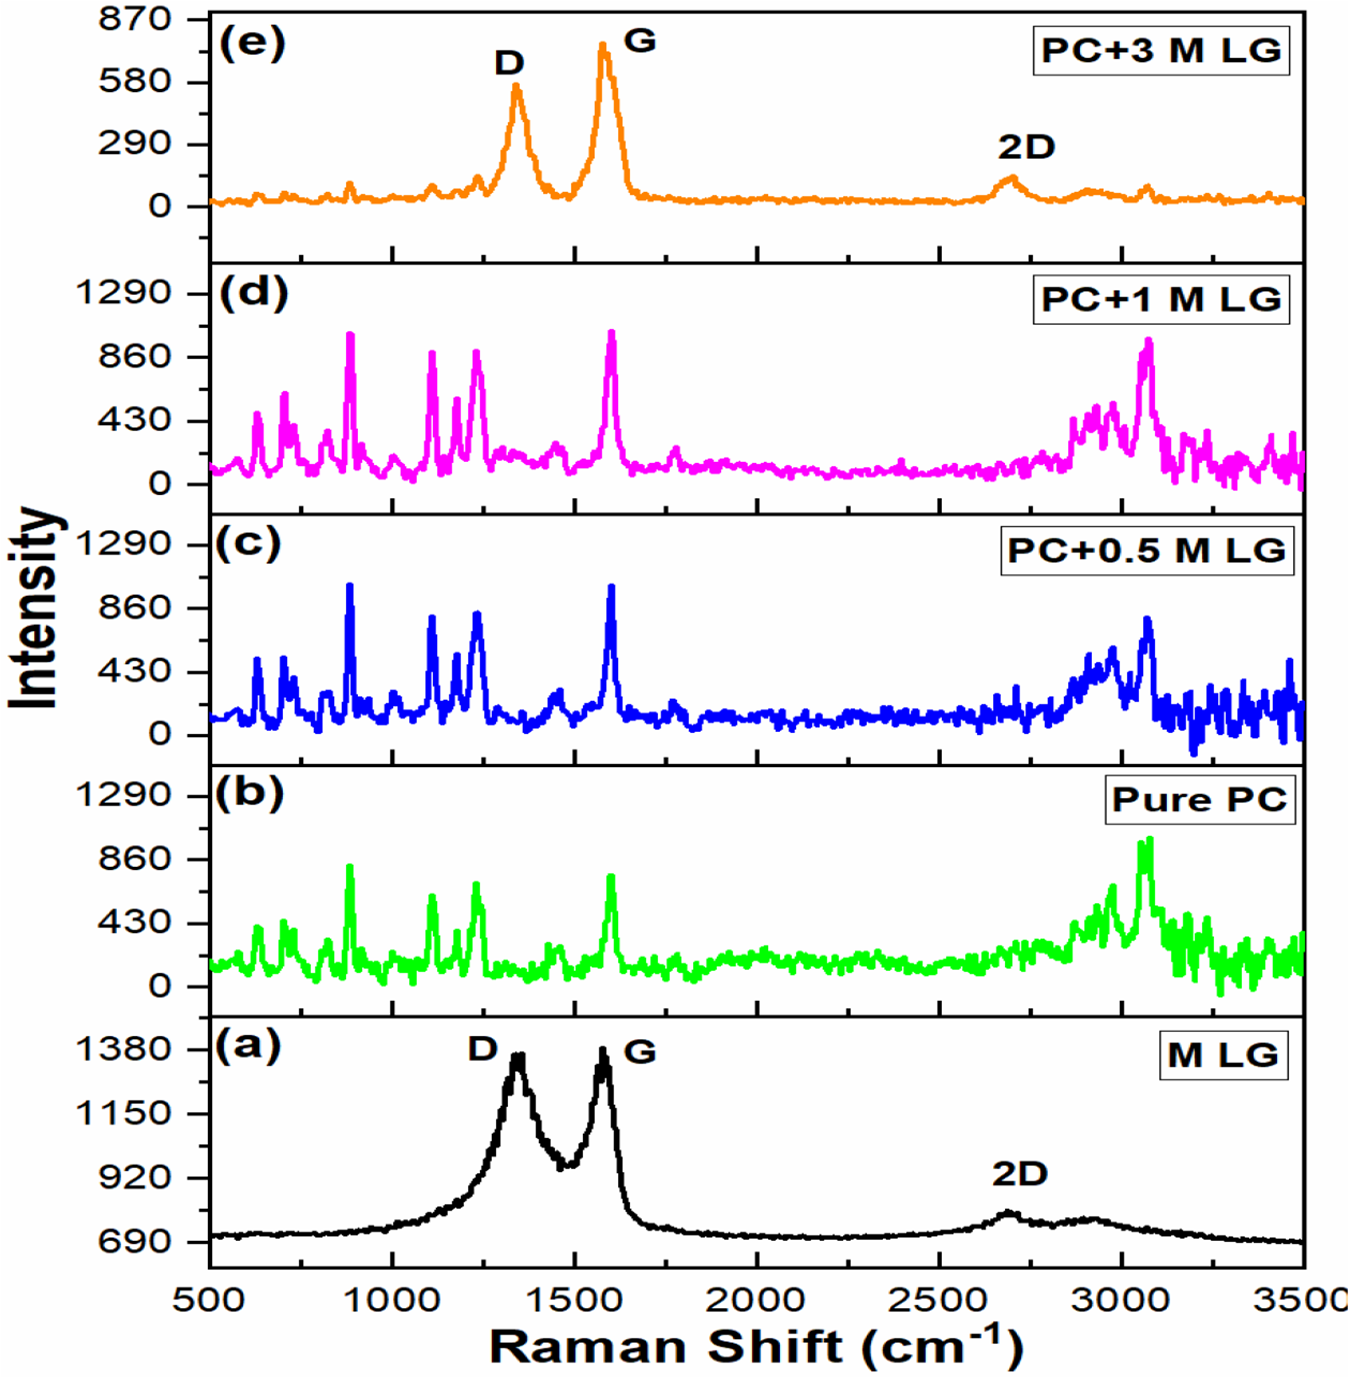
Raman spectra of (a) MLG, (b) pure PC, and (c) to (e) PC/MLG nanocomposites with 0.5, 1, and 3 wt% of MLG loadings.
Position of characteristics graphene Raman bands (D, G, and 2D bands) in pristine MLG and PC + 3 MLG nanocomposite.
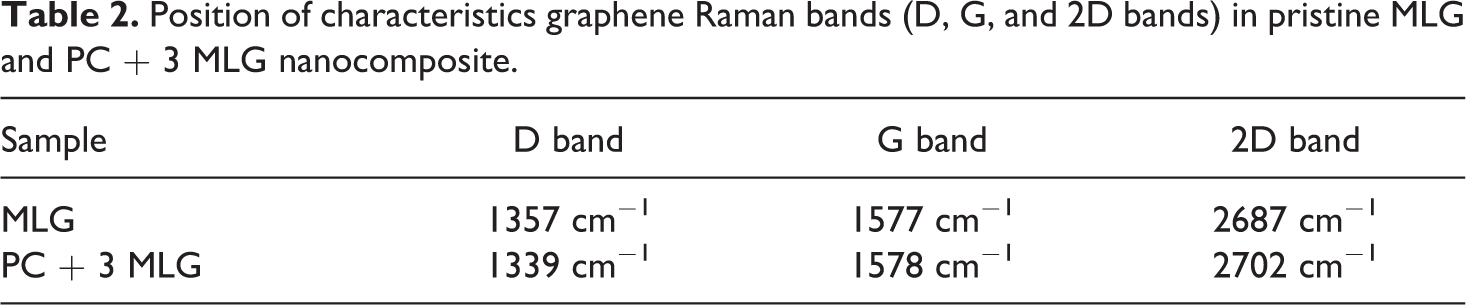
Raman bands (D, G, and 2D bands) for pristine graphene and PC + 3 MLG nanocomposite is also tabulated in Table 2. The Raman spectra of the PC + 3 MLG composite shows D, G, and 2D bands located at 1339, 1578, and 2702 cm−1, respectively. In comparison to the MLGs, the location of D, G, and 2D bands in the PC + 3G composite makes downshift (∼18 cm−1), remains almost the same, and makes upshift (∼15 cm−1), respectively. The interaction via hydrogen or covalent bonding between the graphene and the polycarbonate polymer could attribute these shifts of D and 2D bands in the PC + 3G composite.39,40
Differential scanning calorimetry analysis
Differential scanning calorimetry (DSC) is a thermoanalytical technique used to measure glass transition temperature (Tg), melting point (Tm), latent heat of melting (ΔHm), crystallization temperature (Tc), latent heat of crystallization (ΔHc), and specific heat capacity (Cp) of polymeric materials. DSC heating thermograms of pure PC and its nanocomposite with multilayer graphene (MLG) having MLG loadings of 0.5, 1, and 3 wt% in the temperature range from 30 to 280°C are displayed in Figure 4. It is clear from the figure that pure PC and the nanocomposites exhibit only glass transition, which is expected from the XRD analysis as it is purely amorphous. The point of inflection in the DSC thermograms is taken as the glass transition temperature (Tg). For pure PC, the glass transition temperature (Tg) is found at 137.8°C. The glass transition temperature of polycarbonate (PC) may vary from 130 to 150°C depending on the processing method, molecular weight, and the technique used to determine glass transition temperature.41–43 The glass transition temperature of the nanocomposites PC + 0.5 MLG, PC + 1 MLG, and PC + 3 MLG are found at 139.5, 140.1, and 144.2°C, respectively. Though the increase in glass transition temperature for the nanocomposites PC + 0.5G and PC + 1 MLG is small, a significant increase (∼6.4°C) in Tg is observed for the nanocomposite PC + 3 MLG. Thus, an overall tendency to increase in the glass temperature is observed on the addition of multilayer graphene (MLG) to PC. Similar qualitative results, i.e., increment in Tg, were reported by Wan and Chen 44 and Liao et al. 21 in PS/GO and PMMA/TRG nanocomposites. Out of different existing models on Glass transition, free volume theory (FVT) is the most acceptable model. 45 According to this model, a reduction in free volume imposes constraints on the segmental motion of polymer chains, thereby enhancing glass transition temperature. It has also been well established that the strong interfacial interaction between nanofillers and polymer reduces the free volume available for molecular chain movement. 46 Therefore, the observed enhancement in Tg in PC/MLG nanocomposite could be attributed to the imposed restrictions on molecular chain mobility due to reduction in free volume resulting from the interfacial interaction between the MLG nanofillers and the polycarbonate polymer, as observed in Raman analysis.
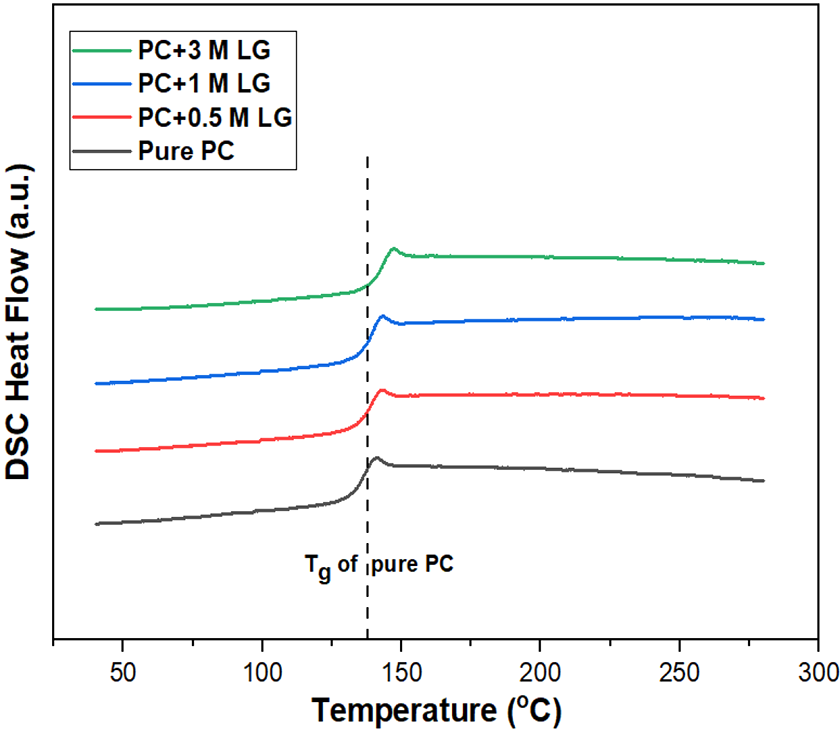
DSC thermograms of pure PC and PC/MLG nanocomposites.
Another important thermal property of polymeric material is specific heat capacity (Cp), as it reflects the heat absorption ability of the material. DSC measures the specific heat capacity (Cp) at a constant pressure of materials as a function of temperature by following a simple and straight forward method known as ratio method. 47 In the measurement of specific heat, sapphire is used as a standard sample. The variation of specific heat capacity (Cp) with temperature in the range from 313 to 493 K, i.e., below the glass transition temperature of pure PC and PC/MLG nanocomposites are shown in Figure 5. Analytically, the specific heat capacity of polymeric system having more than one component can be estimated by the relation:

where Cpi and Xi are the specific heat capacity and weight fraction of the ith component in the mixture. To eliminate the composition dependence of specific heat capacity Van Krevelen and te Nijenhuis, 48 Bicerano, 49 and Baird and Collias 50 proposed the following equations:


where Cps(T) and Cpl(T) are respectively the specific heat capacity of the polymeric material in the solid and liquid state at any temperature T in K. Cps (298) and Cpl (298) are respectively the experimental heat capacities of polymer for the solid and liquid states and are used to eliminate the composition dependence of specific heat capacity. They suggest that the specific heat capacity of semicrystalline polymer follows equation (2) below its melting temperature and equation (3) above the melting temperature. In our previous work on ABS/PA6 polymer blend, we have successfully applied equation (2) to fit the specific heat capacity (Cp) of different blend compositions below their melting temperature. 51 As PC is a pure amorphous polymer, equation (2) may also be applicable to fit the experimental data of specific heat capacity if the temperature range remains below the glass transition temperature. As the temperature 313 K is the initial temperature of the measurements, Cps (298) in equation (2) has been replaced by Cps (313) during the fitting program. By linearly fitting the experimental data for Cp of amorphous PC and PC/MLG nanocomposites in the temperature range from 313 to 393 K following relations are obtained:


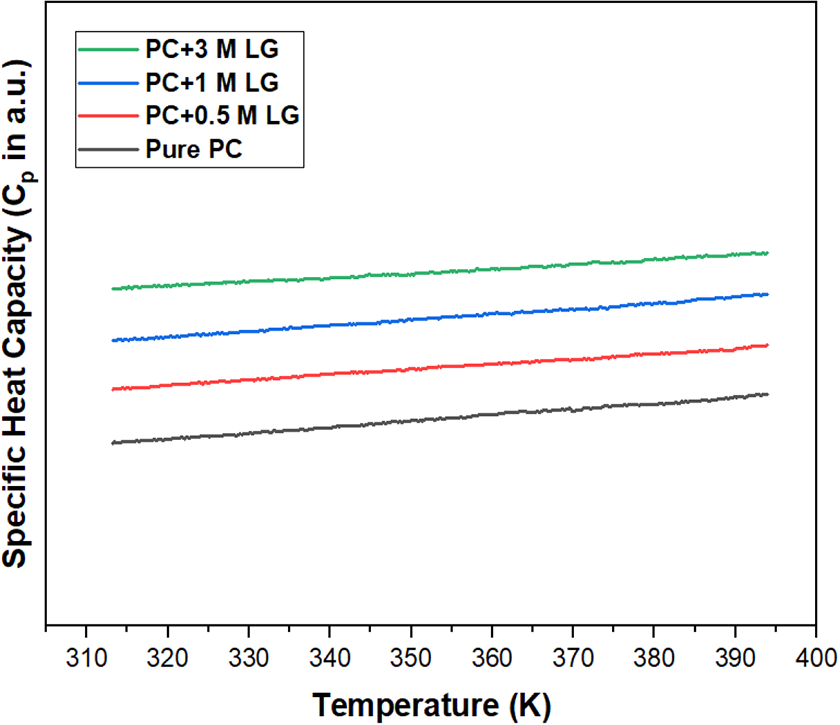
Variation of specific heat capacity (Cp) of pure PC and PC/MLG nanocomposite.
The above relations are well fitted since adjustable R2 of fitting for pure PC, PC + 0.5 MLG, PC + 1 MLG, and PC + 3 MLG has the value 0.9978, 0.9976, 0.9976, and 0.9948, respectively. From these fitted relations, it is observed that the values of intercepts and slopes for all four samples have nearly equal. Therefore, it is possible to conclude that any one of the above four fitted relations can be used to express the temperature variation of specific heat capacity of pure PC and PC/MLG nanocomposites in the temperature range from 313 to 393 K.
Thermogravimetric analysis
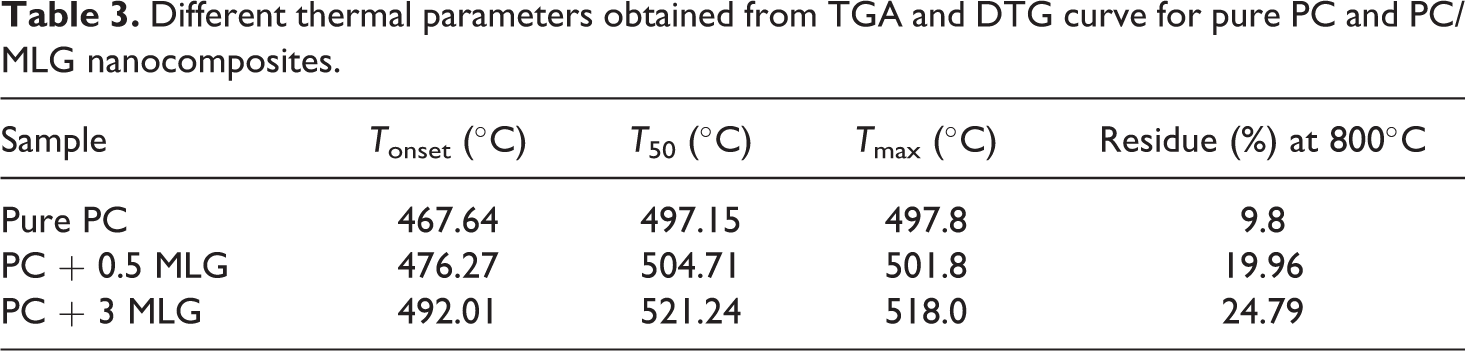
To study the effect of graphene on the thermal stability of polycarbonate/graphene nanocomposites, we carried out TGA analysis of pure PC and its nanocomposites having multilayer graphene (MLG) loadings 0.5 and 3 wt%. The typical TGA and DTG curves of pure PC, PC + 0.5 MLG, and PC + 3MLG samples are given in Figure 6. From Figure 6, it is clear that the pure PC, as well as its nanocomposites with 0.5 and 3 wt% loadings, are decomposed in a single-step process. In comparison to the pure PC, the TGA curves of PC/MLG nanocomposites shifted toward higher temperatures with increasing MLG loadings. Different parameters used to study the relative thermal stability of the samples obtained from TGA and DTG curves are summarized in Table 3. From Table 3, it is observed that the onset decomposition temperature (Tonset) and the temperature of the maximum rate of weight loss (Tmax) of pure PC are 467.64and 497.8°C, respectively. The thermal degradation of polycarbonate (PC) can take place in two different pathways: chain scission of isopropylidene bond and hydrolysis or alcoholysis of carbonate bonds, which include rearrangements of carbonate bonds or crosslinking upon heating and finally resulting in CO, CO2, H2O, and char. 25 For PC/MLG nanocomposites, delayed decompositions are observed. The onset decomposition temperature (Tonset) of the PC + 0.5 MLG and PC + 3 MLG nanocomposites are respectively 476.27 and 492.01°C, which are 8.63 and 24.37°C higher than that of pure PC. Also, the values of Tmax, obtained from the peak value of the DTG curve, of PC/MLG nanocompositesincreases with MLG loading compared to that of pure PC. Moreover, the residual weight increases with MLG loading. Therefore, it is clear that when multilayer graphene (MLG) is added to polycarbonate, all the degradation temperatures, as well as the residual weight of the nanocomposites, increases with MLG concentration in the composites. Hence it is possible to say that the presence of multilayer graphene (MLG) enhances the overall thermal stability of the nanocomposite. It is well known that graphene possesses high thermal stability and its flat like structure may promote the gas barrier effect of the nanocomposite. 52 Highly dispersed graphene has the ability to form continuous network structured protective layer and tortuous path which restricts the escape of volatile degradation products during thermal decomposition53–55 and thereby improving the overall thermal stability of the nanocomposite.
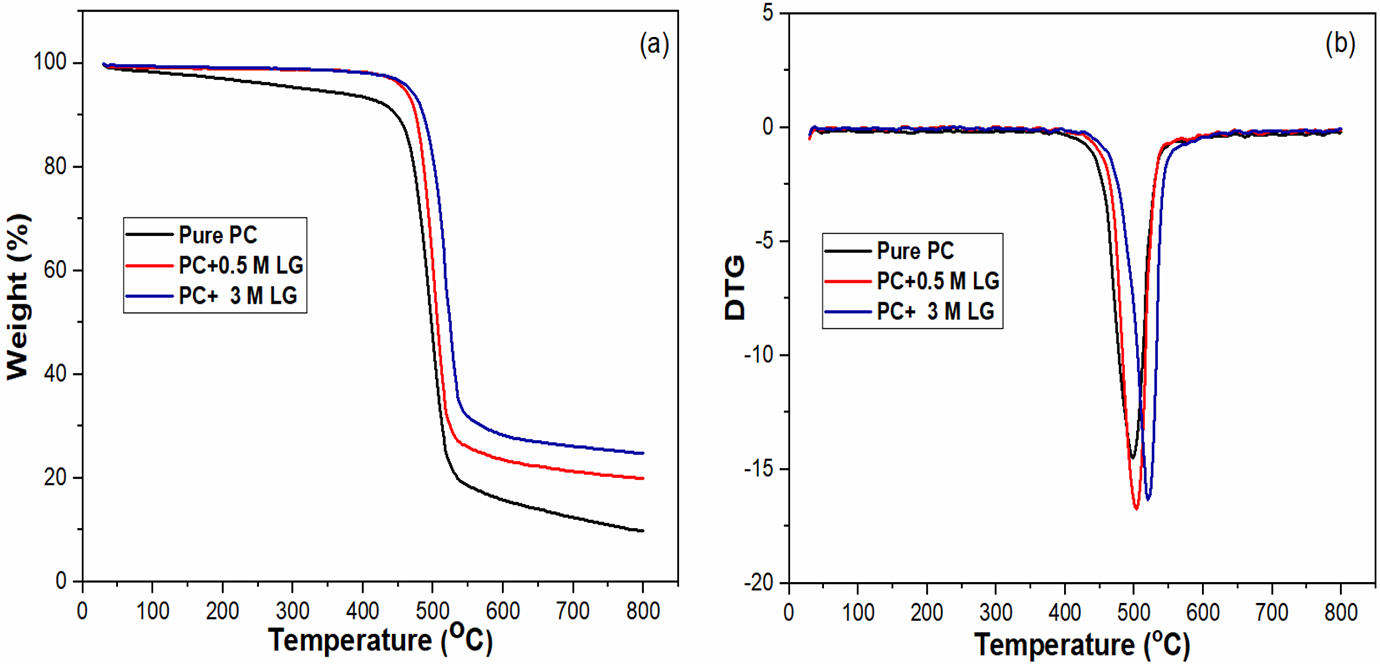
TGA (a) and DTG (b) curves of Pure PC, PC + 0.5 MLG, and PC + 3 MLG.
Different thermal parameters obtained from TGA and DTG curve for pure PC and PC/MLG nanocomposites.
For further investigation of thermal stability, the thermal activation energy (Ea) of decomposition for the pure PC and its nanocomposites are evaluated. Various models based on either the rate of conversion or the heating rate have been developed to estimate the thermal activation energy. In the simplest case, i.e. for single-step decomposition process, the rate equation can be expressed as
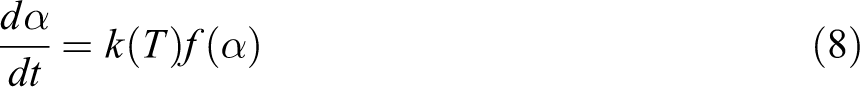
where α represents the extent of conversion (α = 0

where A is the pre exponential, Ea is the activation energy, and R is the universal gas constant.
Considering the reaction order model of the general form

where n represents the reaction order, the rate equation of decomposition becomes
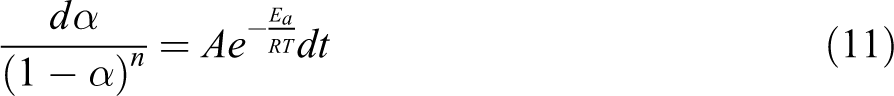
By integrating the above expression with different approximations, a number of different kinetics methods have been proposed. In this work, two such methods—Horowitz–Metzger method 56 and Broido’s method 57 are used to estimate the decomposition activation energy (Ea) of pure PC and PC/MLG composites. These two methods have the advantage that they require to heat sample with only a single heating rate and assumes first-order kinetics. Followings are the equations employed to estimate different kinetics parameters in the above two methods:


where
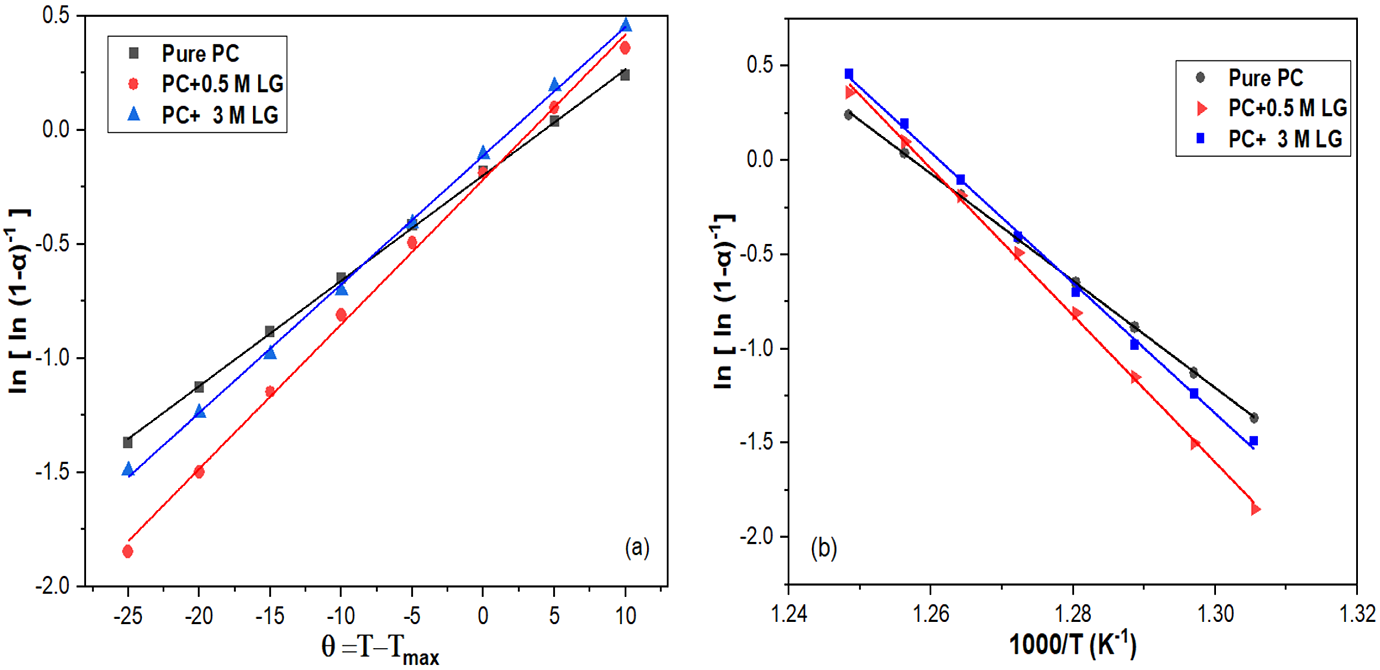
(a) Plot of
Activation energy (Ea) obtained from H–M method and Broido’s method.
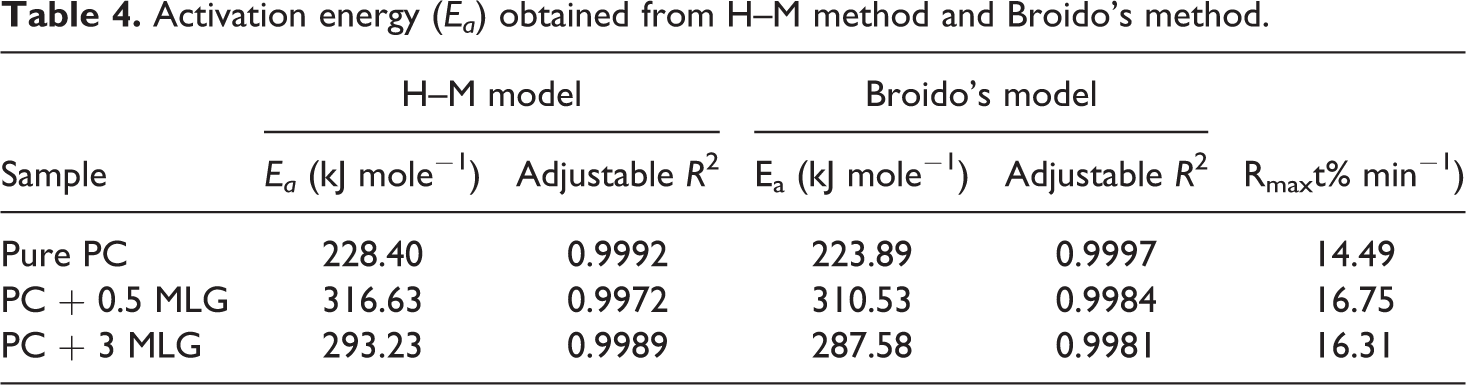
rate (Rmax), as given in Table 4. Thus it is clear that though the PC + 3 MLG composite is more stable than others as reflected from the different characteristic decomposition temperatures (i.e., Tonset, T50, Tmax), the PC + 0.5 MLG composite requires more energy to decompose. Many researchers have reported such variation of activation energy (Ea) and maximum decomposition rate (Rmax) for Polymer/graphene and Polymer/CNT nanocomposites.59–61 The decomposition of polymer is a complex phenomenon, and it becomes more complex when nanofillers are added to the polymer. The presence of graphene affects many properties of the polymer such as gas barrier, heat transfer, and char formation, which influences the decomposition behavior of the nanocomposites. As well dispersed graphene forms a continuous jammed network in the polycarbonate matrix, it enhances the gas barrier effect. Also, the formation of the graphene network increases the heat transfer ability since graphene is a high thermal conductive material. During thermal decomposition of PC/MLG, there is a competition mechanism between gas barrier effect and heat transfer effect which may be resulting such variations of activation energy (Ea) and maximum decomposition rate (Rmax). 61
Conclusions
In this work, Polycarbonate/Graphene composites were prepared via the melt mixing process and the influences of graphene on the thermal properties and thermal stability of the composite are investigated by DSC and TGA. The dispersion of multilayer graphene (MLG) into the polycarbonate(PC) matrix in PC/MLG nanocomposites was monitored using FE-SEM and well dispersion of MLG in PC polymer matrix was observed in the PC/MLG nanocomposite. A significant increase in the glass transition temperature was observed on the addition of MLG in PC/MLG nanocomposites, which could be attributed to the interaction between the PC matrix and MLG as confirmed by the observed shift in Raman Spectra. Specific heat capacity of all pure PC and PC/MLG nanocomposites varies linearly with temperature in the temperature range from 313 to 393 K. The TGA result demonstrated an overall enhancement in the thermal stability of PC/MLG nanocomposites on the addition of MLG. The activation energy (Ea) of thermal decomposition, obtained using H–M and Broido’s method, of PC + 0.5 MLG and PC + 3 MLG nanocomposites is higher than that of pure PC, which also indicates the better thermal stability of the PC + MLG nanocomposite.
Footnotes
Acknowledgements
Authors wish to acknowledge FIST program of SERB/DST, Govt. of India for XRD and TGA facilities at the department of physics, Visva-Bharati Central University, India. MAS wishes to acknowledge CSIR, Govt of India, for providing SRF-direct fellowship vide sanction no. 09/202(0087) 2K19-EMR-I. Authors also acknowledge Injamul Alam, NIT Rourkela, for his help in the measurement of FE-SEM and Raman analysis.
Funding
The author(s) received no financial support for the research, authorship, and/or publication of this article.