
Abstract
Despite their high strength-to-weight ratio, short fiber reinforced composites, due to their intrinsically heterogeneous microstructures, exhibit complex mechanical behavior, especially relating to failure. This study explores the dependency of micro-void nucleation on microstructural defects by ranking contributions of competing microstructural metrics, as identified through in-situ X-ray microtomography. Using a Gaussian process framework, six metrics were explored which capture the properties of the closest fiber, the closest fiber tip, the closest pore (proximity and volume), and the local stiffness (using 19 μm and 38 μm neighborhoods). The results demonstrated that less stiff, resin rich areas were more relevant for micro-void nucleation than clustered fiber tips, T-intersections of fibers, or varying porosity volumes. By ranking microstructural configurations and their relevancy to damage, this analysis provides which microstructural metrics can induce micro-void nucleation to help modelers improve failure predictions.
Introduction
The highly heterogenous microstructure of discontinuous fiber composites results in a complex local mechanical response to deformation.1–3 In this study, an injection molded, discontinuous glass fiber composite within a thermoplastic matrix is examined. The material exhibits a range of key fiber characteristics, including distributions of length, orientation, and local volume fraction, and porosity characteristics, including distributions of volume, morphology, and local volume fraction. Given the wide distribution of microstructural attributes, the damage and fracture response is difficult to understand, let alone predict.
A deeper understanding of damage initiation hinges on understanding the complex interplay of microstructural defects and their configurations.1,3,4,5 Rolland et al. have shown that fibers in close proximity and/or fiber crossings promoted damage initiation. 6 Hanhan et al. have shown that high shear stress concentrations near voids promoted interfacial matrix cracking. 7 While a range of damage mechanisms, including micro-void nucleation, 8 fiber breakage, 6 and debonding, 9 have been reported in these materials, this paper investigates the microstructural rationale for micro-void nucleation as the predominant observed failure mechanism and thus damage progression.
In addition to the underlying complex microstructure, polypropylene based composites, unlike thermoset composites, exhibit highly non-linear plasticity further complicating their mechanical behavior.4,10,11 This not only facilitates ductile behavior in the composites but also throughout the microstructure. For example, Sato et al. 8 studied the fracture surface of a polyamide 6,6 reinforced with short glass fibers, and noted that a region (about 1 mm in diameter) was characteristic of ductile failure in the matrix. Specifically, this region was considered the region where the crack initiated and grew in a ductile manner, prior to final catastrophic fracture. In this work, this region will be referred to as the ductile fracture zone.
While initial works in damage assessment (including the assessment of the ductile fracture zone) adopted surface-based approaches such as scanning electron microscopy,8,12–14 in-situ X-ray microtomography can provide time-resolved microstructure evolution during loading, thus providing insight into varying damage mechanisms within the bulk of the material.6,7,15–18 These 3D techniques can provide valuable sub-surface information, however, it can be difficult to manually visualize large data sets of tomography images to observe the direct effects of fibers and voids.
The vast microstructural configurations and their evolution with respect to applied loading via in-situ X-ray microtomography presents rich datasets for further examination. The resulting datasets cannot translate into knowledge about the origins of the failure mechanism in the material of interest, unless it is interpretable. Gaussian process modeling provides a promising means for interpreting such datasets, which represents a means to classify a series of random variables to an observable event, including material failure.19–21 In this study, the microstructural attributes for local neighborhoods within discontinuous fiber composites are classified, via Gaussian process modeling, based on their relevancy to micro-void nucleation.
Methods
Materials and in-situ tomography
The material used in this work was a polypropylene matrix reinforced with E-glass fibers (30% by weight), which was injection molded into cylinder rods that were further machined into small dog-bone shaped specimens. Prior to injection molding, the 10 μm diameter discontinuous E-glass-fibers were pre-treated with a silane solution to ensure their adhesion to the polypropylene matrix. Measuring 12.7 mm in diameter and 457.2 mm in length, the injection molded rod was manufactured such that the flow direction was along its length.
The dog-bone specimens were machined from the cylindrical rod (initially 1.27 cm in diameter) to accommodate a gauge section with a diameter of 2.4 mm and a gauge section length of 5 mm, with a grip diameter of 6.31 mm. Hence, the entire specimen is extracted from the core region of the injection molded rod. Two specimens were studied in this work, and they were placed in a screw-driven custom load frame, as shown in Figure 1(a). Each specimen was loaded to final fracture, with the loading interrupted at intervals (Figure 1(b)) in order to acquire tomography images. The loading path was displacement controlled, in which during the scans, each specimen was held at a fixed displacement. Load relaxation was observed during the scan time, on average of 5 N. The material was sufficiently stable, such that from the radiography images, no evidence of pore evolution (i.e., nucleation or growth) was observed during the scan time. (a) Experimental setup showing the tensile specimen (circled) in the load frame, the X-ray detector, the rotational stage, and the DIC camera; (b) load profile of the two specimens where each data point represents an in-situ tomography scan; (c) 3D greyscale image volume composed of 2D serial sections of the gauge section after tomographic reconstruction of projected sinograms with an insert of an edge crack (just before final failure).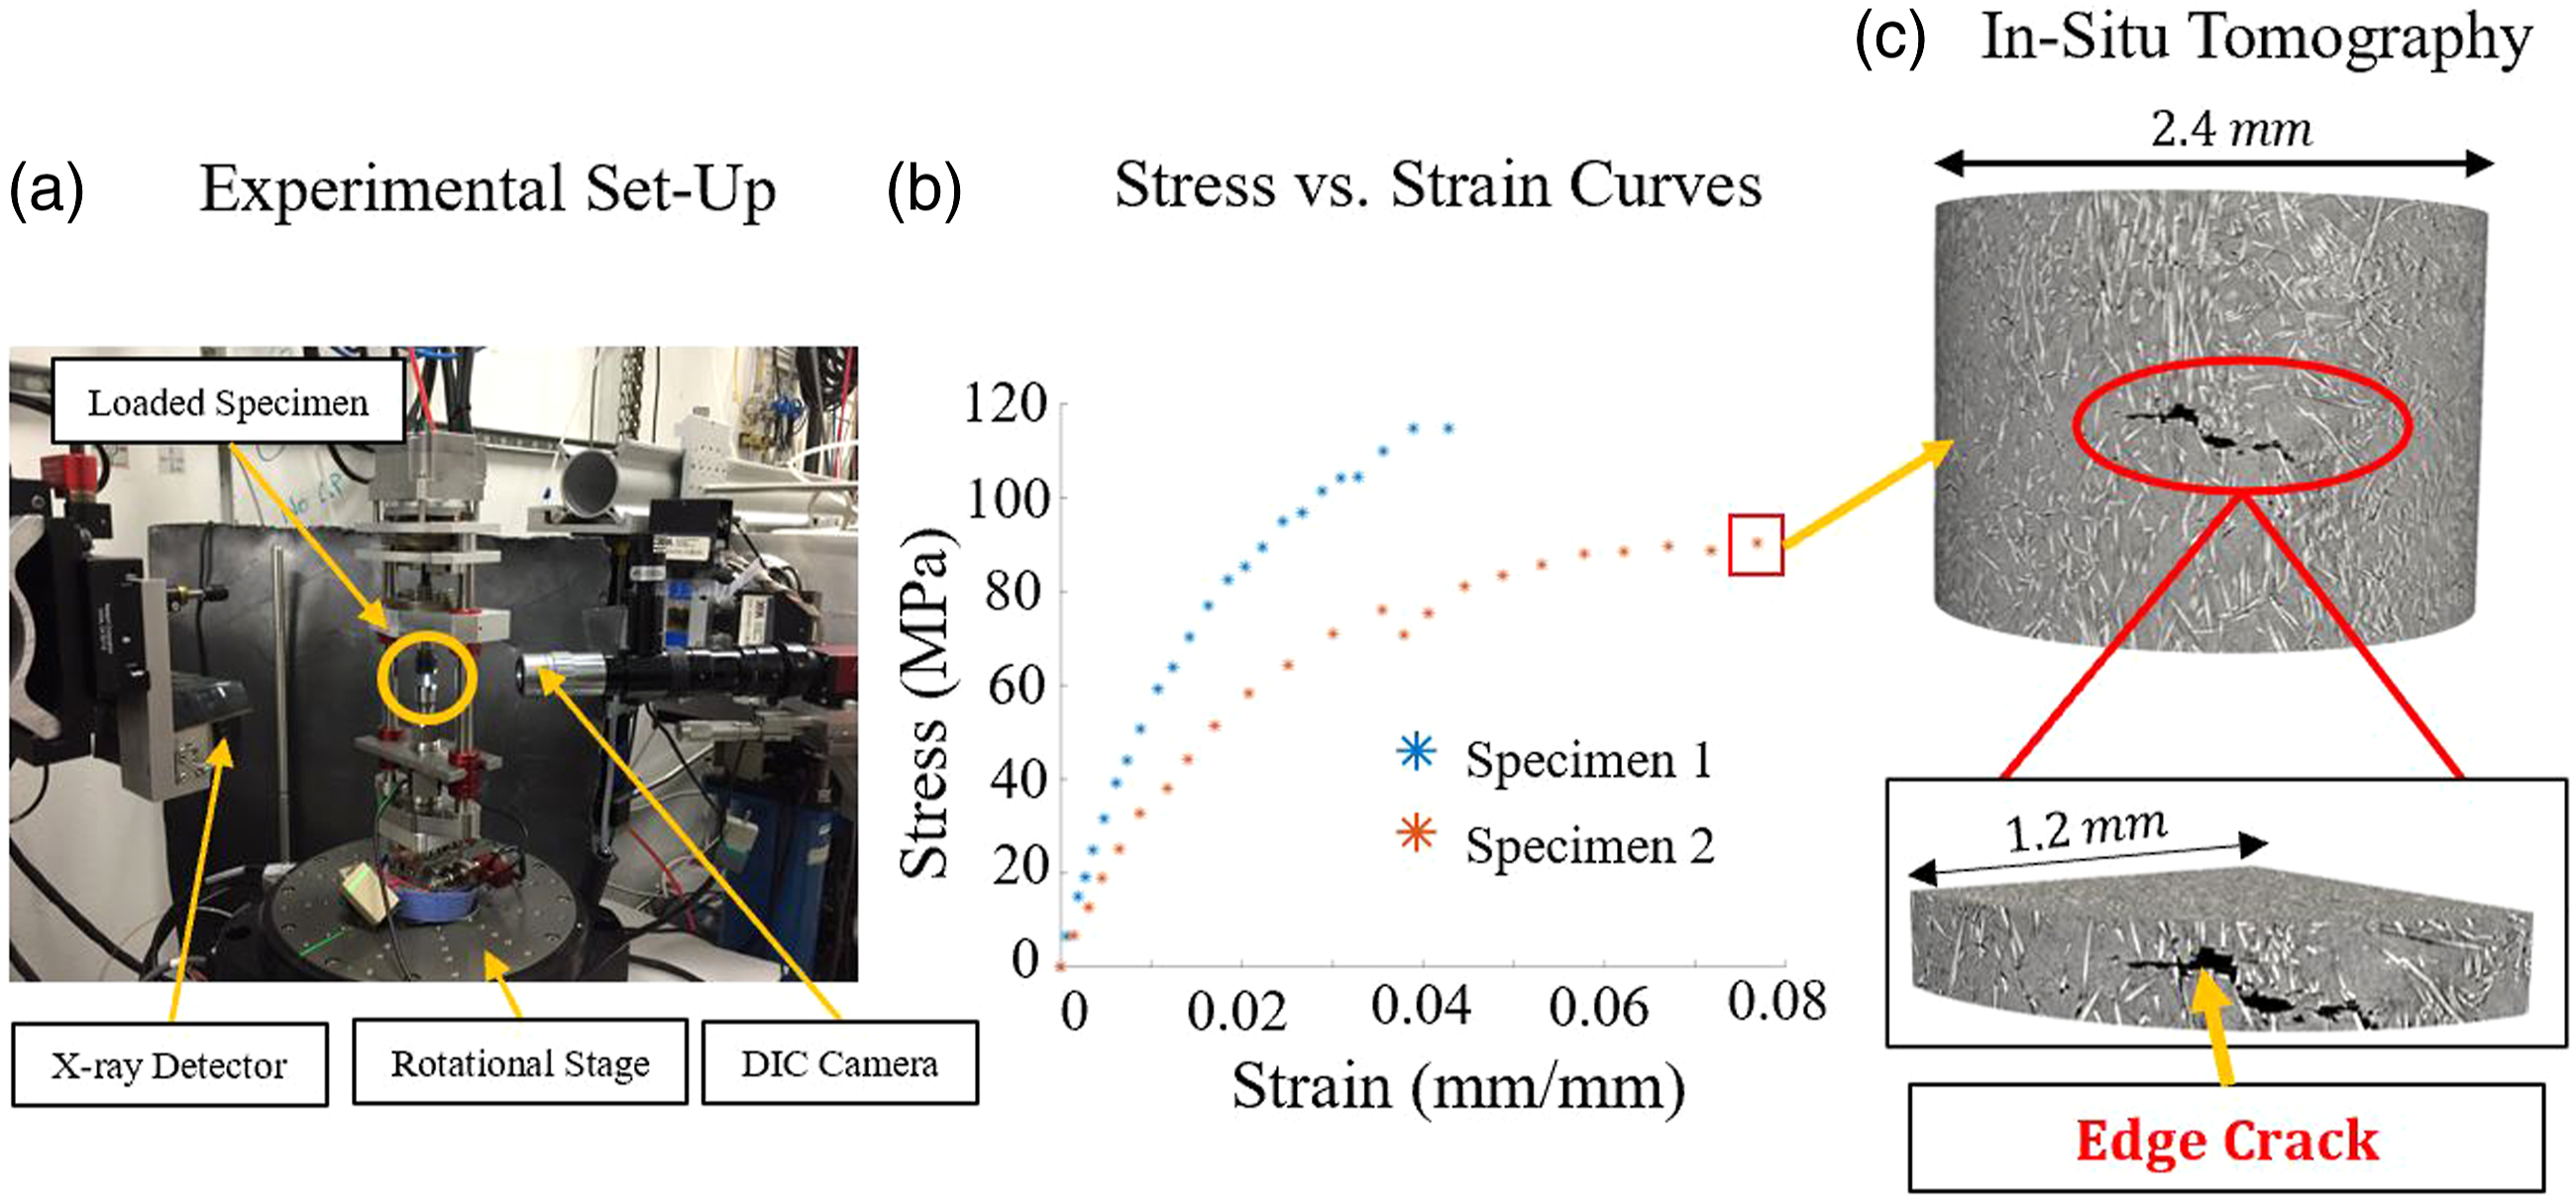
In-situ time lapse tomography was conducted on the gauge sections of the monotonically loaded tensile specimens to generate serial sections of 1.3 μm per pixel 3D image volumes.22,23 This was accomplished by mounting the full assembly on a rotational stage (Figure 1(a)) placed 75 mm away from an X-ray detector downstream, such that the gauge section of each specimen was in the path of a 25 keV beam line upstream. The load frame was rotated at 0.5
o
/s through a 180
o
range, where X-ray projections of the specimen were acquired at a 100 ms exposure time for every 0.12
o
step. In total, 1500 projections of the specimen were collected during a complete scan. A scan was acquired at each interrupted interval of tensile loading, and each scan was completed in 6 min. TomoPy,
22
a filtered back projection framework, was used to reconstruct the projected images of the specimen. The result of the reconstruction was a 3D greyscale image volume (composed of stacked 2D slices) with dimensions of 2560 by 2560 by 1300 pixels with pixel size of 1.3 μm. The protocol described above was repeated for the second specimen. Figure 1(c) shows a greyscale image volume of the gauge section for Specimen 2 just before catastrophic failure. The 3D image volumes contained the fiber and porosity features as shown in Figure 2(a) and (b), however in order to understand the mechanical evolution of these features, it was important to characterize and render the 3D fibers and pores using advanced image processing. Verification of the fiber and porosity rendering using (a) a highlighted slice in a cropped 3D greyscale volume, where (b) is the greyscale image of the highlighted slice, (c) is a cross-section of the fiber renderings of the greyscale image, and (d) is a cross-section of the porosity renderings of the greyscale image. This verification is shown from Specimen 2.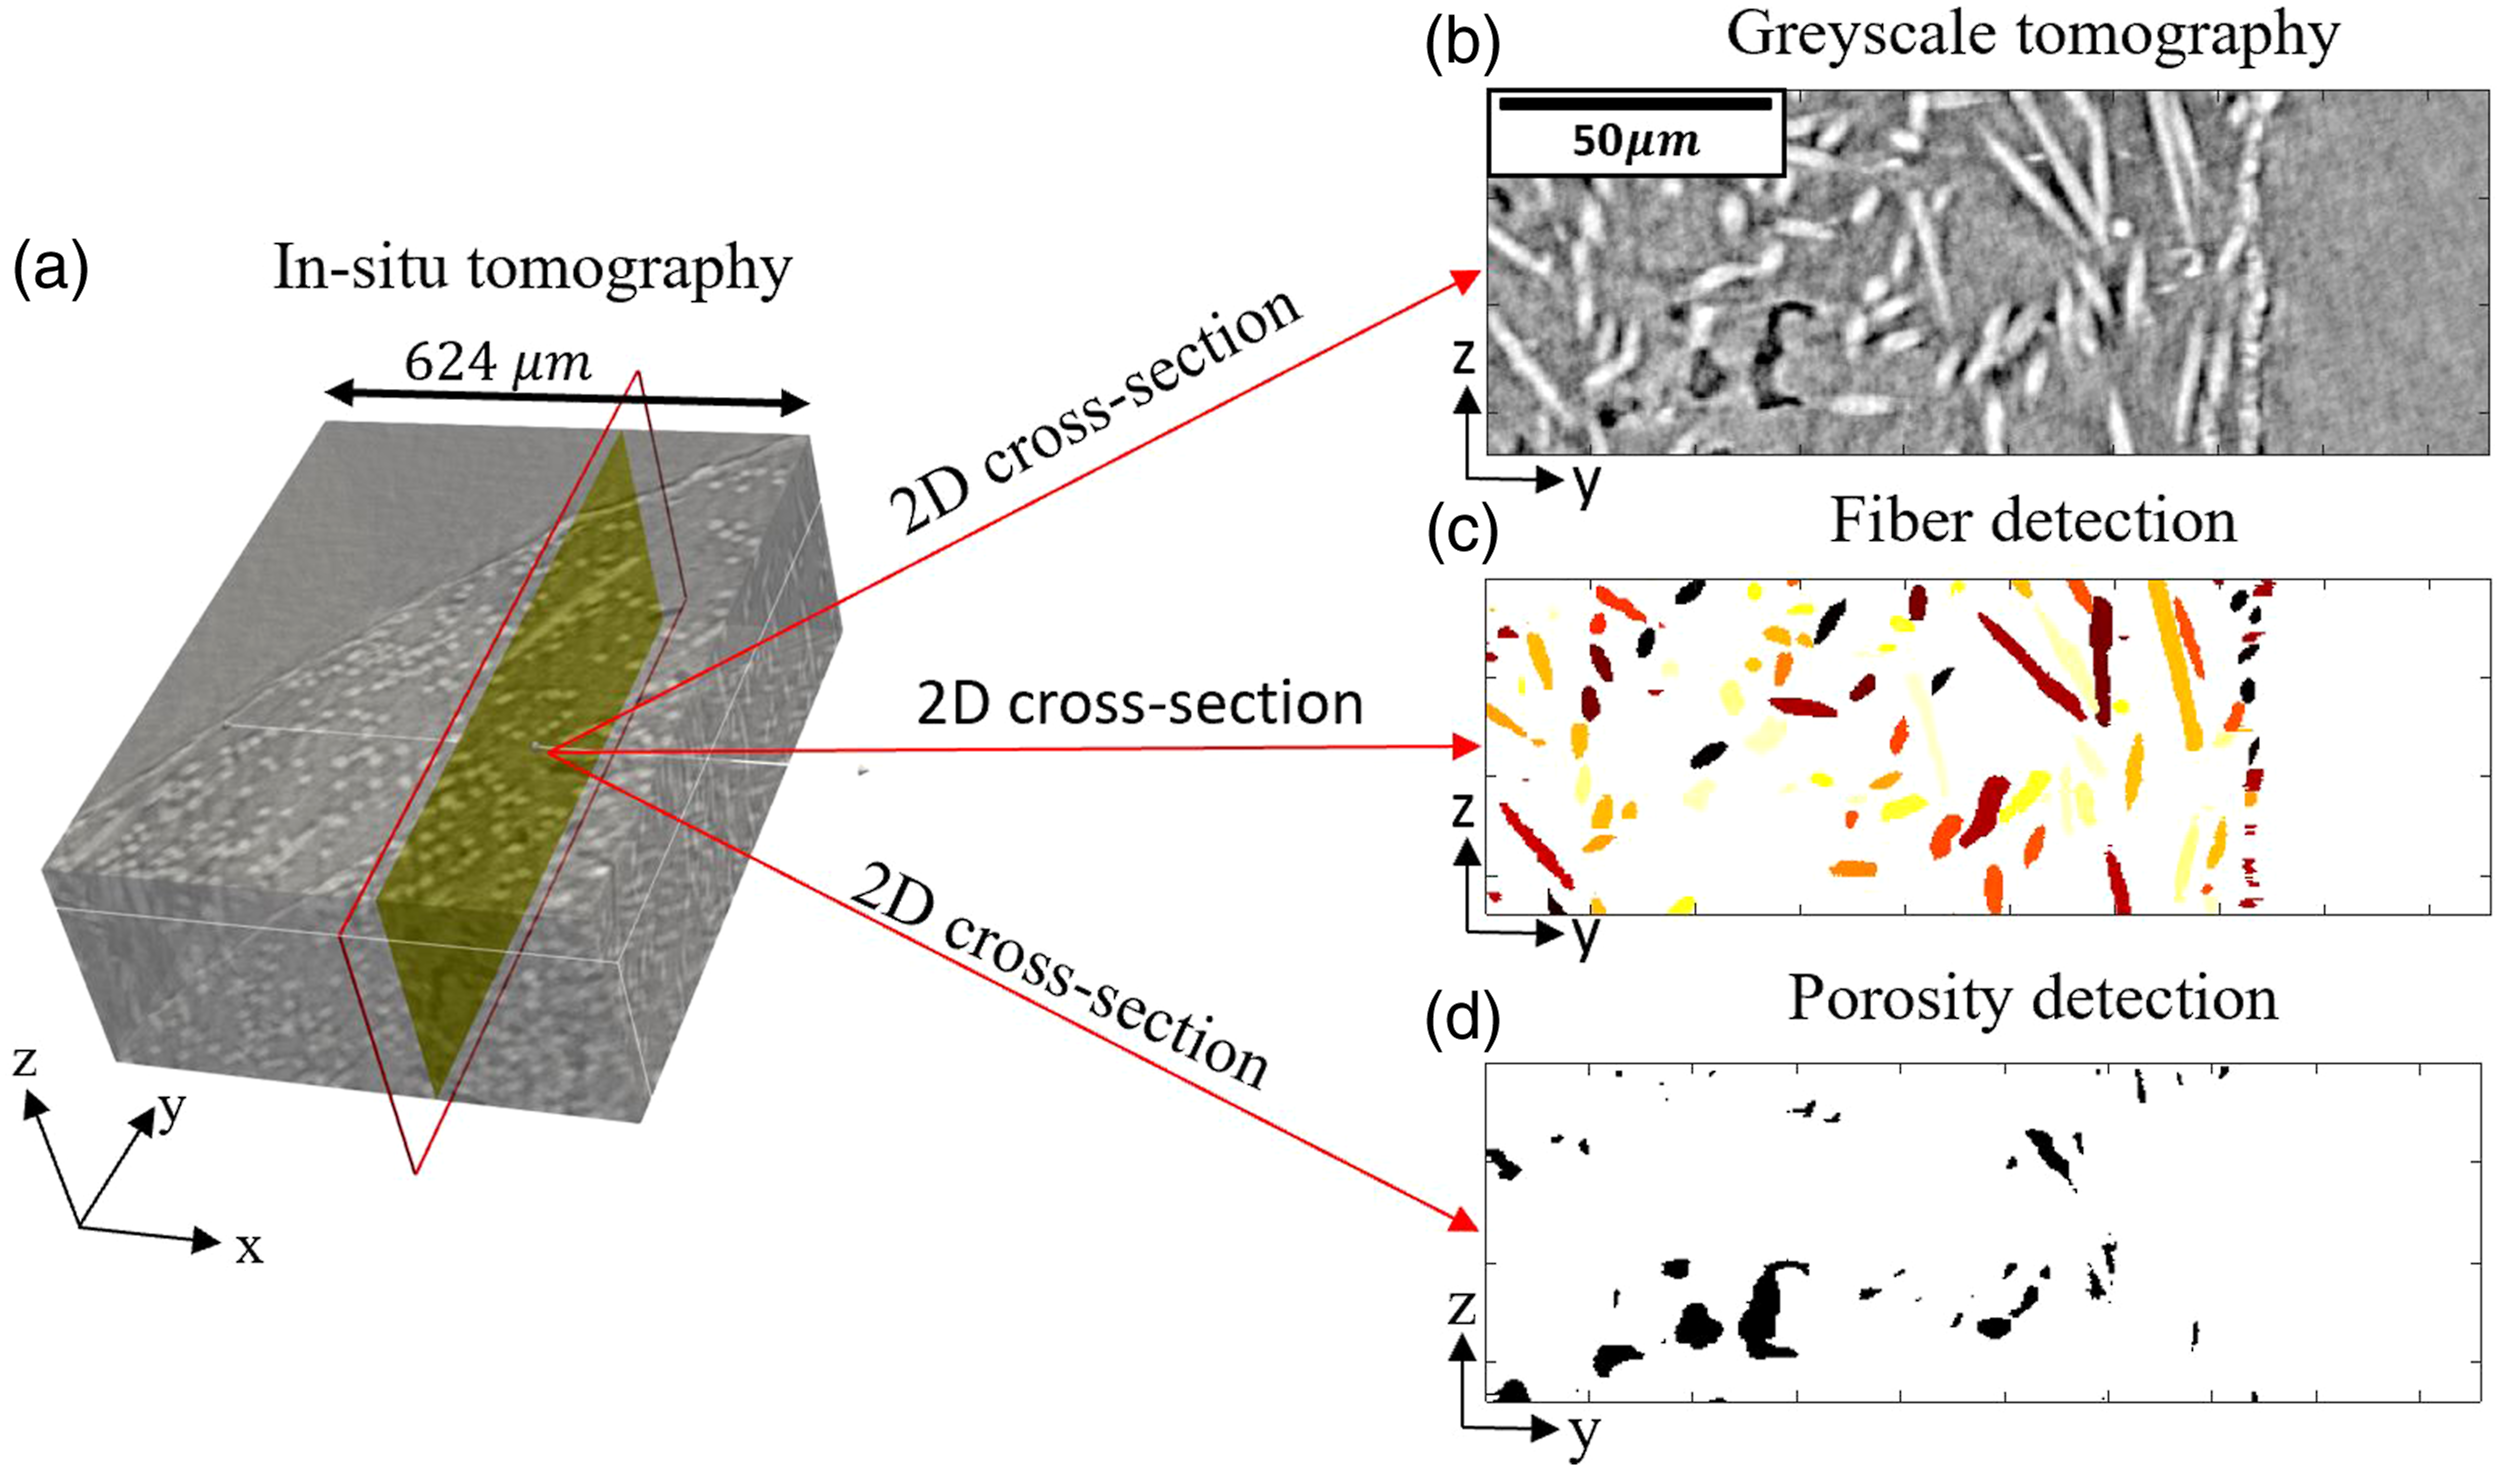
Post-processing
To accurately render fiber features of the microstructure for each specimen, an automated 2D/3D fiber reconstruction framework was applied to serial sections of the reconstructed greyscale volumes as described by Agyei and Sangid. 24 The framework is based on a series of 2D segmentation steps to fit ellipses to the fibers within a tomography slice, which are stacked and then further refined by a combination of (i) 3D segmenting, (ii) stitching over-segmented fibers, and (iii) verification with orthogonal views to inform the iterative approach. The results of the segmented fiber features are shown in Figure 2(c).
The voids within the microstructure (manufacturing-induced pores) were rendered by adopting a semi-automated approach, where segmented porosity features, based on a trained porosity classifier, were manually corrected using ModLayer. 25 The semi-automated approach was adopted because, unlike fiber features, manufacturing-induced pores have more complicated morphologies, ranging from simple spherical shapes to dendritic architectures, which made the rendering of porosity features difficult. To implement the semi-automated approach, WEKA, 26 a machine learning segmentation tool, was first used to build a model classifier based on user-defined input from the greyscale images. The learned classifications were applied to the entire stack of greyscale images to extract the boundaries of the manufacturing-induced pores. Manual verification and intervention in ModLayer was then applied to the WEKA results to ensure that the boundaries of the manufacturing-induced pores were accurately captured, as shown in Figure 2(d).
Damage detection
Corresponding greyscale volumes from the unloaded state to final failure were tracked by visual inspection and 3D cross-correlation, in order to identify the ductile fracture zone. The ductile fracture zone is a critical region characterized by the accumulation of ductile fracture, including the initiation of damage and crack growth (which eventually leads to final failure via a transition from ductile to brittle fracture). To detect the ductile fracture zone, void detection at various load increments (verified through visual inspection of the greyscale images) was conducted to aid in the detection of the largest void (prior to catastrophic failure) within the greyscale volume that did not exist at the unloaded state. During tracking, three stages of the ductile fracture zone, relevant for this study, were captured: just before catastrophic failure (ɛ = 0.99ɛ
f
), at damage inception (ɛ = 0.3ɛ
f
) and at the unloaded state (ɛ = 0). Figure 3 is an illustration of the ductile fracture zone at the unloaded state and just before catastrophic failure for both specimens, where the largest void (which was not present in the as-machined specimens) is shown in the red box. This box was used to mark the boundaries of the ductile fracture zone, and its dimensions were 300 μm by 716 μm by 299 μm for Specimen 1 and 400 μm by 663 μm by 286 μm for Specimen 2. The ductile fracture zone reached the free surface of each specimen, and a visualization of this is provided for Specimen 2 in 1(c) labeled as the edge crack. 3D rendering of the fibers colored according to their A33 orientation for Specimen 1 at (a) preload and (b) ɛ = 0.99ɛ
f
, and for Specimen 2 at (c) preload and (d) ɛ = 0.99ɛ
f
; 3D rendering of the pores colored according to their volume for Specimen 1 at (e) preload and (f) ɛ = 0.99ɛ
f
, and for Specimen 2 at (g) preload and (h) ɛ = 0.99ɛ
f
. In each case for the 3D porosity rendering, the ductile fracture zone has been boxed in red.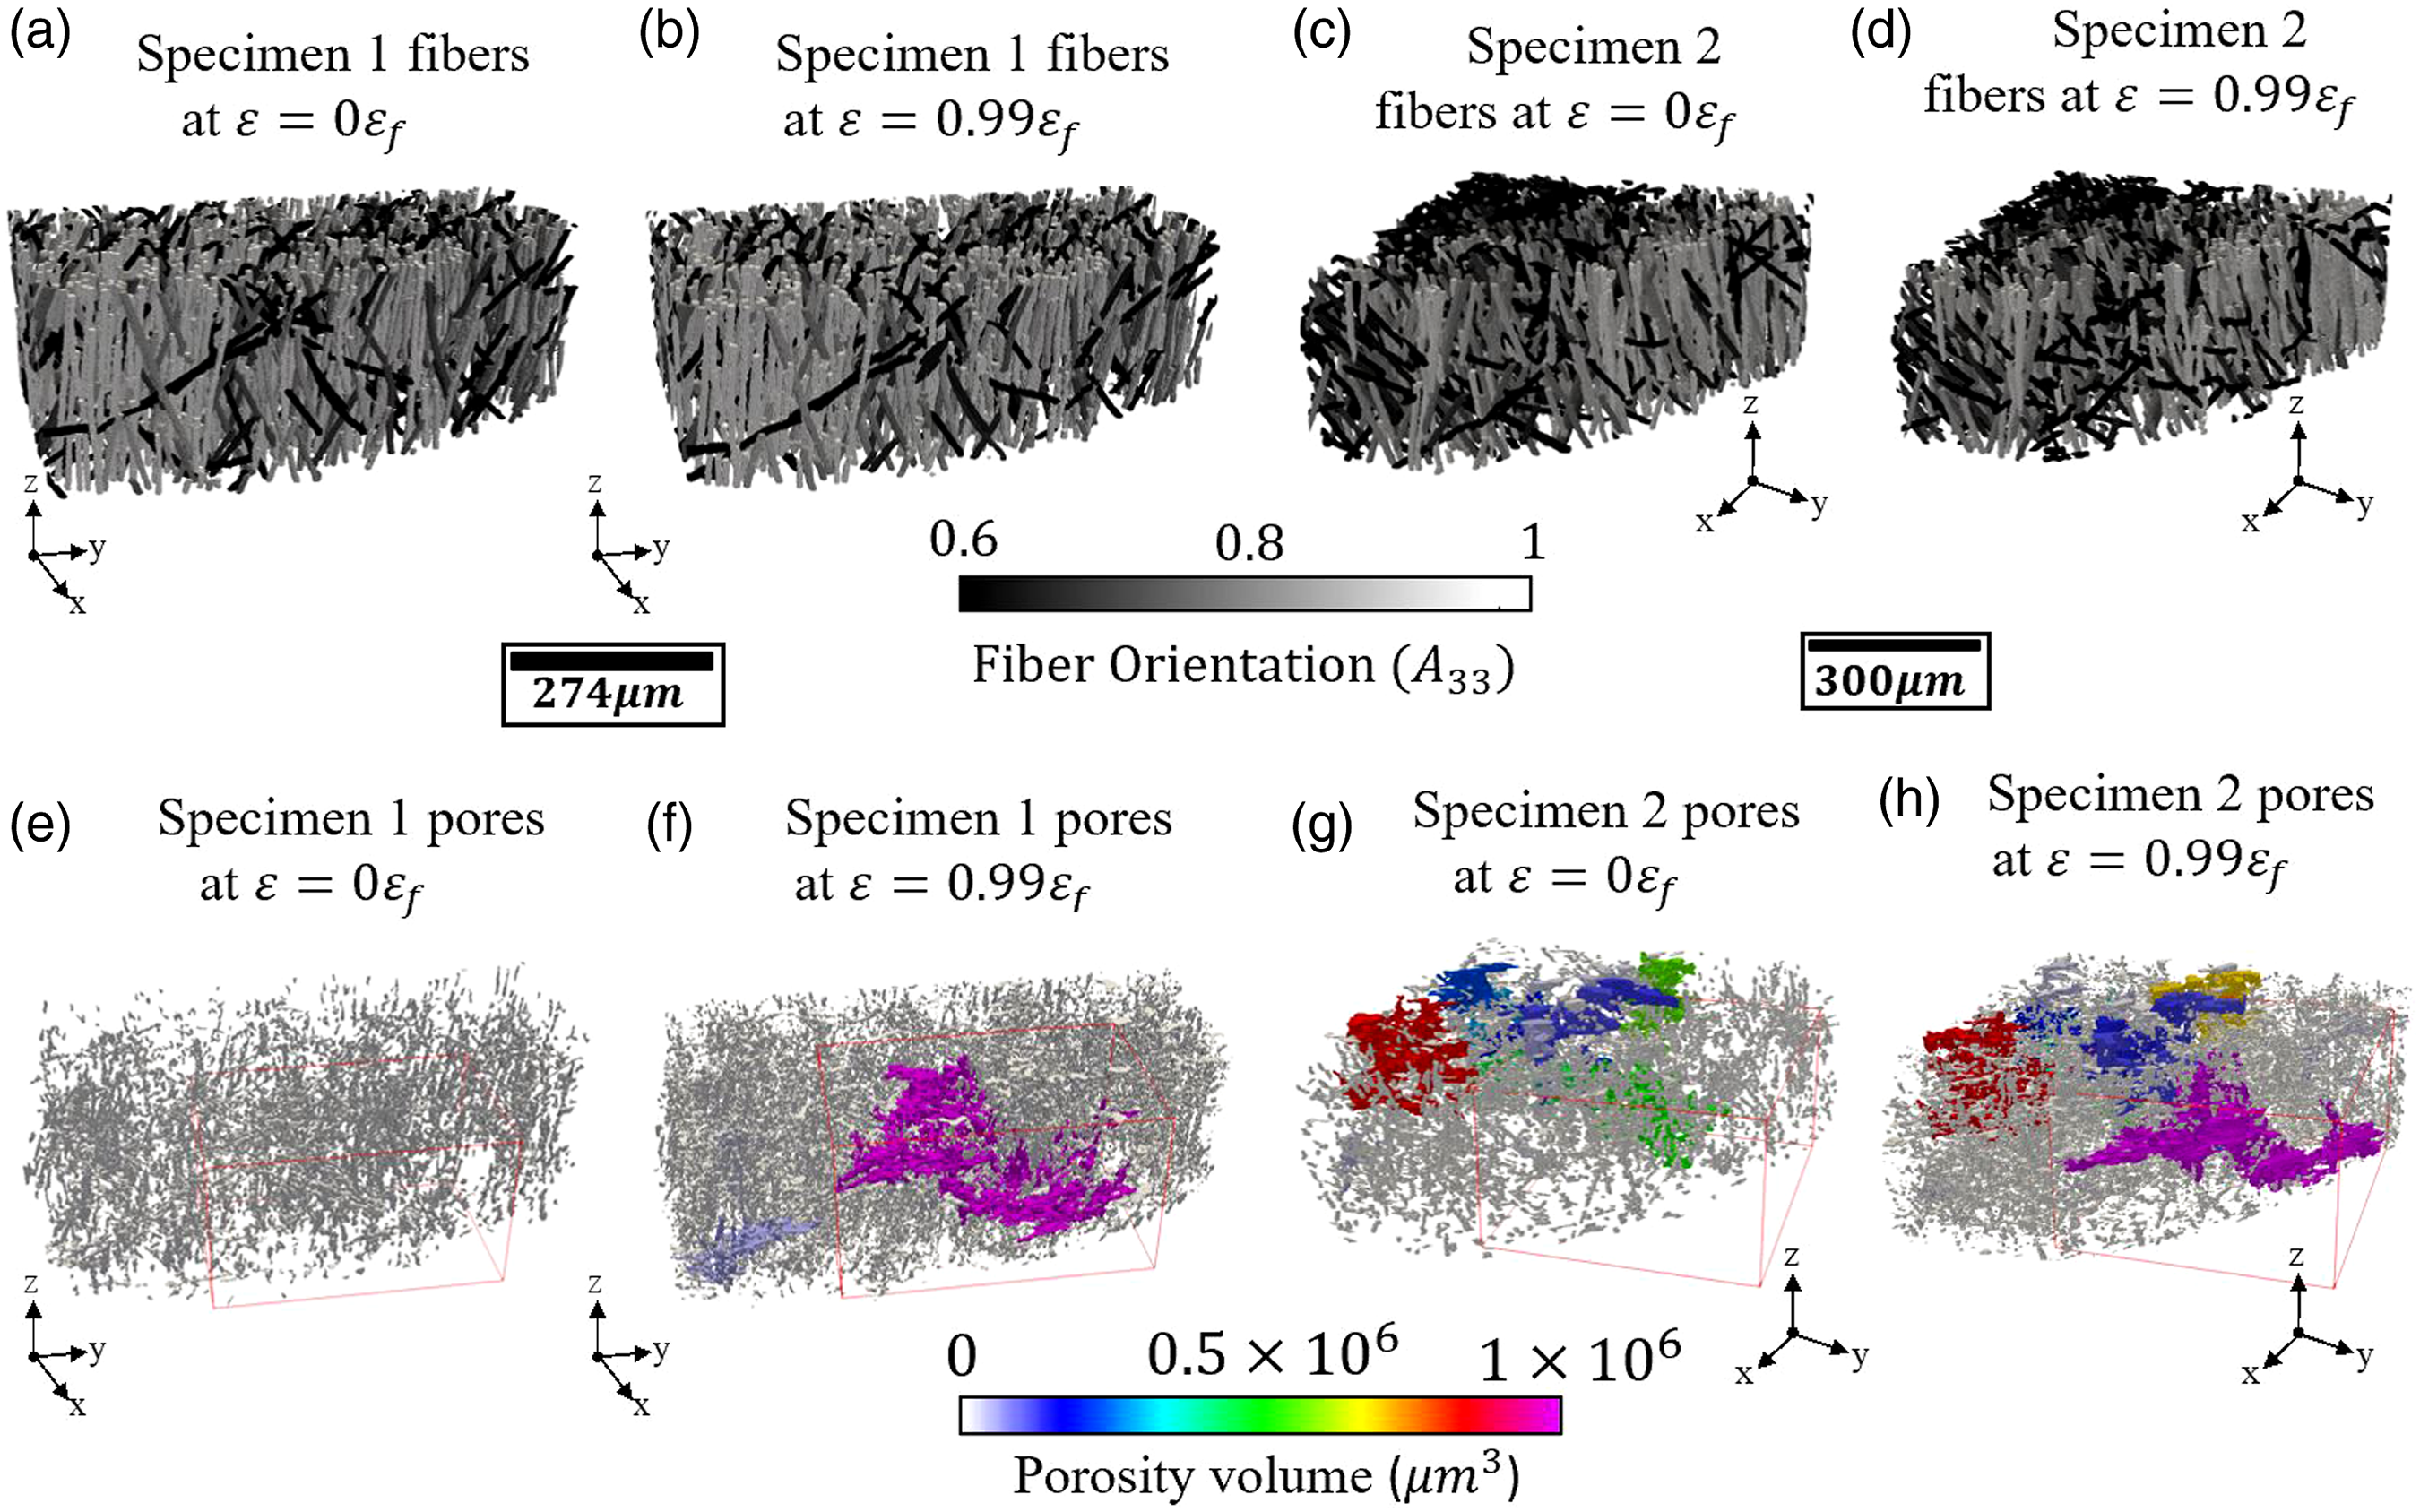
Although the void detection was used to determine the ductile fracture zone, additional steps were required to determine individual damage initiation sites and their corresponding damage mechanisms. Within the ductile fracture zones, damage initiation sites were defined as locations of dark intensity pixels that were not present in ɛ = 0 and appeared in ɛ = 0.3ɛ f when corresponding tomography slices were compared for both specimens.6,16,17 Within discontinuous composites, these localized damage initiation sites are associated with damage types such as micro-void nucleation at fiber tips (the appearance of a spherical agglomeration of dark pixels at the tip of fiber tip), fiber breakage (the appearance of a new discontinuity in a fiber that was initially continuous), and fiber debonding (the appearance of dark pixels along the length of the fiber). 17 Within the ductile fracture zone at damage inception (ɛ = 0.3ɛ f ), boundaries of detected damage were manually identified using ModLayer 25 and classified as either micro-void nucleation at fiber tips, fiber breakage, or fiber debonding. Micro-void nucleation was observed as the dominant mechanism (quantitatively via number of detected sites) in both specimens. The number of detected sites of micro-void nucleation, fiber breakage, and fiber debonding were 37, 7, and 19, respectively, in Specimen 1 and 34, 7, and 2, respectively, in Specimen 2.
Due to their prevalence within the ductile fracture zone, micro-void nucleation sites which occurred at the tips of the discontinuous fibers were further examined to determine the effects of their neighboring microstructure. Two categories of local microstructural sites were chosen: fiber tips experiencing micro-void nucleation, and randomly sampled locations of pristine fiber tips (to ensure the statistical analysis was not biased). Sampling of the locations of pristine fiber tips were (i) random with verifications to ensure that sites were uniformly spaced within the ductile fracture zone; (ii) not adjacent to locations of micro-void nucleation; (iii) did not belong to the same fiber; (iv) equivalent in number to detected sites micro-void nucleation. The collection of fiber tips that exhibited micro-void nucleation as well as the random fiber tips that remained pristine throughout loading will be referred to as the fiber tips of interest. As shown in Figure 4(a) and (b), a neighborhood around micro-void nucleation has been defined as the radial distance away from the outer boundary of the damage site, whilst the neighborhood of a pristine fiber tip was defined as the radial distance away from the centroid of its fiber tip. This neighborhood definition for the fiber tips of interest will be used when computing local stiffness at two neighborhood sizes (whereas all other microstructural metrics are not dependant on the definition of a neighborhood). Illustrations of (a) a neighborhood of micro-void nucleation and (b) a neighborhood of a pristine fiber tip; (c) illustration of the distance from the tip of the fiber that nucleates a micro-void, to the closest fiber tip (designated d1) and to the closest fiber (designated d2); (d) illustration of the distance from a location of micro-void nucleation to the closest manufacturing-induced pore (designated d3) as well as the volume of that manufacturing-induced pore (designated V1).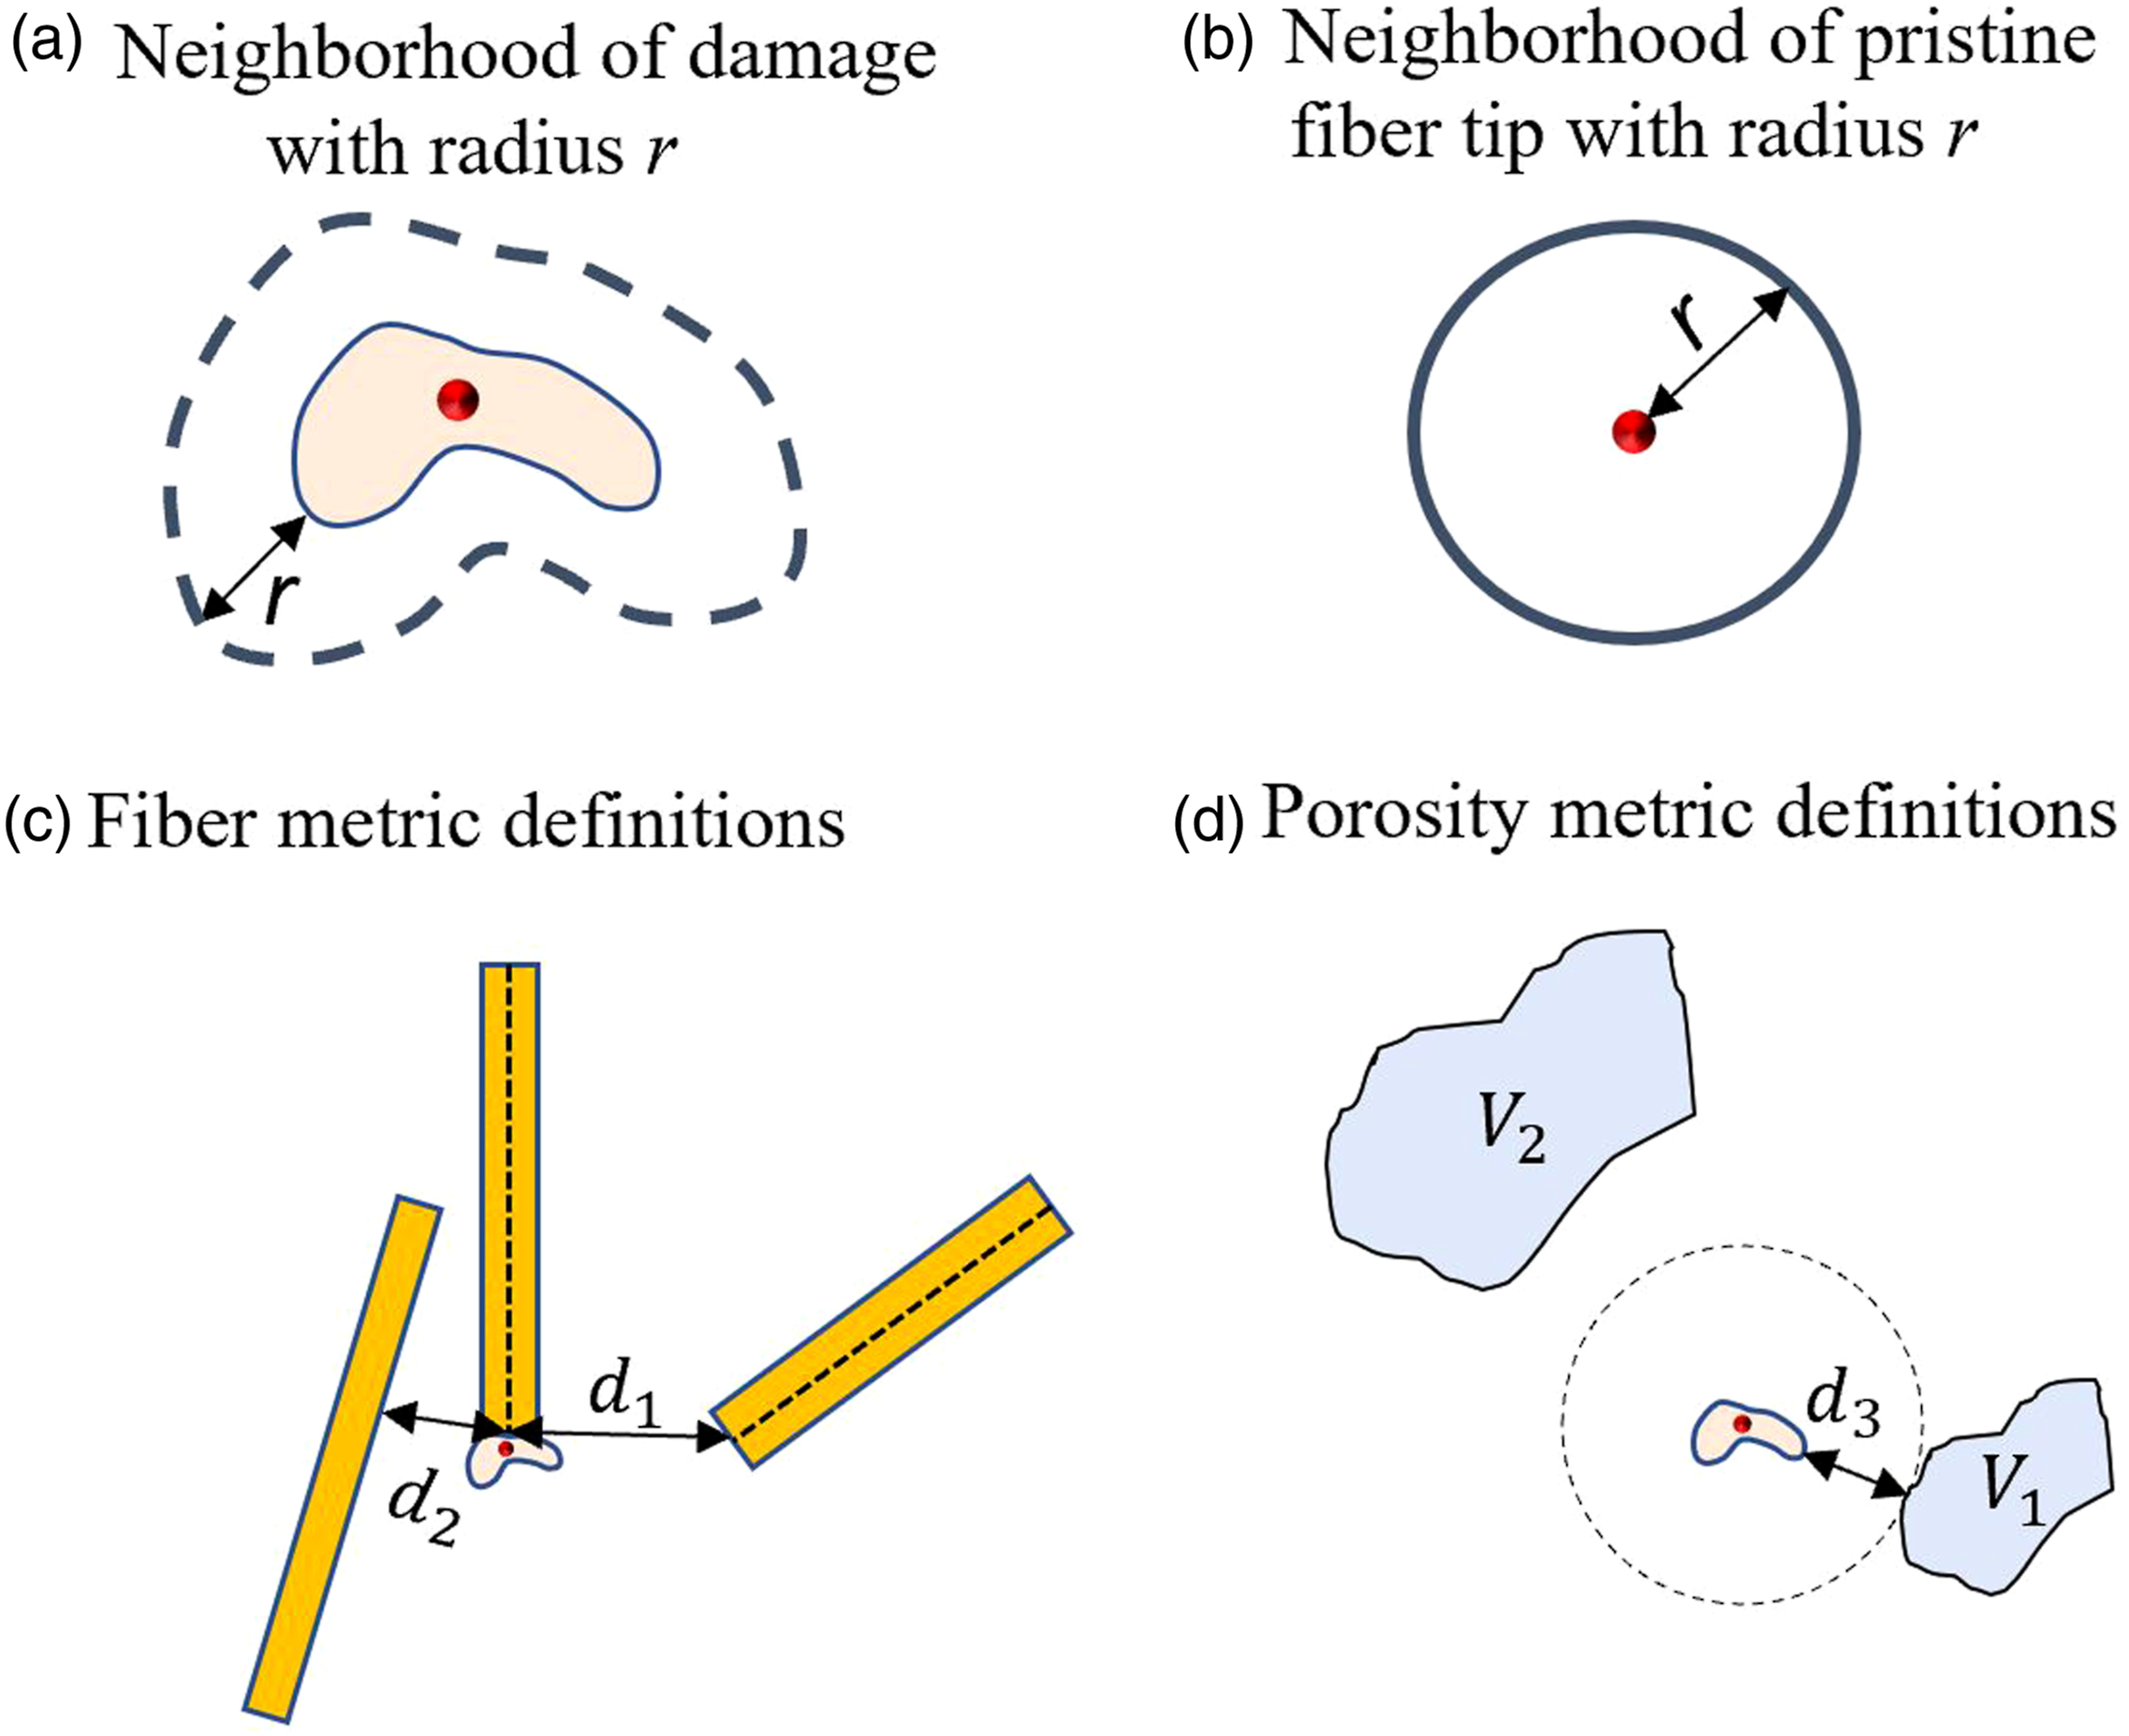
Data analysis for microstructural metrics
Microstructural metrics
The dependency of neighboring fibers to micro-void nucleation was examined via two fiber metrics, defined as: the distance from a fiber tip of interest to the closest fiber tip, as well as the distance to the closest fiber (to study T-intersections). The computation of both metrics was conducted using an in-house Matlab algorithm that used the 3D voxelated data, where each voxel was assigned a class (corresponding to either a fiber ID, the polymer matrix, or a void ID). The 3D ductile fracture zone was then automatically analyzed iterating for each fiber tip of interest. For each case, the distance to the closest fiber tip was defined as the distance to the closest fiber tip’s centroid (using regionprops and knnsearch), and has been schematically shown as d1 in Figure 4(c). On the other hand, the distance to the closest fiber used a slightly more complex procedure because it required the determination of the boundary of the nearest fiber. This was accomplished by isolating the voxels of all the neighboring fibers’ boundaries, and then computing the shortest distance between a fiber tip of interest and the closest fiber boundary. This distance has been schematically visualized as d2 in Figure 4(c).
The dependency of neighboring porosity to micro-void nucleation was examined via two porosity metrics, defined as: the distance from a fiber tip of interest to the closest manufacturing pore, as well as the volume of that closest pore. Similarly to the neighboring fiber analysis, this was conducted on the 3D voxelated data of the ductile fracture zone, however all voxels classified as porosity were instead examined. Each fiber tip of interest was iteratively analyzed in a Matlab algorithm, where the 3D boundaries of all pores were extracted, and compared to each fiber tip of interest. From this voxelated boundary data and the coordinates of the fiber tips of interest, the distance to the closest porosity boundary was computed, and has been shown as d3 in Figure 4(d). Additionally, since the 3D voxelated data also contained a unique ID for each pore, it was possible to cross-reference with the porosity detection and compute the volume of the closest pore (the sum of all the 3D voxels which were classified as the pore), shown schematically as V1 in Figure 4(d).
Generally, polypropylene exhibits highly non-linear behavior. Based on prior studies of this material, 4 the mechanical behavior of the polypropylene matrix was in agreement with results reported by Mohammadpour et al. 27 Varna et al. 28 further decompose the time-dependent non-linear behavior into a viscoelastic and viscoplastic response by using Schapery’s model for non-linear viscoelasticity. In its reinforced state, polypropylene could be approximated as a linear elastic material due to its embrittlement by the introduction of rigid fillers. 29 For instance, the storage modulus of aramid reinforced polypropylene (representing the elastic portion) was observed to be enhanced largely due to the high stiffness of the aramid short fibers and the proper stress transfer between the polypropylene matrix and the fibers. 30 In past work, the embrittlement of fiber reinforced polypropylene allows for application of elastic frameworks, such as linear elastic fracture mechanics, to assess the mechanical properties, such as toughness. 29 Additionally, Mu et al. 31 computed the anisotropic properties of reinforced polypropylene using the Tandon-Weng approach to the Mori-Tanaka model. In view of the embrittlement of polypropylene by reinforcing glass fibers, this work includes the local elastic response (by assessing the length and orientation of fiber features) within a neighborhood to assess mechanical behavior as it relates to damage inception of a glass fiber reinforced polypropylene composite.
The dependency of local stiffness to micro-void nucleation was examined via a Mori-Tanaka implementation of the Eshelby problem32–34 to analytically compute elastic stiffness within a 19 μm and 38 μm neighborhood at each fiber tip of interest. The two neighborhood sizes were chosen based on the average distance between fiber tips in the ductile fracture zone, which was computed to be 19 μm. This average distance was computed based on the distances between the centroid coordinate of each fiber tip that nucleated damage and the centroid coordinates of the closest neighboring fiber tip. A total number of 71 data points were used in calculating the average. Therefore, a neighborhood with a radius of 19 μm would include the fiber tip of interest, as well as one other fiber tip (on average), and the 38 μm neighborhood would include the fiber tip of interest and two other fiber tips (on average). This locally computed stiffness accounted for the full fiber lengths, orientations, and fiber volume fraction of all fibers that intersected with each neighborhood (as defined in Figure 4(a) and (b)). In these computations, the fiber and the matrix were assumed to be isotropic, with the stiffness and Poisson ratio of the E-glass fibers were chosen as E
f
= 73 GPa and ν
f
= 0.22, respectively, while the stiffness and Poisson ratio of the polypropylene matrix were chosen as E
m
= 1.6 GPa and ν
m
= 0.43, respectively. The fiber volume fraction, v
f
, was determined for each neighborhood as the ratio of the fiber voxels to the total neighborhood voxels. The analytical method includes the use of the modified dilute strain concentration tensor, A
Eshelby
, which provides the following relationship between the fiber strain and the matrix strain


Additionally, the Mori-Tanaka stiffness tensor, C
MT
, for aligned fibers is

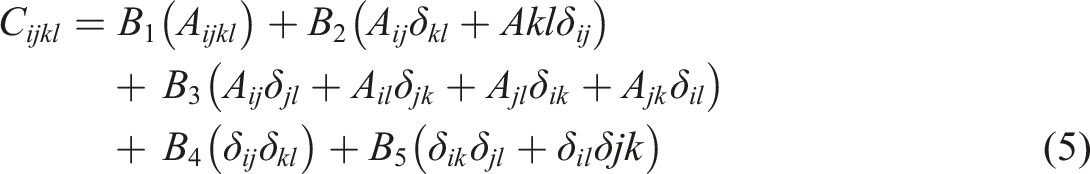
However, for misaligned fibers (such as those found in this work), the fiber orientation tensor A
ijkl
is used to represent the orientation of the fibers34,35,40 that intersect each neighborhood, and is used to calculate the elastic stiffness tensor for a neighborhood as
Gaussian process
Gaussian process classification is used to rank the contribution of microstructural metrics to the inception of micro-void nucleation, due to its ability in solving non-linear, high dimension problems.41–44 Gaussian process classification (GPC) is a non-parametric machine learning framework that models posterior probabilities of class membership for unseen datapoints based on correlations between sampled datapoints and their associated classes.41,42 The implementation of GPC, via GPy,
44
was broken into the data-preprocessing phase (tabulating all computed metrics for each fiber tip of interest), the training phase (choice of a suitable kernel function and optimization routine), and the testing phase (testing the kernel function’s performance), as shown in Figure 5. Pre-processing data included tabulating input variables (microstructural metrics) and output variables (associated class of computed microstructural variables for each fiber tip of interest: 1 for micro-void nucleation and 0 for pristine), and then normalizing the entries of the microstructural metrics
45
to avoid numerical instability.
46
The training phase used the Matern 5/2 kernel and Broyden-Fletcher-Goldfarb-Shanno (BFGS) optimization routine. The training module automatically updated the values of the hyperparameters of the Matern 5/2 kernel to generate an optimized kernel function that draws a correlation between sampled input variables (computed microstructural metrics) and their associated classes (micro-void nucleation or pristine fiber tip). To avoid training biases which may arise from the choice of sampled data points, the GPC code was augmented with a stratified k-fold cross-validation sub-routine. This sub-routine segmented the training data into 9-folds where 8 folds (50% micro-void nucleation-50% pristine fiber tips) were used for training whilst the remaining 1 fold (also 50% micro-void nucleation-50% pristine fiber tips) was reserved for testing. This was then repeated 9 times for each of the 9-folds. Schematic of the Gaussian Process Classification framework.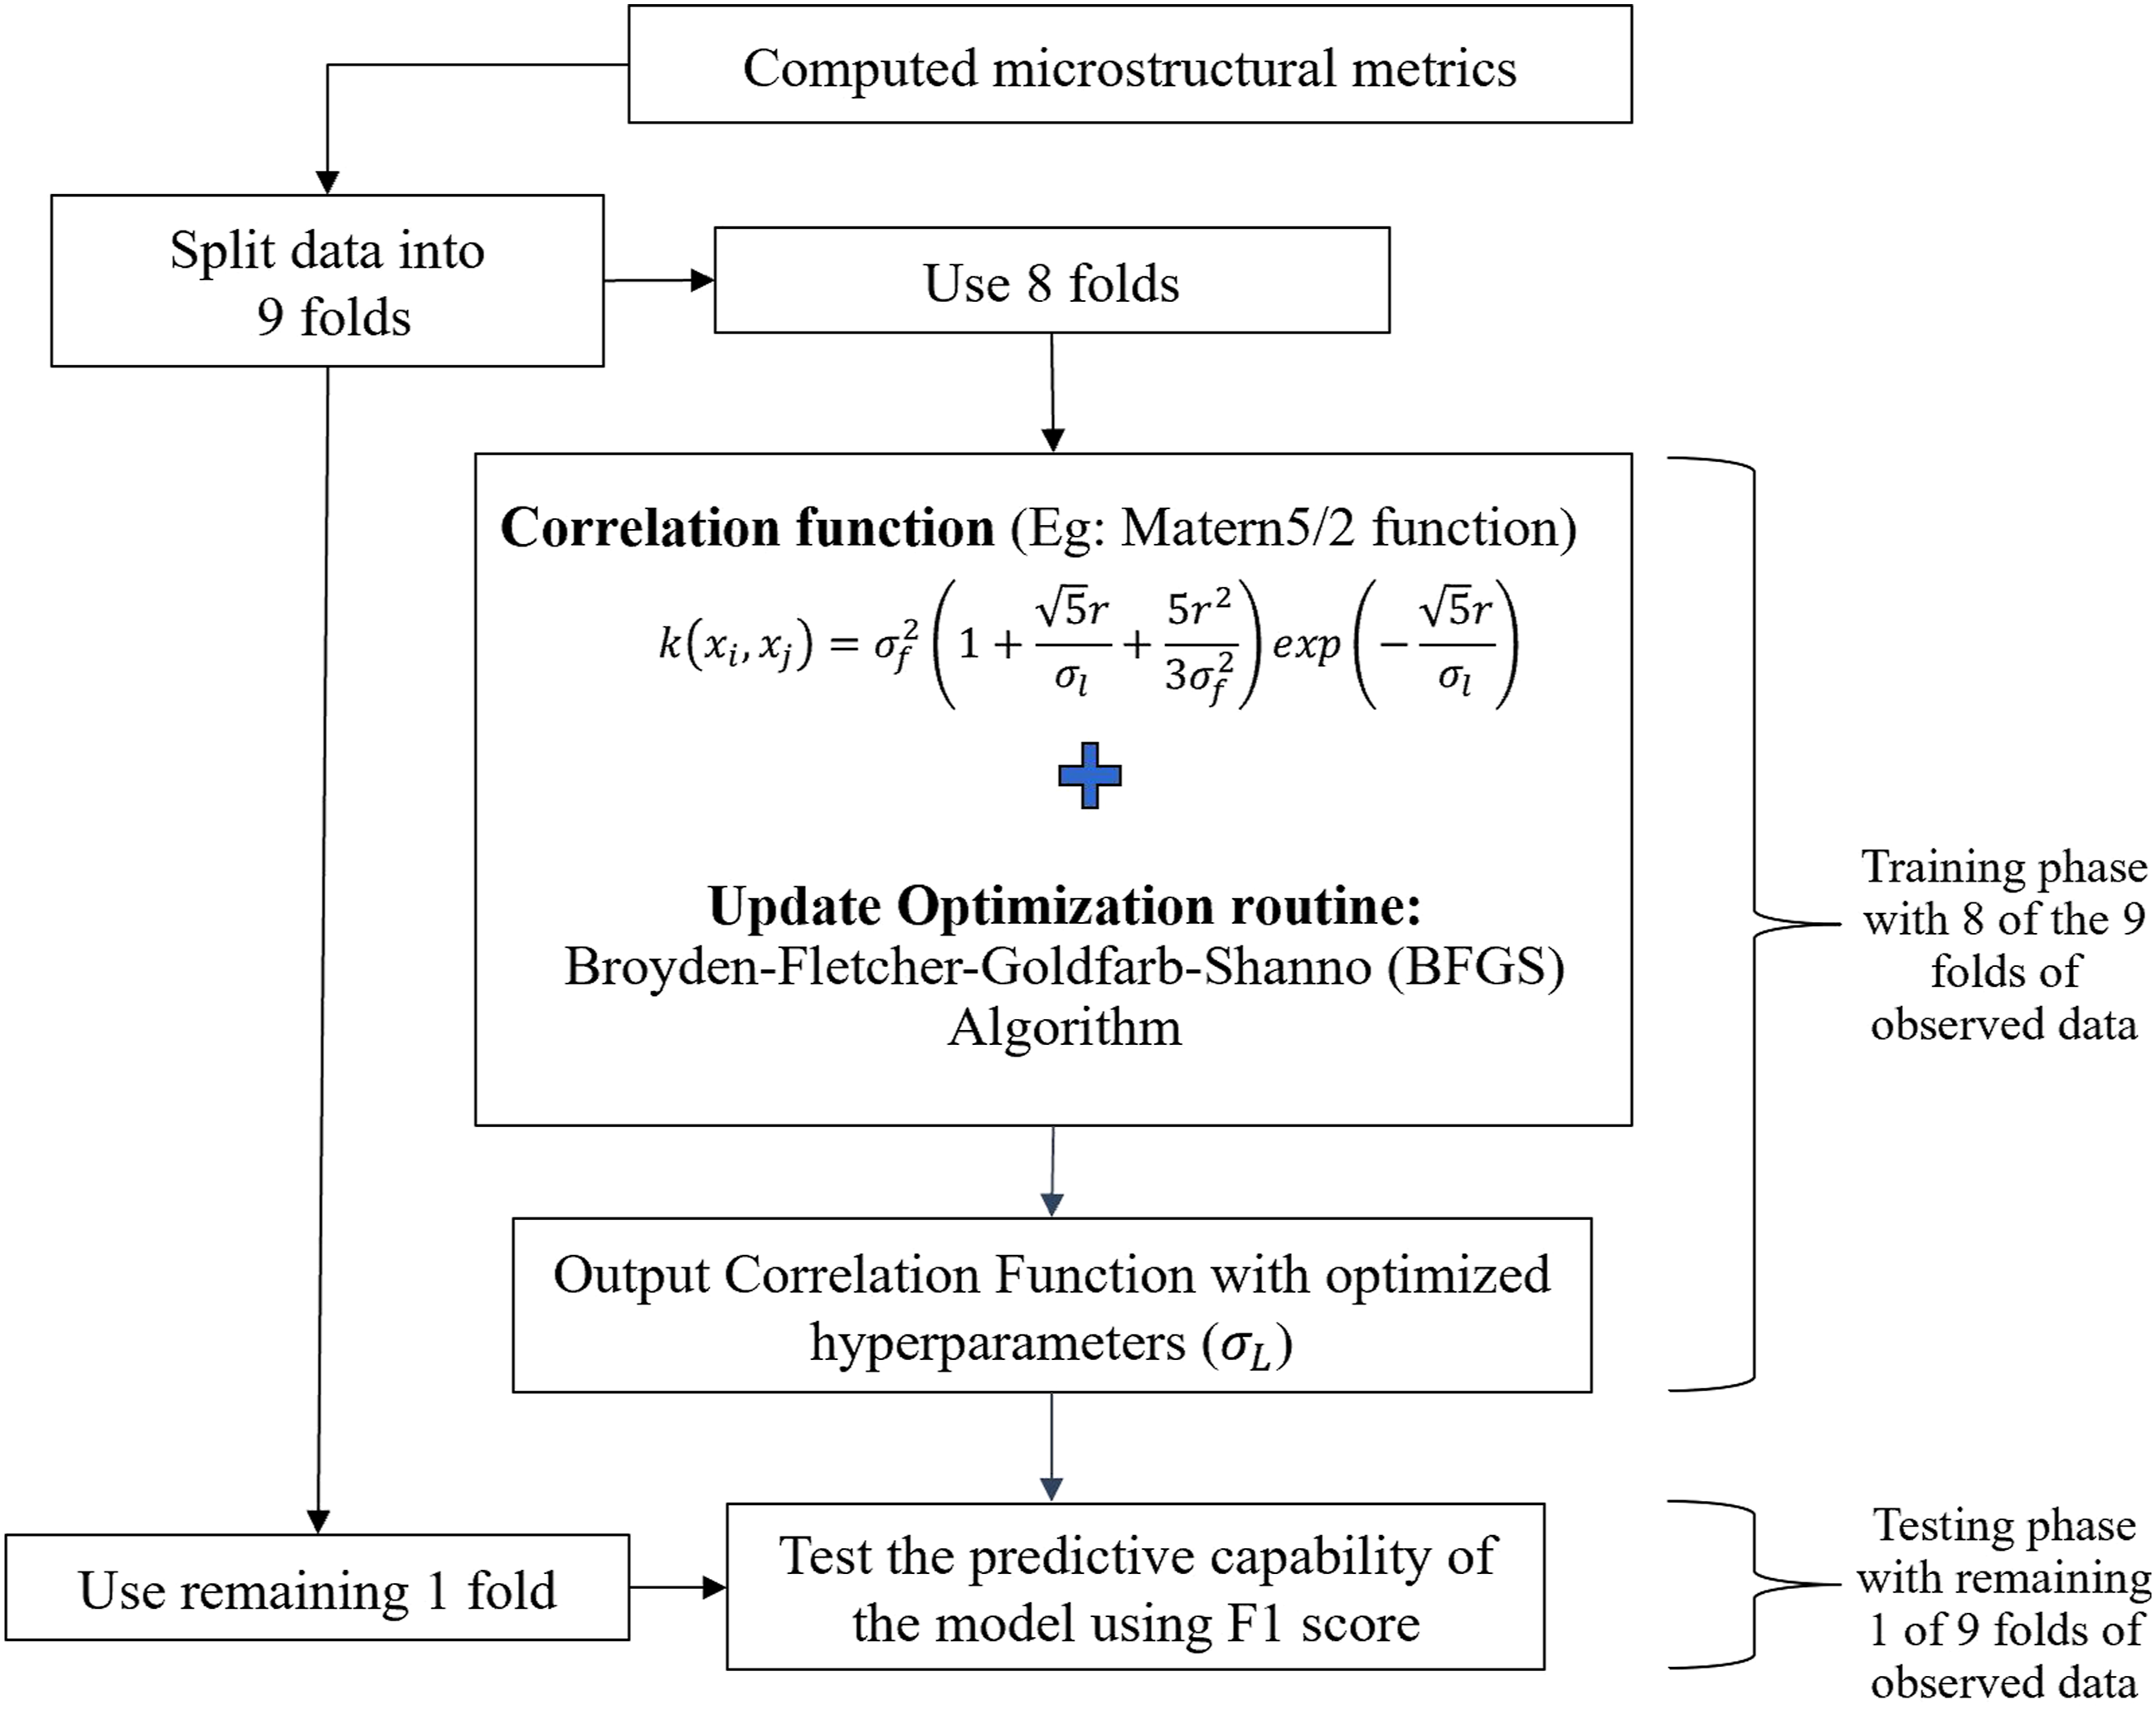
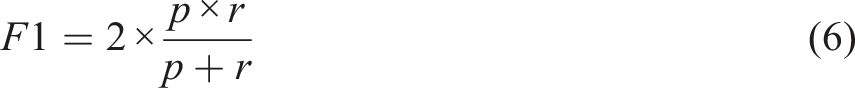
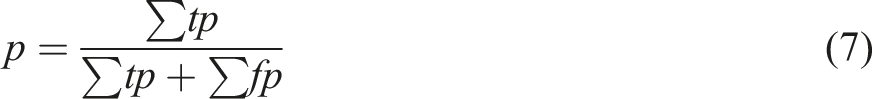
Testing was conducted using the F1 score, which takes into account both accuracy and precision of the GPy testing data. During the testing phase, predicted class probabilities of test data ranged from 0 to 1. With classes of micro-void nucleation and pristine fibers set to values of 1 and 0, respectively, a threshold of 0.5 was set such that predicted class probabilities below 0.5 were set to 0 and those above 0.5 were set to 1. Predictions of the optimized model generated a combination of true/false and positive/negative outcomes. A true positive outcome (tp) occurred when the GPC correctly predicted an observation of micro-void nucleation, and a true negative outcome (tn) occurred when the GPC correctly predicted an observation of a pristine fiber tip. On the other hand, a false positive outcome (fp) occurred when the GPC incorrectly predicted micro-void nucleation (when the observation was actually a pristine fiber tip), and a false negative outcome (fn) occurred when the GPC incorrectly predicted a pristine fiber tip (when the observation was actually micro-void nucleation). The F1 score provides a score of the model’s ability to predict classes correctly (precision, p) and its ability to find all examples of a class (recall, r),
47
as follows
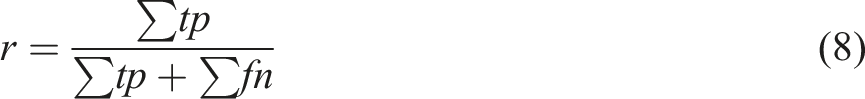
The F1 score ranges from 0 to 1, where 1 implies a perfect prediction. In this work, the F1 score at each of the 9-folds was evaluated to check the performance of the GPC (Figure 6(b)). Results of GPy training and testing; (a) plot of relevancies of computed microstructural metrics for all 9-folds and the ranking of the computed microstructural metrics based on the median values of the respective relevancies; (b) GPy prediction results for each of the 9-folds using the F1 test-prediction metric.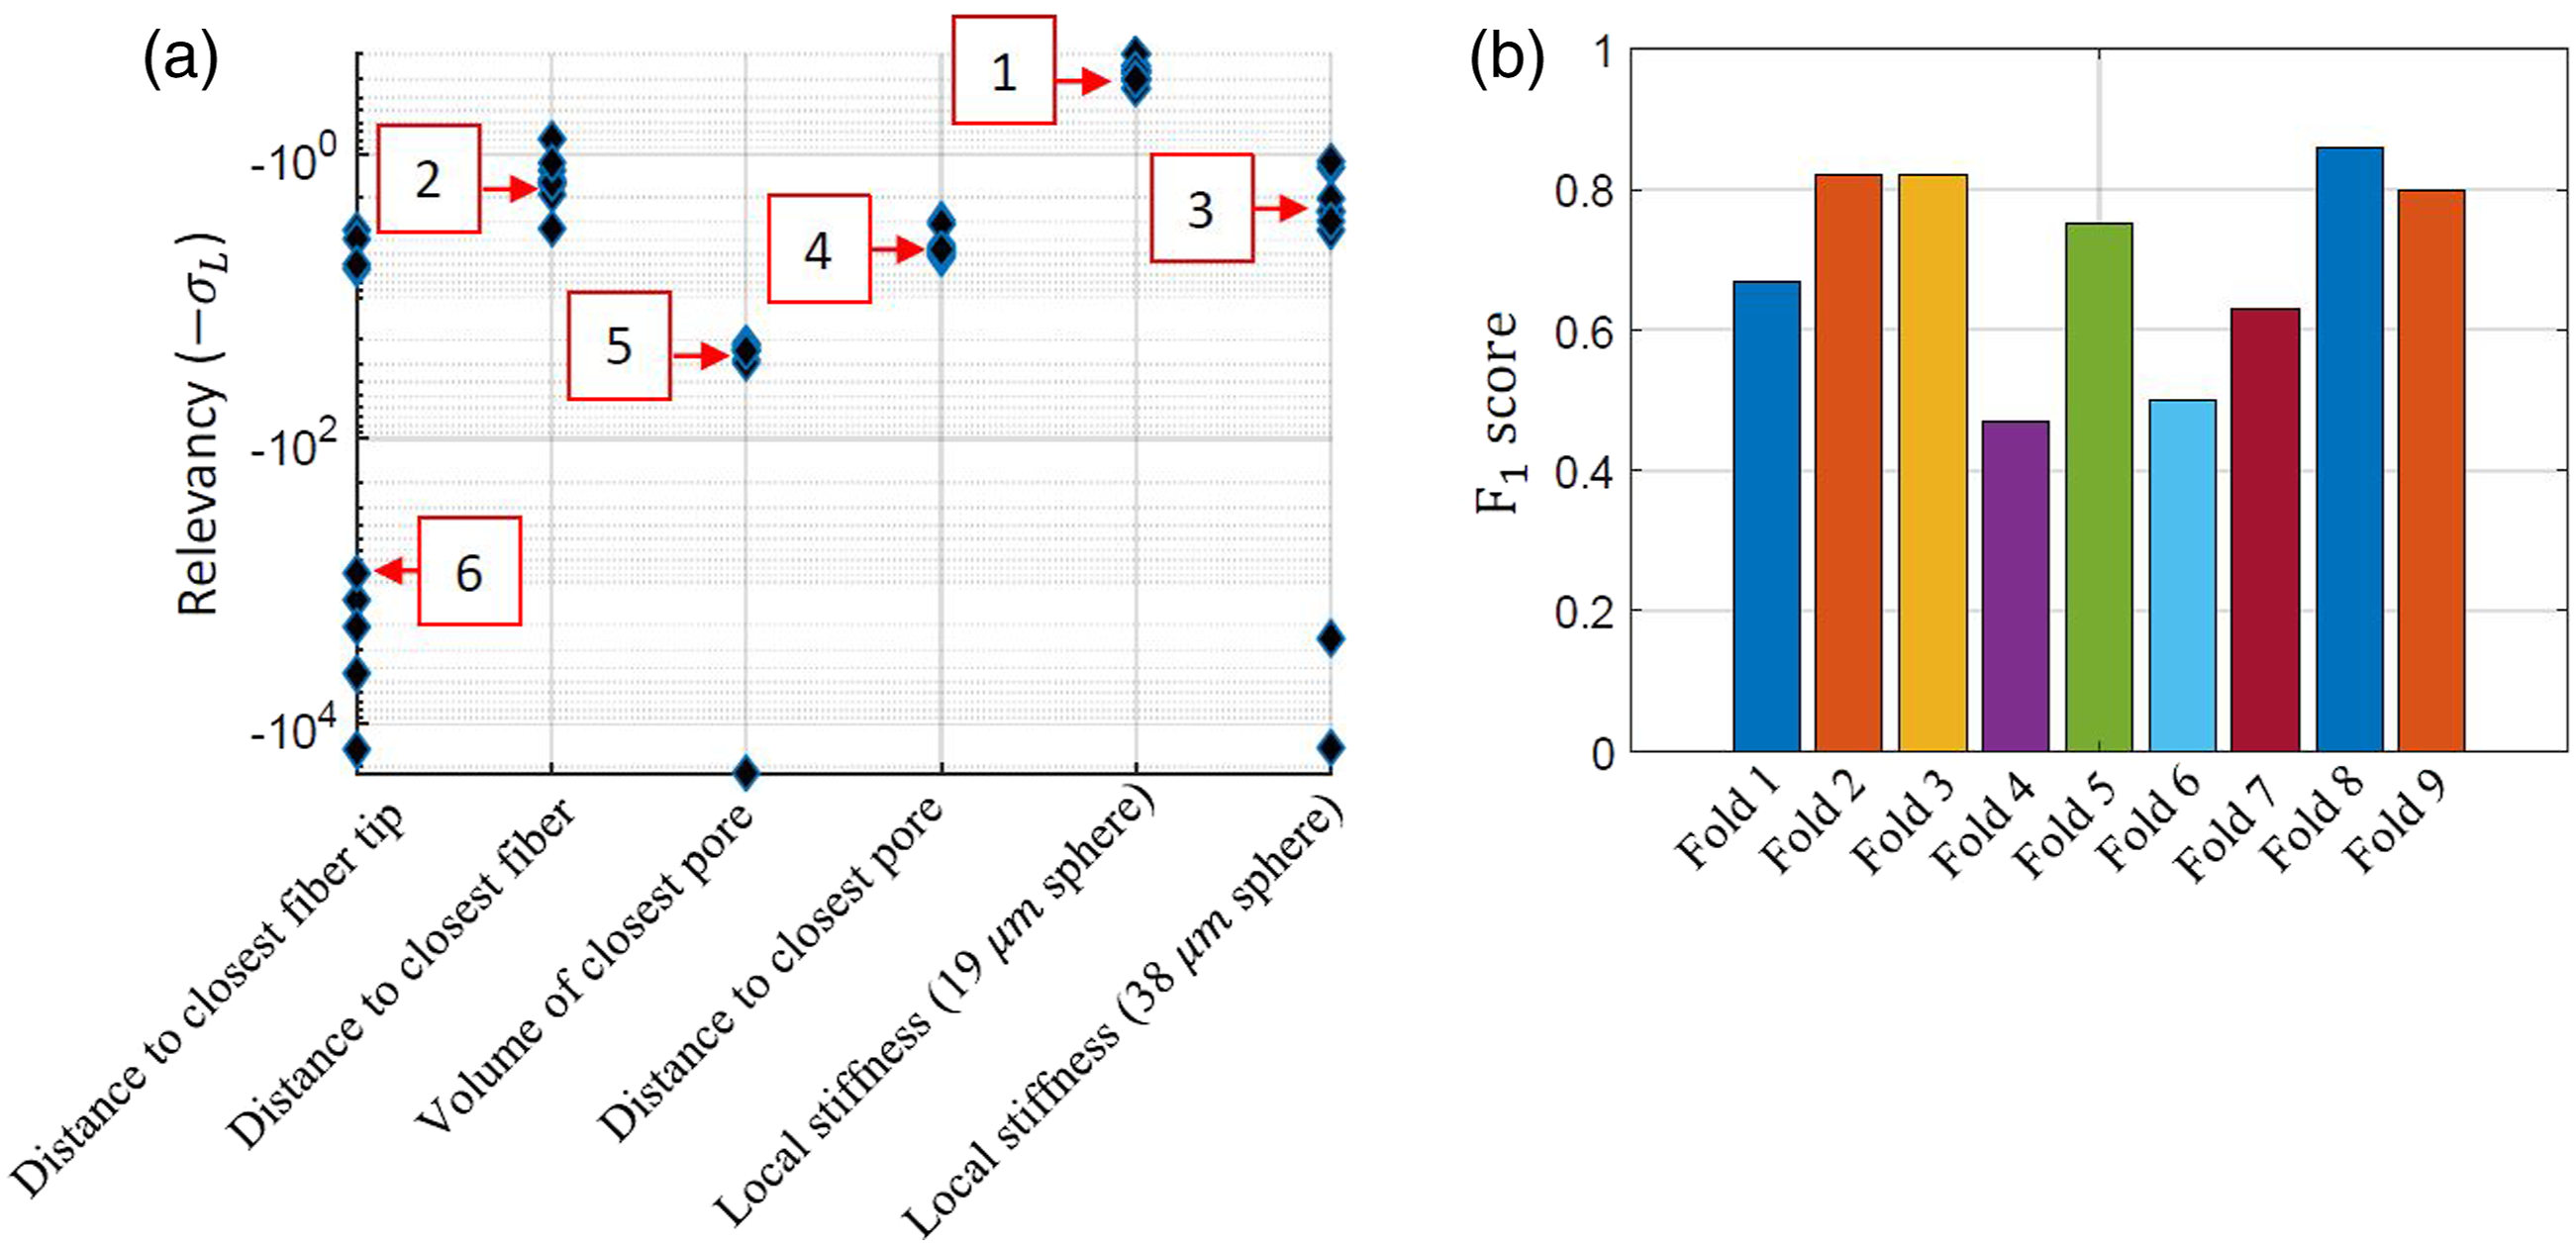
To rank the contributions of six microstructural metrics to the propensity for damage via micro-void nucleation, an automatic relevancy determination was employed based on the values of the hyperparameters of the trained model associated with the six microstructural metrics. A trained model has the values of its hyperparameters optimized to make the kernel function the best possible mapping function that characterizes the underlying relationship between the input variables and their associated output variables. An inverse relationship exists between the values of the hyperparameters of a trained Gaussian model and the influence of the hyperparameter in the predictive result of the trained model. Thus, the lower the value of a hyperparameter associated to an input variable, the more dependent the trained model is on that input variable to accurately predict. This interpretation of the inverse relationship forms the basis of the automatic relevancy determination, which has been employed in several studies to rank relevancy of metrics.19,44,48 For convenience in interpretation, the negative magnitude of each hyperparameter is plotted.
Results and discussion
A detailed characterization of the micro-void nucleation events and the associated microstructure attributes near these events were captured in two specimens of a discontinuous fiber composite, in order to perform a data-driven analysis of the microstructure rationale associated with this damage mechanism. As mentioned in Section “Data analysis for microstructural metrics,” six key microstructure metrics were examined within a Gaussian process classification and their hyperparameters were used to assess the relevancy of each metric with respect to micro-void nucleation events. In order of most relevant to least relevant, the metrics associated with micro-void nucleation were classified as follows: (1) local stiffness (evaluated within a 19 μm spherical region), (2) distance to the closest fiber, (3) local stiffness (evaluated within a 38 μm spherical region), (4) distance to the closest pore, (5) volume of the closest pore, and (6) distance to the closest fiber tip. The relevancy, according to the hyperparameter, of these metrics were quantified and shown in Figure 6(a). In the following sections, each of these metrics will be discussed in detail.
Microstructural characterization metrics, including volume fraction, fiber orientation, and fiber length, of both specimens in the full gauge section as well as in the ductile fracture zone.
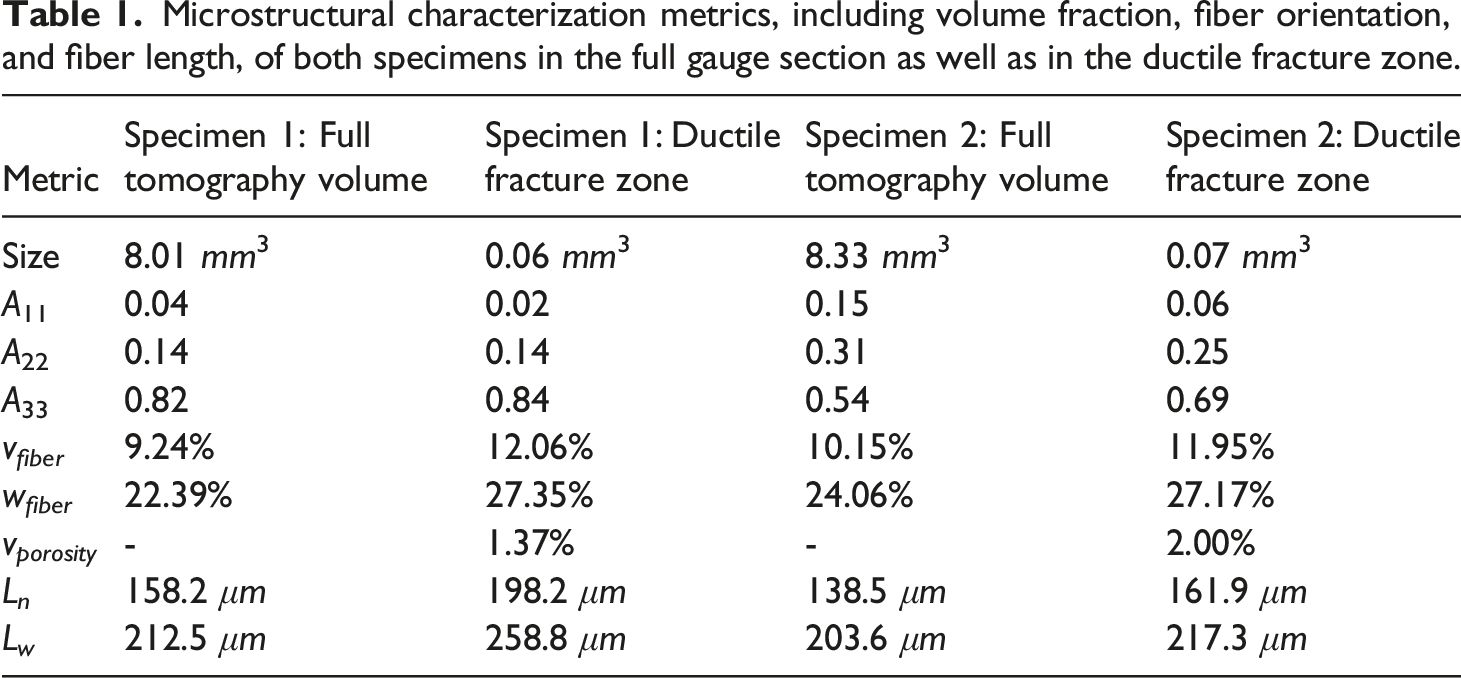
The standard deviation of the computed fiber lengths (L n ) in the Table 1 was 88.5 μm (specimen 1) and 88.9 μm (specimen 2). For further details, please refer to Hanhan et al., 35 where fiber length and orientation properties of the specimen are compared, verified and explored using destructive and non-destructive techniques. In Specimens 1 and 2, the A33 values were 2% and 28% higher, the v f values were 31% and 18% higher, and L n values were 25% and 17% higher, in their respective ductile fracture zone regions compared to the full tomography window. Hence, from each of these metrics, the expected stiffness of the ductile fracture zone is higher than the average stiffness in the full tomography volume.
Based on the relevancy analysis, the local stiffness was determined to be the most likely indicator of micro-void nucleation, with fibers that are misaligned from the loading axis displaying a higher correlation with micro-void nucleation. From the median value of relevancy for all 9-folds (Figure 6(a)), local stiffness within a 19 μm region ranked first and the local stiffness within a 38 μm region ranked third amongst the six microstructural metrics examined. As shown in Figure 7(a) and (b), the lower local stiffness in the 19 μm region was associated with micro-void nucleation. Recall, the local stiffness calculation was based on the fiber volume fraction, orientation, and length. In the 19 μm region, one fiber tip should be evaluated, as this spherical region was determined based on the characterized mean free path between fibers. Hence, within this region, the orientation with respect to the loading axis, A33, will provide the highest sensitivity to the reported local stiffness values; as such, it is reasonable to surmise that fibers that are misaligned with the loading axis displayed a higher association with micro-void nucleation. This observation is in tandem with previous studies where initial material defect zones (particularly zones of misaligned fibers) were said to have weak domains (local regions with a reduced stiffness) resulting in damage initiation in discontinuous reinforced composites.
21
The local stiffness assessments, with less stiff local regions corresponding with micro-void nucleation, is in contrast to the previous observation that the ductile fracture zone experienced a relatively higher expected stiffness than the full tomography region. This implies that the ductile fracture zone overall contains higher stiffness and therefore more load bearing capacity than the average values characterized within the material, however within the ductile fracture zone, fiber tips with a localized lower stiffness are more likely to result in micro-void nucleation. Naturally, this observation is associated with the multi-scale nature of failure as expected in discontinuous fiber reinforced composites.
49
Comparing the local stiffness in a 19 μm radius neighborhood at sites of micro-void nucleation and sites of pristine fibers for (a) Specimen 1 and (b) Specimen 2; comparing the distance of the nearest fiber tips to sites of micro-void nucleation and sites of pristine fiber tips for (c) Specimen 1 and (d) Specimen 2; comparing the distance of the nearest fiber to sites of micro-void nucleation and sites of pristine fibers for (e) Specimen 1 and (f) Specimen 2, where all plots are show as CDF distributions.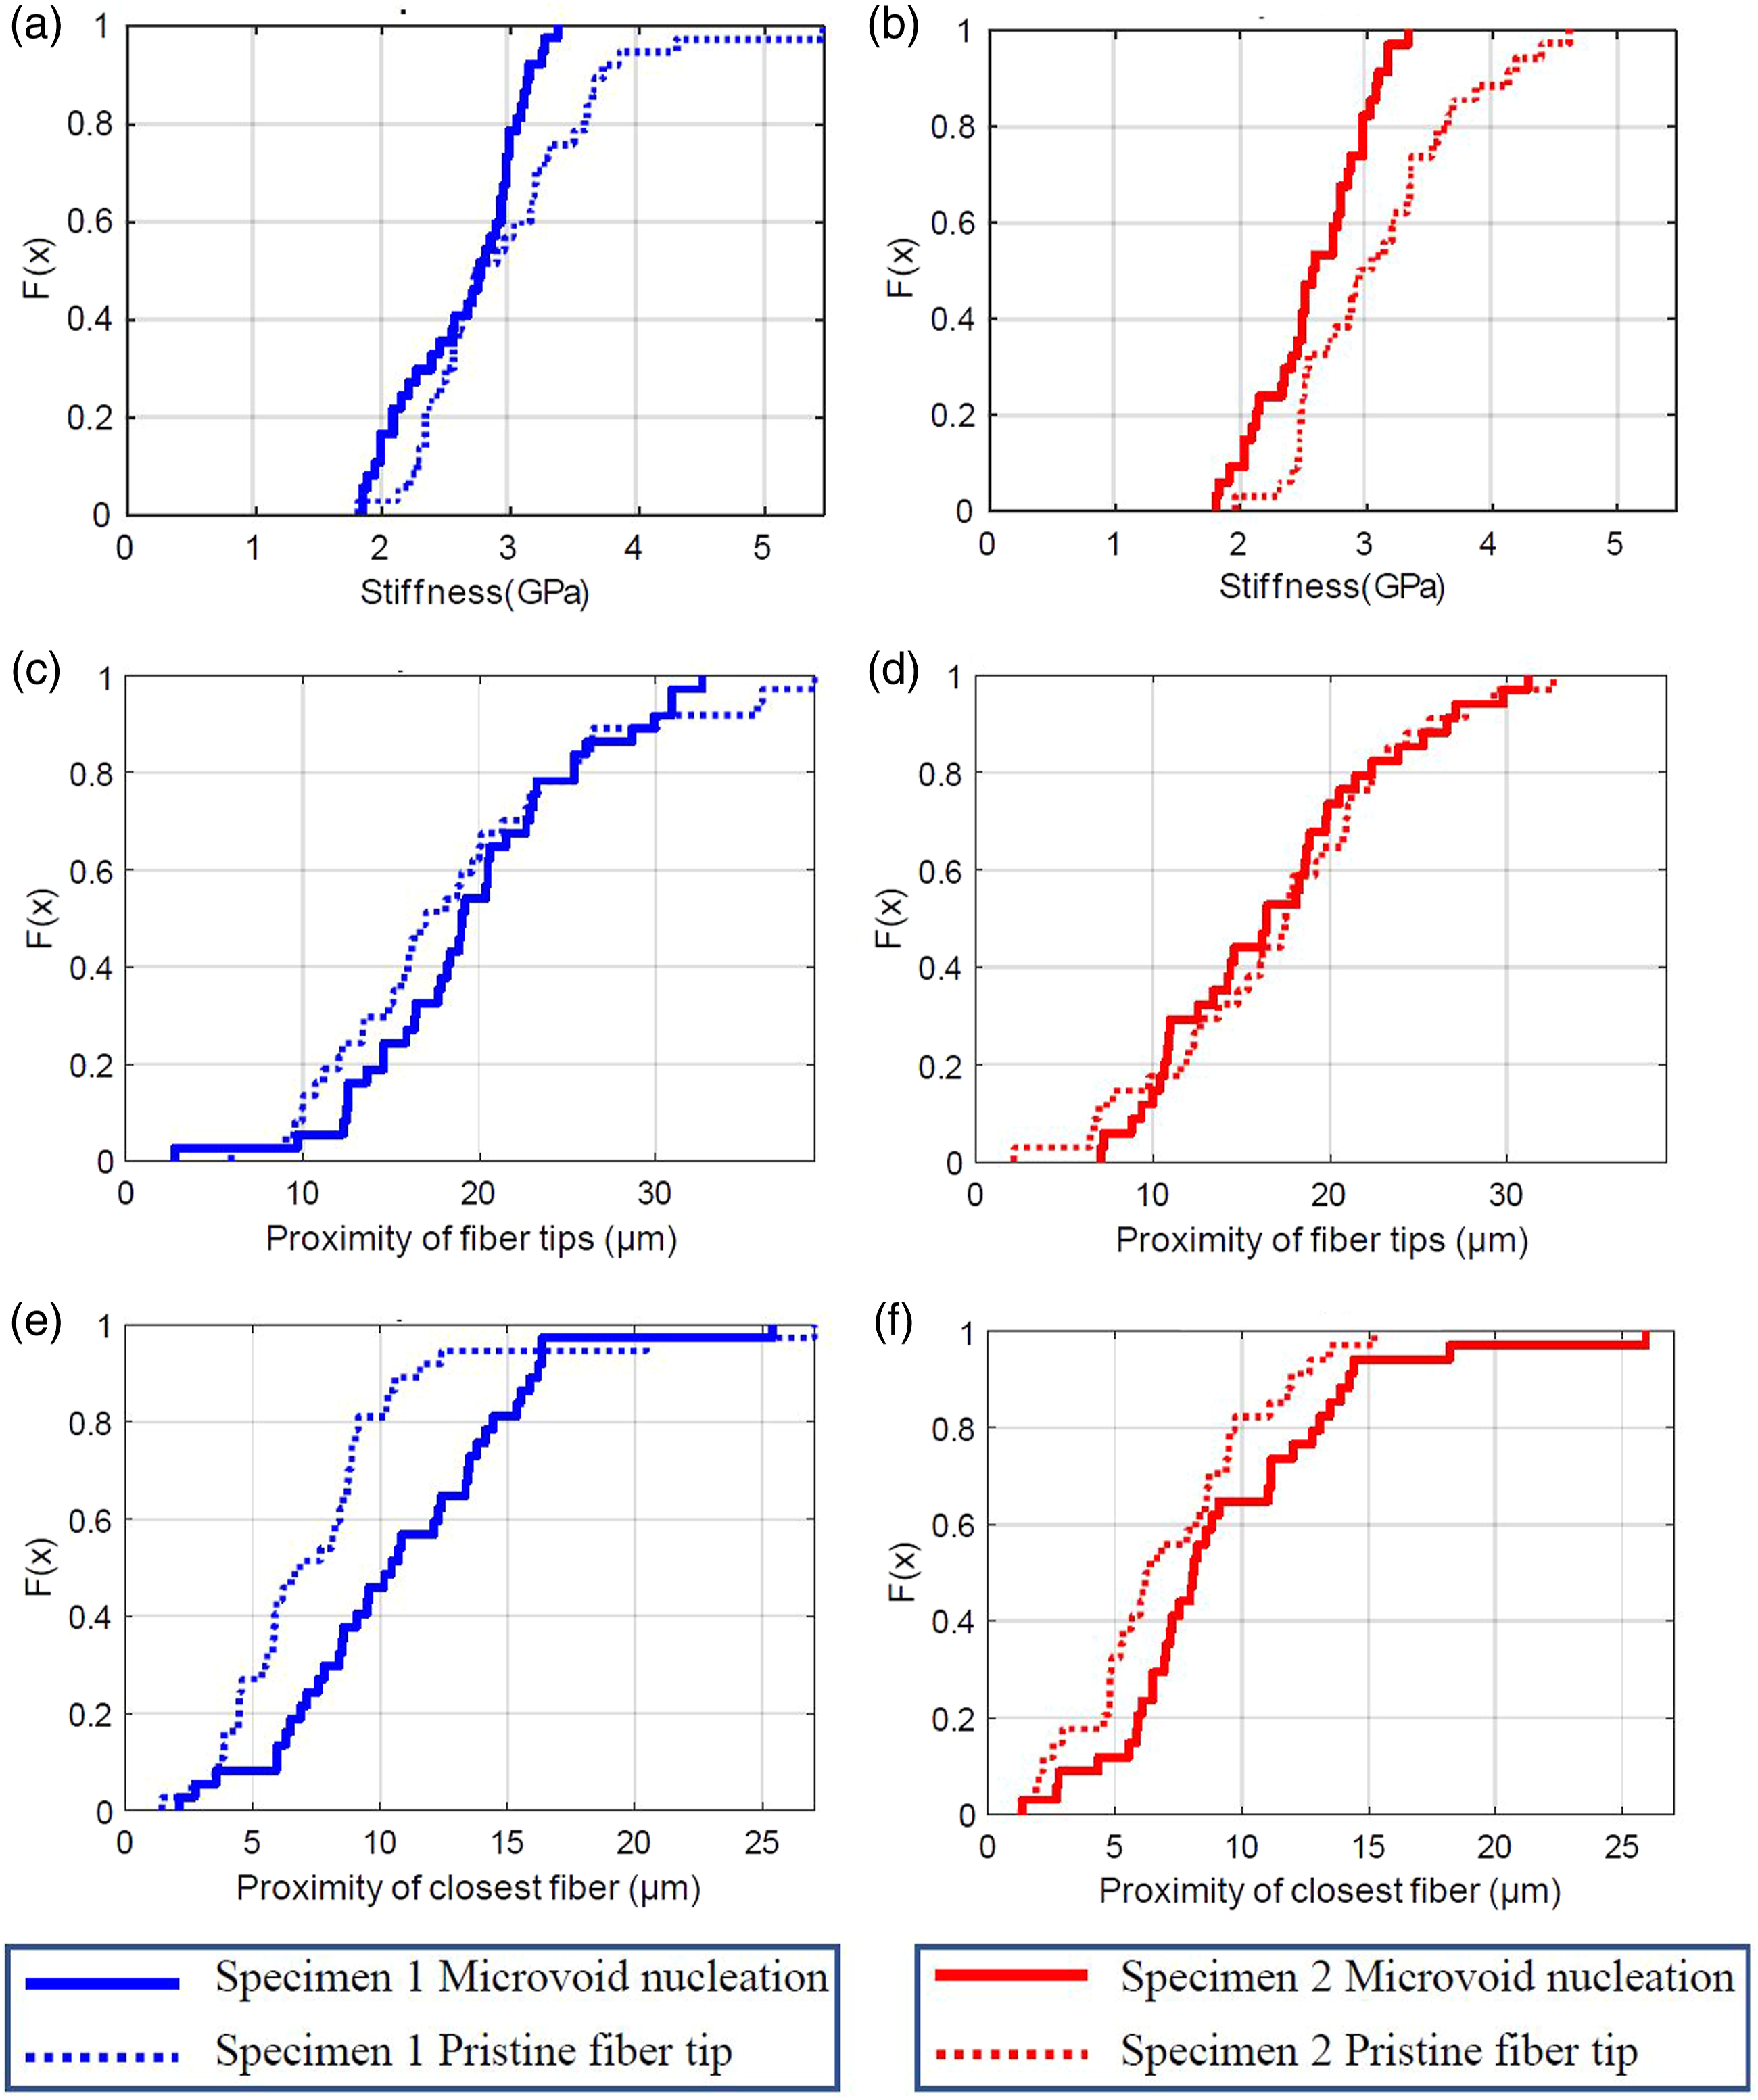
The proximity of the closest fiber tip ranked last in relevancy out of the six metrics examined. As shown in Figure 7(c) and (d), the proximity to the nearest fiber tip values for locations of micro-void nucleation and pristine fiber tips overlapped. This overlap in the distribution of micro-void nucleation and pristine fiber tips made this metric less informative to the GPC model to identify correlations, yielding a low relevancy. This has been further visualized in Figure 8, where two representative cases are shown, and it can be seen that despite having a fiber tip 19 μm away, one case resulted in micro-void nucleation, while the other case remained a pristine fiber tip. These observations for the discontinuous fiber composite within a thermoplastic matrix exhibited differences from previous studies for thermoset matrix composites. Greyscale comparison of corresponding slices for a case of micro-void nucleation at (a) ɛ = 0ɛ
f
and (b) ɛ = 0.3ɛ
f
; greyscale comparison of corresponding slices for a pristine fiber tip at (c) ɛ = 0ɛ
f
and (d) ɛ = 0.3ɛ
f
; (e) is a 3D volume visualization of the two representative cases of micro-void nucleation and a pristine fiber tip where the fibers of interest are colored in green, fibers with the closest tips colored in yellow, the closest fibers are colored brown, and the nucleated micro-void is colored red. These representative cases have been visualized here for Specimen 1, where each distance corresponds to measurements performed on the 3D reconstructed microstructures.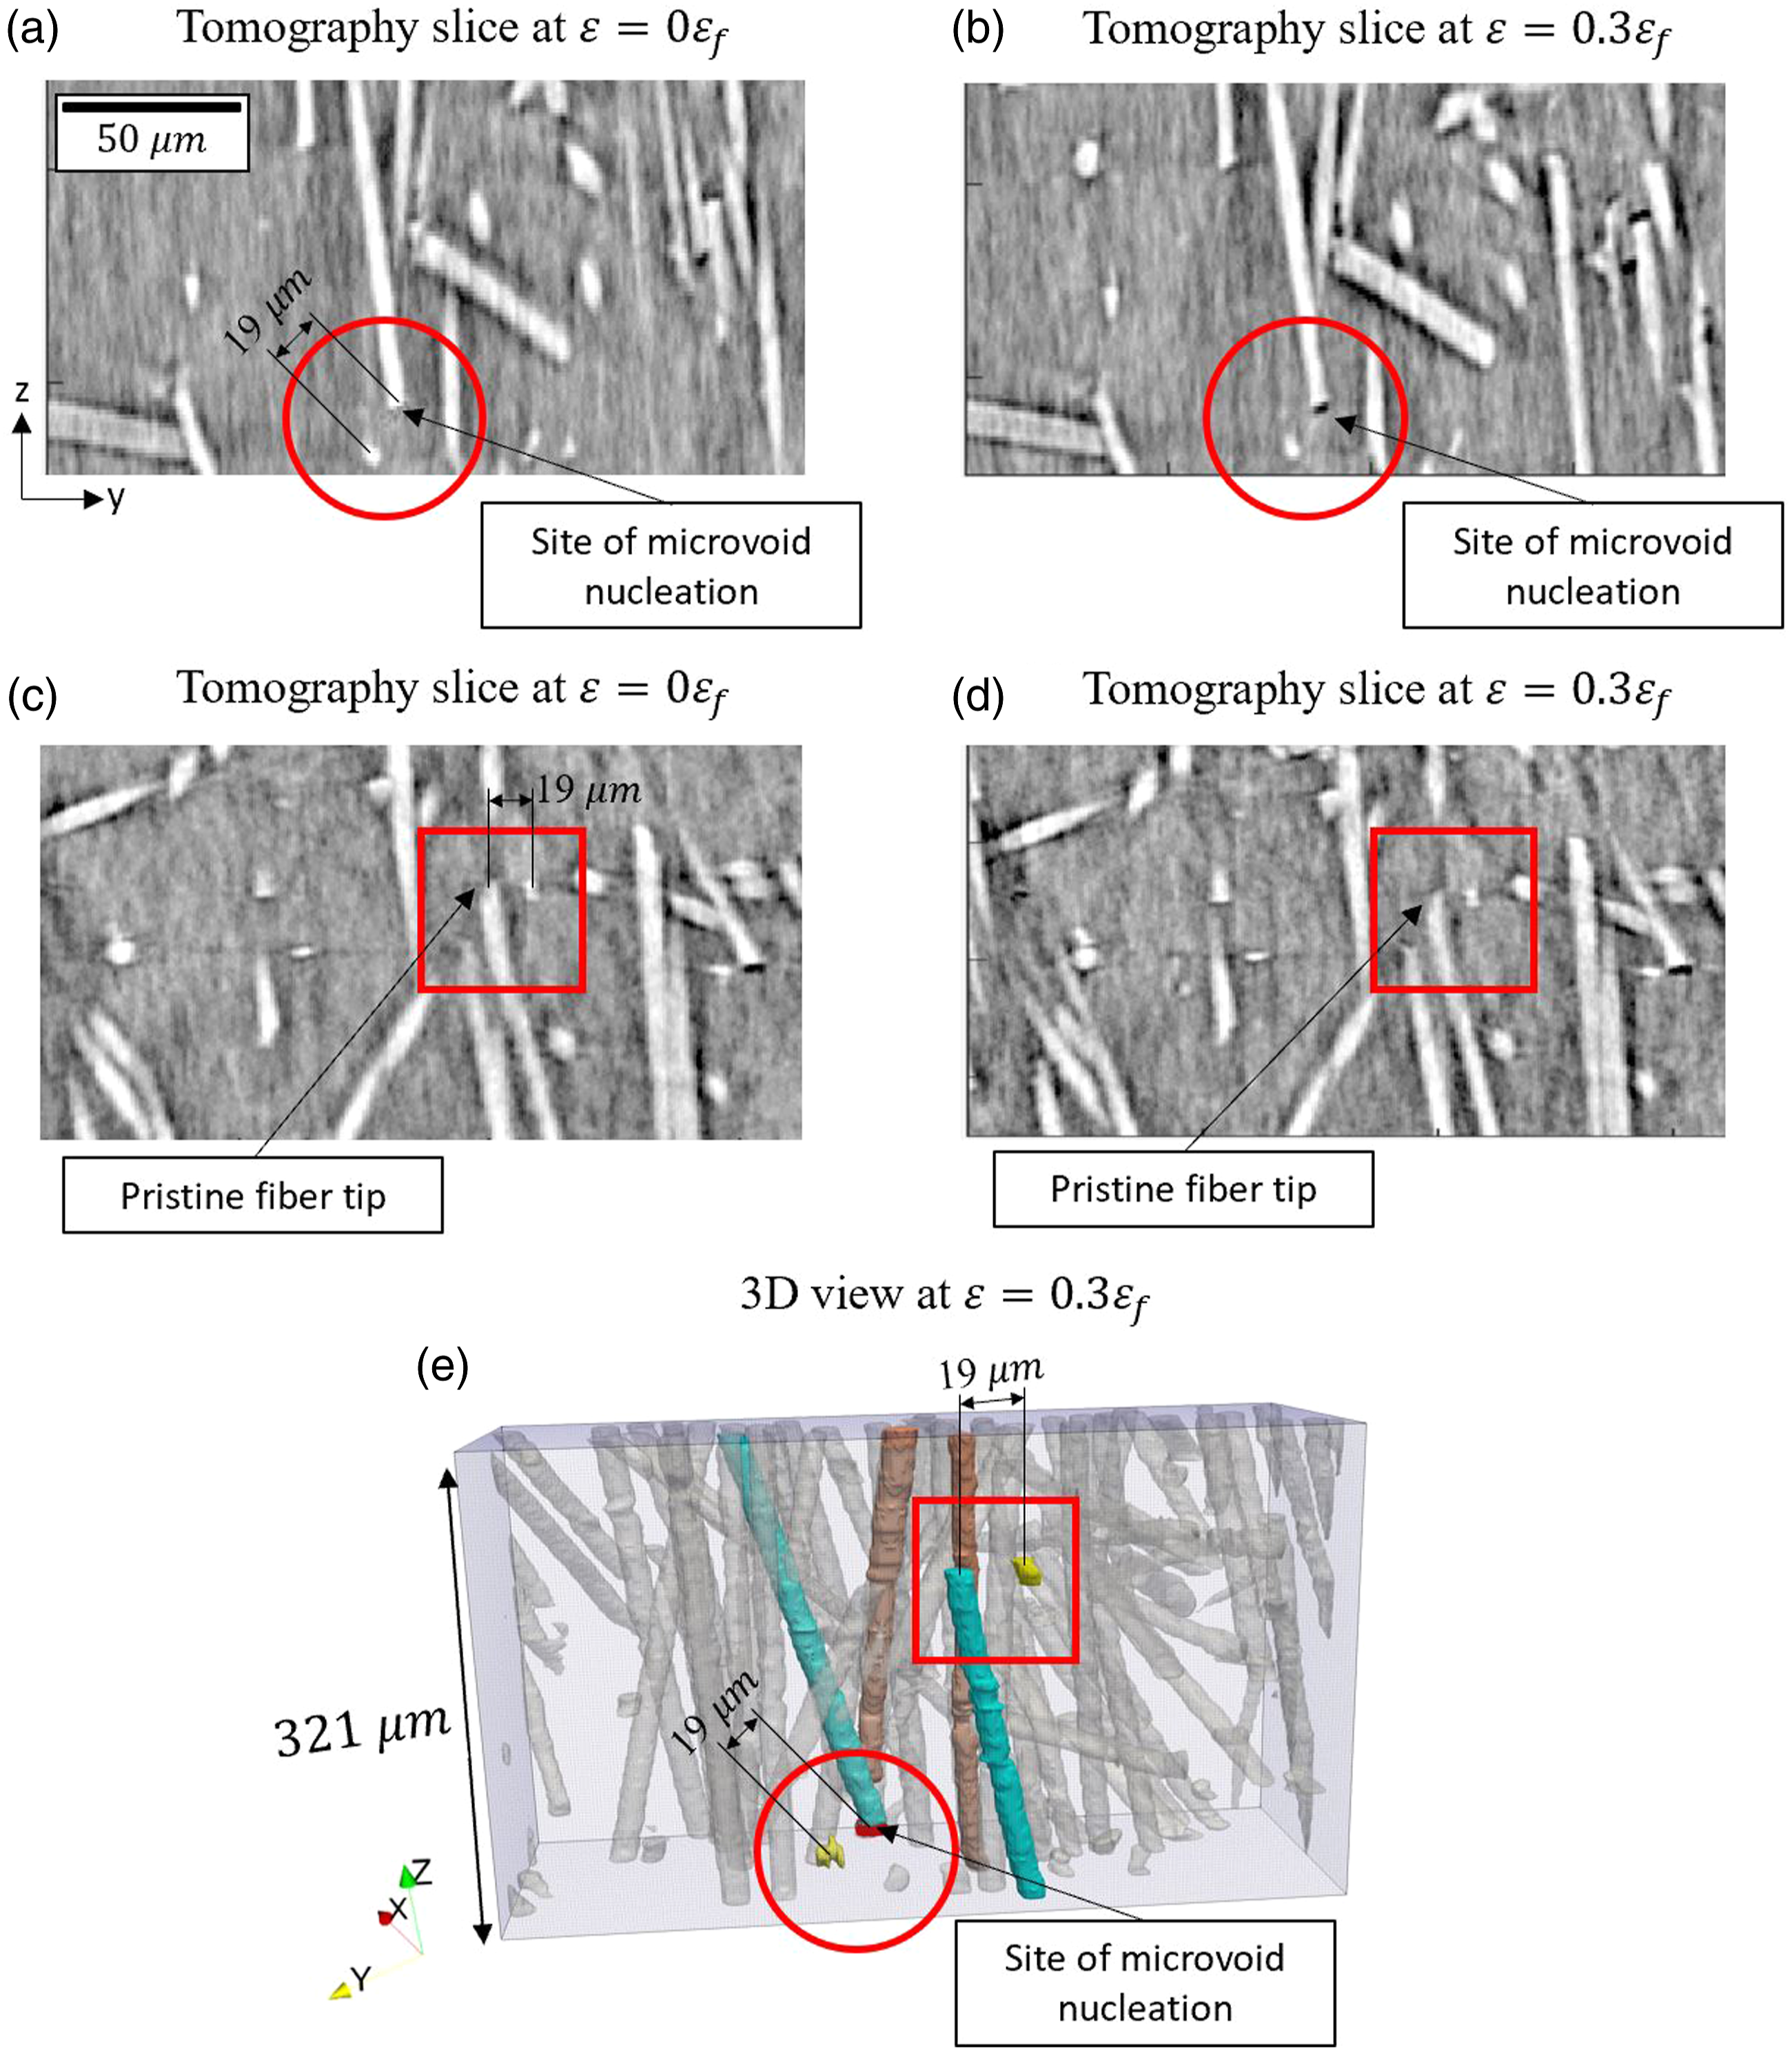
For thermosets, Hu et al. 1 demonstrated that the proximity of adjacent fiber tips was directly attributed to damage initiation. The observed disparity in the influence of fiber tips on damage initiation in this work (for the case of thermoplastics) and in the work of Hu et al. (for the case of thermosets) is attributed to the varying degree of cross-linking in the polymer matrix. A highly cross-linked thermoset polymer induces brittleness, 50 which cannot withstand the high strain gradients between fiber tips resulting in the propensity for damage initiation. On the other hand, the linear polymer chains in a thermoplastic are attributed with higher toughness values, which can accommodate high strains between fiber tips, making nearby fiber tips less relevant to damage initiation. The upper limit for neighborhood in which the fiber features did not contribute to the local stiffness calculations was 50 μm. The value of the upper limit of 50 μm was based on the mean free path of the micro-void nucleation sites (the average of the distances between boundary of each micro-void nucleation sites and boundary of the closest micro-void nucleation site).
The proximity of the closest fiber ranked second in relevancy (out of six metrics examined), which in part could be attributed to the observed stiffness relationship. As shown in Figure 7(e) and (f), regions resulting in micro-void nucleation displayed a larger distance to the closest adjacent fiber compared to a similar characterization for pristine fiber tips. Since a nearby fiber will increase the local volume fraction and thereby increase the local stiffness, the metric for proximity to the closest fiber was consistent with the local stiffness metric results, with lower local stiffness values correlating to micro-void nucleation.
The metrics attributed to porosity’s effect on micro-void nucleation were less pronounced and no definitive trend was observed. Single metrics analyzed for the role of porosity, included distance to the closest pore (ranking forth out of the six metrics examined) and volume of the closest pore (ranking fifth). These metrics have an interrelated role, as illustrated in Figure 9(a) and (b). Interestingly, large pores, (nominally Visualizations of a multivariable plot of distance to the closest pore and volume of the closest pore for (a) locations of micro-void nucleation and (b) locations of pristine fiber tips; (c) visualization of the relative spatial locations of 2 cases illustrating the effect of porosity (volume and proximity) to micro-void nucleation; (d) visualization of a very large pore near a fiber tip that did not nucleate a micro-void; and (e) visualization of a small pore near a fiber tip that nucleated a micro-void.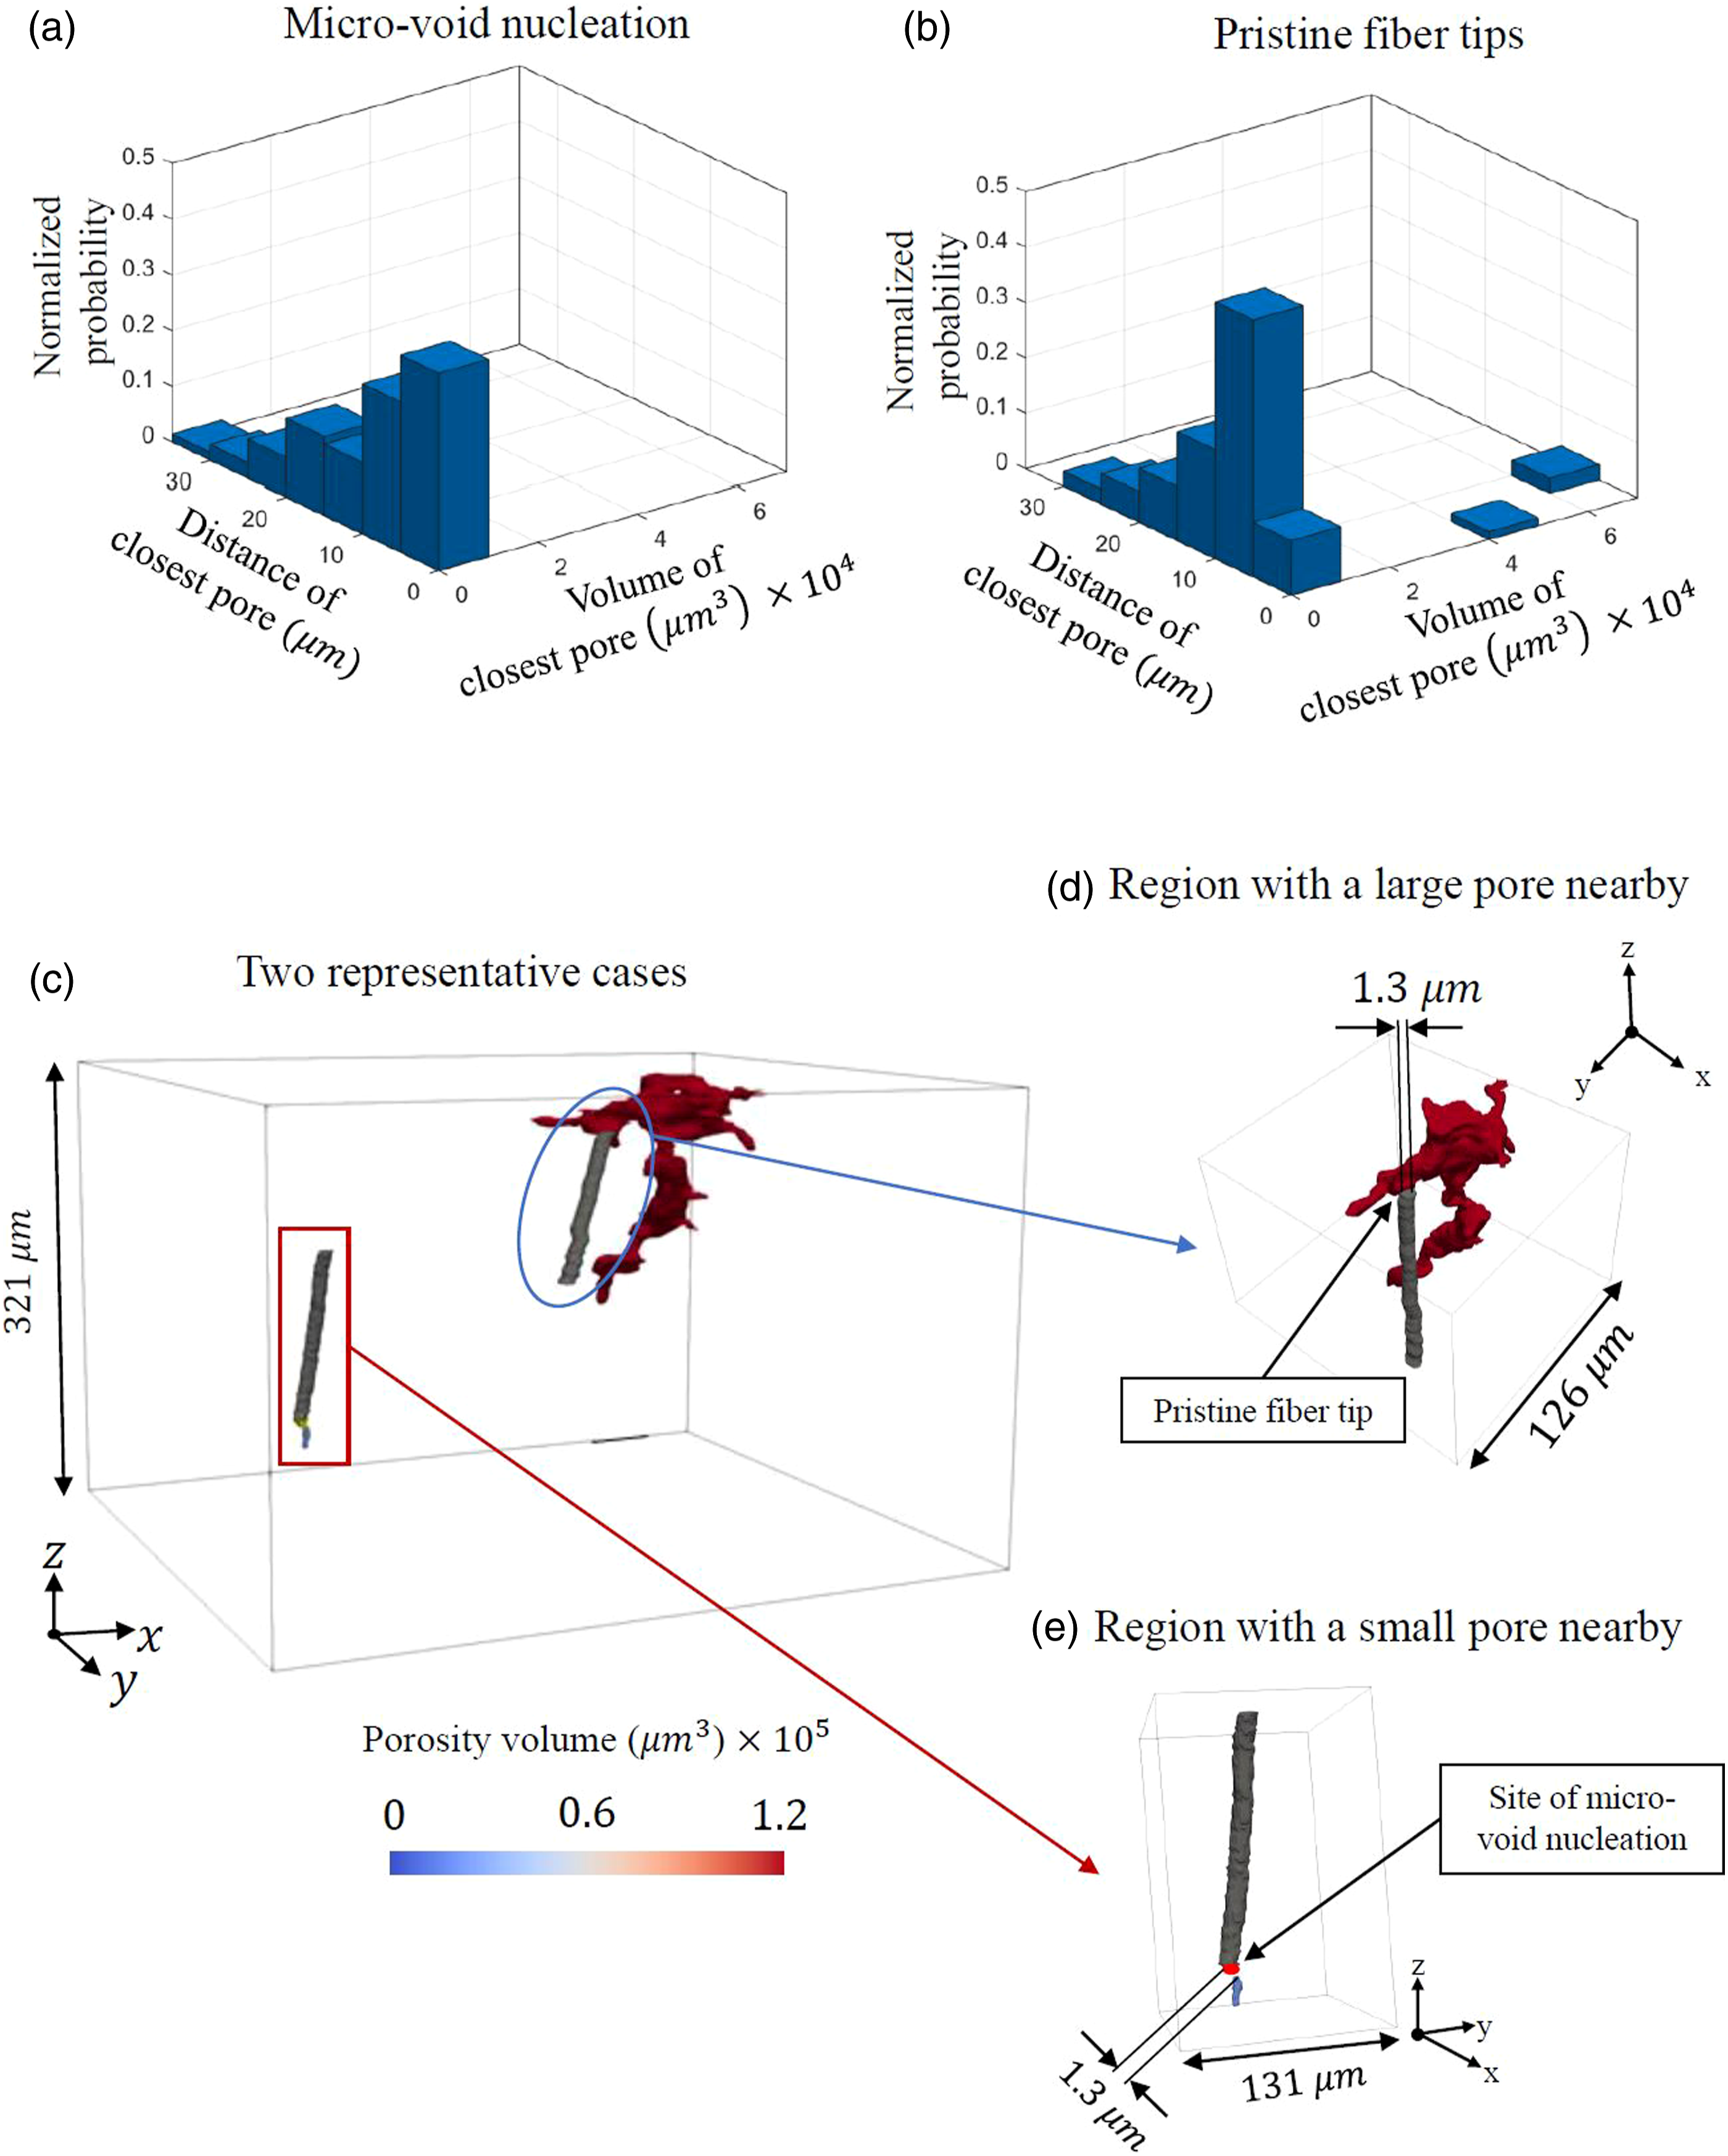
As mentioned, no definitive trend was observed in the single porosity metrics on micro-void nucleation, and it is reasonable to surmise that the size, proximity, and morphology of the closest pore potentially play an interrelated role. Additional data (including simulations to determine local stress concentration) is needed to identify the higher order porosity metrics on damage inception. Furthermore, since void evolution is a function of residual stress, it will be important to examine residual stress (gleaned from the process history) and its effects on void formation and its morphology. Although this paper focused on micro-void nucleation because it was the leading damage mechanism, future studies utilizing higher resolution tomography can be integrated with the GPy framework to measure the role of local microstructure on other damage mechanisms such as debonding. Previous studies have shown that debonding occurs at the fiber-matrix interface, specifically along fibers oriented transversely to the macroscopic loading. In relation to void growth, this mechanism could occur as an inception 7 or at an advanced stage 51 and its nature is linked to cohesive failure (in the form of the interaction of multiple cavitation at the fiber-matrix interface) or by adhesion failure (driven by the quality of chemical fiber-matrix treatments).
Conclusion
This research examined the rationale behind damage initiation by ranking microstructural metrics and correlating these metrics to micro-void nucleation in discontinuous fiber thermoplastic composites. The correlation was performed based on microstructural information, including characterization of the closest fiber, the closest pore, and the local stiffness, into a Gaussian process classification model, where the model was trained and tested in a 9-fold cross-validation framework. The importance of each microstructural metric was ranked based on the median values of the relevancy associated to each instance of the 9-fold. Significant contributions of this study are summarized as follows: 1. The local stiffness was identified as the most relevant whereas proximity to the fiber tips was the least relevant. 2. Regions of lower stiffness (using local fiber volume fraction, orientation, and length) were more likely to correlate to micro-void nucleation. 3. In contrast to thermoset composites, the proximity of fiber tips in thermoplastics is observed to be less sensitive to the nucleation of micro-voids, due to the more ductile nature of thermoplastics. 4. Single metrics, describing the characterization of porosity, did not exhibit a trend pertaining to the proclivity of micro-void nucleation. From this analysis, a confounding role between the size, proximity, and morphology of the pores is expected to influence the local stress concentration, which would result in micro-void nucleation.
Footnotes
Acknowledgements
Support for this work was provided by the National Science Foundation CMMI MoM, Award No. 1662 554 (Program Manager Dr Siddiq Qidwai). The authors would like to thank Dr Francesco de Carlo and Pavel Shevchenko from Argonne National Laboratory for providing the experimental set-up and expertise necessary during the X-ray tomography data acquisition. The material used in this study was provided by Dr Alan Wedgewood. This research used resources of the Advanced Photon Source, a U.S. Department of Energy (DOE) Office of Science User Facility operated for the DOE Office of Science by Argonne National Laboratory under Contract No. DE-AC02-06CH11357.
Declaration of conflicting interests
The author(s) declared no potential conflicts of interest with respect to the research, authorship, and/or publication of this article.
Funding
The author(s) disclosed receipt of the following financial support for the research, authorship, and/or publication of this article: Support for this work was provided by the National Science Foundation CMMI MoM, Award No. 1662 554 (Program Manager Dr Siddiq Qidwai).