
Abstract
In this study, the synergistic effect created by adding Graphene (GE) nanoplatelets and carbon black (CB) fillers to the rubber matrix was used to determine the high stretchable sensor properties. GE and CB-filled rubber nanocomposite (HcN) strain sensors have been shown to detect and trace crack initiation and crack propagation of different sizes under cyclic loading. Tests were performed with four different crack sizes (0, 2.5, 5, and 10 mm) at five different strain levels (0%, 5%, 10%, 15%, and 20%) to determine the strain sensing performance of the specimens. The electrical response of HcNs under loading was measured with the four-point probe technique and recorded with a high-performance data acquisition system. The progression of external cracks created by scalpel on HcNs was examined by measuring electrical resistance changes caused by cyclic strain loading between 0% and 20%. The electrical response of 4 phr and 8 phr filled HcNs behaved qualitatively similar to each other, while 1 phr filled HcNs showed a significantly different response in terms of quality and quantity. In 4 phr GE-filled specimens, the resistance increase was changed steadily depending on the crack length, and unstable conditions occurred at 5 and 10 mm crack lengths at 1 and 8 phr GE filler ratios. The flexible and stretchable elastomer-based conductive strain sensing sensors, developed with the synergistic interaction of well-dispersed carbon-based fillers in the matrix, can detect and record damaged conditions caused by cyclic loading in many application areas.
Keywords
Introduction
Elastomer materials like rubber have attracted attention in the automotive, defense industry, and sensitive signal monitoring areas due to their application potential by highly flexible and stretchable nature.1,2 Over the past years, Graphene (GE)’s use for improvement in many polymer materials has been a new experimental research subject. With the development of electrically conductive elastomers with nanofillers,3–5 many studies have been performed to obtain flexible and large-strain sensors showing good electrical conductivity during normal working conditions.6,7 For instance, the GE-filled nanocomposites' mechanical, electrical, and other physical properties have been studied as well. 8 The researchers examined the effects of the GE reinforcement on different matrix materials to take advantage of their properties with a wide range of potential applications. Flexible elastomer large-strain sensors are a new mechanical sensor class that can measure deformations and damages, forces, and pressures. 9 They offer excellent flexibility and conductivity and can be integrated into structures that are themselves subjected to strong deformations, especially in automotive, defense industry applications, wearable electronics, and smart materials. 10 The rubber nanocomposites' mechanical properties are improved by adding a small amount of GE nanoplatelets filler into the rubber matrix. Some functional properties, such as electrical conductivity, wear resistance, crack initiation, and propagation sensing under cyclic dynamic loading, can be imparted. Some applications of these advanced features are based on strain properties. Therefore, GE-filled nanocomposites may be used to produce strain sensors that convert physical deformation into electrical signals.3,6,7,10 To better understand this signal transformation, excellent sensitivities, electrical and mechanical stability are required for cyclic strain sensors' performance. However, external deformations or damages may inevitably reduce the strain sensors' conductivity and operational stability or even create cracks. 11 Some research studies have been conducted on the advantage of filler incorporation in producing a high-strength composite, while in other studies, there are findings of the use of various elastomers reinforced with high conductive fillers used as a sensory network. 12
Mondal et al. 13 studied the change in mechanical and electrical properties of GE nanoplatelets and Carbon black (CB) hybrid fillers in elastomer matrix (acrylonitrile butadiene copolymer). They found a remarkable improvement in the electrical and mechanical properties using the formed multi-dimensional conductive networks between GE and CB fillers in the elastomer matrix. The authors determined that the effects of GE and CB’s synergistic behavior in the elastomer matrix are evident from all morphological analyses.
Li et al. 14 Prepared graphene nanoplatelets with different particle sizes and rubber nanocomposites with four different filling ratios and compared them with the mechanical properties of carbon black-filled nanocomposites. It showed that the mechanical properties of graphene-filled nanocomposites increased three times more than carbon black-filled ones. Rad et al. 15 showed that the combination of graphene nanoplatelets and metallic microscale fillers led to significant improvements in thermal and electrical conductivity, with the improvement in mechanical properties due to the strong interface interaction between these fillers and the polymeric matrix.
Das et al. 16 and Natarajan et al. 6 performed similar studies. The electrical and mechanical properties of rubber composites based on Multiwalled Carbon Nanotube (MWCNT), Expanded Graphite (allotropes of the Carbon), GR nanoplatelets, and a combination of Expanded Graphite with MWCNT (Multiwalled Carbon Nanotube) were evaluated and compared. They discovered that the rubber composite’s electrical resistance was gradually reduced due to the increase in the amount of filler in the composite. According to the type of fillers, a hybrid filler network showed a synergistic effect on improving electrical properties and various mechanical properties. Dong et al.17,18 studied graphene/natural rubber composites with a conductive segregated network by latex mixing. They demonstrated that 10 phr of graphene-containing natural rubber composites had excellent electrical conductivity and good elasticity. After four tensile cycles, they found that the increase in conductivity resulted from the damaged networks that occur during the tensile process. Various loading conditions on GE-filled elastomer nanocomposites have also been investigated widely in recent years. 19 Much work has demonstrated the outstanding potential of using GE as a multifunctional nanofiller for elastomer-based nanocomposites. According to the literature, GE was found to be a multifunctional nanofiller for elastomer-based nanocomposites. Similar studies about the electrical, tensile, compression, impact properties of GE nanocomposites are available in the literatura.4,20 Conductive filler added elastomeric rubbers, including carbon nanotubes (CNTs) and expanded graphite-based nanoparticles, are used as the sensing materials. 21 Kasim et al. 22 produced conductive elastomers using carbon-based nanofillers such as multiwalled carbon nanotubes (MWCNT)/graphene (GR). The cycling compression tests applied to both filling materials obtained the best electrical resistance change for pressure sensor applications at approximately 20% strain. In elastomer composites, two-dimensional (2D) graphene has become an attractive carbon conductive filler for studies due to its high aspect ratio, extensive specific surface area, unique thermal, mechanical, and electrical properties low resistance.6,14,23 Some elastomer-based nanocomposites containing two different carbon fillers (e.g., carbon fiber and CB, CNTs, and graphite) have also been examined, resulting in synergistic effects on network formation and improving the conductivity properties of the nanocomposite.9,24 In between these requirements, priority should be given to some critical applications, such as air springs, tires, and electronic applications, directly related to fracture, fatigue resistance, and security. 25 The main reason for the rubber product defect is the initiation of cracks from the local stress concentrations and then the following crack propagation process. Therefore, resistance to the beginning of damage and propagation shows a vital role in rubber composites' failure.26,27 The concepts of fracture mechanics are widely used in studying the fracture and fatigue behaviors of elastomers. Li et al. 14 examined the fatigue equation of the natural rubber material by testing the material properties, and the strain distribution of the rubber component was determined by the FEA (Finite Element Analysis) method. They used the Finite Element Analysis to decide the maximum total principal strain in the critical region. Kroon 28 recommends a computational framework for studying high-speed crack growth under planar stress and steady-state conditions in biaxially stretched rubber-like solids. Fukahori et al. 29 claimed that stick-slip motion with high-frequency micro-vibration might enlarge crack tip and initiate cavitation in viscoelastic rubber, causing speeding up crack propagation over the transition zone.
In this study, NR (Natural Rubber) nanocomposites reinforced with well-dispersed GE nanoplatelets and CBs were produced by the two-stage mechanical mixing in the current study. The effects of GE nanoplatelets and CBs on mechanical properties, crack initiation and dissemination, and strain sensing and the electrical resistance of NR nanocomposites were systematically investigated. GE nanoplatelet and CB hybrid fillers have been shown to get a more attractive reinforcing effect than conventional fillers. Besides GE/CB fillers ratios, the loading conditions and initial crack length were also taken into account to investigate cyclic strain performance. An optimum loading of GE nanoplatelets (4 phr) was realized in obtaining the most effective cyclic strain sensing concerning initial crack length for all loaded strain levels. This study also provides a new view into the preparation of rubber nanocomposites containing GE/CB fillers to detect crack initiation and propagation depending on a change in electrical resistance.
Materials and method
Materials
Rubber Groups (SVR10, SBR-1502, CBR 1203 provided by Pega Automotive Co., Turkey) were filled with different contents of FEF N550 type CB (REGAL® SRF N550, Cabot Corporation, USA) and GE (NG01GNP0105, Nanografi Co. Ltd., Turkey) to form hybrid filler networks. For rubber elastomers, CB is the most commonly used nanofiller in the industry. It improves the mechanical strength and vibration damping, thermal properties, and electrical conductivity of the rubber elastomer matrices. CB’s have an amorphous structure and primary nanoparticulate filler materials, with balanced physiochemical properties in all significant aspects. The CB particles have spherical shapes with an overage original particle size of 38–46 nm and a specific surface area of 30–32 m2/g. The structure degree of CB’s, characterized by the oil absorption number, is about 67.5 mL/100g. GE nanoplatelets present excellent mechanical and thermal properties, including low density, high aspect ratio, nano dimensions, perfect chemical inertness, and adjustable electrical properties. All these outstanding properties of the GE materials make them one of the most promising nanofiller for nanocomposites. GE’s have 99.9% purity, 5 nm thickness of each platelet, Average diameter of 12–18 μm Specific Surface Area 175 m2/g, and electrical conductivity 1100–1600 s/m and gray color. All the additives incorporated in the rubber processing (e.g., zinc oxide, stearic acid, CBS accelerator, and sulfur) were of analytical grades. They were also commercially available as an individual industrial product.
Production of HcN nanocomposites
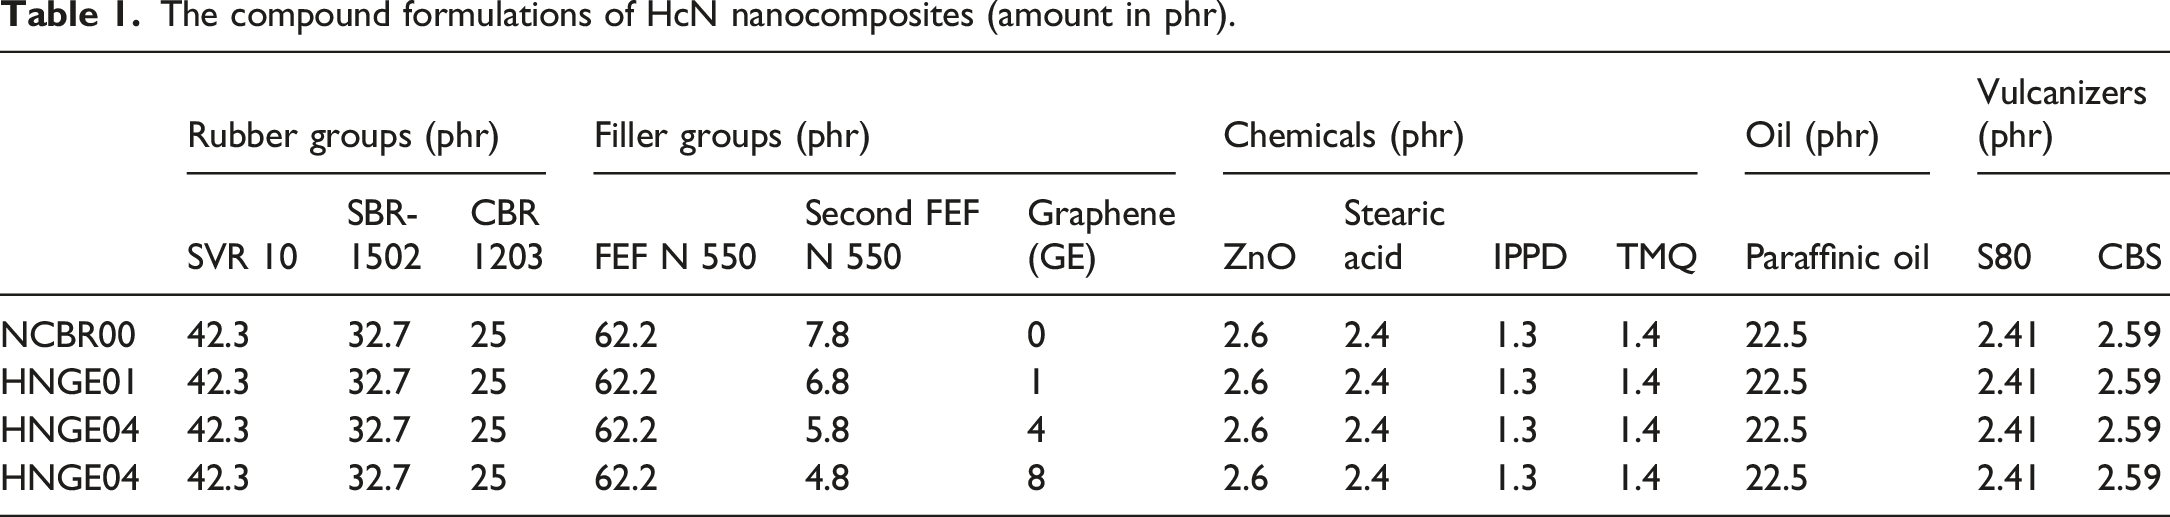
The compound formulations of HcN nanocomposites (amount in phr).
After the mixing process, the compound was kept in a climatic chamber at 23 ± 2°C and 50% ± 5% relative humidity for 24 h (ASTM D412). The vulcanization curves of the compounds were measured to determine the optimum curing time (t90) via a moving die rheometer (Montech MDR 3000, Germany) at 160°C for 10 min. HcN nanocomposites were cured in a laboratory-type hydraulic curing press (VP10-300 kN, Turkey) as 2 mm thick samples at 165°C and 150 Bar compression pressure. After the vulcanization, HcN samples were removed from the mold and were kept at 23 ± 2°C and 50% ± 5% relative humidity for 24 h (ASTM D412). A schematic diagram of the processing methods is shown in Figure 1. A schematic diagram of the processing methods: a) Automated mixing line and b) Two-roll mixing and vulcanization process c) Sample sheet manufacturing with hot press molding.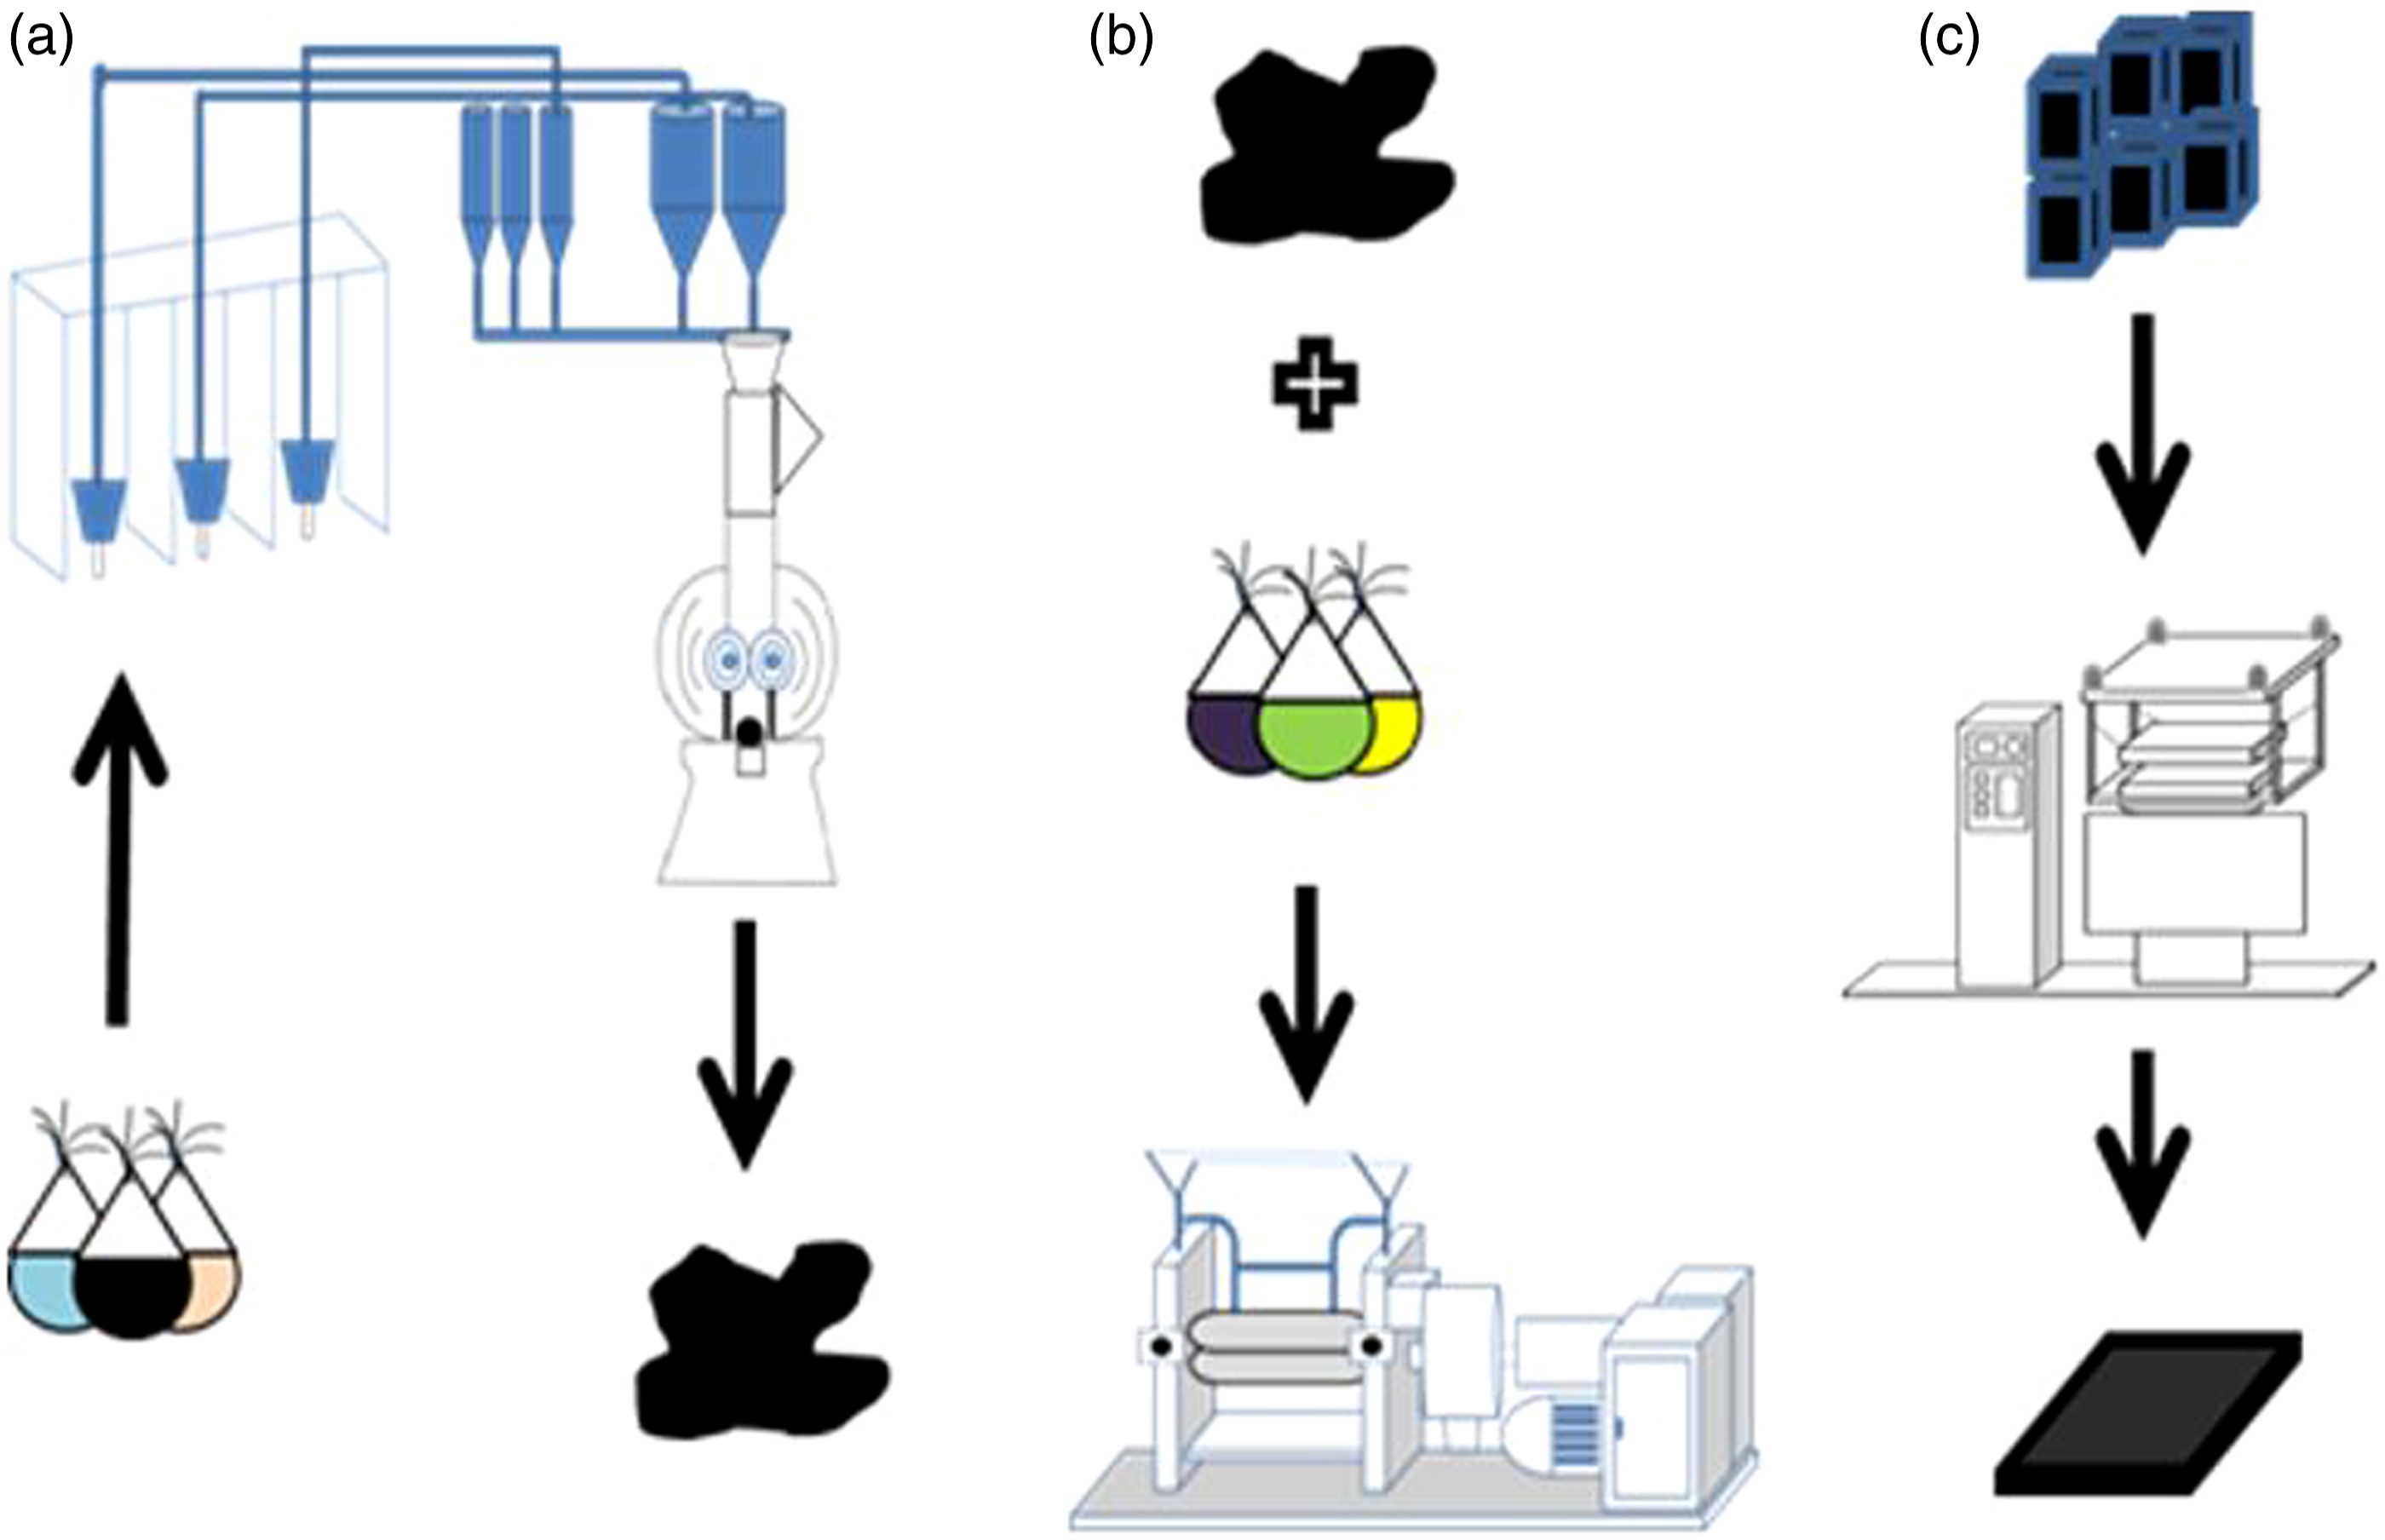
Experimental setup
The samples were cut from vulcanized rubber sheets in a single step without any notch effect. While choosing the sample sizes, easy connection to the test machine (Zwick Roell Z010, Germany) and the ease of mounting the probes to be used for electrical measurements were considered. The distinctive dimensions of the test specimen are presented in Figure 2(a). The test specimens were cut in a single action with a special cutting mold prepared in a rectangular section of 135 × 20 × 2 (length × width × thickness). The cut surfaces of the samples are carefully checked visually to ensure that there is no notch effect. The specified crack initial dimensions were prepared using a surgical scalpel (thickness 0.45 mm) to be 2.5, 5, and 10 mm along the crack propagation axis. (a) Schematic diagram of the geometry of the test samples (b) Placement of the electrical resistance measurement probes.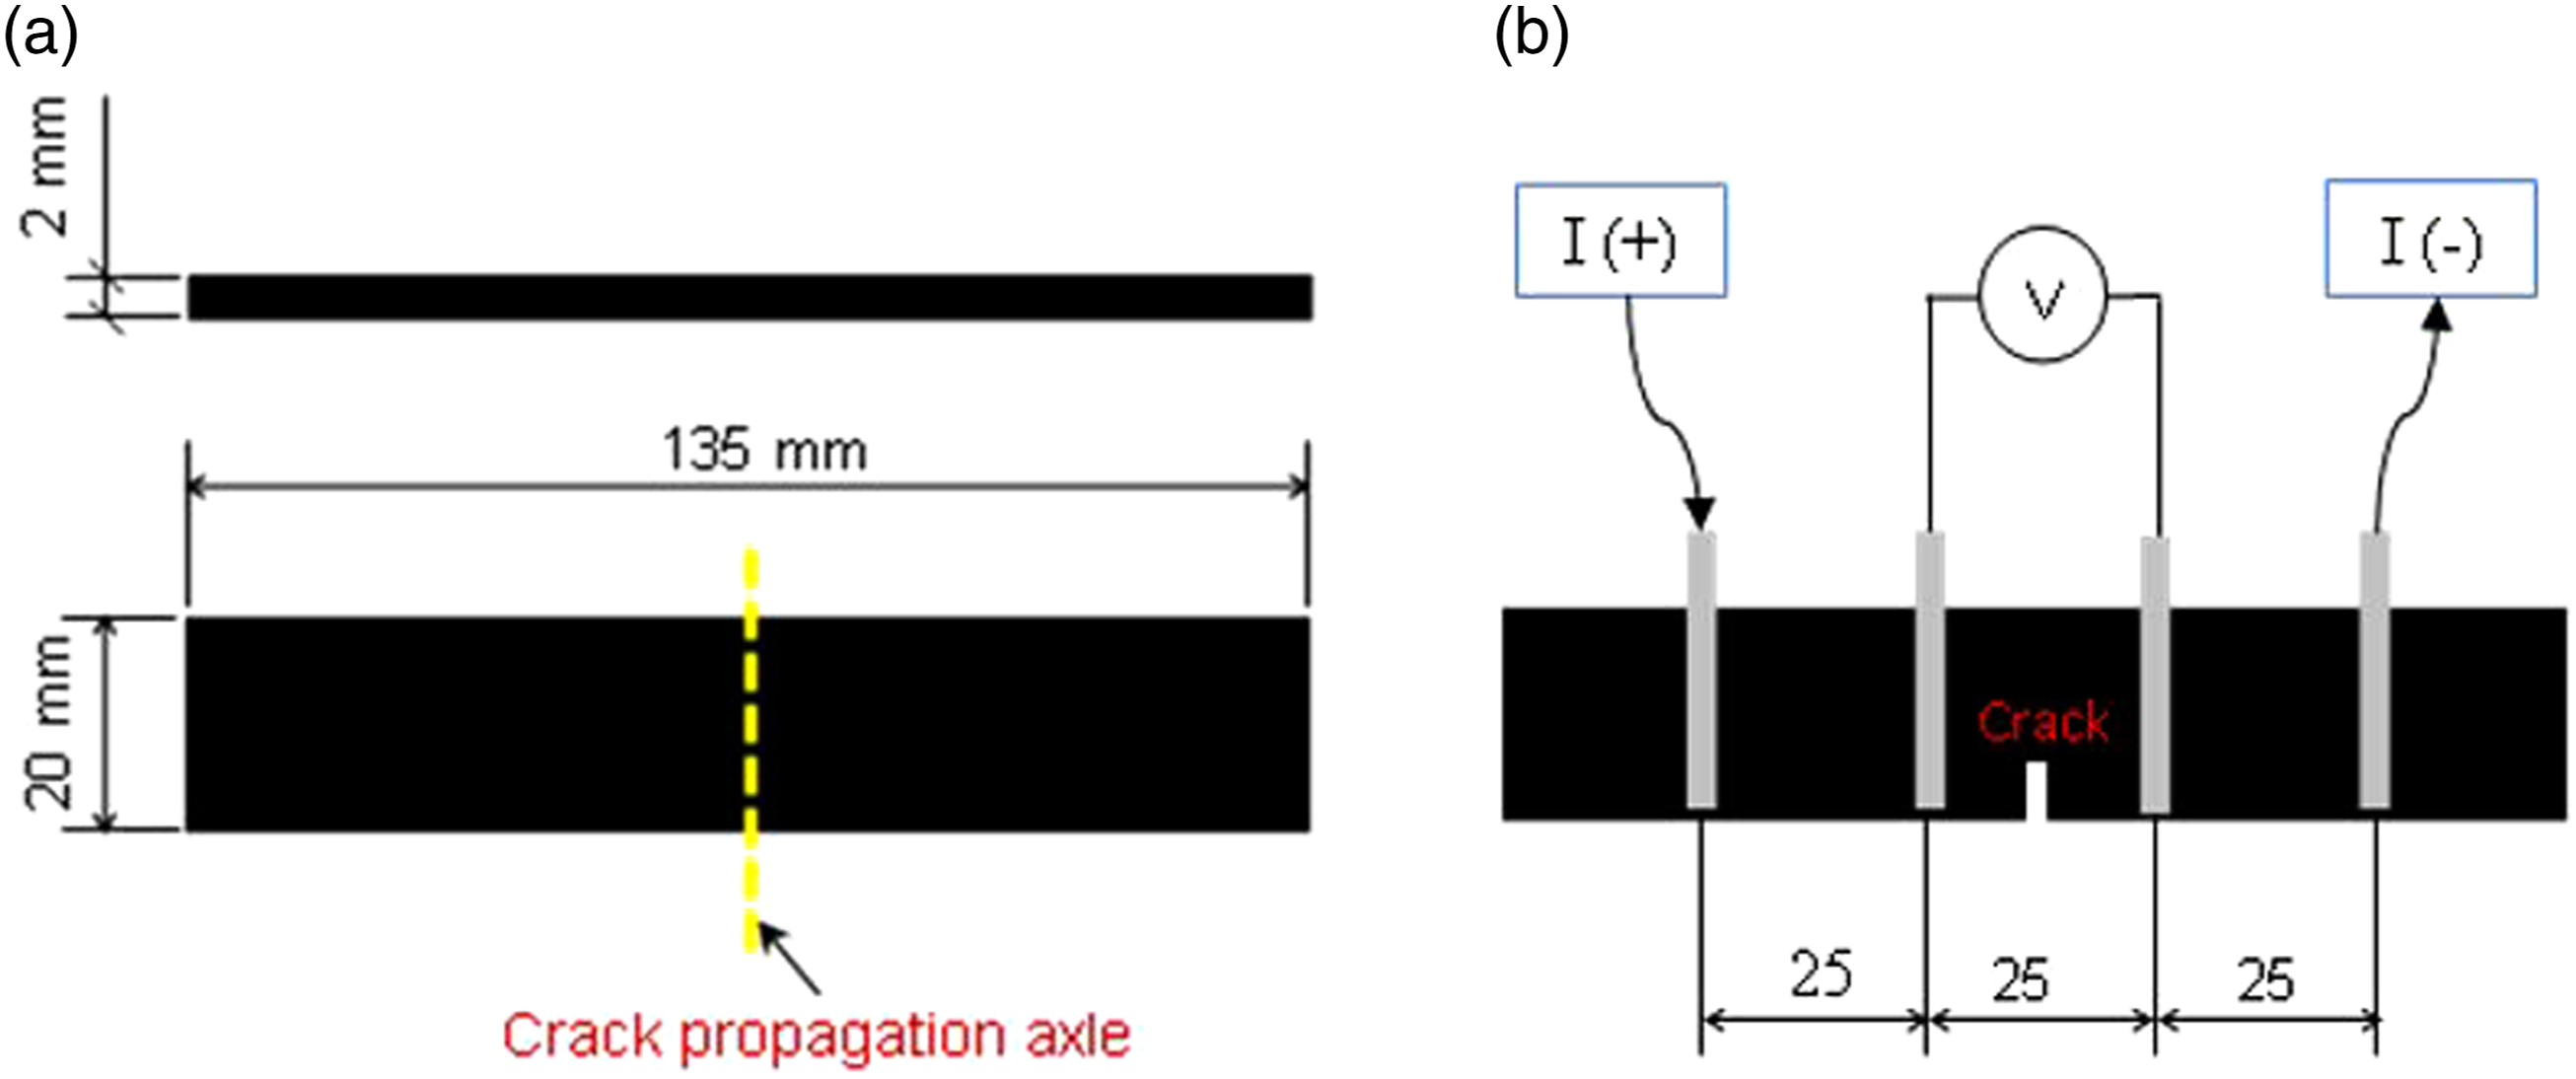
The Four-Point Probe Method and Van der Pauw Resistivity method are two standard techniques for measuring semiconductive materials' conductivity. These methods use a 4-wire method to eliminate the lead resistance and the contact resistance effects on measurement accuracy. Four-point measurements were applied, as illustrated in Figure 2(b). The outer (current passing) probes were placed directly without any conductive paint to obtain the actual electron flow into the specimen surface. Electrical measurement with low noise Triax Cable was fixed onto the specimen, as illustrated in Figure 2(b). A Keithley Instruments Model 6221 device was connected to the specimen’s outer probes to supply a constant current. Additionally, to measure the voltage difference between inner probes where the zones of interest, an Electrometers (Keithley Instruments Model 6514) were connected. A digital multimeter (Keithley Instruments Model 2000) is used to record a voltage drop by helping LabVIEW data acquisition software. According to many laboratory studies on the materials, a constant current of 100 mA and a constant voltage of 10 V was applied to each GE/NR nanocomposite to eliminate noise from the collected data. While the selected current provides a constant initial resistance within the GE/NR nanocomposite group, it is low enough to prevent GE from damaging them. Ohm’s law specified by equation (1) defines material resistance, which gives the relationship between current and applied voltage, as follows
In this equation, R, I, and V are electrical resistance, current, and voltage difference. The resistance R is calculated using the current (I) and the measured voltage (V) under Ohm’s Law. R0 is the initial electrical resistance value. The percentage of resistance change (%RC) is calculated using the basic equation (2) given below.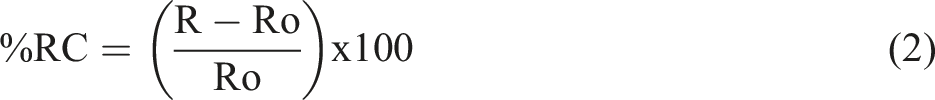
The resistance change is recorded during the experiment around the crack zone to show a relation between resistance and crack length. All experiments were performed using Zwick Roell Z010 tensile testing machine at 5%, 10%, 15%, 20% strain percentages under a minimum of 100 cycles in the 40 mm/min crosshead speed conditions. The electrical resistivity of the elastomer-based nanocomposite samples was measured on the samples shown in Figure 2. A Keithley Instruments Model 2000 type digital multimeter was used when the electrical conductivity of the test samples was above 107 S/m and a Keithley Instruments Model 6517b type digital electrometer was used when it was below 107 S/m. The ends of the samples were completely wrapped with insulating tapes and connected to the fixing jaws of the measuring device to minimize the surface effects in resistance measurements. The resistance of the nanocomposite samples was converted into resistivity (ρ) and conductivity (σ) and gauge factor (GF) according to equations (3), (4), and (5), respectively.
Results and discussion
Characterization techniques and SEM micrographs
The microstructural view of conductive nanocomposites was examined by SEM (Vega3 Tescan Instrument), with an acceleration voltage of 20 kV as shown in Figure 3(a)–(h). The samples were coated with 3 nm thick Au before analysis. Many graphene flakes dispersed in different sizes and shapes were examined in the SEM images obtained in the internal structure examination studies carried out in the laboratory. Figure 3(a) and (b) show SEM images of only carbon black-filled first stage rubber mixture in a closed mixer. SEM images show that spherical-shaped CB particles are homogeneously distributed in the matrix as well as clusters of different sizes. One of the most important points of obtaining better mechanical and electrical properties from the prepared HcNs is the perfect dispersion of the conductive filler particles in the matrix. Pictures between c and h indices in Figure 3 provide information on the morphology of nanocomposites containing 1, 4, and 8 phr graphene fillers, respectively. In general, it can be seen that the graphene nanoplatelets are homogeneously and evenly distributed in the matrix. Due to the two-dimensional structure of graphene and the difficulty of mixing, it is seen that in some places, it sticks out from the rubber matrix and is directed perpendicular to the surface (Figure 3(d), (f), and (h)). The graphene nanoplatelets in HnCs prepared by the mechanical mixing method were observed as agglomerated in patches regardless of the amount. Because GE nanoplatelets have a 2-dimensional morphology, some dimensional deformations, breaks, and folds have been observed in length and width due to the surface friction force they are subjected to during mechanical mixing. In some regions (Figure 3(d), (f), and (h)), GE nanoplatelets adhering to each other formed a thick layer and formed clumps by getting stuck in the rubber matrix. The images obtained in Figure 3(c), (e), and (g) show the formation of a strong transmission network by homogeneously dispersing GE nanoplatelets of different thicknesses. However, GE nanoplatelets in the rubber matrix appear to have better dispersion and alignment in HNGE04 and HNGE08 nanocomposites than HNGE01. As shown in Figure 3(c), the presence of CB particles in the matrix and the transmission network formed by other conductive fillings can be seen. The CB particles appear to be in contact with almost all graphene layers and dispersed well. These GE and CB fillers are involved in creating some filler networks in the matrix, which is responsible for high electrical conductivity at the same time. In Figure 3(d), (f), and (h), GE nanoplatelets can be seen more closely, as well as the presence of CB particles. SEM images of prepared HcN compounds: (a–b) CB-filled mixture, (c, d) 7 phr CB + 1 phr GE, (e, f) 4 phr CB + 4 phr GE and (g, h) 0 phr CB + 8 phr GE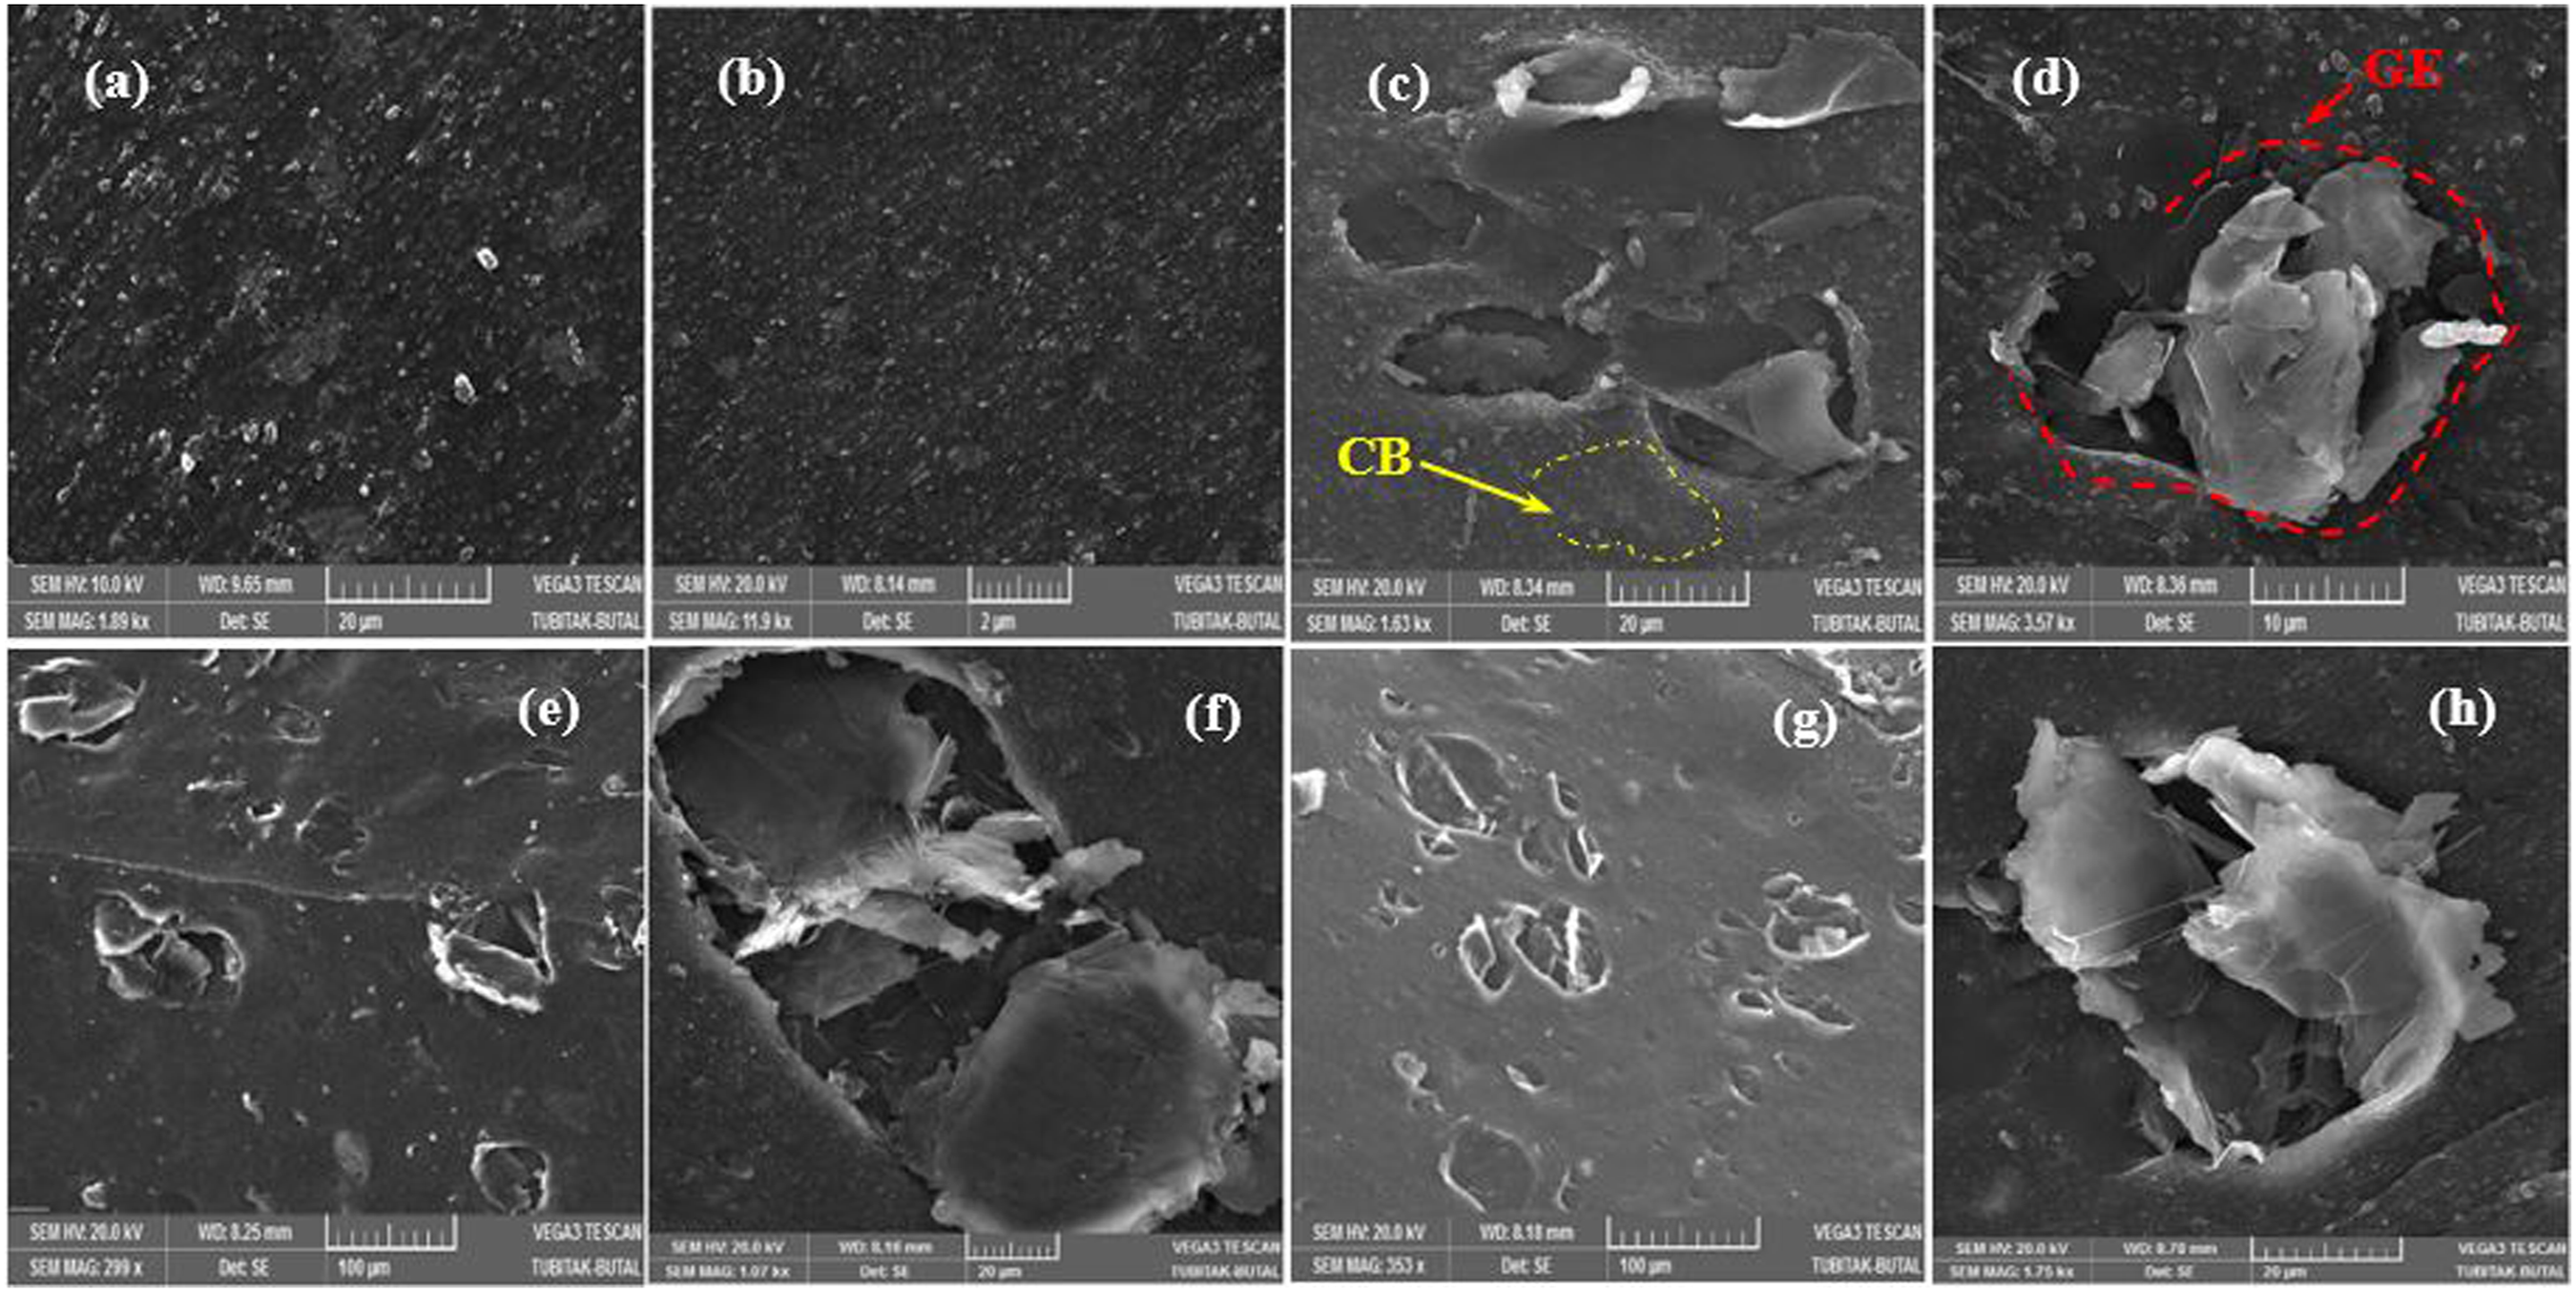
Figure 4 shows agglomerated GE layers in contact with agglomerated CB particles. It can be seen that GE nanoplatelets are intertwined, their morphology is deformed, and they combine with CB particles to form an integrity. The clumping of carbon-based fillers by sticking to each other is not only dependent on the viscosity of the matrix itself, but is also affected by the non-homogeneous distribution of the additives in the matrix. This prevents the formation of a continuous transmission network and leads to higher electrical resistance. Therefore, the uneven distribution of GEs, faulty delamination, and agglomeration of CB reduced the mechanical properties and electrical conductivity of HcNs. SEM image of the interaction of CB and GE in the HcN matrix (7phr CB + 1 phr).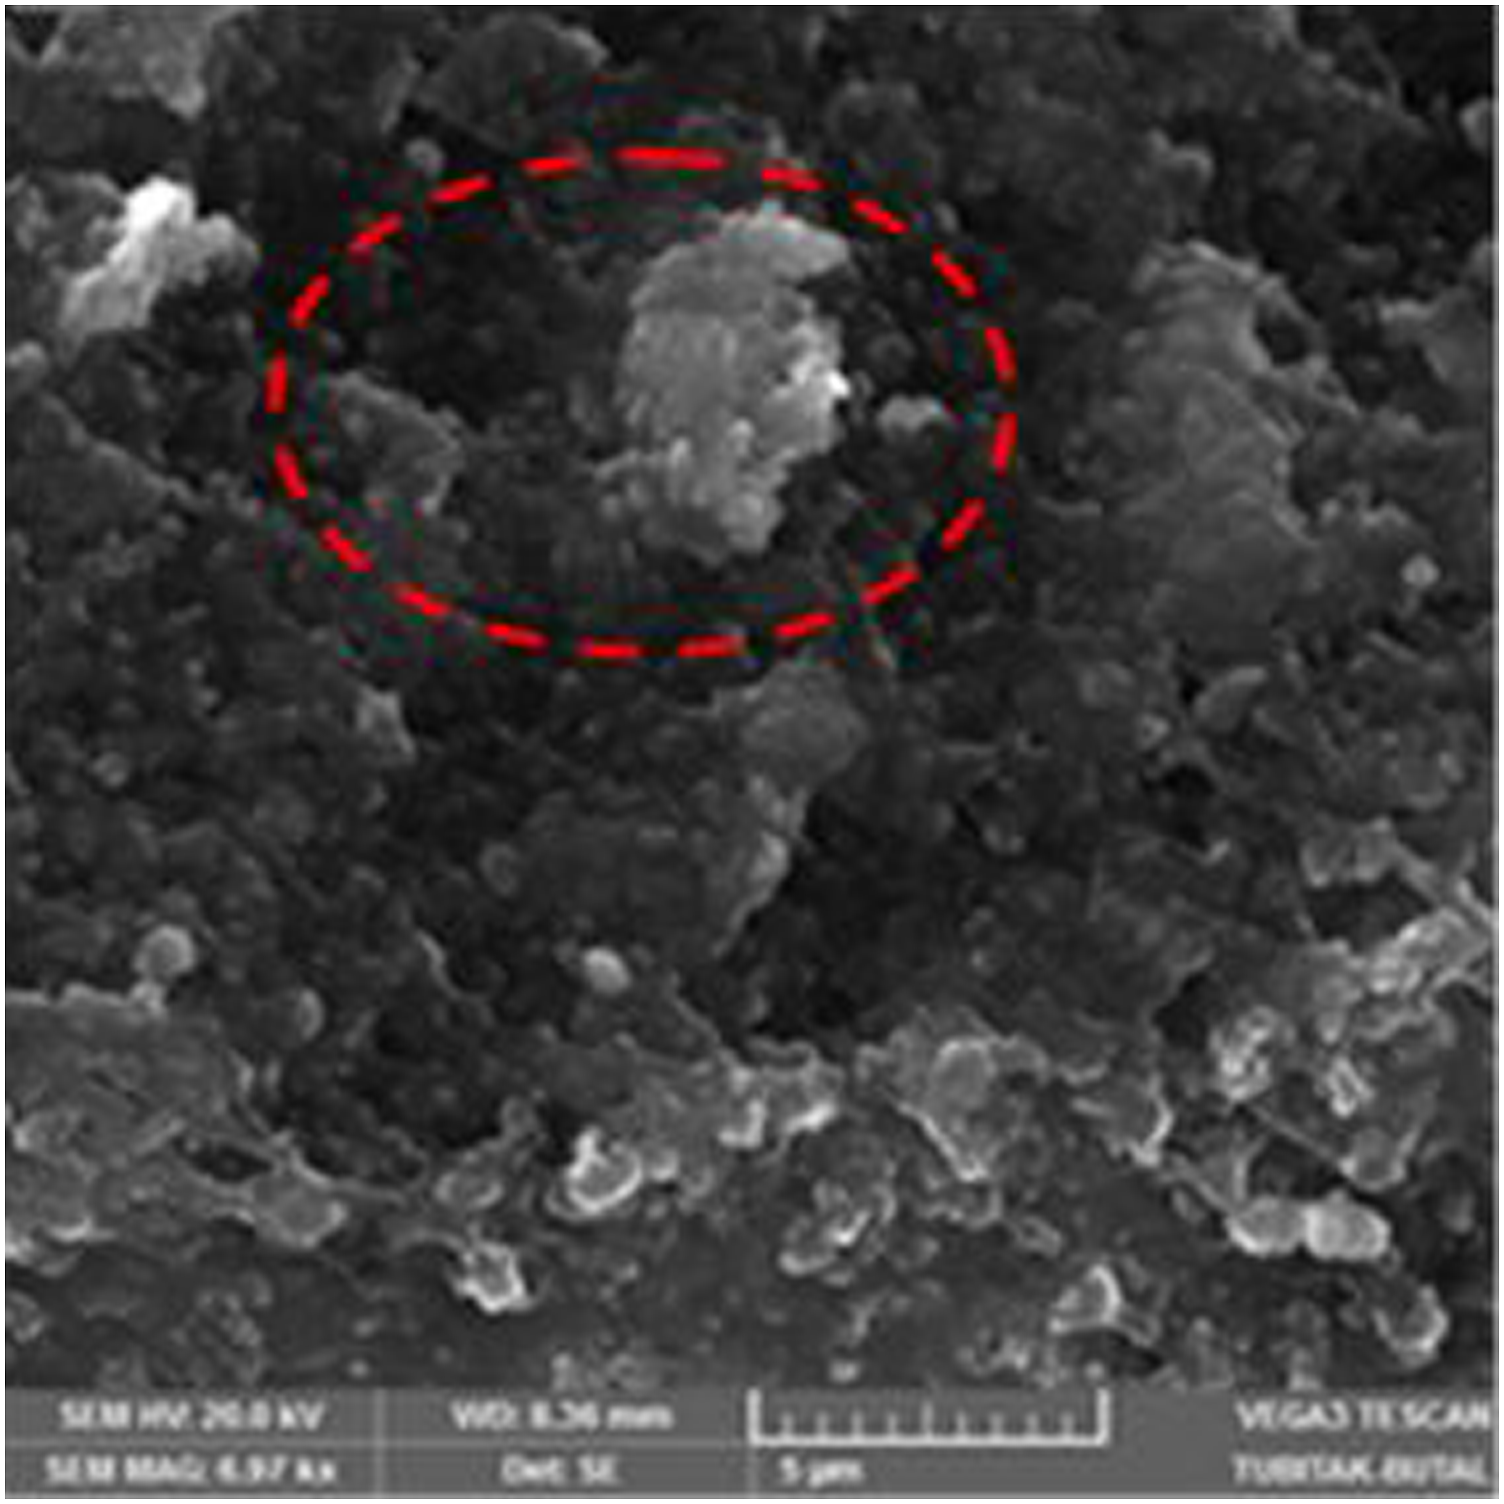
Mechanical properties
Mechanical properties of HcNs.
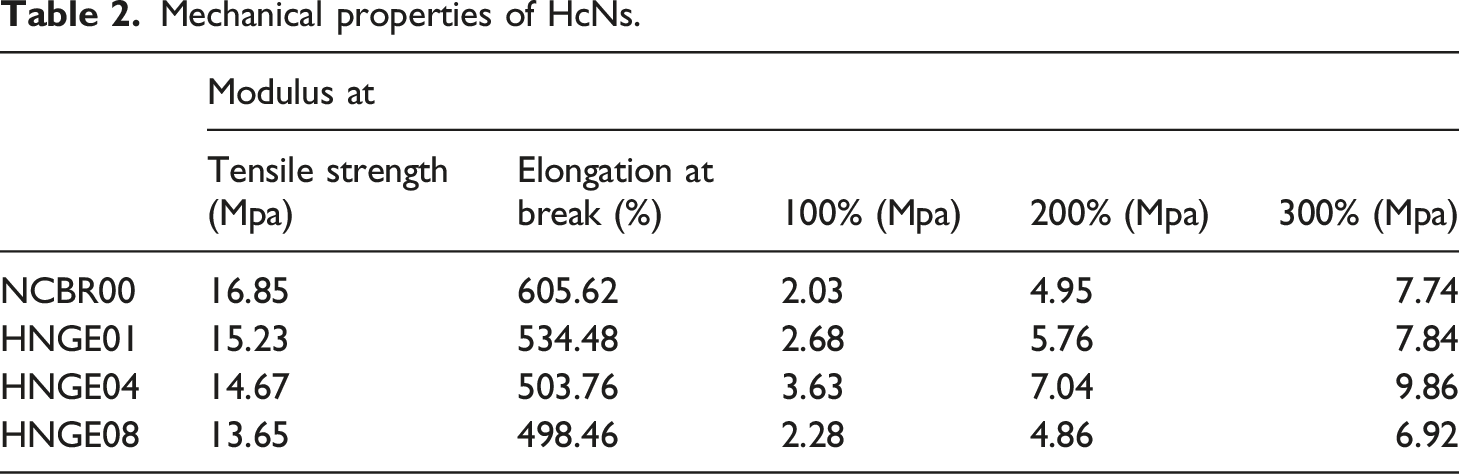
The good distribution of GE particles and high aspect ratio, corresponding to HcNs high mechanical properties, should be clearly stated. As the filler ratio of GE nanoplatelets in HcNs increased, stress and strain values decreased. Both the tensile strength and elongation values of only carbon black-filled mixtures are higher than the conductive-filled nanocomposites. The addition of GE nanoplatelets to the compounds negatively affects the mechanical properties. Adding 1 phr of GE in the mixture, compared to CB filler compounds, the tensile strength decreased by 9.67%, and the elongation value at the break by 11.65%. Adding 8 phr of GE in the mixture, compared to CB filler compounds; the tensile strength decreased by 18.99% and the elongation value at break by 17.69%. The main reason for this increase is evaluated as the slip effect of GE nanoplatelets on each other, the interaction of fillers with rubber and the structures of the matrix. In order for nanocomposites to withstand the applied stress, a good interface and interaction between GE and CB nanofiles and the NR matrix is required. The rubber-filler distribution and interactions for the prepared mixtures are schematically shown in Figure 5. Schematic representation of the interaction mechanism of filler materials in the HcN matrix: (a) NCBR00 (b) HNGE01 (c) HNGE04 (d) HNGE08.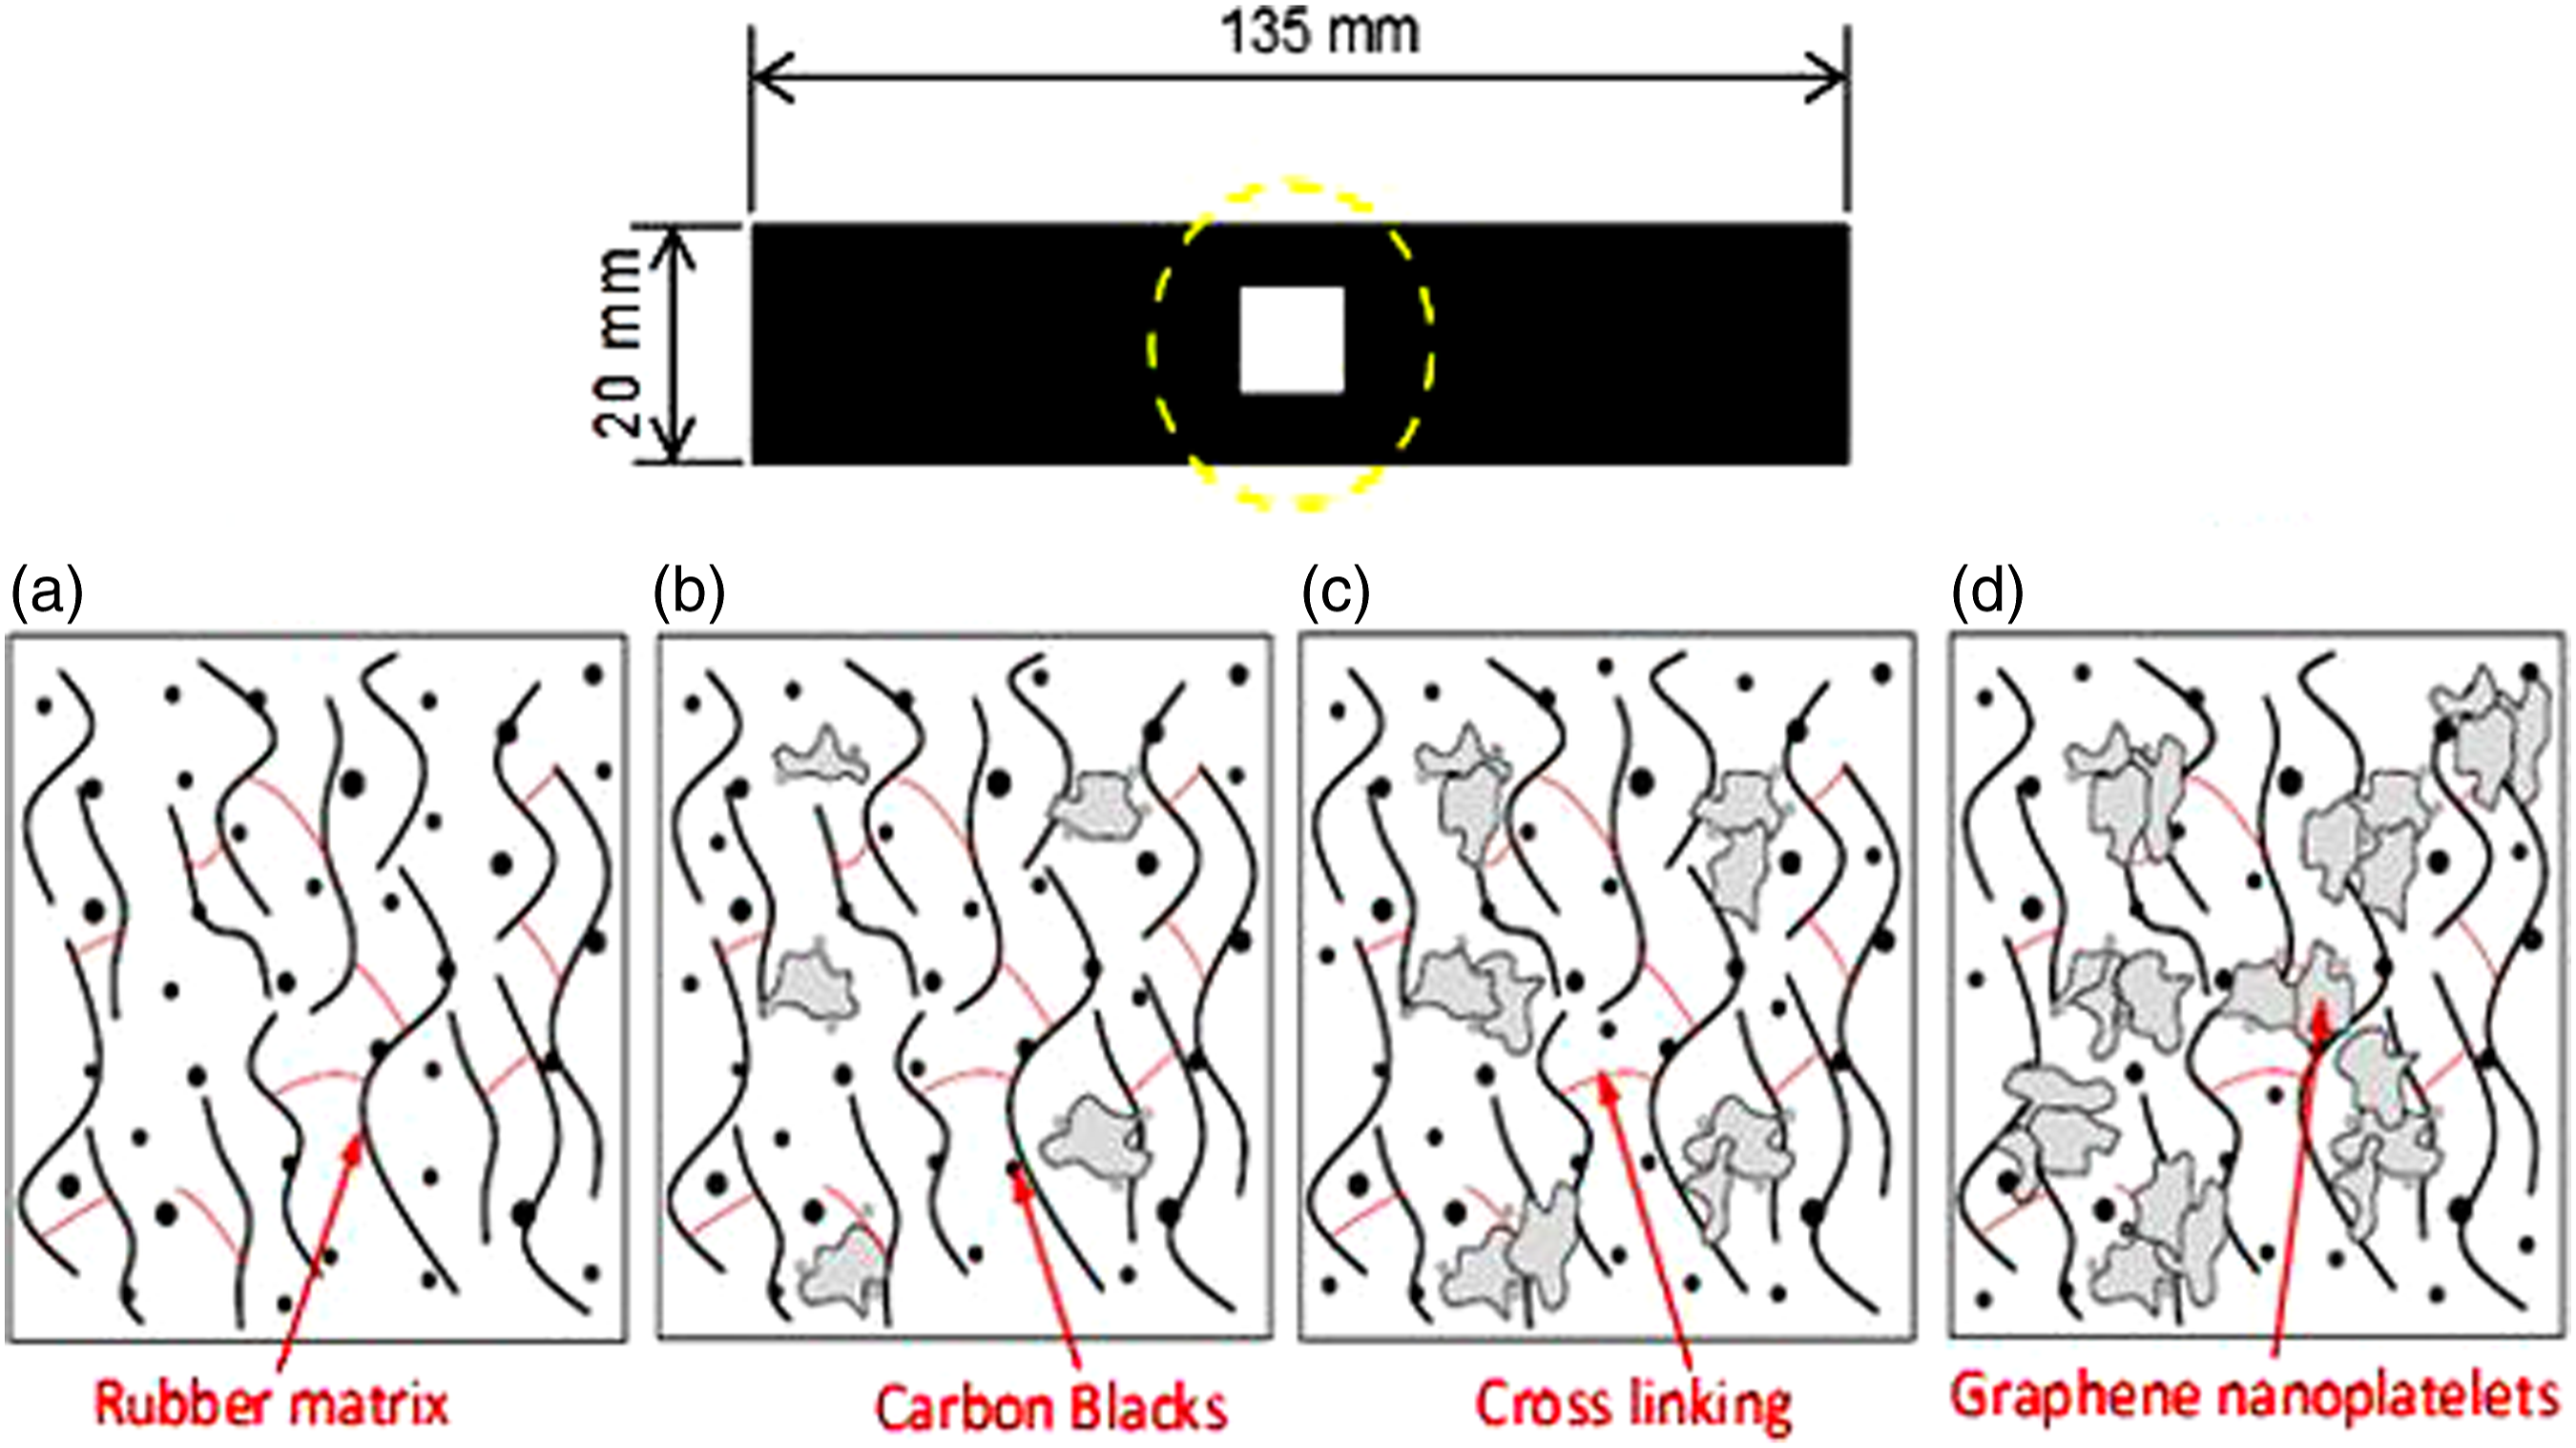
The tensile strength of HcNs is partly attributed to the reorientation and shear effect of GE nanoplatelets and CB particles against the stress direction in the composite. These effects show the result of the entanglement of GE nanoplatelets and CB particles in the rubber chains and the interactions between them. Moreover, the interfacial interaction and aspect ratio between rubber and filler materials play a vital role in providing stress movement from rubber chains to filler aggregates in rubber samples under tensile load.31,32 The addition of 8 phr GE nanoplatelets to the mixture produced a significant decrease in tensile strength and elongation at break. This decrease is due to the interface regions with poor interaction between the rubber chains and the conductive filler materials.
GEs and CBs well dispersed in the matrix exhibit high elongation at break and high tensile strength. During the stress applied to HcNs, stress and strain transfer occurs between filler particles and rubber chains. As shown schematically in Figure 6(a)–(d), when strain loading is applied on HcNS, both new formations and deformations are seen between the filler materials and the rubber chains. Schematic representation of rubber-fillers distribution and interaction mechanism under stress. (a) Stretched bond, (b) Rubber-filler interaction, (c) Voids and separation, (d) Sliding effect.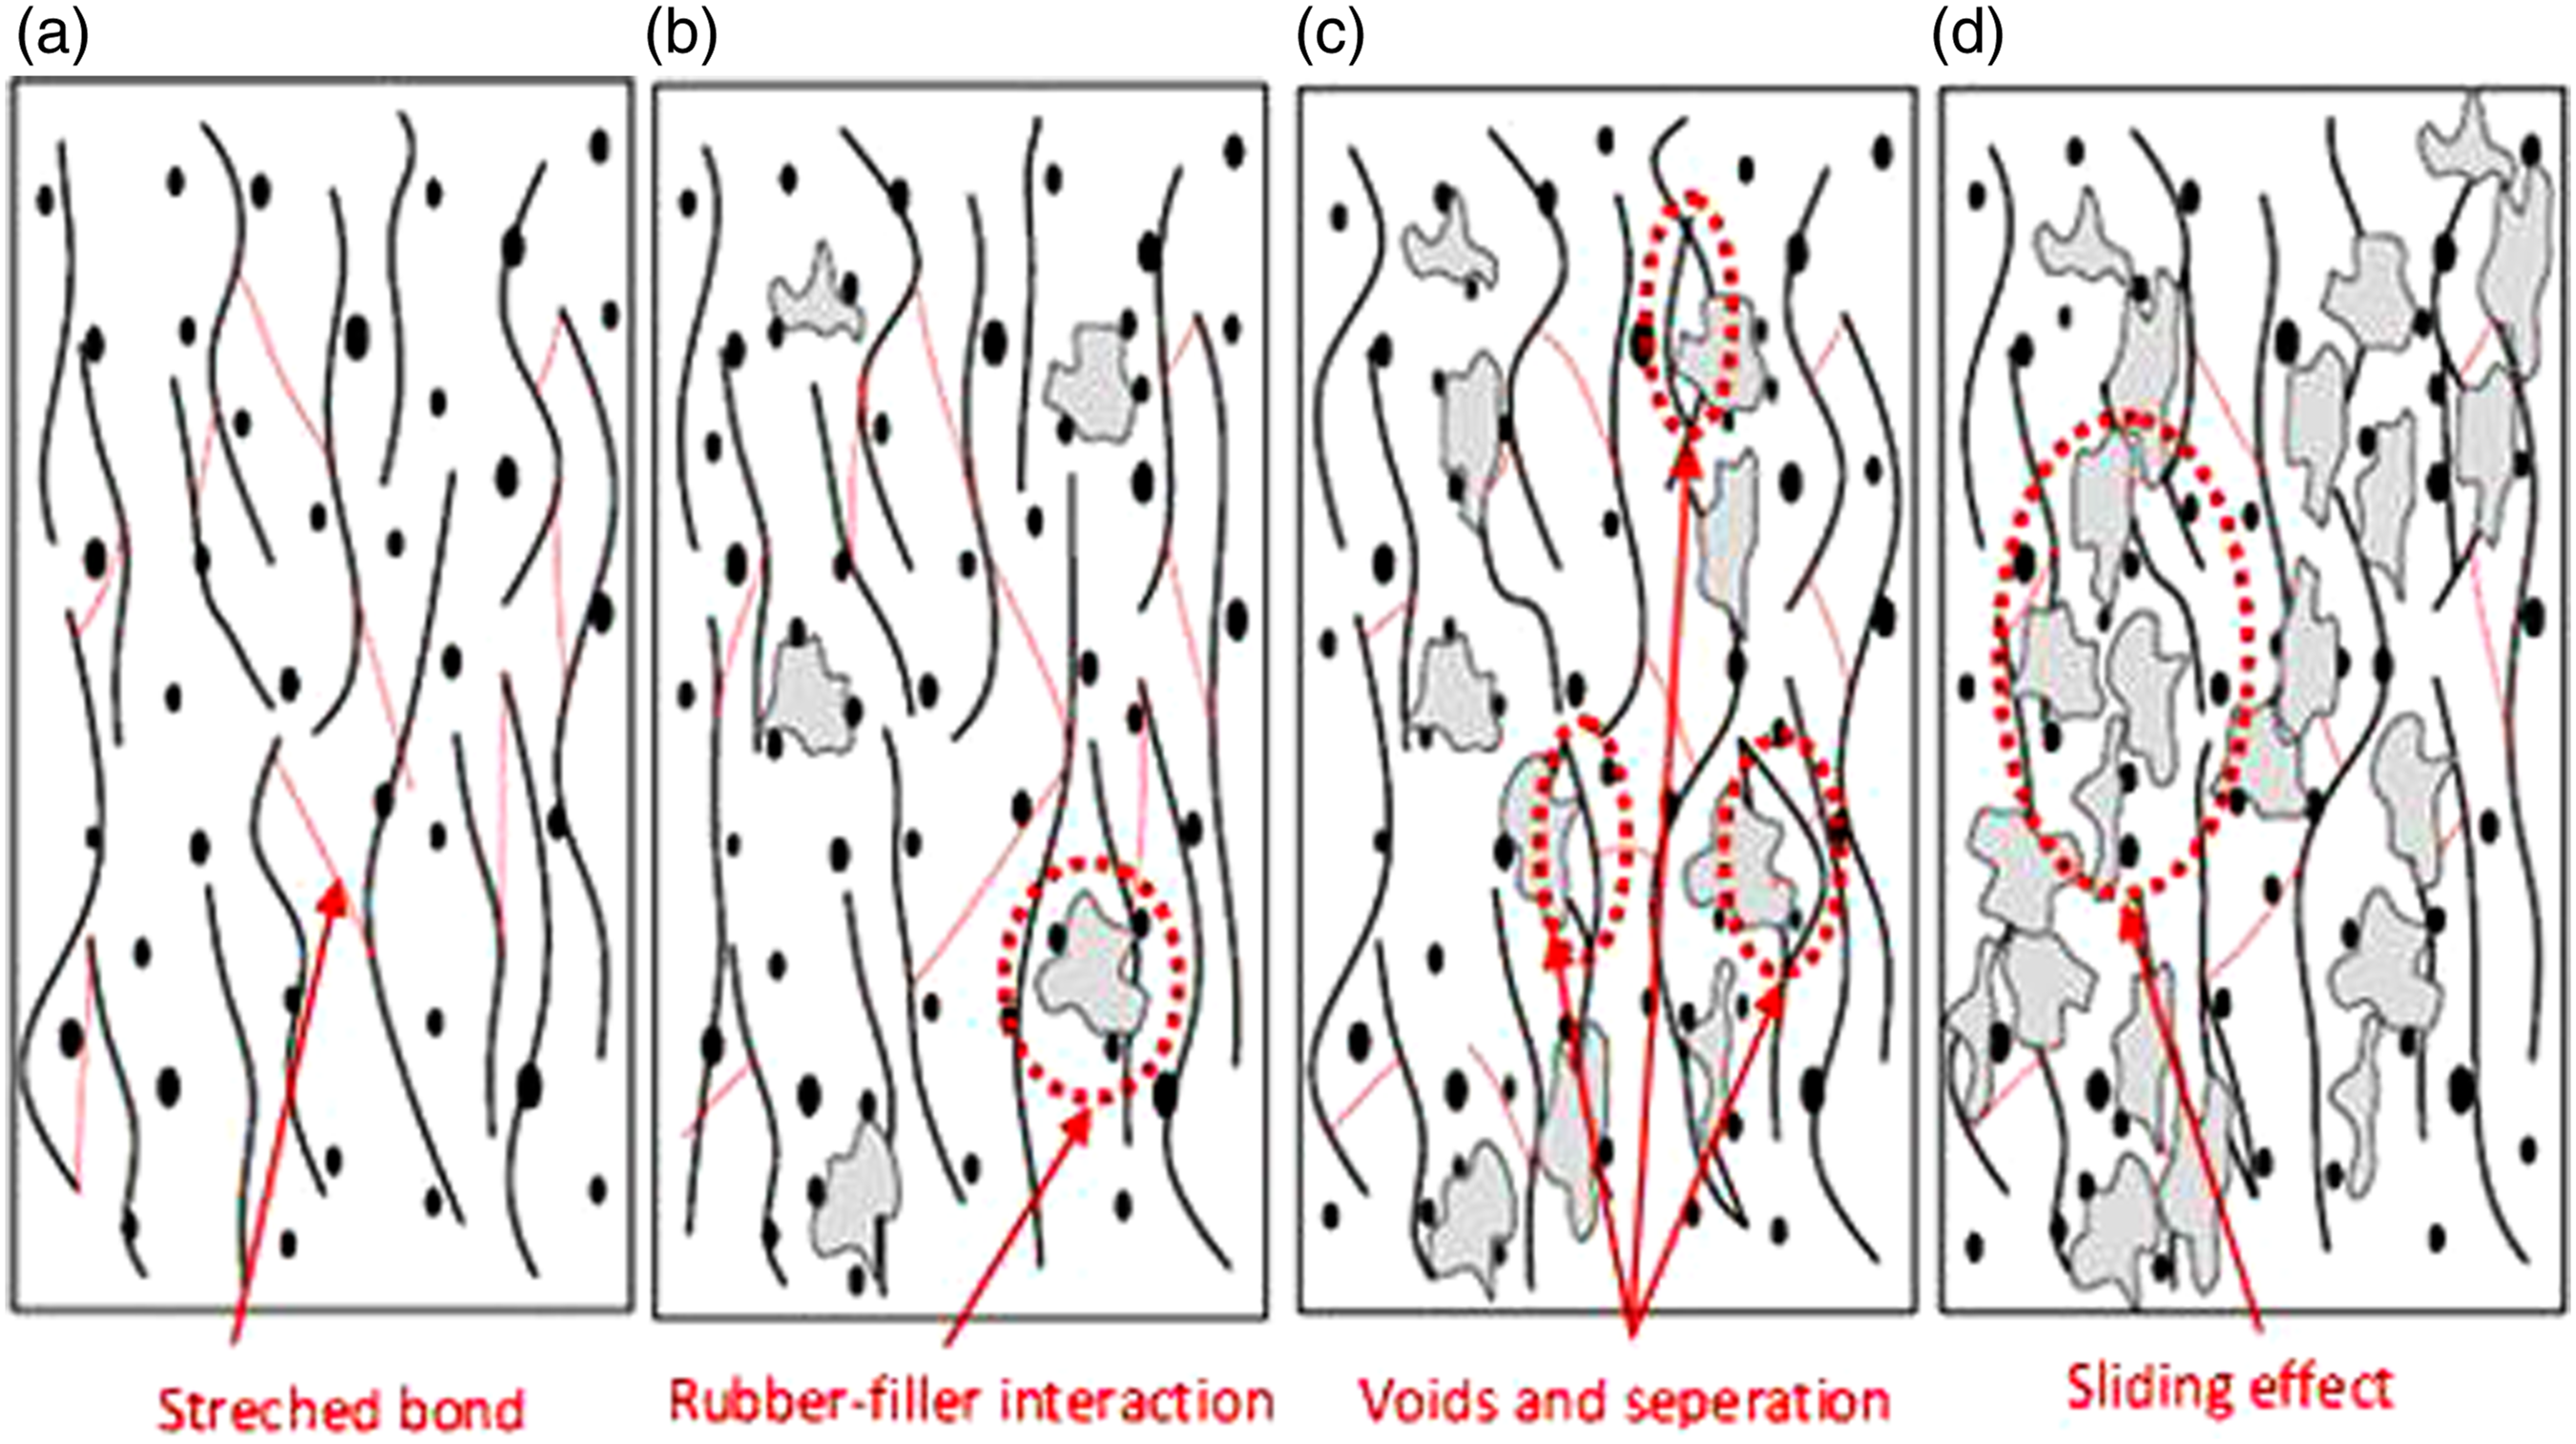
Filler materials can form superficial bonds with rubber chains due to their position and shape after the movement of the layers caused by the stress applied on the specimens. As shown in Figure 6(c), GE nanoplatelets with a high filler ratio create agglomeration in the matrix, causing a decrease in tensile strength and elongation at break. The absence of sufficient chemical groups on GE surfaces can also be considered a weak physicochemical interaction between GE and the rubber matrix.
Electrical sensitivity of nanocomposites
The electrical properties of the composite are determined by the amount and nature of the conductive filler phase in the elastomer used as the matrix. Figure 7 shows the effect of graphene filler on the electrical conductivity of nanocomposites. Influence of filler concentration on the electrical conductivity of the HcN.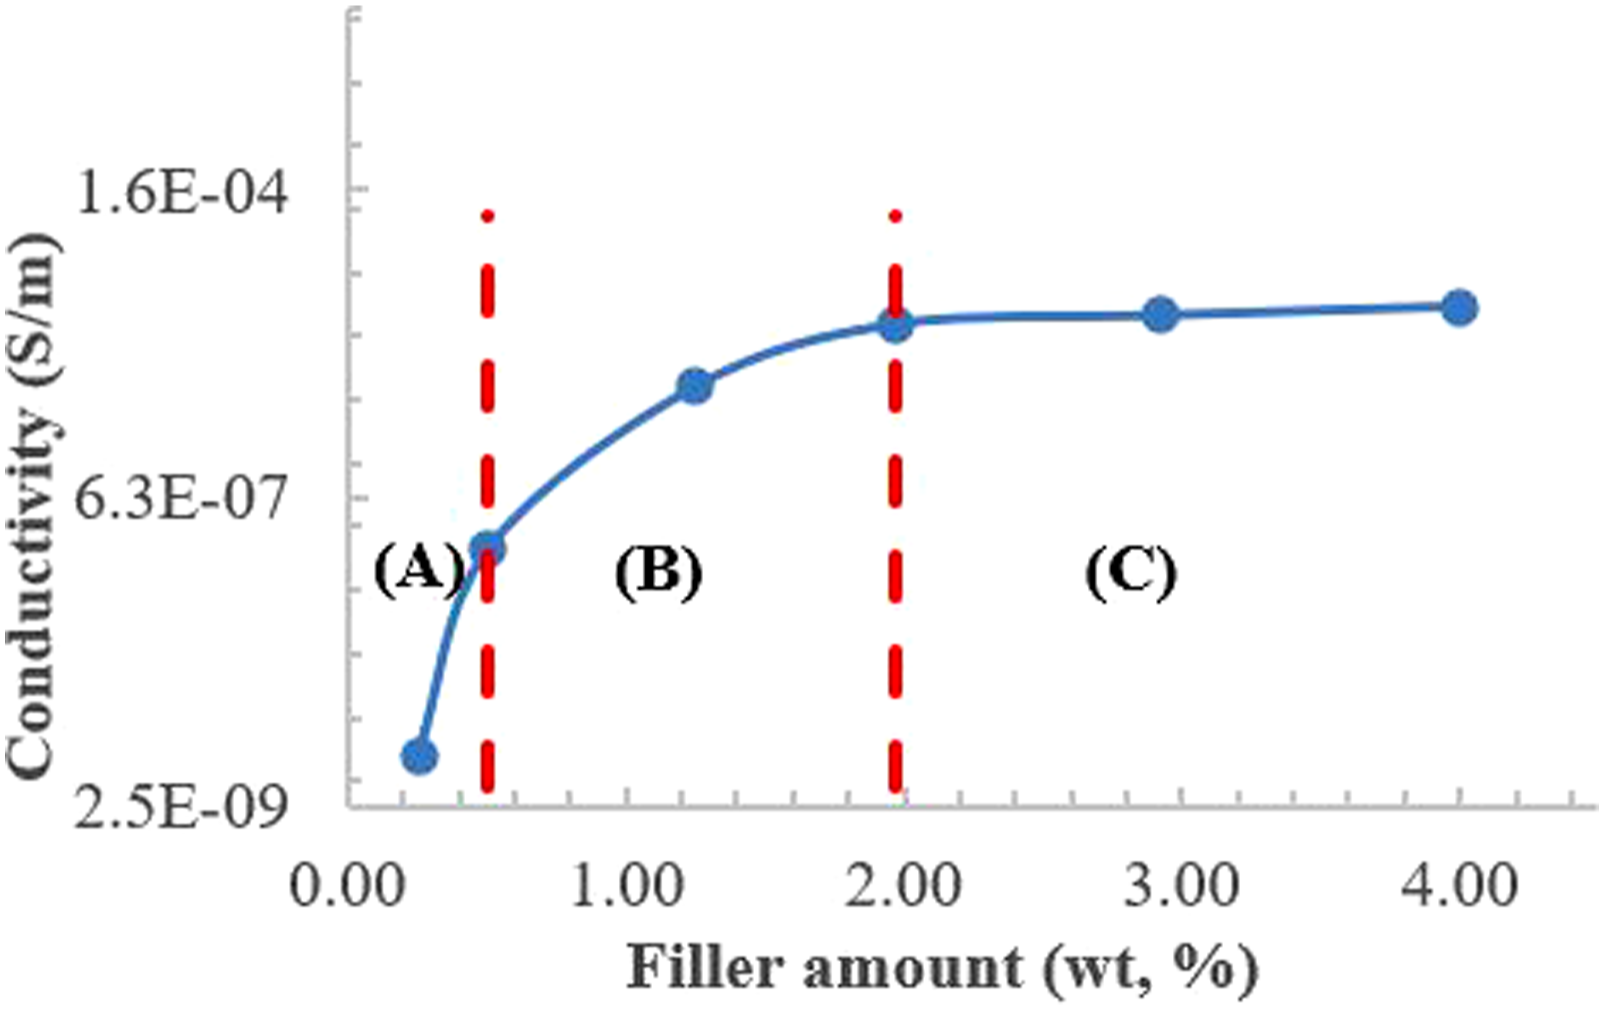
As a result of the gradual addition of GE, the electrical conductivity of the nanocomposites exhibited a slow increase initially, then a sharp increase, and then a very low increase behavior. The conductivity can be defined as the beginning of interaction (A), which is defined as the first region between 0.25 and 0.5% by weight, the second region (B), which is called the percolation threshold between 0.5 and 1.97%, and the third region (C) where the conductor network between 1.97% and 4% is fully formed. The electrical conductivity of the nanocomposite increased remarkably with the increase in the amount of GEs between 0.5% and 1.97 wt%. In this filler range, the conductivity of HcNs changed abruptly from 2.48 × 10⁻⁷ S/m to 1.4E-05 S/m. This observed jump in conductivity correlates with the amount of critical filler material and the resulting percolation threshold (Perets ve arkadaşları). The amount of critical filler determined depends on the dimensional properties of the GEs, their distribution in the matrix, and the alignment structure. One of the most important aspects of sensor behavior characterization is the estimation of the sensitivity and linearity of the sensor and correlates the stress-strain plot of the sensor with the measurement of the change in relative resistance with strain over the range of sensor function. Figure 8 shows the variation of the relative resistance (ΔR/R0) against the applied tensile stress. Influence of different GE ratios on the piezoresistive behavior of HcNs.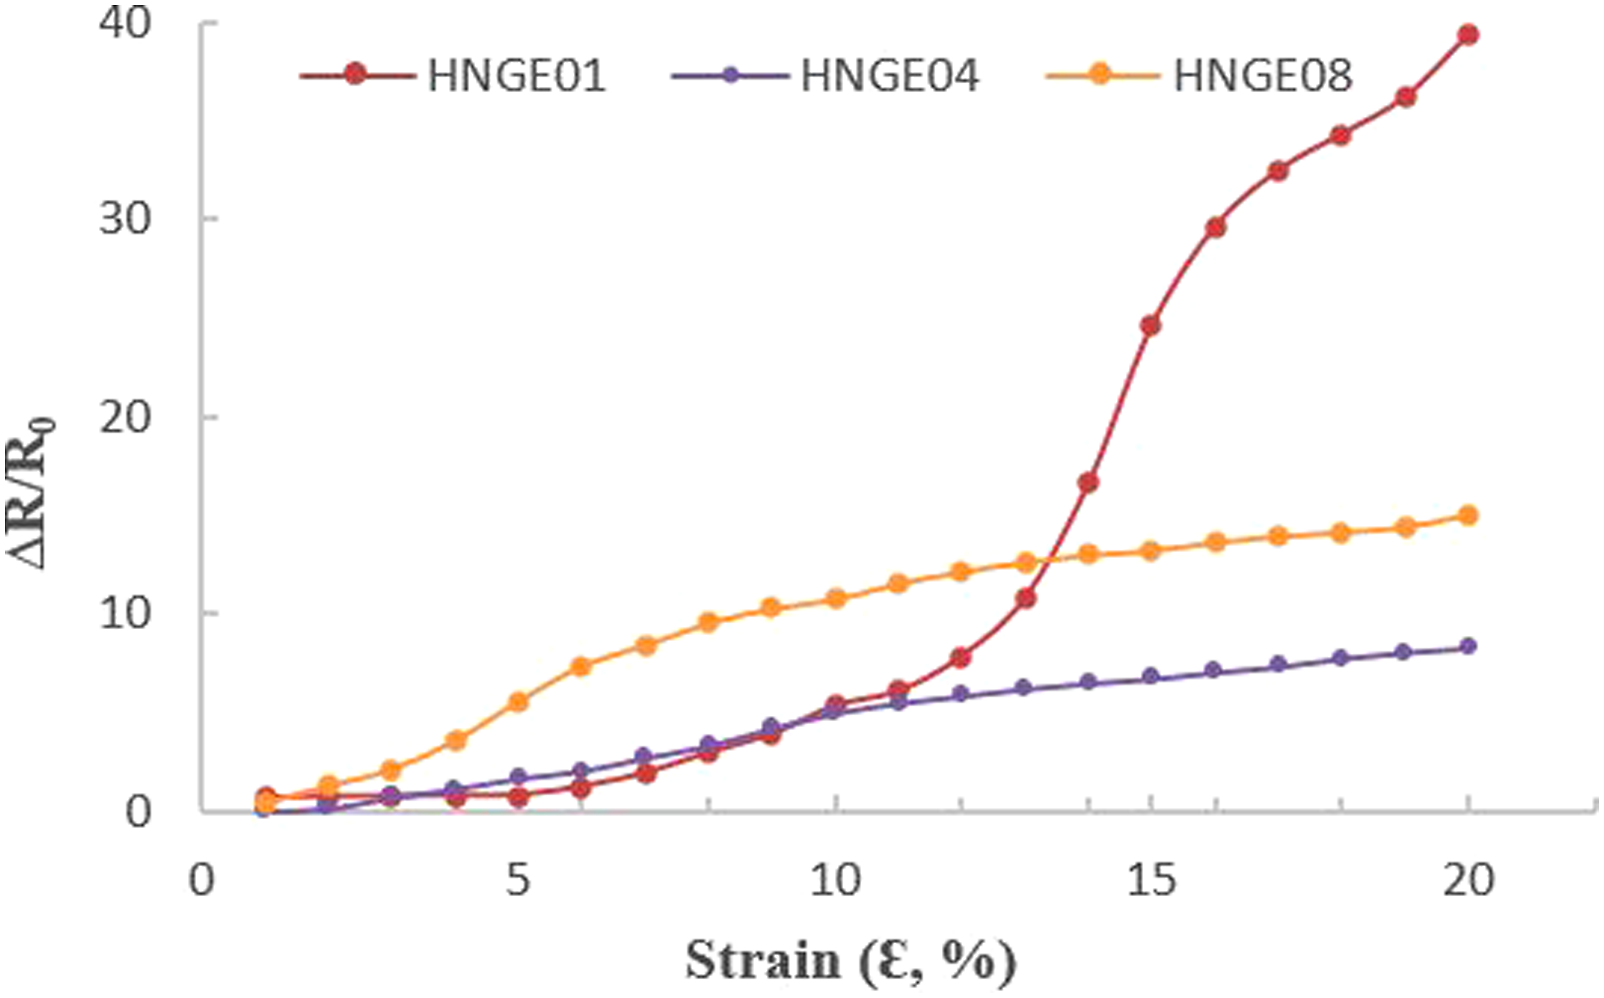
This figure describes GE and CB-filled HcNs that exhibit a nonlinear piezoresistive behavior to strain. When the graph obtained from the piezoresistance measurements is examined, two different behavior patterns are observed. For all three samples, the change in relative resistance due to strain exhibited a linear behavior up to 7.5% elongation, and this value was determined as the critical percent elongation value. While a linear behavior was observed below the critical percent elongation value, variability was observed in the values above this region depending on the amount of filling. Linear behavior of HNGE04 nanocomposite was observed up to 20% strain values. The sensitivity of nanocomposite containing 1.97% conductive filler is higher than nanocomposite containing 4% by weight GE. As the amount of filler increases, the distance between the GE plaques in the matrix decreases and the aggregation density increases. Therefore, at higher filler amount, higher percentage elongation values are needed to increase the distance between the GE and destroy the conductive mesh. The advantage of using nanocomposites with the amount of filler above the leaching threshold is the ability to detect higher magnitudes of elongation. Figure 9 shows the measurement factor (GF), defined as the slope of the curves obtained from the strain relative resistance change tests performed on HcNs. Gauge factors (GFs) at 5%, 10%, and 15% strain values.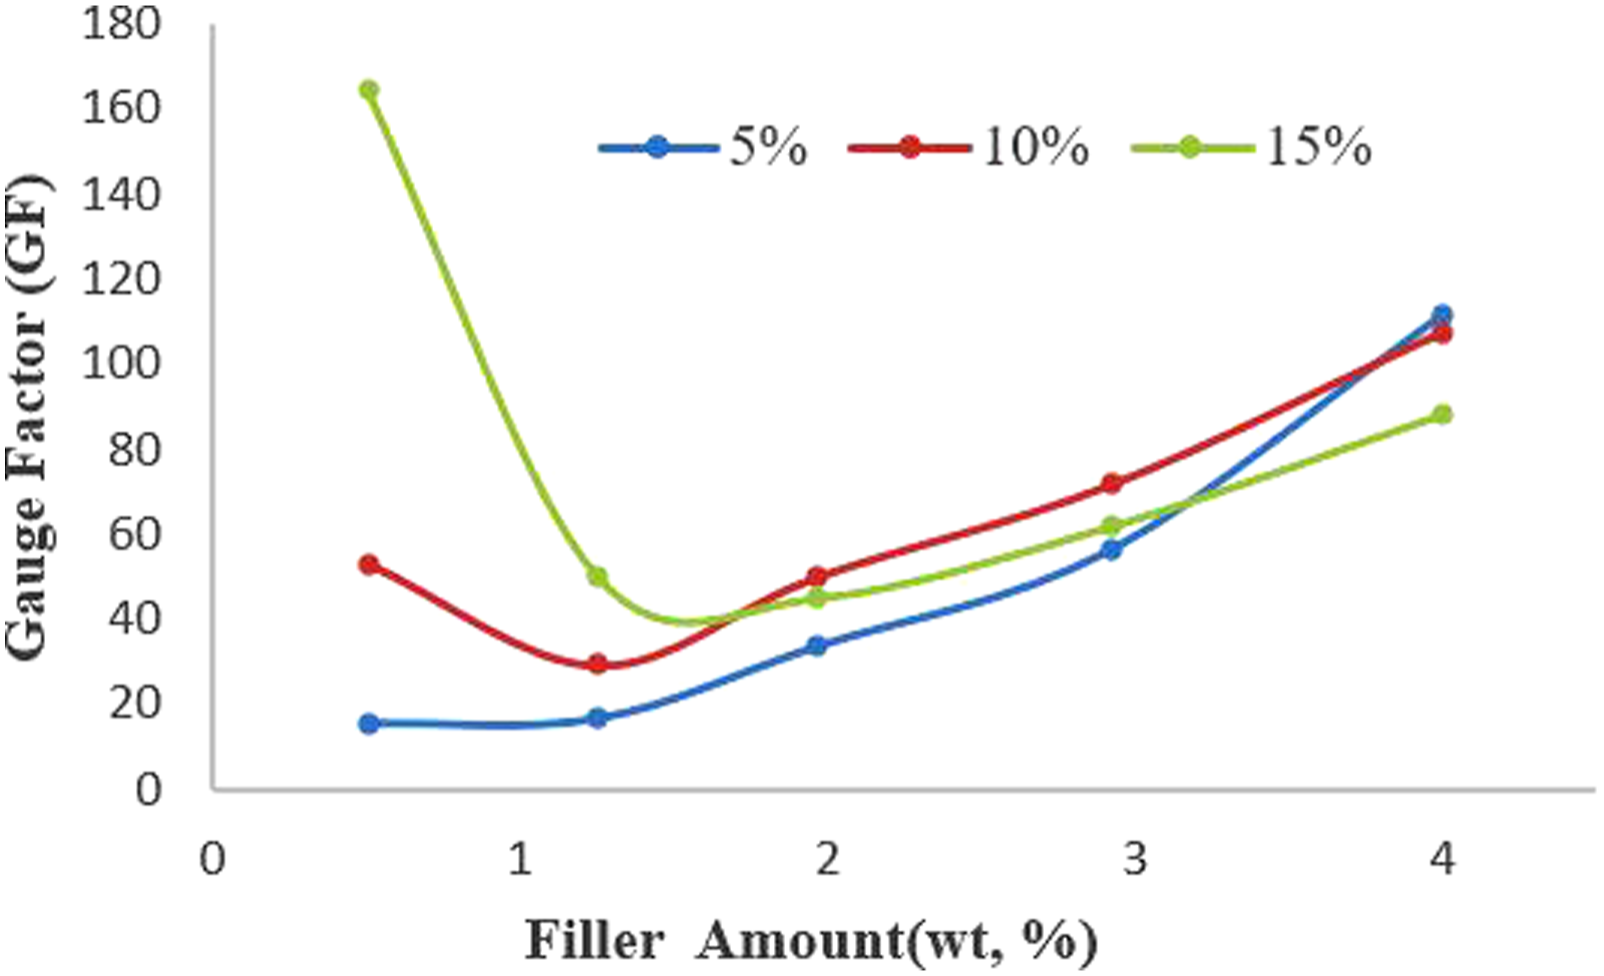
A gauge factor of approximately 34, 50, and 45 units was measured for an elongation level of 5%, 10%, and 15%, respectively, of HcN containing 1.97% GE by weight. It is seen that the gauge factor decreases considerably as the amount of GE moves away from the percolation threshold. When the gauge factor graph was carefully examined, it was thought that a small change in the amount of GE by weight could cause serious changes in the piezoresistor behavior due to the dispersion quality in the matrix, depending on the amount of elongation applied.
The variation of the relative resistance change as a function of time under the loading and unloading cycle of HcNs prepared with different ratios of GE filler material, up to 20% strain value, is shown in Figure 10. Dynamic cyclic tests were performed to ensure the time-dependent reliability and stability of the sensor. The most critical point during cyclic loading tests is to see if the HcNs come to the same relative resistance changes after many cycles of use and if there will be any deviations. It can easily be noticed in Figure 10(a) that the conductive properties occasionally break after multiple repeated charging–discharging cycles. In contrast, in Figure 10(b) and (c), the conductive properties of the composite are mostly preserved, with very stable but flexible conductive paths developed by the particular arrangement of the filler in the rubber matrix. Cyclic strain experiment and plots of relative resistance, and strain versus time for HNGE01(a), (b) for HNGE04, (c) for HNGE08.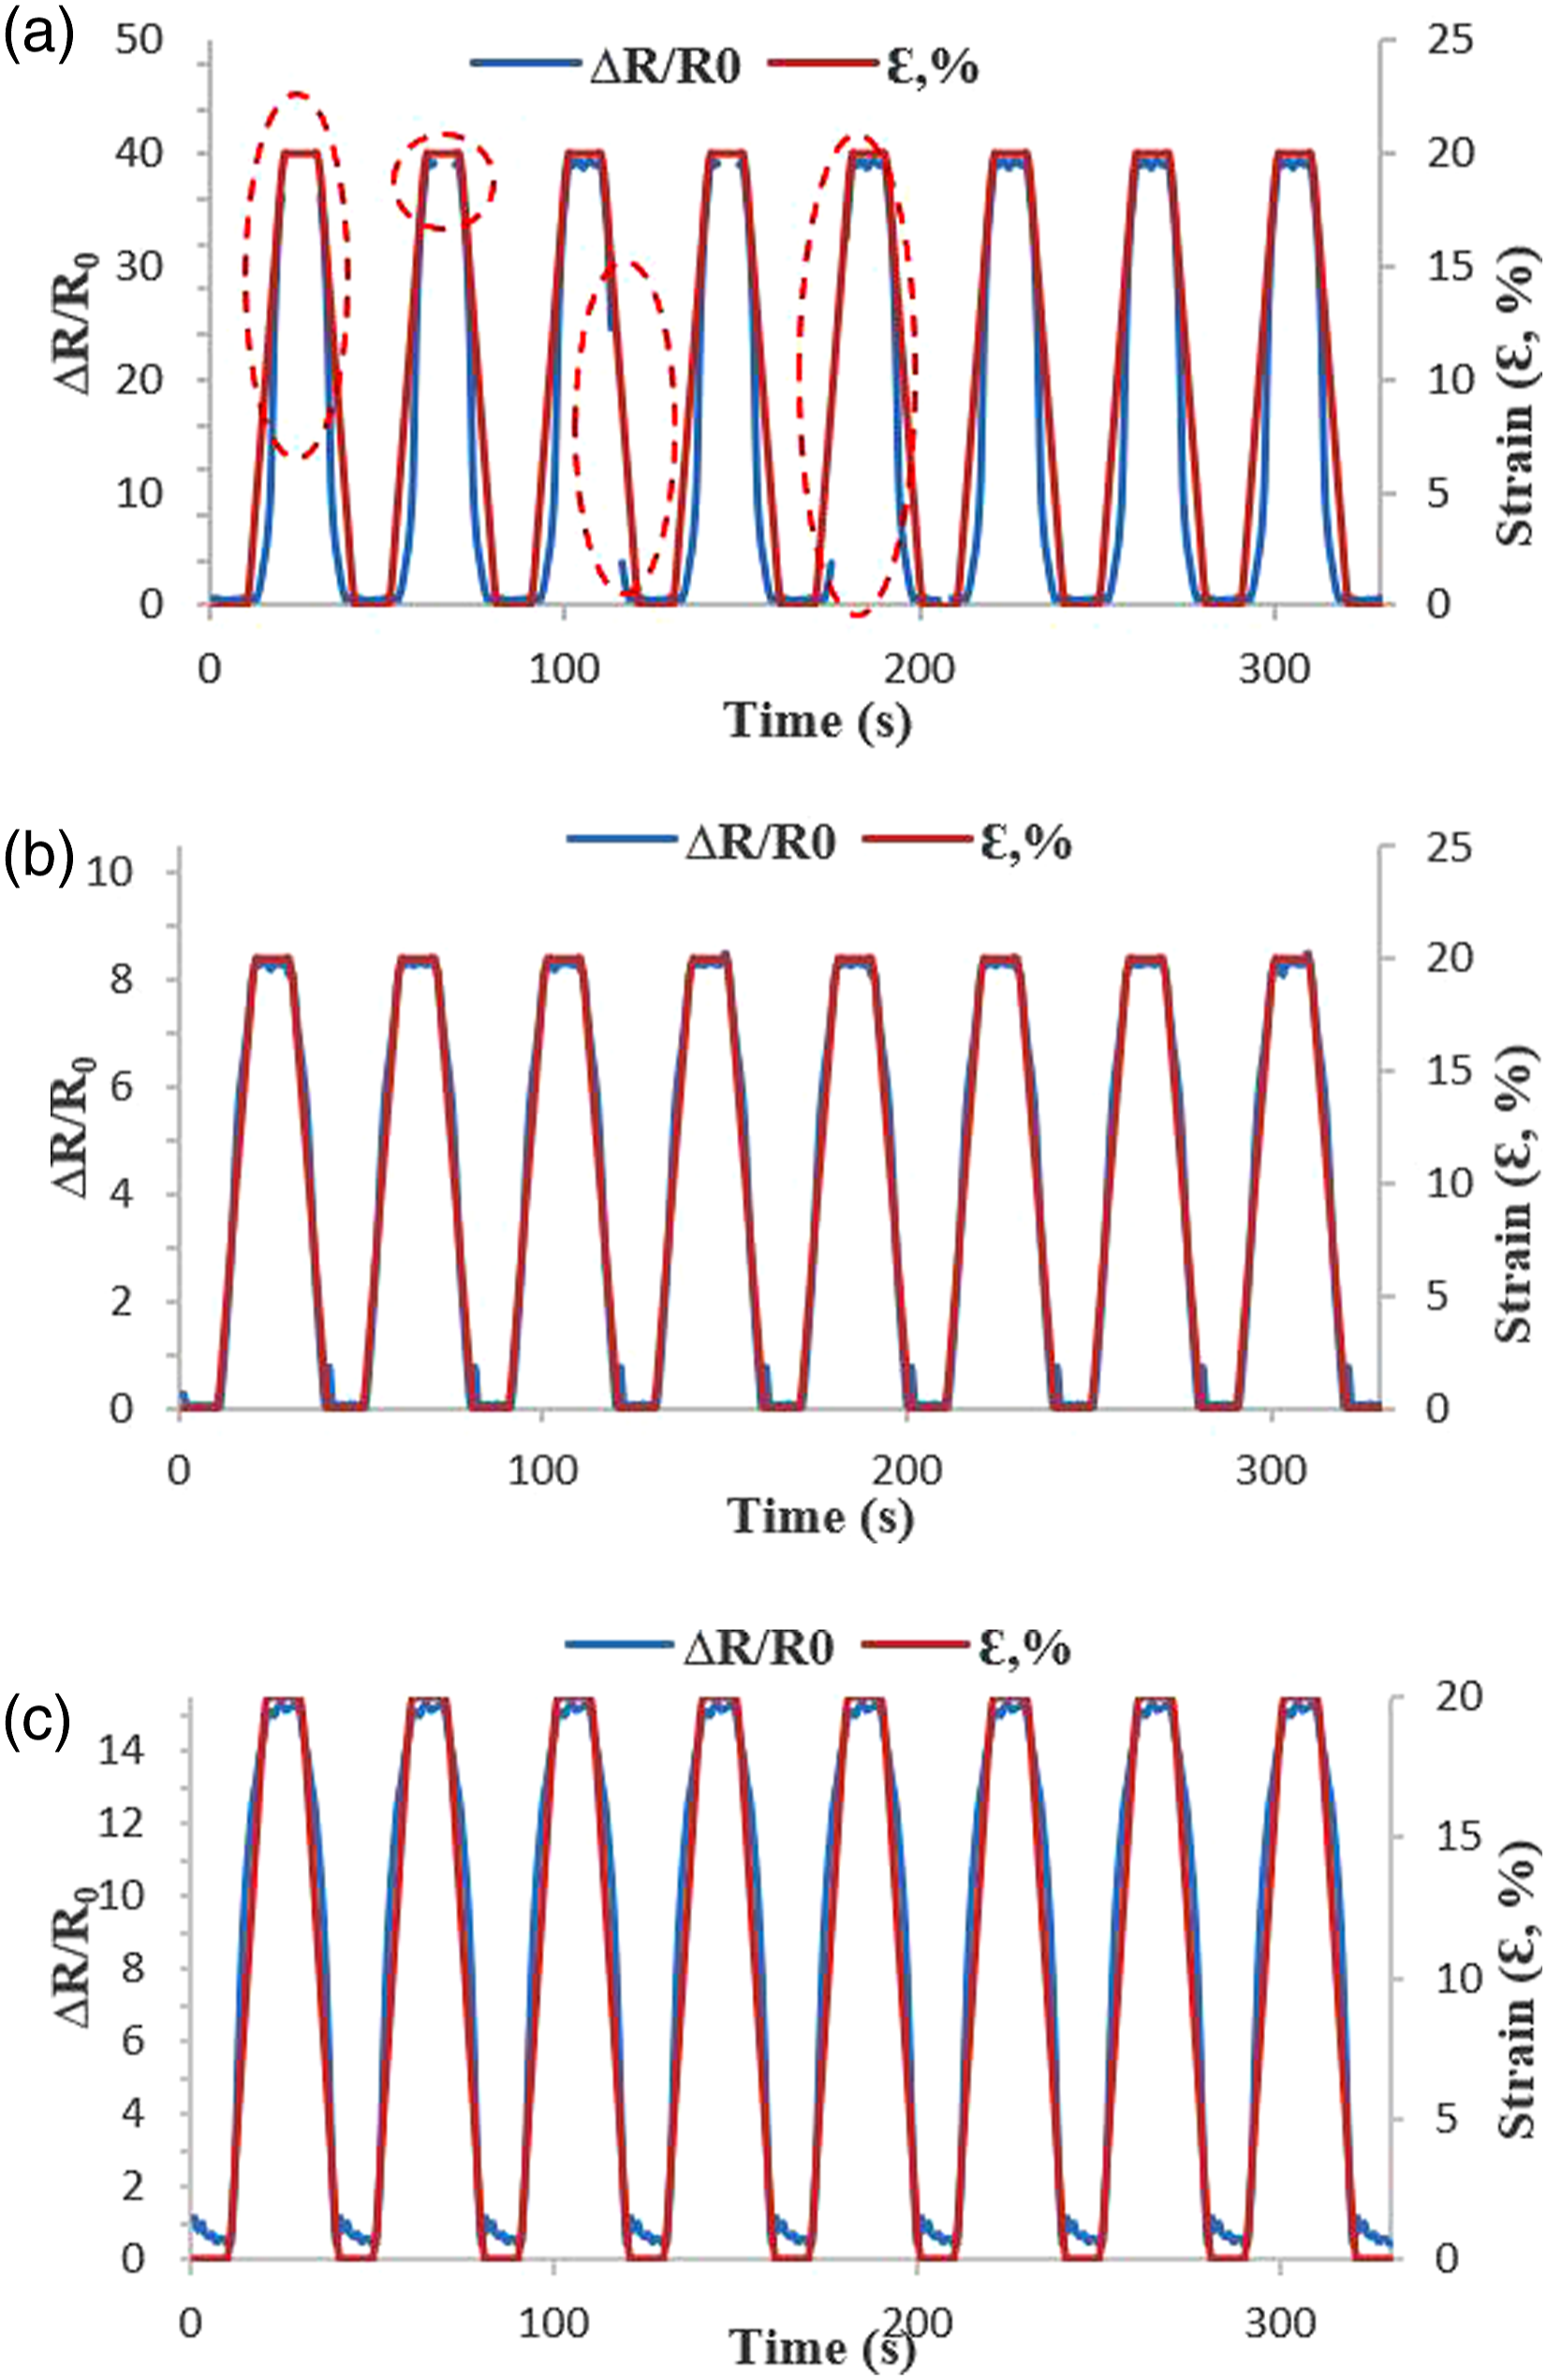
The resistance increased when tensile stress was applied and decreased under stress relaxation. The resistance values recorded before (first) and after the (last) loading-unloading cycle are different. The change in resistance depends on the magnitude of the applied strain. Excessive resistance increases were observed in HNGE01 and HNGE08 nanocomposites due to the increasing number of cycles. Generally, after a few cycles, the relative resistance change is less than the initial value. After several loading cycles, the infill materials are aligned according to the stretching direction. Thus, the effective number of conductive paths increases, resulting in higher conductivity. In addition, conductive paths can be significantly damaged during stretching, and a new temporary filler-filler network can be formed during dynamic loading and unloading.
Mechanisms of strain sensing properties
A strain sensor may detect unilateral stretching as a change in the cause of resistance by an extension or contraction; this motion alters the electron flow among a couple of electrodes connected to the electrometer during loading and unloading. The resistance variation is based on electron transfer changes in the conductive paths, developed by physical touching between filler materials in the matrix.16,33,34 When GE nanoplatelet filler material was added to the carbon black-filled main mixture, a synergistic conductive network was formed in the rubber matrix due to the contact of GE and CBs. Some gaps occur in the internal structure of the strain sensor depending on the load condition; some of these gaps narrow and contact during the elongation in the sample. Resistance changes were observed due to the elongation and contraction in the loading and unloading of HcNs. As a result of the stresses caused by loading, graphene nanoplatelets are separated from each other, matrix material, and CB fillers. Separation of the carbon black from the GEs and the rubber matrix results in smaller contact areas, larger gaps, and even higher contact stress, and thus, resistance changes were observed.
The internal resistance changes of flexible strain sensors can be understood by the behavior of transmission networks formed by the contact of conductive infill materials in the matrix, depending on the type of loading. The electrical resistance change tests of the developed HcNs have shown that a good conduction network is formed in high strain applications, and there is a strong interface interaction between the filling materials. As the amount of GE in HcNs increased, more points in contact with each other were seen in SEM micrographs due to their high aspect ratios and surface area. As a result, the electrical resistance variations of 4 and 8 phr GE nanoplatelet filled HcNs (titled HNGE04 and HNGE08, respectively) showed more significant changes than 1 phr GE nanoplatelet filled HcNs (termed HNGE01). In cyclic loading, the HcN sample moves backward after elongation and returns to its original position. Depending on the cyclic loading applied to HcNs, the conductive filler particles in the matrix find a suitable place for them and stabilize the variable resistance behavior in the strain sensor over time. Therefore, cyclic strain sensor performance exhibited excellent repeatability. As the strain value increases, the activation of the filler materials in the rubber matrix is observed in the resistance measurements. When applied to a 5% strain, the resistance change formed a sharp shape, just like a triangle. Also, transient resistance changes, called the plateau effect, were obtained in 10%, 15%, and 20% strain applications. The structure and plateau effect formed by the change in resistance depending on the strain values are shown in Figure 11. Change of resistance transitions depending on strain values (a) resistance change behavior at 5% strain, without crack for HNGE04 (b) resistance change behavior at 20% strain, without crack for HNGE04.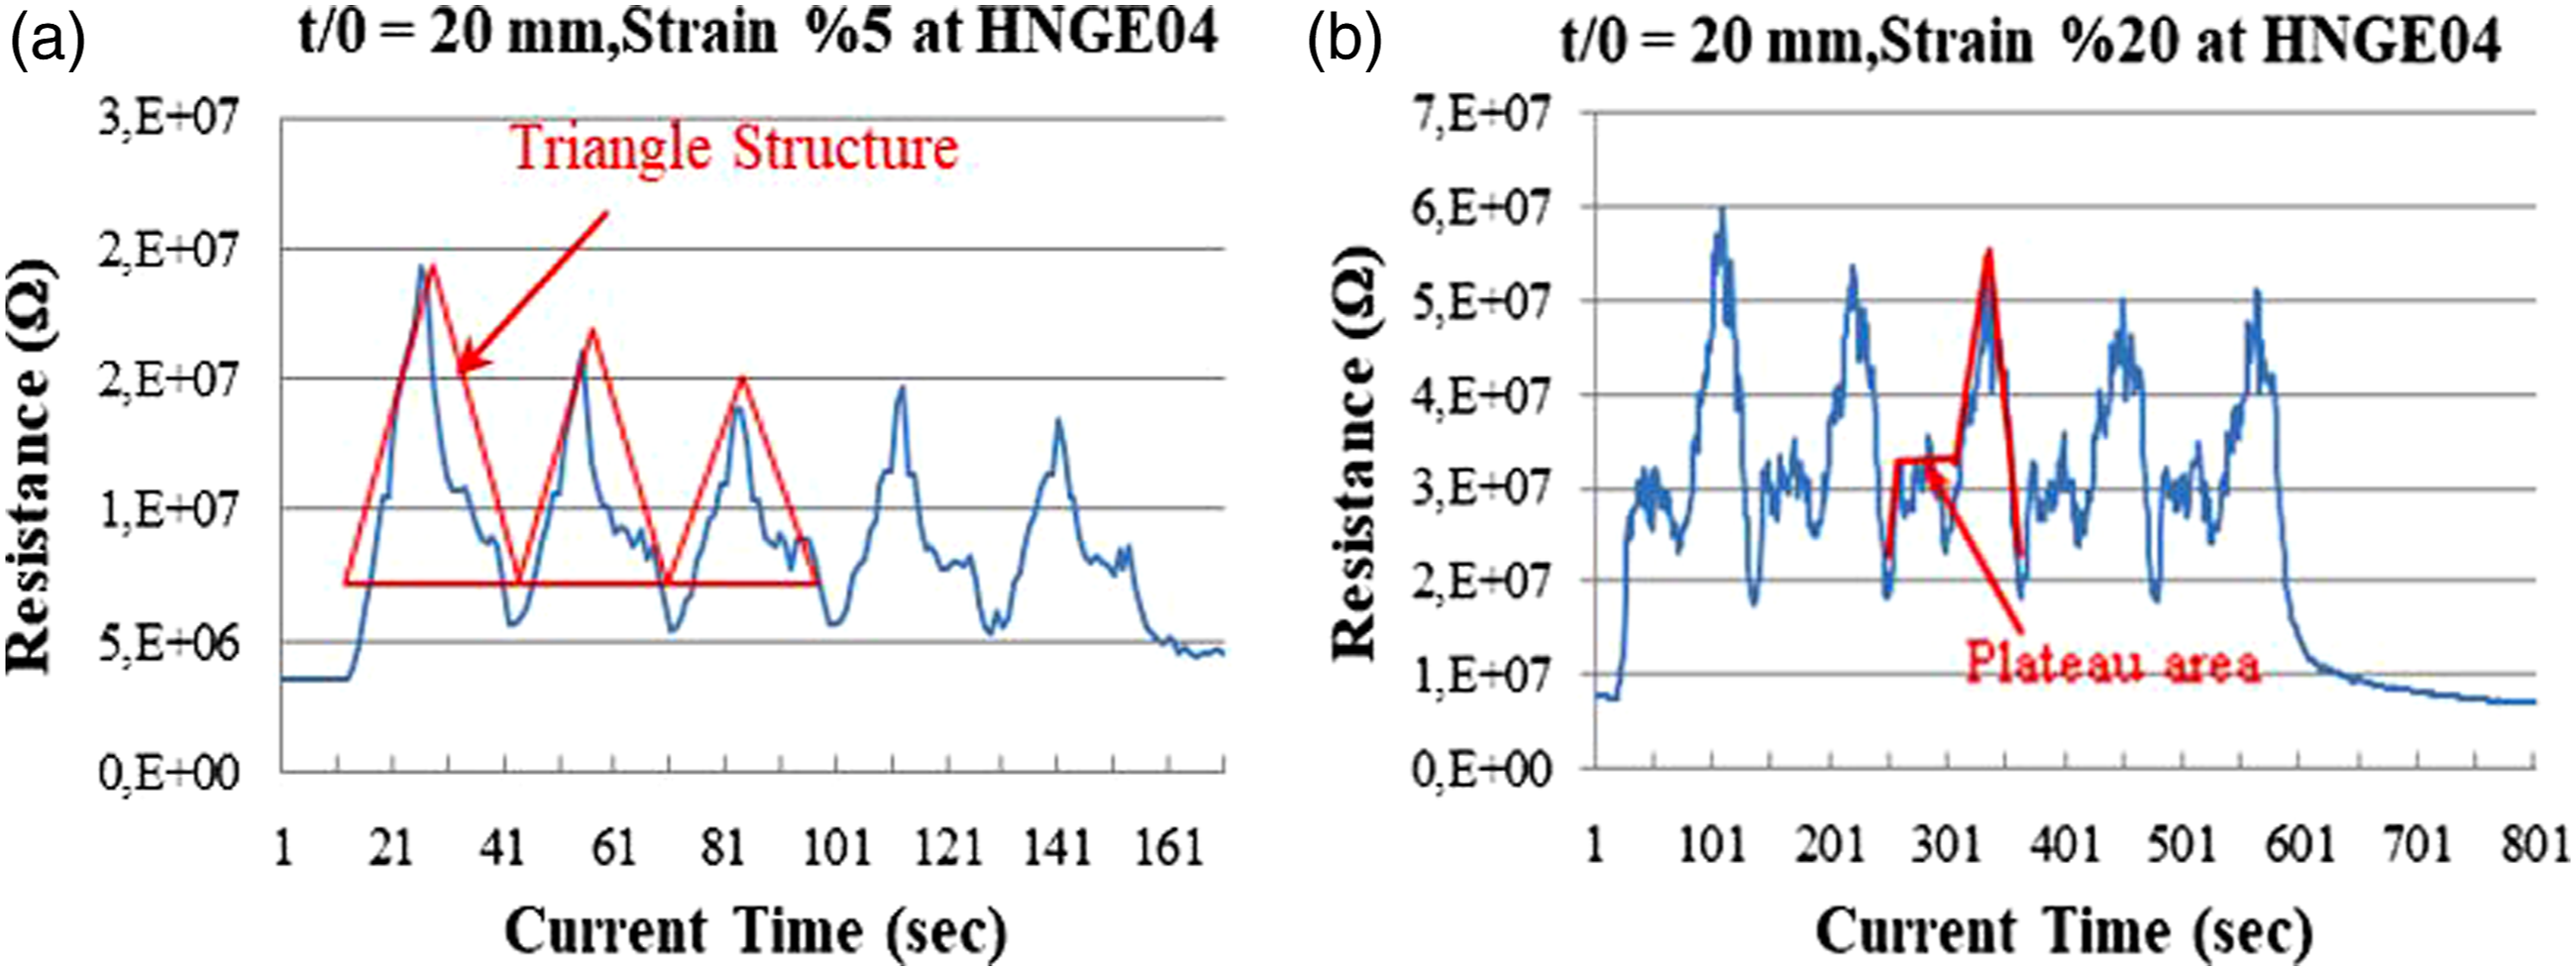
After a 5% strain value in each sample type, the resistance changes' structure is irregular and complicated. At 10%, 15%, and 20% strain values, fluctuations due to resistance changes and increases were observed due to the more significant mobilization of GE and CB fillings in the nanocomposite material. In comparison, there are a cleaner and smoother measurement in the 5% strain. Figure 12 shows the schematic representation of the cyclic loading test applied to the samples, elongation, and contraction conditions. Schematic representation of strain-induced elongation and contraction: Strain values at elongation: 0% (0, initial position), 4.8% (1), 10.6% (2), 18.6% (3), 20% (4) mm and Strain values at contraction: 15.9% (5), 6.4% (6), 2.7% (7), 0% (8, initial position).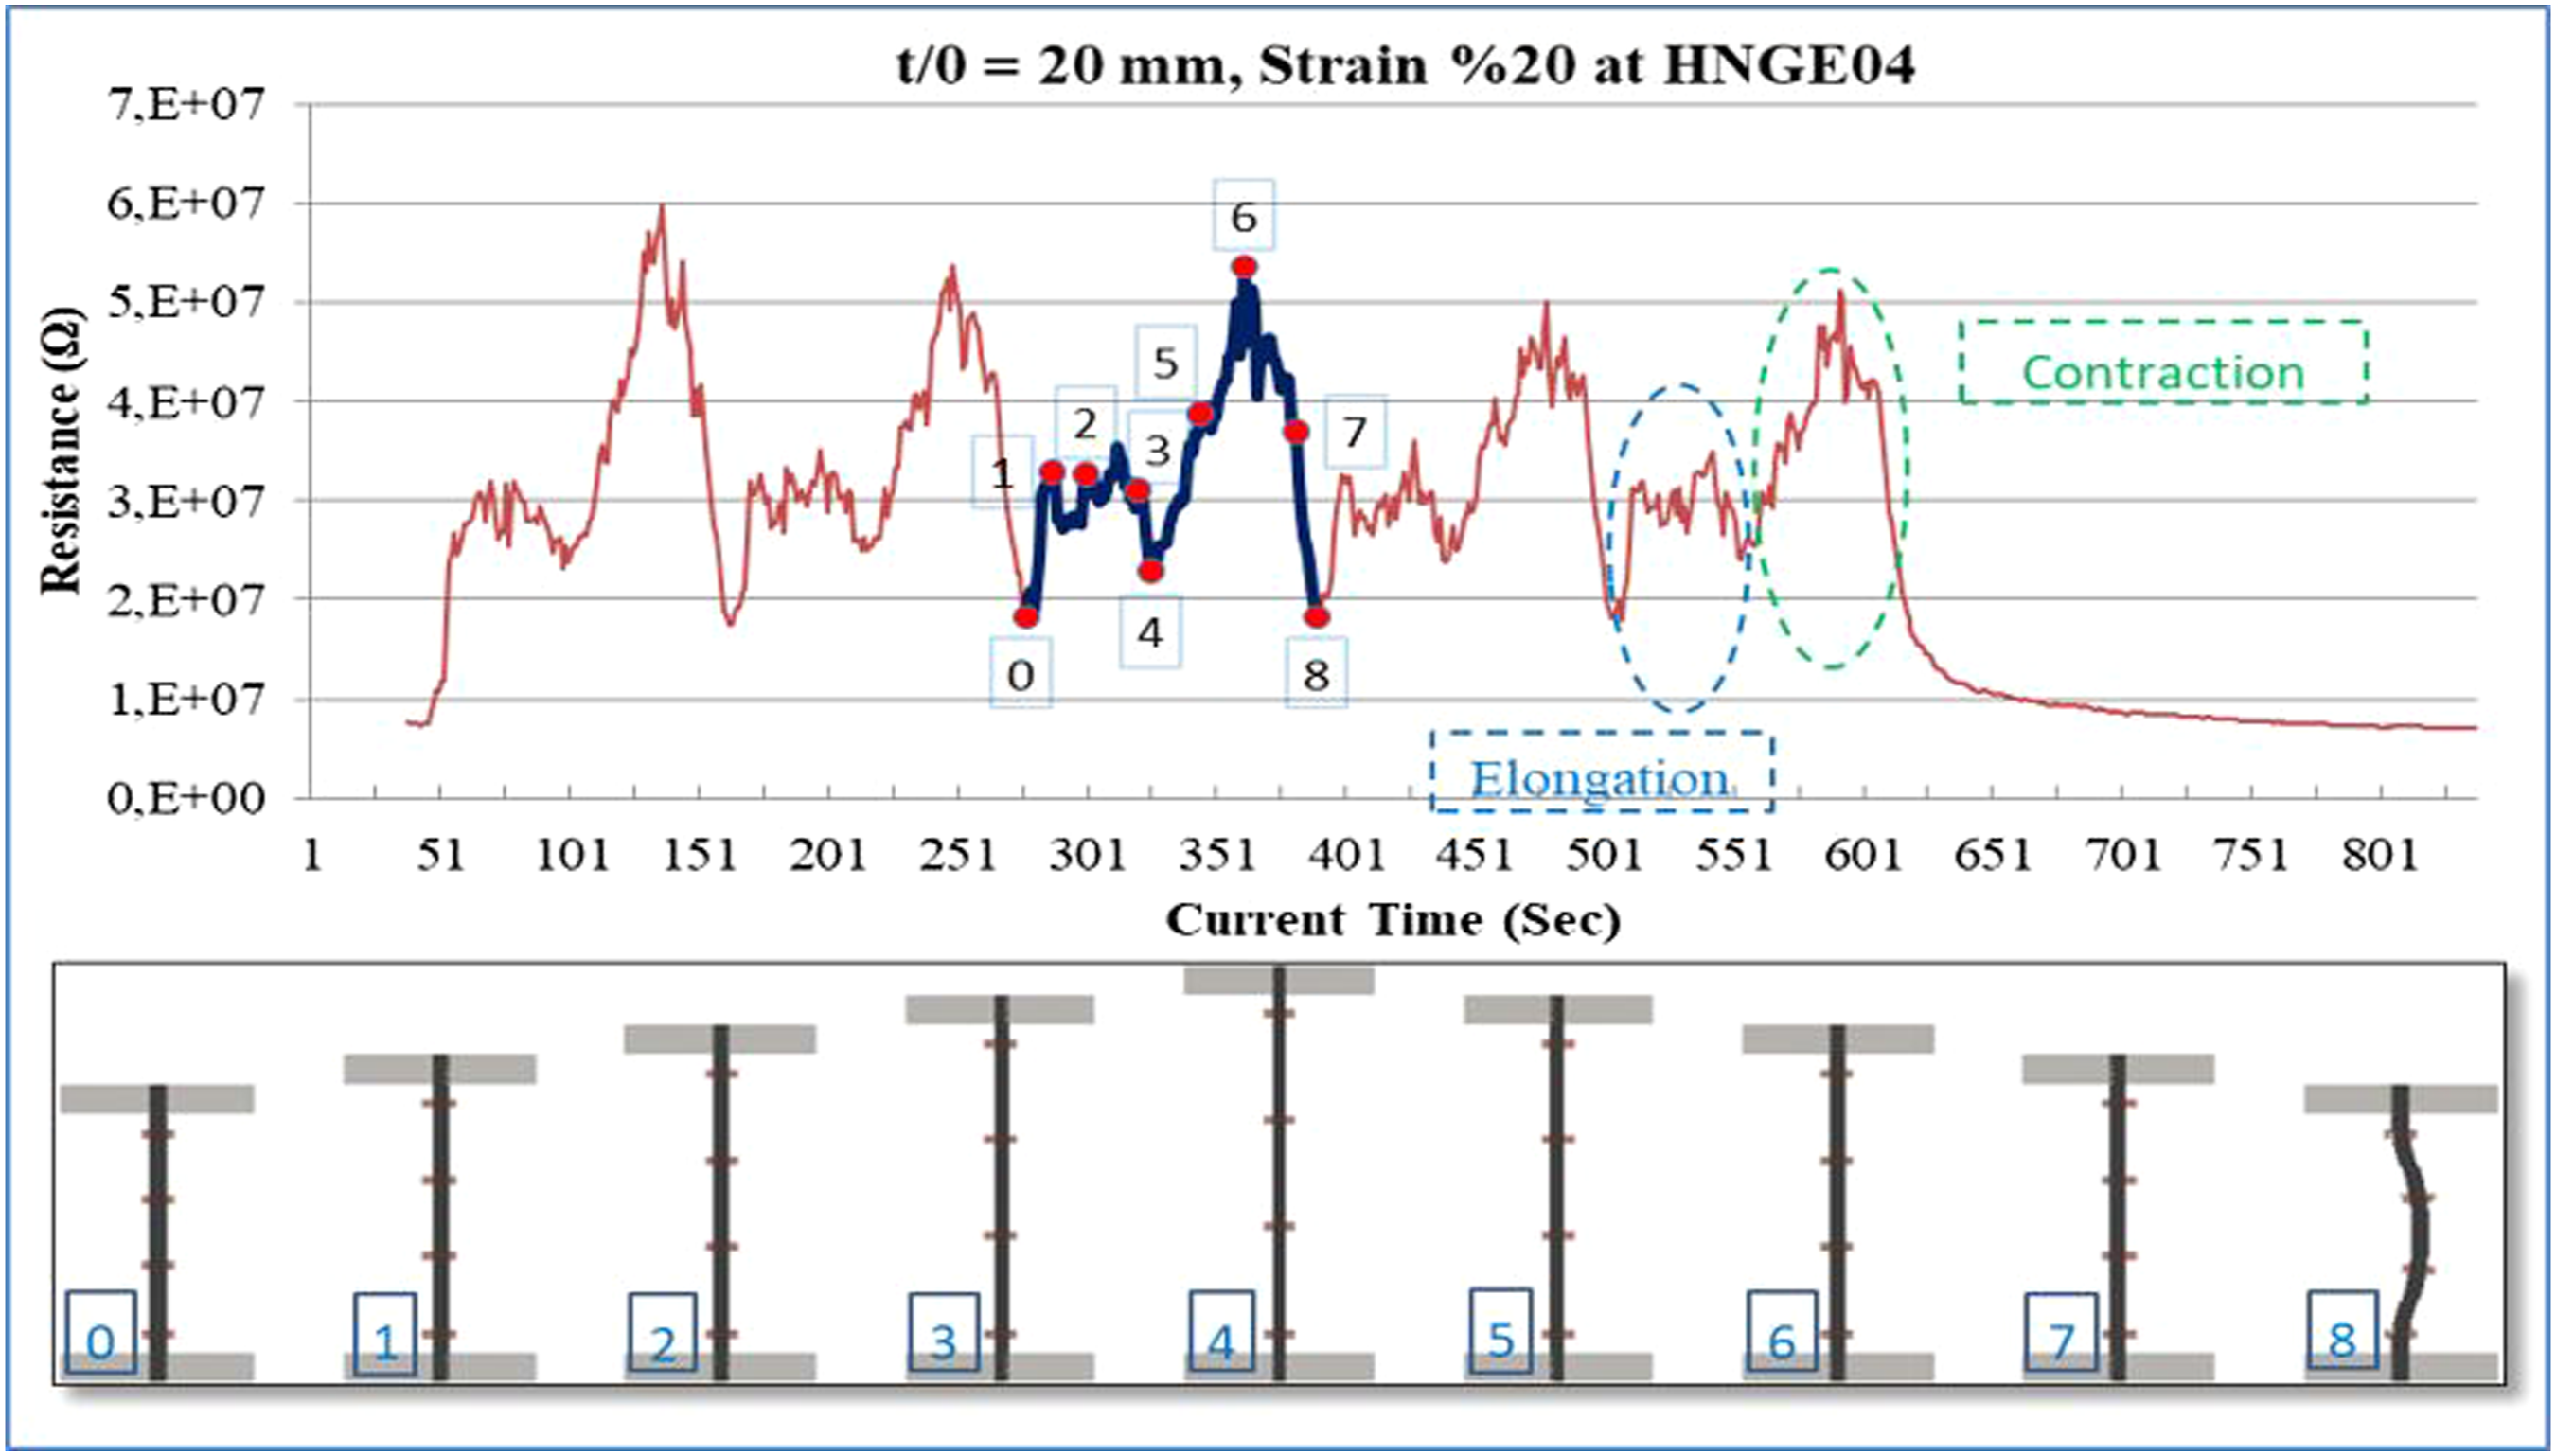
In resistivity measurement experiments, a general tendency was significant resistance increases after 5% strain regardless of crack size. The main reason for this resistance increase is the mobilization of CB and GE fillers dispersed in the matrix, depending on the applied strain and their interactions. The resistance changes in elongation zone 1–4 after applying the strain is less than 4–8, the contraction zone. The reason for this situation is illustrated schematically in Figure 13. Initially, the GE nanoplatelets and CB filler materials in the rubber matrix are interacting with each other. The GE nanoplatelets and CBs in the rubber nanocomposite were randomly distributed, forming a conductive network by interfacing with each other and the rubber matrix. This is shown in Figure 13(a). After the elongation starts, the distances between the filling materials start to increase at varying rates. This distance is directly related to the distribution pattern and filler quantities. Arrows indicate the spaces between GE, CB fillers, and rubber matrix in Figure 13(b). The resistance is also reduced due to the material thickness during elongation. Moreover, in Figure 12, the resistance change measured at 0 (at the initial position) and the resistance change measured at position 4 (at 20% strain) are close to each other. The measured resistance differences at points 0 and four were the results of the filler materials' movement in the rubber matrix. On the other hand, the rubber matrix that enters between the conductive nanofiller materials during the return causes the resistance to reach the highest point. This is shown in Figure 13(c) as residual rubber. Demonstration of the interaction of fillers and matrix during elongation and contraction, (a) borders, (b) Separation between GEs and CBs filler materials at elongation, (c) Resistance increase due to residual rubber. SEM images were taken after applying strain.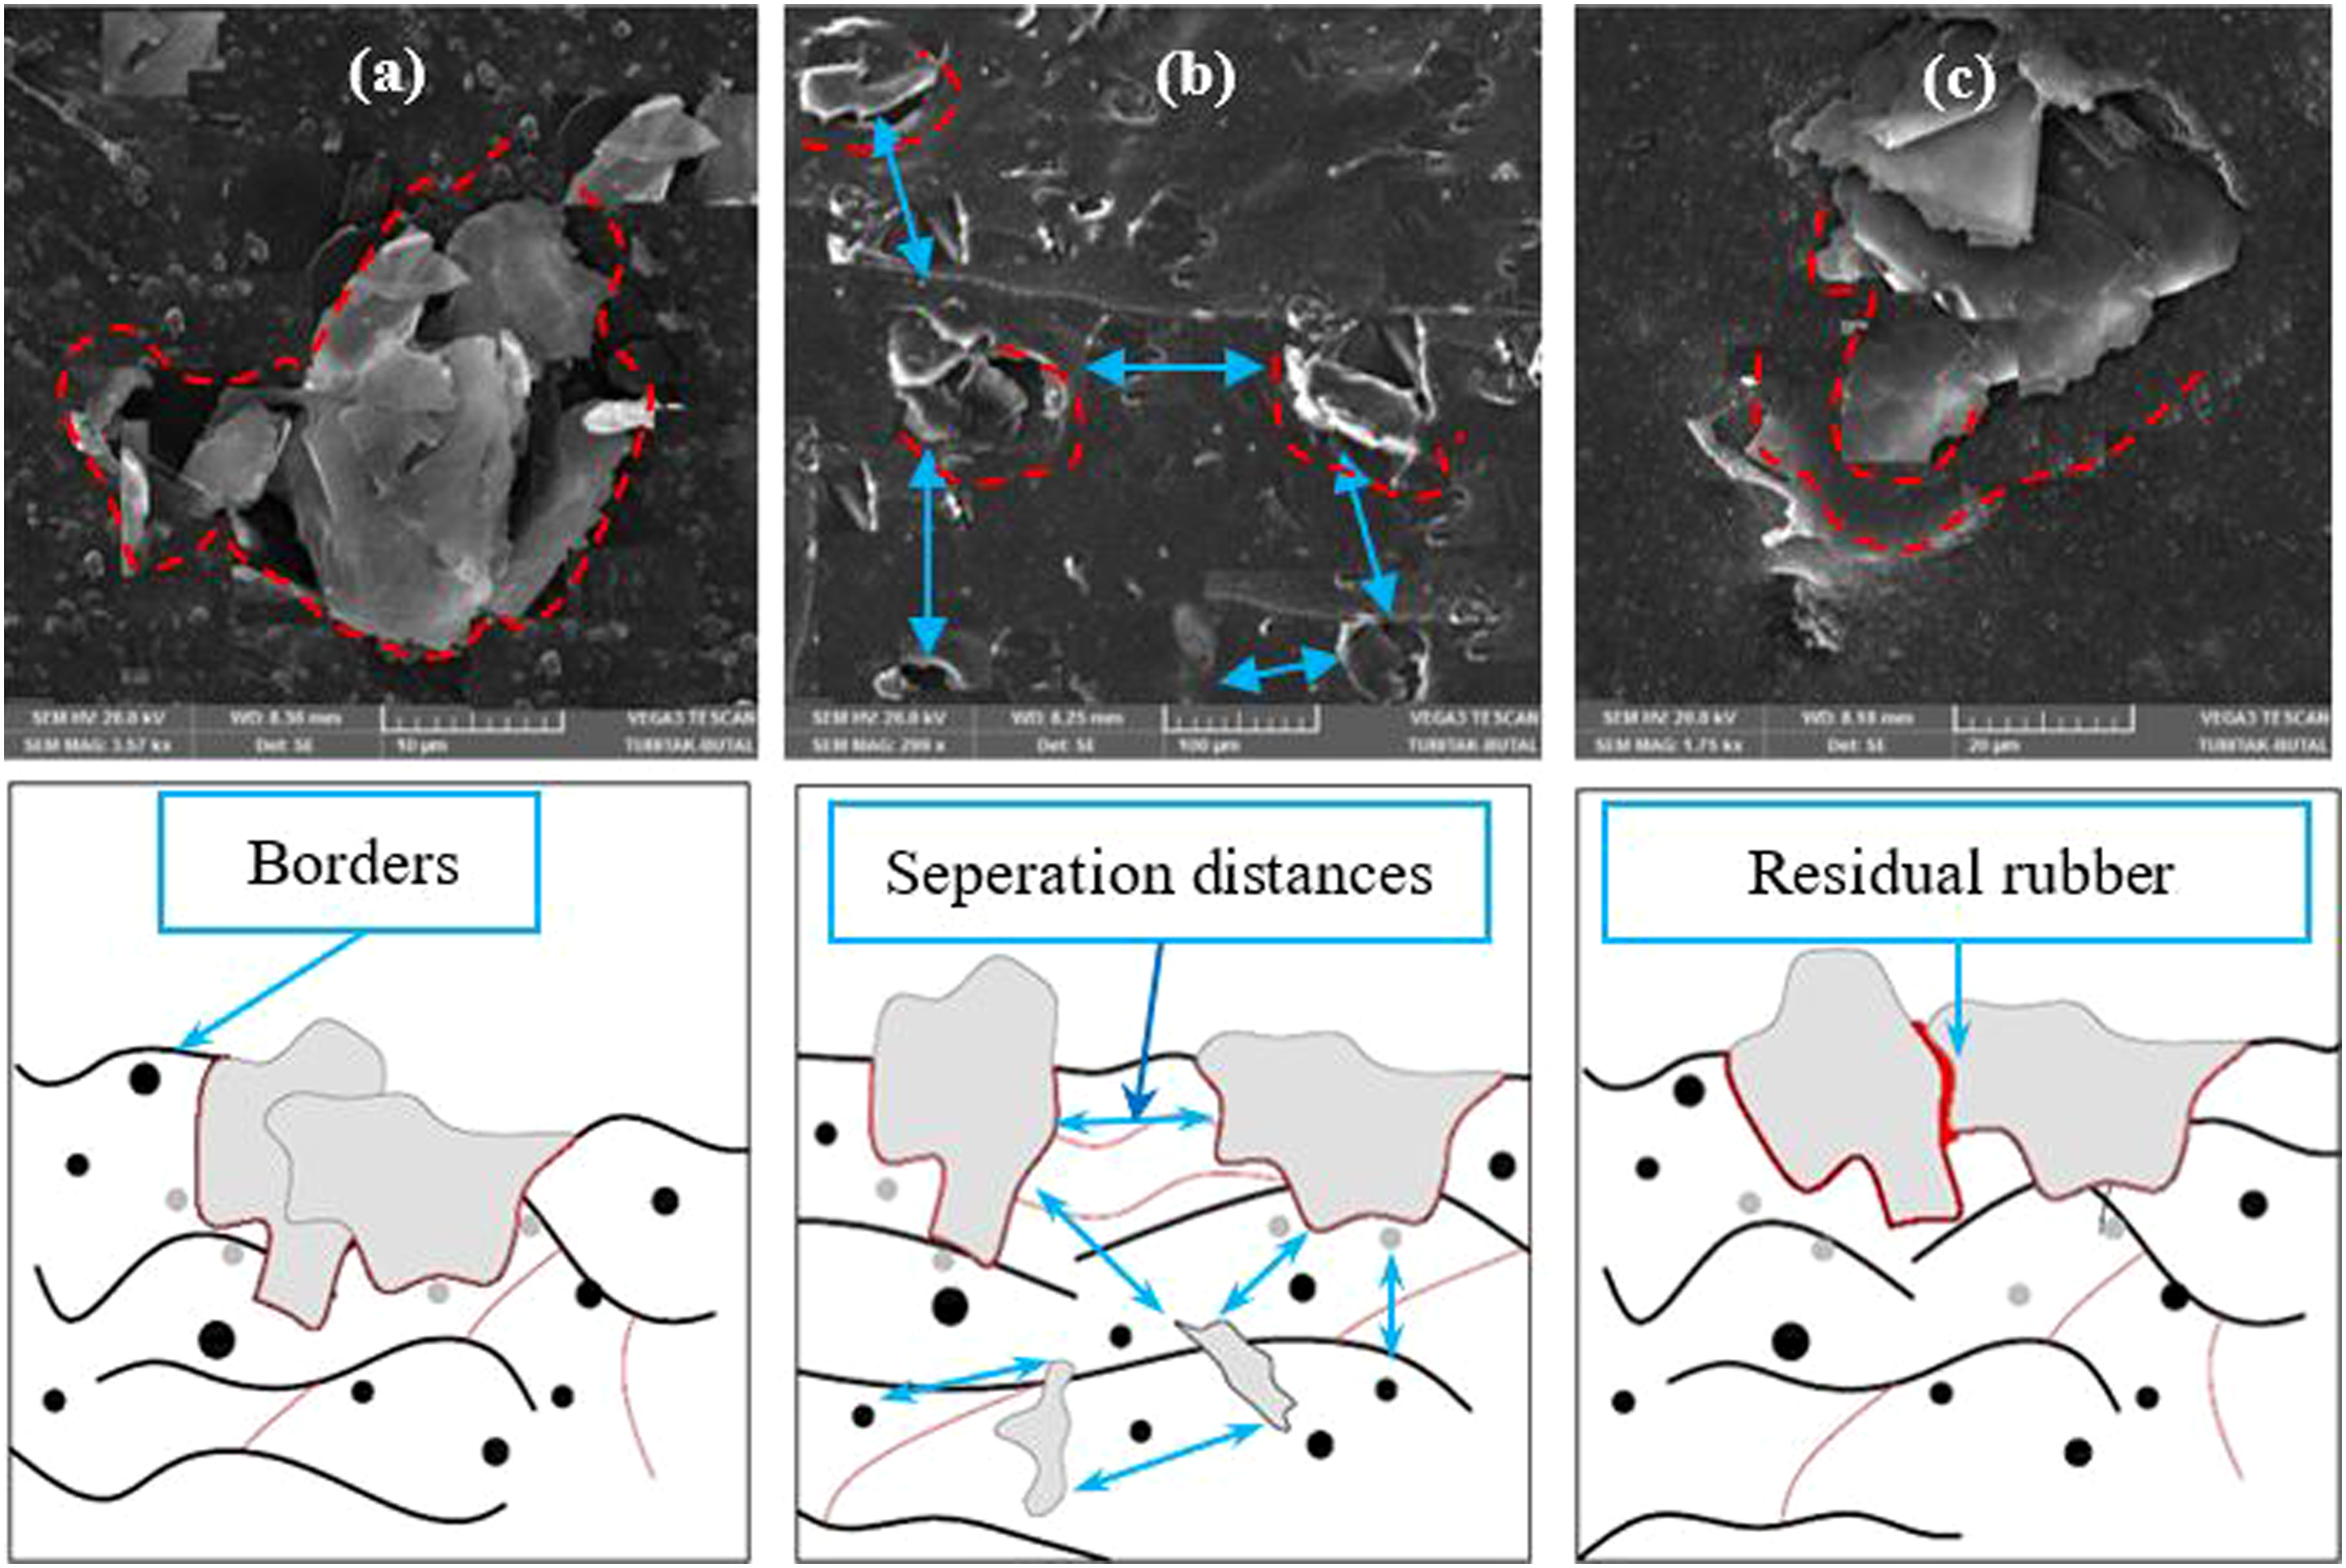
The resistance increase during return was determined due to the hybrid composite’s low filler content35,36 (7 phr CB and 1 phr GE termed HNGE01) due to the excess rubber matrix. Even when the strain values for this material (HNGE01) went up to 5%, sometimes remarkably high resistance measurements were taken, and the material showed an insulator character.
Crack detection and electromechanical response
The electrical conductivity experiments of rubber samples based on GE/CB hybrid were carried out through resistance profiles for unstretched samples, static tests, and periodic strain tests. (1 phr, 4 phr, and 8 phr). To further examine the cyclic strain sensing performance, the electromechanical properties of the flexible and stretchable HcNs nanocomposite samples were investigated through measurement of the resistance at different strain values and different crack dimensions, as illustrated in Figure 14. Demonstration of the measurement of the resistance at different strain values and different crack dimensions.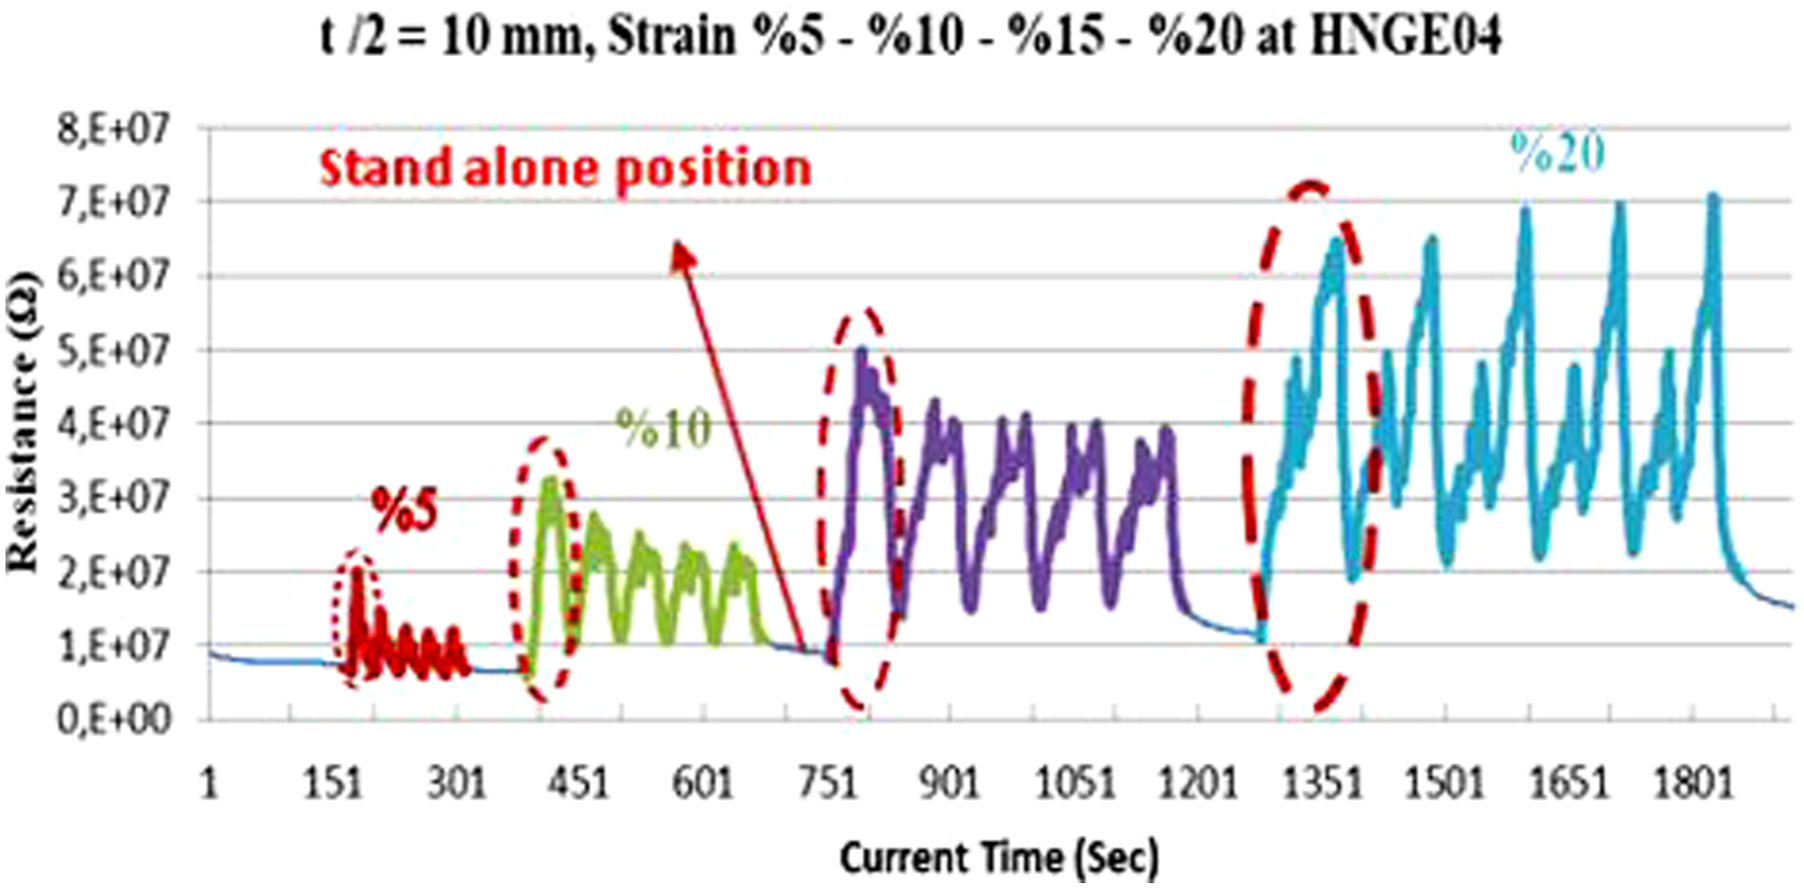
The electrical resistance curves were detailly investigated under cyclic strain loading at different filler contents and different crack dimensions by applying four different strains 5%, 10%, 15%, and 20%. The specimens were allowed to stand in initial positions for a minimum of 2 min between each of the subjected strains. At this time, the measurement was continued, after which strain was subjected. In the first loading cycle, the resistance increases sharply and is then balanced in successive cycles. After forming new chains, it contributed to the breaking of chains after the first loading cycle. Also, resistance values are stabilized in continuous cycles by ensuring equilibrium in the loading-unloading cycles. Figure 14 shows resistance profiles under cyclic strain during the addition of 4 phr. Compared to other samples, HNG04 samples have the least resistance values in all cycles and all crack dimensions. This is due to the homogeneous mixture attributed to the small range between adjacent GE and CB hybrid particles.
37
This resulted in lower resistance values than the other samples containing the same filler. The difference in the resistance profiles of the rubber samples was examined by enhancing the filler content from 1 to 8 phr (Figure 15). The resistance has a nearly linear appearance at low and high strain amplitude due to crack lengths. Very high resistance values such as 1037 Ohm were obtained in the electrical resistance measurement tests made with CB/NR nanocomposite called NCBR00. So, NCBR00 was not considered in the comparison due to behaving like an insulator. The HNGE01 mixture has intermittent resistance values read after 5% strain regardless of the crack lengths. This behavior can be caused by the fact that GE nanofillers cannot be recovered too much, and the rubber interface is formed between the filler materials after the discharge cycle. Stress relaxation and incomplete recovery after the discharge cycle was also observed for HNGE01 nanocomposites. Stress relaxation is also called the Mullins effect in HcNs and is caused by the separation of polymer chains from the filler surfaces.38,39 Electrical resistance measurement results of produced HcNs under constant strain loads according to crack lengths, (a) without crack, (b) crack 2.5 mm-t8, (c) crack 5 mm-t4, (d) crack 10 mm-t2.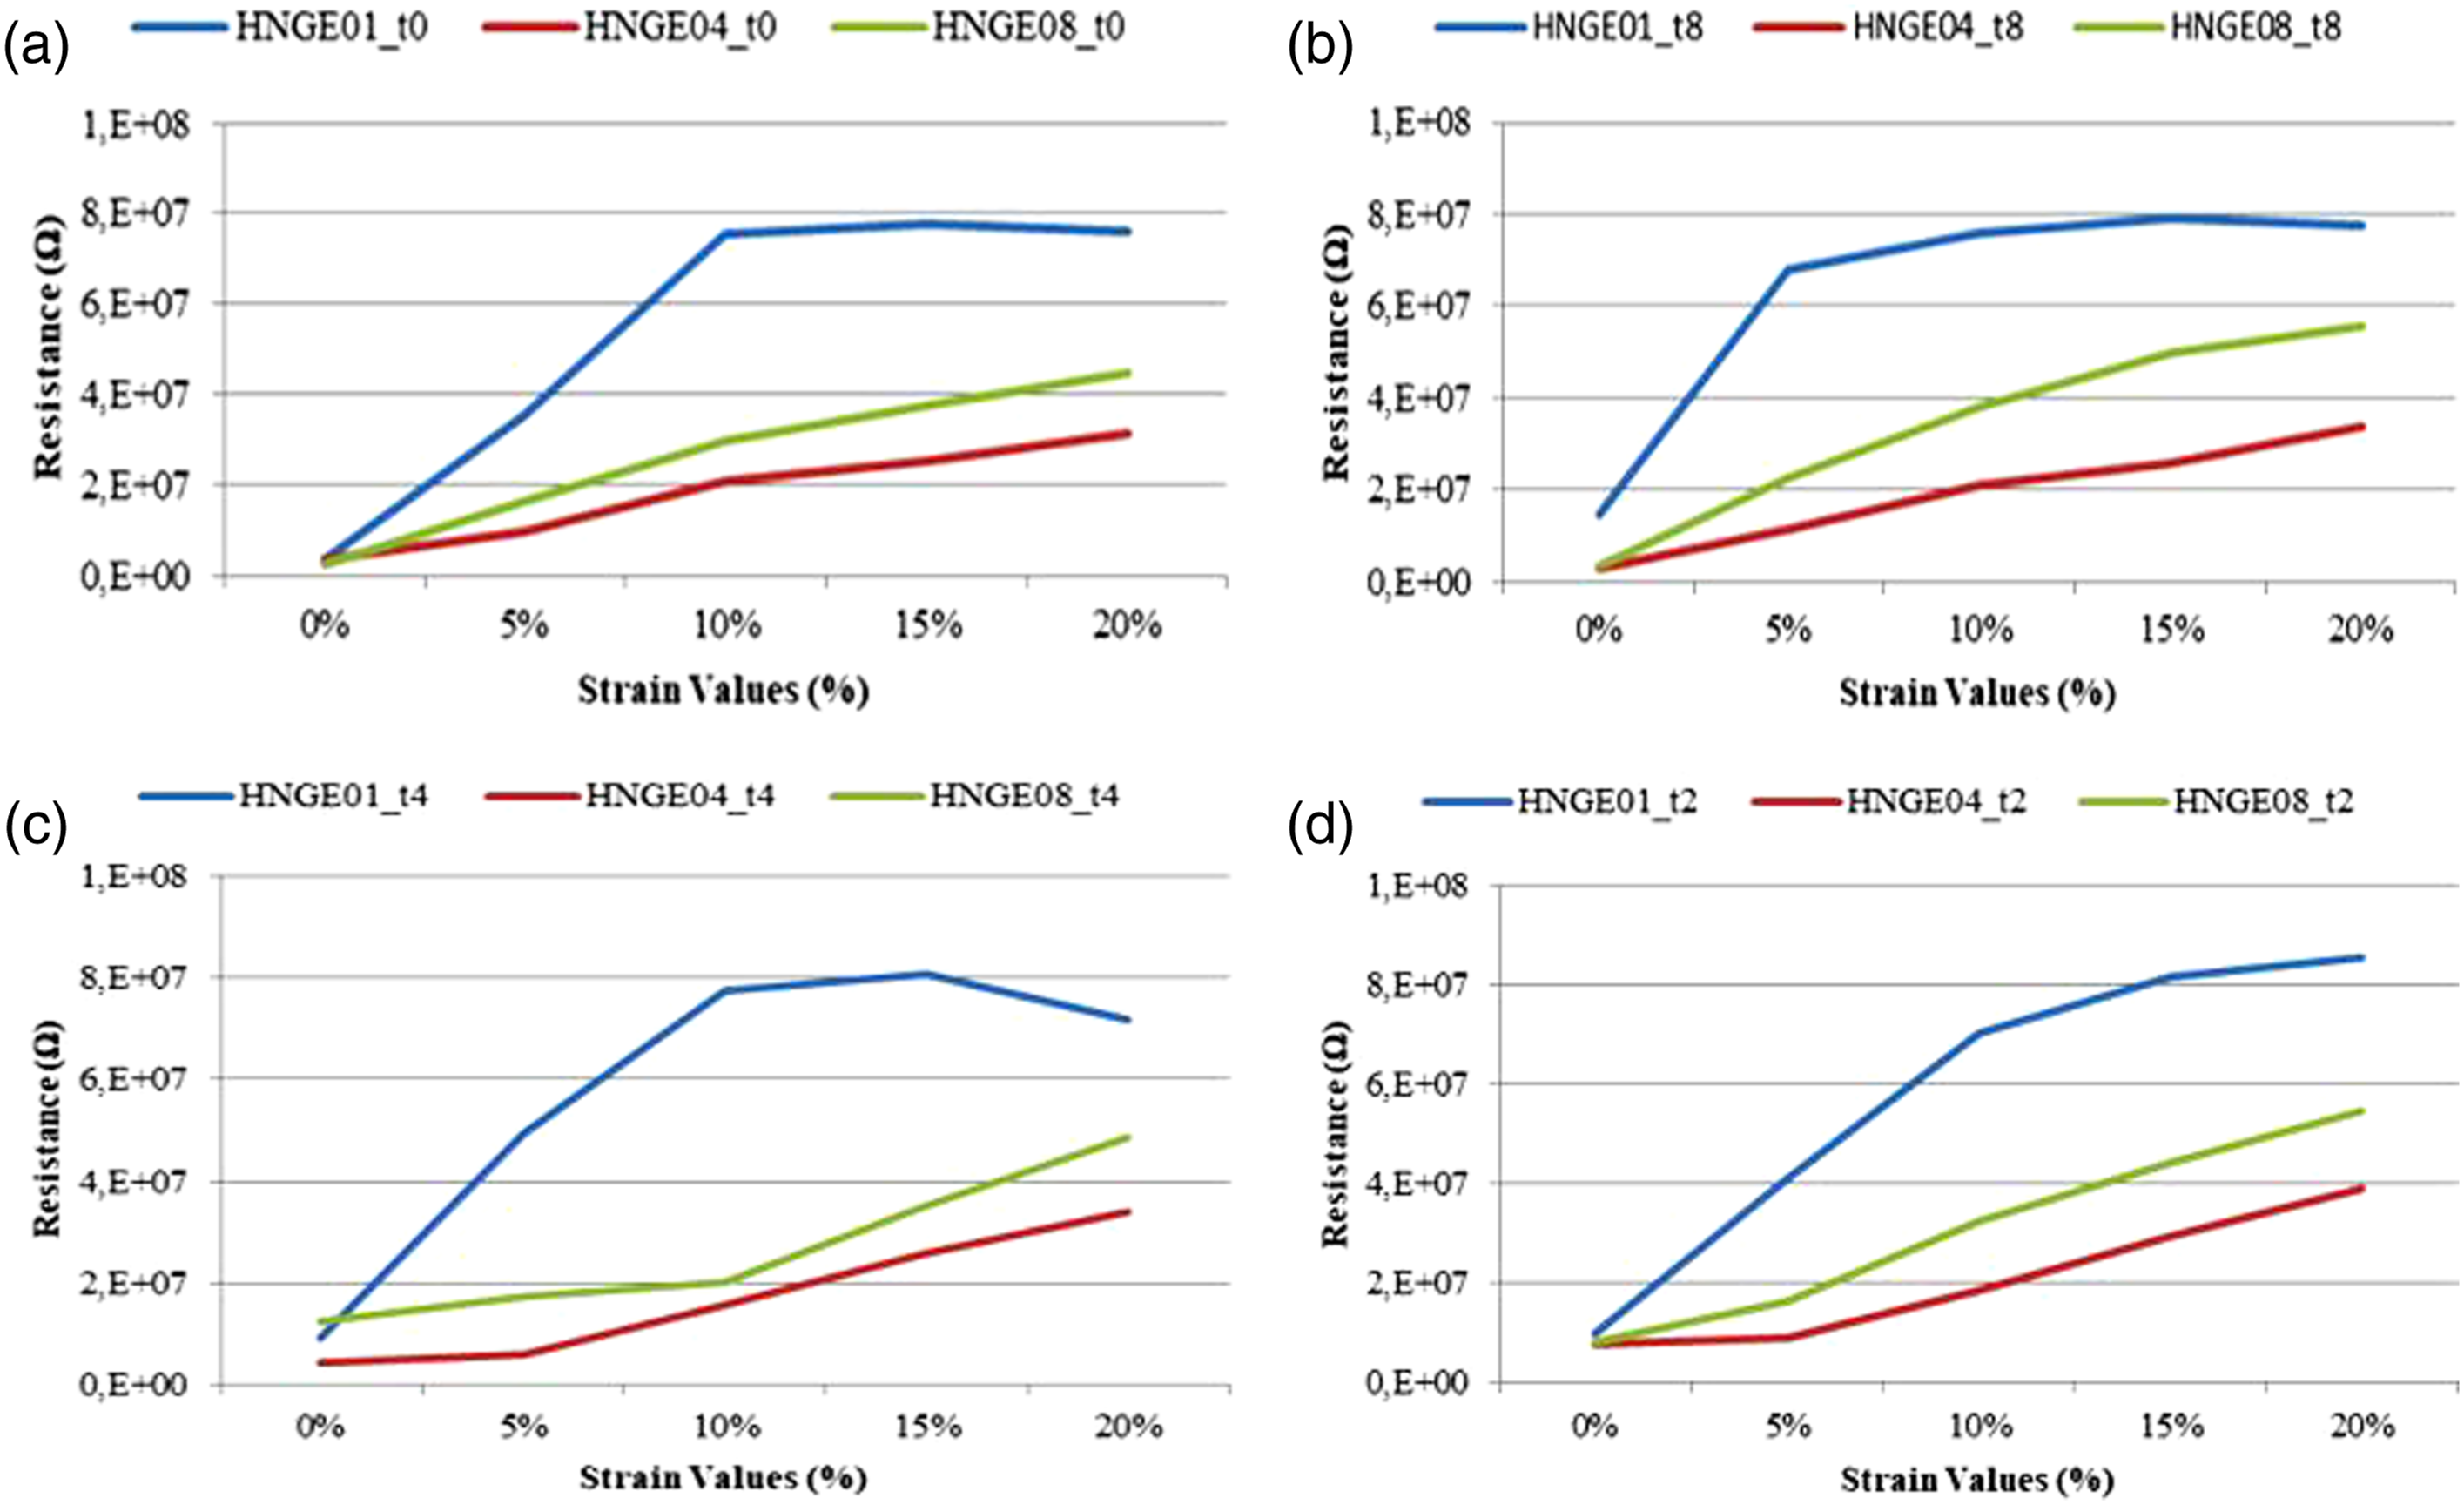
The resistance increases with insufficient filler loading because of the rupture of conductive parts of filler networks. Electrons increase the resistivity in the polymer matrix and do not flow through the system. For HNGE01 nanocomposites, Figure 16 shows the resistance behavior at 0 and 5 mm crack dimensions with 1 phr GEs for a cyclic strain sensing performance. Resistance behavior of HNGE01 sample at (a) without crack-0 mm, (b) 5 mm crack size.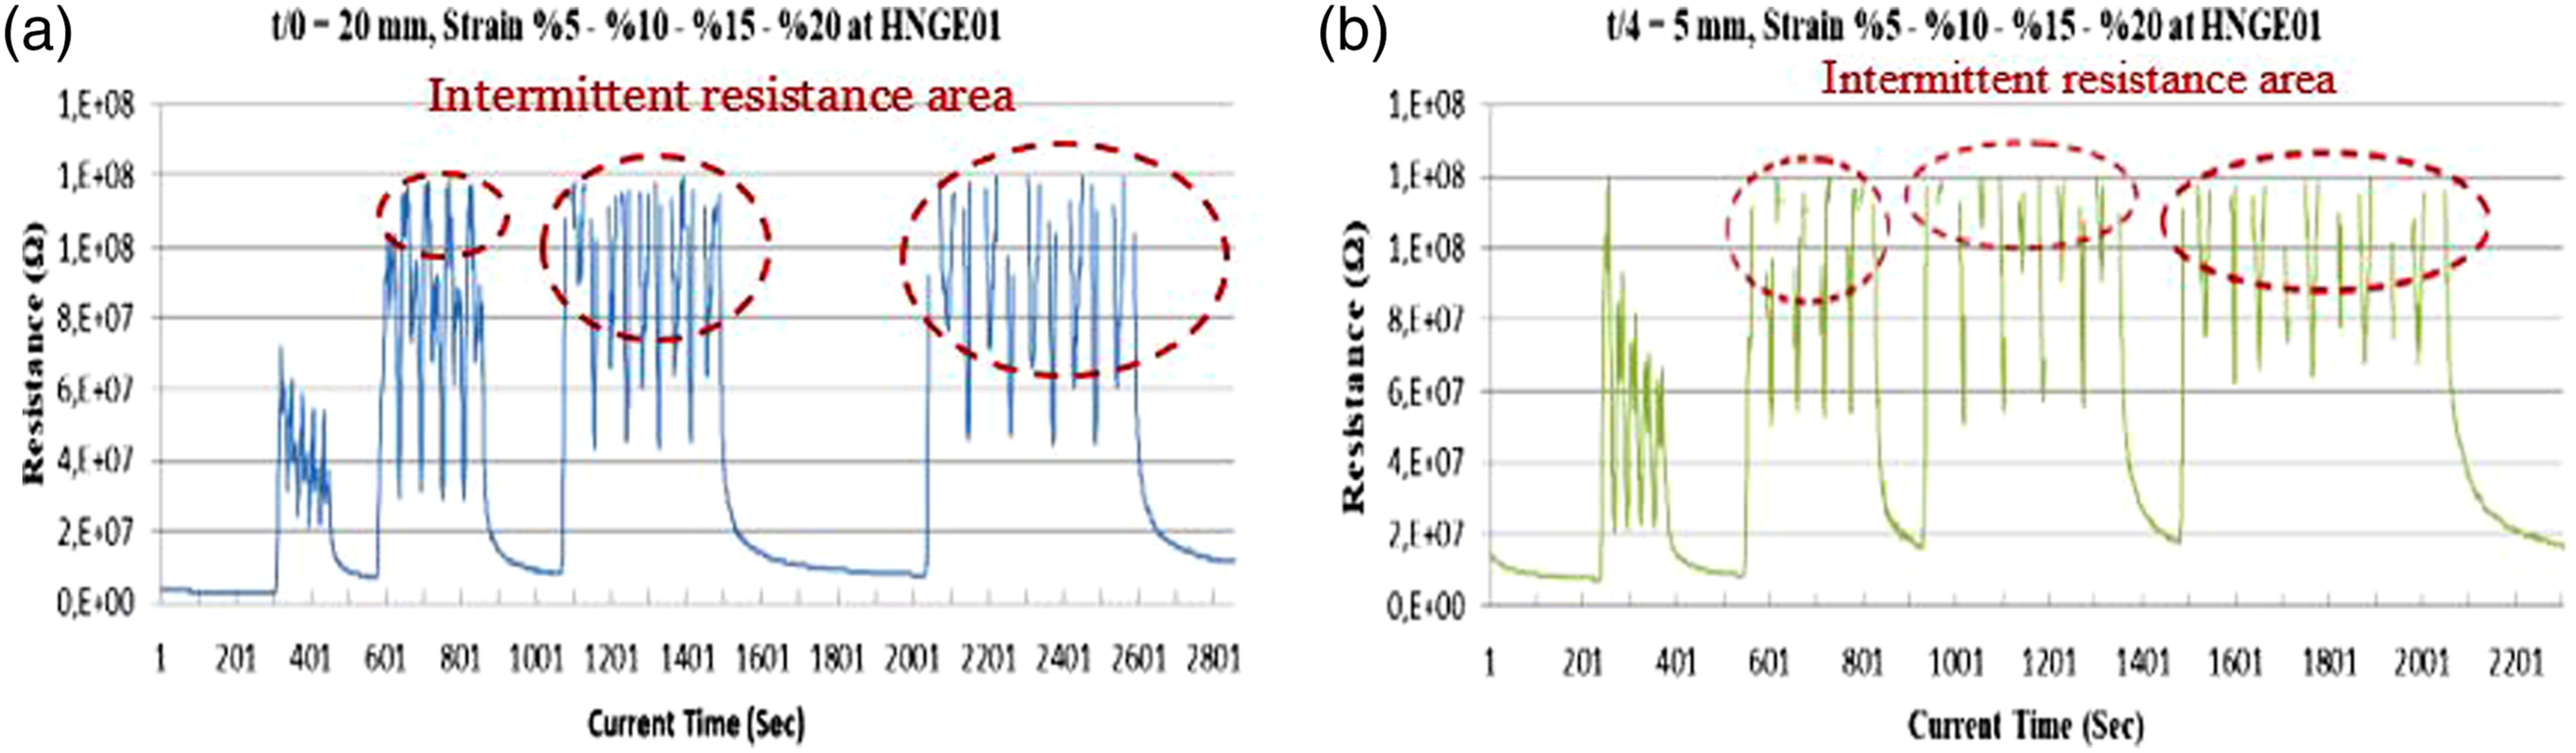
The increase and decrease in average resistance changes depending on the applied strain value are shown in the graphs in Figure 17(a), (b), and (c). As shown in Figure 17(a), the resistance changes obtained after the 5% strain show that they are very close to each other without being attached to the crack length. The addition of 1 phr GE nanoplatelets does not supply the origination of any continuous conductive networks in the CB-filled rubber matrix. The resistance changes due to crack length in (a) HNGE01, (b) HNGE04, and (c) HNGE08 nanocomposites.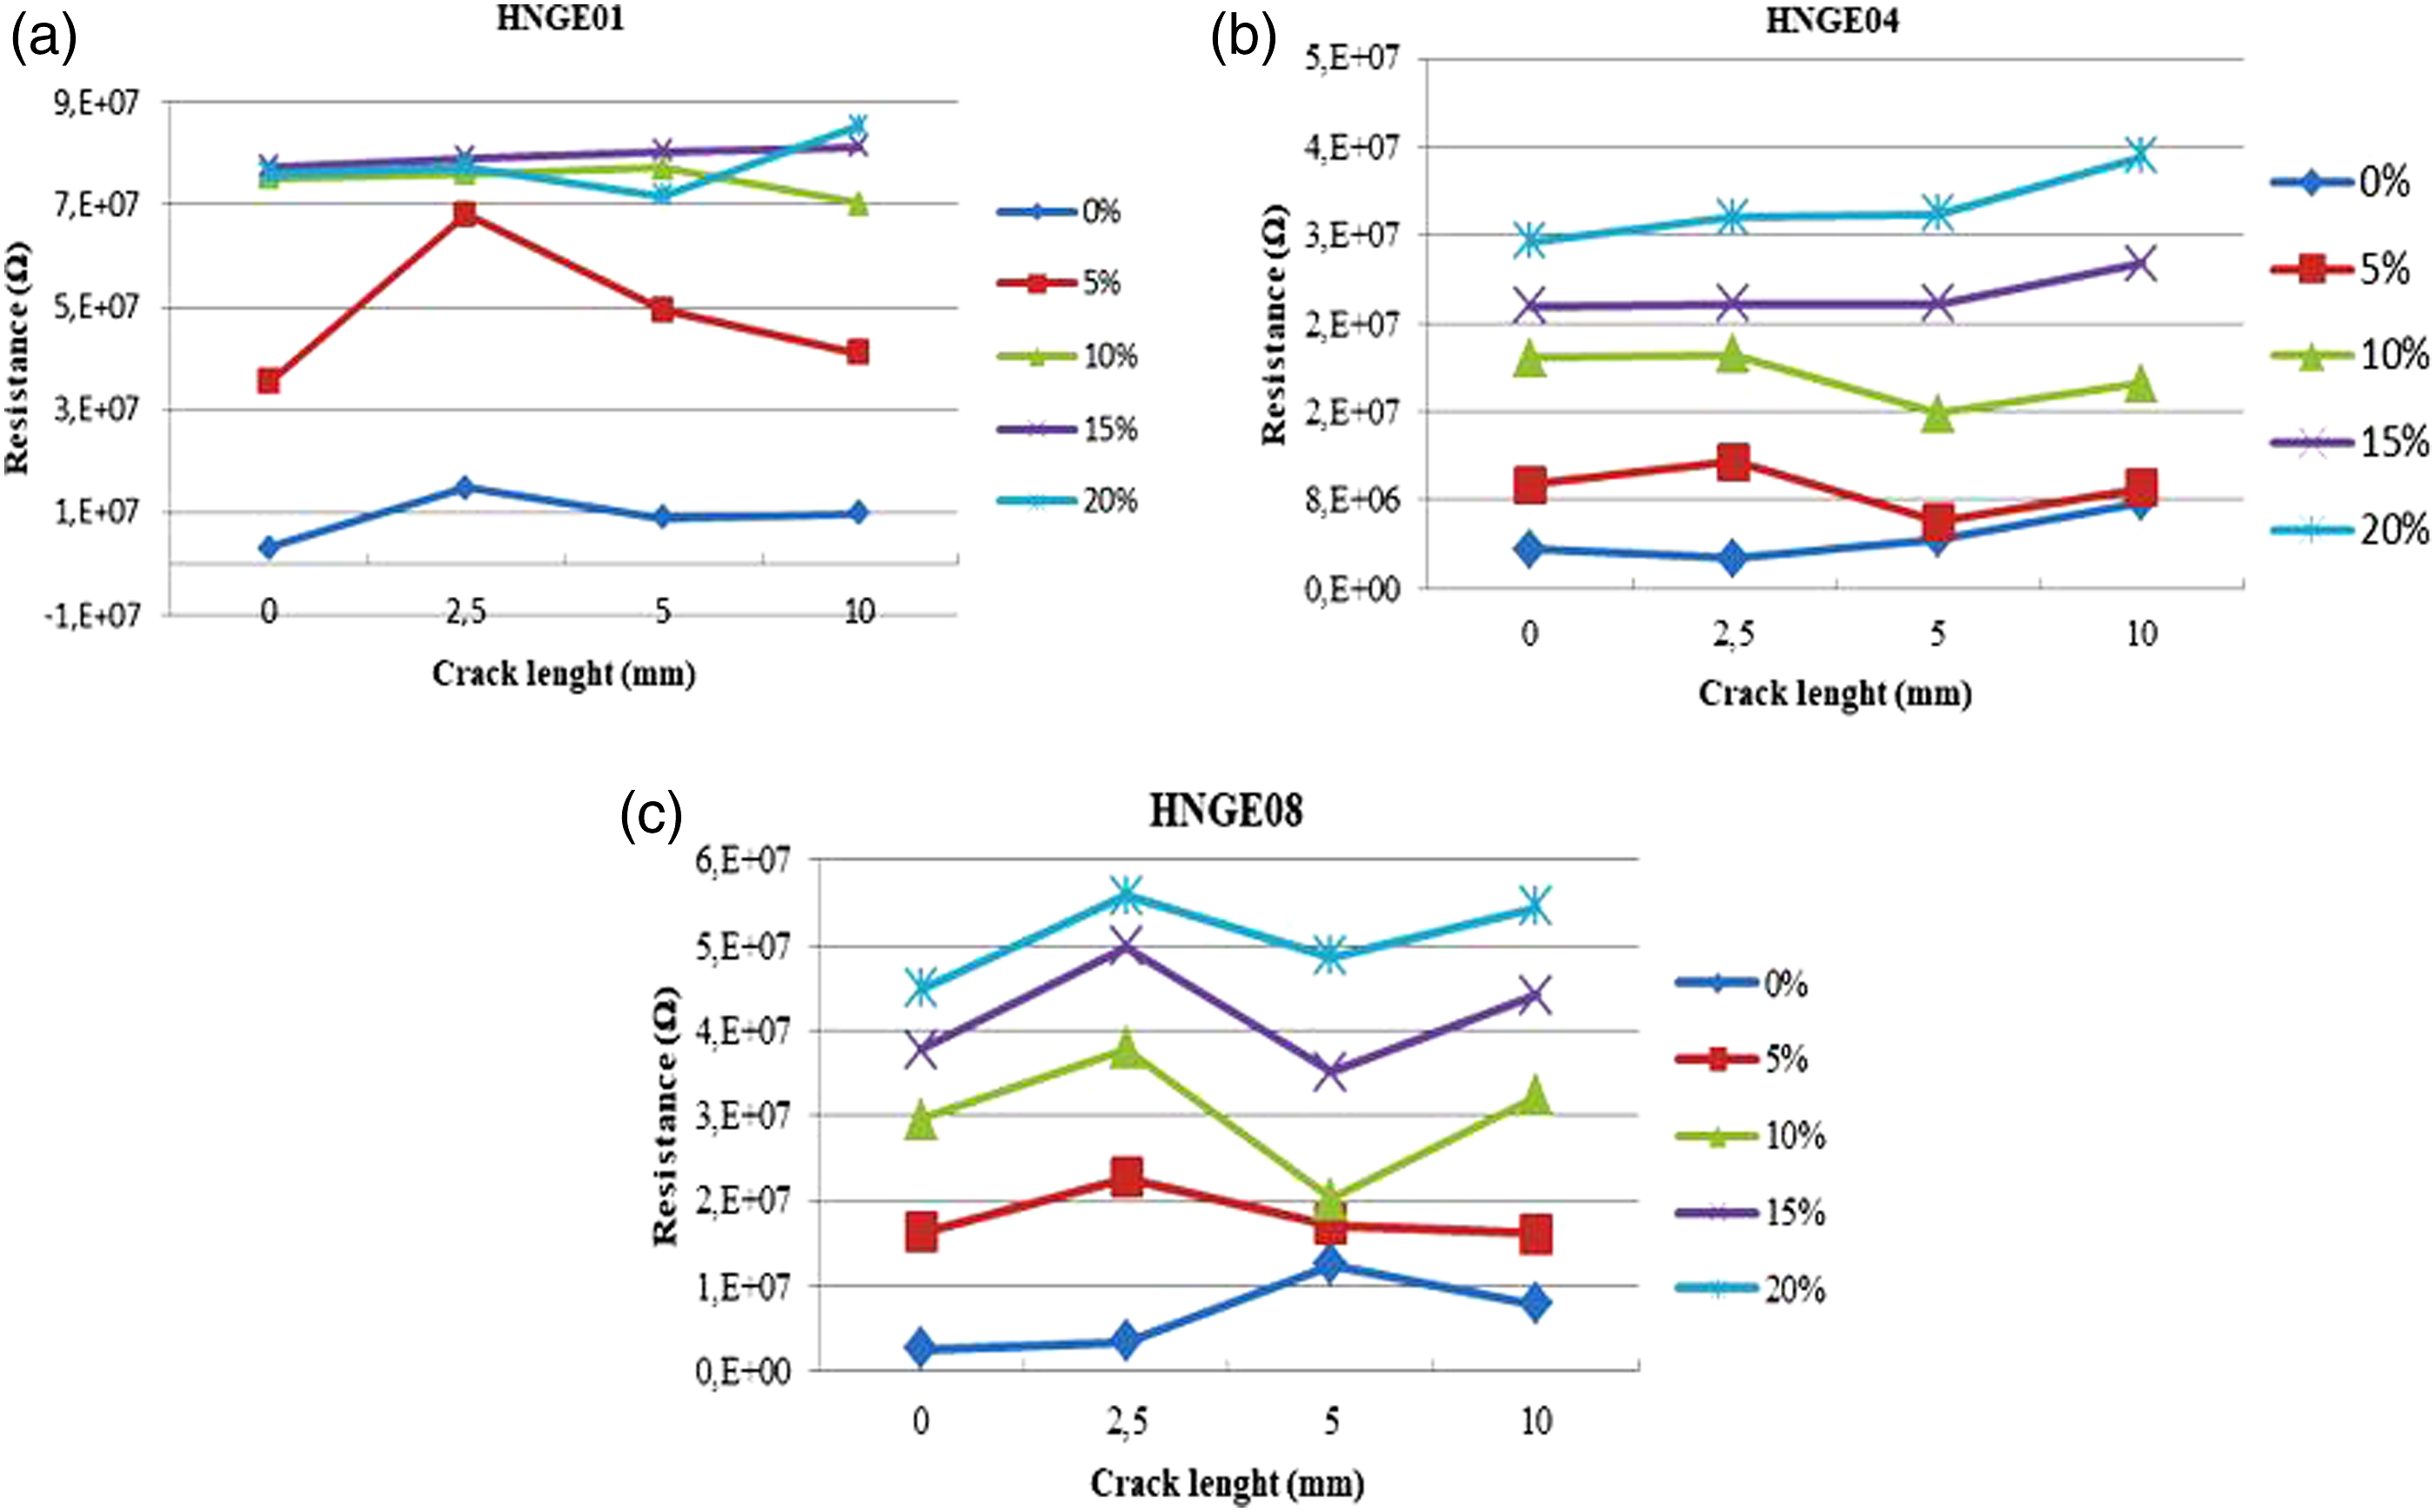
However, the incorporation of GE at 4 and 8 phr ratios progressively reduces the system’s resistivity. A general tendency is that, as the amount of GE nanofillers in the matrix increases, the resulting electrical resistance values decrease. However, as the crack size increases, the electrical resistance change increases due to the strain. This is shown in Figures 17(b) and (c) for HNGE04 and HNGE08 nanocomposites with 4, 8 phr GE fillers ratio, respectively. As the crack length increases, the resistance changes increases. After the initial strain (5%) value is applied to the samples, the GEs and CBs move in the material, resulting in changes in the interaction and distances between them. This movement in the matrix affects the conductivity network due to the interaction of the filling materials. Especially in cycling strain applications, when the movement towards the initial position starts, the resistance reaches almost the highest values. At the start position, the resistance has reached the minimum value, and the filling material is in its final position. Increasing the amount of filler decreases the electrical resistance value, internal friction resistance due to material excess causes irregularities in electrical resistance values. This can create multiple triangles and plateau structures in the resistance graphs. (Figure 12).
The change in resistance depending on the applied strain value and cross-sectional area A is shown in Figure 18. At maximum strain value A (Cross-sectional Area) narrows, electron transition becomes difficult, and resistance increases. Similarly, as the samples return to the initial position when the cross-sectional area (A) becomes the first condition, material accumulation occurs, and the resistance increases. This is clear in the samples HNGE04 and HNGE08. Figures 19(a)–(d) shows the electrical properties of the HNGE04 specimens at 0, 2.5, 5, and 10 mm crack length. These graphs show resistance increases depending on the strain and crack length. The increase of the filler ratio is an essential factor in reducing the obtained resistance values, and the process should be evaluated separately in the conditions. However, one reason for the limitation of electron transfer is that many GE nanofillers are in the process zone. The CB and GE contents in the HNGE04 nanocomposite were equal in the second-stage mixing, resulting in a more homogeneous and hybrid mixture. The resistance change shown in Figure 19(b) proves this. Moreover, as the crack length increases, it appears that there is a smooth and clear graphic with higher strain values (15% and 20%). While comparing the results of changing the network resistance behavior between the HNGE01 and HNGE04 hybrid composites, the HNGE04 system shows a unique hybrid network formation with high conductivity. One of the GE + CB (4 + 4 phr) hybrid addition is used as a conductive filler and the other acts as a lubricant in applications stress/strain. The production of unique conductive composites is achieved by the action of the hybrid filler’s conductive network. The effect of conductive network formation due to hybrid filler can be better conductivity of composites. The average resistance values were obtained as 0.31, 0.36, 0.39, and 0.39 kΩ for the HNGE04 nanocomposites at 20% constant strain cyclic loading. Moreover, the resistance sharply increases as the strain magnitude rises. Due to the CB’s spherical structure, it may be easier to go into the graphene platelet’s partially thin layer structure to form the GE-CB conductive 3D network. CB’s aspect ratio influences the easy go into of HcNs nanocomposite into the graphene nanoplatelet layers to create the conductive 3D bridges. In fact, GE has higher surface energy than CB. For that reason, it is not easy to dissipate GE nanoplatelets inside the rubber matrix. The conductivity network formation behavior of the specimens. The resistance behavior at (a) no crack, (b) crack length 2.5 mm, (c) crack length 5 mm, (d) crack length 10 mm for HNGE04.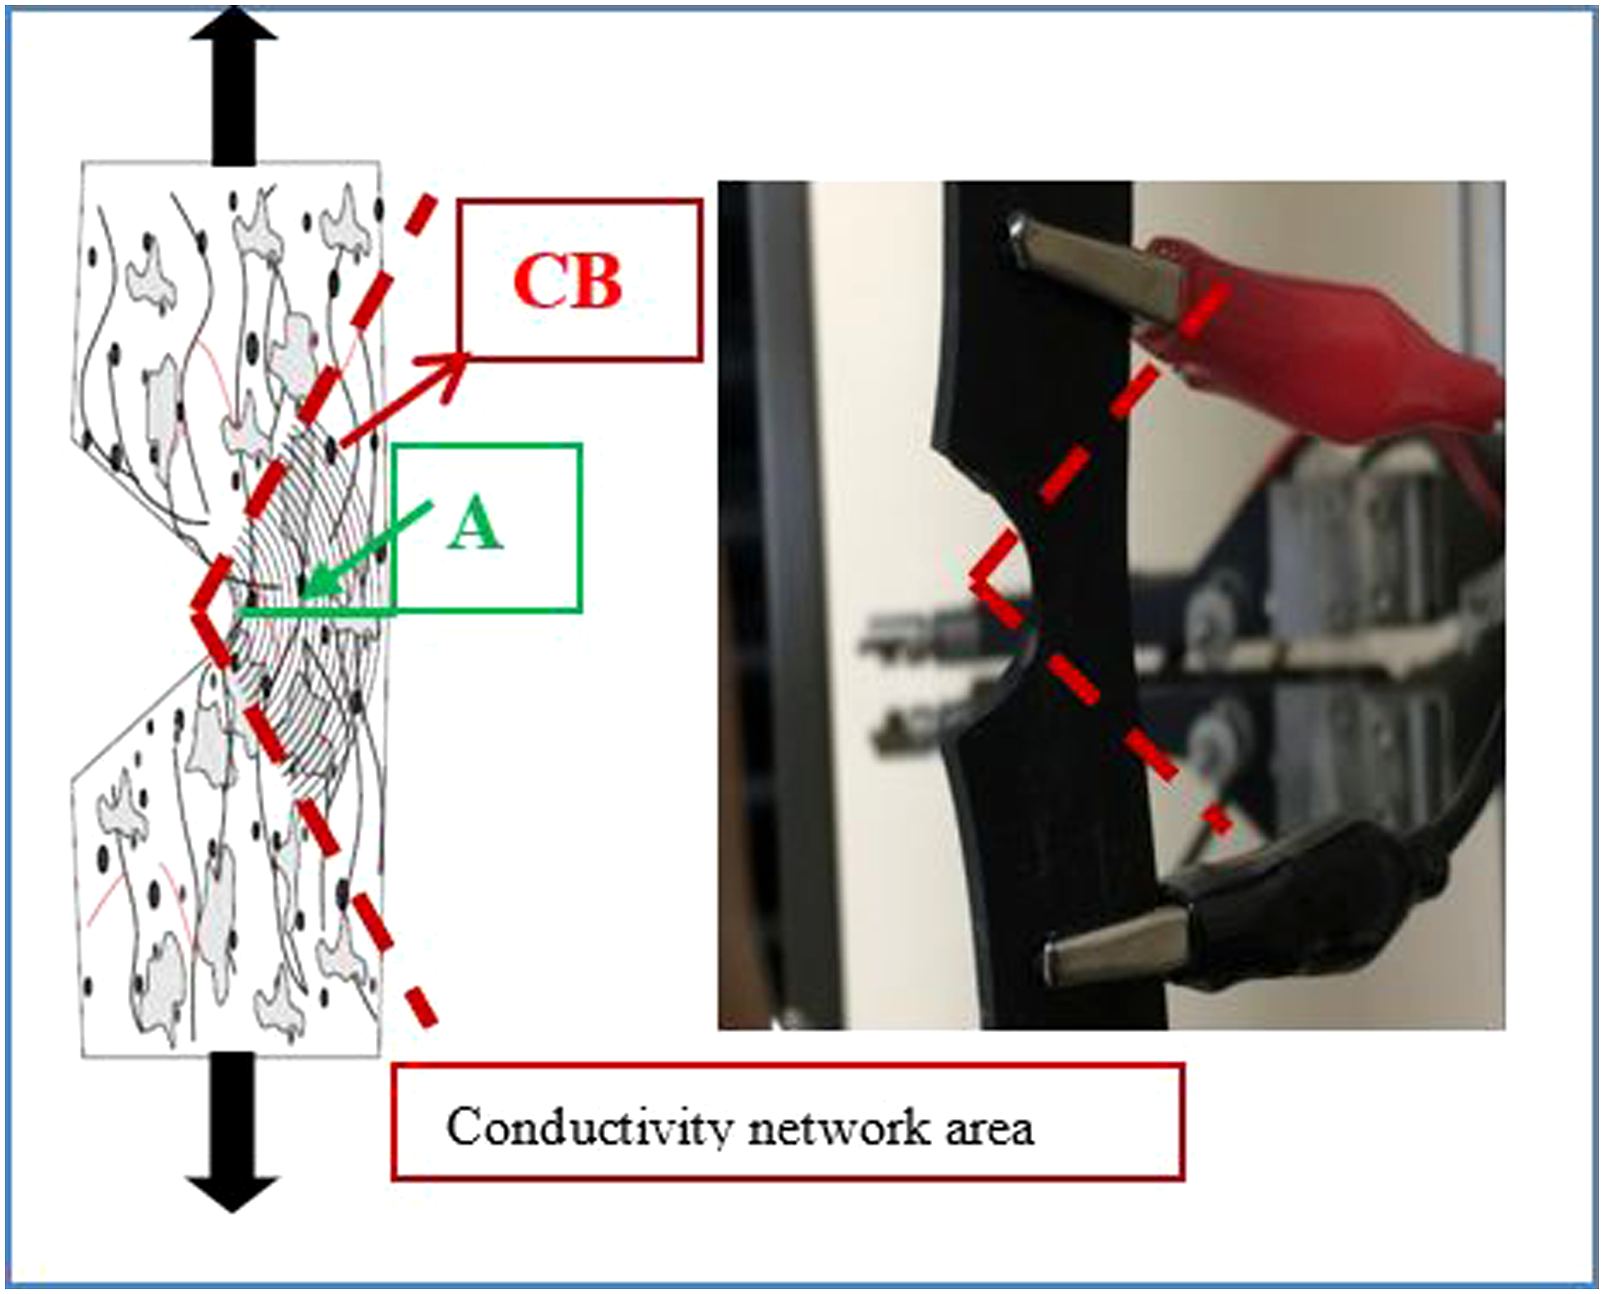
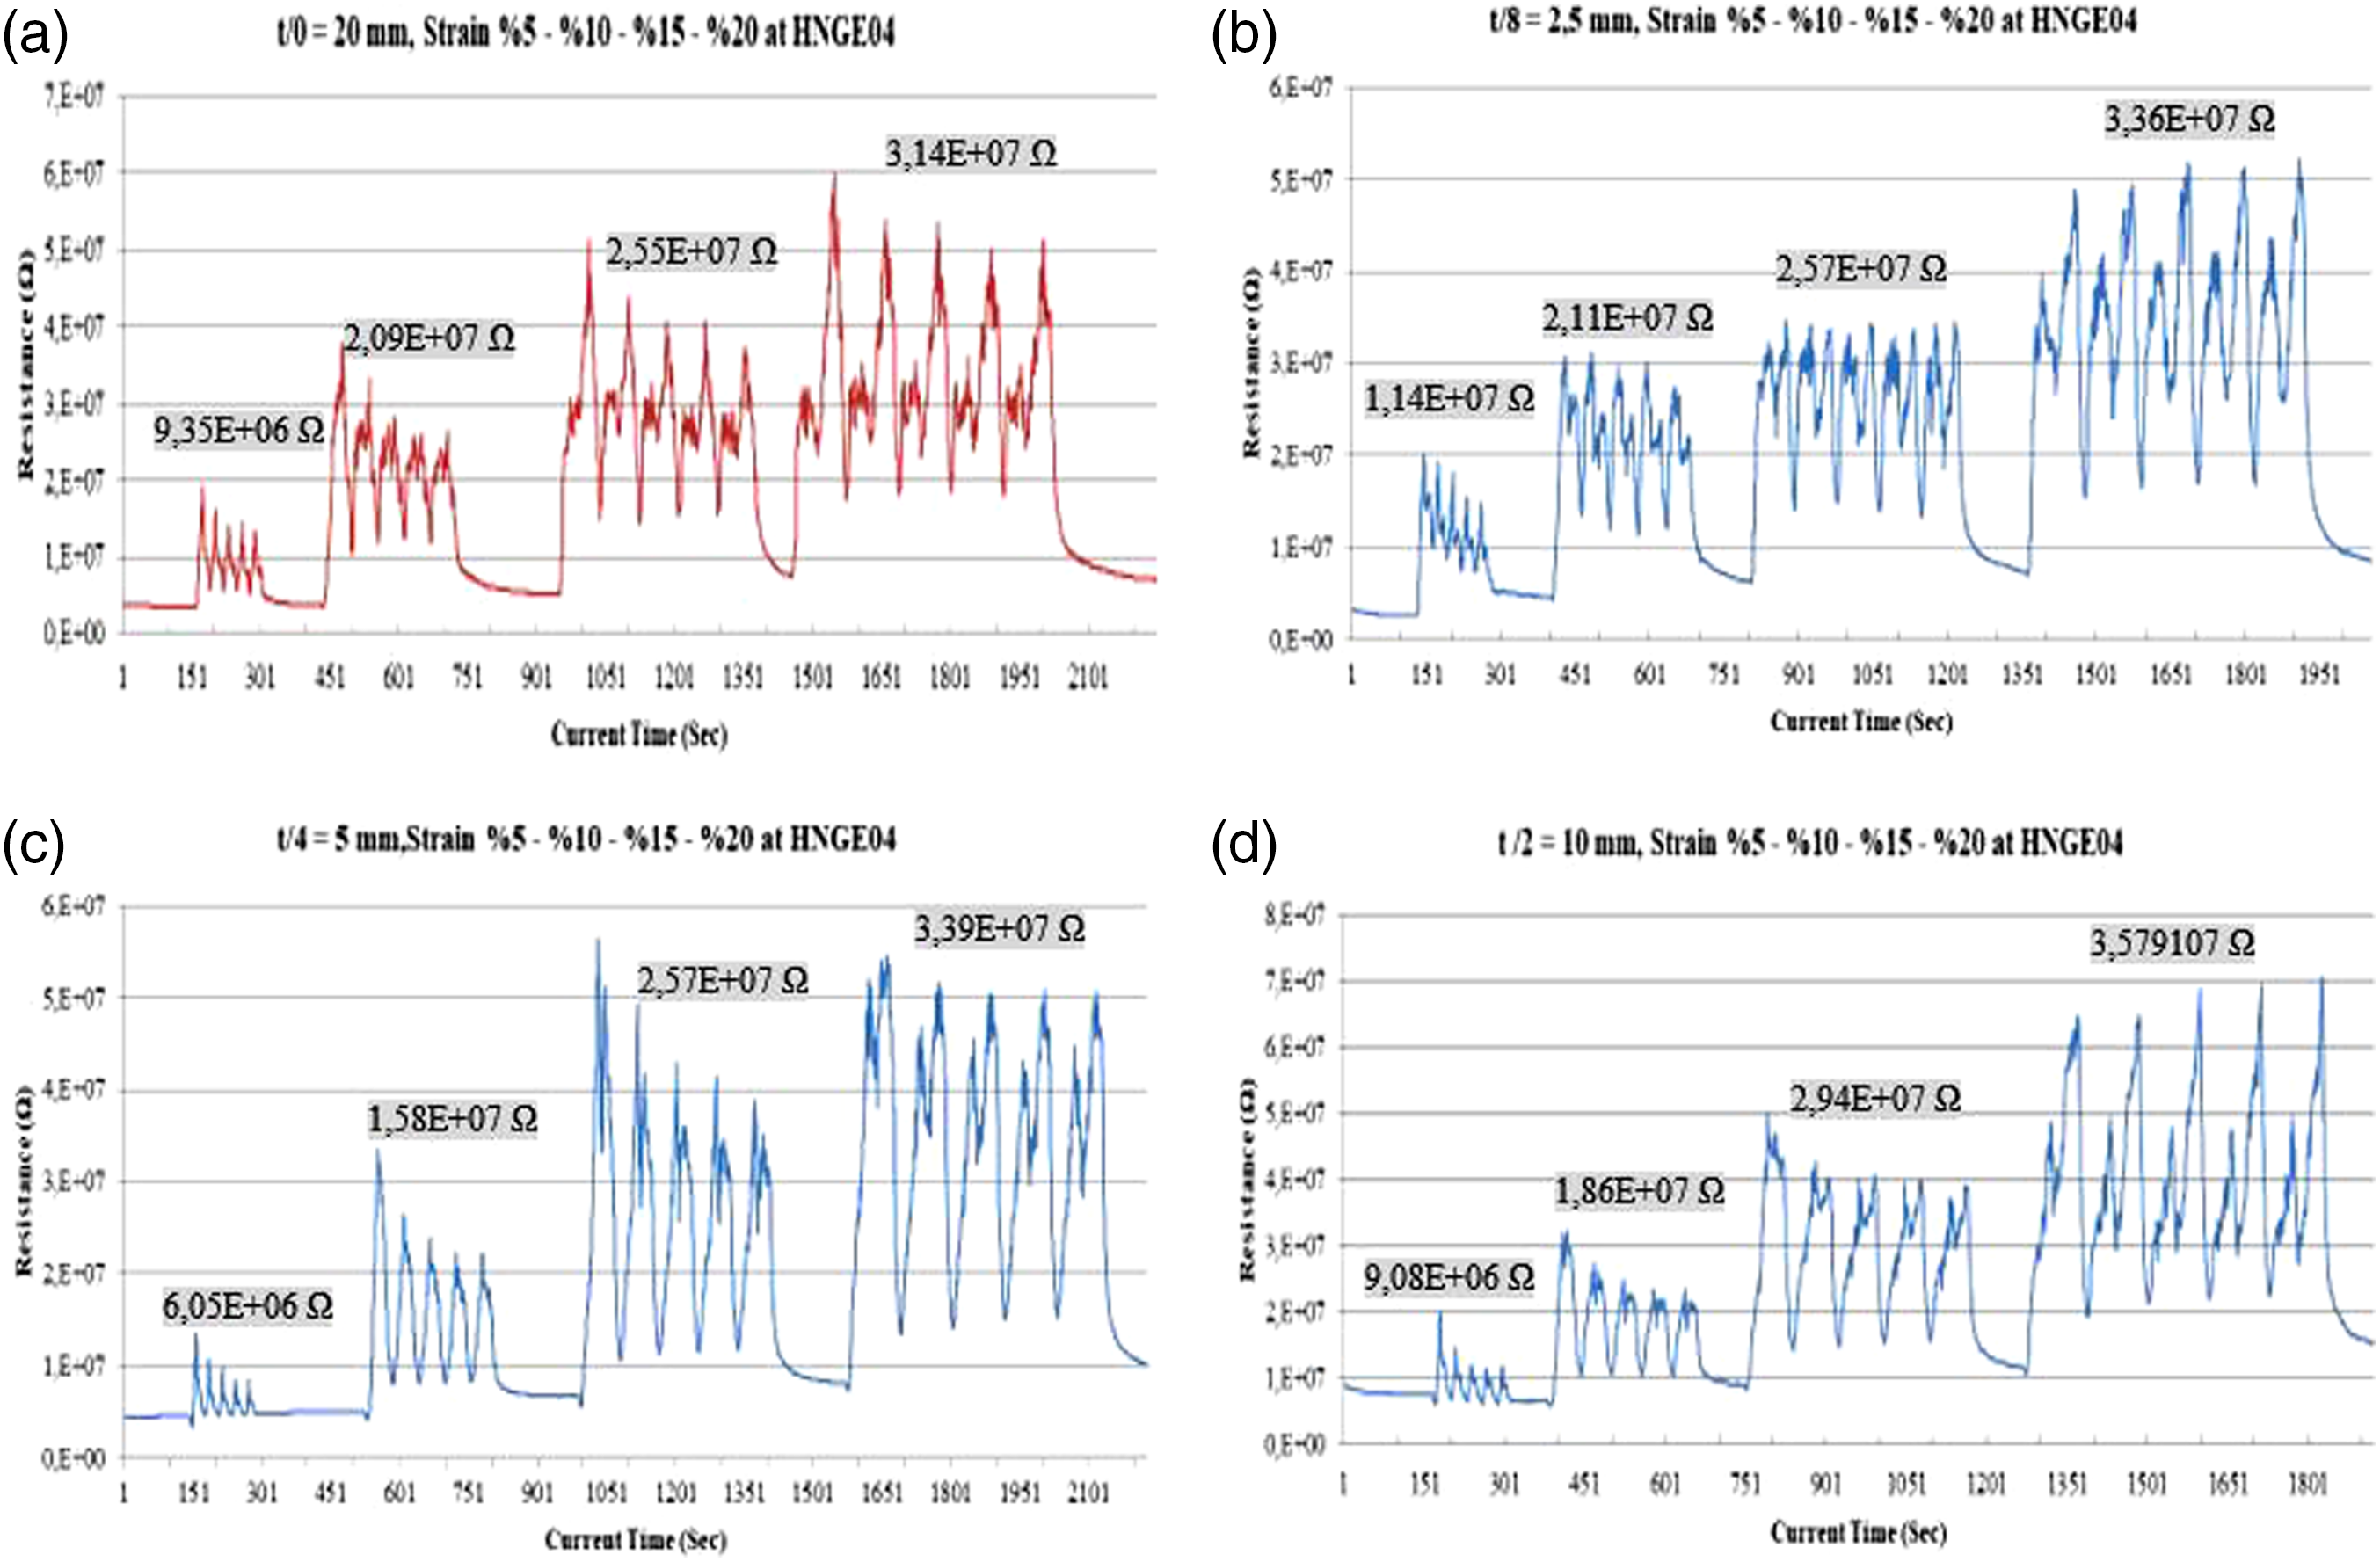
Figure 20 shows the electrical properties of the HNGE08 specimens at 0, 2.5, 5, and 10 mm crack length. Compared to the HNGE04 nanocomposite, when GE fill increased to 8 phr, a sharp decrease in resistance was expected, which was not the case. On the contrary, the average resistance values increased. This is explained by reducing the cross-sectional area and the filling materials' movements due to the strain values in Figure 18. The average resistance values were 0.45, 0.56, 0.49, 0.54 kΩ for the HNGE08 hybrid nanocomposite at 20% strain. The resistance increases with increasing filler loading because of agglomeration and residual rubber material between GE nanoplatelets and CB particles. It can be said that the CB contributes to network building among the fillers; otherwise, GE cannot achieve such a network. The formation and degradation of the network structure occurring in both systems are shown in Figure 18. As only 8 phr of GE nanofiller material was used in the second-stage mixture of HNGE08 composite, agglomerations in the conductivity network formation caused electrical resistance increase and irregularities. The Formation of CB, which acts as a bridge between graphene platelets, forms a conductive pathway through the matrix. However, GE does not form a conductive network such as CB because it is aggregated around itself. Finally, the HNGE04 nanocomposites in electrical conductivity show significant synergistic behavior compared to HNGE08 and HNGE01. Figure 20 shows HNGE08 specimen’s signal shapes according to crack length and strain levels. For all crack lengths and loaded strain percentages, HNGE08 specimens show precise sensing. Also, for 10% and 15% strain levels for all initial cracks and virgin specimens, measured signals were repeated equally for each loading and unloading step. Under low strain levels such as 0% and 5%, measured signals decrease during the loading and unloading process. The resistance behavior at (a) no crack, (b) crack length 2.5 mm, (c) crack length 5 mm, (d) crack length 10 mm for HNGE08.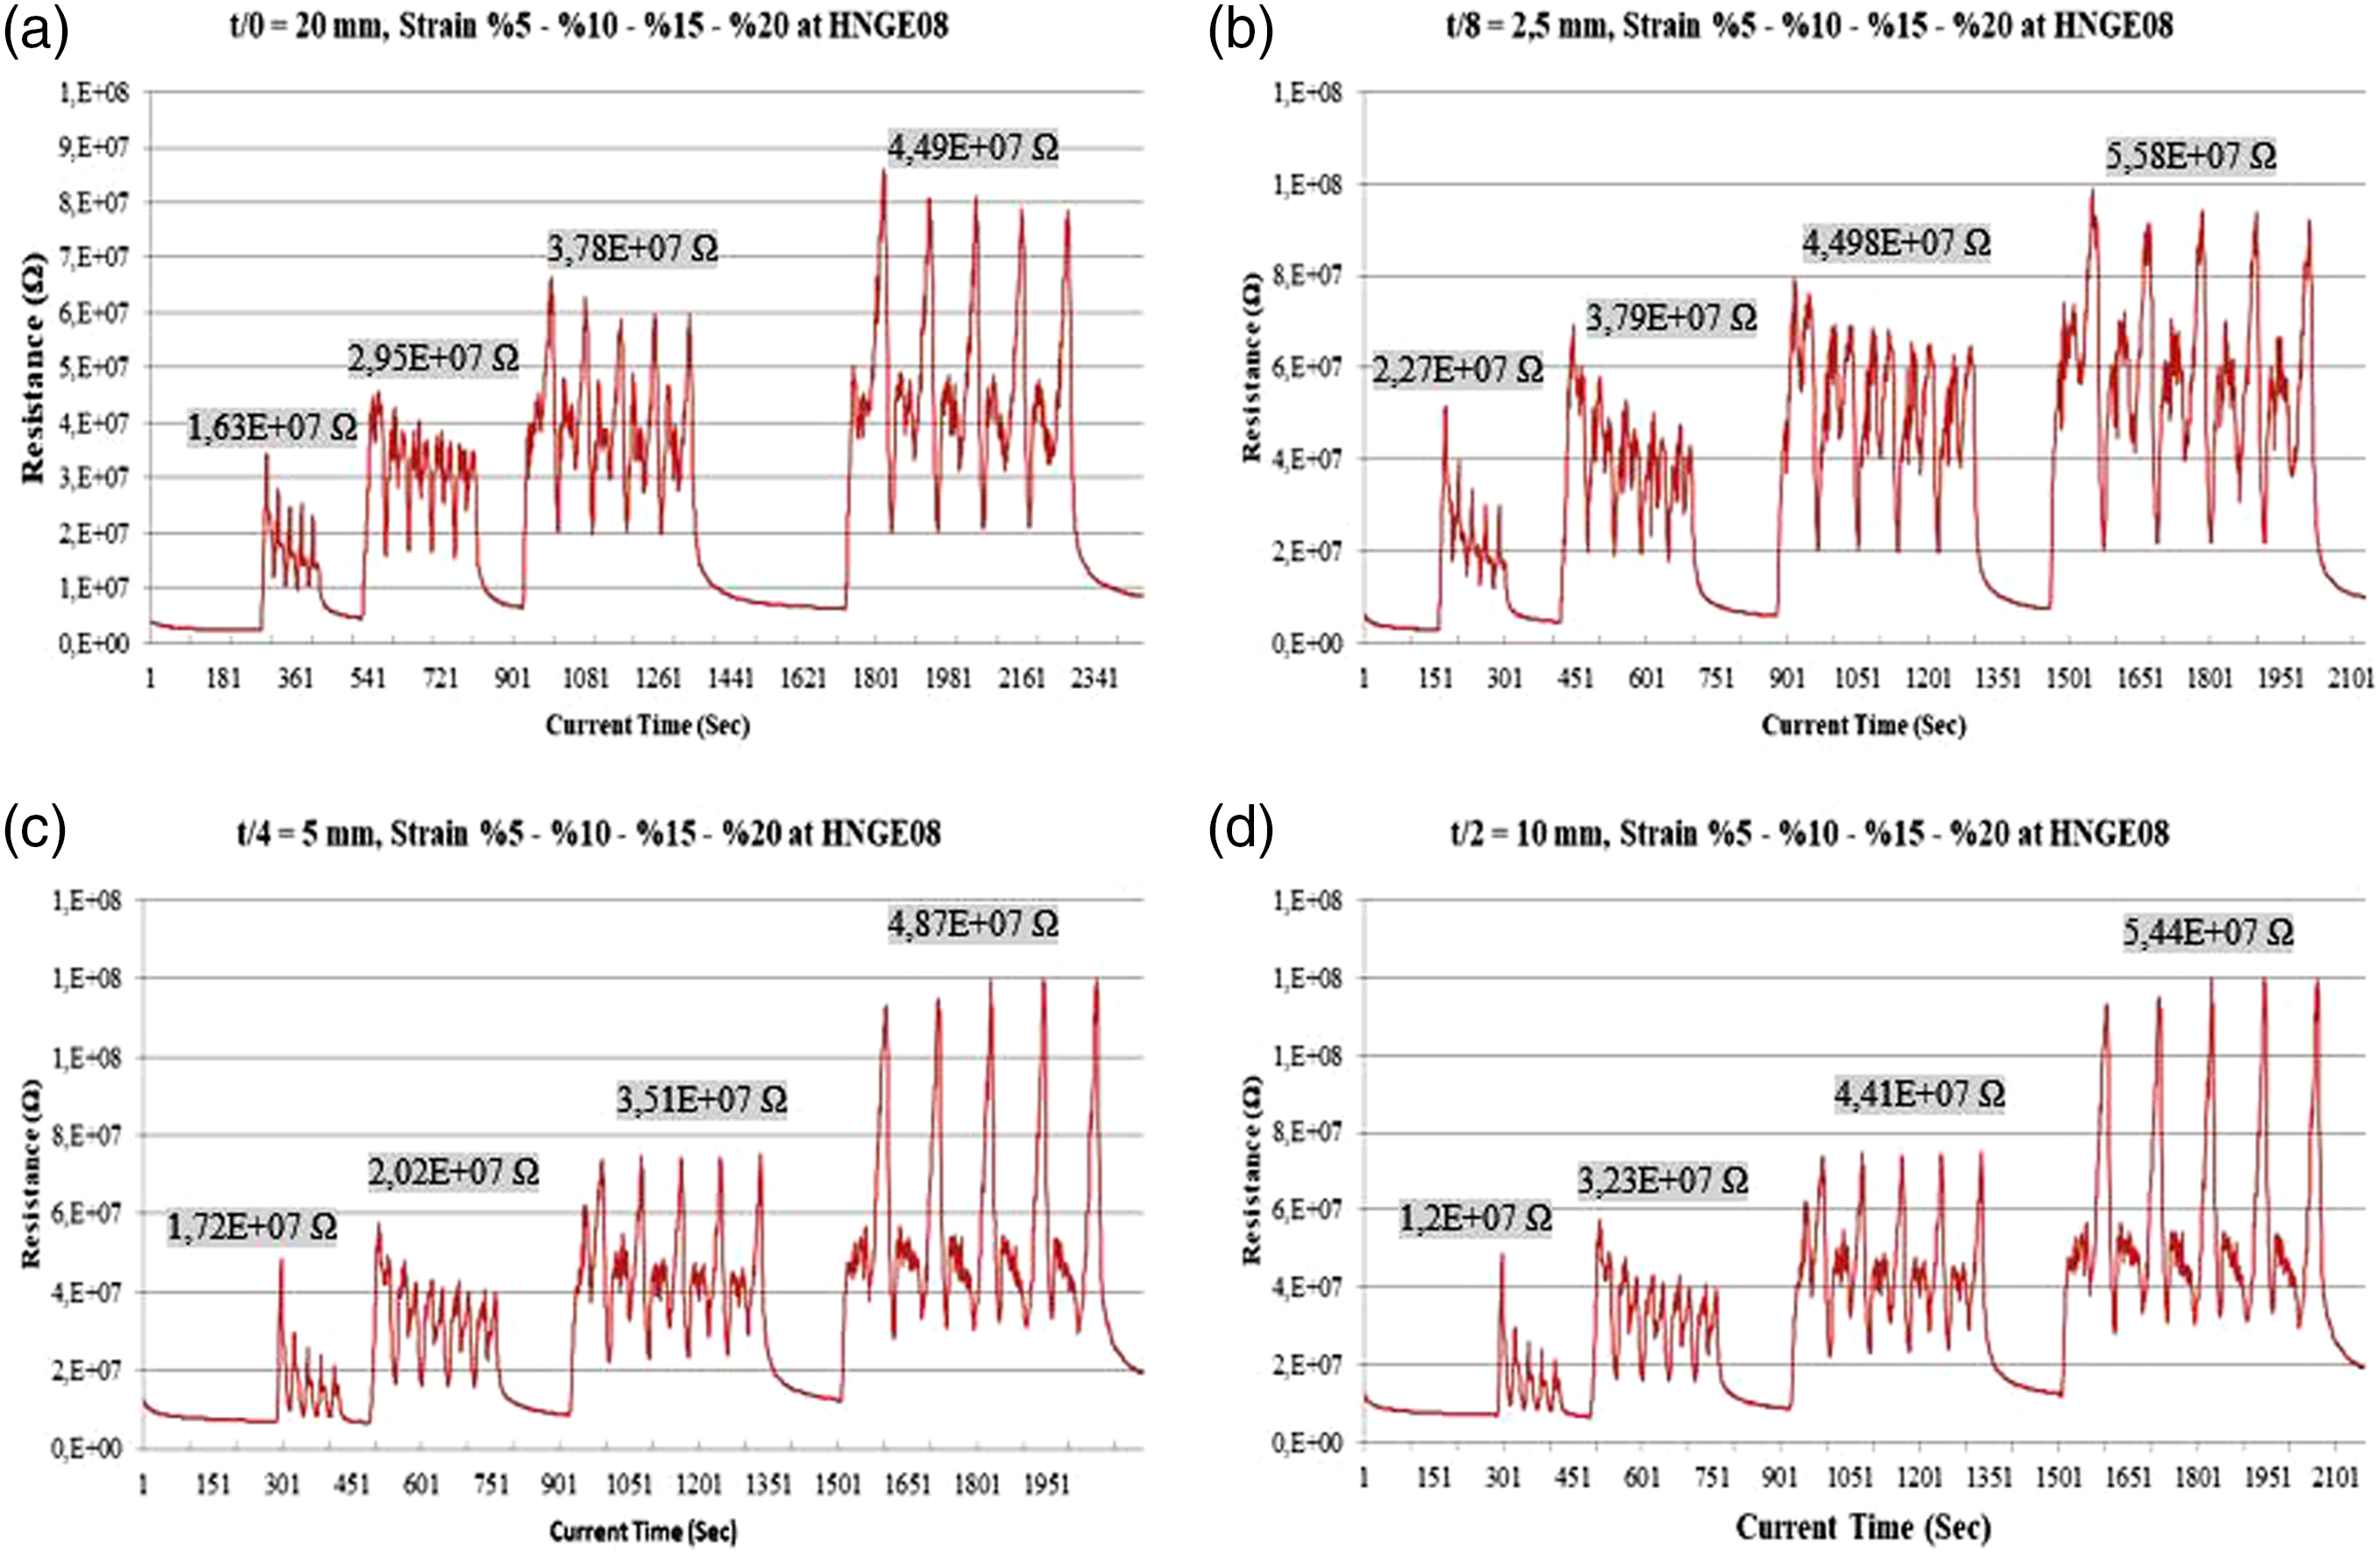
Conclusion
In this study, with developing mixing methods and improving process conditions to filling Graphene (GE) nanoplatelets and Carbon black (CB) particles, high conductive natural rubber-based nanocomposite materials were obtained. Therefore, GE and CB filling were improved the nanocomposite’s conductivity by the synergistic effect. This novel conductive hyperelastic nanocomposite materials present excellent properties with different characters to achieve large-strain sensors based on electrical resistivity change, considered helpful for industrial applications.
40
The concluded outcomes can be summarized as given below: 1. Increasing the highly conductive nanofillers' ratio into the natural rubber matrix improves electrical conductivity. Nevertheless, the amount of conductivity improvement is varied depending on the shape and size of the conductive nanofillers, dispersions, and loading directions.41,42 2. Damaged nanocomposite specimens with initial cracks in various lengths show electrical resistivity changes for the entire GE fill content. Increasing the initial edge crack length from 0 to 2.5 mm creates a visible increase in the electrical resistance. 3. The expected increase depending on the crack length in electrical resistance due to cross-section reduction are more stable for 4 phr GE-filled specimens. At lower or higher GE filling ratios than 4 phr, unstable conditions occurred at 5 and10 mm crack lengths. 4. Similar and stable signals for electrical resistivity are obtained for high strain levels (10% and 20%). However, unstable conditions were observed at low strain levels (0 and 5%) and at crack lengths greater than 2.5 mm. 5. The developed natural rubber-based nanocomposite sensor materials are continued to exhibit the ability to detect even in challenging and damaged conditions. Like the well-dispersed GE and CB fillers within the matrix, the developed hybrid nanocomposites show comparatively high tensile strength and high elongation at breakage. 6. The highly conductive nanoparticles in the developed nanocomposites moved away from each other when the material was stretched. This creates smaller contact surface areas, larger gaps, and even higher contact stresses. The realization of all these conditions causes an increase in electrical resistance during stretching. 7. Natural rubber material enters between the highly conductive nano filling materials during the reversal of the stretched material, and the electrical resistance of the material reaches the highest electrical resistance point. This situation is obtained in low conductive filler amounts in the nanocomposites. 8. Increasing the amount of highly conductive nanofillers decreases the electrical resistance value, while the internal friction resistance caused by the excess material causes irregularities in the electrical resistance values. This behavior is observed in resistance graphs as multiple-sized triangles and plateau regions. 9. Increasing the GE nanoparticle filler ratio improved the electrical conductivity. However, after a certain filling ratio, on the contrary, causes a decrease in the nanocomposite structure’s conductivity. The reason for this is the agglomerations of GE nanoplatelets. This agglomeration created the reach natural rubber regions between the agglomerated nanoparticle point and caused rising the electrical resistivity. 10. The rubber samples containing 4 phr GE fillers have proven to have better properties under cyclic strain. Continuous filling filtration networks are formed in GE samples with a low fill content of 4 phr the almost linear resistance at low strain was observed to increase at high strain amplitude. 11. The addition of the CBs, which has a smaller size than GE’s and near-spherical geometry, as the second conductive phase fillers, are distributed more homogeneously in the matrix and contribute to forming a homogenous conductive network in the matrix and creating conductive bridges between the highly conductive agglomerated GE regions. 12. The hybrid reinforced conductive nanocomposites present higher electrical conductivity and higher-strain sensing accuracy properties due to the synergistic effect.
Footnotes
Acknowledgments
The authors would like to thank the staff of the R&D center for providing the use of composite samples and test equipment necessary for the experiments.
Declaration of conflicting interests
The author(s) declared no potential conflicts of interest with respect to the research, authorship, and/or publication of this article.
Funding
The author(s) disclosed receipt of the following financial support for the research, authorship, and/or publication of this article: This work was funded by Pega Automotive Trade Co