
Abstract
Short fiber-reinforced 3D printed components are high performance materials with a wide range of potential applications in various industries ranging from aerospace to automotive.
Mechanical characterization of 3D printed short carbon fiber polyethylene terephthalate and acrylonitrile butadiene styrene parts are presented under the application of shear load in this study. The anisotropy properties of both composite and polymer materials were investigated by printing samples at two different orientations, using fused deposition modeling (FDM) technique. The fabricated samples were subjected to tensile and shearing loads while 2D digital image correlation (DIC) was used to measure full-field strain on the specimen.
The obtained results revealed a noticeable anisotropy in shear properties as the function of printing orientation. Moreover, it found that using carbon fiber-reinforced PET results in higher elastic modulus, tensile, and shear strengths up to 180%, 230%, and 40% compared to ABS.
Keywords
Introduction
As a revolutionary technology, additive manufacturing has found so many applications in fabricating high-performance structural parts in various industries ranging from aerospace to automotive.1–3 Among the available additive manufacturing processes, Fused Deposition Modeling (FDM) has been a preferred method due to its low technology cost, ease of access, and application.4,5 Polylactic acid (PLA), acrylonitrile butadiene styrene (ABS), polyamide 12 (PA 12), and polyethylene terephthalate glycol (PETG) are common thermoplastic polymers that are used in the FDM process.6–8 Low strength and unstable mechanical properties cause the end-use FDM parts, made from such pure polymers, to be unreliable for structural and functional engineering applications. 9 However, this issue has been addressed by introducing fiber-reinforced filaments. Carbon,10,11 glass,12,13 aramid,14,15 and natural16,17 short or continuous fibers are known as common reinforcements in the FDM process. The properties such as high dimensional stability, high level of strength, and stiffness at an affordable cost make fiber-reinforced filaments an interesting material that opens new application fields in FDM printing.18–21
In literature, continuous carbon fibers have been used as reinforcement materials of FDM printed ABS22,23 and PLA.24,25 The mechanical characterization of the printed composites indicated that the bending and tensile strengths were increased by up to 35% and 108%, respectively, in comparison with pure PLA while delamination together with matrix cracking were found as the dominant failure modes. 26 Mohammadizadeh et al 9 studied the mechanical and structural behavior of continuous carbon fiber-reinforced 3D printed components under static and dynamic loadings. The presented results show that specimens printed with fiber inclusion exhibit superior mechanical properties compared to those fabricated with pure polymer. The impact damage performance of FDM-printed continuous glass, carbon, and aramid fiber-reinforced thermoplastic composites was studied in Caminero et al. 27 The authors found that though the printed parts with carbon fiber-reinforced nylon result in a brittle structure, the impact performance of the printed parts with glass fiber inclusion was improved significantly. The mechanical properties and dimensional accuracy of the short carbon fiber-reinforced nylon composites fabricated by FDM were investigated by Yasa and Ersoy. 28 They showed that using appropriate compensation techniques the dimensional accuracy of some features can be enhanced. The presented results for tensile tests show that compared to the unreinforced nylon, the elastic modulus, and yield strength were enhanced, notably.
The mechanical properties of FDM printed parts are significantly affected by process parameters,29–33 printing, and raster orientations.34,35 In Cantrell et al, 36 the effect of build and raster orientations on yield and ultimate tensile strengths, modulus of elasticity, and toughness of ABS and PC were investigated. The presented results showed a significant anisotropy in the mentioned material properties.
Shear characteristics of 3D printed parts were also investigated in the literature. However, in most of the studies, only the elastic modulus and the Poisson’s ratio obtained via uniaxial tensile tests were used to determine the shear properties.34,35 The issue of such an approach is assumption of the material to behave isotropic. In order to obtain accurate shear modulus measurements, the specimen should be loaded under pure and uniform shear stress with minimum normal stresses.
ASTM 5379 and ASTM 7078 are well-known direct shear test methods, specifically developed to determine the shear properties of composite materials under pure and uniform shear load. In Rohde et al, 37 the shear properties of printed ABS and PC parts were investigated in terms of raster and printing orientations according to ASTM 5379. A noticeable anisotropy was observed in both ABS and PC samples, as a function of printing and raster orientations. Additionally, they found that the samples fabricated by ABS material with flat orientation show a higher shear strength and modulus of rigidity (around 17%) than on-edge printed ones. On the other hand, although an identical modulus of rigidity (670 MPa) was calculated for flat and on-edge PC-printed samples, higher ultimate shear strength was observed in flat-oriented samples (36.9 MPa) than on-edge printed ones (34.0 MPa).
Based on the author’s knowledge, the shear properties of 3D printed short fiber-reinforced parts were not concisely studied in the literature. In this study, short carbon fiber-reinforced thermoplastic specimens were fabricated at different printing orientations aiming to investigate the effect of printing orientation on the anisotropy within the mechanical properties. The fabricated specimens were evaluated for both tensile and shear properties to reveal the mechanical behavior of FDM-printed short carbon fiber-reinforced filaments, which can provide a comprehensive guideline for the design and manufacturing applications.
The paper is organized as follows: the samples used in the tests and their fabricating process are explained in material and sample preparation. Then, the shear test procedure is explained in detail in mechanical characterization. In results and discussions, the experimental results are presented together with the discussion of these results. Finally, in conclusion, key findings and conclusions obtained from this study are presented.
Material and sample preparation
Test specimens were fabricated in accordance with ASTM D638-type V and ASTM D5379, using the FDM technique. As material, Ultrafuse PET-CF15 filament (1.75 mm diameter, developed by BASF) and ABS were used. Ultrafuse PET is a polyethylene terephthalate reinforced with short carbon fibers (15 wt.%). With its superior heat resistance, high dimensional stability, and very low moisture uptake, this is a filament for a wide range of industrial applications specifically, for the ones in humid operating environments. The microstructure of the fabricated samples was analyzed using SEM. Figure 1 shows the microstructure of the fabricated samples with PET-CF15 filament. The average diameter and length of the carbon fibers was measured as 8 μm and 150 μm, respectively. Also, it was observed that most of the carbon fibers are in raster alignment. It is worthy to notice that the mechanical properties of the final 3D printed composites are greatly impacted by their microstructural characteristics, including reinforcement fiber orientation.
38
The mentioned internal morphological characteristics can be quantitated using high-resolution X-ray microscope analysis. Microstructure of the printed samples.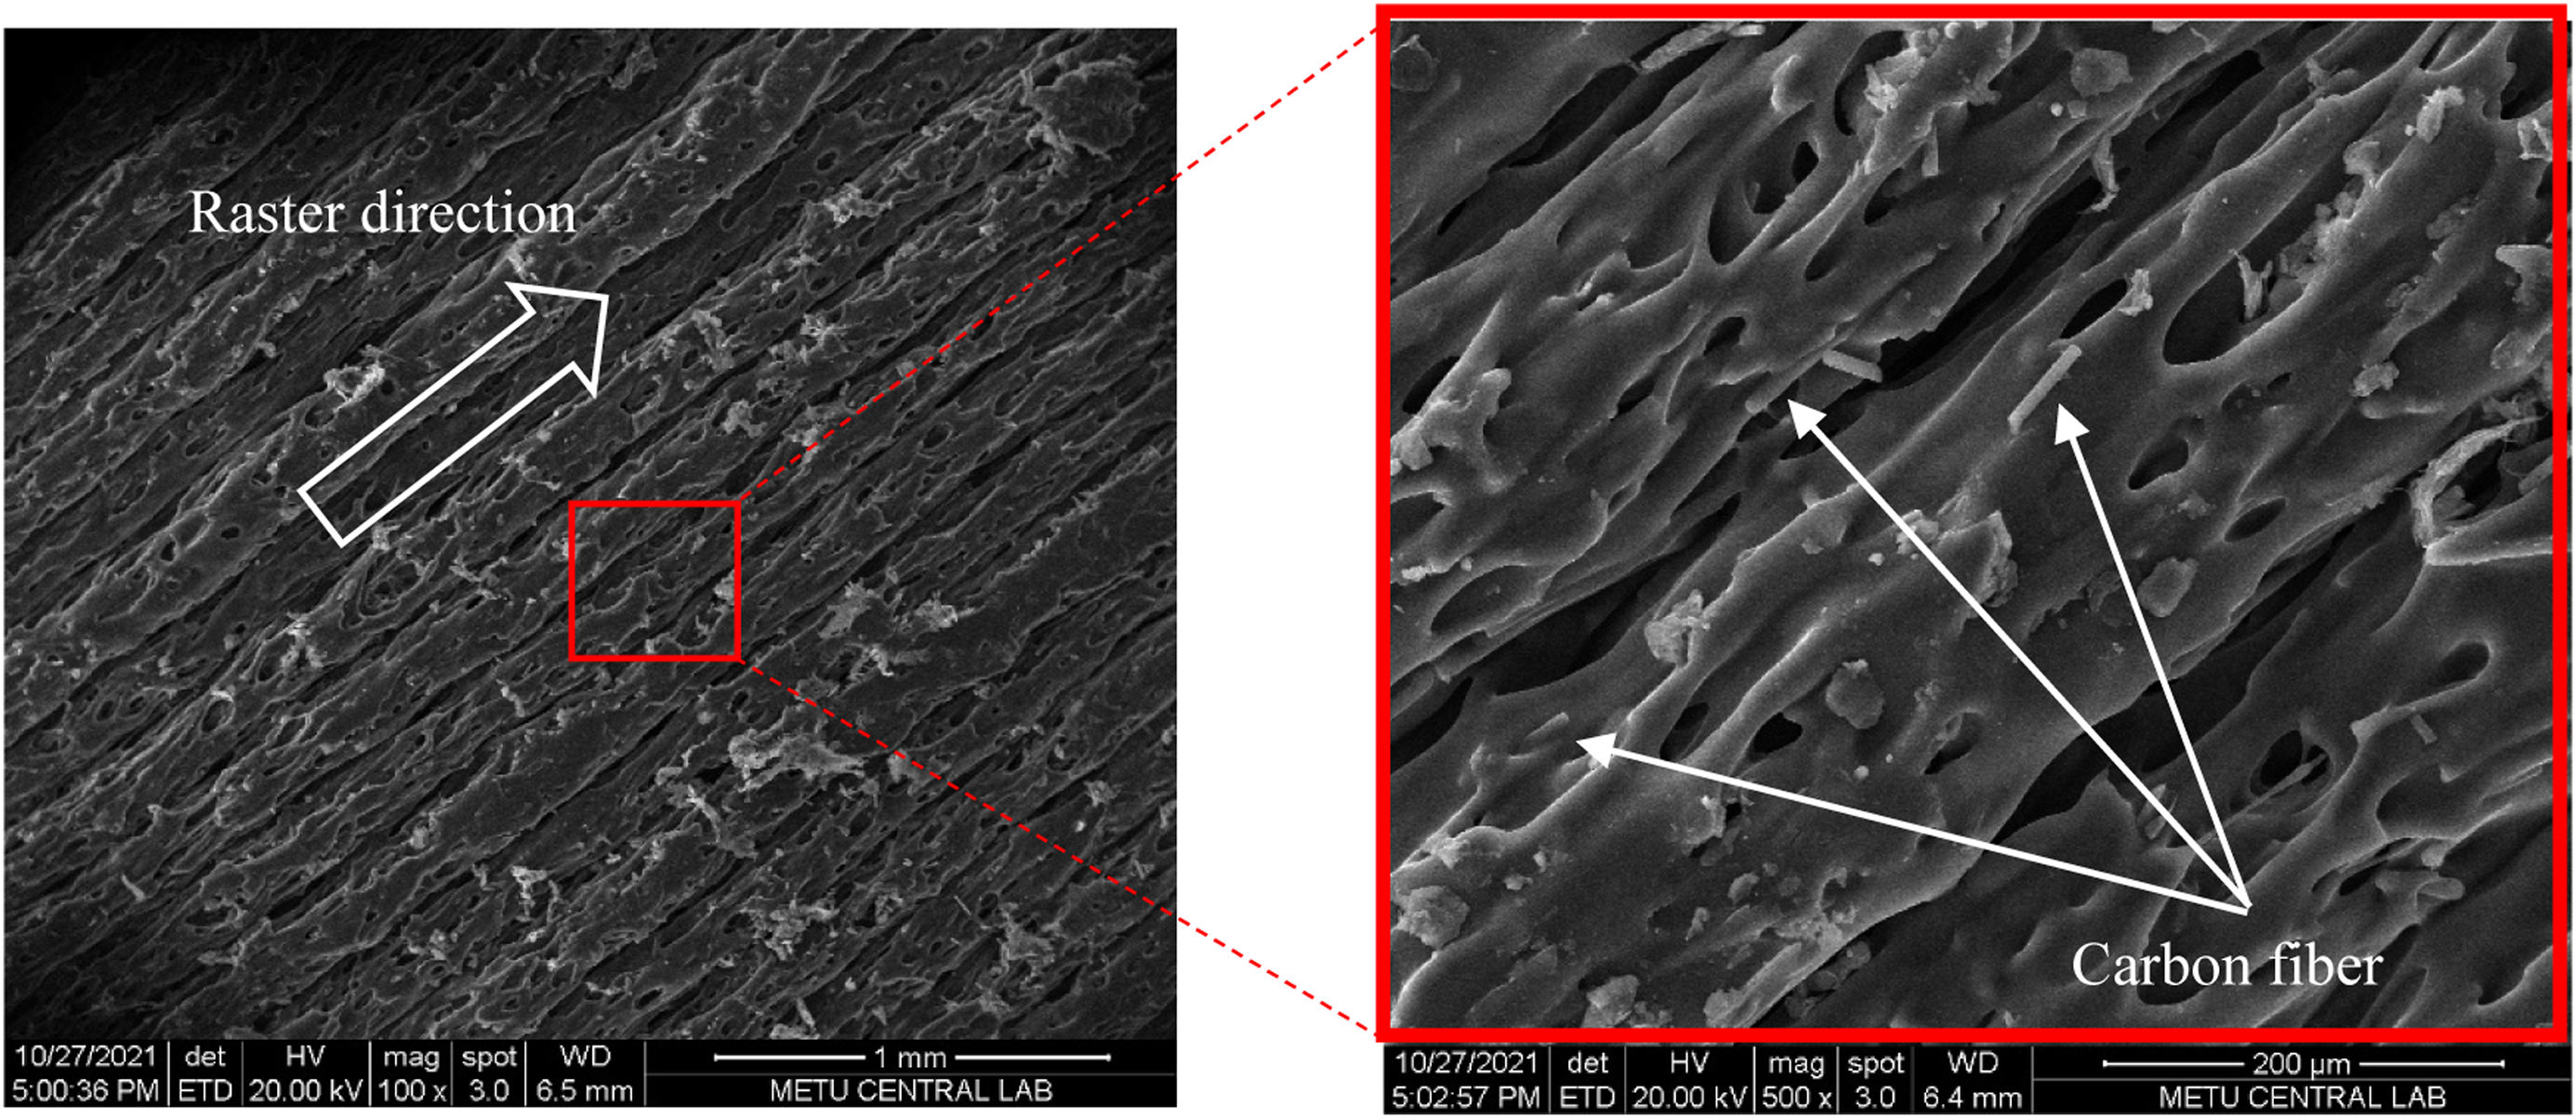
The geometry of test specimens (Figure 2) was created using SolidWorks software package. Then, it was exported as a stereolithography file (STL) and loaded into a 3D printer slicing software package, namely, “Z-Suite” and processing parameters were adjusted. Samples were fabricated by Zortrax M 200 printer. Due to the abrasive nature of fiber-reinforced filaments, a hard steel nozzle diameter of 0.6 mm was used as an extruder. The printing speed was set to 30 mm/s with a layer height of 0.19 mm for all layers. Infill density, bed, and nozzle temperatures were set to 95% (solid), 90, and 280°C, respectively. The parts were produced with a crisscross raster in which the orientation of the fused material alternates from +45° to −45° in each layer. Schematic representation of the ASTM D638-type V and ASTM D5379 specimen geometries. Thickness of the specimens are 3 mm.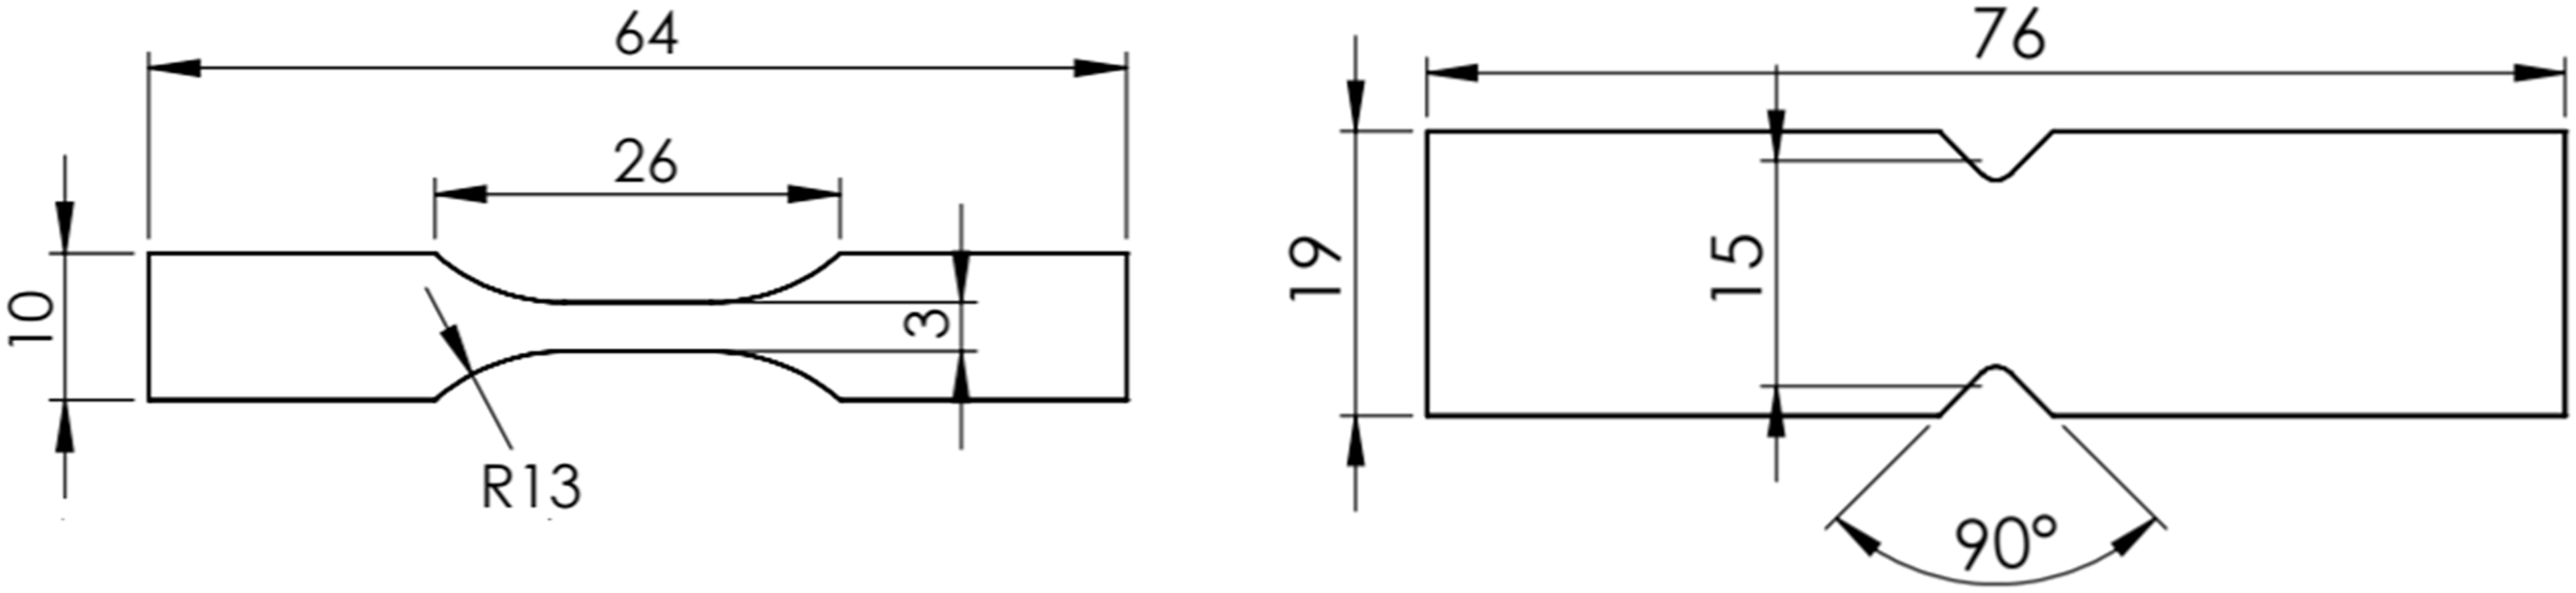
The effect of printing direction on the mechanical properties of the 3D printed samples was studied by printing the samples in flat and on-edge directions as shown in Figure 3. For each test, eight samples were fabricated. Models’ arrangement, a) on-edge, b) flat.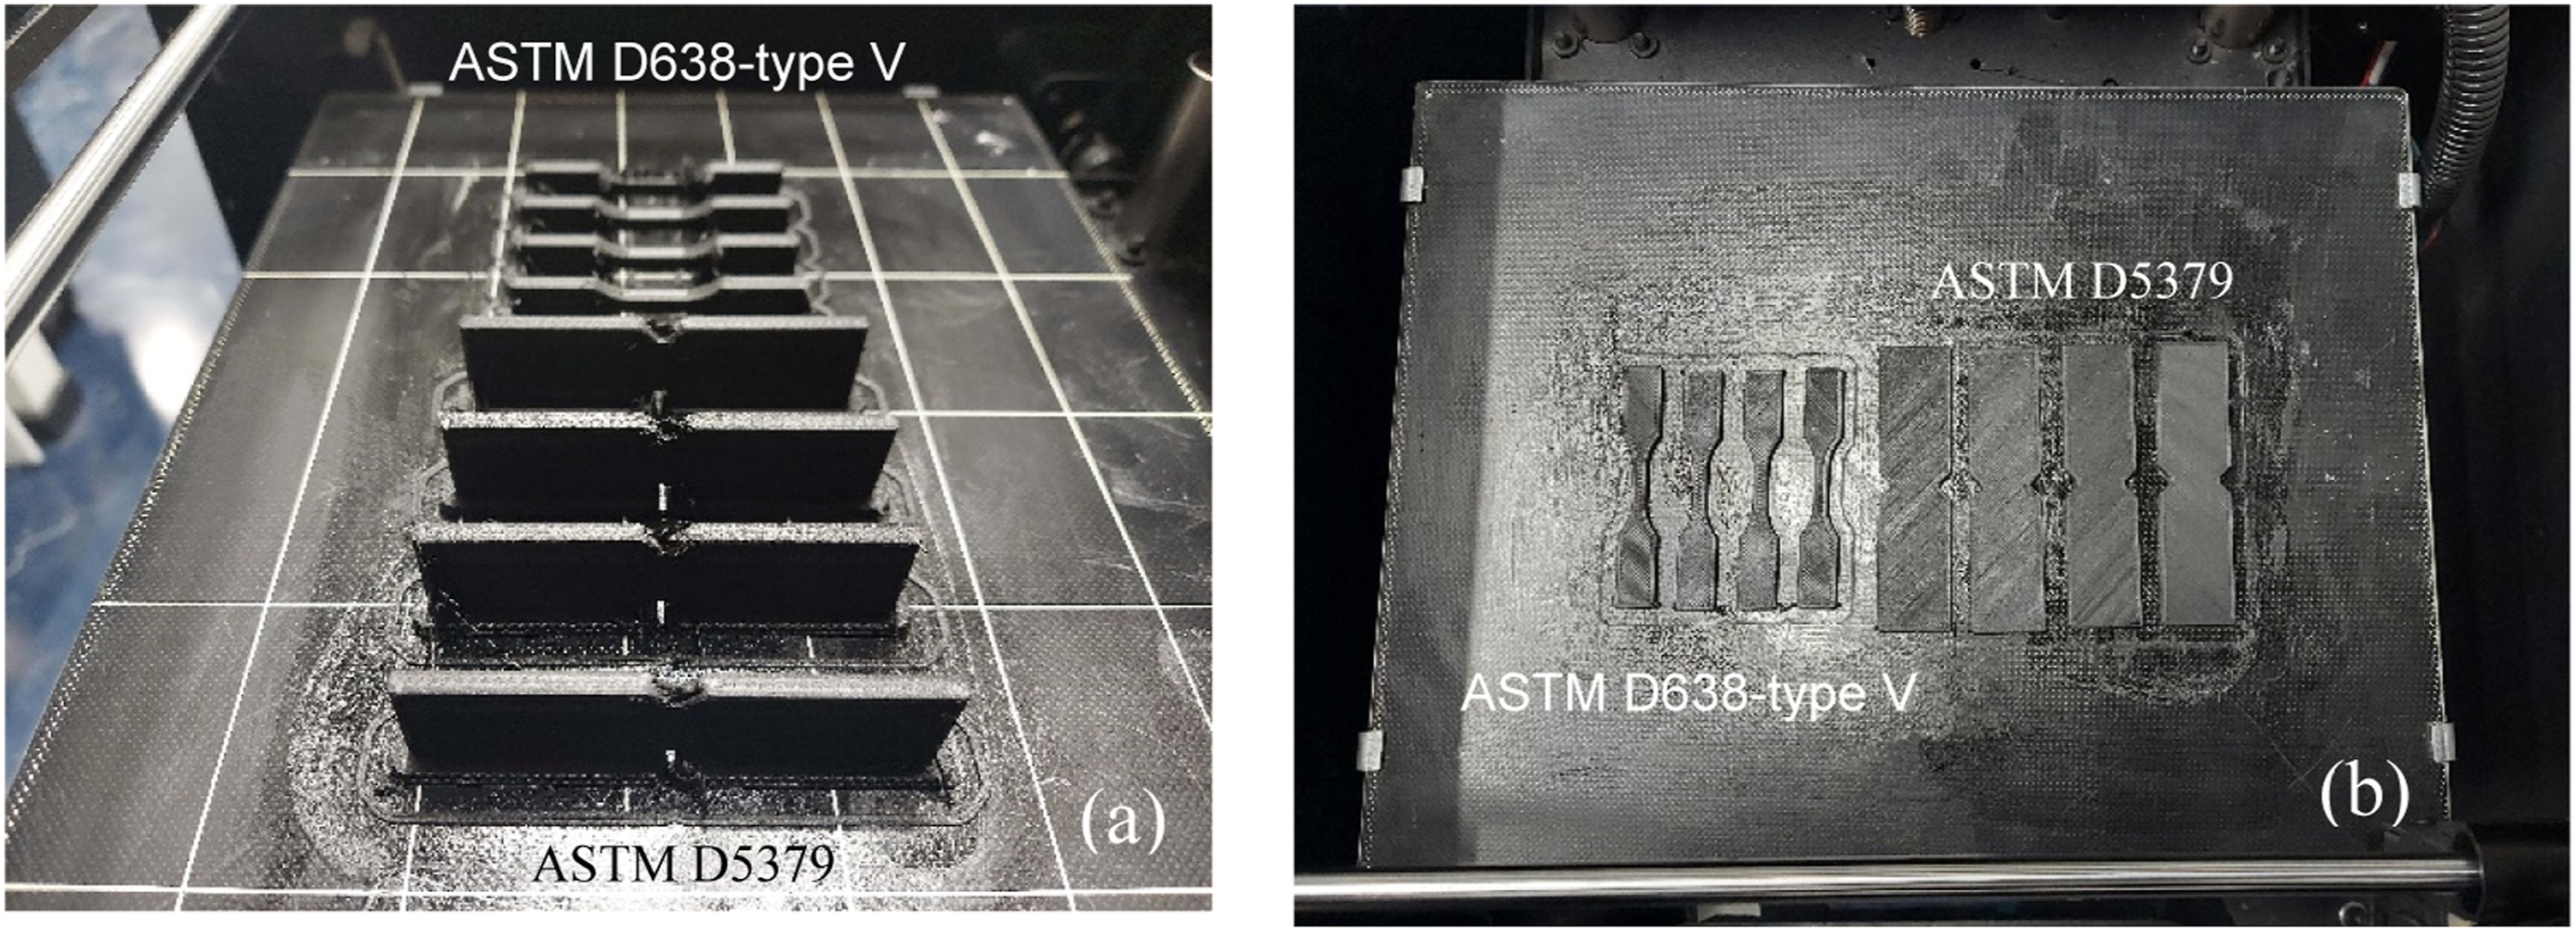
Mechanical characterization
Uniaxial tensile tests were performed on samples (fabricated as outlined in material and sample preparation) according to ASTM D638 under displacement control by straining at a rate of 1 mm/min using a universal tensile test machine (Tenson).
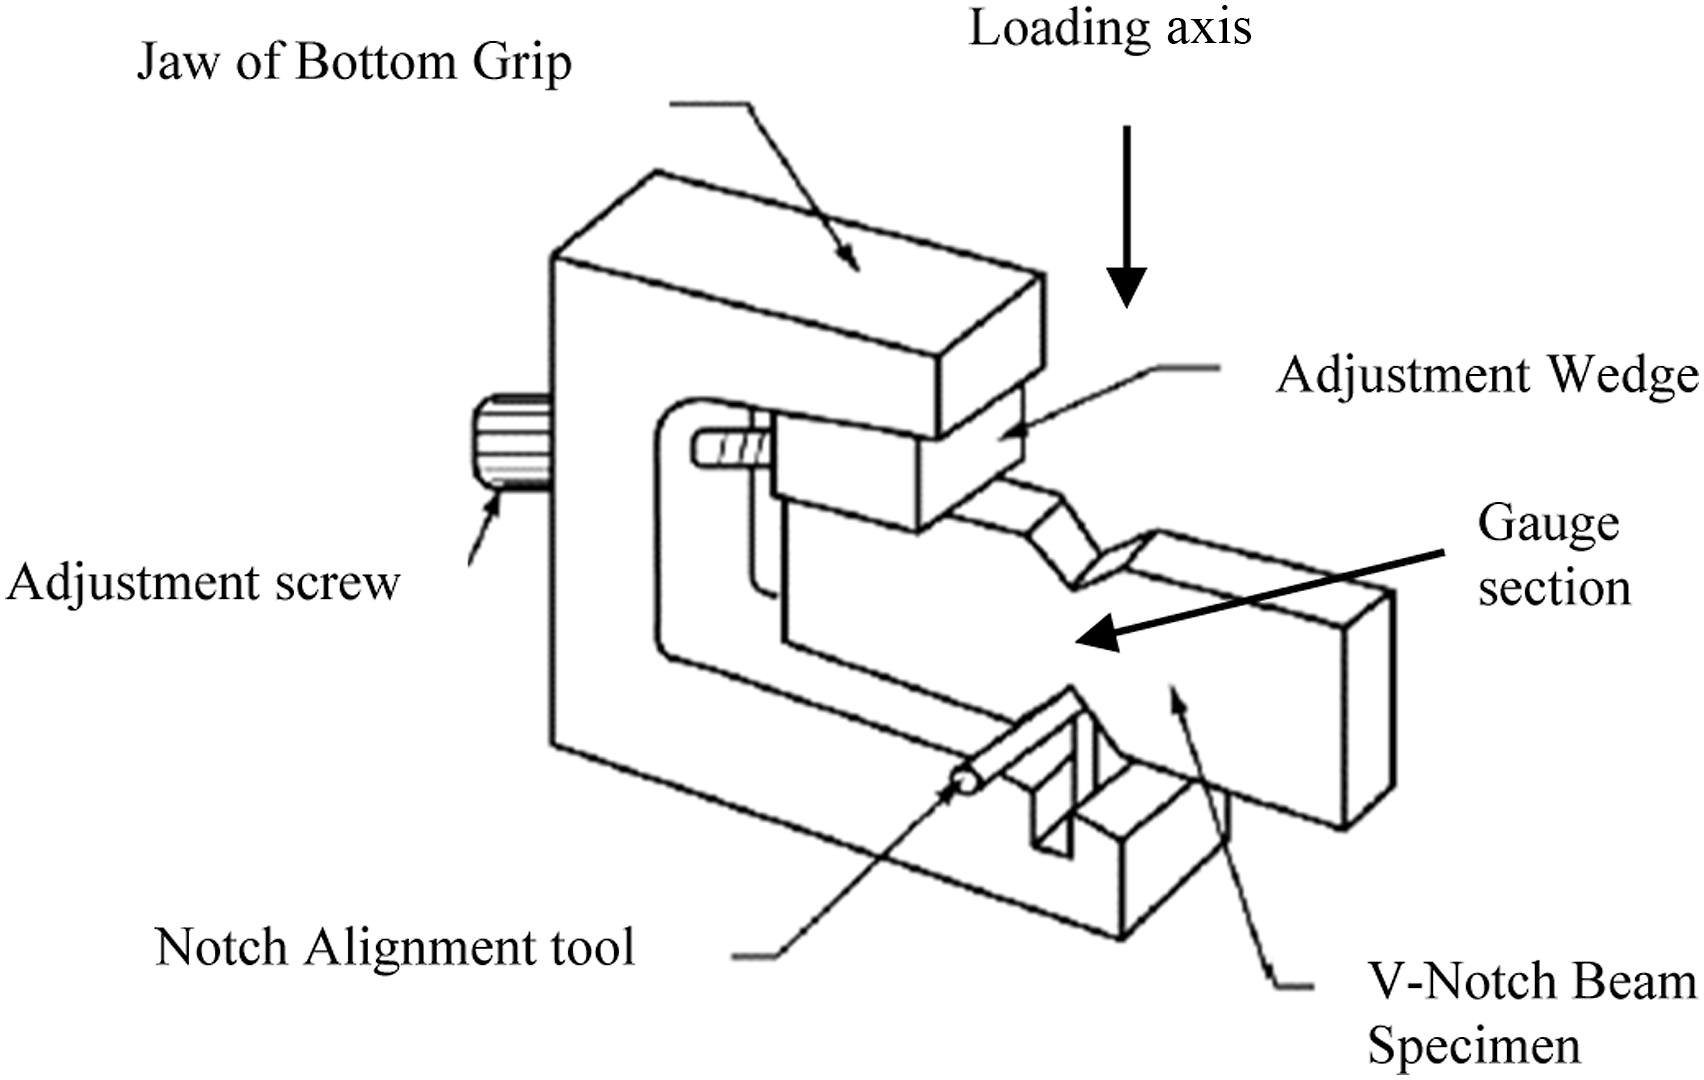
The shear property of samples was investigated by V-notched beam method in accordance ASTM D5379M-12 using a v-notched beam test fixture. Test specimen insertion procedure is as follows: • First, the jaw of each grip was loosened sufficiently to allow the specimen width to be freely inserted into the grip with clearance. Then, the movable head position was adjusted until the grips were approximately aligned vertically. • The specimen was placed loosely into both grips and the backside of the specimen flat is pressed against the back wall of the fixture. The specimen alignment tool was vertically pulled up into the notch to center the specimen v-notch relative to the fixture in accordance with Figure 4. • While keeping the specimen centered, the left-hand-side jaw (on the lower grip) was lightly tightened to fix the specimen. Then, the testing machine head was moved until the upper surface of the upper grip just contacts the upper surface of the right-hand side of the specimen, without loading it. The jaw of the upper, right-hand, grip was then lightly tightened. Alignment of the specimen in the fixture.
Tests were performed at a constant head speed of 2 mm/min. Digital image correlation (DIC) technique was used to investigate the strain behavior of the samples during the shear test. First, the investigated surfaces were painted in white. Then speckle patterns were generated by spraying black aerosol paint on the samples’ surface. A Full HD camera (SONY 7520A) was used to record the deformation of the interested area during the test with a resolution of 2.1 megapixel. The recorded videos were processed in GOM software (GOM Correlate Professional 2017, Braunschweig, Germany). In GOM, the facet size and grid overlapping were adjusted as 15 pixels and five pixels, respectively. Test setup is shown in Figure 5. Shear test setup.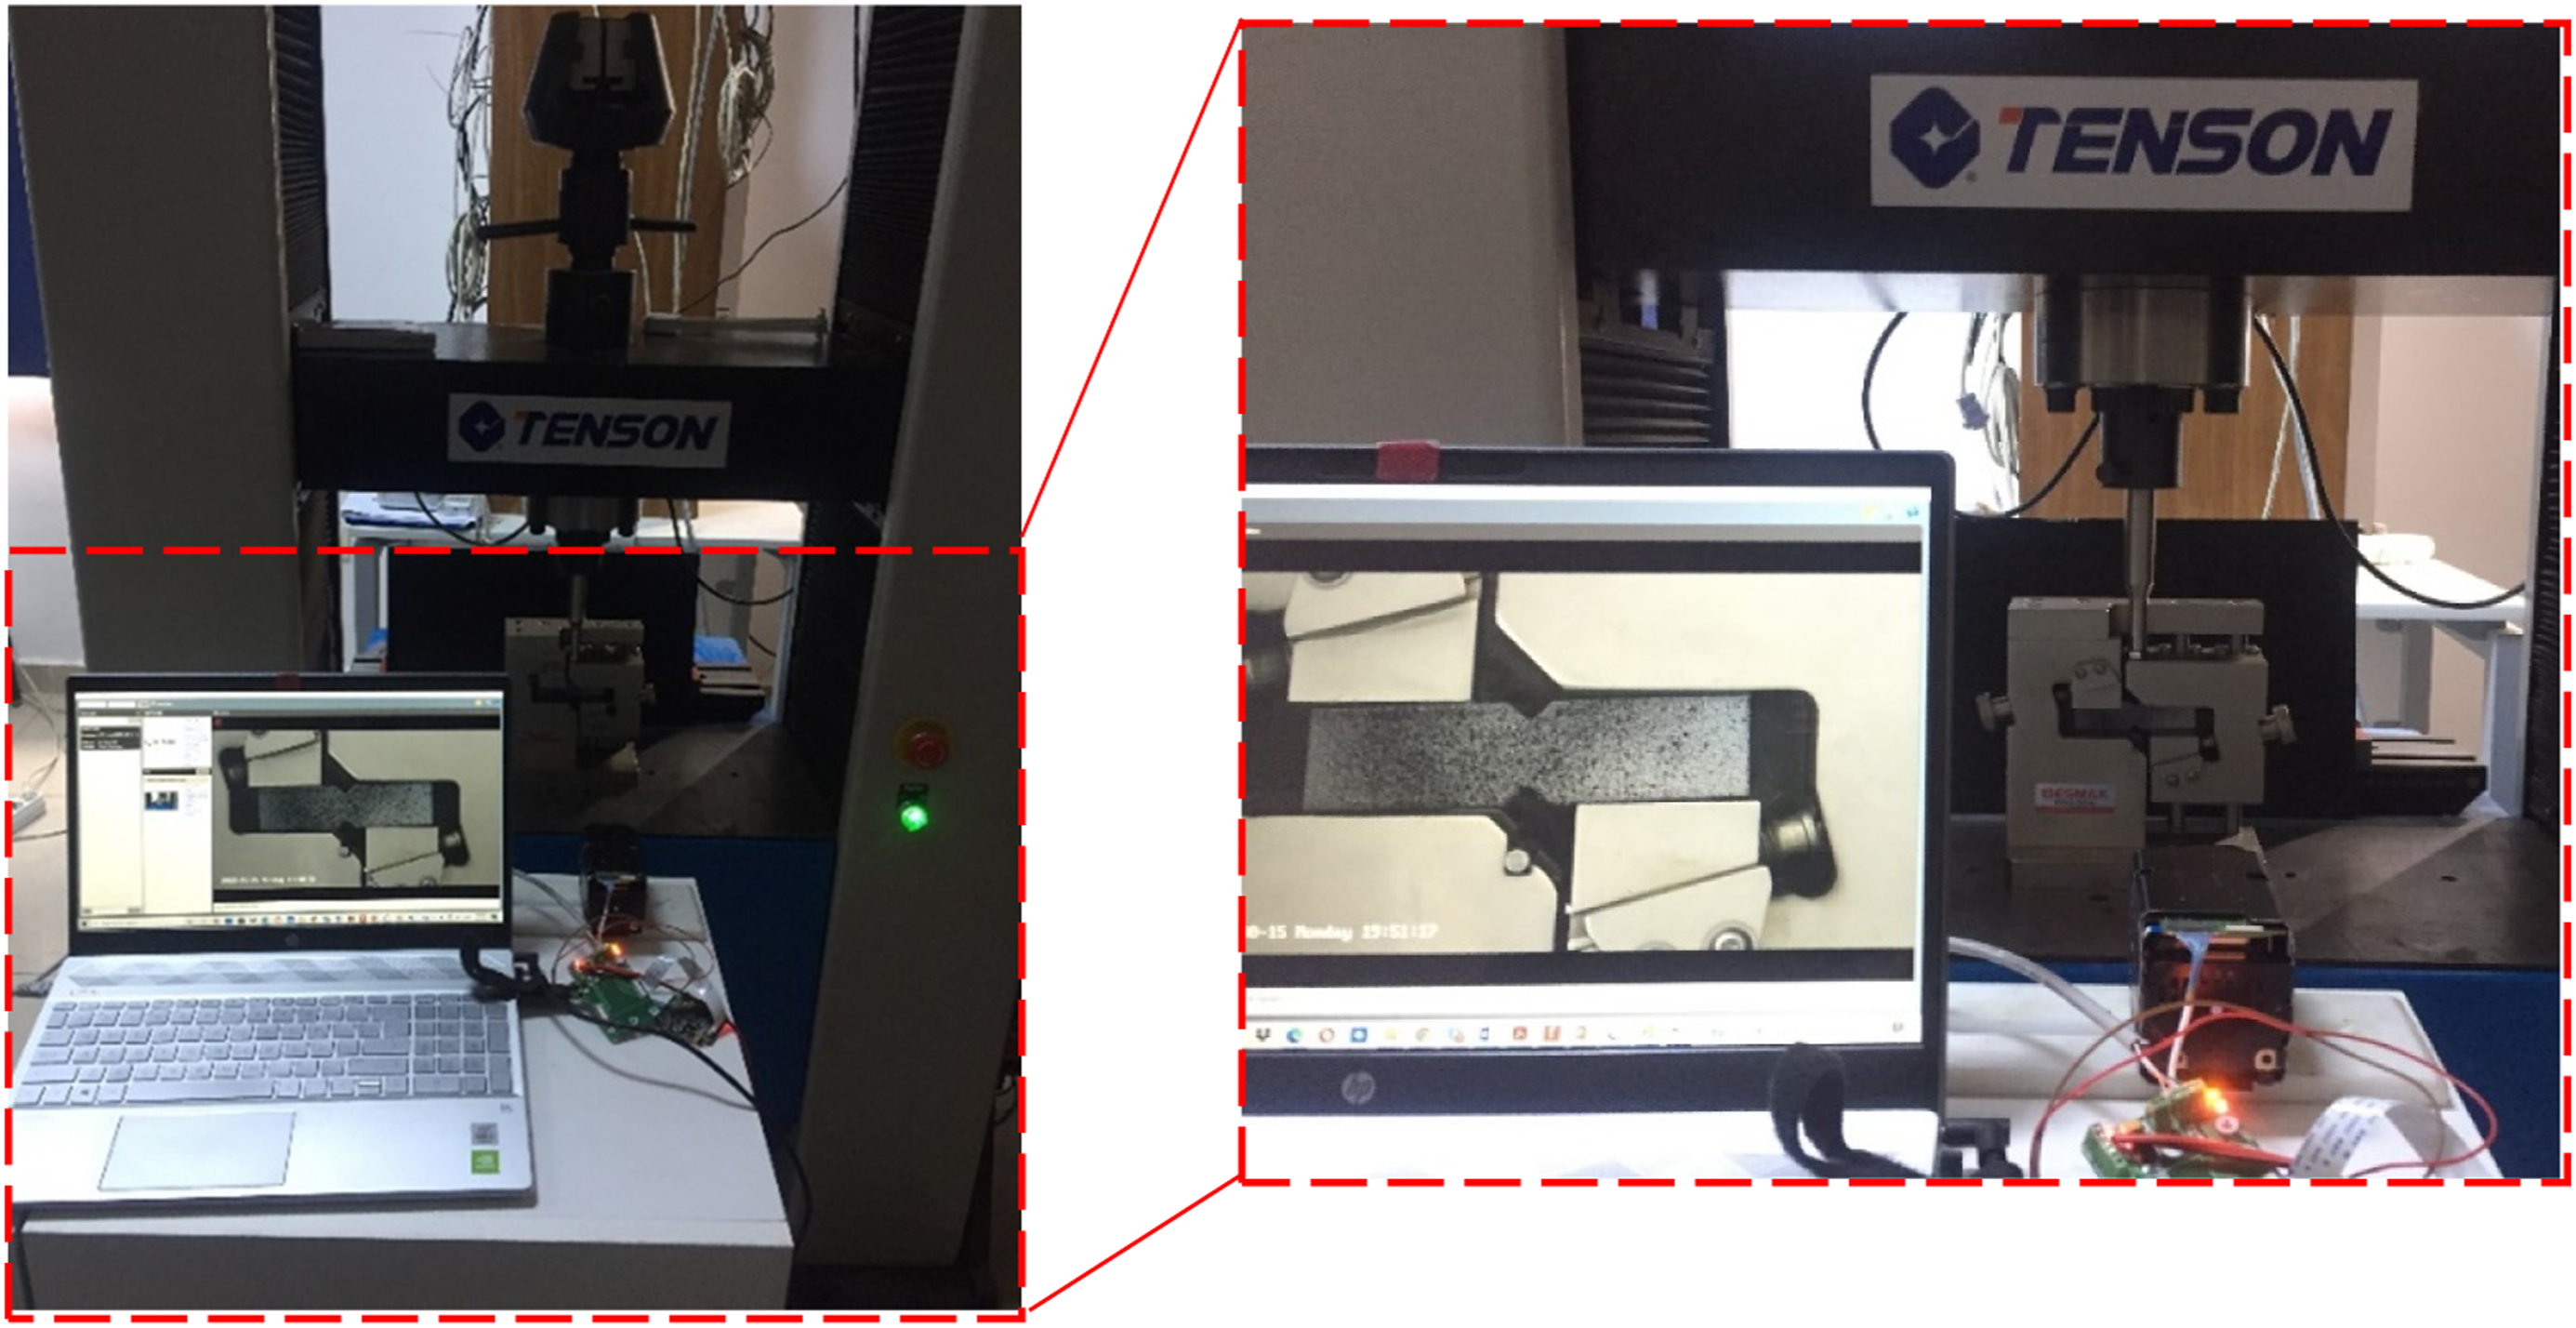
Shear Stress (τ) and Ultimate Strength (τu) were calculated using equations (1) and (2)
Equations (3) and (4) were used to calculate shear Strain (ϒ) and ultimate strain (ϒu)


ASTM D5379 suggests using two strain gauges with an active gauge length of 1.5 mm to not extend beyond the area in which the shear strain is uniform. According to ASTM the gauges should be centered about loading axis in the gauge section of the test specimen and mounted at +45° and −45° to the loading axis (see Figure 4). In this study, the obtained images were processed in GOM Software after each test. To determine the shear strain, the coordinate system was rotated 45° clockwise about the z-axis. Three, equally spaced and 0.75 mm apart, points were defined as reference points in the gauge section between notches parallel to the rotated y-axis (P1, P4, and P5) and x-axis (P1, P2, and P3). Note that the reference points were spaced and positioned within ASTM 5379 suggestion for the length and position of the strain gauges. The reference points and coordinate system are shown in Figure 6(b). Afterward, the strain data of the mentioned point was exported to MS Excel for further processing. The Measurement of shear strain using, (a) strain gauges, according to ASTM D5379, (b) DIC technique, the reference points to calculate shear strain along the x-axis and y-axis are labeled with P1-P5.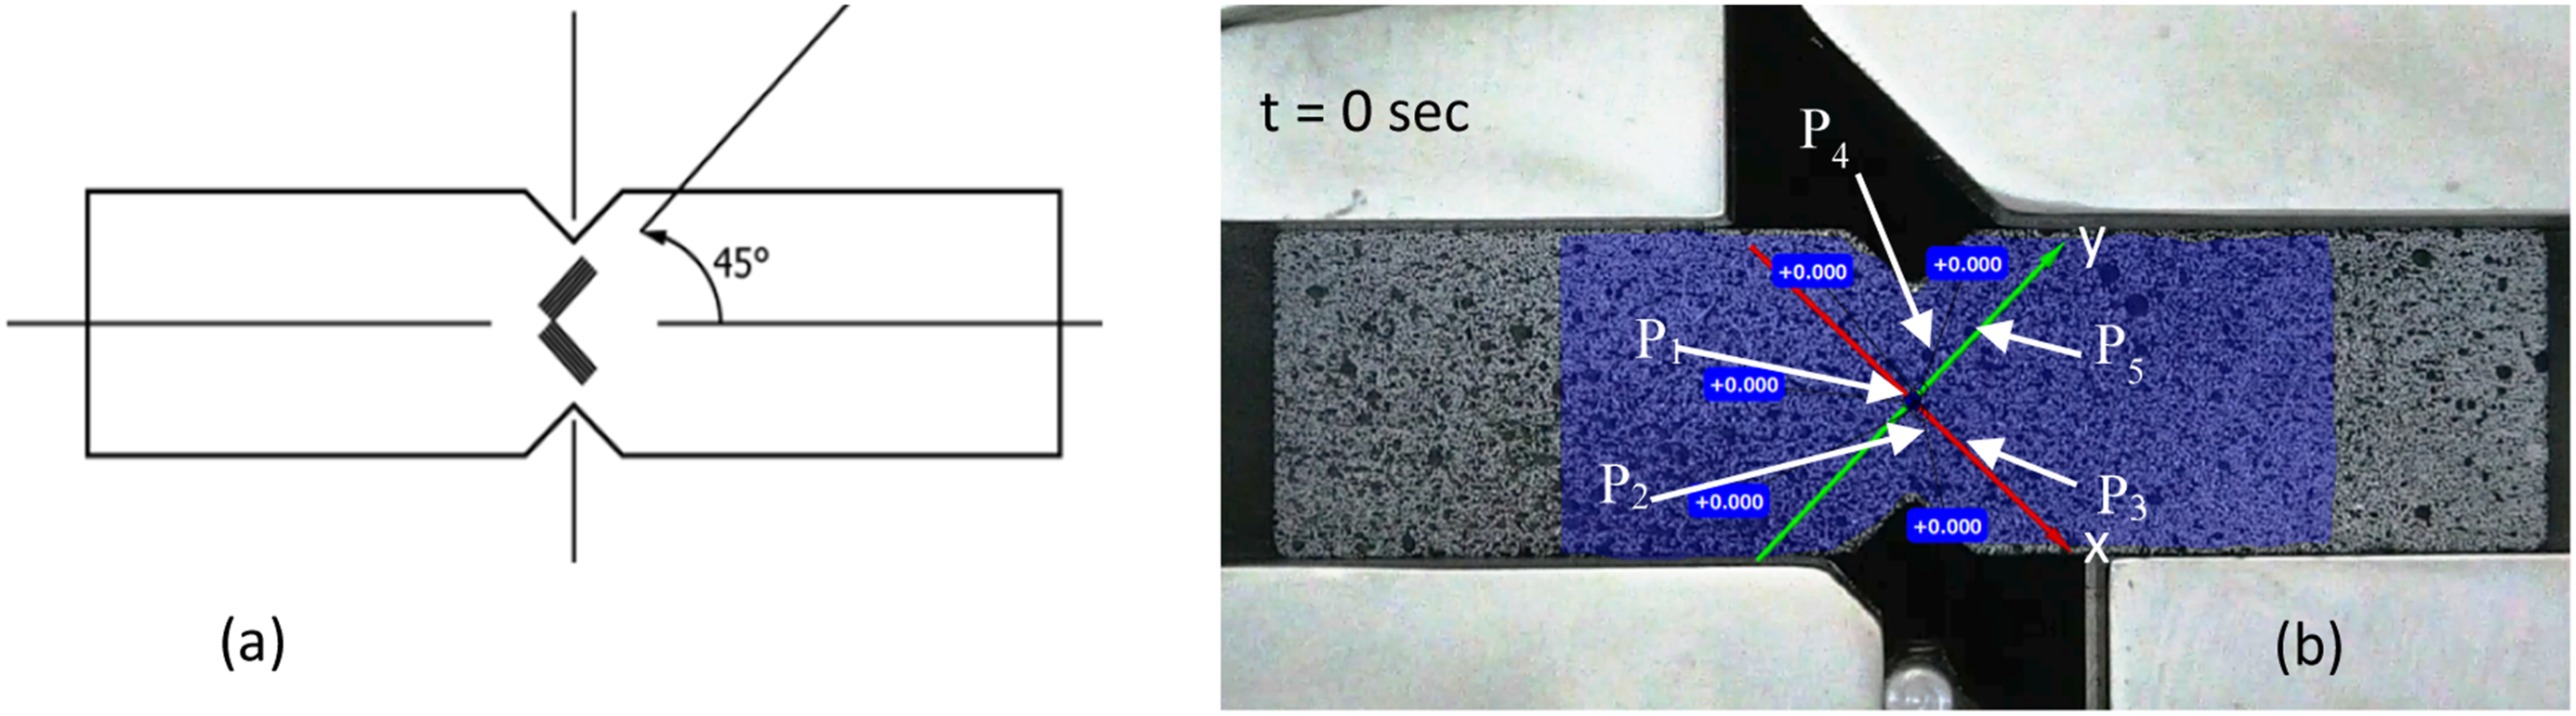
Results and discussions
Figure 7 shows stress versus strain diagrams of samples printed at flat and on-edge orientations. For CFPET, the average tensile strength of Flat and On-edge samples was measured as 98 ± 8 MPa and 91 ± 4 MPa, respectively. The elastic modulus of the samples printed at flat orientation was measured as 4.7 ± 0.5 GPa while an average elastic modulus of 4.5 ± 0.5 GPa was calculated for on-edge samples. Stress versus strain diagram of printed samples at flat and on-edge orientations.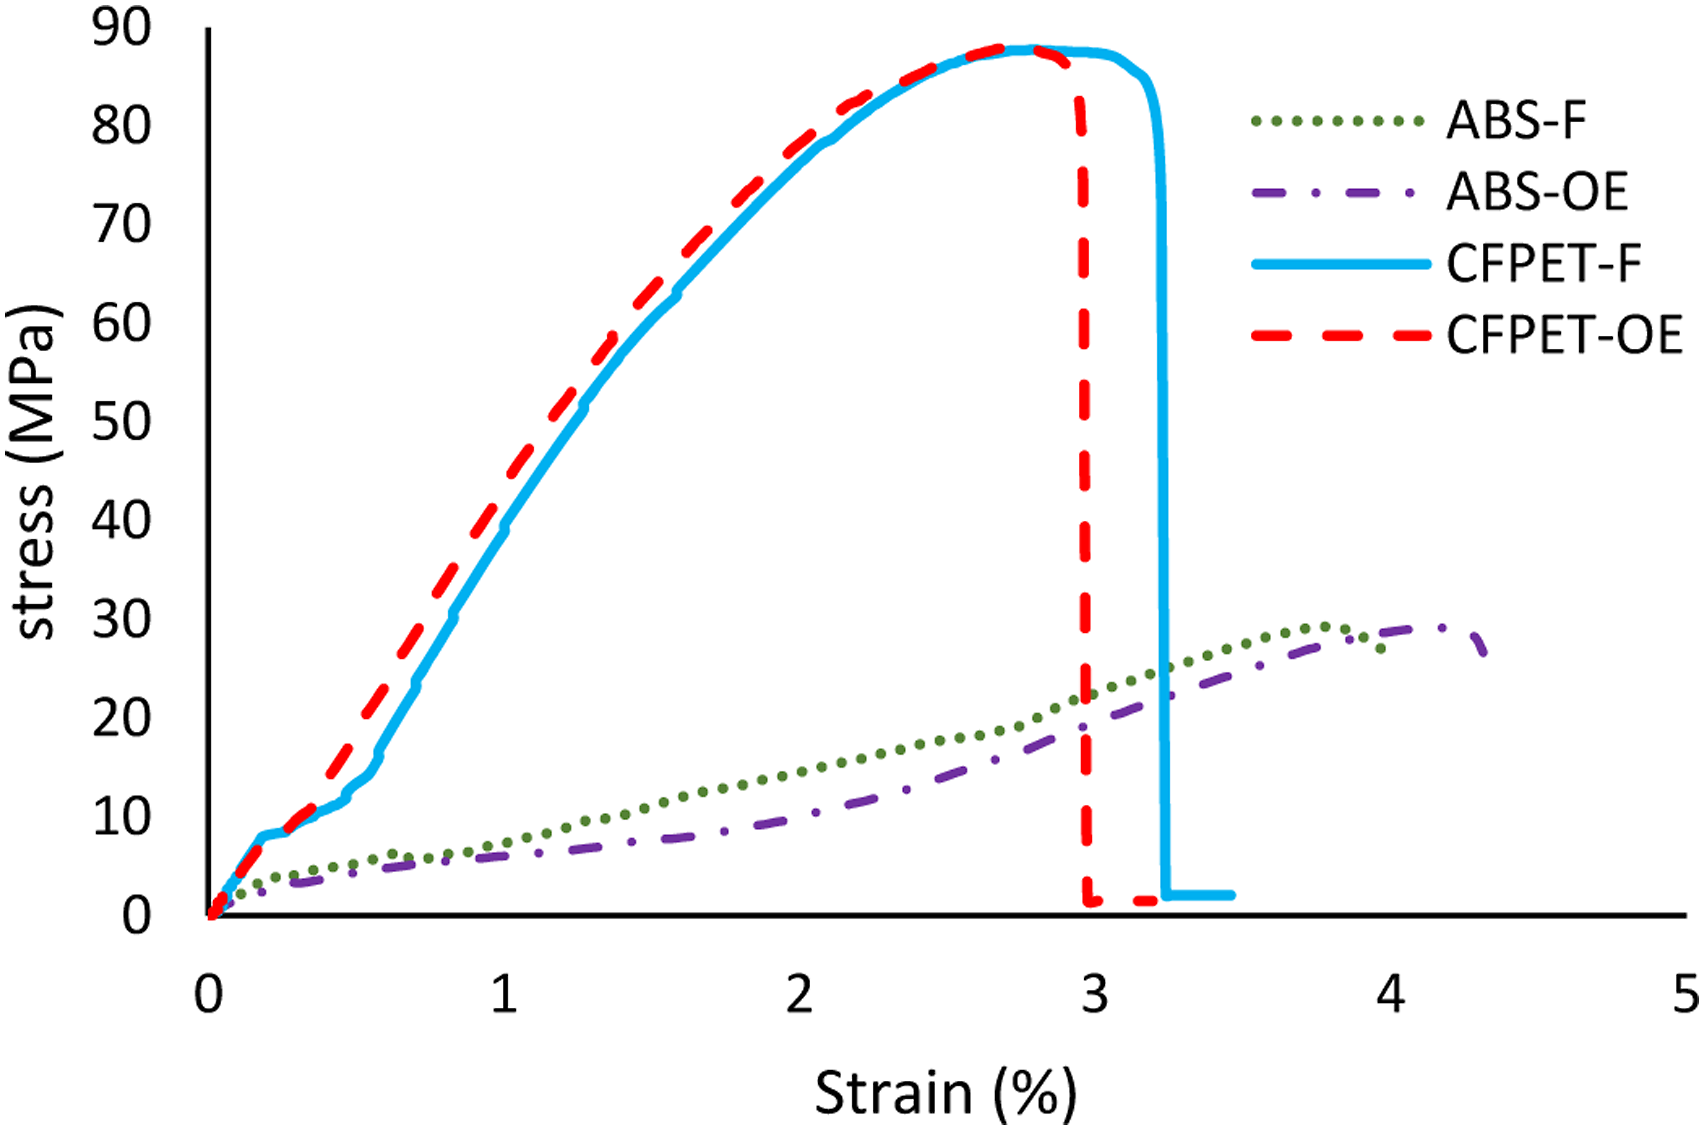
The tensile strength and elastic modulus of ABS samples at flat configuration were measured as 29 ± 2 MPa and 1.7±0.1 GPa while for on-edge orientation the measured strength and elastic modulus were 28 ± 3 MPa and 1.9±0.1 GPa, respectively. These findings are consistent with the typical mechanical properties of ABS material reported in the literature.
In Tymrak, Kreiger, and Pearce, 39 the elastic modulus and average tensile strength for ABS printed at flat orientation were found as 1.7 GPa and 29.5 MPa, and in Cantrell, Rohde, Damiani et.al, 36 they were reported as 1.9 GPa 32.8 MPa, respectively. It is worth noting that the obtained mechanical properties can diverge depending on the supplier and their filament fabrication process. 5
Figure 8 shows the stress versus strain plot of the samples under the shear test. The summarized results in Table 1 show a significant difference in the shear strength between printing orientations with the flat orientation having the highest strength. Considering the presented results in Table 1, a noticeable anisotropy is observed in both ABS and CFPET samples. Thus, in contrast to isotropic materials, the shear modulus cannot be calculated as a function of elastic modulus and poison ratio. Typical V-Notched Beam shear stress versus shear strain Plots. Tensile and shear properties of ABS and CFPET printed at flat and on-edge orientations.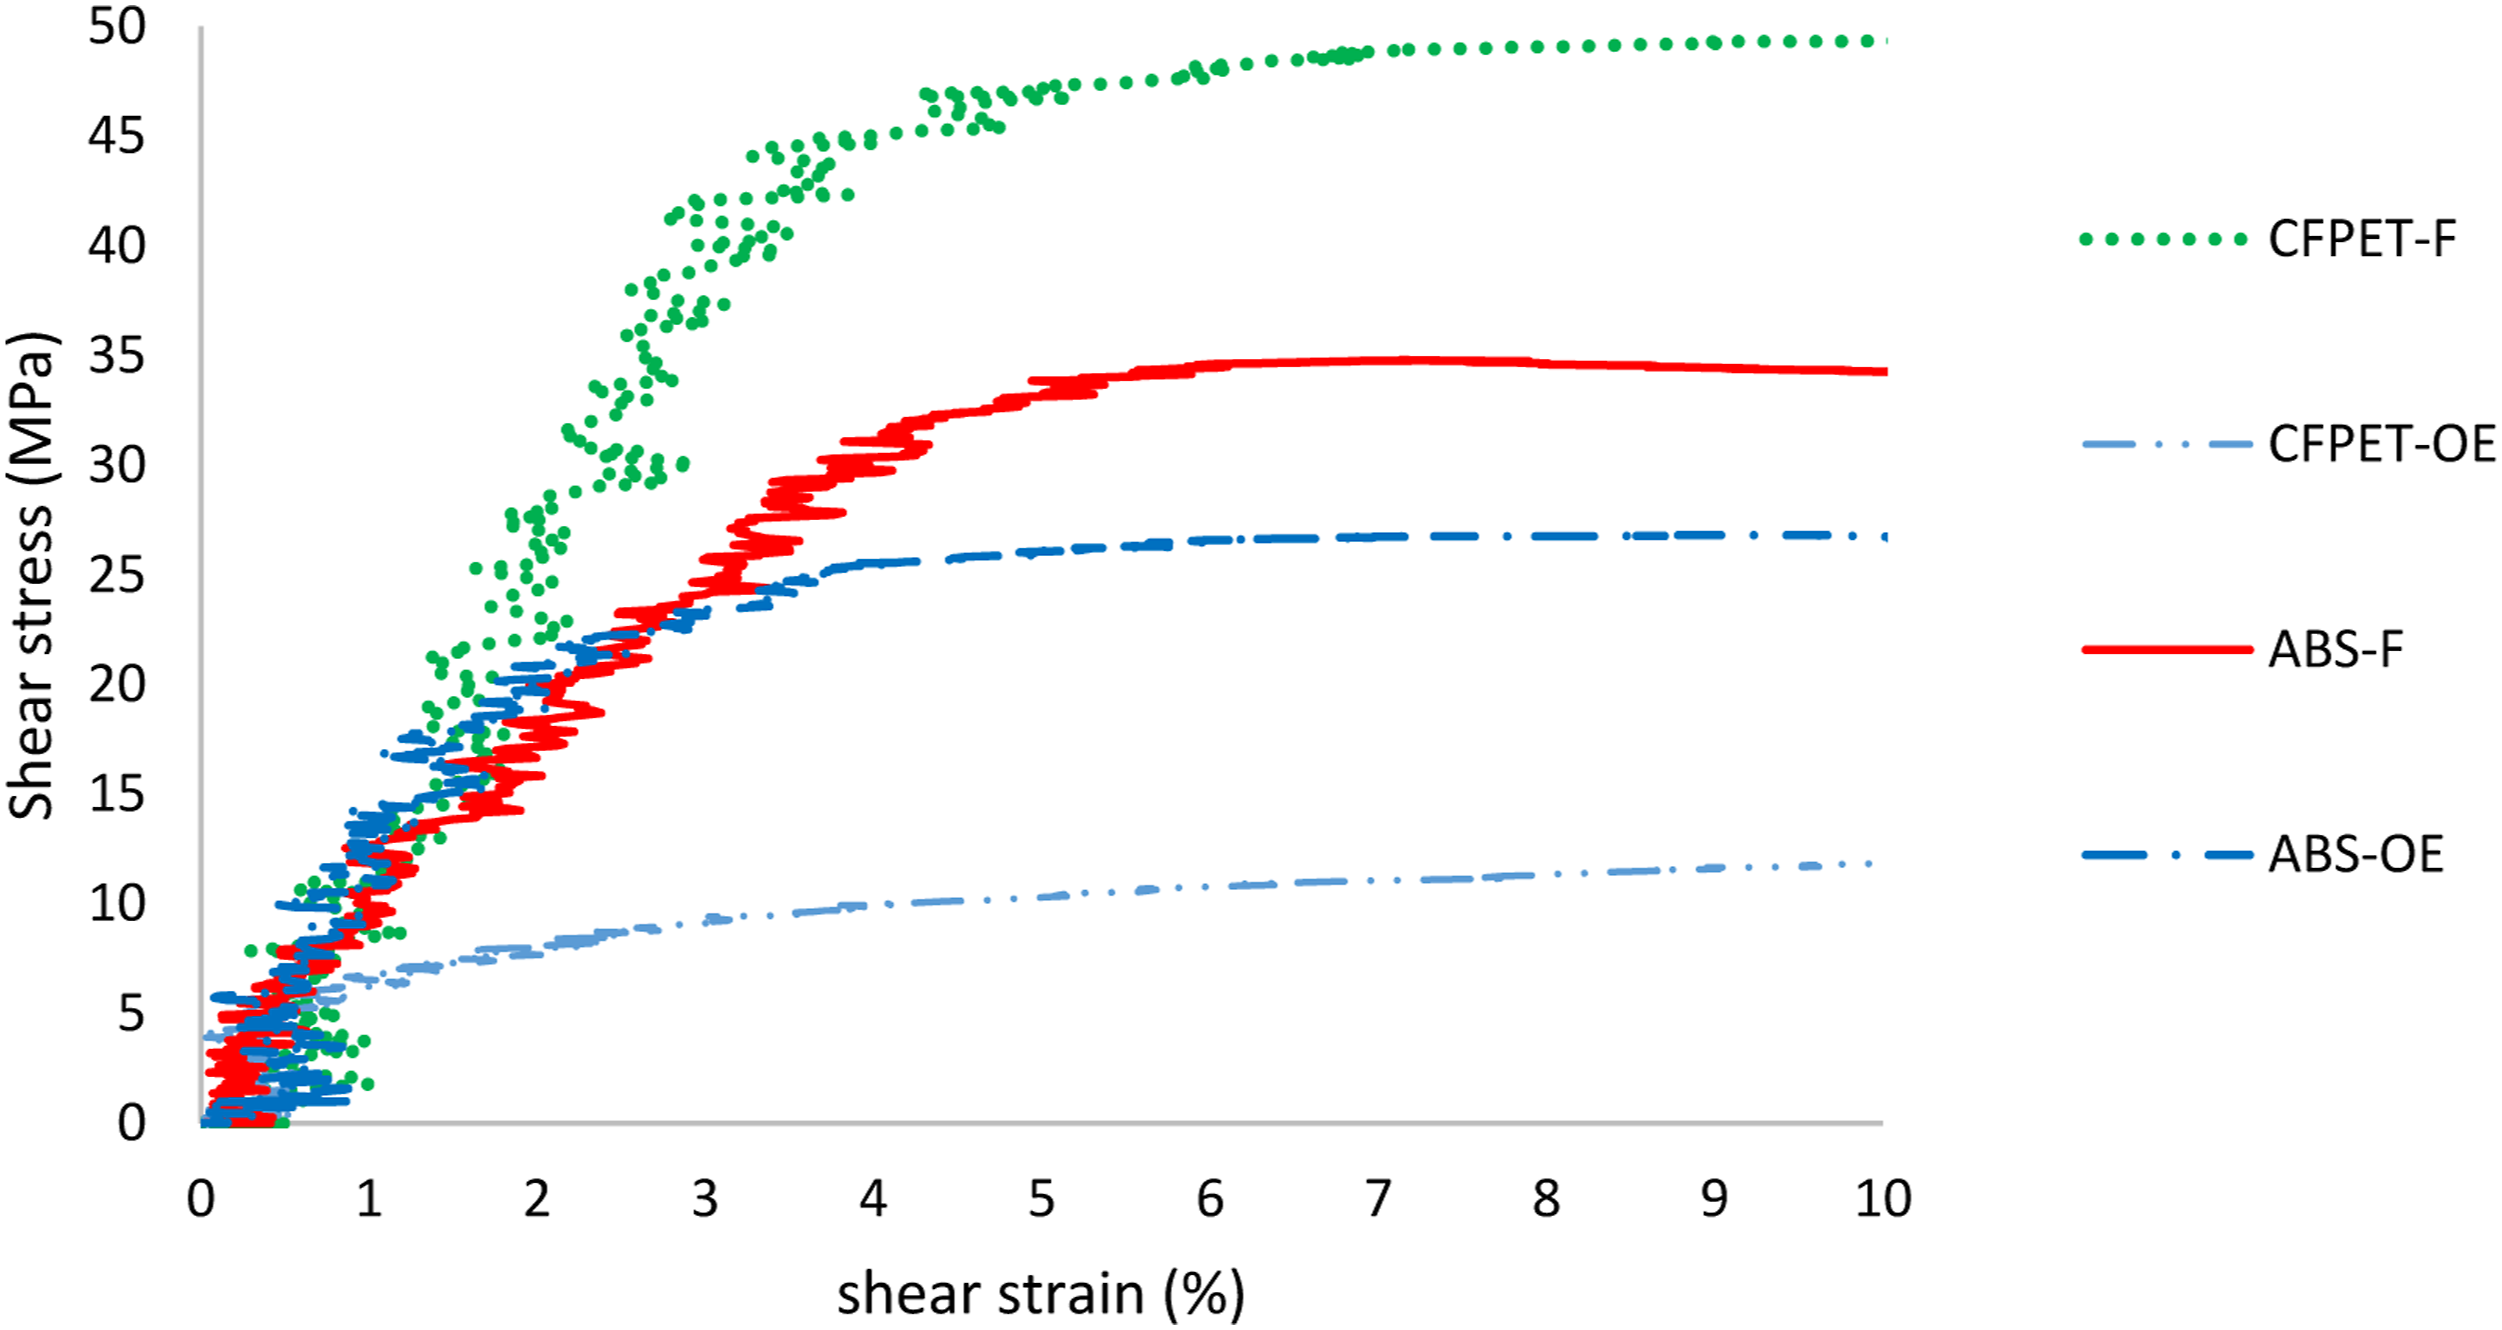
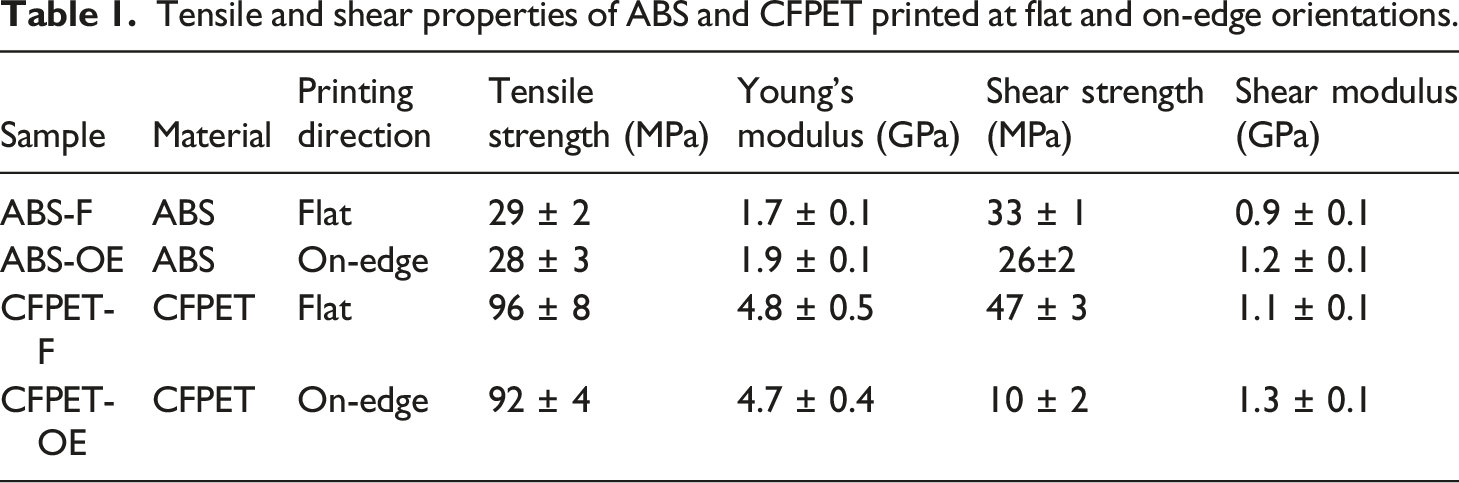
Figure 9 shows the shear strain distribution on the sample’s surface when the fracture starts. According to Figure 9(a), concentrated strain adjacent to the upper notch is observed at on-edge printed CFPET sample (Figures 9(c) and (d)), while for other samples, the maximum strains occurred at gauge section between notches. The lowest shear strength was observed at CFPET samples printed at on-edge orientation. The reason for these results is the delamination in the notched areas due to a weak adhesive bond between the deposited layers. Strain distribution of (a), (b) CFPET-F, (c), (d) CFPET-OE, (e), (f) ABS-F, and (g), (h) ABS-OE.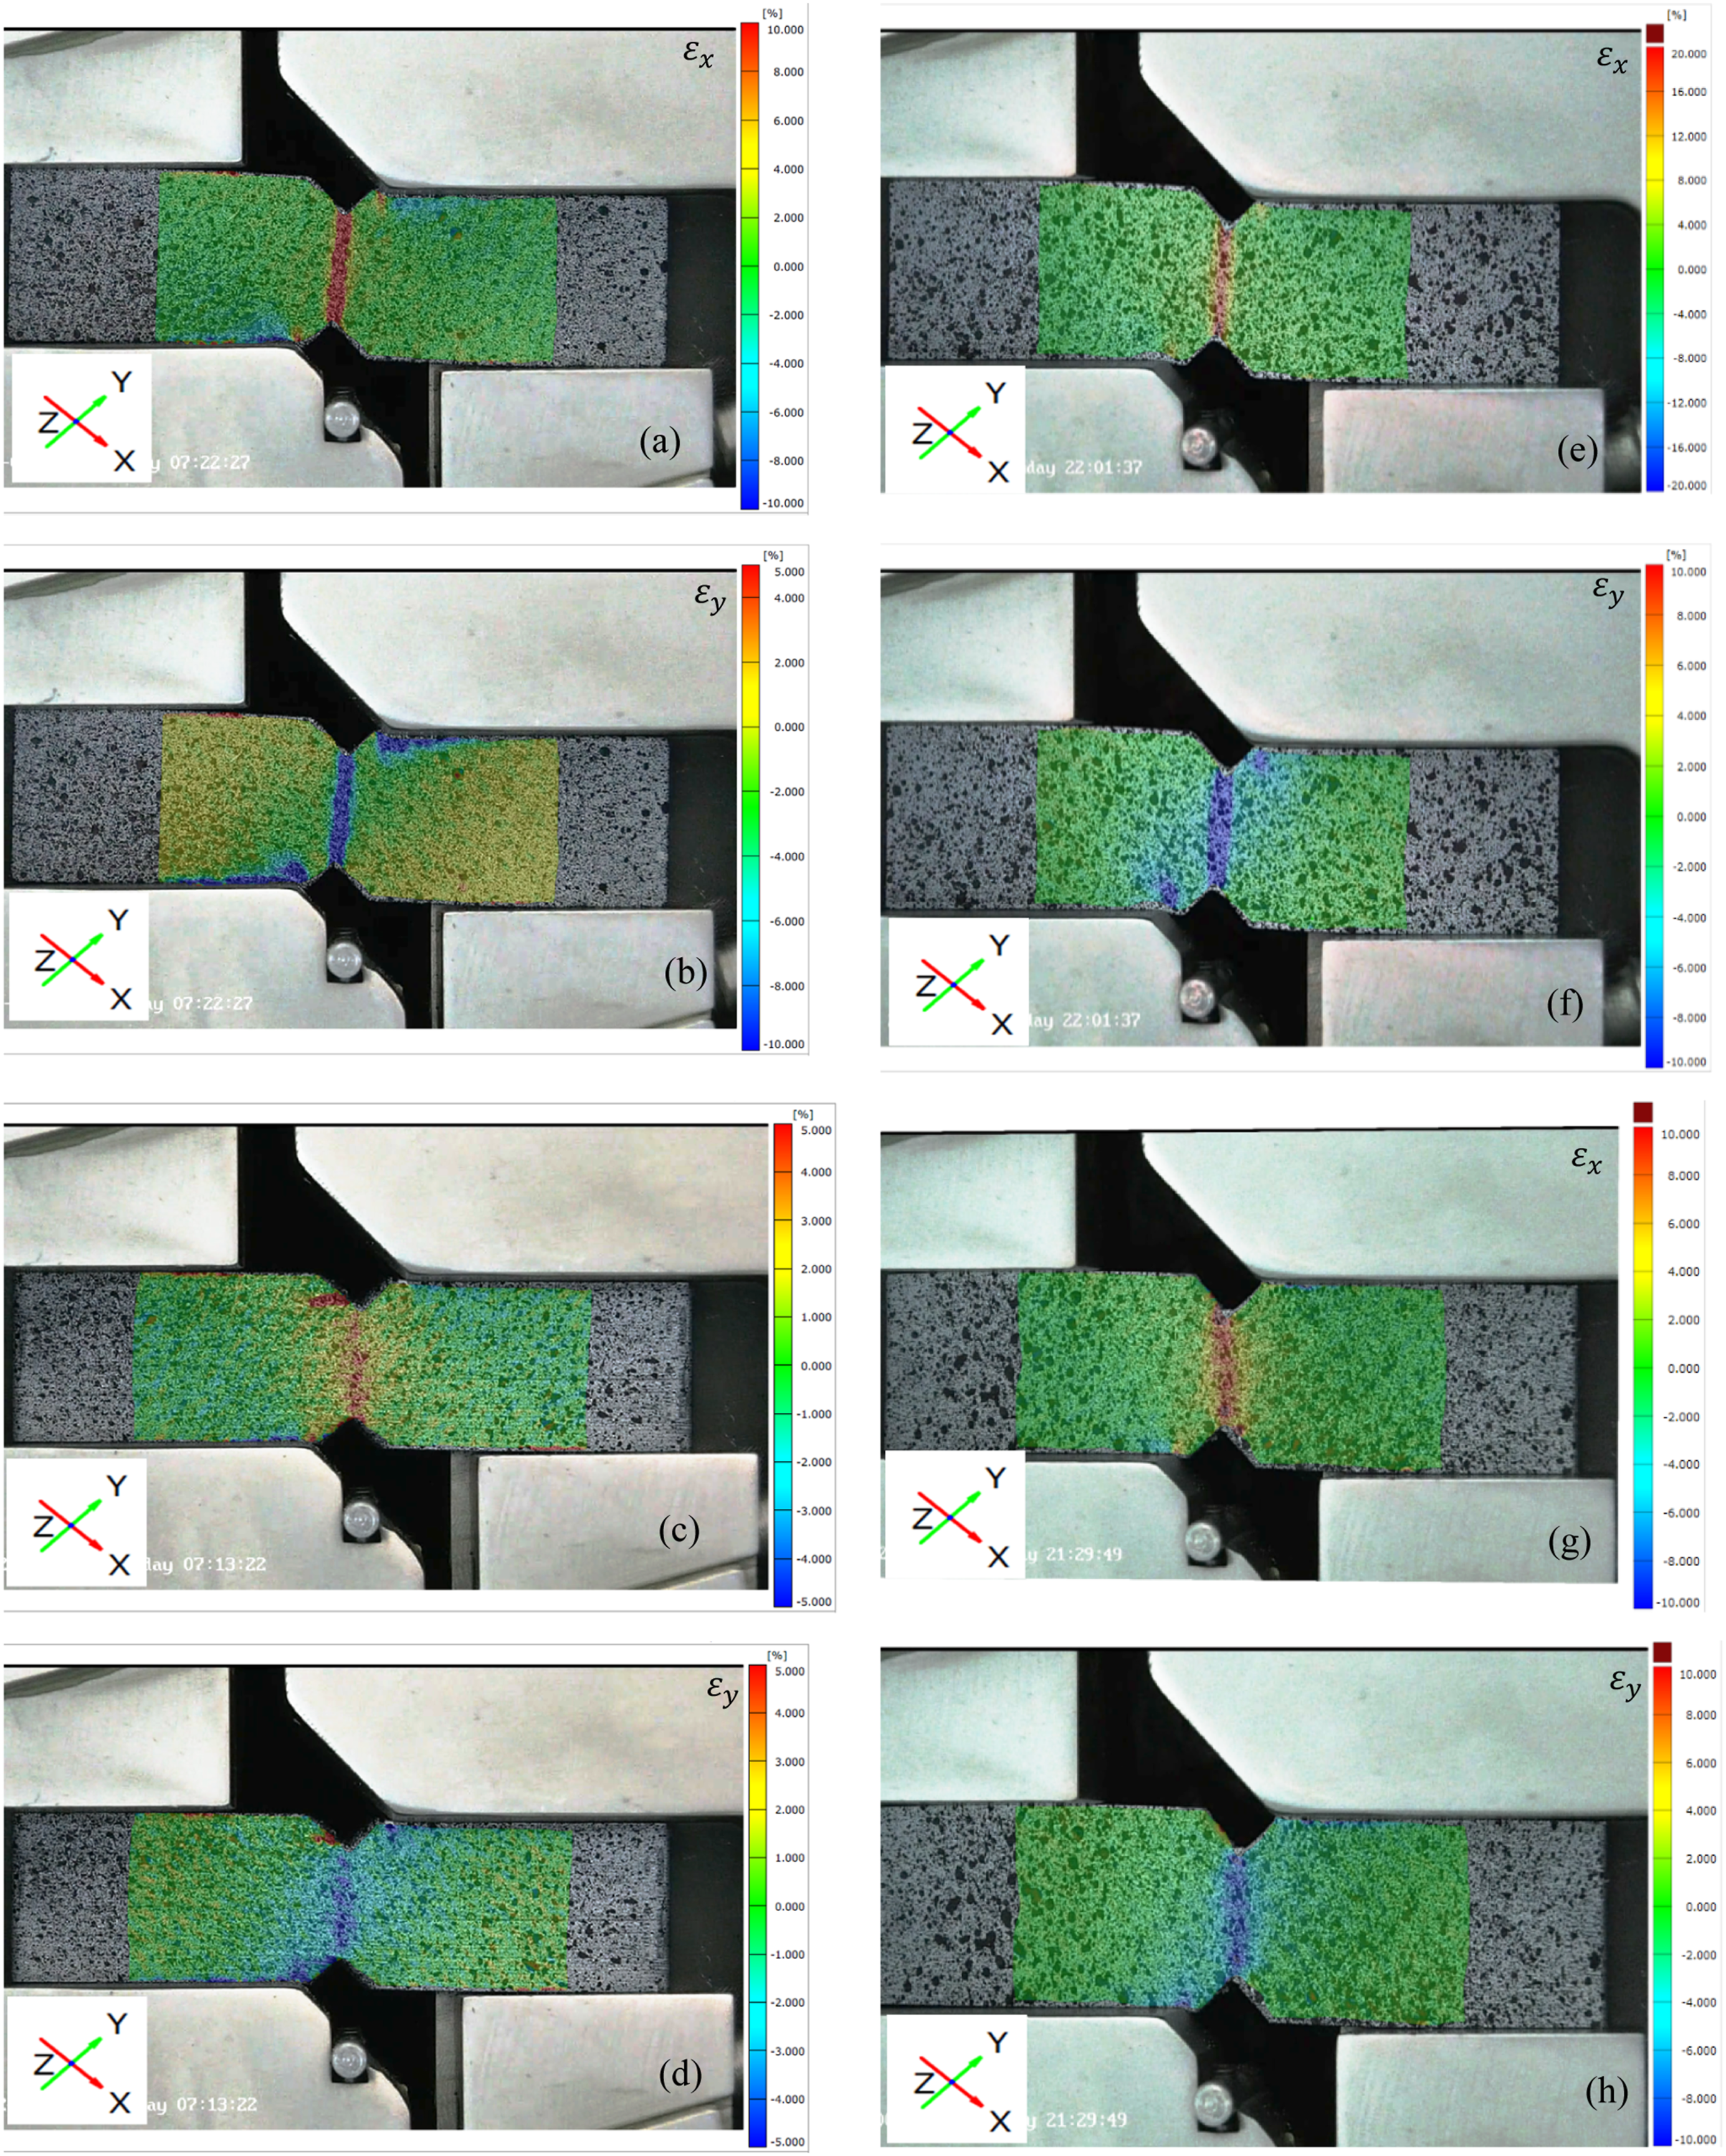
All tested specimens were also examined under optical microscopy for damage observation (Figure 10 and Figure 12). Optical microscopic images of the fractured surfaces under tensile loading are shown in Figure 10. For samples printed in flat orientation, fracture occurred at the middle portion of the gauge length (narrow section of the test specimen) while for on-edge printed samples, the fractured section was located at fillet connecting the gauge section to the grip section (see Figure 10(b)). Optical images of fractured surface under tensile loading for the samples printed at, (a) flat, and (b) on-edge directions.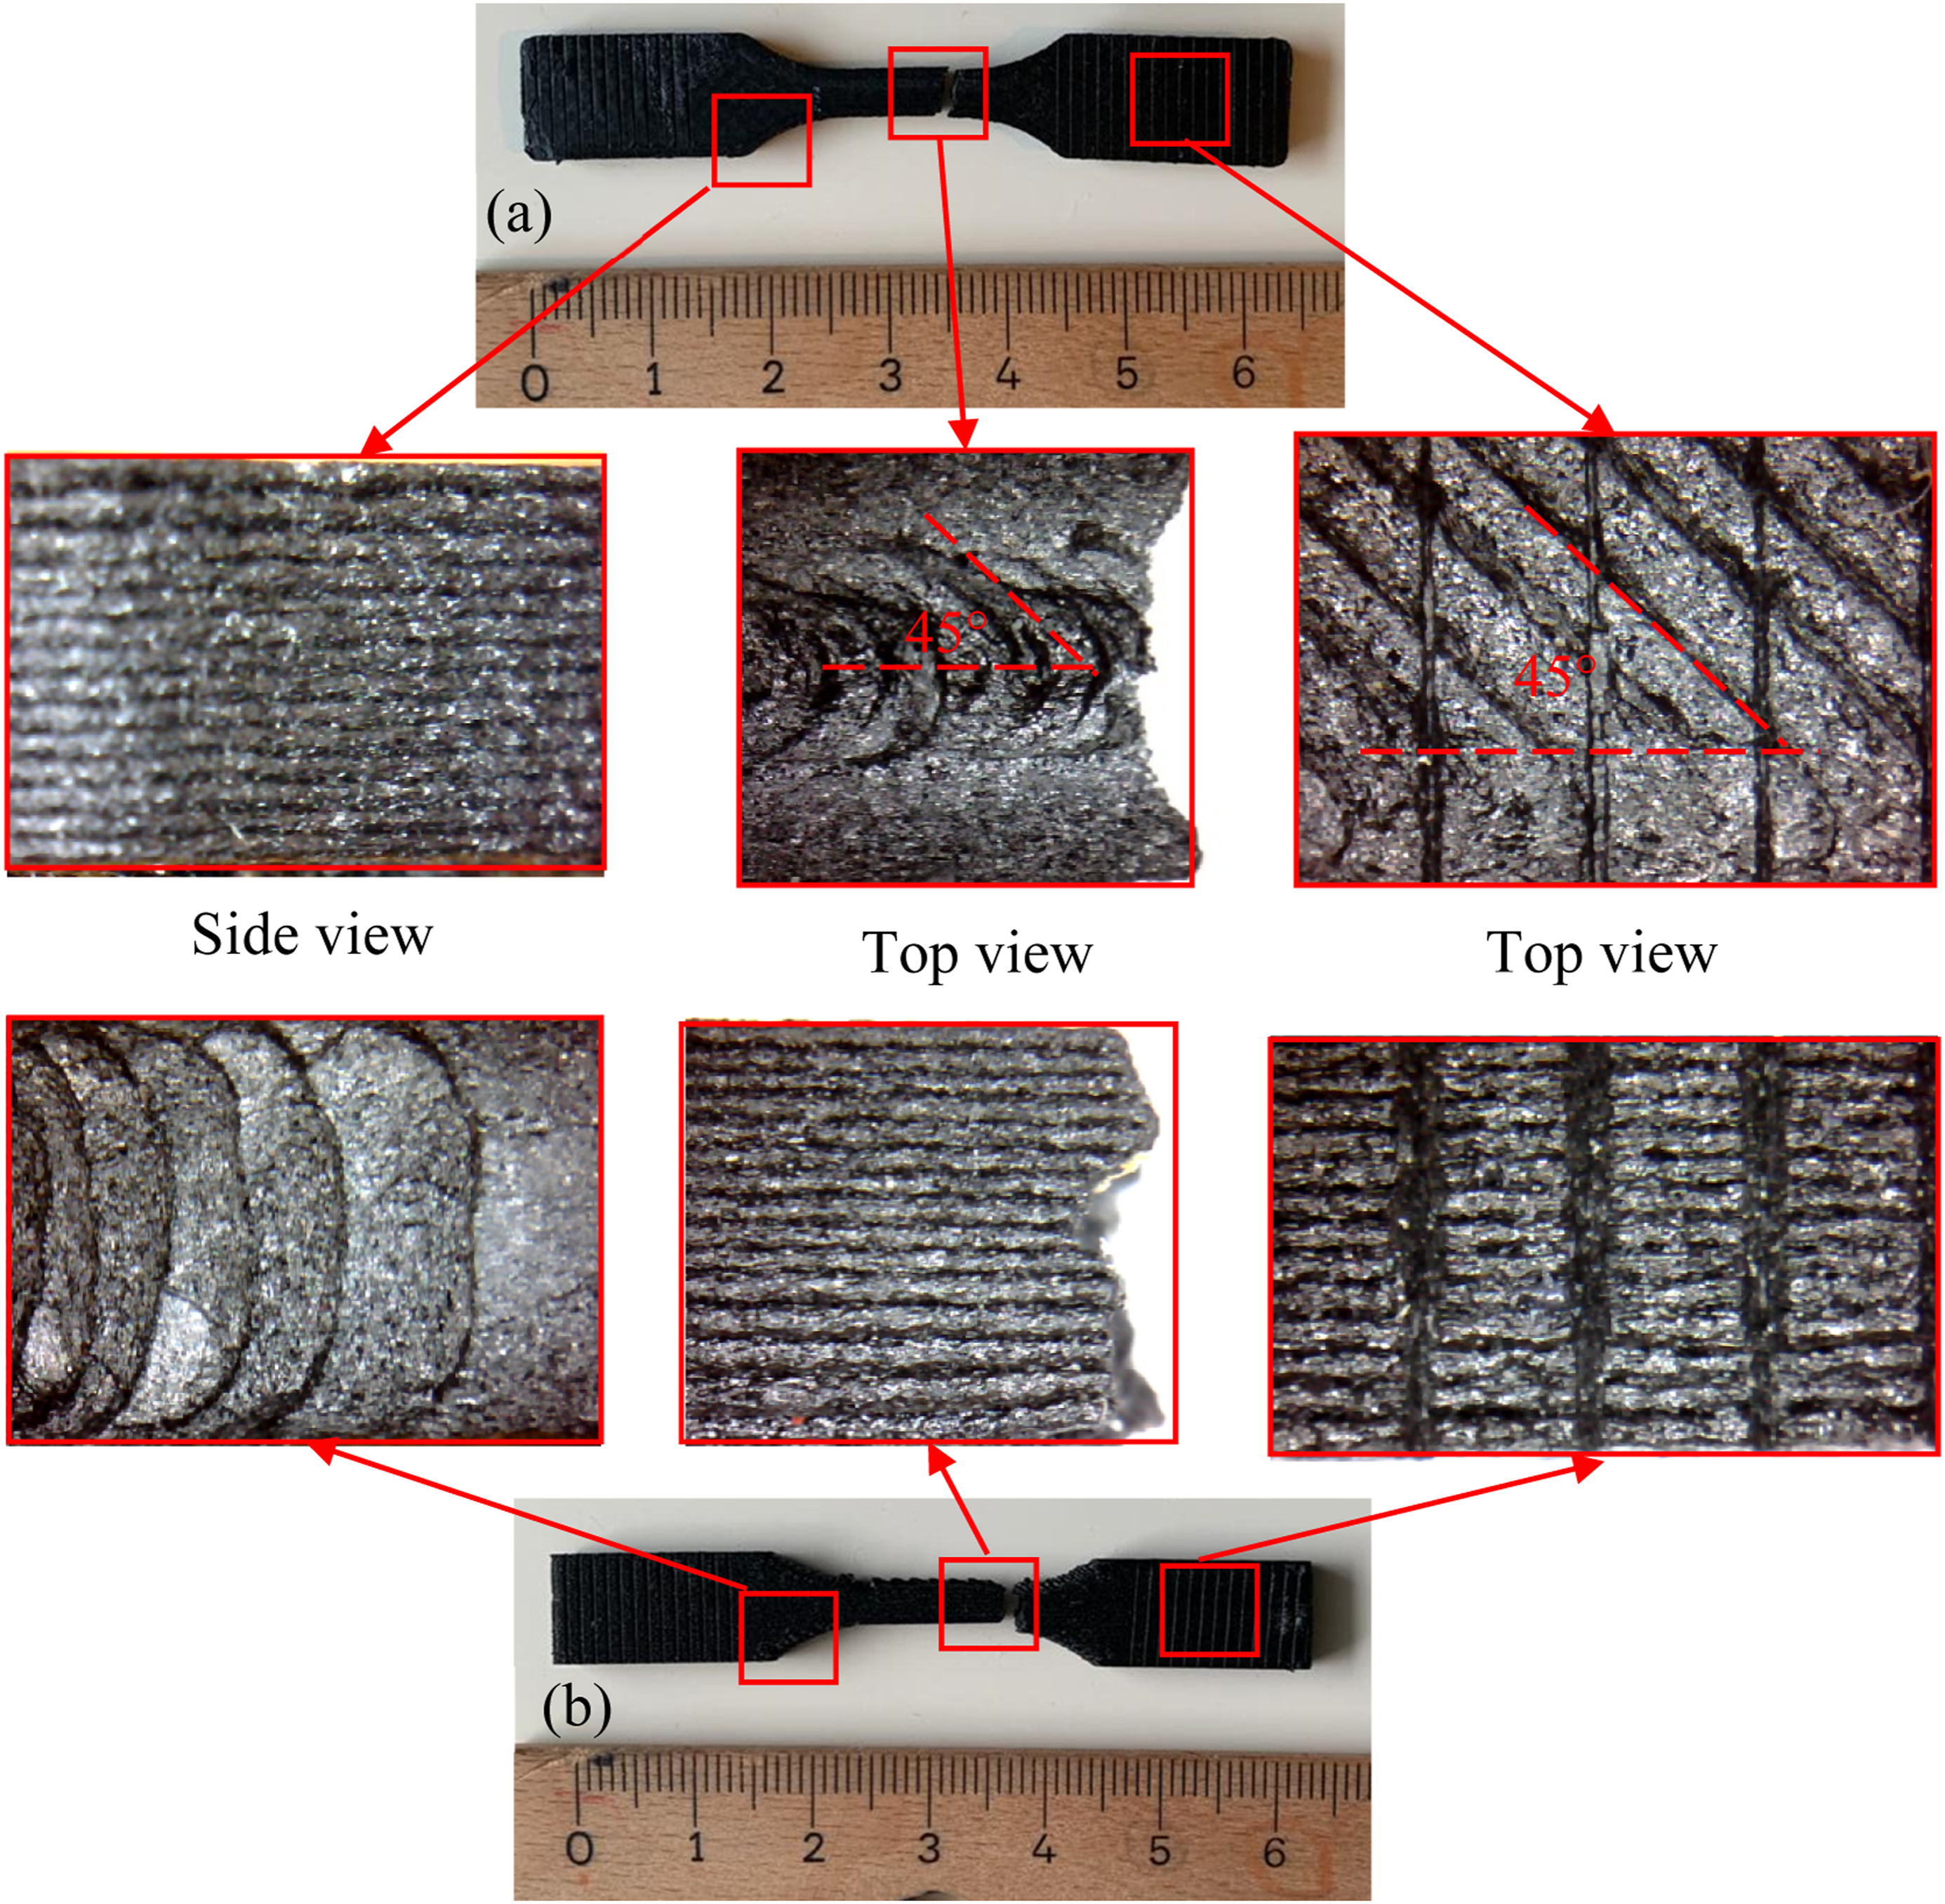
Figure 11 shows the SEM fracture interface of the specimens. For both printing configuration, fiber pull-out seems to be the main fracture mechanism. However, fiber breakage was also observed at fracture surface of the samples printed in flat orientation. Chopped carbon fibers in filament, owing to higher elastic modulus, carry the highest load on the specimen. This phenomenon was also observed in Takahashi et al.
40
In that work, they showed that fiber pull-outs in loading direction are the dominant failure mechanism in short fiber-reinforced polymers. SEM of fractured surface under tensile loading, (a) CFPET-F, (b) CFPET-OE.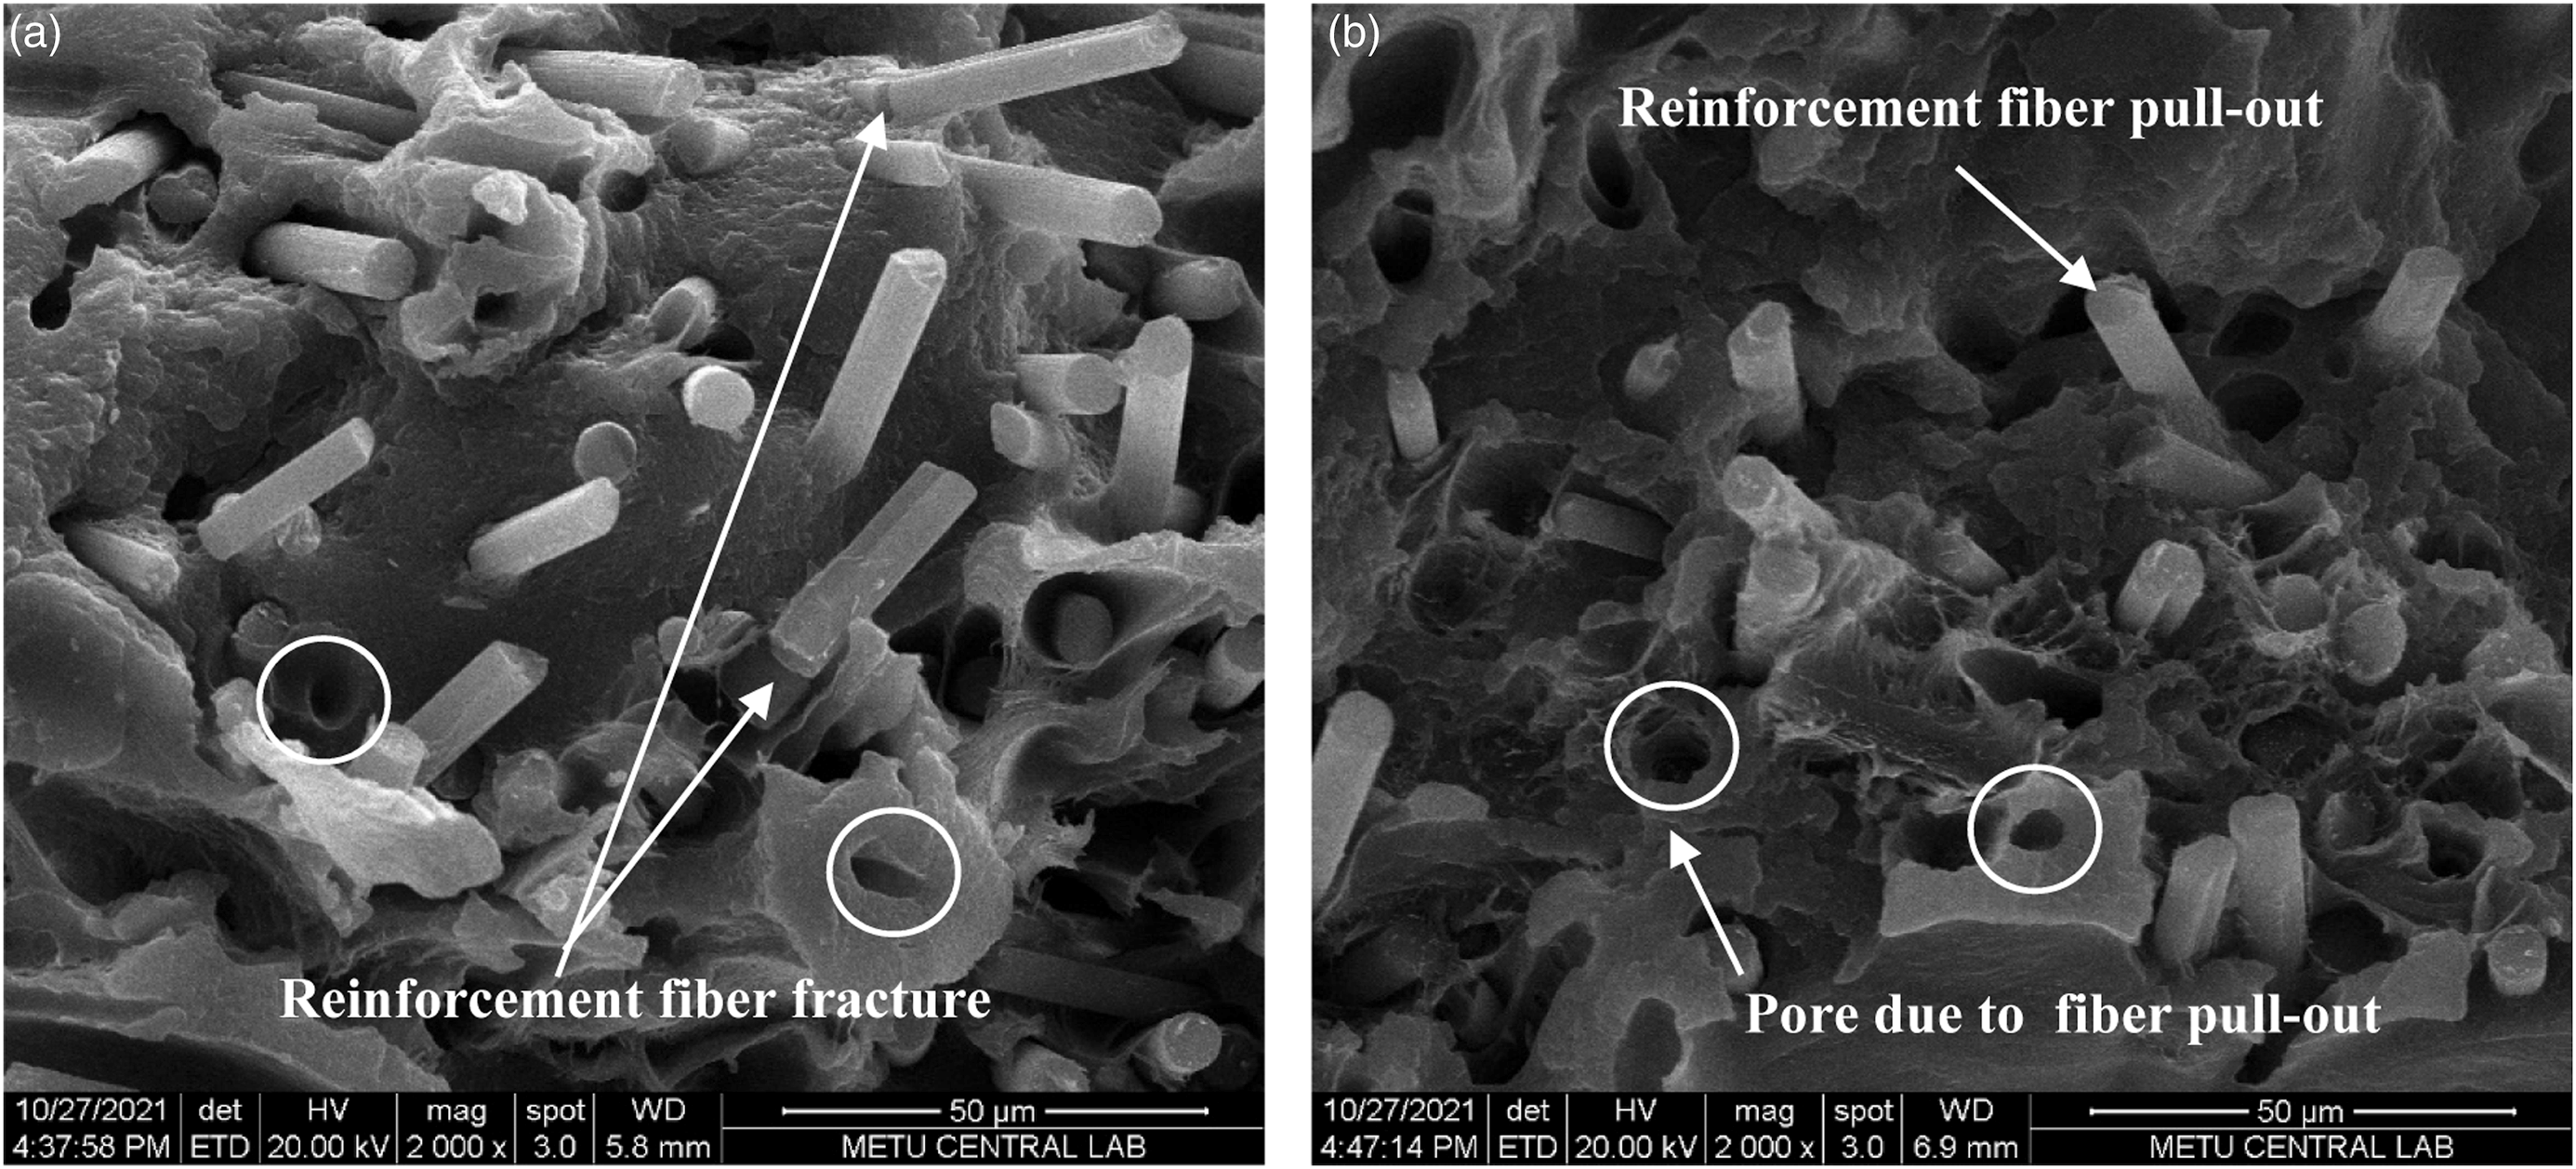
Figure 12 shows the optical microscopic images of the fractured surfaces under shear loading. A vertical cracking in the gauge section was observed at the specimens printed in flat orientation (Figure 12(a)–(c)). For ABS specimens printed on edge (Figure 12(d)), horizontal cracking in gauge section between notches was the dominant failure mode while, it was the horizontal cracking adjacent to the upper notches for the CFPET-OE specimens (Figure 12(b)). Optical images of fractured surface under shear loading for the samples, (a) CFPET-F, (b) CFPET-OE, (C) ABS-F, and (d) ABS-OE.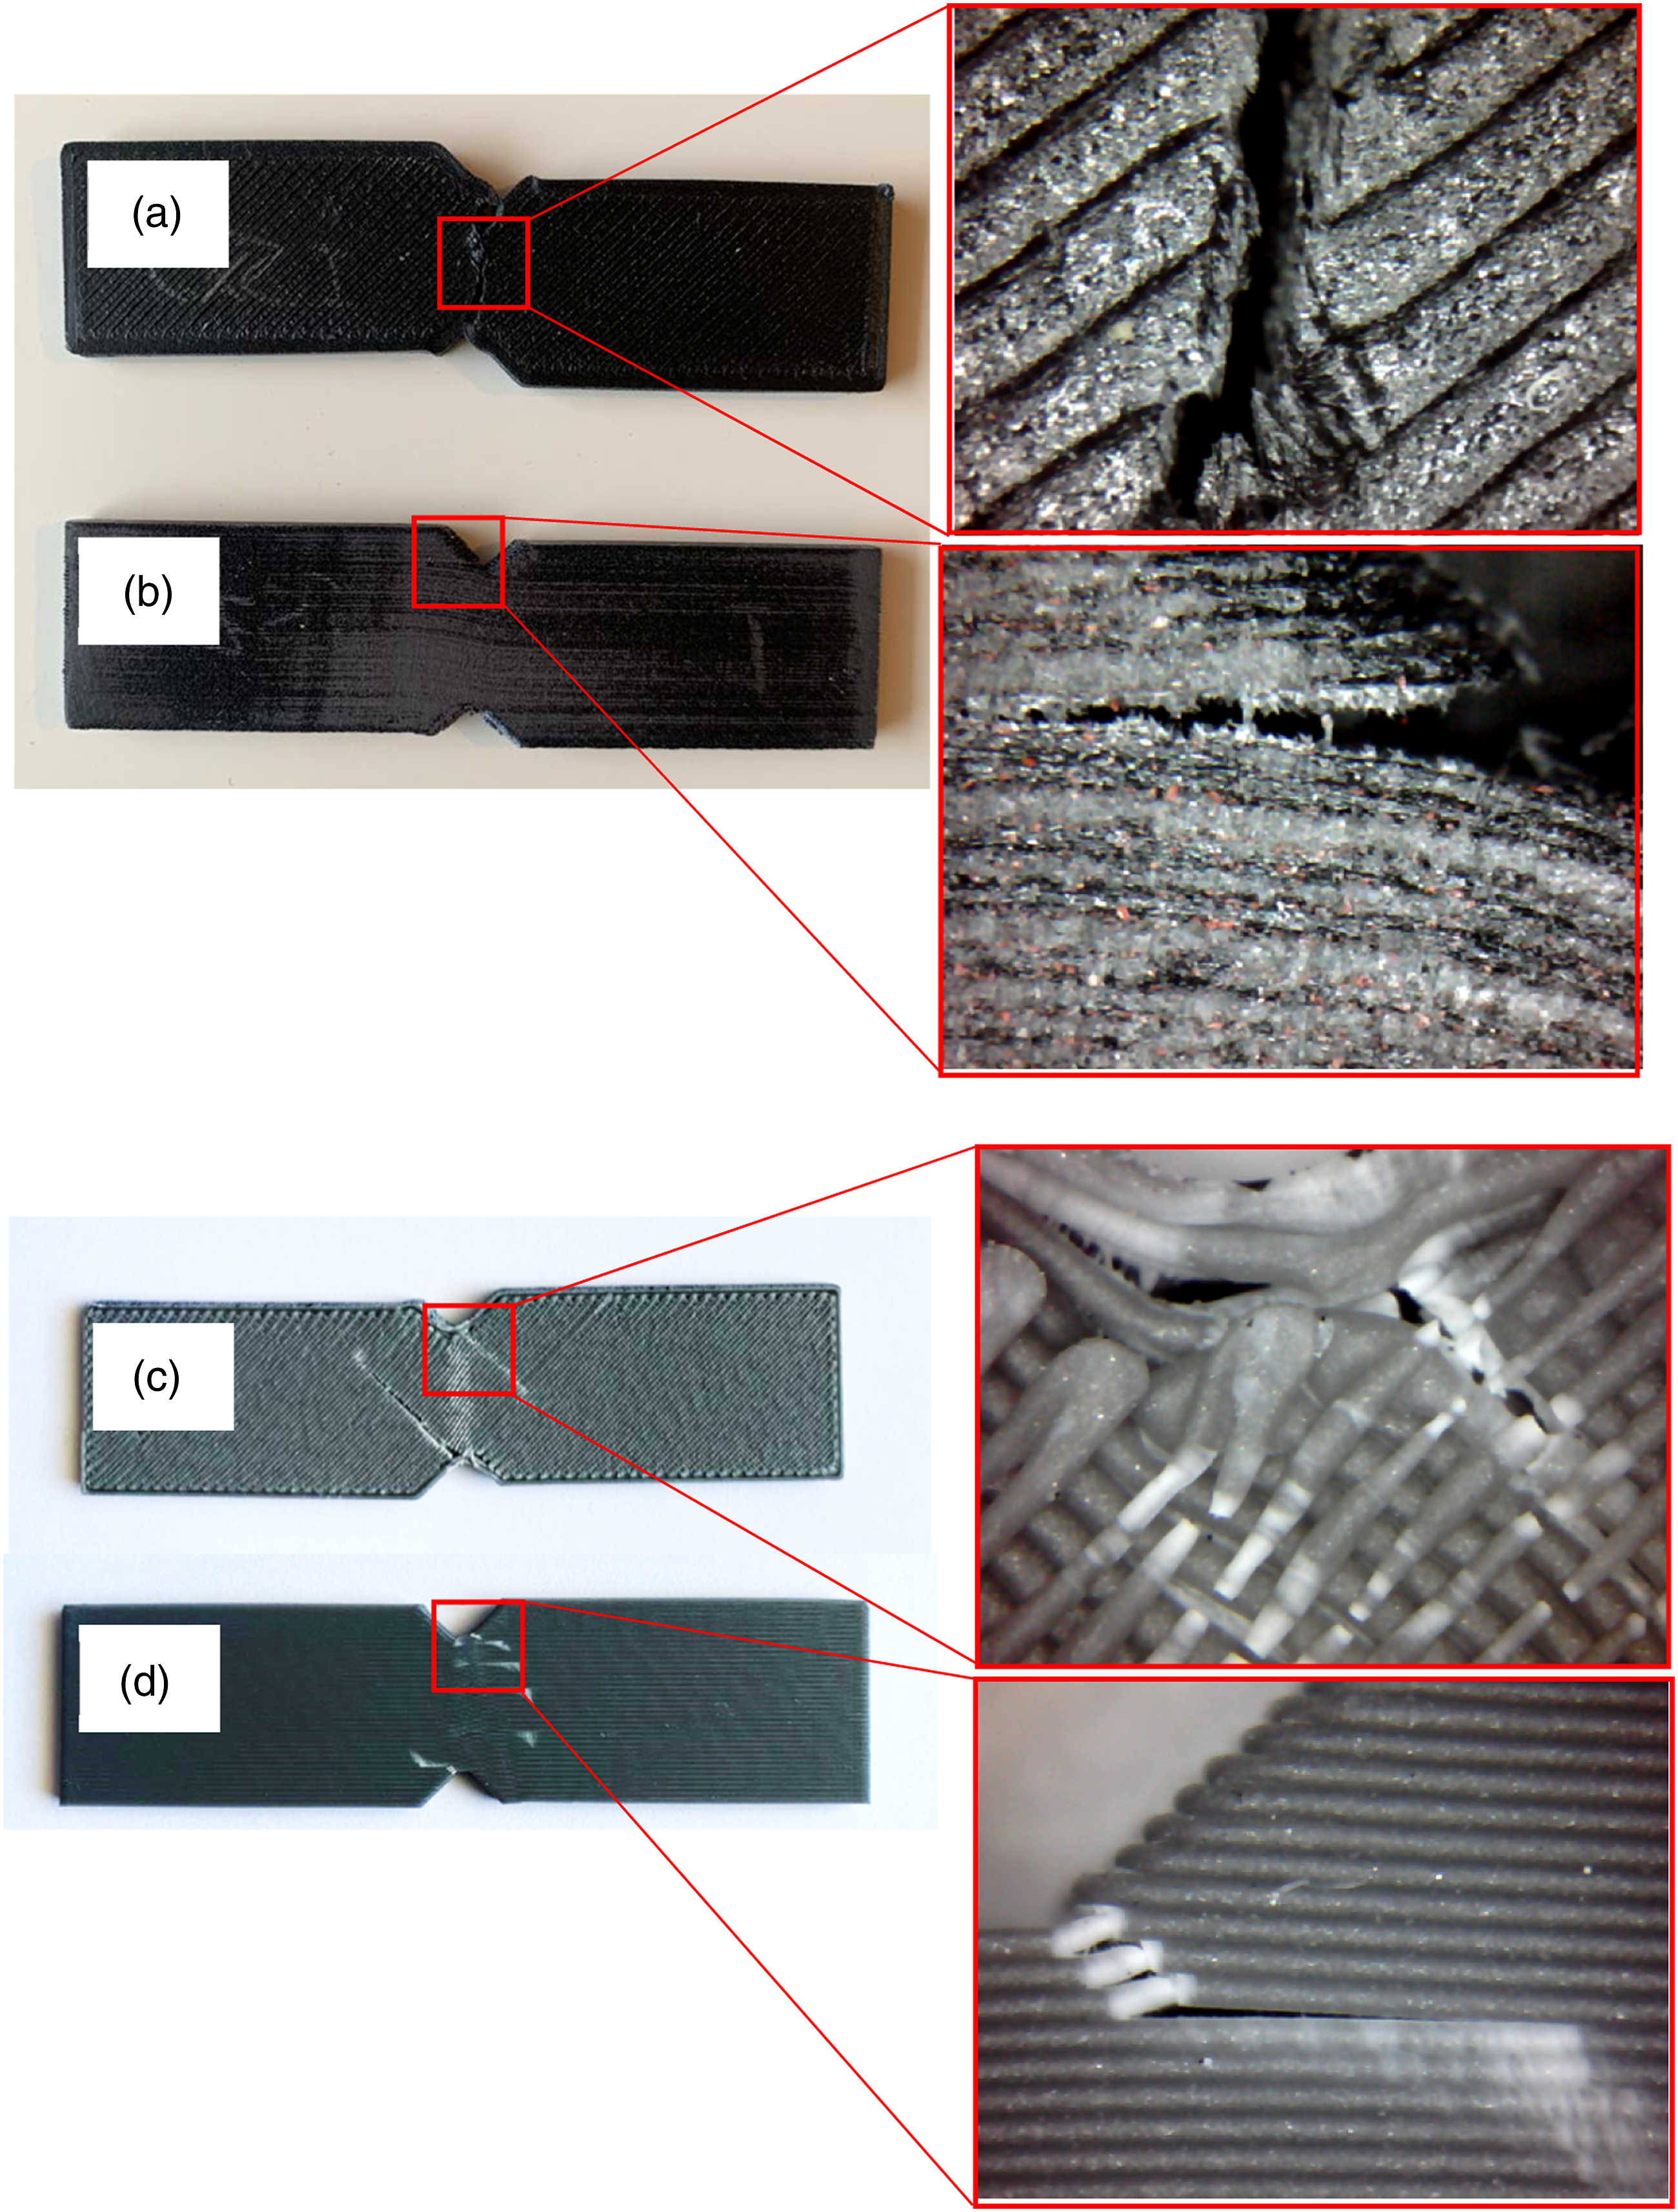
As shown in Figure 13(c), the samples, printed as on-edge orientation have consistent, well-fused roads in the printer plane, while a less consistent layering (out-of-plane) and a variation of fusing from one layer to the next is observed in flat samples. In another word, the adjacent layers were not adhered each other, properly. This weak link causes a higher sharing strain and lower shear modulus in flat printed samples compared to the on-edge ones. On the other hand, the existence of the contour layers at flat printed samples prevents premature failure at the notch region (see Figure 13(b)). Thus, higher shear strength was obtained for the flat printed samples. Optical micrographs taken from the face of samples shows the fusing condition of flat orientated sample at (a) between notches (solid insert box), (b) upper notch (dashed insert box), and on-edge orientated samples at (c) between notches (solid insert box), (d) upper notch (dashed insert box). Magnification is 20X.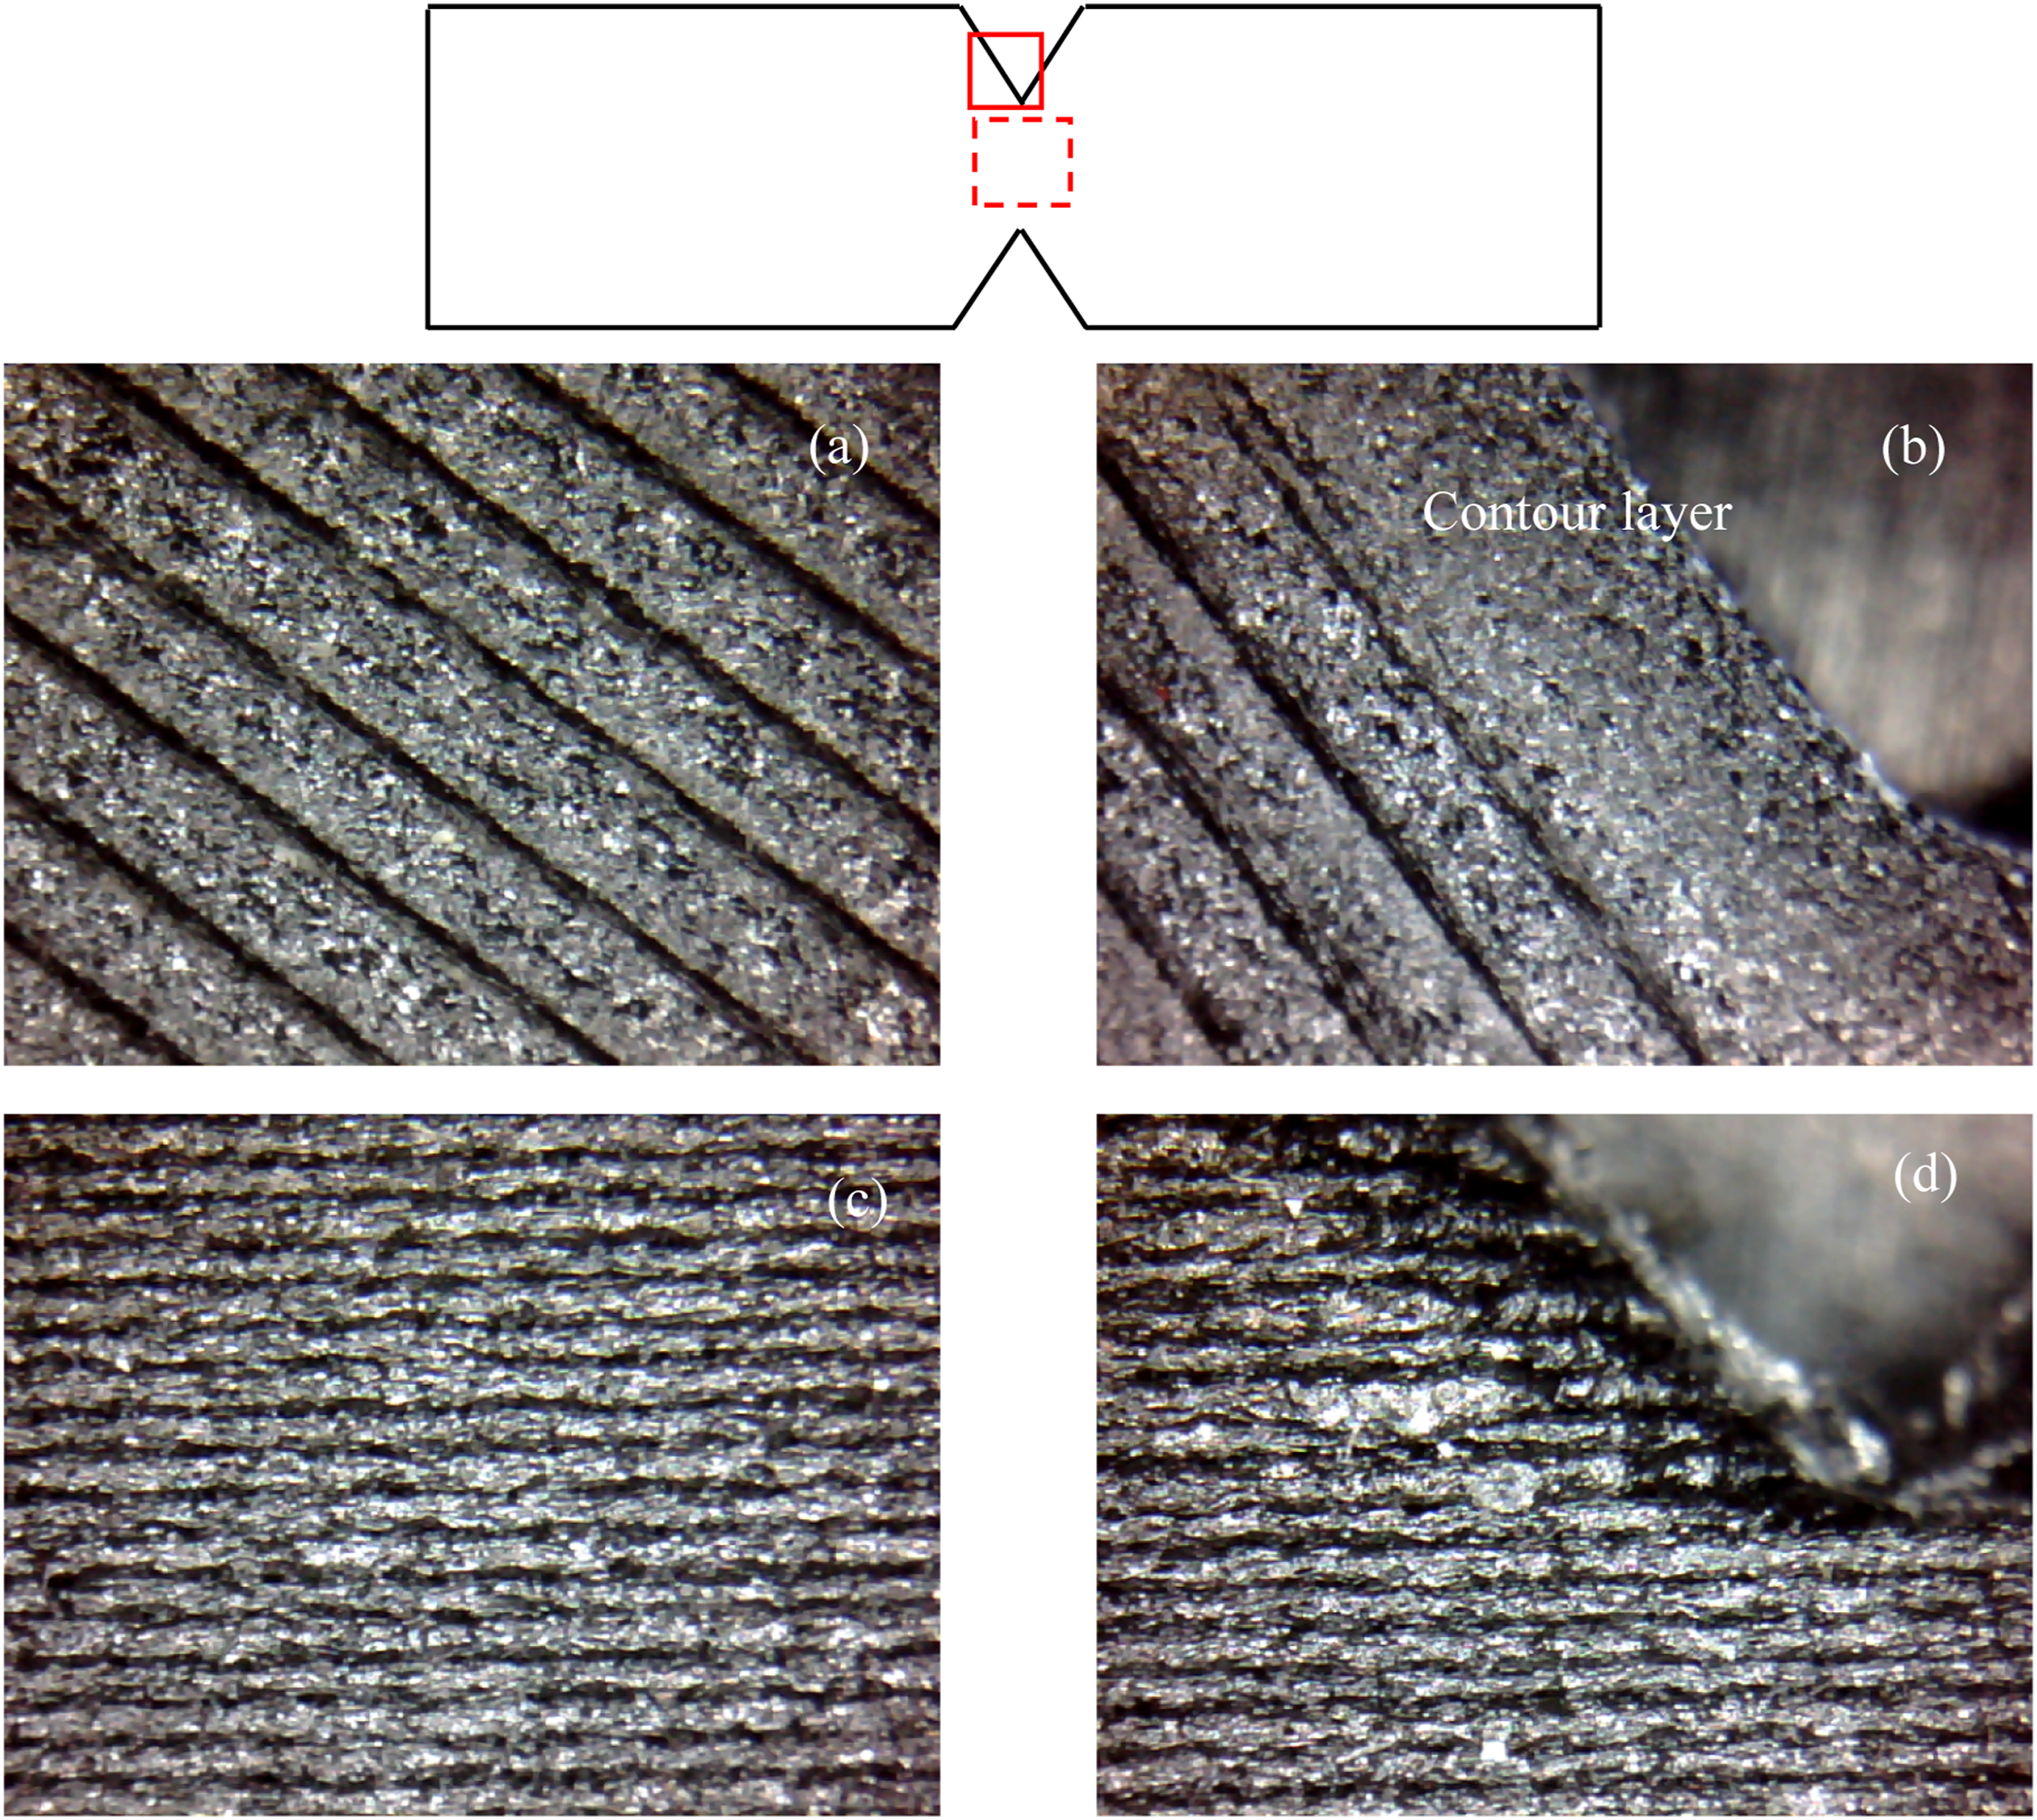
Conclusion
In this study, shear and tensile properties of FDM printed short carbon fiber PET and ABS parts were investigated in terms of printing orientations. 2D digital image correlation technique was used to measure full-field strain on samples under shear loading. The fracture modes of the FDM printed samples were investigated in more detail using an optical microscope and SEM. The mechanical characterization results showed that elastic modulus, tensile, and shear strengths were significantly enhanced using short carbon fiber-reinforced PET compared to ABS. Scanning electron microscopy images of the fracture surfaces of tensile specimens indicated that the breakage of the deposed filaments was the dominant failure mechanism for ABS while reinforcement fiber pull-out was determined to be the dominant failure mechanism for CFPET material. Although the tensile properties of the specimens were not affected by printing orientation, a noticeable anisotropy was observed in shear properties as the function of printing orientation. The premature shear failure was observed for CFPET samples printed at on-edge orientation due to the weak adhesive bond between the deposited layers.
In conclusion, the superior mechanical properties obtained by 3D printed short fiber-reinforced polymers than the usual FDM thermoplastics make them an interesting material with potential for future development. However, further research is required to clarify the anisotropy in mechanical behavior of the FDM printed short fiber-reinforced thermoplastics.
Footnotes
Acknowledgement
The authors would like to thank Dr. Baris Sabuncuoglu for valuable comments and useful discussions.
Declaration of conflicting interests
The author(s) declared no potential conflicts of interest with respect to the research, authorship, and/or publication of this article.
Funding
The author(s) received no financial support for the research, authorship, and/or publication of this article.