
Abstract
This work focused on the preparation of biopolymer blend nanocomposites from chitin (CT) and cashew tree gum (CTG) with different contents of copper sulphide nanoparticles (CuS) by solution casting method. The formation of nanocomposites have been characterized by FT infrared (FTIR), UV spectroscopy, X-ray diffraction (XRD), scanning electron microscope (SEM), high-resolution transmission electron microscope (HRTEM), thermogravimetry (TGA), differential scanning calorimetry (DSC) and impedance analysis. The characteristic absorption of nanoparticles in the FTIR spectra and shift in UV spectra of blend composites revealed the strong interaction between CuS nanoparticles and the polar segments of CT/CTG blend. With the increase in dosage of nanoparticles, a decrease in amorphous domains has been noted in the XRD scans. The uniform distribution of nanoparticles in CT/CTG network has been confirmed by the SEM analysis. HRTEM of the blend composites reveals the formation of hemispherical nanoparticles with a diameter of 15–30 nm. The glass transition temperature of blend composites increased with the addition of nano-CuS in the polymer matrix. Compared to the pure CT/CTG blend, the prepared nanocomposite showed higher thermal stability. Mechanical properties such as tensile strength and hardness of the blend nanocomposites were greatly enhanced by the reinforcement of CuS into the CT/CTG matrix. The AC conductivity and dielectric properties of the nanocomposites increased with the concentration of fillers and the magnitude of these properties was higher than the pure polymer blend.
Introduction
It is a fact that the human race on earth today is facing serious threats from climate change, global warming and accumulated pollution in soil and water resources. The threats emerging from global warming are serious and the so-called ‘waking up diseases hidden in ice’ is becoming real every day. As the climate of earth warms, long-dormant bacteria and viruses are hidden under the white wonder in winter are reviving. As the society turns into a greedy consumer, plastic pollution also comes into the picture and contributes heavily to this worsening scenario. Superior performing synthetic polymers do perform excellently, but they remain in our environment even for decades, without any biodegradation. In the past, the industrial revolution searched for synthetic alternatives to natural ones, now we are in our never-ending search for natural alternatives to replace synthetic ones. In order to satisfy the demands of the society and retain the fell-good-factors of the customer, the properties of the materials obtained from the nature must be modified. 1 Reinforcement of the natural materials, especially polymeric materials must be improved to a great extent and this can be achieved only with the incorporation of nanoparticles. 2,3 Cellulose, starch and their derivatives were in progressive use over the past years, and the researches are reported extensively in the literature. 4 –6 However, cashew gum is relatively a new material, whose potential is still to be explored as a natural biodegradable and non-toxic polymer. Even though a natural polymer, its use in industry as a common adhesive is already established. Its tendency to thicken a solution also is established industrially and therefore it finds use in the manufacture of several value added products. In this context, the present candidates in this research work, namely cashew gum and chitin become relevant to the society, research community and a common science reader.
The scenario explained above leads to the constantly growing demand for high performing but environmental friendly materials. Such a strategy can replace the biodegradable and harmful materials with eco-friendly super performing and smart materials. Having a big contribution to the primary sector of our country, natural polymers find immense applications in agriculture, construction, food industries, biomedicines and in the packaging industry. 7 In order to bring every natural or synthetic product to the doorstep of the customer from places that are half a world away, the packaging industry serves the best. However, the industry always demands materials with high performance to weigh ratio with reasonable durability. They are expected to have optical clarity to display the quality of the material inside together with the required electrical and mechanical properties. Also, the material used for packing must degrade naturally to nontoxic components after their service life. This can cut the use of fossil fuels while assuring us a clean and healthy environment.
Nature is a treasure house of many biopolymers, such as starch, cellulose and chitin (CT). Among them, cellulose and CT are most abundant and their position in abundance is in the same order. CT is a natural biopolymer present in crustacean shells, fungi and insects. 8,9 Most of the naturally obtained polymers exhibit acceptable physical properties that make them suitable for bio-engineering applications. Being a naturally occurring polymer, cashew tree gum (CTG) is unique and less explored by the scientific community. Their non-toxic, inexpensive, biocompatible, hydrophilic and biodegradable characters make them ideal candidates for the development of high performing but environmental friendly materials. It is a water-soluble polysaccharide that exudates from the ducts on the bark of the cashew tree (Anacardiumoccidentale). 10 Its exudation can also occur from flowers and fruits as well as leaves. 11 It contains72% galactose, 14% glucose, 4.6% arabinose, 4.5% gluconic acid and 3.2% rhamnose. 12 This gum is easily soluble in water and therefore its aqueous solution can be cast into a film. However, materials based on CT suffer from poor mechanical properties and low thermal stability. The demand for a super performing natural material has prompted researchers worldwide for the enhancement of mechanical and thermal properties of cashew gum. 13 –15
The usual strategy for this is through the blending of different polymers and the inclusion of high performing synthetic nanoparticles. Such a blending of two or more natural polymers can result in a novel blend with structurally and functionally similar or dissimilar components. The simple mixing of CT with naturally occurring polymers containing other functional groups may result in a novel material with unique properties. 16 The introduction of reactive functional groups in the polymers 17,18 and the incorporation of nanoparticles to a natural polymer matrix can impart many required properties to these materials. For this purpose, copper sulphide (CuS) nanoparticle is suggested as the best candidate. This is due to their high thermal stability, electrical property and easy method of preparation. 19,20 CuS has high metallic conductivity and it becomes a superconductor at 1.6 K. 21 Its superior photoelectric properties make it useful as the quantum dots in photoelectronic devices. 22 While incorporating CuS nanoparticles into natural polymer blend, several parameters such as the shape, size, orientation and the adhesion of nanoparticles with the blend segments must be considered. 23
This research work focuses on the modification of the properties of CT/ CTG blend by adding different concentrations of CuS nanoparticles. The influence of CuS nanoparticles on various structural properties of CT/CTG blend was investigated by FTIR and UV spectroscopy. XRD, HRTEM and SEM analysis. Mechanical properties of the blend nanocomposite materials, such as the tensile strength, hardness, dielectric properties, and AC conductivity were analyzed. The thermal stability and glass transition temperature (Tg ) of the blend composites were aslo assessed by TGA and DSC respectively. Such a systematic study has not been carried out earlier and this can be very useful to map the position of these novel biodegradable blend nanocomposites in the materials market.
Experimental
Materials and methods
Copper acetate monohydrate, thioacetamide, sodium dodecylsulfate (SDS), glutaraldehyde and methanol were procured from Merck India. Chitin (MW = 40,000) was procured from Sigma Aldrich. Cashew tree gum (CTG) was collected from the bark of the cashew tree. The CTG was purified by the precipitation method. It was dried, powdered and passed through 70 µ mesh size before use.
Synthesis of copper sulphide (CuS) nanoparticles
The synthesis of CuS was carried out by the chemical reaction between thioacetamide and copper acetate. 24 In this work, SDS was used as a capping agent to avoid clustering of nanoparticles during the reaction between copper acetate and thioacetamide. 25 The copper acetate monohydrate was dissolved in deionized water and to this solution 0.2 g SDS was added and stirred. This aqueous solution was slowly added to the aqueous solution of thioacetamide at room temperature and stirred the homogeneous solution for 20 min. The solution slowly turned to golden brown color during the mixing of copper acetate monohydrate which finally turned to green color at the time of 12 h. The CuS nanocrystals formed were filtered, washed and dried.
Preparation of CT/CTG/CuS nanocomposites
The preparation of biopolymer CT/CTG/CuS blend nanocomposite was carried out by the solution mixing and casting method. Here, we prepared 50/50 biopolymer blend nanocomposites through the dispersion of nano CuS particles into the blend. The CT was dissolved in diluted acetic acid while CTG was dissolved in water at room temperature. The CT solution was added to the aqueous solution of CTG (CT/CTG ratio is 50:50) and stirred the blend to make a homogeneous solution. Varying concentrations of nano-CuS (0, 3, 5, 7, 10 and 15 wt.%) were mixed with distilled water and ultrasonicated for 20 min. This nanofluid solution was poured into the above prepared CT/CTG homogeneous mixture and it was ultrasonicated for another 20 min. The homogeneous solution was cross-linked by adding a glutaraldehyde solution. The product obtained was washed and dried at 40°C for 12 h. A schematic representation of the preparation of blend nanocomposites is given in Figure 1.
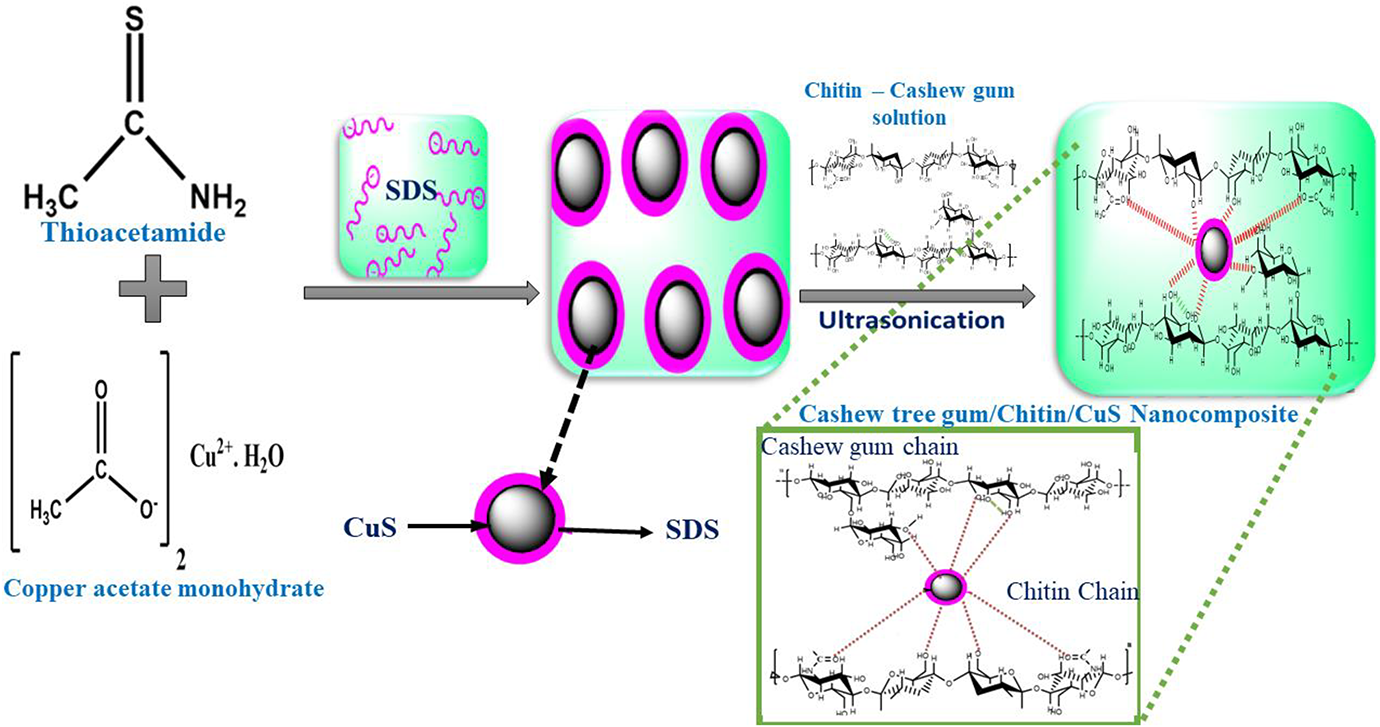
Schematic representation of the preparation of CT/CTG/CuS blend nanocomposites.
Characterization
The UV spectra of the pure blend and its nanocomposites were analyzed by a spectrophotometer (Perkin Elmer Lambda 650). The incorporation of CuS nanoparticles in the blend matrix was analyzed by a Bruker Optics ALPHA-E spectrometer in the region of 4000 to 400 cm−1. The crystalline structure of blend composites was determined by a Philips X-ray diffractometer in the range of 2θ = 10–80° at a speed rate of 2°/min. The morphology of CT/CTG blend nanocomposite was analyzed by a scanning electron microscope (Hitachi SU 6600). The structure and formation blend nanocomposite were analyzed by HRTEM (JEOL/JEM 2100) using the dried film of the samples on a carbon-coated copper grid. The glass transition temperature of blend composite was conducted by a differential scanning calorimetry (Shimadzu DSC-50) at a heating rate of 10°C/min. The thermal resistance of blend nanocomposites was carried out by Perkin Elmer thermogravimetric analyzer at a heating rate of 10°C/min. The mechanical properties were measured by tensile properties measurement by rectangular CT/CTG blend composites samples (15 × 10 × 10 mm3) at a speed of 10 mm/min and the tensile tests were performed at room temperature using a Universal Testing Machine according to ASTM D 412. Five groups of each sample were tested and the average of all readings was taken as the tensile strength. A Zwick H04-3150 hardness tester was used for the measurement of hardness as per ASTM D 2240-95. The test was carried out at room temperature on each blend specimen at different locations, and the average of all readings was reported as hardness values. The AC resistivity of the blend film at room temperature was measured using a fully automatic Hewlett–Packard LCR Meter at different frequencies. The dielectric constant (εr) of blend nanocomposite was calculated by the relation,
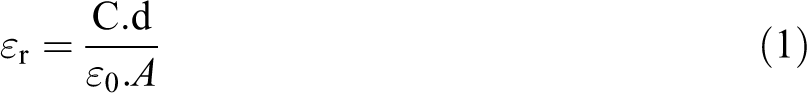
The AC conductivity was calculated by the equation below,

where d is the thickness of the film, A is the area of cross-section of the polymeric material, C is the capacitance and ε0 is the permittivity of free space. εr which is the dimensionless factor that reflects the permittivity of the polymer. The dielectric loss (tan δ) of the composite was also determined by the LCR meter.
Results and discussion
UV-Vis spectroscopy
The interaction of blend components with CuS nanoparticles was analyzed by using UV spectroscopy. The UV spectra of the samples were given in Figure 2. The UV-Vis absorption spectra of CuS shows a sharp peak at 287 nm, which is ascribed to the quantum size effect of the nanoparticles due to their smaller crystallite size. 26 Also, there is a broad shoulder around 630 nm near-IR region is due to the free-carrier absorption of CuS nanoparticles. 27 The pure CT/CTG blend gives a broad and strong absorption peak at 262 nm due to π-π* transition while the weak reflection at 331 nm is due to n-π* transitions arising from chitin and cashew tree gum. 14 The nanocomposite material shows a narrow sharp UV peak at 247 nm which confirms the uniform dispersion of CuS nanoparticles in CT/CTG blend. Generally, a broad peak indicates the random arrangement of nanoparticles while a sharp peak indicates the uniform arrangement of filler in the polymer. It is evident from the figure that the broad shoulder near-IR region is absent in blend nanocomposites and this is due to the dilution of polymer entanglements with the nanoparticles. 28 In addition to this, the absorbance values of the blend significantly deviate from 262 to 247 nm for nanocomposites. This shift indicates the strong interactions between CuS nano-filler and blend segments. As the loading of nanoparticles reached 7 wt.%, the edge of the absorption peak is shifted to a lower wavelength in the entire range from 200 to 900 nm. This proves that the effective interfacial interaction between filler and blend matrix. Further enhancement in the loading of nanoparticles (above 7 wt.%) results in a decrease in intensity and broadness of the peak. This can be attributed to the aggregation of CuS nanoparticles. The shift in intensity and the change in the broadness of composite indicate the variation in bandgap energy within the polymer blend composite and this is largely due to the change in crystallinity after the incorporation of nanoparticles into the blend. This will be further confirmed later in the manuscript with the help of HRTEM and SEM analysis.
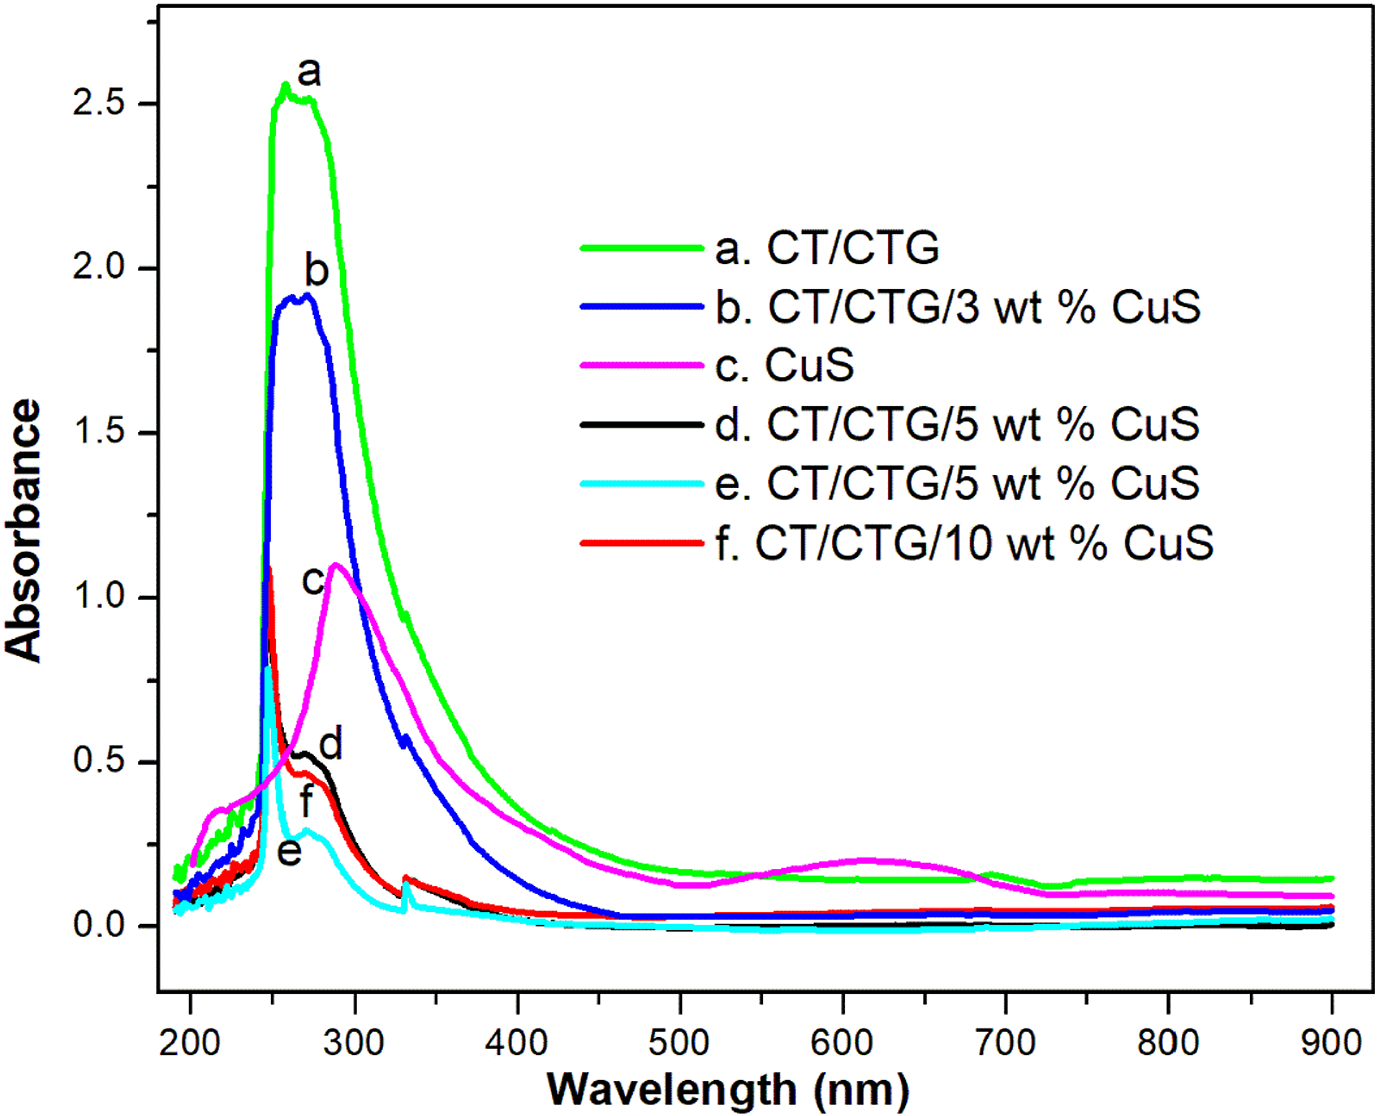
UV spectra of CuS and chitin/ cashew tree gum with different contents of CuS.
FTIR analysis
FTIR spectrum of CuS, CT/CTG and CT/CTG with CuS particles are shown in Figure 3. The CuS particles shows a sharp band at 614 cm−1, which is the vibrational stretching frequency of sulphur and copper. 29 The CT/CTG blend exhibits the characteristic vibrations of CTG and CT. The OH vibration of CT occurs at 3440 cm−1,9 while that of CTG is at 3378 cm−1. 10 But in CT/CTG blend, it is visible as a strong and broad OH absorption peak at 3437cm−1. The absorption frequency of the blend is found to be merged relative to their individual IR values. This indicated the strong interactions developed between the CT and CTG segments. The peaks at 3274 cm−1 and 1660cm−1 can be attributed to the N-H and amide groups of the CT. The C–H vibration from the blend is visible at 2932 cm−1. Also, the characteristic absorption band of carbohydrates and various stretching vibrations such as C--O--C glucoside link and C--O--H bonding present in CTG are visible at 1200–900 cm−1. These absorption peaks from the FTIR spectra prove the formation of CT/CTG blend. The IR spectra of blend nanocomposite show absorption at 619 cm−1 which indicates the presence of CuS. Furthermore, the OH stretching frequency of blend nanocomposite is shifted to higher wavenumber 3441cm−1. Similarly, the N–H absorption frequency in the nanocomposites is also shifted from 3263 cm−1 to 3276 cm−1. This shift in absorption frequency of the blend nanocomposites revealed the strong interaction between nanoparticles and the blend. This stands as strong evidence for effective mixing of blend segments and valid interaction between hydroxyl, carbonyl, or NH groups with the polar unit of the nanoparticles
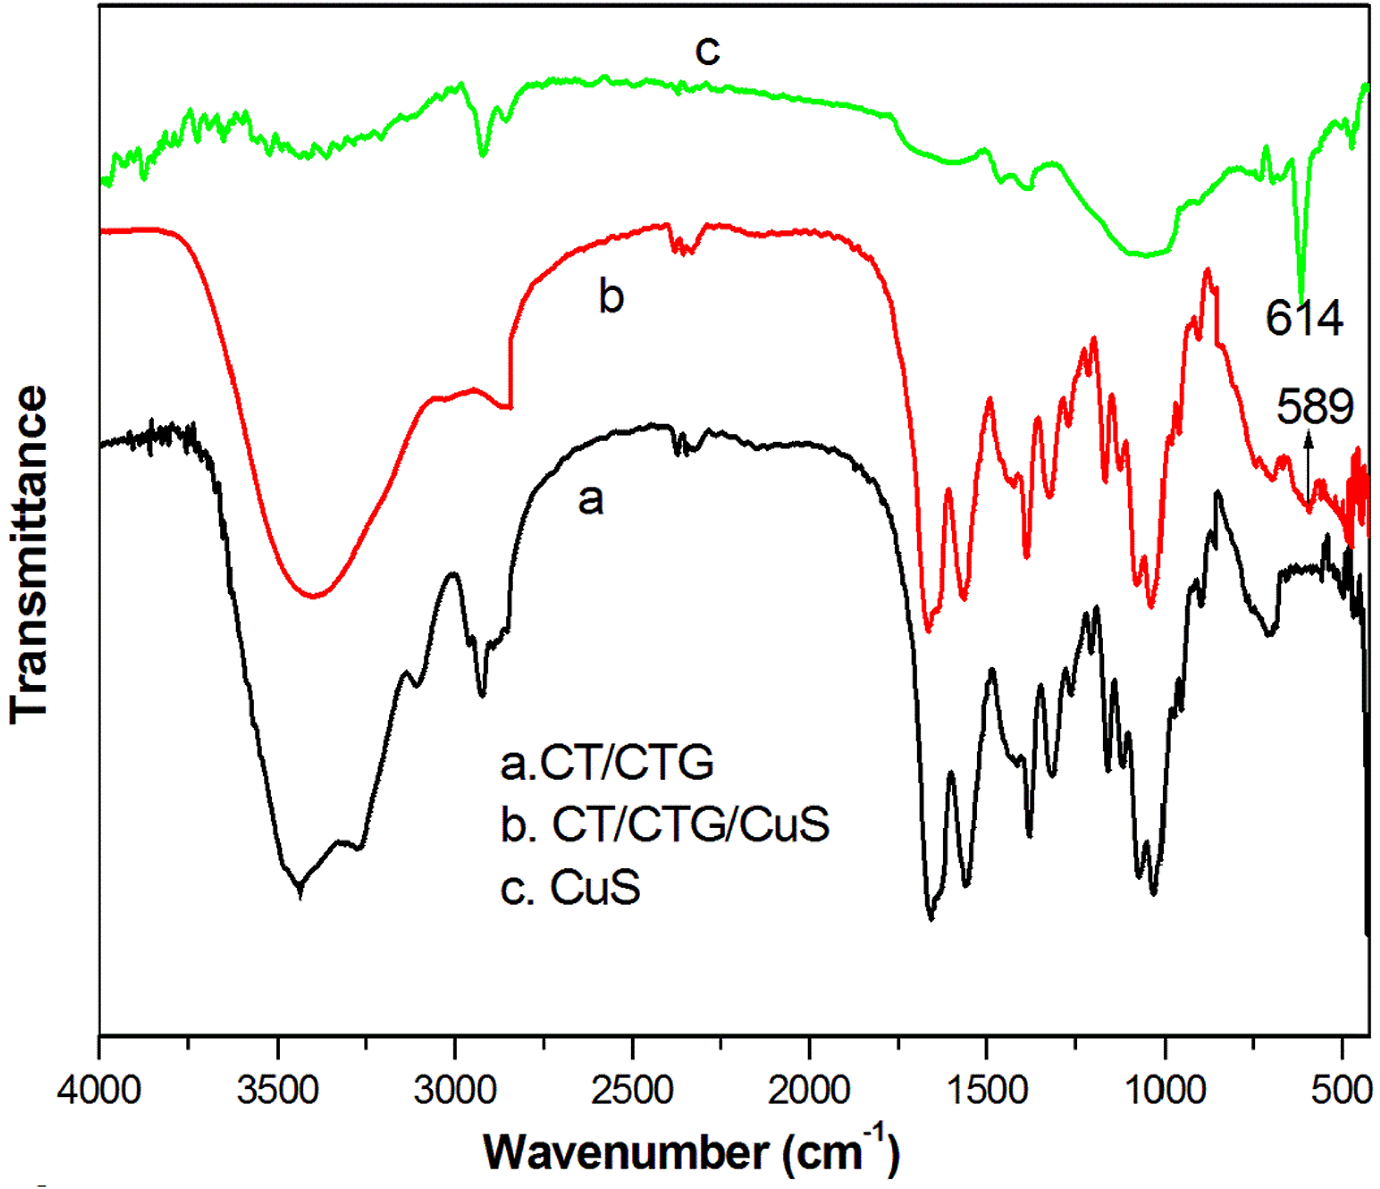
FTIR spectrum of chitin/ cashew tree gum/ CuS nanocomposites.
X-ray diffraction analysis (XRD)
The XRD plots of CuS particles, CT/CTG and blend containing varying amounts of nano-CuS particles are depicted in Figure 4. The peaks at 2θ = 27.9°, 29.3°, 32.3°, 32.9°, and 48.2° indicate the crystalline structure of CuS. 24 The two XRD diffraction peaks at 2θ = 9.28 and 17.31° of CT/CTG sample correspond to the broad diffractions of CT and CTG components respectively. Again, weak peaks at 2θ = 21.65° and 2θ = 26.13° indicate the semi-crystalline behavior of the polymer nanocomposite. The nanocomposite samples show the characteristic diffraction patterns of blend together with the crystalline peaks of CuS. From the figure, it is clear that the diffraction peaks of the polymer blend shifted slightly to a higher 2θ value (i.e., 2θ = 9.28 to 2θ = 9.92°) by the insertion of nanoparticles.
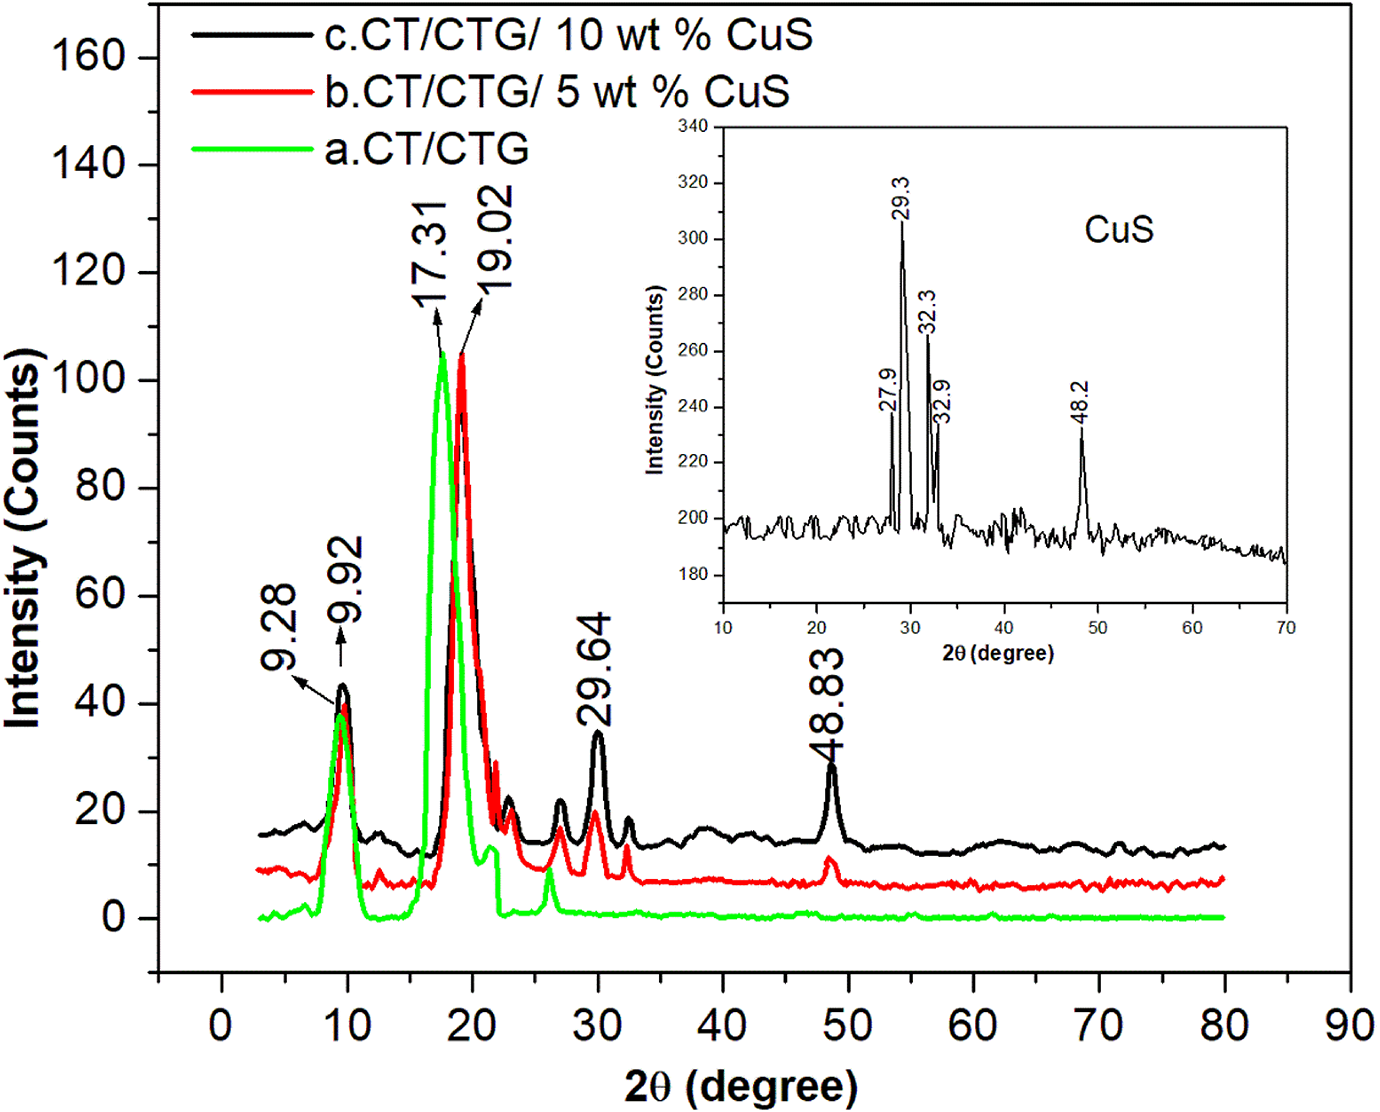
XRD curves of chitin/ cashew tree gum/ CuS nanocomposites.
Similarly, the major diffraction peak at 2θ = 17.31° of the pure blend is also found to be shifted to a higher 2θ region by the reinforcement of filler in the bio-polymer (i.e., 2θ = 19.02°). This shift in XRD peak is due to the coordination linkage among the vacant orbitals of the metal sulphide particles and the carboxyl or OH group and NH group in the blend segments. Such interactions lead to many closely packed and ordered chains in the polymer matrix. From these results, it is evident that the nano-CuS particles are strongly encapsulated by the CT/CTG molecules due to the strong interactions between them.
Morphological analysis by SEM
In order to determine the nano-filler dispersion in the blend, scanning electron microscopy was employed. The morphology of the blend and CT/CTG/ CuS nanocomposites are given in Figure 5. The SEM image of CT/CTG blend matrix (Figure 5(a)) exhibits uniform phase morphology in the blend surface and a homogeneous composition structure. Figure 5(b) represents the morphology of the blend with 7 wt.% CuS nano-filler and it can be seen that the nanoparticles are uniformly distributed in the blend matrix.
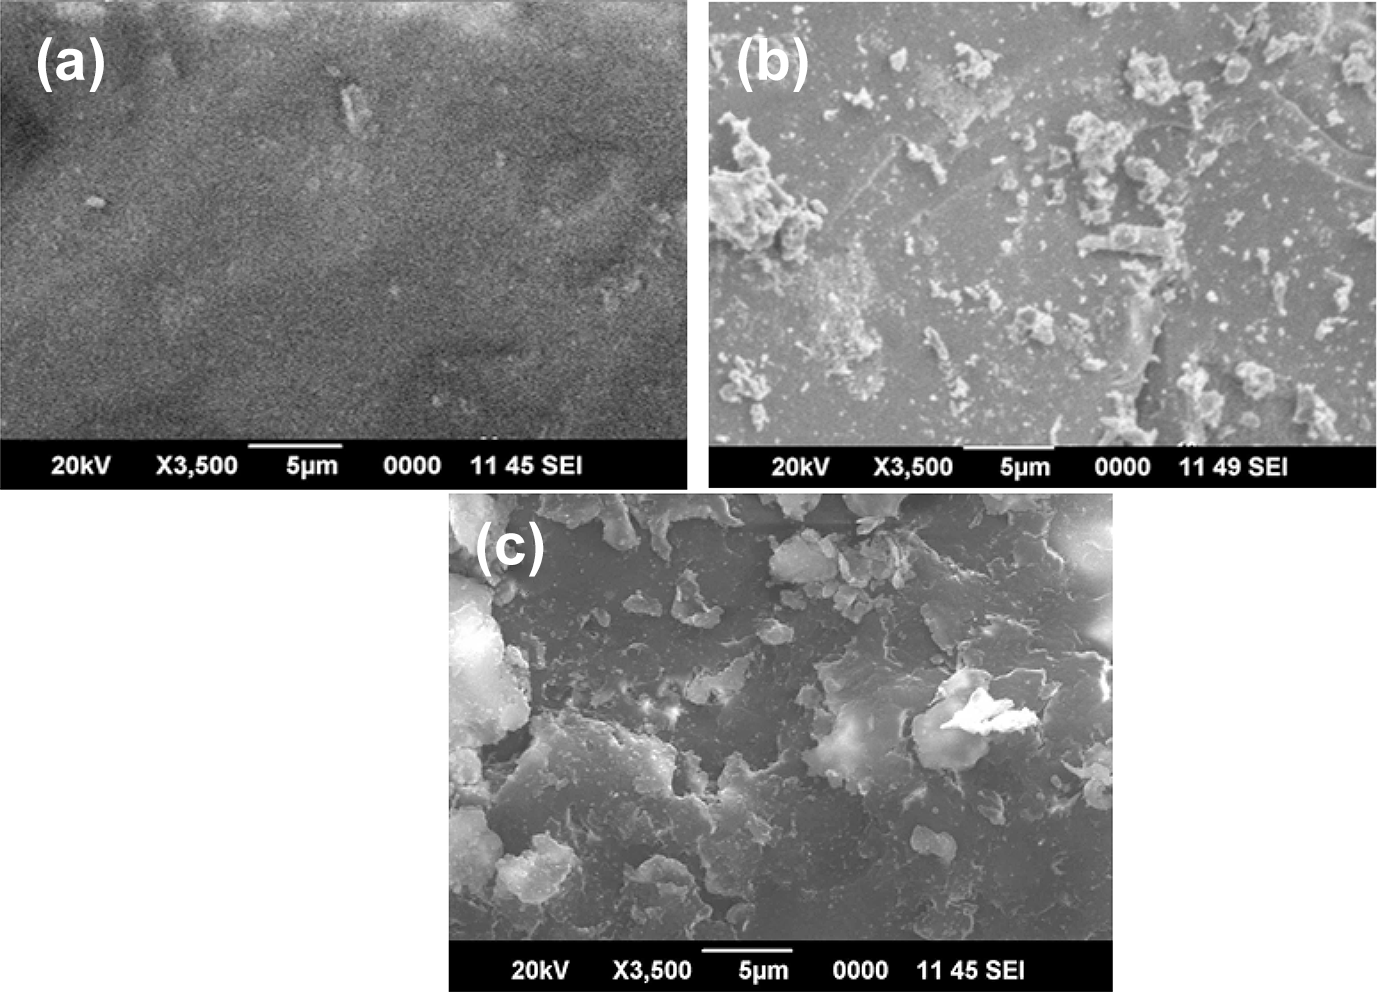
SEM image of (a) CT/CTG (b) CT/CTG/7 wt.% CuS and (c) CT/CTG/15 wt.% CuS.
The uniform dispersion of nano-metal sulphide particles is due to the electronic rearrangements in CuS particles, which in turn depend on the coordination interaction between the blend segments and CuS particles. This illustrating an exceptional adhesion between nanoparticles and polymer blend without any agglomeration of filler is an evidence for the good reinforcement of CuS fillers in the polymer blend. At a higher loading of CuS nanoparticles (Figure 5(c)), the morphology of the blend composite is changed. It shows an elongated structure and this is due to the development of greater stress in the blend nanocomposite. The picture also shows slight clustering of CuS in the blend. At higher filler loading, the interactions between the adjacent nanoparticles take predominance as compared to that of the nanoparticles and blend. This stands as a solid reason for the agglomeration of CuS nanoparticles at higher loading.
Morphological analysis by HR-TEM
The HRTEM images of CuS and the blend with different contents (7 and 15wt.%) of nano-CuS particles are shown in Figure 6. The TEM image of copper sulphide nanoparticles shows uniform nature with spherical and hemispherical shaped particles having an average crystallite size in the range of 10–18 nm. TEM image of 7 wt.% CuS incorporated composite indicates that the CT/CTG components are effectively adsorbed on the surface of CuS (hemispherical with average particle diameter below 30 nm). The uniform distribution of CuS in the blend composite can be attributed to the strong interactions between them. However, when the loading of nanoparticles reached to 15 wt.%, its spherical shape becomes elliptical (elongated structure) in morphology. The slight structural difference in the composite is due to the formation of aggregates, that result from the weak interactions between the nanoparticles and the blend segments.
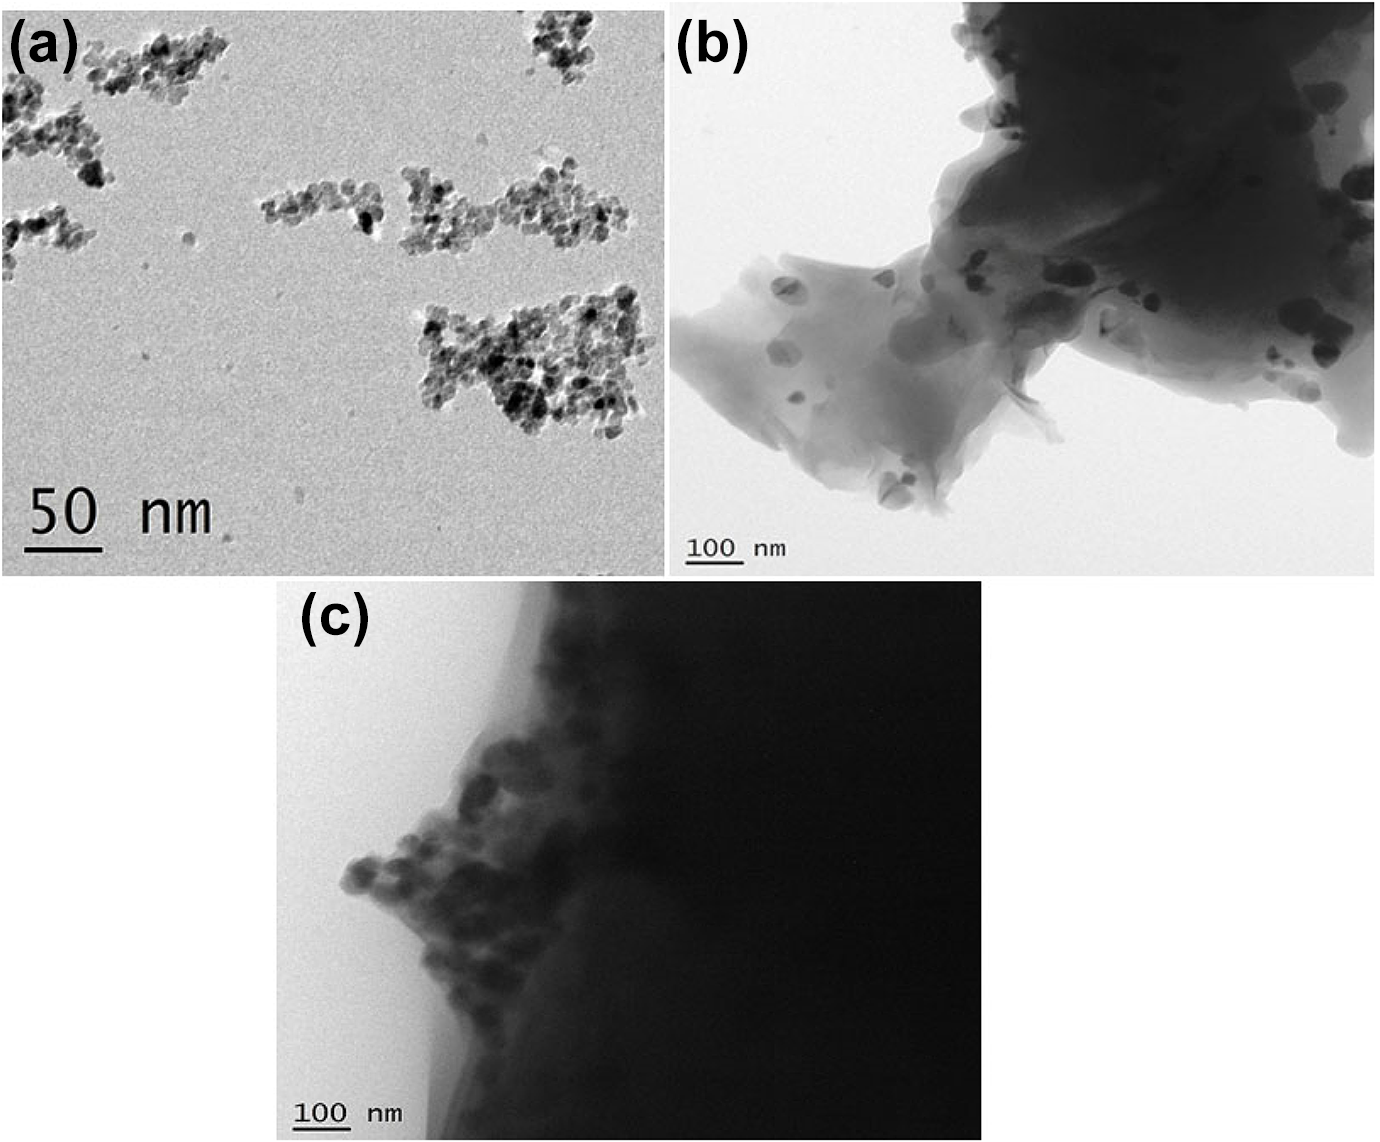
TEM images of (a) CuS (b) CT/CTG/7 wt.% CuS and (c) CT/CTG/15 wt.% CuS.
Differential scanning calorimetry (DSC)
Figure 7 shows the thermal changes in CT/CTG blend with various loading of nano CuS particles. It can be seen that all the samples showed a single Tg and this indicates the compatible nature of the blend components. Generally, the reinforcement of nanoparticles with the polymer arrest the molecular flexibility of macromolecular chain and this rigidity enhances the Tg value of composites than the parent polymer. 30,31 The endothermic peak at 73.5°C in the DSC plot of pure blend represents its glass transition temperature. The Tg value of 5 and 15 wt.% CuS incorporated blend nanocomposites are observed at 78.65°C and 88.63°C, respectively. It can be seen from the figure that the Tg value increases gradually with the addition of CuS nanoparticles. The increase in Tg value of the polymer blend with the loading of CuS leads to the restriction in segmental movement of the macromolecular chain imparted by the CuS nanoparticles distribution in the blend matrix.
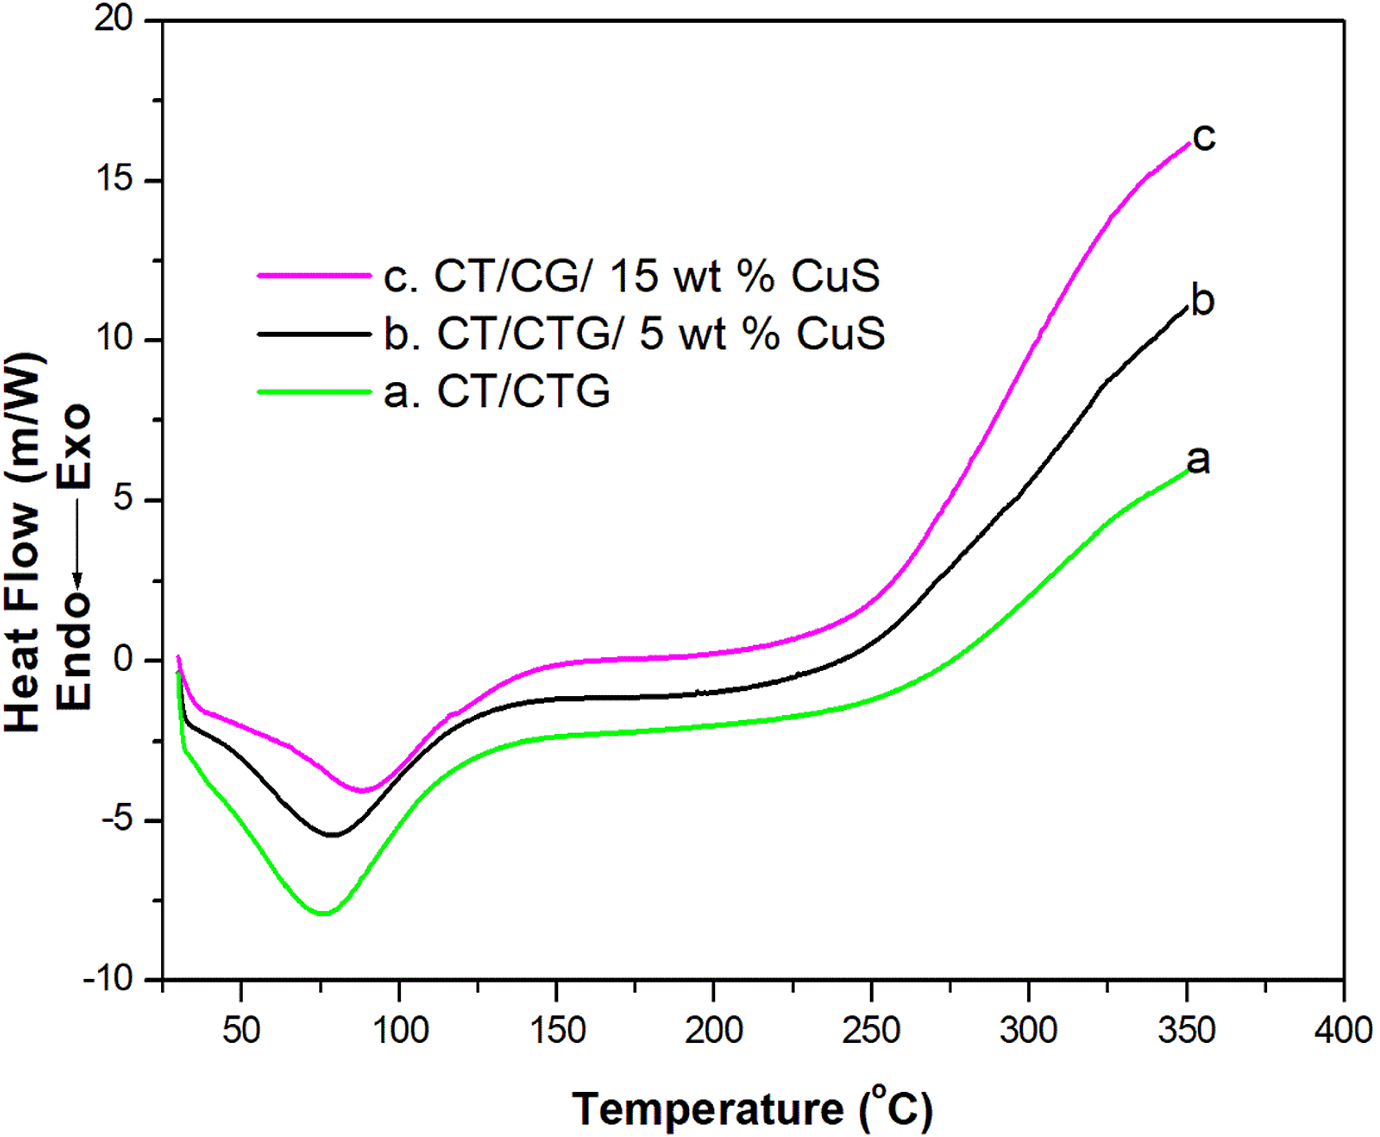
DSC profile of chitin/cashew tree gum/CuS nanocomposites.
Thermal stability (TGA)
The thermal stability of chitin/cashew tree gum blend with different loading of CuS nanoparticles obtained from TGA and DTG is presented in Figure 8. The TGA plots show minor and major thermal decomposition pattern for all the polymer blend samples. This result is also confirmed by the presence of two peaks from DTG curve (Figure 8). The weight loss in the initial stage can be observed from 30°C to 84°C, which corresponds to the elimination of moisture and the impurities present in the blend composites. The major weight loss observed in the range of 200–385°C can be assigned to the degradation of polysaccharides present in the blend and the formation of imine and ammonia. 32 It can be seen that the thermal degradation of CT/CTG blend starts at 249°C and finishes at 415°C with a peak at 324°C; while for bio-composites with 5, 10 and 15 wt% CuS showed the peak at 336°C, 349°C and 360°C, respectively. These results clearly prove that CuS nanoparticles slow down the thermal decomposition of CT/CTG blend and the thermal stability of the composites increases with an increase in the loading of nanoparticles. Here the nanoparticles resist the diffusion of volatile components from blend segments through strong interaction with the blend matrix. The char residue obtained for pure polymer blend after complete degradation is 0. 15%, but for CT/CTG blend with 5, 10 and 15 wt.% CuS nanoparticles are 4%, 10% and 16% residue, respectively at the same temperature. The final char residue is the measure of the thermal resistance of the polymeric materials 33 and in the present study, the char residue increased with the loading of nanoparticles in the blend. Thus, the results of TGA is corroborated with the XRD and DSC results.

TGA and DTG curves of chitin/ cashew tree gum/ CuS nanocomposites.
AC conductivity
The AC resistivity of CT/CTG blend with different loading of nano-CuS particles at room temperature is given in Figure 9. Generally, for all samples, it is evident that AC conductivity depends on the frequency which increased accordingly as shown in the figure. The mechanism of electrical conduction in polymer composites occurs in three ways. It can be due to the movement of electrons through the conductive network; the movement of electrons from one conducting particle to neighboring one and can also be due to the electric field radiation. 34 From the above possibilities, electron hopping is the major deciding factor for the conductivity of materials. It can be seen that the AC conductivity of CT/CTG/CuS composites is much higher than the pure CT/CTG blend and the conductivity of the composites increases with the dosage of nano CuS particles in the blend. The randomly oriented nature of macromolecular chains reduces their compactness of the pure blend which leads its poor conductivity as compared to composites. However, the crystalline CuS nanoparticles in the blend undergoes strong interaction with the blend segments and thereby improves their symmetric orientation of macromolecular chains in the blend matrix. This structural order of the composites improves the compactness of the polymer (well evident from XRD) which in turn leads to higher conductivity. The filler loading significantly increases the conductivity of the composite up to 7 wt.% CuS and beyond this loading the conductivity decreases. The decreases in conductivity of blend composite at higher loading of CuS results from the aggregation of metal sulphide within the blend matrix. 35
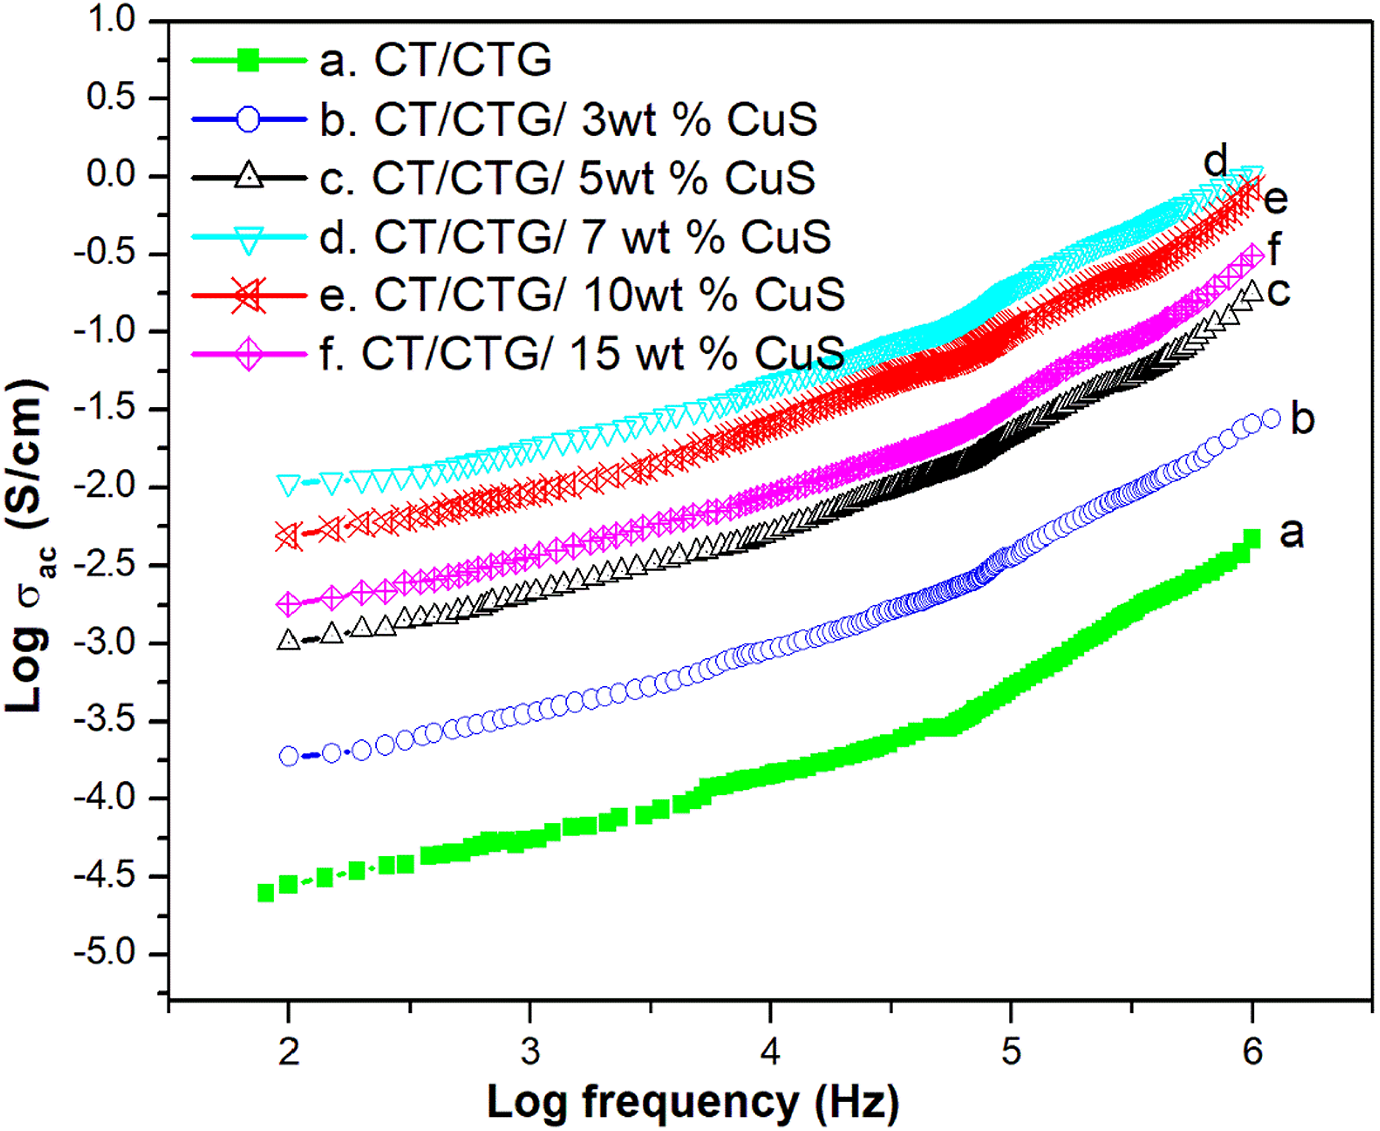
AC conductivity of chitin/ cashew tree gum/ CuS nanocomposites.
Dielectric constant (εr)
The influence of CuS nanoparticles on the dielectric constant (εr) of chitin/cashew tree gum composites is shown in Figure 10. It is clear that with an increase in the frequency, the dielectric constant values decrease for all samples and it shows constant values on further increase in the applied frequency. This decreases in εr can be related to the time lag taken by the dipoles with the applied field. At lower frequencies, a sudden drop in εr results from the tendency of forming dipoles in the blend to orient themselves with an applied frequency. The value of εr increases gradually with the CuS concentration which is due to a unique and different relaxation behavior of the blend composite. 36 This relaxation is related to the polarity of the nanoparticles in which the polar-polar interaction affects the εr of polymeric materials. Blend nanocomposites with high dielectric constant values are useful to fabricate integrated circuits of very small sizes.
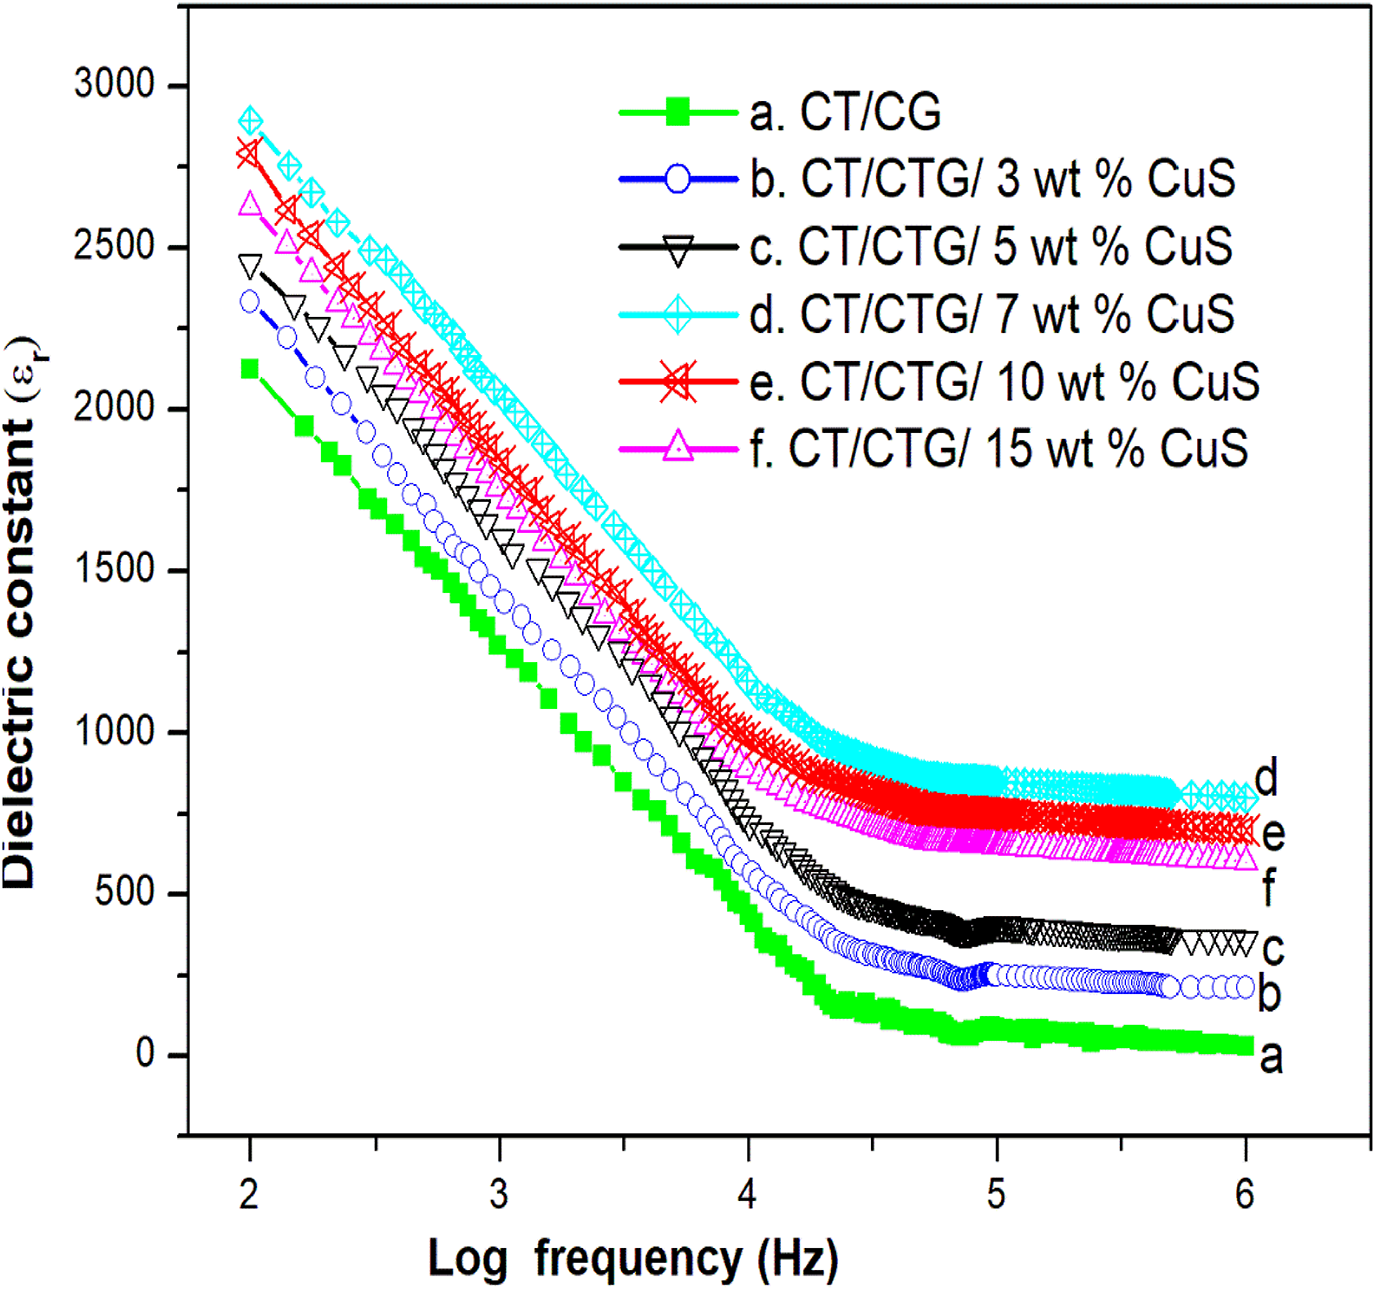
Dielectric constant of chitin/ cashew tree gum/ CuS nanocomposites.
Dielectric loss tangent (Tan δ)
The dielectric loss plot of CT/CTG blend and its CuS filled samples at room temperature are shown in Figure 11. Here the Tan δ values of all samples decrease with frequency and finally reached a constant at 105 Hz. From the figure, it can be seen that the dielectric values for all the CT/CTG/CuS samples are higher than the pure CT/CTG blend. This clearly indicates a relaxation phenomenon and it is associated with the orientation of dipoles and interfacial polarization. 37 Among the nanocomposites, for 7 wt.% observed the highest Tan δ value which can be due to the interfacial adhesion among the polar segments of polymer blend and CuS nanoparticles. However, there is a reduction in Tan δ value for the sample with 10 and 15 wt.% CuS with respect to 7 wt.% sample. This may be due to the agglomeration of CuS in CT/CTG blend that restricts the movement of the macromolecular chain. This in turn leads to the lowering of tangent values. Again, materials with high Tan δ values are of high use in electronic devices.
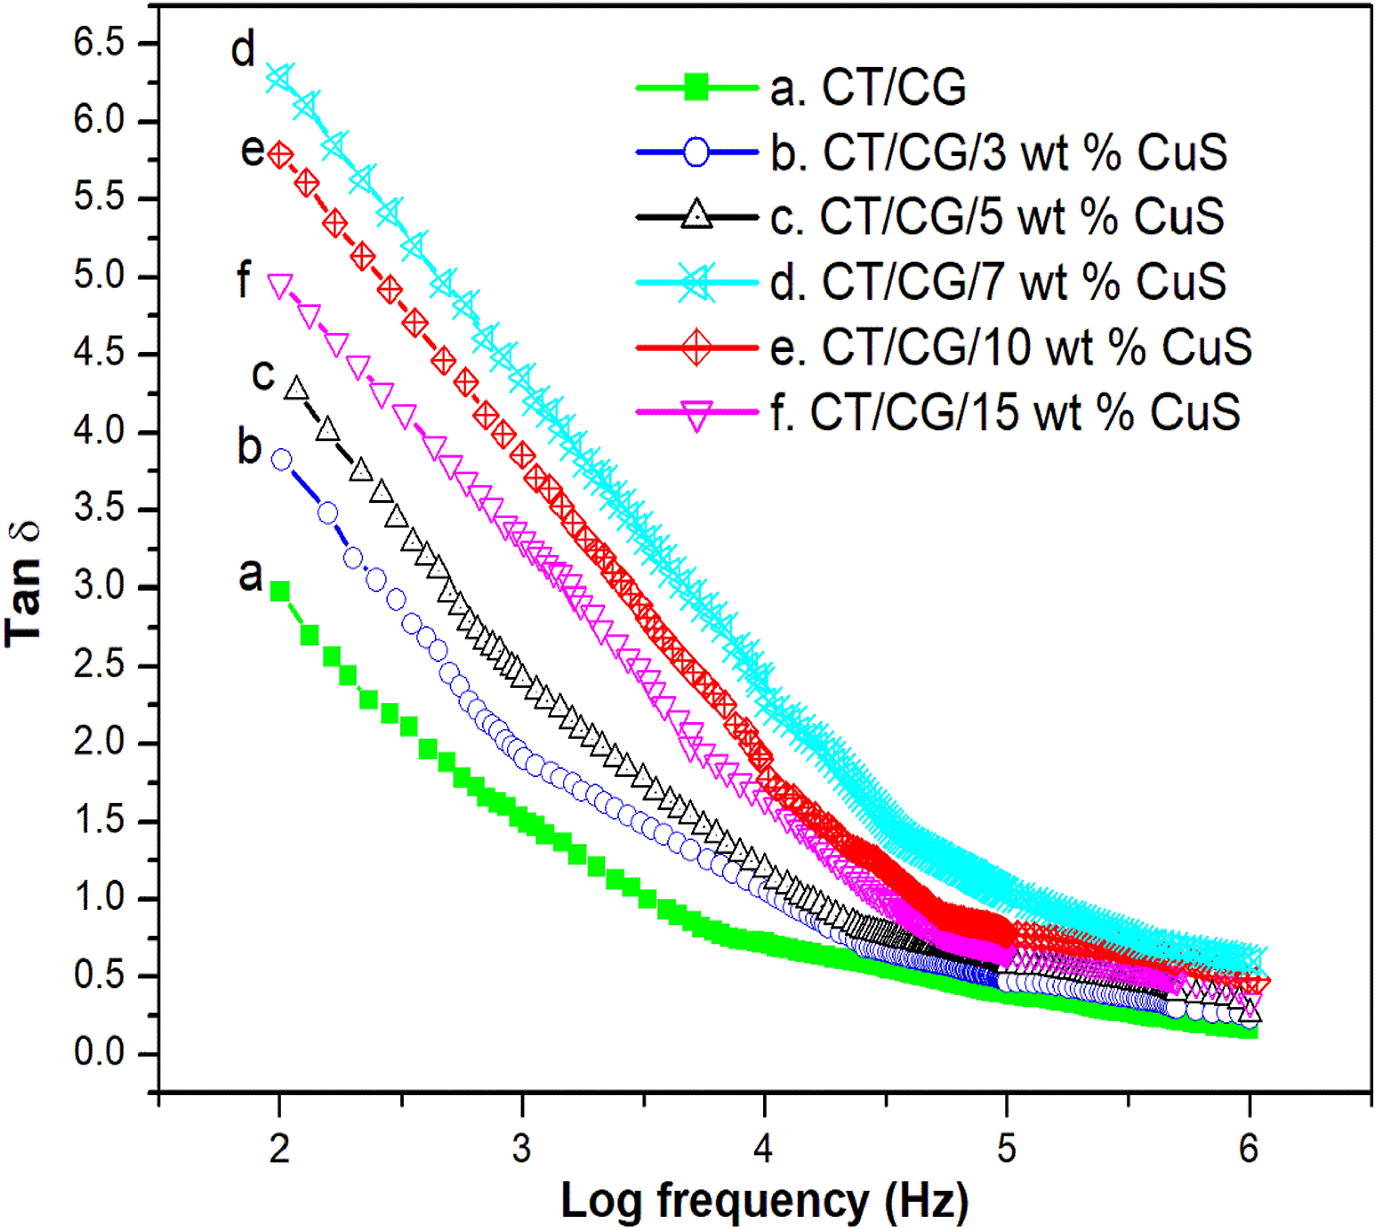
Dielectric loss of chitin/ cashew tree gum/ CuS nanocomposites.
Mechanical properties of CT/CTG/CuS nanocomposite
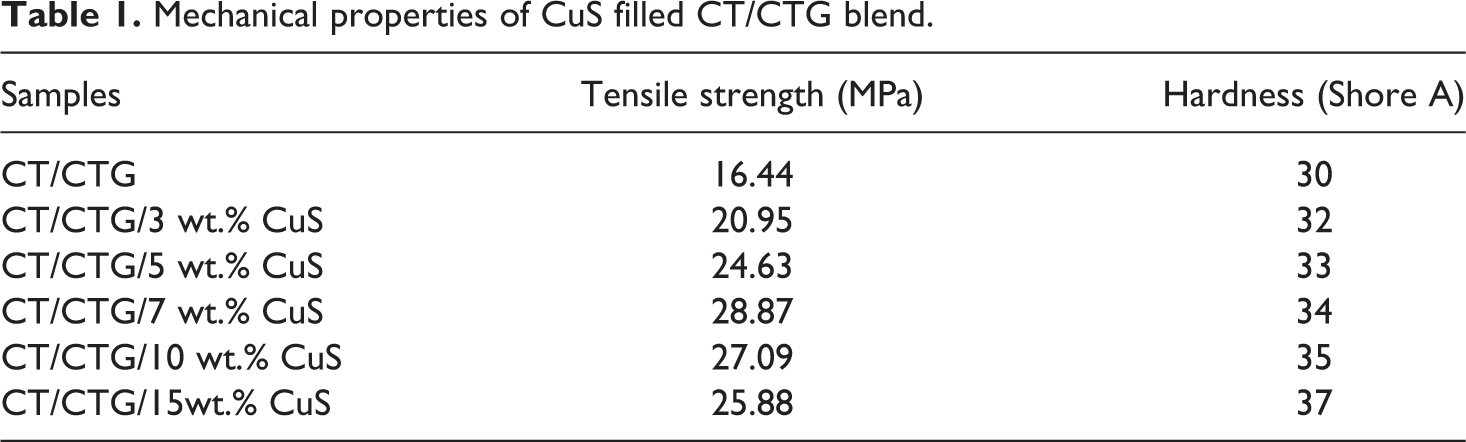
Among the mechanical properties of polymer blends and nanocomposites, tensile strength has much relevance. This is because the material with high tensile strength tends to perform better properties and more durable in service. 38 The tensile values of CT/CTG with different loading of CuS particles are presented in Table 1. Higher tensile strength values are obtained for all the blend nanocomposites as compared to that of the pure CT/CTG blend. This may be due to the strong interfacial adhesion between the nano CuS particles and CT/CTG blend. Tensile strength of CT/CTG/CuS increases up to 7 weight percentage loading of CuS, which is the maximum tensile strength value. The reason for this observation is the uniform dispersion of CuS nanofiller at 7 wt.% loading. The uniform distribution leads to a large interfacial area of contact and hence good interfacial adhesion among the polymer blend and CuS nanofiller. Beyond 7 wt.% loading of CuS, the tensile strength decreases resulting from the poor reinforcing effect due to the aggregation of nanoparticles. At higher dosage of CuS, the heterogeneous distribution of aggregated CuS nanofiller in the blend occurs and this leads to more CuS-CuS interaction than the CuS-blend interaction. The Shore A hardness of the CT/CTG/CuS composite given in Table 1 is found to increases with the dosage of CuS nanoparticles in the polymer blend.
Mechanical properties of CuS filled CT/CTG blend.
Conclusions
Chitin (CT)/cashew tree gum (CTG) blend nanocomposites with different loadings of nano-CuS particles have been prepared and characterized. A simple solution blending technique has been used for the preparation of blend composites. The change in broadness and shift in the peaks of UV spectra as well as the shift in the case of FTIR clearly indicated the strong interfacial interactions between CT/CTG blend segments and CuS nanoparticles. The crystalline nature of CuS nanoparticles was clear from the sharp XRD peaks while their shift to higher 2θ values clearly indicated the coordination interaction between vacant orbital of CuS and carboxy, hydroxyl and NH group of blend segments. The SEM and TEM images showed the uniform distribution of CuS nanofiller in the polymer blend matrix at lower loading of 7 wt.%, while at higher loadings, the particles appear elongated. The glass transition temperature of pure polymer blend showed an increased Tg value with the addition of CuS nanoparticles due to the restriction they impose on the segmental mobility of CT/CTG blend. The thermal stability of CT/CTG/CuS was higher than the polymer blend. AC conductivity values showed strong dependence on the weight percentages of CuS particles in the CT/CTG blend. AC conductivity, dielectric properties such as the Tan δ and dielectric constant values were increased with the amount of CuS up to 7 wt.%. The tensile strength and hardness of the blend composites increased with the CuS loading indicated the reinforcement of CuS in CT/CTG blend. With respect to the observed properties, it could be concluded that CT/CTG/CuS blend nanocomposites find potential applications in the field of electronic devices, sensors and actuators.