
Abstract
Oriented polylactic acid (PLA)/graphene oxide (GO) nanosheets tapes were prepared via uniaxial solid state drawing. The effect of various drawing conditions, including drawing ratio (DR), temperature (DT), and speed (DS) on mechanical, thermal, structural, and barrier properties were studied. Structural studies showed oriented structure for the drawn tapes with aligned polymer chains and GO nanosheets. Differential scanning calorimetry revealed improved glass transition temperature (Tg) and crystallinity (Xc) after drawing. In addition, Tg and Xc were increased more by increasing DR and DT. The highest Tg and Xc were achieved for 3/70/50 tape with values of 73°C and %22, respectively. Higher thermal stabilities and enhanced barrier properties were achieved after drawing, especially at the higher DR. Finally, tensile testing revealed simultaneous improvement in stiffness and toughness due to strain hardening for all the drawn tapes. The strength and elastic modulus were increased after increasing DR, DS, and DT and reached the highest values of 149 MPa and 3.6 GPa for 3/70/50. Overall, the properties were controllable by the processing conditions.
Introduction
In recent years, globally increasing environmental and social concerns over petroleum-based polymers and new environmental legislations about their use have forced researchers to find bio-based alternatives such as polylactic acid (PLA). PLA’s good properties such as low amount of consumed energy for production, low emission of greenhouse gases, biocompatibility, and biodegradability make it suitable for various applications. Nevertheless, high brittleness and low toughness, inferior thermal resistance, relatively low tensile strength, and slow crystallization rate are PLA’s shortcomings indicating the urgency of reinforcing this polymer for engineering applications.1–5
A variety of nanofillers have been incorporated into PLA to tackle its limitations. 6 In recent years, graphene has been the most appealing nanomaterial for nanocomposite preparation. Graphene, which is a single layer of graphite, is a promising nanomaterial and shows excellent mechanical, thermal, and electrical properties.7,8 The degree of property enhancement by graphene addition depends on the dispersion state, the orientation of nanosheets, and their bonding to the matrix. 9 Different forms of graphene such as graphene nanoplatelets, graphene oxide, and reduced graphene oxide have been added to PLA and studied. 10 In order to promote the interactions between graphene and PLA, several oxygen-containing functional groups are added to the base plane of graphene through the oxidation of graphite and graphene oxide (GO) is introduced.11–13 Enhanced mechanical and thermal properties have been reported for PLA/GO nanocomposites.13–16
Orienting polymer chains by solid state drawing is also utilized to improve PLA properties. Solid state drawing offers several advantages over other methods used for properties enhancement. It is a green mechanical technology with high production rates and is performed without complex processing apparatus. 17 Drawing leads to chain alignment in the applied force direction which alters polymer structure and causes anisotropy. Simultaneous enhancement of strength and toughness along with improvement in thermal properties can be achieved and have been reported by researchers for PLA after drawing.18–20 From literature, it can be concluded that the properties of PLA are highly dependent on the applied drawing conditions, including drawing ratio, temperature, and speed.21–23
Few studies have been performed on solid state drawing of PLA-based nanocomposites24–26 and to the best of our knowledge, no work has been reported the effect of drawing on mechanical, thermal, and structural properties of PLA/GO nanocomposites. In the present work, PLA nanocomposites containing 1.5 wt.% of GO were prepared by melt blending in a twin screw extruder followed by compression molding and were drawn at two ratios of 2 and 3, two temperatures of 60°C and 70°C, and two speeds of 20 and 50 mm/min. Mechanical, thermal, and structural properties of the undrawn and drawn nanocomposites were investigated to study the effect of GO and the applied drawing conditions.
Experimental
Materials
Polylactic acid (2003D) with density and MFR of 1.24 g/cm3 and 6 g/10 min, respectively was acquired from NatureWorks Inc. (USA). Graphene oxide (99%, 3.4–7 nm, 6–10 layers) was obtained from US Research Nanomaterials Inc. (USA). Methanol and NaOH were supplied from Merck Co. (Germany). PLA and GO were dried under vacuum at 60°C for 7 h before processing.
Sample preparation
Neat PLA and PLA nanocomposites containing 1.5 wt.% of GO were melt blended in a Brabender co-rotating twin screw extruder with thermal profiles of 160–170–175–180–185–195°C from feeding to die zones and at 200 rpm speed. The obtained strands were quenched in water bath and pelletized using a strand pelletizer. Subsequently, the compounds were compression molded into 250 µm thick films using a hot press (Sanjesh Baspar Novin 1041, Iran) in three steps. First, preheating of the compounds were performed for 2 min at 190°C and atmospheric pressure. Next, pressure of 8 MPa was exerted at the same temperature for 6 min. Finally, the films were cooled to the ambient temperature at 3 MPa pressure by circulating water through the plates.
Uniaxial drawing was carried out by a tensile testing machine equipped with a heating chamber (SANTAM STM 50, Iran). Tapes with 80 × 20 mm2 dimensions were punched from the prepared films and placed in the tensile machine grips with a 30 mm gauge length. Two drawing ratios (DR) of 2 and 3, two drawing temperatures (DT) of 60°C and 70°C, and two drawing speed (DS) of 20 and 50 mm/min were selected for drawing conditions. DR was calculated using equation (1).24,27
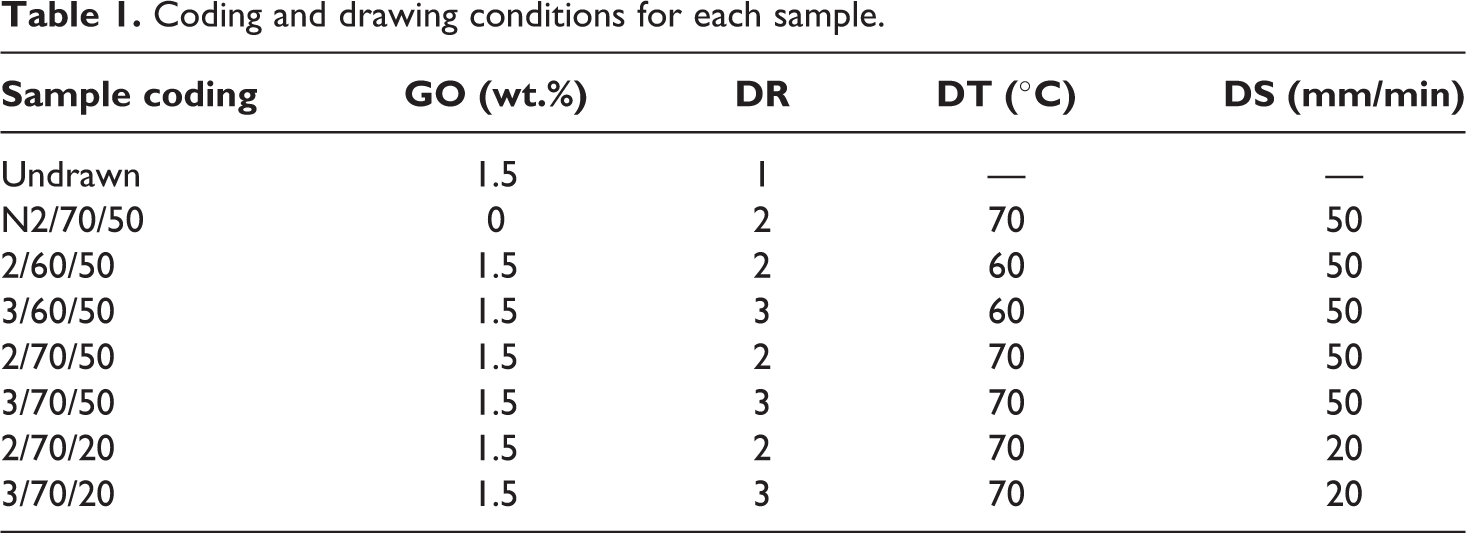
The abbreviation used in the rest of this study for each sample as well as the drawing conditions applied for the sample are indicated in Table 1. For the drawn nanocomposites, three numbers separated by slash marks is used for the coding indicating DR, DT, and DS, respectively. For instance, 3/70/50 is a drawn nanocomposite at DR = 3, DT = 70°C, and DS = 50 mm/min. The code for the drawn PLA starts with N and is followed by the aforementioned numbers.
Coding and drawing conditions for each sample.
Characterization
Field emission scanning electron microscopy (FESEM)
The structure of nanocomposites in the undrawn and drawn tapes were observed by field emission scanning electron microscopy (FESEM) (FEI, Quanta FEG 450). The tapes were cryo-fractured and longitudinal sections were coated with a thin layer of gold prior to the inspection to reduce the error. In addition, the specimens were etched with a 70:30 water-methanol mixture containing 0.04 mol/L NaOH 26 to study the morphology of the etched tapes together with the unetched ones.
Differential scanning calorimetry (DSC)
Differential scanning calorimetry (Baehr DSC 302) was utilized to study the glass transition temperature and crystallization of the undrawn and drawn tapes. Approximately 5 mg of the samples was cut from the tapes and heated from 40°C to 200°C at a heating rate of 10°/min. The degree of crystallinity (XC) was calculated by equation (2).28,29
where △Hm is melting enthalpy, △Hcc is cold crystallization enthalpy, △Hm° is melting enthalpy for a 100% crystalline sample (93.7 J g−1), 30 and wt is the GO weight fraction (0 or 1.5) in the specimens.
X-ray diffraction (XRD) analysis
X-ray diffraction experiment was carried out using Asenware AW-XDM300 diffractometer (China) to explore the changes in the microstructure of the samples after the drawing. The tests were conducted with CuKα radiation (λ = 0.154, 40 kv, and 30 mA). The 2θ range was 10° to 40°.
Thermogravimetric analysis (TGA)
Thermogravimetric analysis was performed to investigate the thermal stability of the tapes using Baehr 503a machine. Approximately 10 mg of the samples were heated from the ambient temperature to 700°C at a constant heating rate of 20°C/min under the flow of Argon gas. The results were recorded in the form of diagrams of residual mass (%) versus temperature (°C). The temperatures at 10% and 90% mass loss (T10% and T90%, respectively) were reported for each samples for thermal stability comparison.
Water absorption measurement
Water absorption of the samples was measured by immersing specimens in distilled water at 30°C for 20 days. The swelling ratio is defined as the ratio of the final weight (Wf) to the initial (W0) weight of the specimen by equation (3).15,31

Tensile testing
Tensile properties of the tapes were measured based on ASTM D 882 using SANTAM STM 50, Iran, machine equipped with a load cell of 500 N. Samples with dimensions of 80 × 5 mm2 and grip distance of 20 mm were punched from the tapes and stretched to rupture at a cross head speed of 5 mm/min. At least five replicates were tested for each sample code and the properties including elastic modulus, ultimate strength, elongation at break, and the toughness (the area under stress-strain diagram) were reported.
Results and discussion
Deformation behavior of the tapes during drawing
The deformation behavior of the tapes during drawing process is demonstrated in Figure 1. As it can be noticed, a higher strength was obtained for 2/70/50 compared to N2/70/50 due to the presence of GO nanosheets. For investigation of the role of temperature in drawing, the tapes were drawn at two temperatures, one below the Tg (60°C) and the other one above the Tg (70°C). As can be observed, the tapes exhibited either rubbery or ductile behavior based on the applied DT inferring that the deformation behavior was highly dependent on DT. The two samples drawn below the Tg at 60°C (2/60/50 and 3/60/50) depicted a typical ductile deformation with an initial linear elastic part followed by strain softening, a plateau, and weak strain hardening. Higher stress levels were observed for these tapes compared to the ones drawn at 70°C. The reason for showing a ductile behavior and higher stress levels for the tapes at 60°C could be attributed to the increased vitrification effect on PLA segments. At this temperature, PLA could be considered as a supercooled liquid and most of polymer chains are frozen. A high stress is required to overcome the existing energy barrier and induce yielding of the frozen segments.23,32 However, a rubber-like behavior with a nonlinear deformation from the onset of drawing was recorded for all the tapes drawn above the Tg at 70°C. The chains are in the rubbery state and the vitrification effect is decreased. Hence, lower amounts of energy and stress are needed to break the energy barrier of the chains. 23
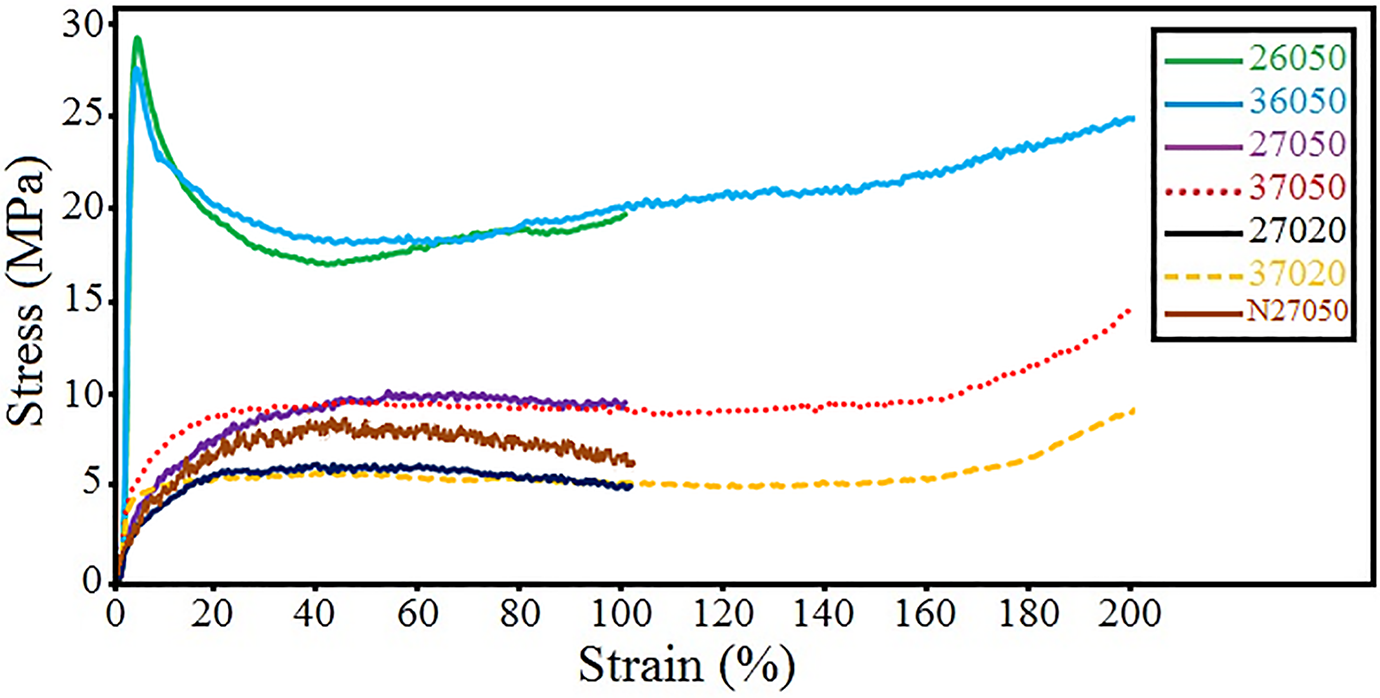
Deformation behavior of the tapes at different conditions during drawing.
For exploring the DS effect, two speeds of 20 and 50 mm/min were selected and the tapes were drawn at different DRs of 2 and 3 and the same temperature of 70°C. An increment in stress was obtained after increasing the DS for both 2/70/50 and 3/70/50 samples compared to 2/70/20 and 3/70/20, respectively. At 20 mm/min, several thin regions were detected in the sample and therefore less uniform tapes were achieved. In contrast, a more uniform and homogeneous drawing was obtained at 50 mm/min. This led to an increased stress level at this DS. Similar results were obtained by Chen et al. 33 and Takahashi et al. 19
The samples drawn at different DRs and the same DS and DT were quite matched up to 100% strain. It is worth mentioning that strain hardening occurred significantly for the samples drawn at the ratio of 3 at strains over 100%. The occurrence of strain hardening after 100% strain was also reported by other researchers and has been attributed to the strain-induced crystallization and orientation phenomenon 34 which will be discussed more in the next sections. Overall, the deformation behavior during drawing was highly dependent on the conditions and varied significantly by increasing the DT.
Morphological analysis
FESEM images taken from the longitudinal section of the unetched 3/70/50 are indicated in Figure 2. The drawing direction is shown by a red arrow. An oriented fibrillary bundle structure in the direction of the red arrow can be observed where amorphous and crystalline regions of PLA and micro-voids are aligned. For better inspection, the undrawn and 3/70/50 tapes were etched and FESEM images of them are depicted in Figure 3. Numerous pits are observed for both undrawn and 3/70/50 samples due to the removal of the amorphous chains of PLA after hydrolysis of the ester linkage via etching. 35 The pits are irregular-shaped for the undrawn tape (Figure 3(a)) and GO nanosheets are randomly oriented. However, they are elongated in the drawing direction (shown by the red arrow) for 37050 in Figure 3(b). The elongated pits indicate the aligned removed amorphous chains after the drawing. In addition, partially aligned GO nanosheets in the drawing direction are observed for the etched 3/70/50. Therefore, oriented structure is also observed for the drawn tape in Figure 3(b). In both Figures 2 and 3(b), wavy striations appear perpendicular to the drawing direction indicating the occurrence of crystal reassembling. It has been reported that in drawing at temperatures just above Tg of PLA and at above 100% strains, micro-voids and cavities are formed and develop with the breakage of the former crystals.21,36
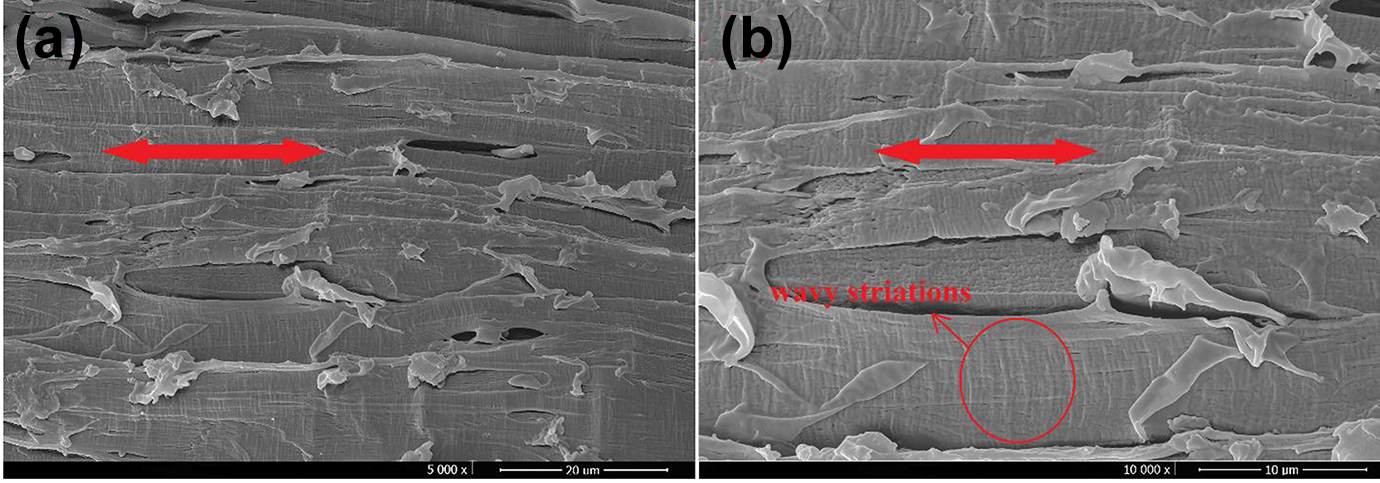
FESEM images of longitudinal section of unetched 3/70/50 at different magnifications.
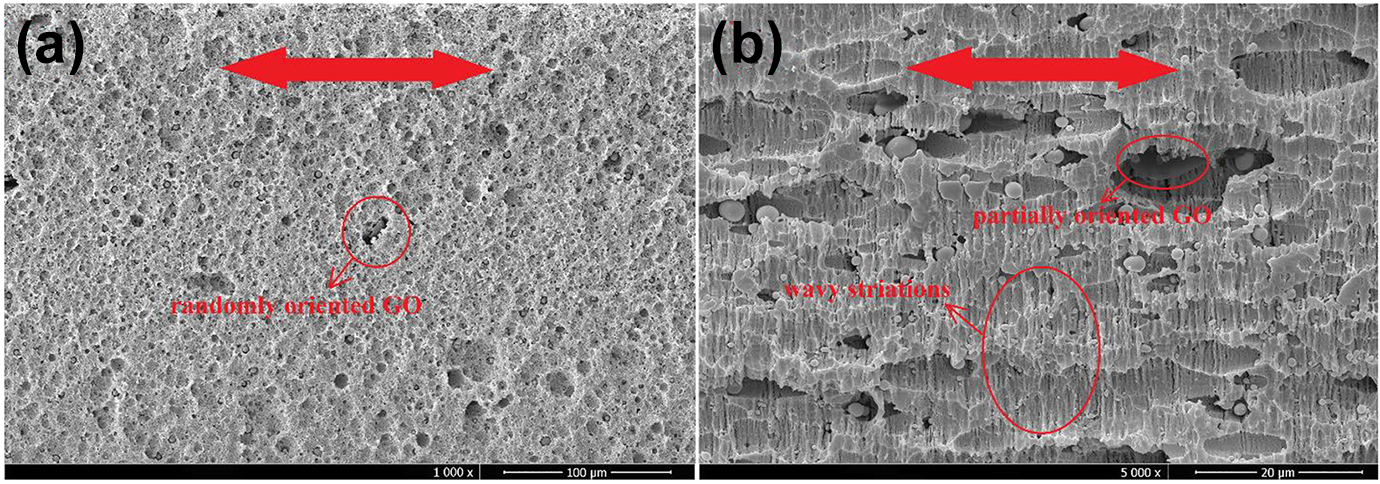
FESEM images of longitudinal section of etched (a) undrawn and (b) 3/70/50.
From Figures 2 and 3, 2-D and 3-D schematic pictures of the drawn tapes are proposed and illustrated in Figures 4(a) and (b), respectively. As can be observed in these figures, an oriented structure is suggested in the stretching direction and amorphous and crystalline regions of PLA along with GO nanosheets are aligned in a unidirectional manner. It is well known that the alignment of nanofillers and polymer regions have great impact on the properties, especially mechanical properties.
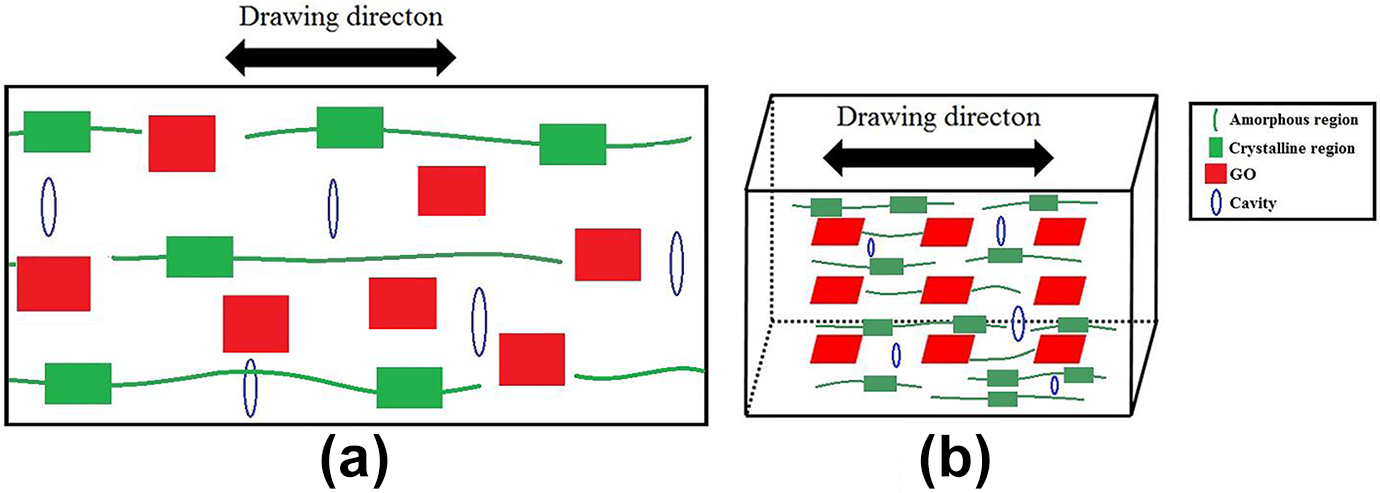
(a) 2-D and (b) 3-D schematic picture of the drawn nanocomposite tapes.
Thermal and structural characterization
Figure 5 shows the DSC heating thermograms and the obtained values for Tg and Xc. The undrawn sample indicated two endothermic peaks associated with glass transition and melting and one exothermic peak for cold crystallization. The values for Tg and Xc for the undrawn tape were 65°C and 5%, respectively and the cold crystallization temperature was approximately 110°C. Both Tg and Xc were increased for all the drawn tapes compared to the undrawn. In addition, the cold crystallization peak was shifted to lower temperatures and disappeared confirming the increase in Xc. The highest achieved Tg and Xc were 73°C and 22%, respectively for 3/70/50. In drawing process, configurational entropy of polymer chains decreases as a result of chain alignment in the drawing direction. Hence, formation of crystalline phase is facilitated, strain induced crystallization occurs, and degree of crystallinity increases.20,24 Moreover, the decrease in chain conformation distribution and the restriction of chain mobility due to the stress induced crystallization is probably the reason for the increase in Tg after solid state drawing. 33 It is worthwhile to highlight that the increase in Xc from 16% to 19% for 2/70/50 compared to N2/70/50 indicates that GO nanosheets plausibly acted as nucleating agents by providing heterogeneous nucleating sites due to their high aspect ratio and specific surface area and strong interfacial interaction between the oxygen-containing functional groups of the basal plane of GO and PLA. 37 The nanosheets also contributed in supporting stress transfer during drawing and maintaining chain orientation by forming a network after the drawing. 38
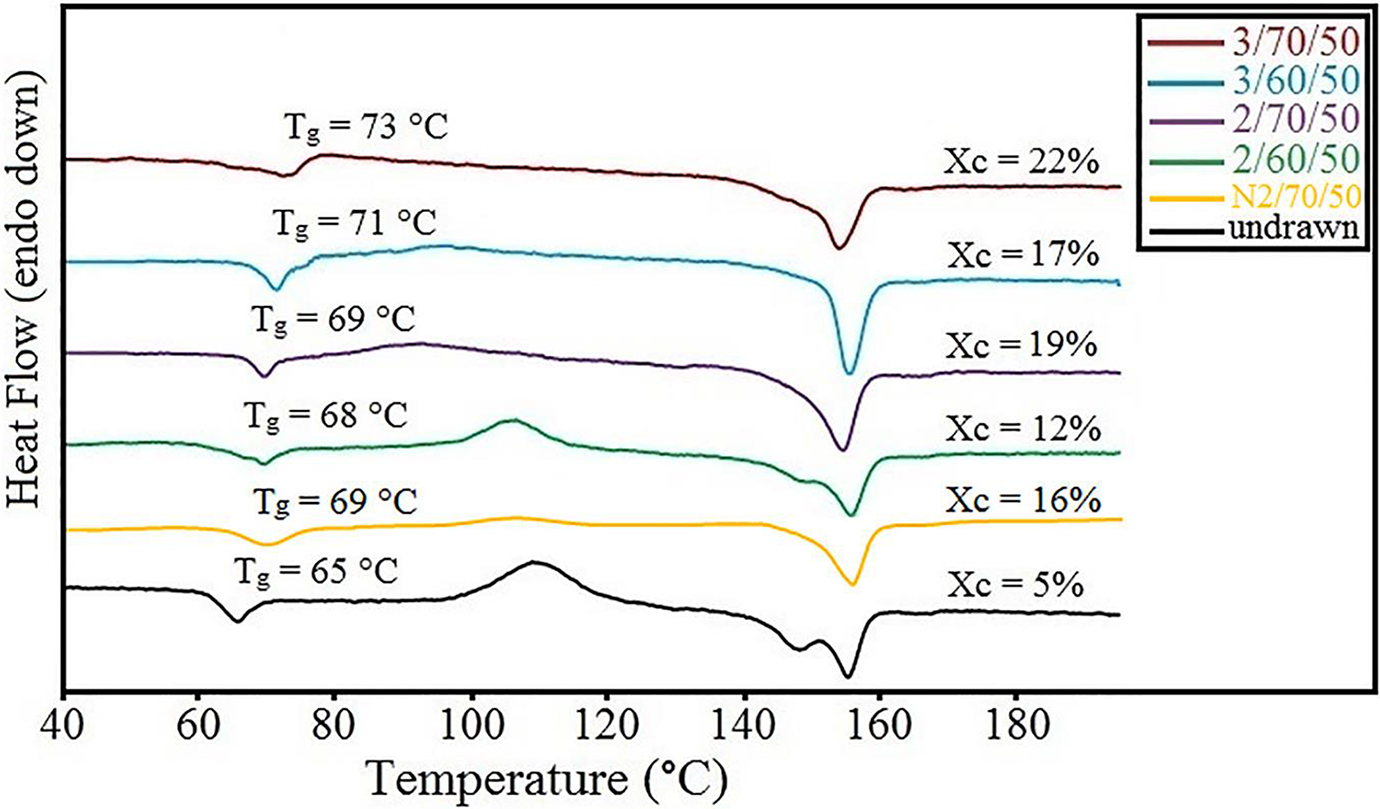
DSC heating thermograms of the tapes.
It is known that strain-induced crystallization is a function of DR, DT, and DS.18,26 Therefore, it is possible to obtain products with an extensive range of properties and applications by altering the drawing conditions. From Figure 5, Tg and Xc were increased more for the samples drawn at 3 ratio compared to 2 at the same temperature and speed suggesting higher alignment of polymer chains, stress induced crystallization, and restriction of chain mobility at the higher ratio. Furthermore, the thermal properties were higher for tapes drawn at the elevated temperature at the same ratio and speed. For instance, Tg and Xc experienced an increment from 68°C and 12% for 2/60/50 to 71°C and 17% for 2/70/50, respectively. It has been reported that the degree of orientation increases with the increase in temperature due to the greater pre-existing spherulite deformation. 20 Similar results were obtained by other researchers after increasing the drawing temperature from below the Tg to above it for PLA-based materials.22,26
XRD analysis was performed to further study the structure changes of the nanocomposite tapes after drawing and the results are depicted in Figure 6. The intensity of a peak in an XRD pattern represents the degree of crystallization and orientation. 27 From Figure 6, the undrawn sample exhibited a weak broad peak around approximately 2θ = 16.5° exhibiting mainly an amorphous and isotropic structure. However, the intensity of the peak and consequently degree of crystallization and orientation increased after drawing. It has been reported that by drawing PLA at temperatures below 70°C, the amorphous chains mainly transform into a less ordered phase named mesocrystal with high chain orientation. 36 In a study by Zhou et al., 39 coexistence of mesocrystal and α crystal form was reported for PLA tapes drawn at 70°C. Therefore, mainly mesocrystal along with α crystal coexist in the structure and are shown in a peak at approximately 2θ = 16.5° which can be assigned to the crystal plane (200)/(110).40,41 In addition, the position of the aforementioned peak remained at the same angle for all the drawn tapes implying that the crystal type did not change during drawing. The increase was more significant for the tapes drawn at 70°C compared to 60°C and also for DR of 3 compared to 2 showing higher degrees of strain induced crystallization at the elevated temperature and DR. The outcomes were consistent with the obtained DSC results.
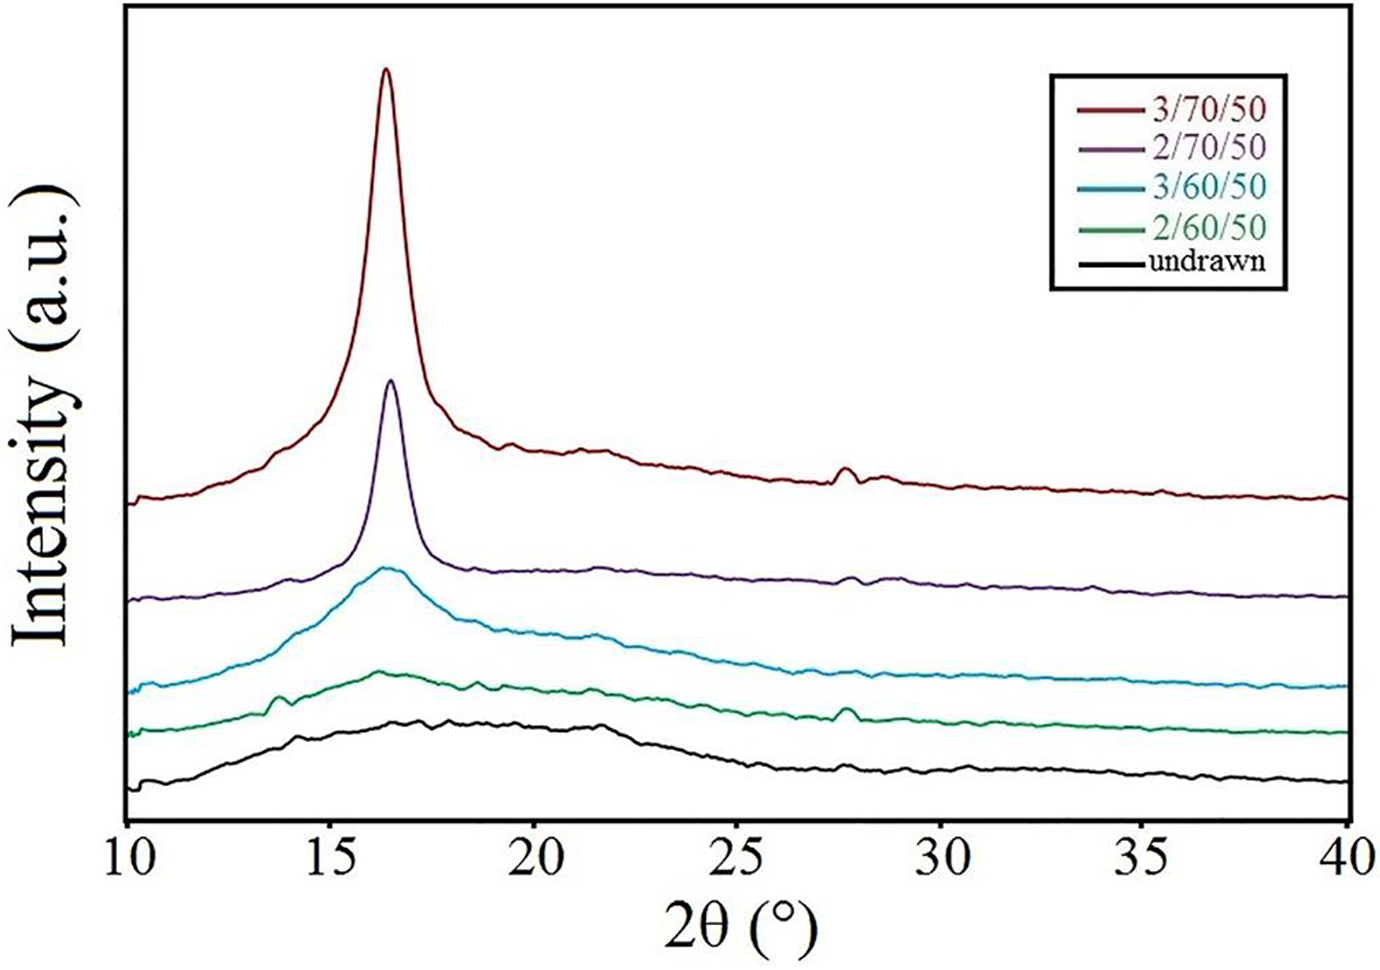
XRD patterns of the nanocomposite tapes.
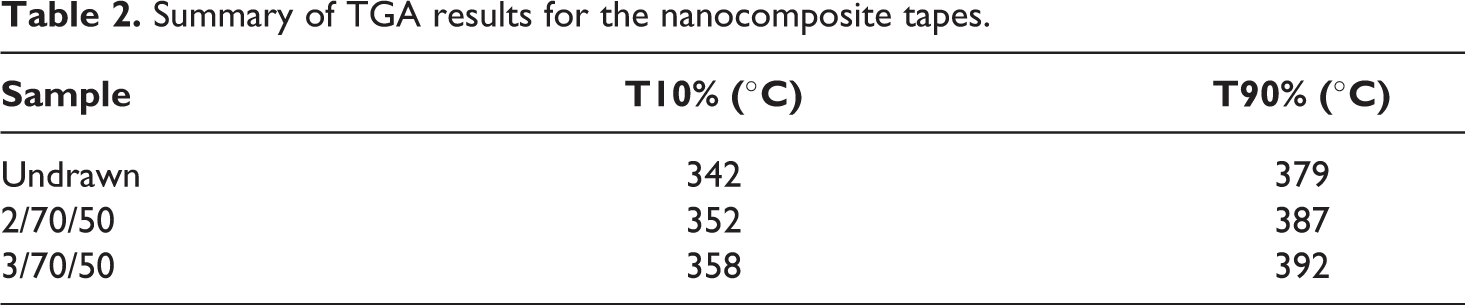
Thermal stability of the tapes was evaluated using TGA test. The thermograms are illustrated in Figure 7 and the results are summarized in Table 2. In Table 2, T10% and T90% are the temperatures at 10% wt. and 90% wt. mass loss, respectively. The values of T10% and T90% for the undrawn tape were 342°C and 379°C, respectively. Thermal stability was enhanced noticeably after drawing and the aforementioned values increased by 10°C and 8°C, respectively for 2/70/50 compared to the undrawn sample. The improvement could be ascribed to the alignment of GO nanosheets and polymer structure and better stability of PLA chains at the interface between GO and matrix which hindered the thermal decomposition by preventing mass transfer. 15 Moreover, T10% and T90% were further increased to 358°C and 392°C after increasing DR to 3 for 3/70/50. Higher degree of alignment for the material was achieved in this case resulting in better thermal stability. The TGA results are in accordance with other findings reported elsewhere.15,24
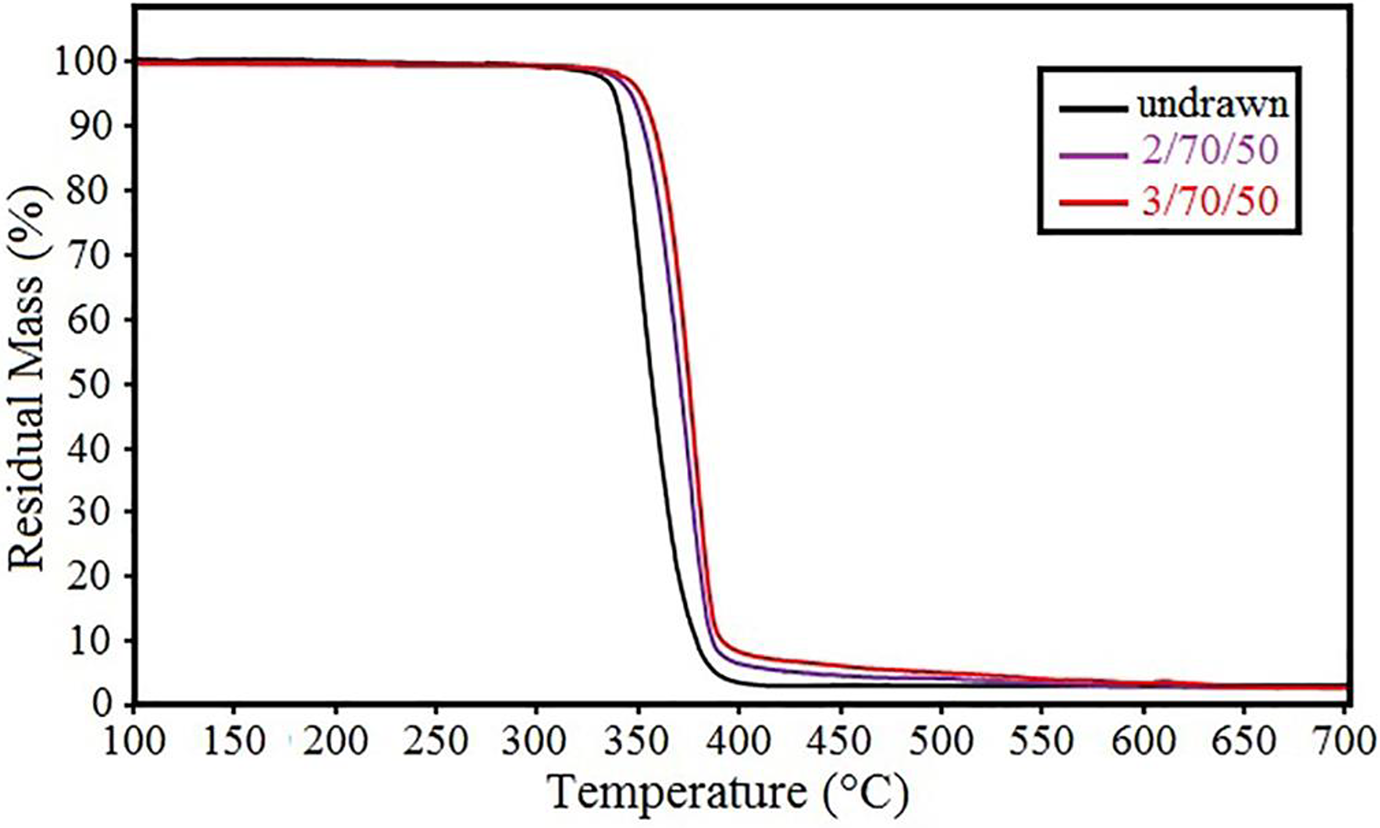
TGA thermograms of the nanocomposite tapes.
Summary of TGA results for the nanocomposite tapes.
Water barrier properties
Water barrier properties of the tapes were assessed by measuring water absorption of the specimens in distilled water at 30°C for 20 days. Figure 8 shows the water absorption trends for the undrawn, 2/70/50, and 3/70/50 tapes. All the samples exhibited the same behavior and water absorption reached a steady state condition after some time. The steady state water absorption decreased from approximately 0.5% for the undrawn to 0.33% and 0.25% for 2/70/50 and 3/70/50, respectively. This indicates that water barrier properties were improved remarkably after solid state drawing. It has been reported that the barrier properties of the nanocomposites are strongly influenced by the crystallinity and orientation of the matrix, the dispersion and orientation of the nanofillers, and the interface between the polymer and nanofillers. The more oriented structure including aligned PLA chains and GO nanosheets at ratio of 3 led to the higher crystallinity of PLA and polymer/nanofiller interface and better dispersion of GO was obtained which resulted in decreased water absorption, consequently. The results are in accordance with the DSC, XRD, and FESEM tests.15,42
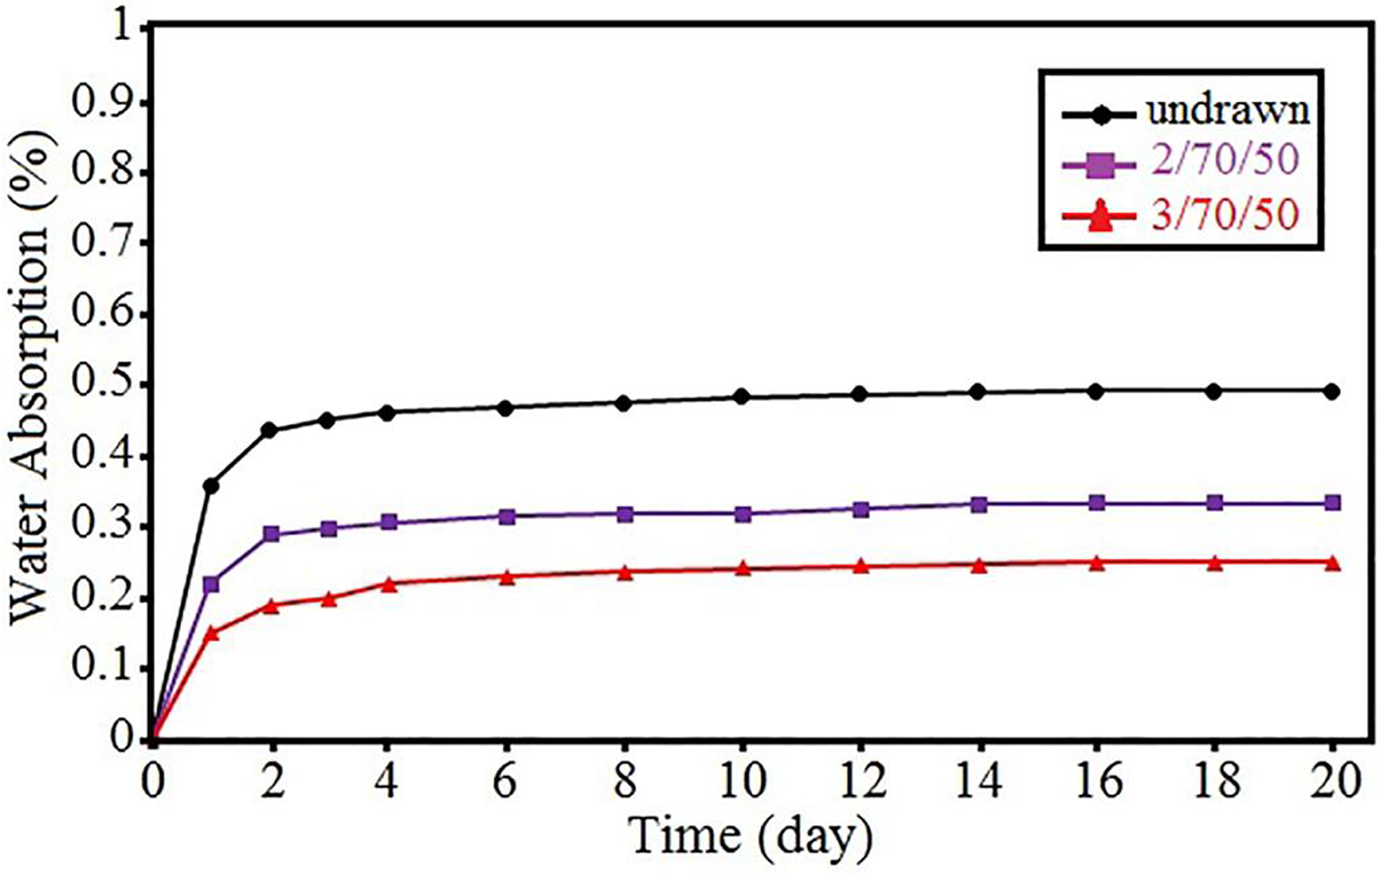
Water absorption of the tapes in distilled water at 30°C.
Mechanical properties
The results of tensile testing are indicated in Figures 9 and 10. As can be seen from Figure 9, the undrawn sample showed a brittle tensile behavior. The elastic modulus, strength, and work of fracture of the undrawn tape were 1.9 GPa, 62 MPa, and 1.4 MJ/m3, respectively. However, the tensile behavior of all the tapes changed after drawing and a ductile behavior with a simultaneous increase in the stiffness and toughness was observed. This deformation behavior change can be explained by strain induced crystallization, strain hardening, and polymer chain due to drawing. In the drawn tapes, the crack growth is prevented by the anisotropic structure which postpones final failure.17,25 The strength and modulus were improved from 115 MPa to 125 MPa and 2.7 to 2.9 GPa, respectively for 2/70/50 compared to N2/70/50. The highest achieved modulus and strength were 3.6 GPa and 149 MPa, respectively for 3/70/50. This shows approximately 90% and 140% enhancement in the mentioned properties, respectively compared to the undrawn sample. The toughness was also improved for this sample to 32 MJ/m3 indicating approximately 2185% increase compared to the undrawn film. The toughest tapes were 3/70/20 and 2/70/50 with both having work of fractures of approximately 39 MJ/m3. In general, the tensile properties were highly dependent on the drawing conditions. The modulus and strength improved and the elongation at break indicated a downward trend after increasing DR from 2 to 3 at the same temperature and speed. In addition, the slope of the final hardening section in the stress-strain curves was raised after the increase in DR. This can be explained by higher degrees of strain induced crystallization and orientation. The same trend for modulus, strength, and elongation at break was observed for 2/70/50 and 3/70/50 compared to 2/70/20 and 3/70/20, respectively after increasing DS from 20 to 50 mm/min. As mentioned earlier, a more uniform tape, higher orientation, and larger strain hardening were achieved at the higher speed. 33 In case of DT, the modulus and strength were enhanced after the increase in DT for 2/70/50 and 3/70/50 compared to 2/60/50 and 3/60/50, respectively. Mai et al. 21 and Shen et al. 17 also reported the increase in strength and modulus after increasing DT. The obtained tensile properties were consistent with DSC, XRD, and FESEM results.
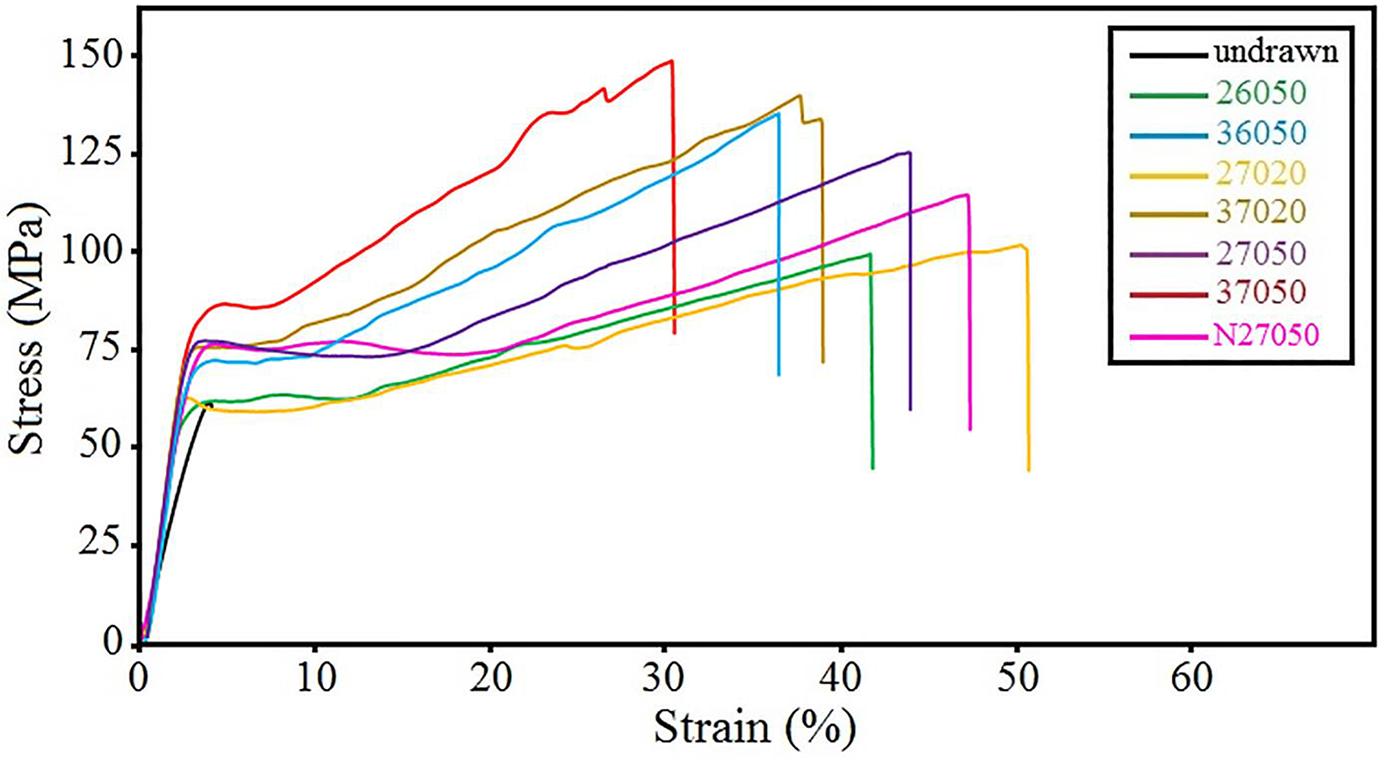
Tensile stress-strain diagrams of the tapes.
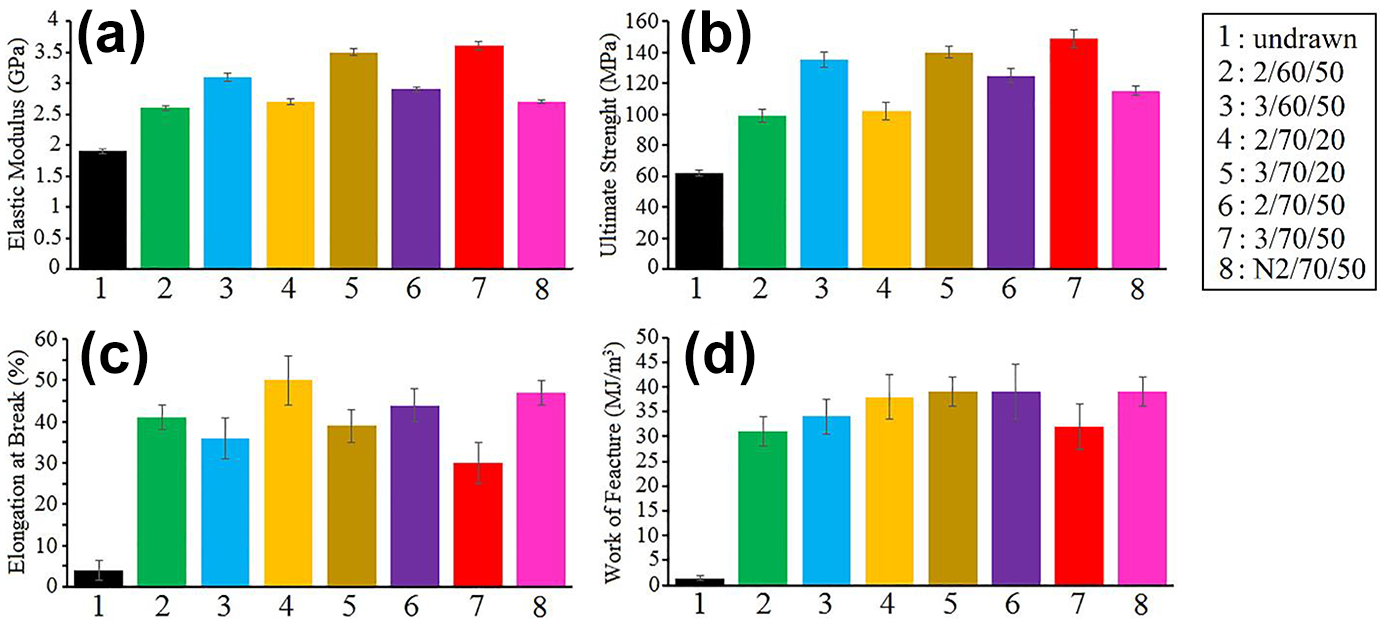
Tensile properties of the tapes (a) elastic modulus, (b) ultimate strength, (c) elongation at break, and (d) work of fracture.
Conclusion
In this study, the effect of solid state drawing at different DRs, DTs, and DSs on mechanical, thermal, structural, and barrier properties of PLA/GO nanocomposite tapes were explored. For this purpose, drawn PLA/GO films were prepared using melt blending technique followed by drawing in a tensile testing machine equipped with a heating chamber. Next, the tapes were subjected to different tests. The results indicated that all the properties were enhanced after drawing. Tensile strength and elastic modulus were improved after increasing DR, DS and DT. The highest strength and stiffness were 149 MPa and 3.6 GPa for 3/70/50. In case of thermal properties, Tg, and Xc were enhanced after increasing DR and DT and 3/70/50 exhibited the highest improvement with 8°C and 17% increase for the mentioned properties, respectively compared to the undrawn tape. The tapes were more thermally stable and resistive to water absorption after increasing DR. Overall, the properties were highly dependent on the applied drawing conditions.