
Abstract
The structure and optic properties of the transparent PP+SiO2 nanocomposites with a relatively high refractive index and enhanced luminescence properties were investigated. X-ray analysis, Fourier-transform infrared (FTIR), Visible-ultraviolet, and photoluminescence spectroscopic methods were used for investigation. The XRD analysis indicated that the fraction of the amorphous phase of the polycrystalline polymer decreases with the introduction of SiO2 nanoparticles. Even though SiO2 nanoparticle is amorphous itself, they play the role of the crystallinity centers in the polymer matrix, and the degree of crystallinity increases in polymer nanocomposites. According to UV-vis spectroscopic analysis that, with the increasing of the concentration of SiO2 nanoparticles distributed in the polymer matrix, the absorption intensity of the samples also increases. It was explained by the hyperchromic effect which is related to raising the optical density of the polymer by introducing the filler particles (SiO2). It was calculated bandgap energy and refractive index on the base of the UV spectra of samples. It has been found that at low concentrations of amorphous silica nanoparticles, the polymer nanocomposite retains its transparency despite having a relatively high refractive index (1.96). Furthermore, the photoluminescence (PL) spectrum of nanocomposites was investigated depending on filler concentration. It was clear that the intensity of the PL spectrums increases with the increase of the filler concentration that is explained by the raising of the luminescence centers in the nanocomposite material. These luminescence centers are oxygen-deficit centers in the spatial structure of the amorphous silica nanoparticles.
Introduction
The exceptional combination of properties makes silica the material of technological interest. As a transition metal oxide, SiO2 exhibit semiconductor properties and is one of the most commonly founded materials in the nature. 1 The main application areas of this material include electronic and optoelectronic. Furthermore, as a low toxic material, silica particles are also used in the field of food industry and cosmetology, successfully. There is a large number of studies on the preparation of the new composite materials on the base of silica nanoparticles.2–4 Especially, the combination of the unique properties of the silica with the remarkable features of the polymer makes polymer/silica nanocomposites a promising material. Guyard et al. 5 provided information about the interaction between polymer and silica nanoparticles. It was clear that favorable interactions prevent particle aggregation and lead to good dispersion of the filler particles inside the polymer matrix, whereas poor interactions cause the filler particles to aggregate during the evaporation of the polymer-filler-solvent mixture. Furthermore, Lee and Yoo 6 gave information about the modification of the silica, characterization of the modified silica, preparation of the polymer nanocomposites based on this silica, and the application areas of these nanocomposites. Characterization, optical and dielectric properties of polyvinyl chloride/silica nanocomposites films were investigated by Abdel-Baset et al. 7 It is known that polyvinyl chloride is one of the thermoplastic polymers which wildly used in the industry. The authors reported that the optical bandgap of the polymer was found to decrease with the addition of nano-silica. Tański and colleagues reported the production of the nanocomposite PVP/SiO2 thin films and the influence of silicon dioxide mass concentration in composite properties. 8 Optoelectrical properties of the epoxy/silica nanocomposites was also investigated and was reported that the optical energy gaps exhibited nano-silica concentration dependence. 9 Furthermore, there are a lot of publications which report the optical properties depending on the size and/or the surface modification of silica particles due to the its nonlinear optical characteristics. 10 It is also known that different modifications of the silica particles exhibit luminescence maximums in different wavelength regions. 11 The luminescence properties of silica nanoparticles in the polymer matrix was also investigated by some authors.12,13
However, there are a lot of rooms to study the structure and optical properties of polymer/silica nanocomposites, since the properties of these nanocomposites depend on the production techniques, the type of polymer, the crystallinity degree, the modification type, the size of silica. The transparency and refractive index are important optical properties of polymer nanocomposite.
The present study was examined the effect of the amount of silicon dioxide particles on the spatial and electronic structure and optical properties of the polypropylene base nanocomposite film. Polypropylene matrix was chosen as a typical member of industrial thermoplastic polymers. The films were produced by mixing the amorphous silica nanoparticles in the polymer/solvent solution and pressing under particular pressure and temperature.
Experimental section
Materials
All chemicals were used without additional purification: Isotactic PP (PP grade Moplen HF500N, homopolymer): density—0.92 g/cm3 at 25°C; Mw = 250,000; Mn = 67,000; melt mass flow rate (MFR) = 11.5 g/10 min (23°C, 2.16 kg); melting temperature = 162°C. Toluene (PLC); deionized water. Amorphous silicon dioxide (SiO2) nanoparticles with 50 nm size.
Solution blending and hot pressing method were used for preparation of the polymer nanocomposites.14,15
Characterization
X-ray diffraction (XRD) analysis of the prepared samples was carried out on a Rigaku Mini Flex 600 XRD diffractometer at room temperature. In all the cases, CuK(a) radiation from a Cu X-ray tube (run at 15 mA and 30 kV) was used. Diffraction patterns were obtained in the range of Bragg’s angle 2θ = 10–100. The structure of nanocomposite was studied at room temperature by Fourier-transform infrared (FTIR) spectroscopy (spectrometer Varian 3600 FTIR) at 4000–400 cm−1. The UV-vis spectra have been recorded on Spectrophotometer Specord250 Plus at 200–700 nm and ambient temperature. Photoluminescent properties of nanocomposite films were examined using a spectrofluorometer Varian Cary Eclipse at a wavelength range of 200–900 nm.
Results and discussion
Figure 1 shows X-ray diffraction pattern of the PP+SiO2 nanocomposites depending on filler(SiO2) concentration. It is known that the characteristic diffraction wide-band pattern of the amorphous silica is detected at 21.8° of 2-theta angle, with (101) Muller index. 16 The hkl indexes (110), (040), (130), (111) of pure polypropylene are observed at 14.7°; 17.4°; 19.1°; 22.3°, respectively. 17
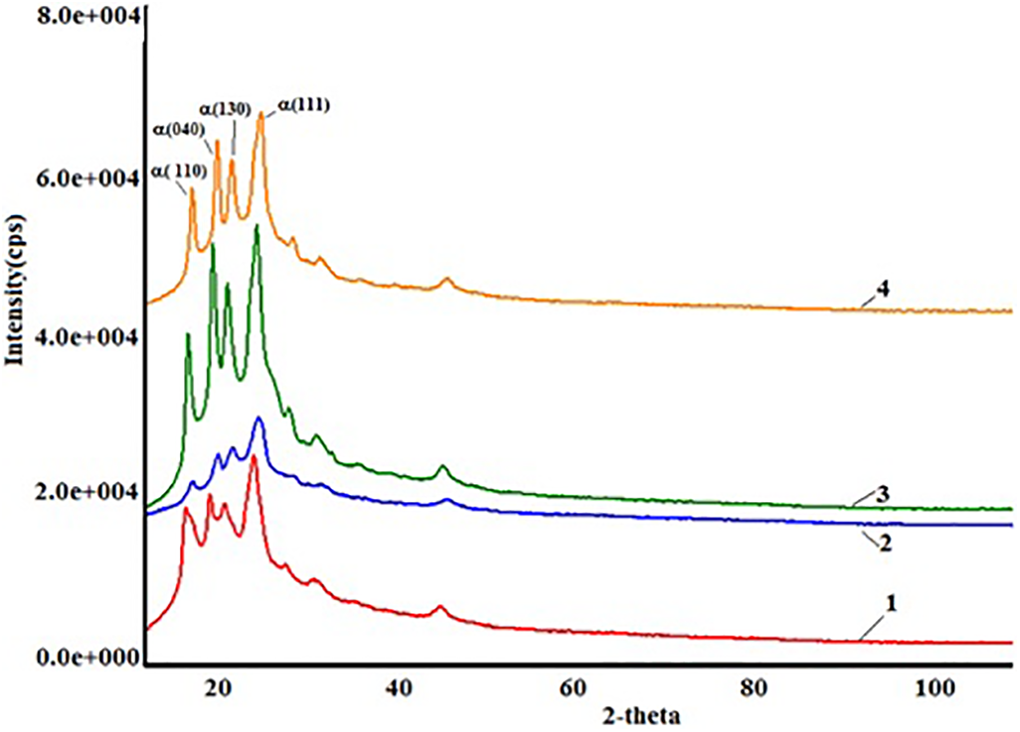
X-ray diffraction patterns of PP+SiO2 nanocomposites depending on concentration of SiO2 nanoparticles in polymer matrix 1) PP+3%SiO2 2) PP+5%SiO2 3) PP+7%SiO2 4) PP+10%SiO2.
It is clear from Figure 1 that with the introduction of the amorphous silica into the polymer matrix, the fraction of the polycrystalline phase of polymer decreases. Even though SiO2 nanoparticles are amorphous itself, they play the pole of the crystallinity centers in the polymer matrix. The number of crystallites with a big size decrease, and the number of crystallites with a small size increase. This fact leads to an increase in the degree of crystallinity of nanocomposites.
The FTIR spectrum of the PP+SiO2 nanocomposites was investigated at the range of 400–4000 cm−1 by Varian 3600 FT-IR equipment. The Figure 2 shows the FT-IR spectrums of polymer nanocomposites. The bands at 2950 cm−1, 2837 cm−1, 1462 cm−1, 1329 cm−1, 1303 cm−1, 1102 cm−1, 1044 cm−1, 972 cm−1, 841 cm−1, 526 cm−1 are associated with the C–H stretching, C–H stretching of CH2 groups, deformation vibration of the CH3 groups, deformation vibration of the –CH group, structural stretching of –CH groups, C–C chain stretching, stretching vibration of C–CH3 bond, C–C chain stretching, structural stretching of CH3 groups, deformation vibration of –C–C chain, respectively. It is known that these absorption bands belong to pure polypropylene. 18 However, incorporation silica nanoparticles into the polymer matrix lead to the observation of a new absorption maximum at the FTIR spectrum. With the addition of SiO2 nanoparticles into the polymer matrix, up to 3 wt%, the new peak at the 459 cm−1 is observed. With further increase of the filler concentration, in the polymer matrix, this absorption band shifts to 460 cm−1. 19 The intensity of the absorption band at 809 cm−1, which is related to the symmetric stretching vibration of Si-O-Si, decreases with increasing filler concentration.
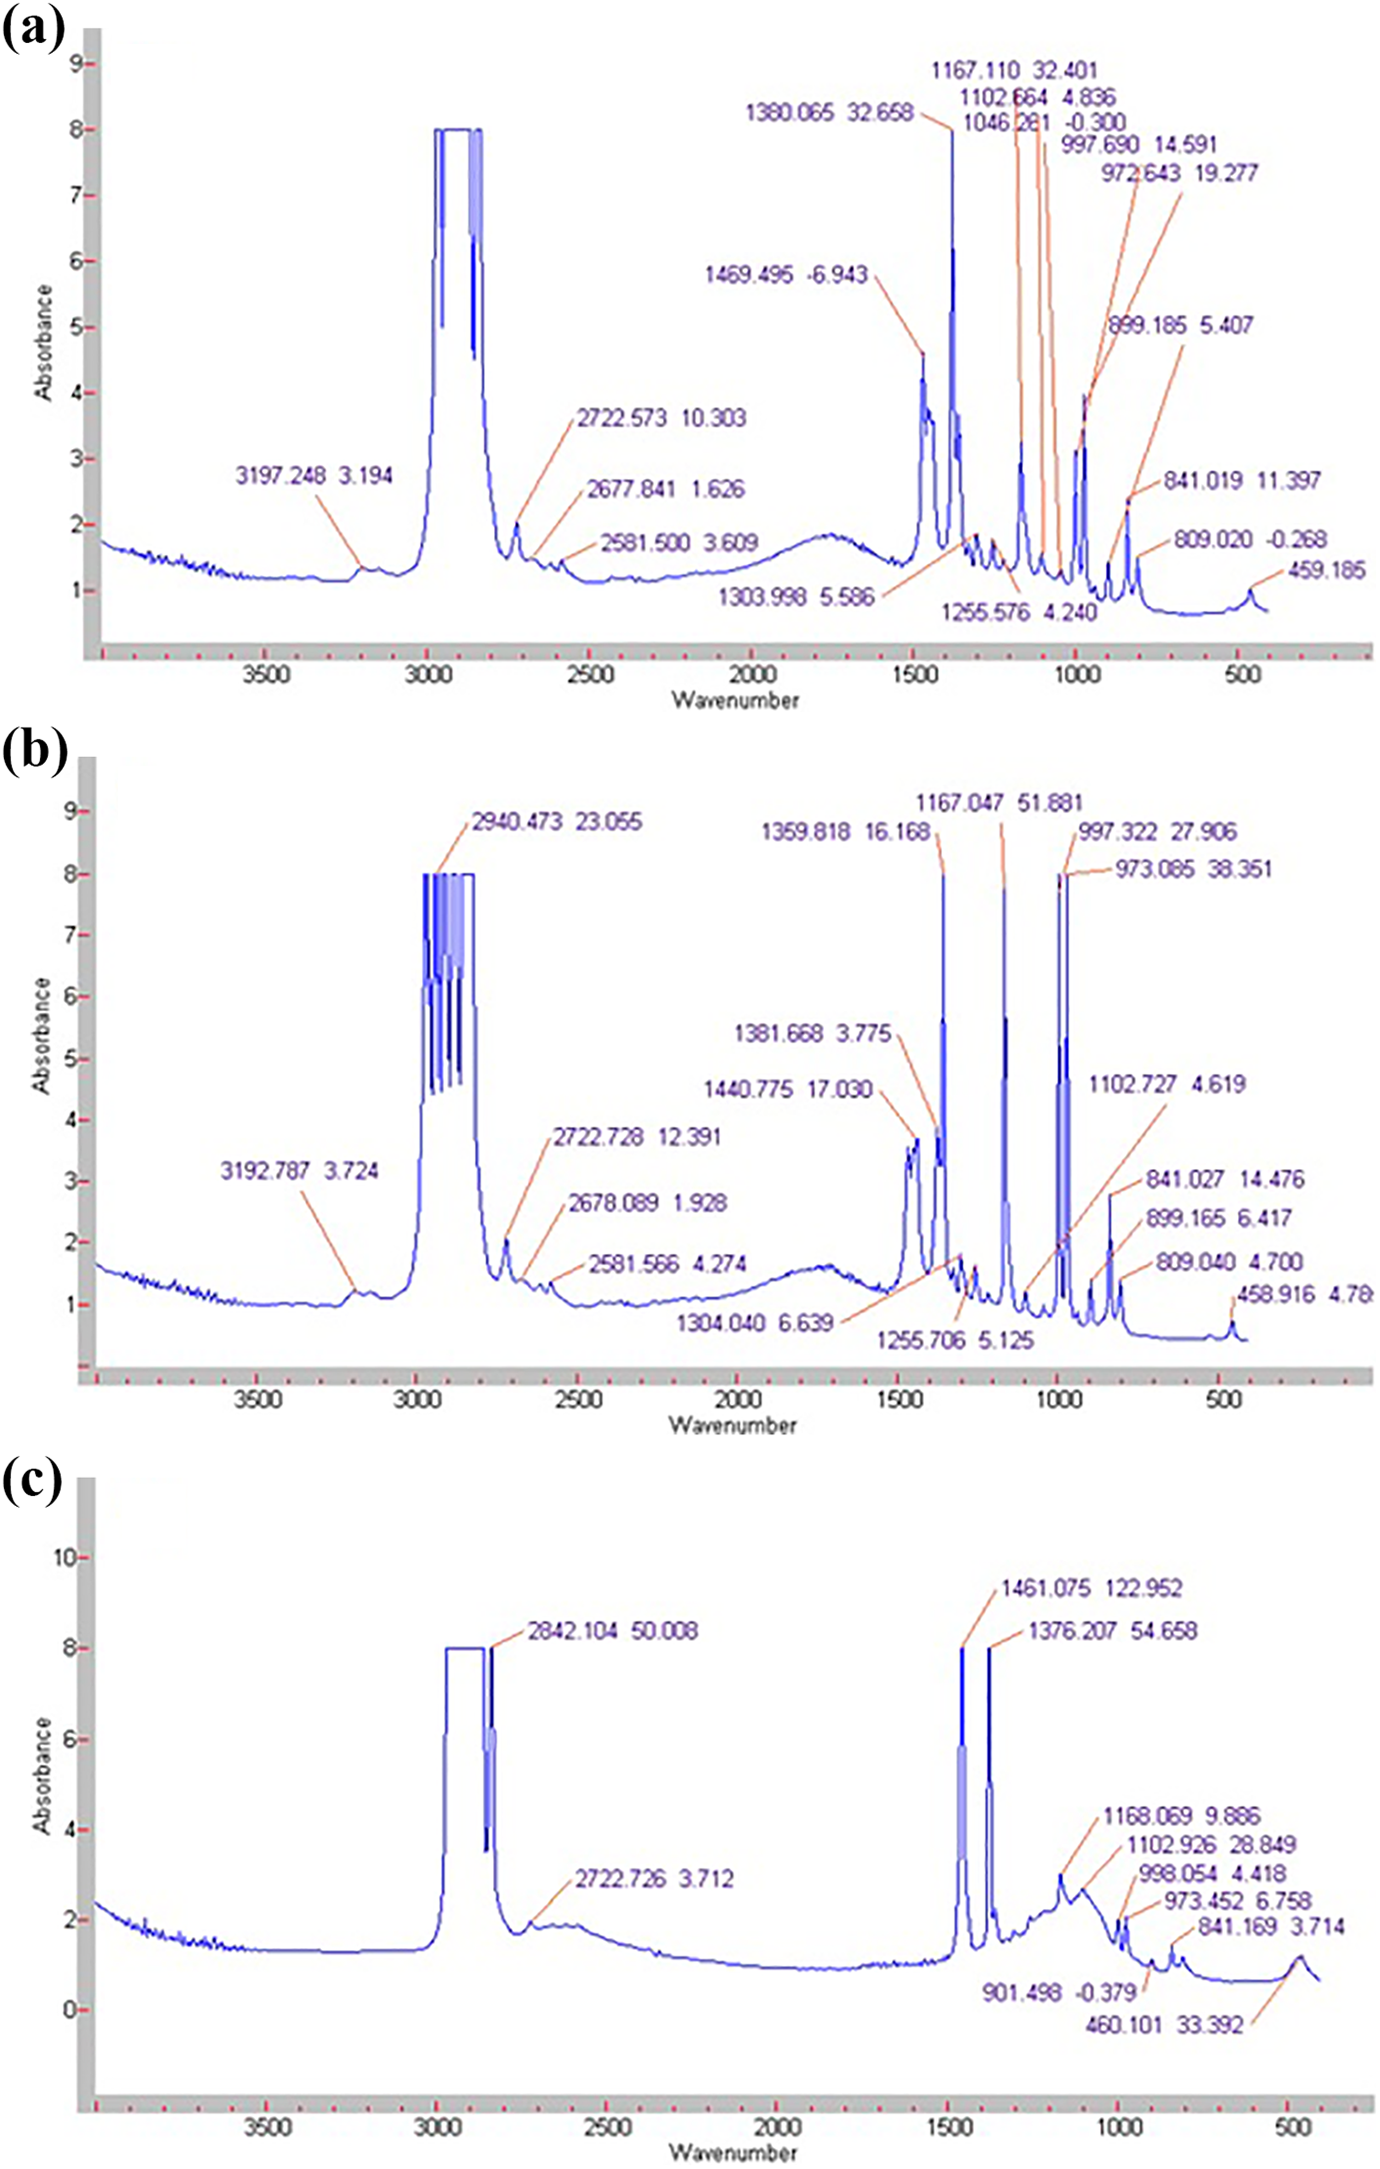
FTIR spectrums of PP+SiO2 nanocomposites a) PP+3%SiO2 b) PP+5%SiO2 c) PP+7%SiO2.
The UV-Vis spectra have been recorded on Spectrophotometer Specord250 Plus, at 200–700 nm and ambient temperature.
Figure 3 demonstrates the UV-Vis spectrums of PP+SiO2 nanocomposites depending on filler concentration. It is clear from the spectrum that the absorption intensity of samples increases with increasing filler concentration in the polymer matrix. This effect is known as the hyperchromic effect, which is due to the increasing of the optic density of the nanocomposites with increasing filler concentration. However, it is clear from the figure that at the low concentrations of nano-silica the absorption is small. From this, it can be concluded that the polymer nanocomposite retains its transparency at low concentrations of filler. 20
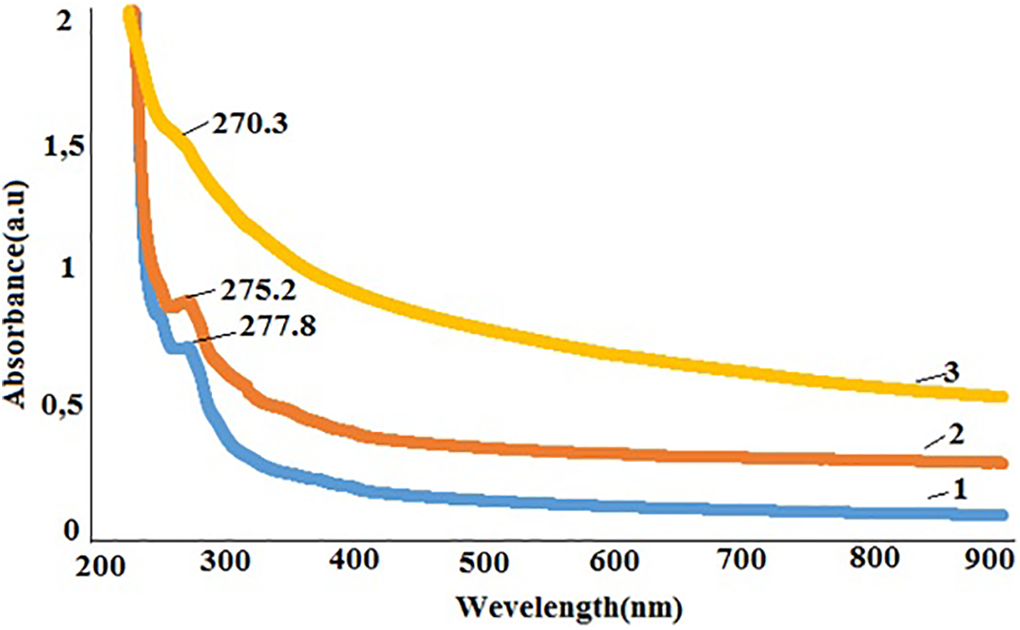
UV-Vis spectrums of the PP+SiO2 nanocomposites 1-PP+1%SiO2, 2-PP+3%SiO2, 3-PP+7%SiO2.
Furthermore, it is also clear from the spectrum that with rising of the filler content leads to shifting of the absorption band to the low wavelength region. For PP+1%SiO2 nanocomposites, the absorption peak is observed at 277.8 nm. For nanocomposites PP+3%SiO2 and PP+7%SiO2 this peak shifts to 275 nm and 270 nm, respectively. Such kind of shift in the UV-Visspectrum is known as a blue shift. 21 Any change in the UV-Vis spectrum is related to electron transitions, so the shift observed with the addition of the silica nanoparticles could be explained by the fact that the electron structure of nanocomposites depends on the concentration of the filler.
With the help of the Uv-Vis spectrum of the nanocomposites, according to A optic absorption coefficient, it was calculated bandgap (Eg). Figure 4 demonstrates the dependence of the absorption coefficient of the PP+SiO2 nanocomposites on the photon energy. Tauc’s relation was used for the optical band gap determination (Eg): 22
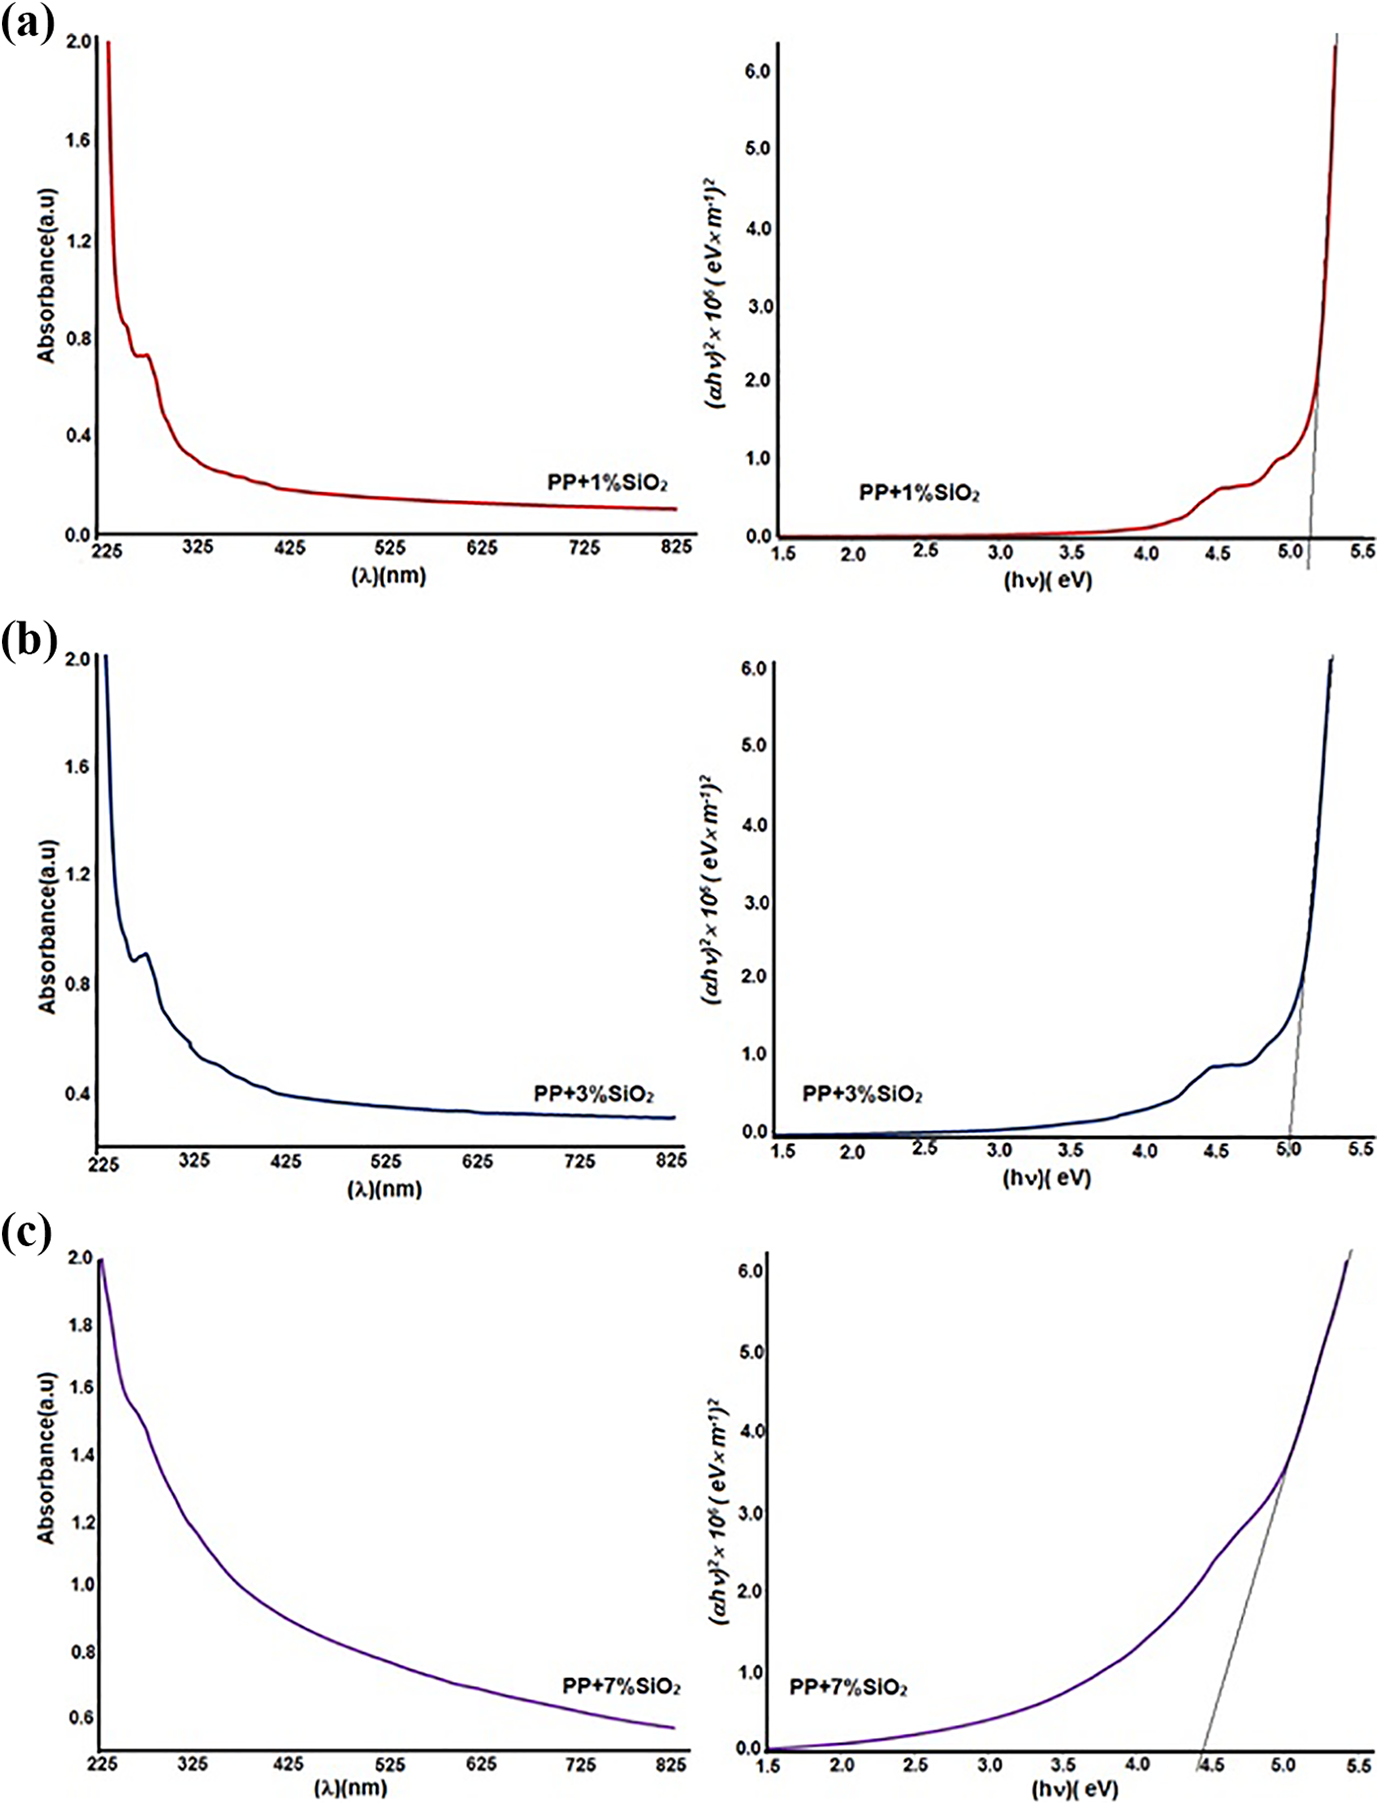
Dependence of absorption coefficient of the PP+SiO2 nanocomposites on the photon energy a) PP+1%SiO2, b) PP+3%SiO2, c) PP+7%SiO2.
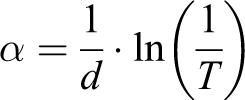
where d is the thickness of the nanocomposite film. In our case, the thickness of the samples was 100 mm. T is the transmittance. Eg values were estimated by extrapolating the linear part of (αhn) 2 to zero. Table 1 demonstrates the optical band gap of polymer nanocomposites, depending on filler concentration.
The direct energy bandgap and refractive index of PP+SiO2 polymer nanocomposites with 100 mm thickness depending on SiO2 concentration.
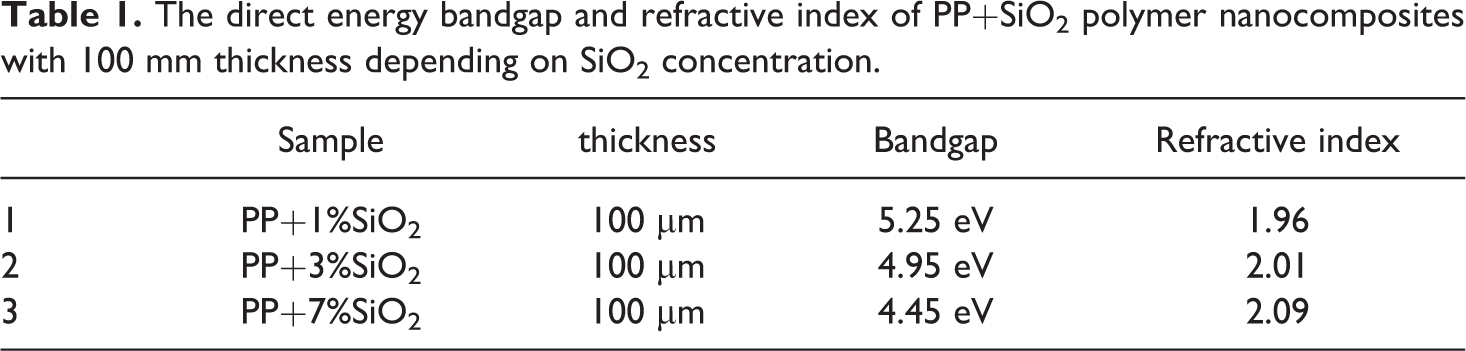
It was clear that with the introduction of the silica nanoparticles, the bandgap of the nanocomposites decreases. It is known that in the amorphous SiO2 nanoparticles, there are a lot of oxygen vacancies-oxygen deficits centers. These vacancies create new energetic levels in the bandgap. In other words, these structural defects effects electron structure, which leads to a narrowing of the bandgap, and the forming of localized electronic states at the band tail.22,23 To conclude, the bandgap of nanocomposites is depending on structural defects or concentrations of nanofiller.
It is known that polymer nanocomposites are generally hazy due to the dispersion of the filler particles in the polymer matrix volume. 24 Although it is possible to obtain nanocomposites with appropriate properties by incorporating nanoparticles into the polymer, it often results in a reduction in the transparency of the material. 25 Losing transparency in polymer nanocomposite is mainly explained by the difference in reflective index of polymer matrix and filler. 24 However, despite transparency another important optical feature of materials is considered their relatively high refractive index. 26 Since the refractive index of polypropylene (1.47) and nano-silica (1.45) are matching very well the loss of transparency can be avoided at the low concentration of the filler. The refractive index of polymer nanocomposite was calculated depending on silica concentration.
The following relation of Dimitrov and Komatsu is used to estimate refractive index of the prepared samples 27 :
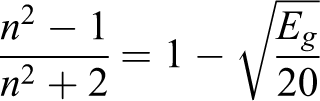
The calculated value of the refractive index n was given in Table 1. It is clear from the table that with the increase in the filler concentration in the matrix, the optic density of them is also increased. The increase is explained by changing of interatomic distance and packing density with including of the nanoparticles.28,29
The luminescence properties of nanocomposites were investigated by Varian Cary Eclipse Visible Spectrophotometer. Figure 5 demonstrates the luminescence spectrum of polymer-based nanocomposites, depending on silica concentration.
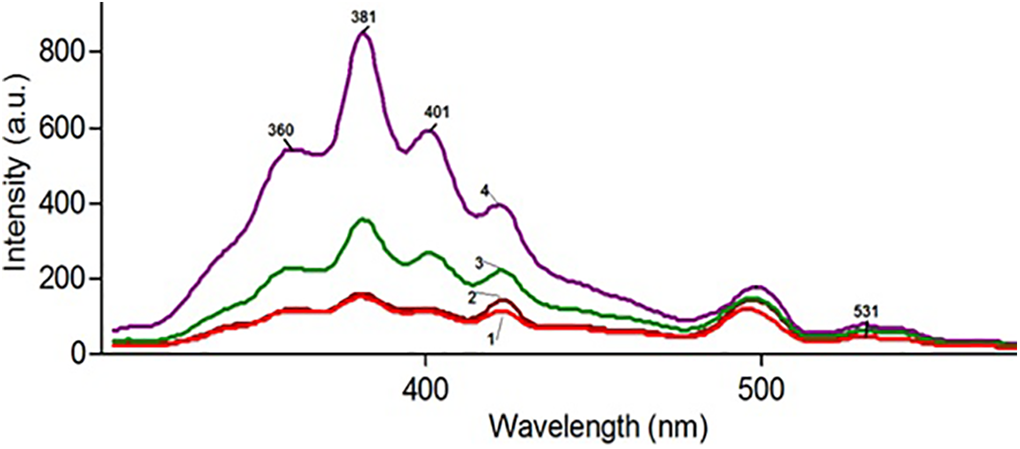
Photoluminescence spectrums of the PP+SiO2 nanocomposites: 1-PP+1%SiO2, 2-PP+3%SiO2, 3-PP+7%SiO2, 4-PP+10%SiO2.
The excitation wavelength was 250 nm (∼5 Ev). The intensity of the luminescence spectrum of nanocomposites increases with including of silica nanoparticles into the polymer matrix. It was related to the increasing of the emission centers in the polymer matrix with increasing silica content. It is known that PL emission in the amorphous silica nanoparticles is related to defects in the space structure. 30 There are some characteristic regions where PL maximums of silica are observed. 31 According to Figure 6, it is possible to say that 531 nm, 401 nm, 381 nm, 361 nm are luminescence maximums for PP+SiO2 nanocomposites. Generally, these maximums are related to oxygen deficit centers of silicon dioxide nanoparticles.32–35 The PL maximum observed at the 381 nm (3.25 eV) is related to b oxygen deficit centers of silica. The emission occurs due to the transition from the triplet state to the singlet state in such kinds of centers. 36 Also luminescence emission at the 401 nm (3.1 Ev)-is related to oxygen deficit centers of silica (b band) and proof presenting of the surface oxygen-deficient centers.37,38
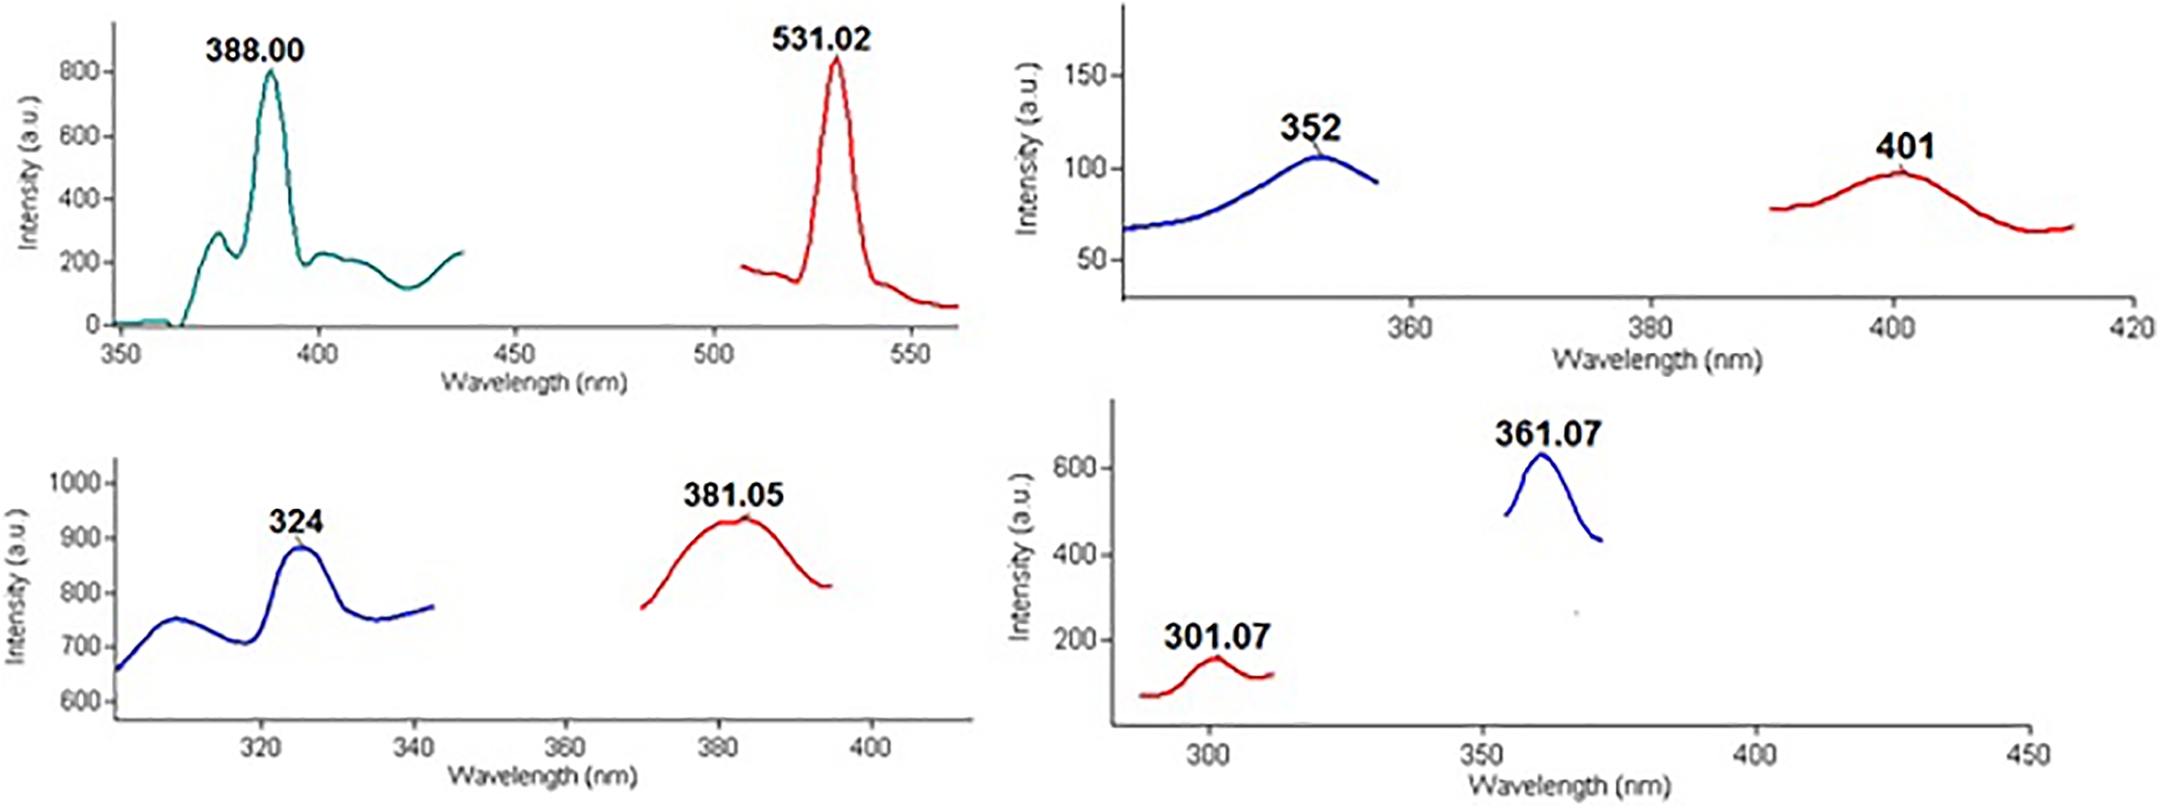
Photoluminescence excitation and emission spectra of PP+SiO2 nanocomposites.
Conclusion
In this work, amorphous silica nanoparticles with 50 nm size were used for the preparation of the transparent PP+SiO2 nanocomposites with a relatively high refractive index and enhanced luminescence properties. The XRD analysis indicated that the fraction of the amorphous phase of the polycrystalline polymer decreases with the introduction of SiO2 nanoparticles. Even though SiO2 nanoparticles are amorphous itself, they play the role of the crystallinity centers in the polymer matrix, and the degree of crystallinity increases in polymer nanocomposites. The optical band gap and refraction index of the PP+SiO2 nanocomposites with different silica concentrations were calculated using the optical method. It has been found that at low concentrations of amorphous silica nanoparticles, the polymer nanocomposite retains its transparency despite having a relatively high refractive index (1.96). The optical band gap was found to decrease with the addition of nano-silica. It was explained by the fact that there are a lot of oxygen vacancies-oxygen deficits centers in the structure of the amorphous silica nanoparticles. These vacancies create new energetic levels in the bandgap. In other words, these structural defects effects on electron structure, which leads to a narrowing of the bandgap, and the forming of localized states at the band tail. Furthermore, it was clear that the refractive index increased by increasing the silica nanoparticle content. The increase is explained by changing of interatomic distance and packing density with including of the nanoparticles. It was also clear that the intensity of the photoluminescence spectrum of nanocomposites increases with including silica nanoparticles into the polymer matrix. It was related to the increasing of the emission centers, which are due to defects in the space structure of silica, in the polymer matrix with increasing silica content.