
Abstract
Polybutylene terephthalate (PBT) is a semi-crystalline engineering thermoplastic polyester. PBT offers rapid molding cycles, high heat resistant, crystallinity, fatigue resistance, strength and rigidity, excellent electrical properties, creep resistance, reproducible mold shrinkage and chemical resistance. In this study, PBT was loaded with synthetic graphite and carbon fiber at different weight fractions (10–40 wt.%). PBT-based composites were fabricated by the melt mixing process by using a co-rotating twin screw extruder then thermal, mechanical and morphological properties of filled PBT composites was investigated. Weight fraction of carbon fiber (up to 30 wt.%) increases the tensile strength and flexural strength of PBT, but synthetic graphite loading decreases the tensile strength and flexural strength of PBT. The highest in-plane and through-plane thermal conductivity values were obtained as 9.24 for 40 wt.% synthetic graphite filled composite and 3.41 W/mK for 40 wt.% carbon fiber reinforced composite, respectively. Carbon fiber was found to be more effective in increasing the through-plane thermal conductivities than synthetic graphite.
Introduction
Polymer composites have gained a great importance in recent years due to being able to adapted according to the requirements for different applications. Although composite materials have traditionally been used for structural applications, novel applications of thermoplastics-based composite materials have been increasing rapidly as they provide attractive properties such as high thermal conductivity, high electrical conductivity, high mechanical strength, lightweight, processability, being able to recycled, and cost-effectiveness. They have been widely used in many industrial applications like medical, electric-electronics, automotive, aerospace, defence, thermal management, sports, and household appliances etc.1,2 Especially, electric-electronics industry is seeking new composite materials for thermal management applications to have better performance and reliability of the components due to increasing miniaturization of microelectronics and power requirements of computer chips or electronic devices.3–7 Heat sinks are usually manufactured by copper, aluminum, or silicon. However, the high density and electric conductivity of conventional metals, in addition to the reduced corrosion and fouling resistances have led researchers to investigate on alternative materials for thermal applications. 8
Heat generated during turning on and off of the electronic packaging devices should be dissipated by means of high thermal conductive materials.9–12 It is known that most polymers exhibit low thermal conductivity values. 13 Thermal conductivity of polymers could be increased with the incorporation of thermal conductive fillers such as metals, ceramics, and carbon-based materials.6,14–17 Thermally conductive polymeric composite materials to be used in some new applications especially for thermal management, like heat dissipation by heat sinks and cooling of circuit boards in electronic devices have drawn attention over the last 10 years.11,12 The thermal conductivity of the graphite and/or its composites has significant importance considering the demands as thermal conductance in heat exchangers, circuit boards, machinery, and electronic appliances. 18 Airbus has successfully employed polymer composites on the leading edges of A300-series aircraft and Gulfstream 650 has an elevator and vertical tail rudder produced with carbon fiber/polyphenylene sulfide composite. 19 The important strategy for having sufficient thermal conductivity is to construct an effective thermal conductive path in polymeric composites by using hybrid fillers with different size and shapes.20–23
Polybutylene Terephthalate (PBT) has gained a commercial interest due to its wide range of applications ranging from automotive, electrical and electronics and medical industries. It has been demonstrated that PBT delivers excellent short-term mechanical properties, such as high strength, toughness and stiffness as well as good practical impact, provides good creep resistance, dimensional stability and exhibits low moisture absorption, stain resistant and processabilitycharacteristics.24–27 PBT finds many uses in plug connectors, relays, keyboards, switches, distribution boxes, and fiber optic cable jackets. However, due to being thermally insulating, PBT cannot be used in applications where thermal conductivity is required. It is known that PBT has a thermal conductivity value of 0.18–0.23 W·m−1·K−1. 28 There are few studies about increasing thermal and electrical conductivity of PBT-based composites in the literature.
Ng et al. showed the effect of carbon fiberand boron nitride (BN) on thermal conductivity and electrical resistivity of PBT-based composites. It has been reported that the addition of BN increased the thermal conductivity value while causing reduction in electrical conductivity. Thermal conductivity of the PBT/BN composites increased gradually with the BN content. Carbon fiber addition up to 30wt.% resulted in higher thermal conductivity values. 29 Wen and Zheng studied the effect of graphite nanoplatelets on thermal and electrical properties of PBT and PBT/PC composites. As expected graphite caused an increase in both thermal and electrical conductivity values. 30 Kim et al. demonstrated that using different size, short or long, multiwall carbon nanotube (MWCNT) resulted in different thermal conductivity values in PBT composites. The highest thermal conductivity values of 1.170 and 1.652 W/m K were reported for addition of 20wt.% short and long MWCNT into PBT matrix, respectively. 28 Hwang showed the effect of carbon fiber reinforcement on the electrical conductivity of PBT composite materials. 31 Karsli et al. demonstrated the effects of different sizing agent types on the mechanical, thermomechanical, electrical and morphological properties of carbon fiber reinforced PBT matrix composites. 32 Karsli et al. studied electrical properties of graphite and carbon black filled conductive polymer composites as a function of temperature. 33 When the literature is examined, up to our knowledge, no study has been conducted on the thermal conductivity of hybrid synthetic graphite (SG) and carbon fiber (CF) added PBT composites.
This study investigates the effect of CF and SG loadings up to 40 wt.% on in-plane and through-plane thermal conductivities of PBT-based composite materials. It is also intended to obtain as high conductivity as possible without sacrificing mechanical properties. Moreover, physical, thermal, mechanical, and morphological properties of thermally conductive PBT composites were studied by various characterization techniques.
Materials and methods
Materials
Advanite 52011 (density: 1.31 g/cm3, IV: 0.88) obtained from IMSPolymers was used as PBT matrix material. CF (AC0101-d: 1.76 g/cm3) with a polyurethane-based sizing and SG (TIMREX KS44-d: 2.26 g/cm3) with a d50 of 15.8 µm (laser diffraction) were purchased from DowAKSA (Turkey) and IMERYS Graphite & Carbon (Switzerland), respectively.
Composite manufacturing
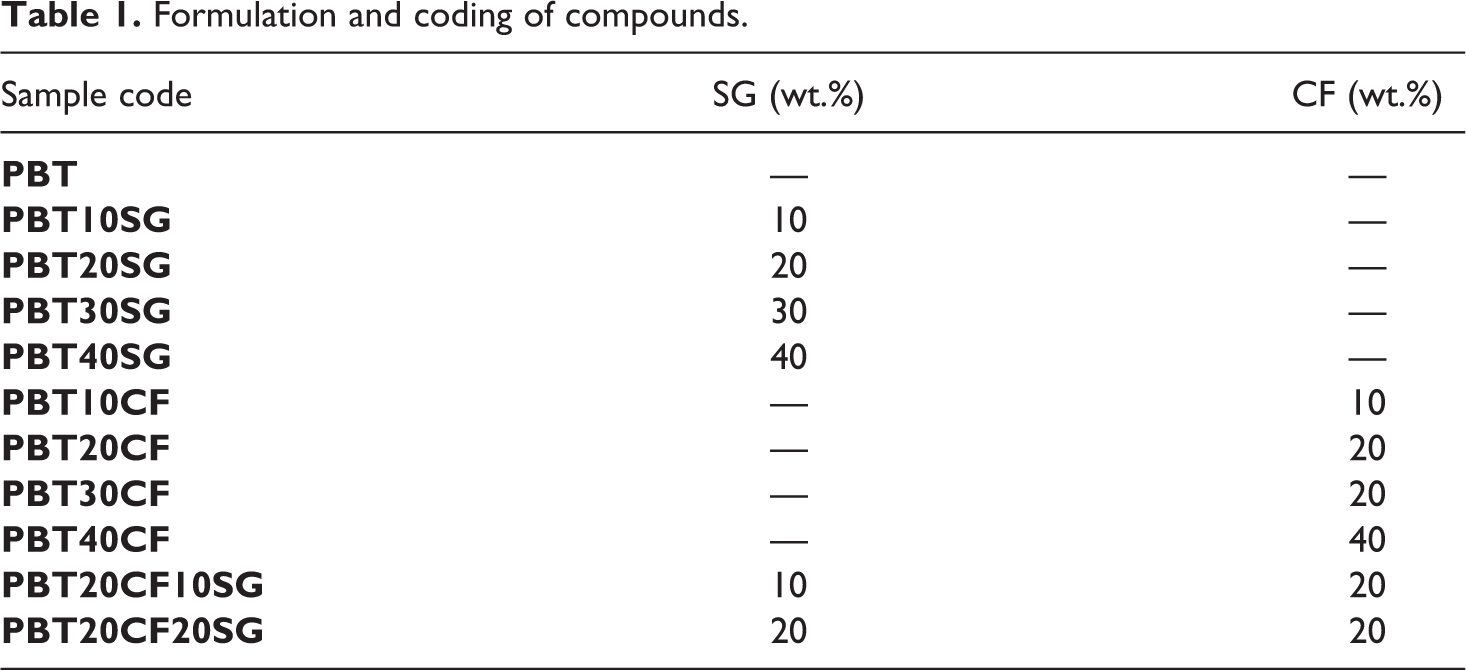
Co–rotating twin screw extruder (Leistritz 27 MAXX) having a screw diameter of 28.3 mm and L/D ratio of 48:1 was used to produce CF and/or SG loaded PBT composites. Composites were produced at the barrel temperatures of 230–250°C with a screw speed of 500 rpm. In order to obtain test specimens composite granules were molded by using injection molding machine (Bole model BL90EK). Injection and mold temperatures are 240–270°C and 40–80°C, respectively. The compositions tested are presented in Table 1.
Formulation and coding of compounds.
Characterization methods
Density
The density calculation of the specimens having a 4 mm in thickness was performed in triplicate according to the ASTM D792 using Matsuhaku electronic densimeter GP-300E.
Thermogravimetric analysis (TGA)
Thermogravimetric analyses of carbon-filled PBT composites were performed by TG Analyzer (TA Instruments Inc., TGA-Q50). The analyses were performed at a heating rate of 10°C/min in the temperature range of 30–600°C under nitrogen atmosphere.
Differential scanning calorimeter (DSC) analysis
Differential scanning calorimeter analysis was conducted using DSC Q20 (TA Instruments Inc., DSCQ20). DSC analyses were executed at a rate of 10°C/min in the temperature range of 50 and 250°C. The degrees of crystallinity was calculated using equation 1. 34
where, ΔHm is the melting enthalpy of the samples (J/g), y is the weight fraction of the filler/reinforcement and ΔHo is the melting enthalpy of PBT with 100% crystallinity (145.5 J/g). 35
Thermal conductivity measurement
The thermal diffusivities of samples having a thickness of 0.5–1 mm were determined by a laser flash method using Xenon Flash Diffusivity DXF-200 (TA Instruments Inc.) according to the ASTM E 1461 standard. All measurements were conducted in triplicate at 25°C. Through-plane and in-plane thermal conductivities (k, Wm−1 K−1) were calculated from thermal diffusivity (α, m2 s−1), density (ρ, kg m−3) and specific heat capacity (Cp, J kg−1 K−1) using the following equation:

Heat distortion temperature (HDT) testing
HDT values of PBT and its composites with the dimensions of 80 × 10 × 4 mm were obtained by using HDT-Vicat Testing Instrument (Coesfeld) according to ISO 75 standard under a specific load of 1.8 MPa.
Tensile tests
The ISO 527 standard samples were subjected to tensile tests in a Shimadzu Autograph AG-IS Series universal testing machine with a video extensometer system (Shimadzu Non-Contact Video Extensometer DVE-101/201). The tensile testing was carried with a crosshead speed of 50 mm/min and a load cell of 5 kN at room temperature. An average value of five tests for tensile strength and modulus were recorded.
Flexural tests
The flexural properties of PBT-based composites were measured according to ISO 128 standard with a crosshead rate of 2 mm/min and span length of 32 mm. The average value of five tests for each specimen were recorded.
Impact tests
Impact tests were conducted according to ISO180 standard with notched samples. During this test the amount of energy absorbed by the specimen for the break is measured in kJ/m2. The average value of five tests for the notched impact strength were recorded.
Scanning electron microscopy (SEM) analysis
SEM micrographs of PBT-based composites were taken by using scanning electron microscope (Carl Zeiss 300VP, Germany) operated at 5 kV. In order to improve the conductivity, gold was deposited on the composite surface by using plasma sputtering apparatus.
Results and discussion
Density results
Figure 1 shows the density values of PBT and its composites as a function of filler and reinforcement ratios. As the densities of carbon fiber and synthetic graphite are higher than PBT (1.31 g/cm3)34–36 composite density values are higher than pure PBT. The density of SG and CF loaded PBT composites increased (from 0 to 40 wt.%) with an increase in filler/reinforcement weight fraction. Density value of 20 wt.% CF reinforced PBT composites increased with the addition SG.
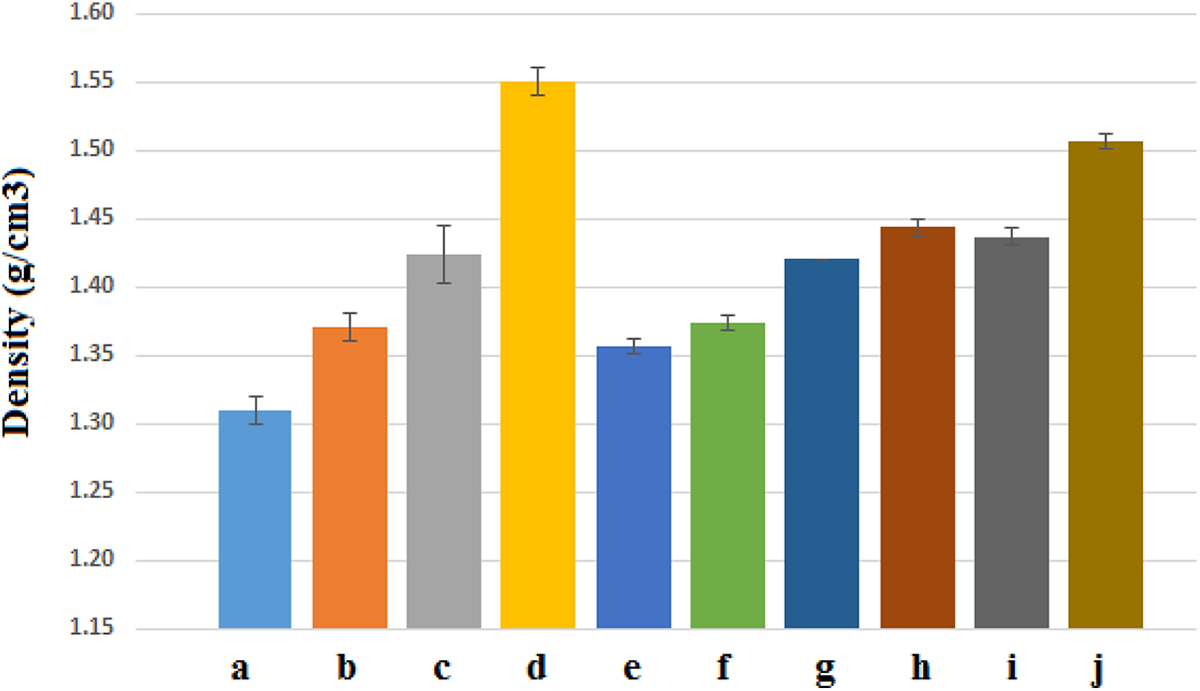
Density values of PBT and its composites.
TGA results
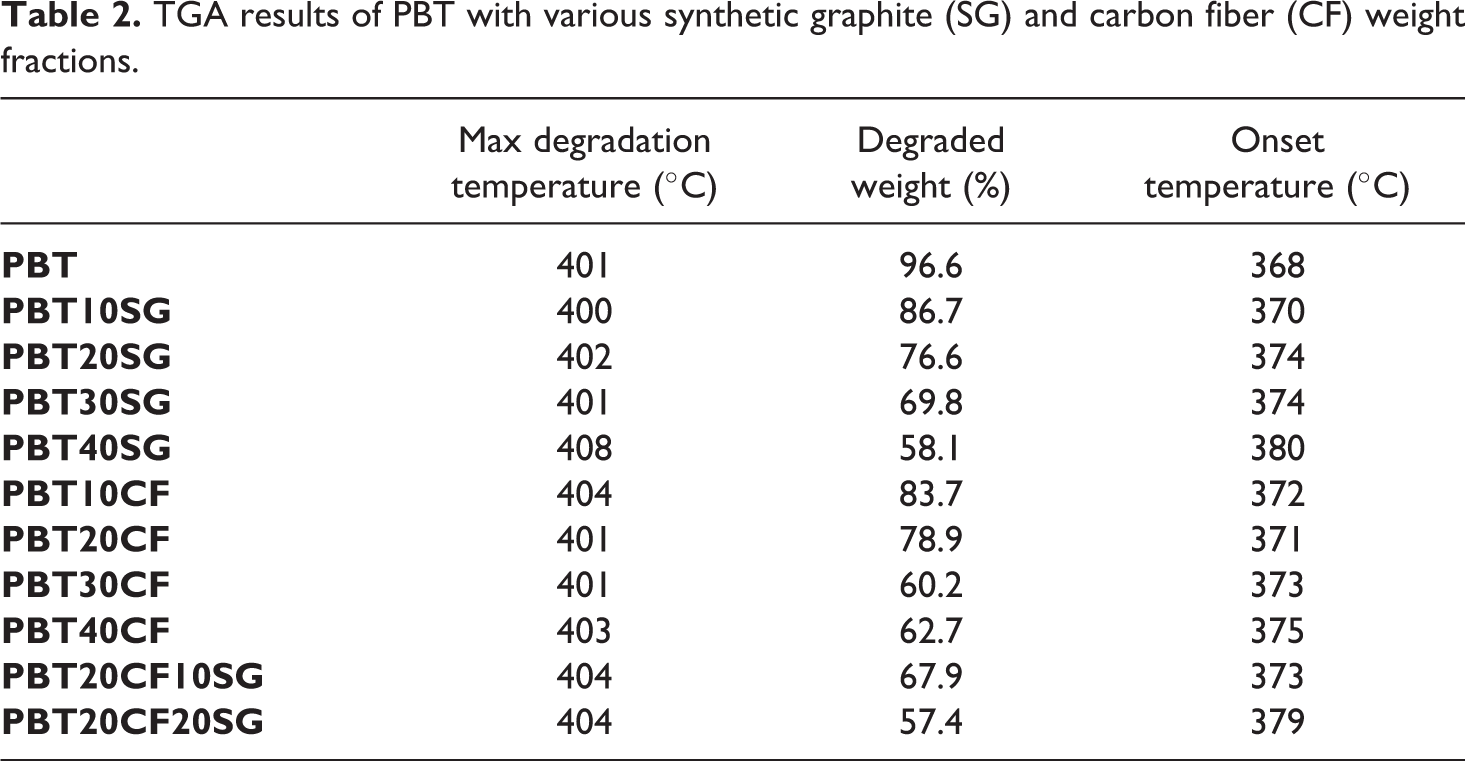
Thermogravimetric analyses of PBT, synthetic graphite and carbon fiber loaded PBT composites with different weight fractions are shown in Figure 2. The TGA results are given in Table 2. Decomposition temperature is an important factor in the characterization of thermal stability of polymeric composites. Maximum decomposition temperature, onset temperature and degradation weight are determined from TGA curves. The maximum degradation temperature (Tmax) of PBT is 401°C. The addition of filler and/or reinforcement affected the thermal decomposition mechanism of the PBT matrix. The maximum change in Tmax was observed in the PBT composite containing 40 wt.% synthetic graphite. The mass loss value of the composites decreased as the filler weight fraction in the composites increased. This may indicate that the filler is homogeneously distributed in the composite. In addition, Table 2 showed an increasing trend in the onset decomposition temperatures of PBT with the addition of filler and/or reinforcement.
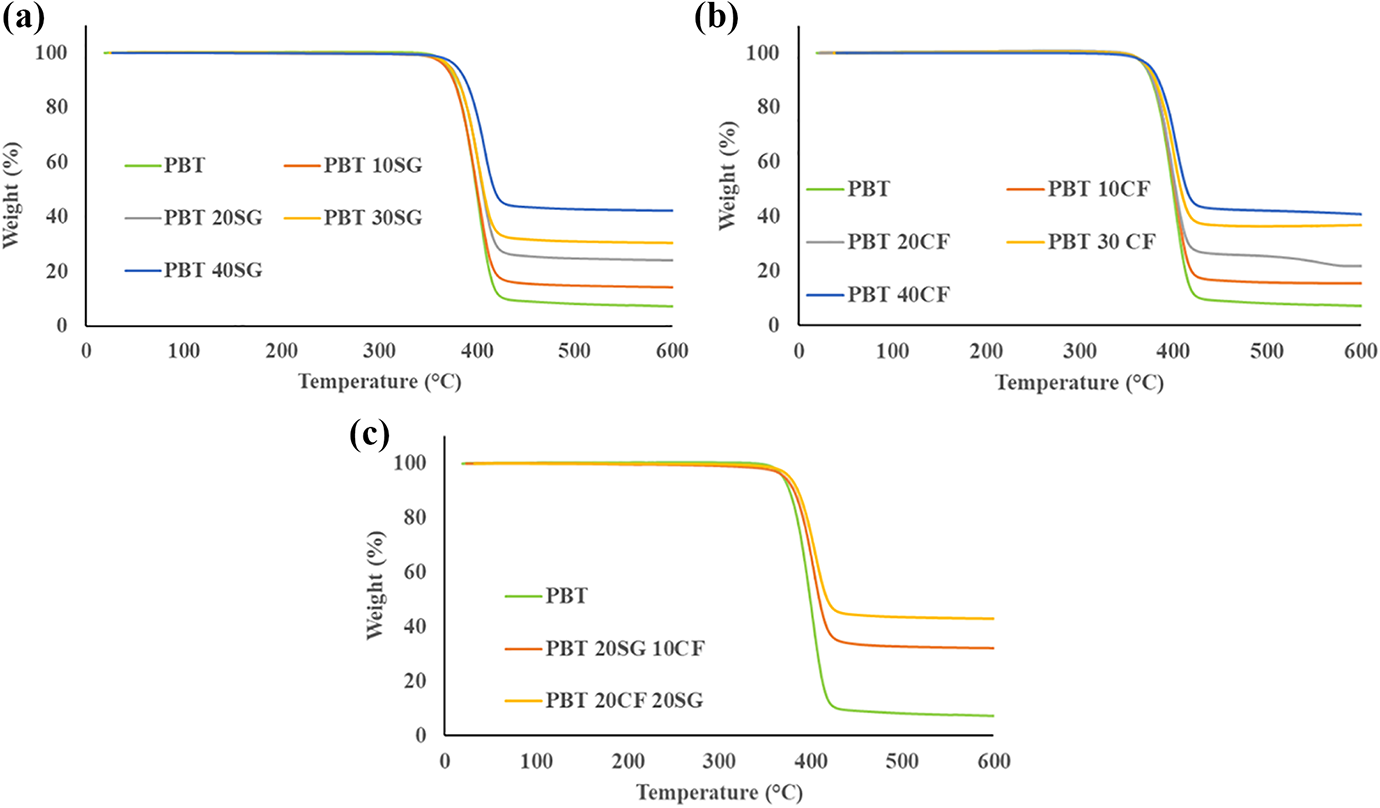
TGA Thermograms of (a) PBT composites containing synthetic graphite, (b) PBT composites containing carbon fiber, (c) PBT composites containing hybrid synthetic graphite and carbon fiber.
TGA results of PBT with various synthetic graphite (SG) and carbon fiber (CF) weight fractions.
DSC results
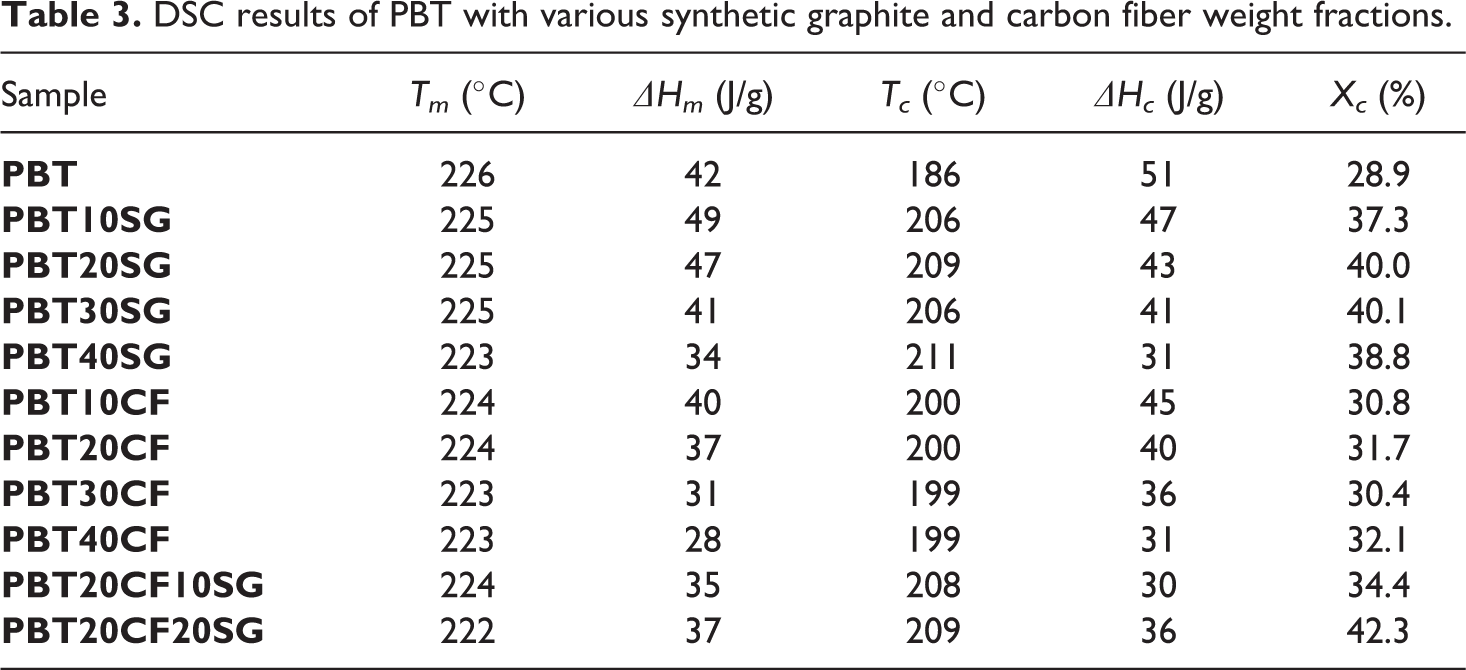
The effect of synthetic graphite and carbon fiber on the melting and crystallization behaviors of PBT is obtained by DSC analysis. DSC curves of PBT and synthetic graphite and carbon fiber reinforced PBT composites with different weight fractions are given in Figure 3. DSC results were summarized in Table 3. The melting temperature of PBT did not change significantly with the addition of filler and/or reinforcement. When the crystallization temperatures were examined, as synthetic graphite was added to PBT composites, the crystallization temperature increased. There was no significant change in the crystallization temperature of carbon fiber reinforced PBT composites. On the other hand, there was an increase in the crystallization temperatures of the hybrid graphite and carbon fiber loaded composite groups compared to PBT. It is seen that all Xc values of the synthetic graphite and carbon fiber reinforced PBT composites are higher than PBT. A similar result was obtained for graphite filled PA6 composites. 37 It was obtained that the degree of crystallinity of the nylon 6 composites increased with increasing graphite content. 37 Moreover, Xc values of the synthetic graphite filled PBT composites are obtained to be higher than carbon fiber reinforced PBT composites. The Xc value increased with the addition of hybrid synthetic graphite and carbon fiber to PBT. In addition, the combination of synthetic graphite and carbon fiber has an increasing effect on the Xc value. Synthetic graphite and carbon fiber has an increasing effect on crystallization with an increased interface. 34 The increase in crystallinity with increasing weight fraction of SG and CF may indicate that CF and SG act as a nucleating agent, promoting crystallization, which is supported by the shifts in the Tc values during cooling. 38 Considering melting enthalpy values of samples, it is seen that the presence of CF has led to lower melting enthalpy values, which indicates that CF containing composites require less heat to reach melt phase compared to PBT, PBT10SG, PBT20SG, and PBT30SG. 39
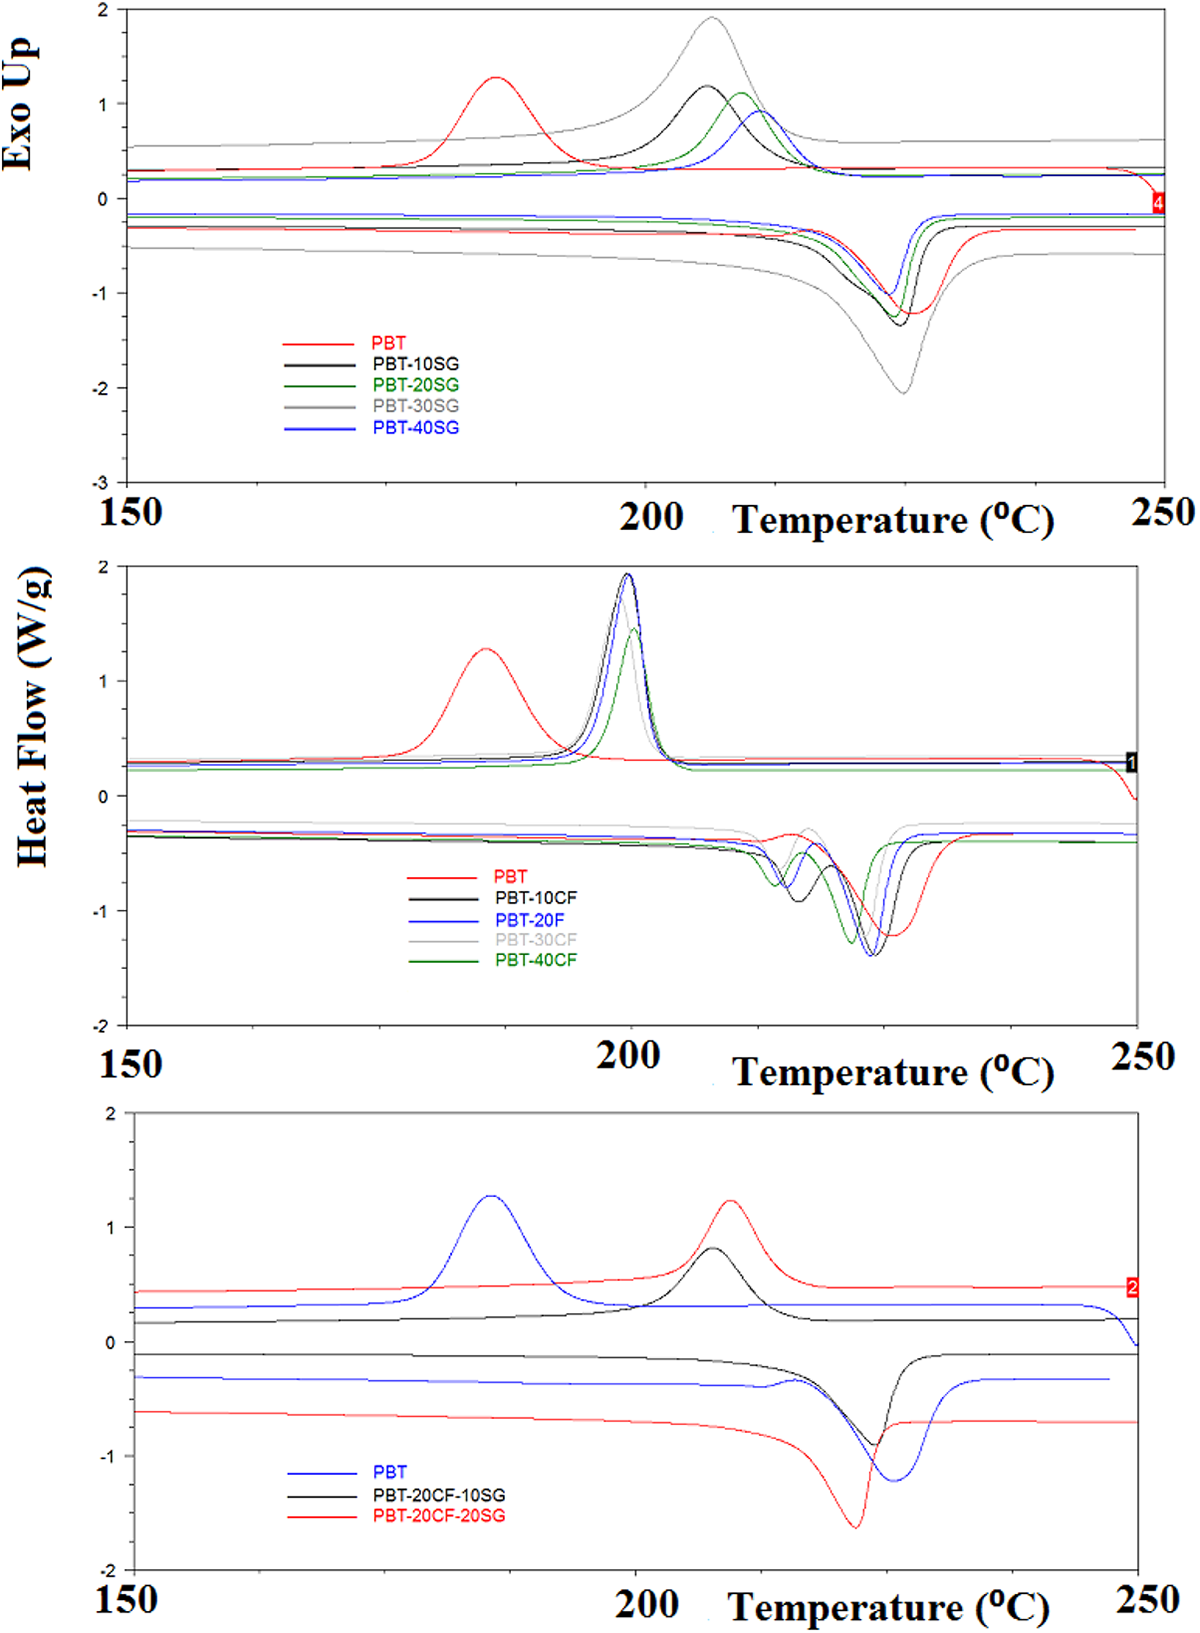
DSC curves of (a) PBT composites containing various synthetic graphite weight fractions, (b) PBT composites containing various carbon fiber weight fractions, (c) PBT composites containing various synthetic graphite and carbon fiber weight fractions.
DSC results of PBT with various synthetic graphite and carbon fiber weight fractions.
Thermal conductivity
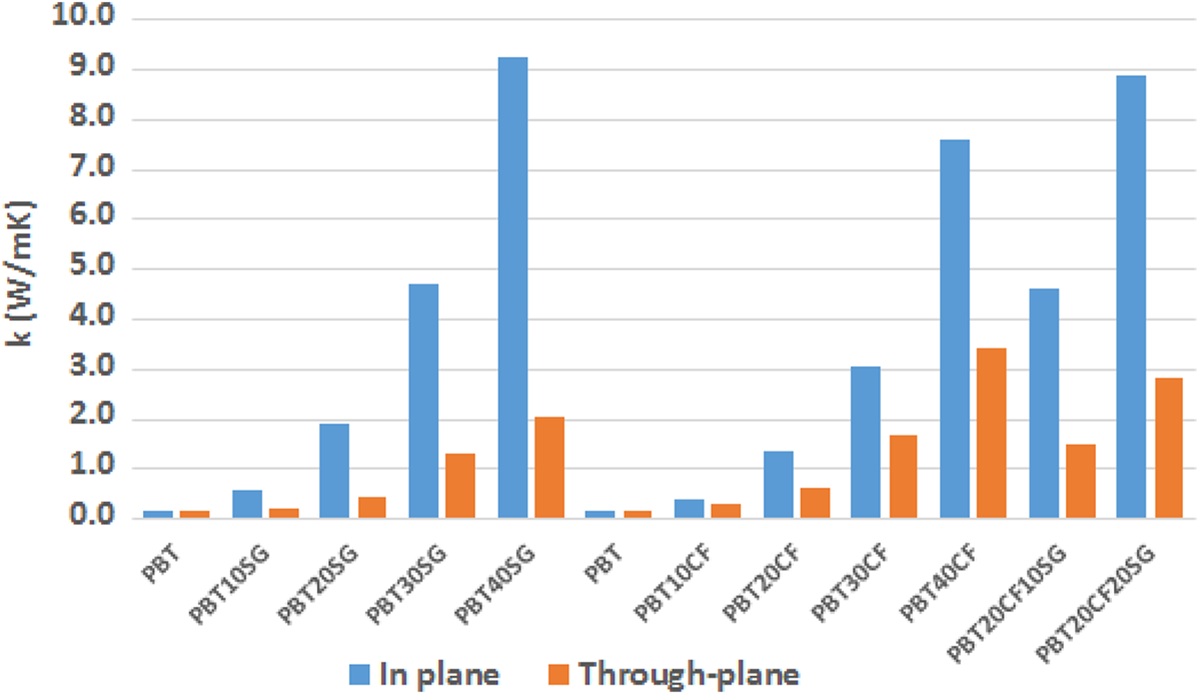
The in-plane and through-plane thermal conductivities of composites loaded with various concentrations of SG and CF is displayed in Figure 4. The in-plane and through-plane thermal conductivity value of neat PBT was evaluated to be 0.19 W/mK. Figure 4 shows the in-plane and through-plane thermal conductivity values of the SG filled PBT composites as a function of the SG weight fraction. As shown in Figure 4, the values of in-plane and through-plane thermal conductivity of PBT10SG, PBT20SG, PBT30SG, and PBT40SG are larger than those of PBT and gradually increase with increasing weight content of SG. In-plane and through-plane thermal conductivities of PBT increased by about 5033, and 1028% with the loading of 40 wt.% SG, respectively. The layered structure of SG exhibits significant anisotropy to the thermal conductivity of the polymer composites, with the determined in-plane thermal conductivity being much higher than the through-plane conductivity.40,41 Figure 4 shows the effect of the weight content of CF and SG on the thermal conductivity of PBT composites reinforced with single carbon fiber and loaded with hybrid SG, and CF.As can be seen from Figure 4, in-plane thermal conductivity for PBT10CF, PBT20CF, PBT30CF, and PBT40CF were observed to be 0.41, 1.35, 3.06, and 7.62 W/mK, respectively. The through-plane thermal conductivity of PBT10CF, PBT20CF, PBT30CF, and PBT40CF composite samples were found to be 0.32, 0.63, 1.69, and 3.41W/mK, respectively. While PBT10CF, PBT20CF, PBT30CF, and PBT40CF showed about 128%, 650%, 1600%, and 4133% increase in in-plane thermal conductivity of CF reinforced PBT composites compared to that of PBT, respectively, through-plane thermal conductivity of PBT increased by about 77%, 250%, 839%, and 1794% with the loading 10, 20, 30, and 40 wt.% CF, respectively. Through-plane and in-plane thermal conductivity of CF reinforced composites was generally observed to increase with increasing CF loading. CF reinforced PBT composites had higher through-plane thermal conductivity than SG filled PBT composites as the through-plane thermal conductivity of carbon fiber higher than synthetic graphite.
Thermal conductivity values of PBT and its composites.
The in-plane thermal conductivity was found to be about 4.69 and 8.89 W/mK for PBT20CF10SG and PBT20CF20SG composites containing 10 wt.% and 20 wt.% SG, respectively. On the other side, through-plane conductivity of PBT20CF10SG and PBT20CF20SG increased to 1.51, and 2.84 W/mK, respectively. The notable improvement of thermal conductivity of composites resulted from the formation of the conductive network of rod-shaped carbon fiber and platelet-shaped synthetic graphite within PBT.42,43 The through-plane thermal conductivity of CF loaded PBT is expected to be much higher than in-plane thermal conductivity due to the anisotropy of fillers.44–46 The usage of different fillers in thermal conductive composites with high thermal conductivity and complementary shapes makes it easy to establish efficient three-dimensional thermally conductive networks, which leads to increased thermal conductive values in composites.3,43 Ng et al., obtained that 22 vol.% of hexagonal boron nitride loaded PBT has a thermal conductivity of 1.1 W/mK, which indicates an almost five-fold increase in thermal conductivity as compared to the unfilled PBT. In this study, 20 wt.% CF and 10 wt.% SG loaded PBT increased the thermal conductivity by about eight-fold as compared to unfilled PBT. 29
HDT-vicat results
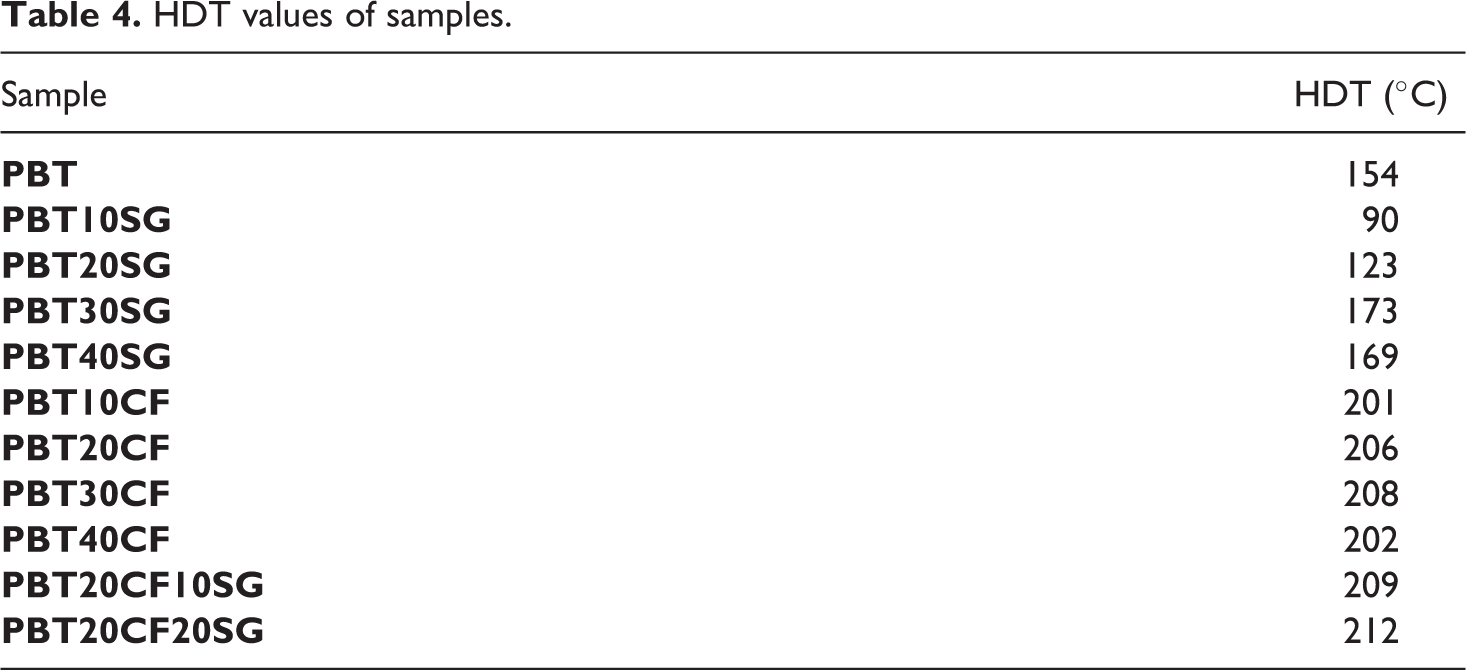
HDT values of PBT and its composites are presented in Table 4. 10SG and 20SG loadings into PBT decreased HDT value of PBT. However, SG loadings of 30 and 40 wt.% and CF loadings at all weight fractions (10–40 wt.%) into PBT increased the HDT value of PBT. It is known that HDT is used to determine elevated temperature performance in plastic materials and is often industrially utilized in the material selection process as the maximum continuous use temperatures. 47 HDT values of PBT40SG, PBT40CF, and PBT20CF20SG were obtained to be 169°C, 202°C and 212°C, respectively. Hybrid CF and SG loaded PBT has a higher continuous use temperature than single SG or CF loaded PBT. Besides, PBT20CF20SG has the highest HDT value in this study. It is seen that CF is more efficient than SG to improve the HDT values of composites. Besides based on HDT values of PBT-based composites, there is no considerable difference between CF and hybrid of CF with SG.
HDT values of samples.
Tensile test results
Figure 5 shows the effect of SG loadings on the tensile properties of PBT composites. From Figure 5(a), it is seen that the tensile strength of composites decreases with the increasing weight fraction of SG. This behavior could be attributed to poor affinity and poor distribution of SG when used at high fractions in polymer matrices. 48 One can say that, SG particles exhibit an aggregated phenomenon even at 10 wt.% loading, which gives rise to decreased tensile strength values. The Young’s modulus of PBT composites have a different trend compared to tensile strength. It can be seen from Figure 5(b) that Young’s modulus increases with an increase of the weight fraction of synthetic graphite. The maximum Young’s modulus is obtained to be 12424 MPa for PBT40SG composite. It indicates that the effect of synthetic graphite particles on modulus values is much more dominant for the PBT-based composites with low levels of SG weight fractions. 48
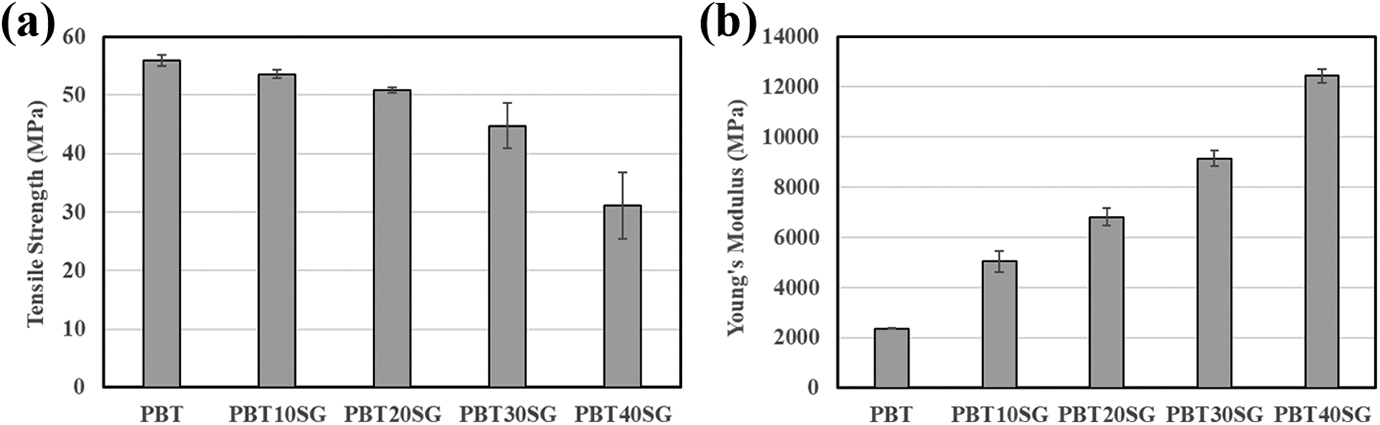
Effect of synthetic graphite on (a) tensile strength and (b) Young’s modulus of PBT-based composites.
Tensile strength and Young’s modulus values of CF reinforced PBT composites is given in Figure 6. It is evident that the tensile strength increases with increasing weight content of CF (up to 30 wt.%) and reacha maximum value of 175 MPa at 30 wt.% reinforcement. This result is due to the fact that carbon fibers facilitate the efficient stress transfer from the polymer matrix to CF during the mechanical characterization.49–51 PBT30CF and PBT40CF exhibits the highest tensile strength and Young’s modulus due to the high amount of the carbon fibers within the PBT matrix, respectively. Above this content (30 wt.%), the tensile strength decreases since the amount of CF is high enough to cause aggregations in the PBT resin. It is well known that homogeneous filler dispersion and interfacial interactions between fillers/fibers and matrix are very important in obtaining high performance polymer composites. 52 Figure 6 shows the effects of hybrid SG and CF additions on the mechanical properties of PBT-based composites. For a fixed content of CF (20 wt.%) the tensile strength of PBT20CF10SG and PBT20CF20SG composites are determined to be 131 and 107 MPa, respectively. These values are lower than that of PBT20CF composite with a value of 157 MPa. This could be explained by the poor dispersion of filler particles/reinforcement due to the aggregation of the overloaded fillers/fibers in the PBT matrix. 31 As the weight fraction of CF and SG was increased in CF reinforced composites, the Young’s modulus increased as expected.
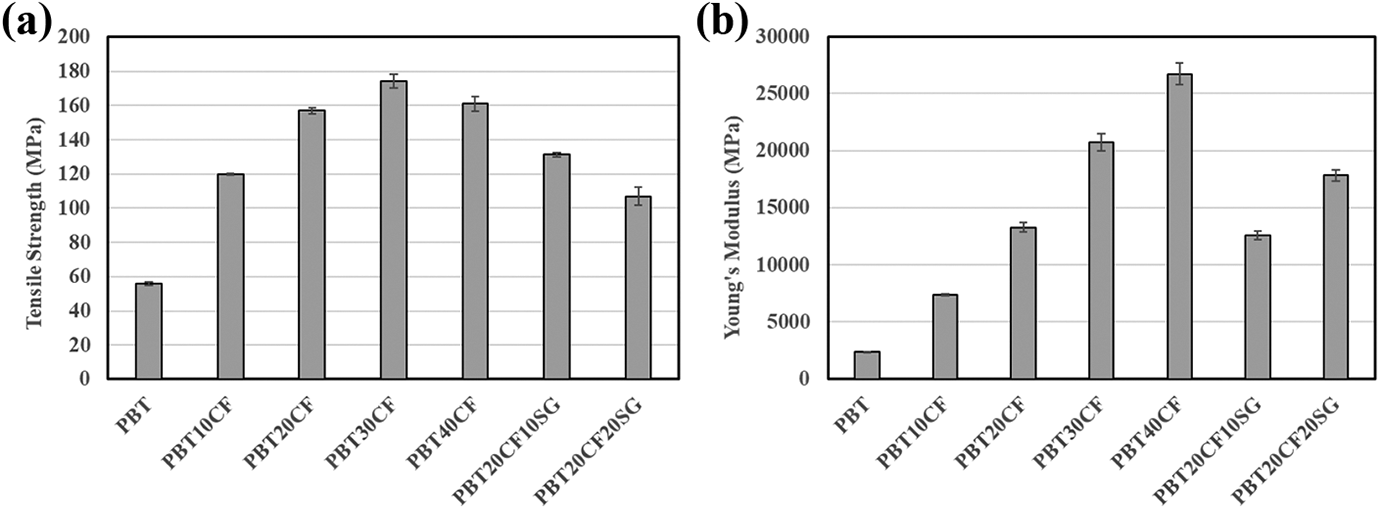
Effect of carbon fiber and synthetic graphite on (a) tensile strength and (b) Young’s modulus of PBT-based composites.
Flexural properties
Figure 7 shows the effect of SG addition on flexural properties of PBT-based composites. It can be seen from Figure 7 that the incorporation of SG into PBT causes little change in flexural strength values of PBT except 10 wt.% SG added composite which shows an about 11% increase in the flexural strength. In contrast, addition of SG to PBT increases the flexural modulus values at all weight fractions of SG used in PBT composites. PBT with 40 wt% SG exhibits the maximum value of flexural strength of 8211 MPa.
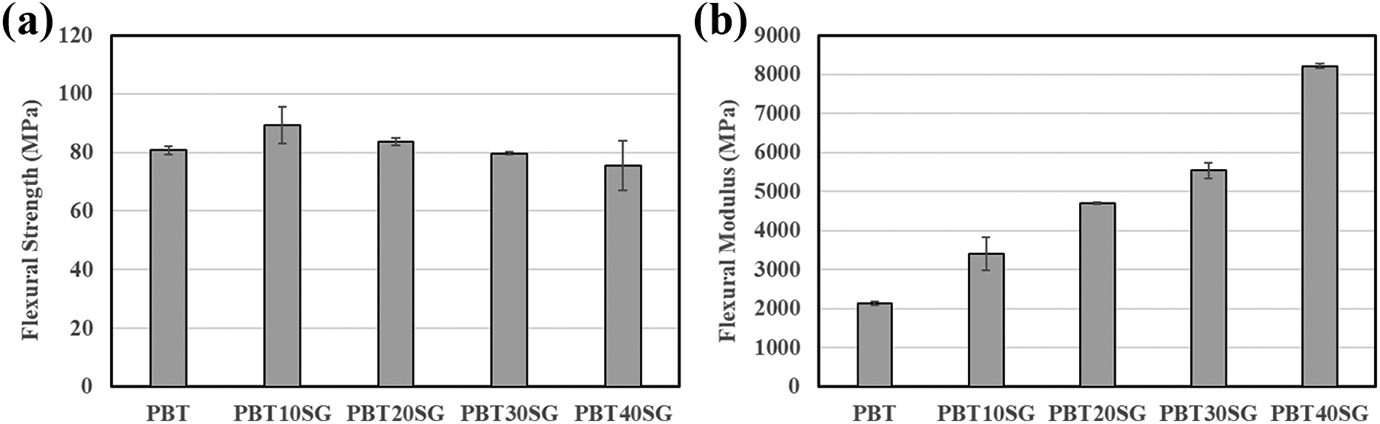
Effect of synthetic graphite on (a) flexural strength and (b) flexural modulus of PBT-based composites.
Figure 8 shows the variation of flexural strength and modulus for CF reinforced PBT and CF and SG filled PBT hybrid composites. As it is seen from Figure 8, flexural strength and modulus values increase with the increasing weight fraction of CF. It can be noted that PBT40CF has the highest value of flexural strength and flexural modulus followed by PBT30CF. Compared with the single CF added composites, the composites with hybrid CF and SG present significantly lower flexural strength. However compared to the PBT20CF sample, hybrid PBT20CF10SG and PBT20CF20SG samples showed 20% and 30% higher flexural modulus values, respectively, indicating that the synthetic graphite filled PBT composites have higher stiffness. 53
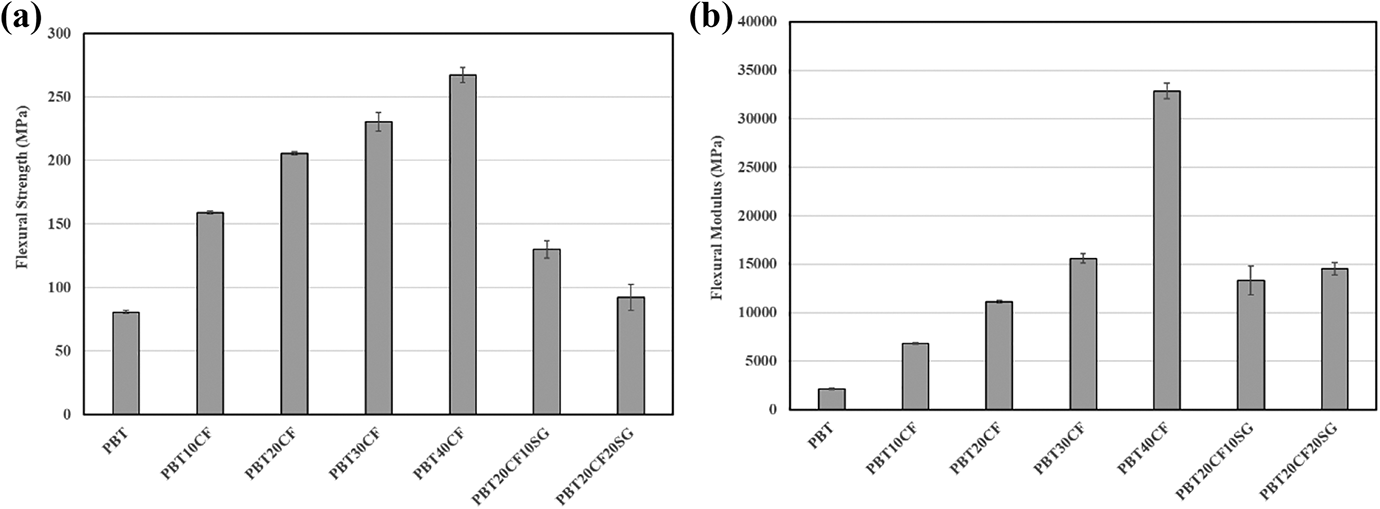
Effect of carbon fiber and synthetic graphite on (a) flexural strength and (b) flexural modulus.
Impact test results
Effect of single SG or CF and hybrid SG and CF addition on the Izod notched impact strength of PBT-based composites is presented in Figure 9. It is obvious from Figure 9 that SG addition results in lower impact strength values at all weight fractions of SG. However, when CF is added in different weight ratios, higher impact strength values in PBT composites were achieved except 10 wt.% of CF. In PBT-based composites, it can be said that the toughening effect of CF is more dominant at weight fractions above 10%. It has been known that impact properties depend on the interfacial interactions and morphology of the components. 54 According to the results, one can say that carbon fibers are more effective on impact properties than graphite particles due to possible better dispersion and bonding with the PBT matrix. In the case of hybrid composites, PBT20CF10 and PBT20CF20SG composites showed lower value for impact strength than that of PBT20CF composite, which indicates the decreasing effect of SG on impact strength in PBT-based composites.
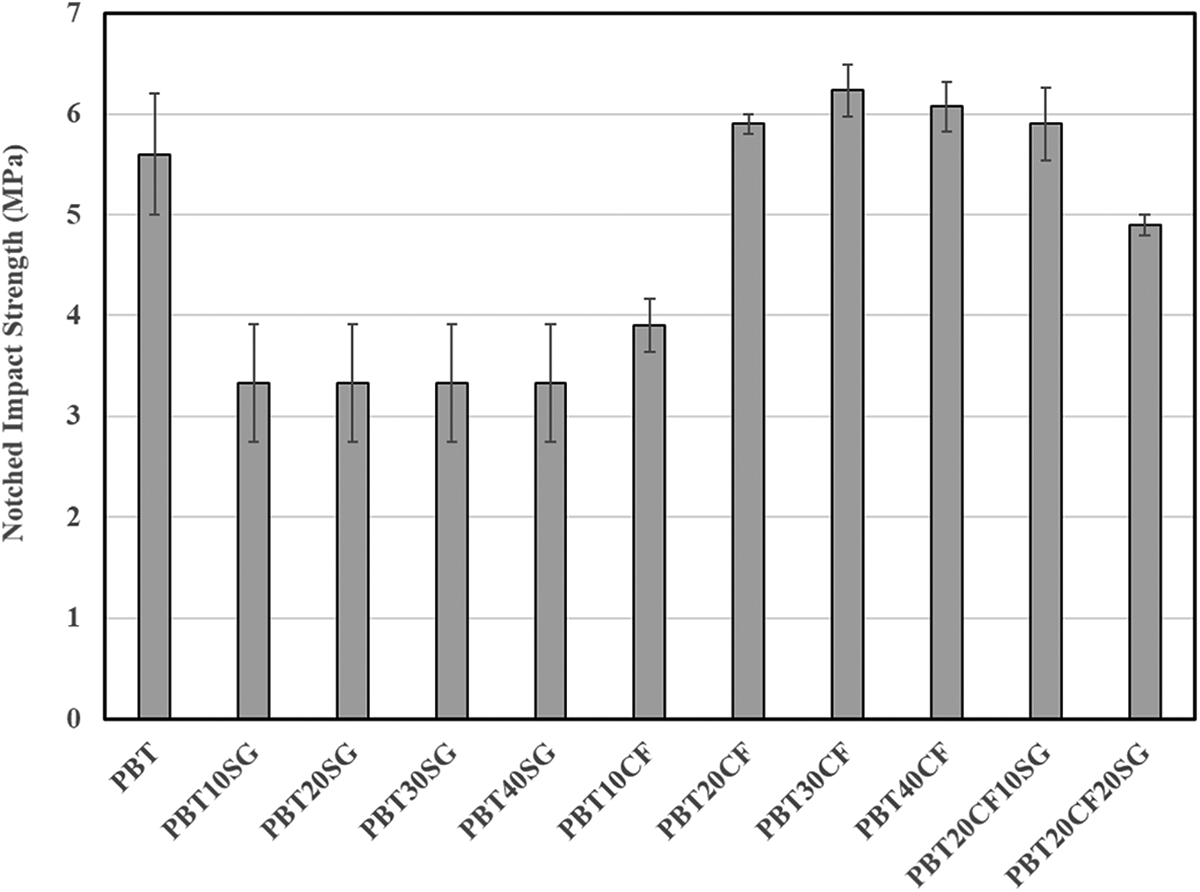
Effect of carbon fillers on the Izod notched impact strength of PBT-based composites.
SEM analysis
SEM images of fractured surfaces of PBT10SG, PBT20SG, PBT30SG, and PBT40SG are shown in Figure 10(a) to (d), respectively. Graphite layers can be clearly seen in those images. Network-like interconnected particle structures are clearly seen in Figures 10(c) and (d), which demonstrates higher SG weight fractions. Figure 11 shows the SEM images of PBT10CF, PBT20CF, PBT30CF, and PBT40CF. Many holes can be noticeable on the fracture surfaces of the composite owing to the fiber pull out. It can be noted that fiber breakage and fiber pullout can be considered as predominant mechanism of fracture. SEM images of PBT20CF10SG and PBT20CF20SG is presented in Figure 12. From Figure 12(a), it is seen that fibers with a diameter of about 9µm were evenly distributed in the polymer matrix. Figure 12(b) shows the graphite layer with a length of 28 µm and a width of 16 µm. The thickness of graphite layer, about 720 nm, can be seen in Figure 12(c). The other length size for graphite layer was shown in Figure 12(d) as 47 µm. As can be seen from Figure 12(c) and (d), a conductive network between SG and CF formed, which indicates strong heat flow pathways. This explains increased thermal conductivity of PBT when loaded with SG and CF.
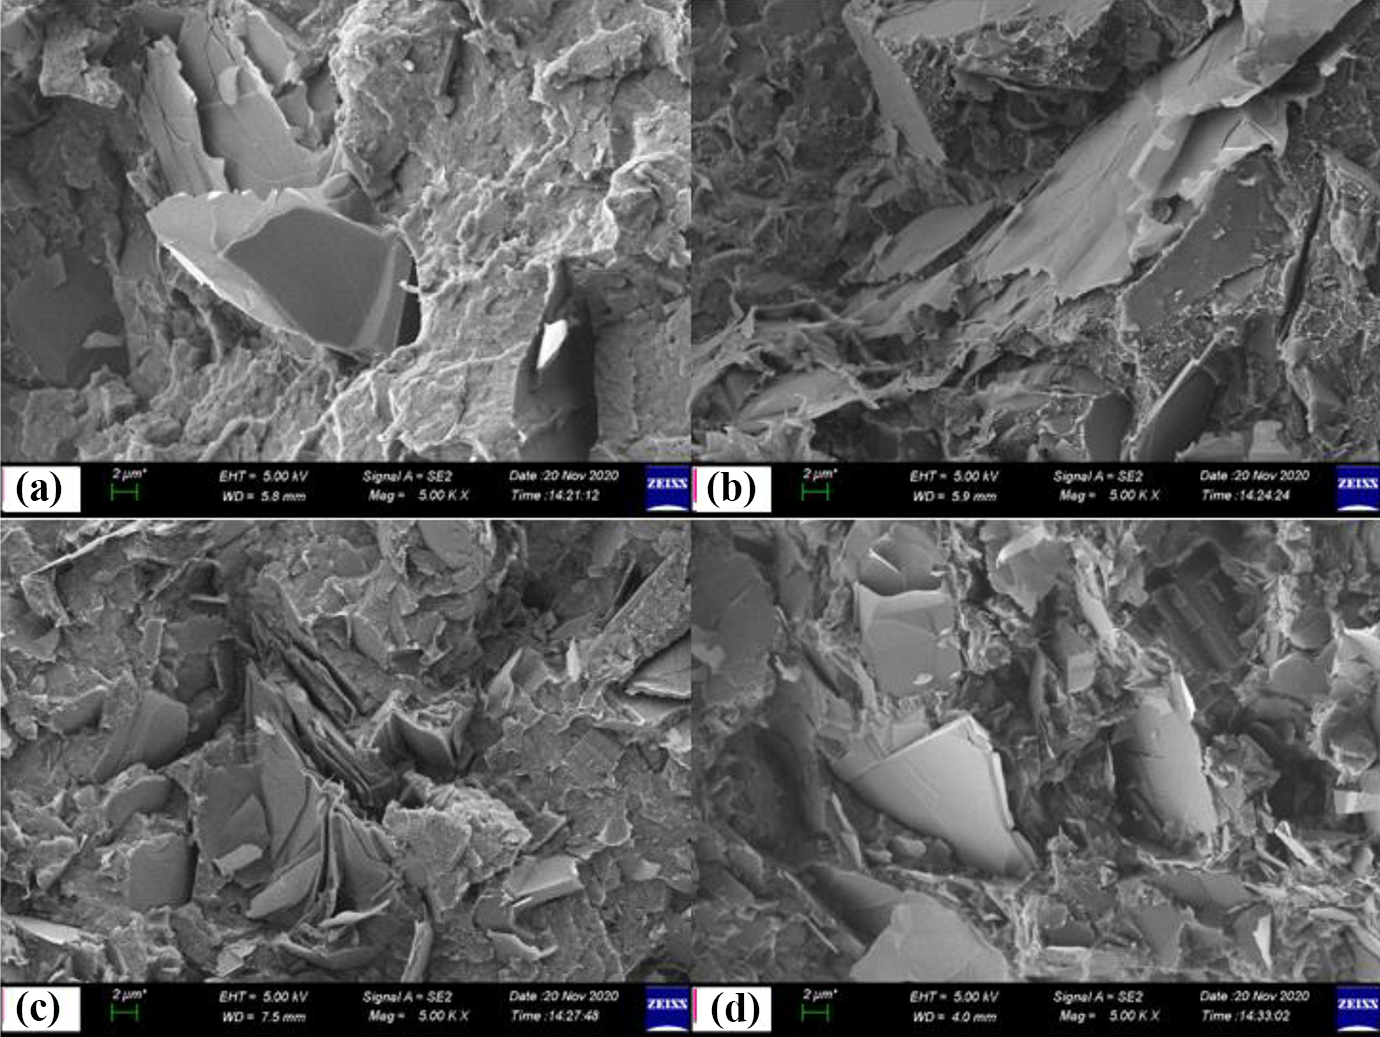
SEM images of (a) PBT10SG, (b) PBT20SG, (c) PBT30SG, (d) PBT40SG.
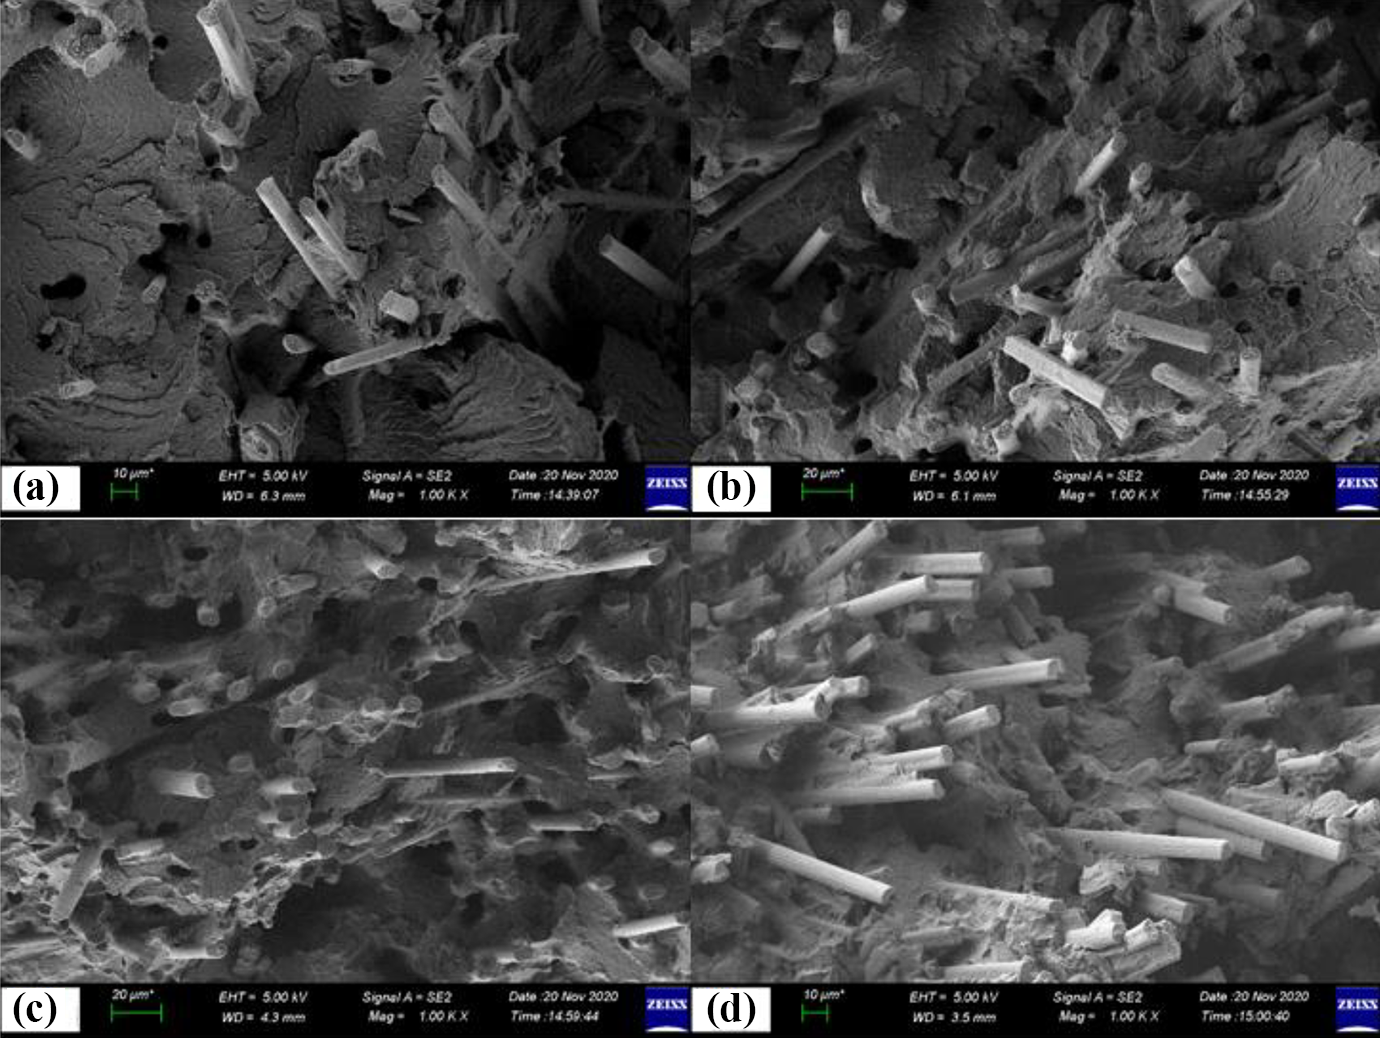
SEM images of (a) PBT10CF, (b) PBT20CF, (c) PBT30CF, (d) PBT40CF.
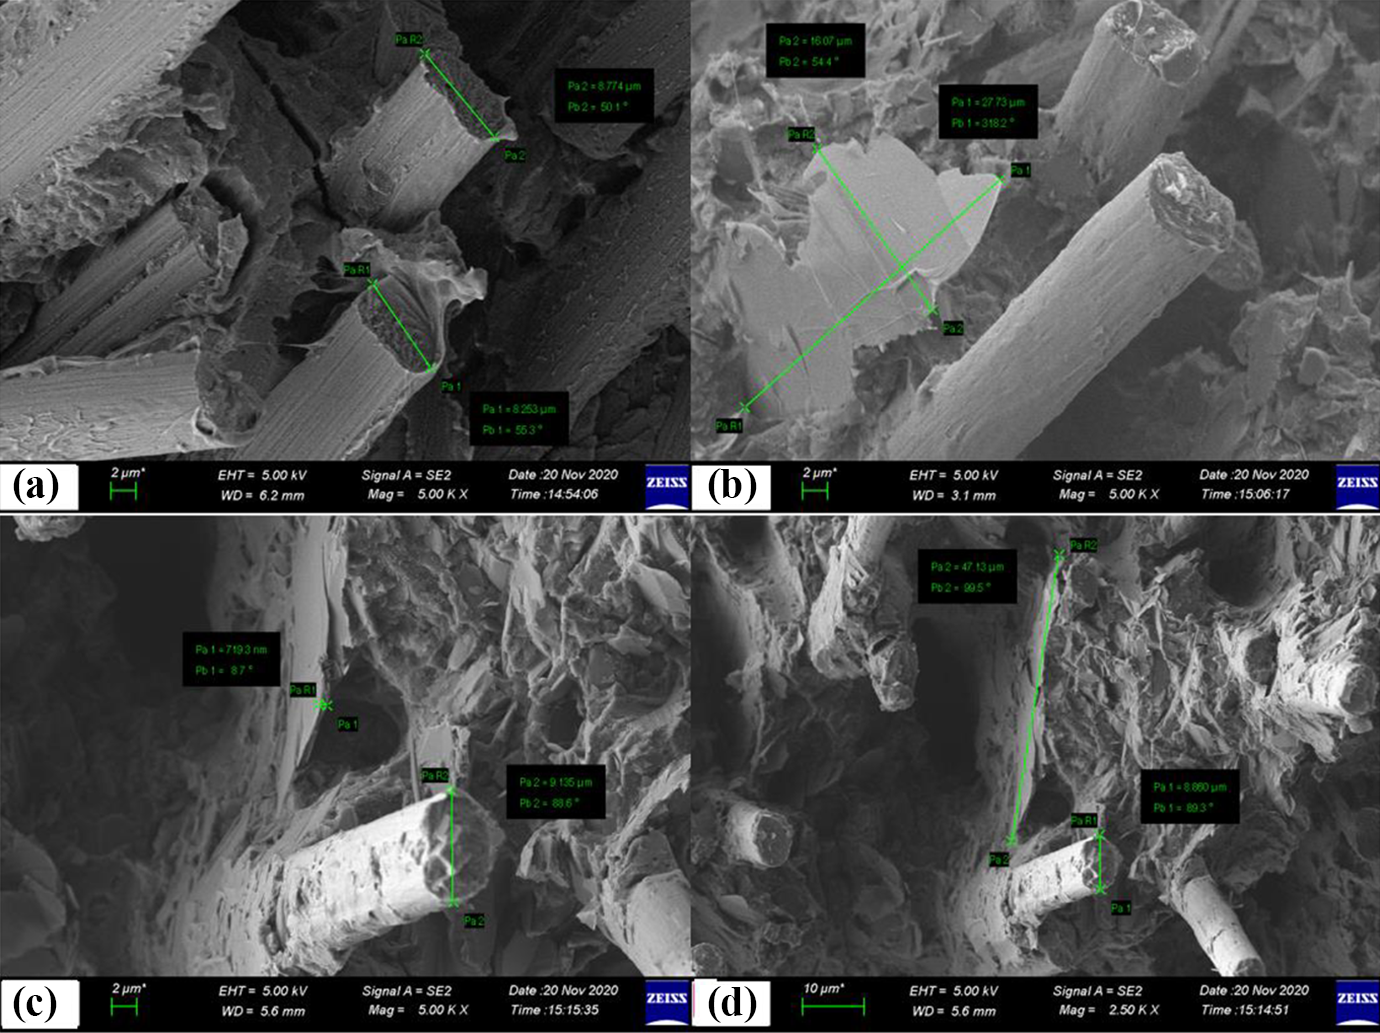
SEM images of (a) PBT20CF, (b) PBT20CF10SG, (c) PBT20CF20SG, (d) PBT20CF20SG.
Conclusion
Thermally conductive SG filled PBT composites, CF reinforced PBT composites, and hybrid CF and SG loaded PBT composites were all successfully manufactured. PBT has in-plane and through-plane thermal conductivity of 0.19 W/mK, which increased to 0.57, 1.89, 4.71, and 9.24 W/mK for in-plane and 0.23, 0.42, 1.33, and 2.03 W/mK for through-plane direction after loading 10, 20, 30, and 40 wt.% synthetic graphite, respectively. Through-plane thermal conductivity of PBT were enhanced by 128%, 650%, 1600%, and 4133% with the loading of 10, 20, 30, and 40 wt.% CF, respectively. However, in-plane thermal conductivity of PBT increased by 78%, 250%, 839, and 794% with loading of 10, 20, 30, and 40 wt.% CF, respectively. The in-plane thermal conductivity values of PBT20CF10SG and PBT20CF20SG composites were obtained to be about 4.69 and 8.89 W/mK, respectively. Although mechanical properties at 40 wt.% CF loaded PBT is higher than PBT20CF20SG composite, both in-plane thermal conductivity value of PBT20CF20SG is higher than that of PBT40CF because of various aspect ratio of SG and CF. However, when high through-plane thermal conductivity is a priority, PBT40CF composite could be preferred compared to PBT20CF20SG for specific thermal management applications.