
Abstract
This study investigated the effects of FDM (Fused Deposition Modeling) process parameters on mechanical properties (tensile strength, elongation, and impact strength) of 3D (three-dimensional) printed PA12 (Polyamide12) samples using Taguchi method. In the experimental design (L8), four different layer thickness (0.1, 0.15, 0.2, 0.25 mm), extruder temperature (250 and 260°C), filling structure (Rectilinear and Full Honeycomb), and occupancy rate (25 and 50%) were determined. The tensile and impact strength test samples were printed with the FDM method. Tensile and impact strength of the test samples were carried out according to ISO 527 and ISO 180 test standards. The findings obtained from tests were analyzed and compared. As a result, the layer thickness is most effective factor for enhance the mechanical properties instead extruder temperature, occupancy rate, and filling structure. The optimum tensile strength of determined for process parameters (layer thickness, occupancy rates, filling structures and extruder temperature) were 0.25 mm, 50%, Rectilinear, and 250°C, respectively. The optimum impact strength of determined for process parameters (layer thickness, occupancy rates, extruder temperature, and filling structures) were 0.25 mm, 50%, 250°C, and Rectilinear, respectively. PA12 filament material can be used to printing for sleeve bearing due to their mechanical properties. It can be used in the production of many machine parts and components due to its tensile strength, impact strength resistance and damping properties.
Introduction
In the industry, additive manufacturing has been developed for printing products with the desired geometry using a variety of material types to create three-dimensional (3D) object instead of traditional manufacturing processes. However, FDM (Fused Deposition Modeling) single technology is widely used in various sectors. This method has been used in engineering and medical applications especially in recent years. The reason for it is widespread that complex parts can be produced in operation without any human intervention. In addition, limited number of tailor-made production opportunities was provided cheaply with this method. Today, prototypes are the basis step for production to obtain tools and functional end-user most commonly used filament materials products. The in production with this method are; Acrylonitrile Butadiene Styrene (ABS), 1 Polylactic Acid (PLA) 2 and Polyethylene Terephthalate Glycol (PET-G). 3 In addition, PA12 (Polyamide12) filament materials are widely used as sleeve bearing, rotating machinery components, and automotive parts. 4
In recent years, FDM parts are mainly used as visual aids, presentation or educational models, and fit and assembly models, manufacturing functional parts have been gaining importance in different fields. 5 In this context, the design for FDM attracts considerable attention. It is also mandatory to be able to predict how the samples will behave when subjected to mechanical loads in order to evaluate their suitability for a given application. Hence, the analysis of the mechanical properties of FDM samples represents an important subject of interest.5,6 With FDM technology, complex geometry parts can be produced quickly and have advantageous because they are more economical than other traditional manufacturing methods. However, the FDM method is limited in lower mechanical properties than traditional manufacturing methods. This is due to the internal limitations of the method, resulting in poor adhesion between layers and the formation of small porous portions in addition to the heterogeneous microstructure of the parts. 7 Despite all these disadvantages, FDM has been the most preferred method for products with very low volume needs due to the absence of significant initial costs that come with specially manufactured molds obtained by molding techniques. Since translating fused deposition technique into traditional technique can be practical and expensive, notable research has focused on improving material performance and functionality using different polymer raw materials. 8 In this regard, experimental studies are conducted based on the mechanical properties, surface quality and dimensional accuracy of the parts produced by the FDM method. 9 Studies focused on the use of ABS and PLA filled with micron or nanoscale particles such as graphene, short fiber, metals to improve mechanical properties.10,11 In another study, they compared the mechanical performance of PA12 and PA11 (bio-based polyamide) powders under various conditions. They found that PA11 powder had higher durability and ductility at low temperatures, as well as better hydrothermal aging resistance and better fatigue strength under investigated conditions. 12 All existing polyamide material development of a new polyamide, incorporated to evaluate mechanical properties such as strength, and toughness of FDM printed parts. In a study, PA12 was selected due to exhibiting higher mechanical properties and is often preferred for prototyping as compared with other filament materials. 13 They investigated the tensile strength and elasticity module of PLA and ABS parts produced with a 3D printer. 14 As regards the filling angle orientation, they found that the thermal behavior of the material also affects the mechanical properties. 15 It was observed that the surface quality of the printed part was improved by choosing the appropriate filling angle and reducing the layer thickness. 16
For the 3D open source printer working with the FDM method, the orthogonal array L9 was used to optimize the dimensional parameters and process parameters of the parts printed from PLA and ABS filament material using the Taguchi method. 17 In addition, the process such as occupancy rate (20, 50, and 70%), layer thicknesses (0.1, 0.2 and 0.3 mm) and number of outer shells (1, 2, and 3) related to Taguchi optimization. Using the parameters, a rectangular sample was produced from PLA filament material, and it was stated that the dimensional accuracy of 20% occupancy rate and 0.2 mm layer thickness and the number of three outer shells. Experimental studies in the literature were investigated on the mechanical properties, optimization and dimensional accuracy of the parts printed by the FDM method with different filament materials (ABS, PA12).18–21 In the literature, many studies were examined in FDM method.22–30 They examined the effect of occupancy rates, printing speed and layer thickness on mechanical properties of PLA samples using Taguchi method. Test results showed that the optimum process parameters (occupancy, printing speed, and layer thickness) for the elasticity modulus and ultimate tensile strength were 80%, 2400 mm/min, and rate 0.1 mm, respectively. 22 They investigated the effect of process parameters (build orientation, layer thickness and printing speed) on mechanical performance of PLA samples. The samples exhibit anisotropic behavior due to the layer-by-layer process. Upright orientation gave the lowest mechanical properties. Flat orientation shows the highest strength. It is shown that ductility decreases as layer thickness and printing speed increase. In addition, the mechanical properties increase as layer thickness increases. 23
In this study, the mechanical properties of the samples printed by FDM process parameters with PA12 filament material, which is one of the engineering polymers commonly used in the industry, were examined. This study aimed to determine the effect of FDM process parameters on mechanical properties with Taguchi (L8) optimization method. As one of the most important outputs of this study, thanks to the equations to be created as a result of the experimental and statistical studies that, the parameter calculations for the desired mechanical properties can be selected for PA12 filament material without experimenting.
Material and method
In order to manufacture samples in a 3D printer, firstly, the samples were designed using the SolidWorks program and transferred to the Slic3r program, which is the slicing interface program. FDM process parameters and 3D printer features were given in Table 1. In addition, one of the important parts for 3D printing is vibration, and the ambient conditions. In order to avoid the disadvantages of these conditions, Rigid2 Zero brand 3D printer, which is a closed box and has a full metal body, was preferred. PA12 material is one of the most preferred engineering polymers in the industry. ESUN brand PA12 filament material was preferred because of its better mechanical and chemical properties.
FDM process parameters and 3D printer features.
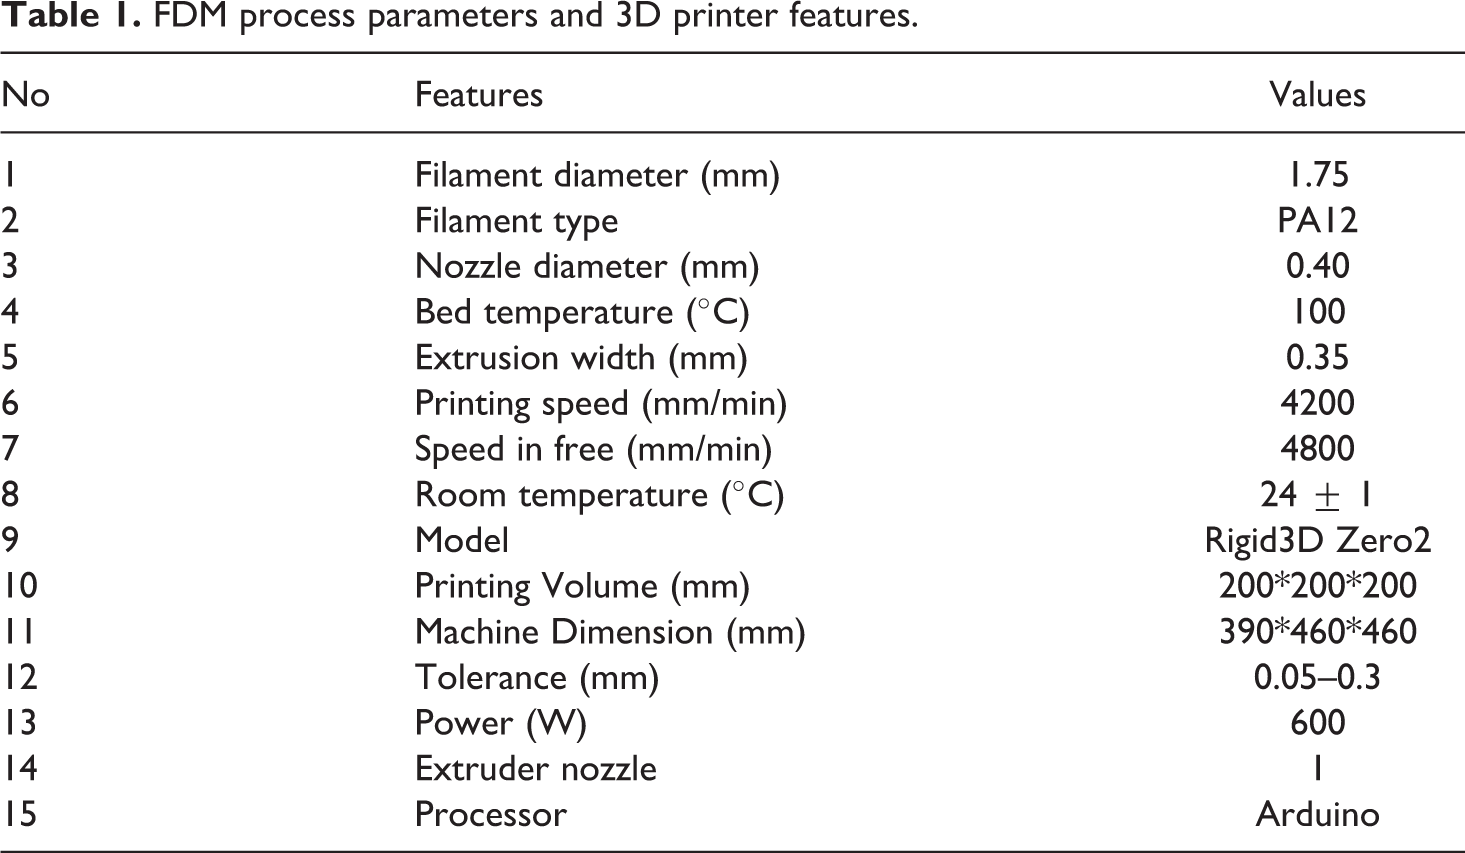
Figure 1 shows the printing process of experiment samples by FDM. FDM method is a production method like injection molding. The difference between two methods are that there is no need for any mold or bedding in the FDM method and the melted material is produced by pouring it onto a flat surface such as a glass surface or a heated bed. This method is pouring the molten plastic through a hot nozzle with a cross sectional area lengthwise layer by layer. In this experimental study, three samples were produced for each combination of process parameters.
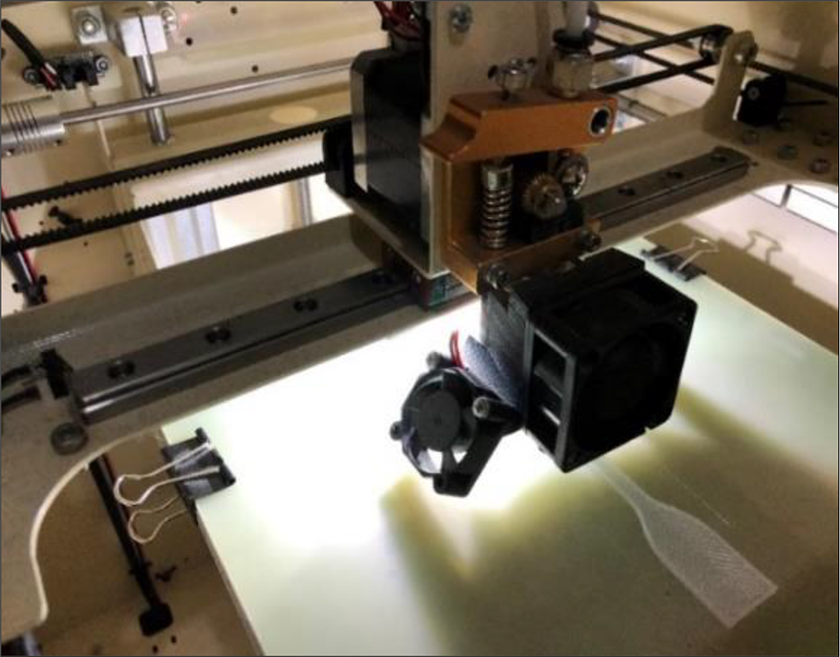
Printing of experiment samples by FDM method.
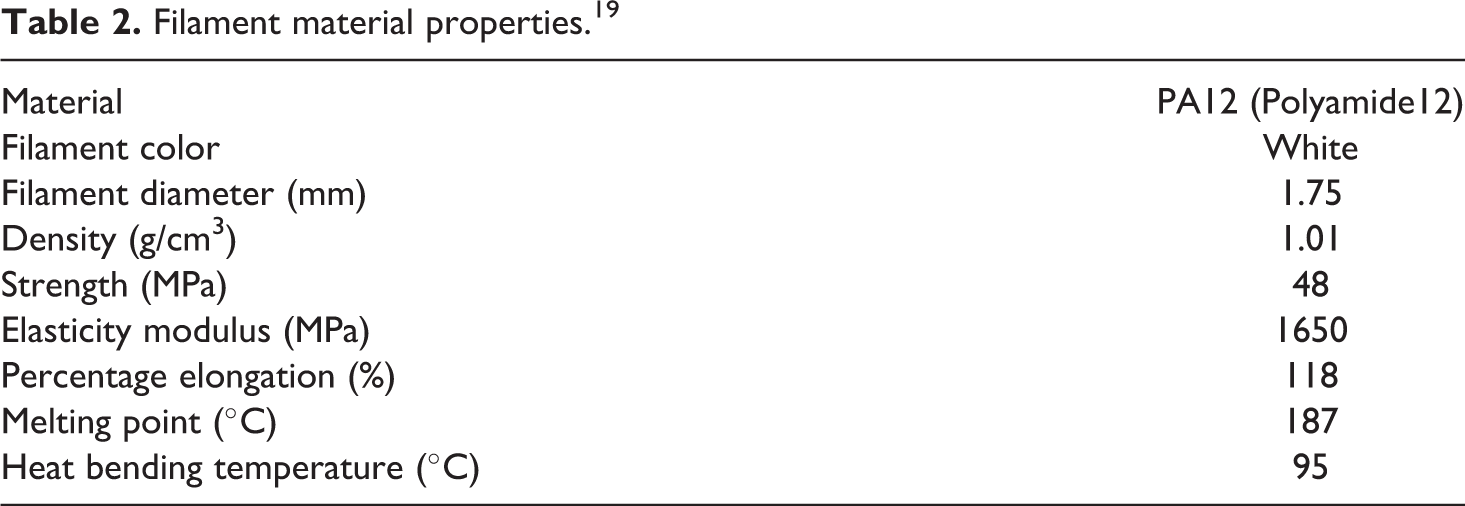
PA12 filament material was used and the physical properties of the filament material are given in Table 2. In addition, PA12 material is widely used in many different application areas such as functional parts, medical applications, molded parts and moving parts with its well-balanced properties. It stands out with its high rigidity, hardness, and chemical resistance, stable behavior in long-term use, high resolution, and biocompatibility.
Filament material properties. 19
Impact strength test sample (ISO 180—Type 1) and tensile test sample (ISO 527—Type 2) dimensions were given in Figure 2.
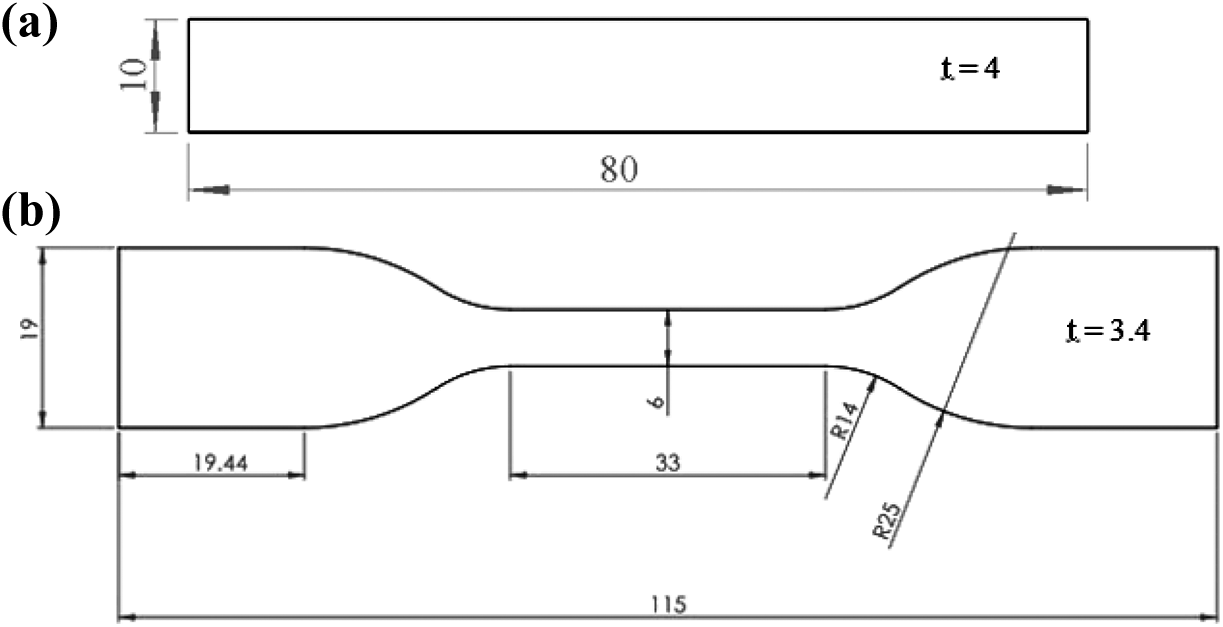
(a) ISO 180—Type 1 impact strength test sample and (b) ISO 527—Type 2 tensile strength test sample (all dimensions in mm).
Tensile tests were carried out in UTEST brand tensile test device. The condition of the samples during the tensile testing device and the tensile process was shown in Figure 3. Tensile tests were carried out at a tensile test speed of 5 mm/min and under equal conditions for each test sample.
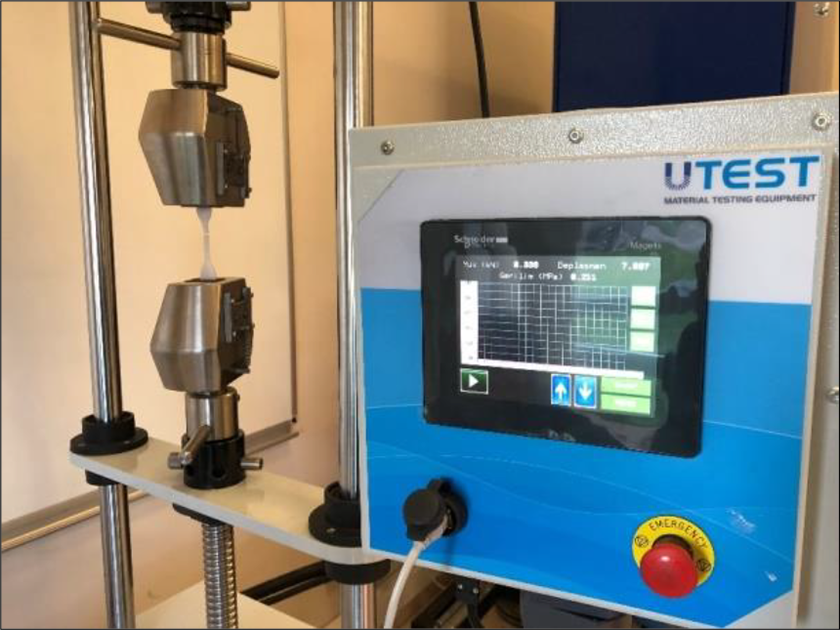
Tensile test device.
Impact strength tester and standard impact strength test samples were shown in Figure 4. Three samples were produced for each combination of process parameters for the tests. These tests were repeated three times for each sample and their mean values were calculated.
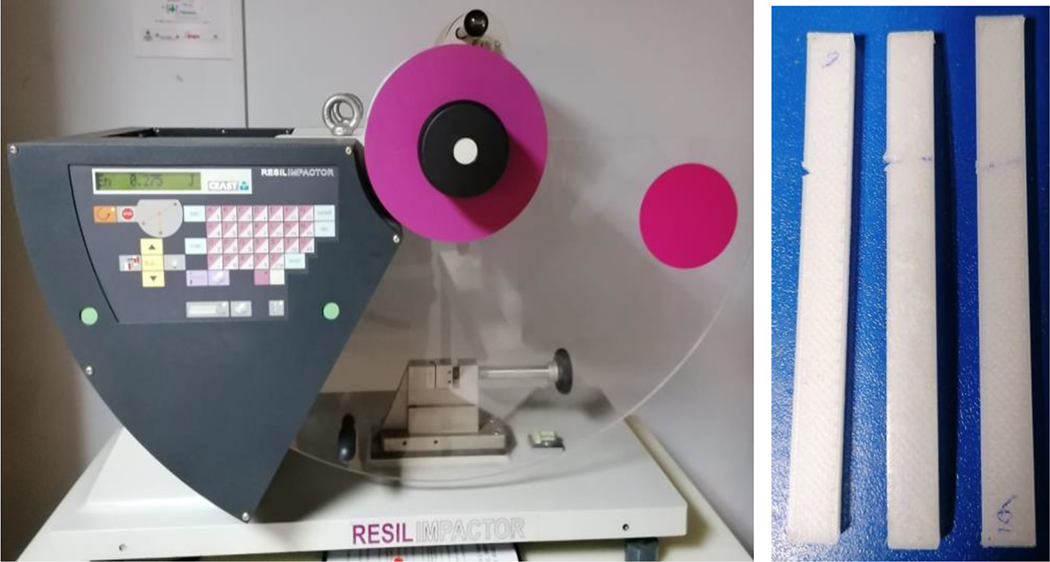
Impact strength test device and test samples.
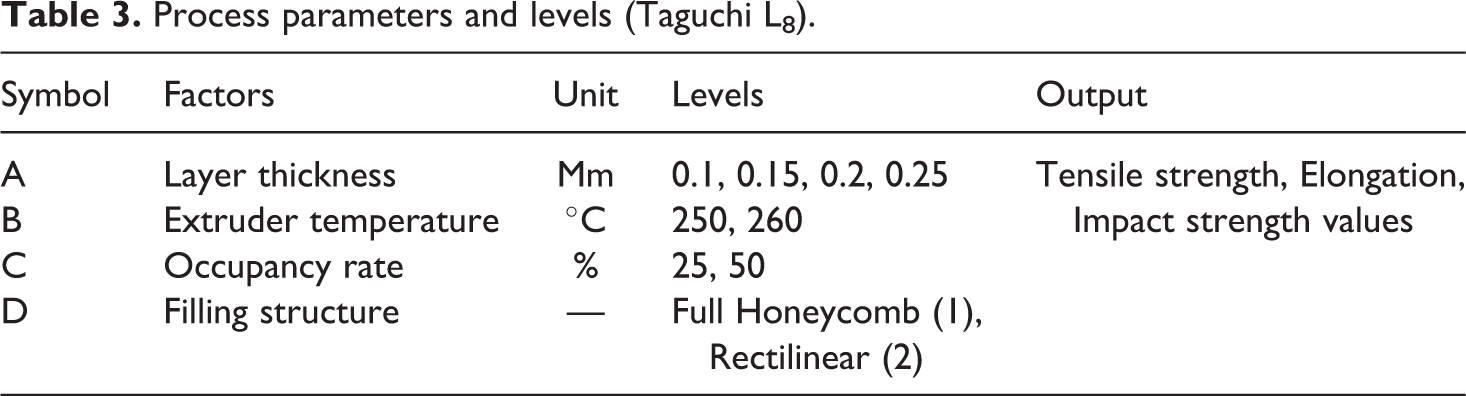
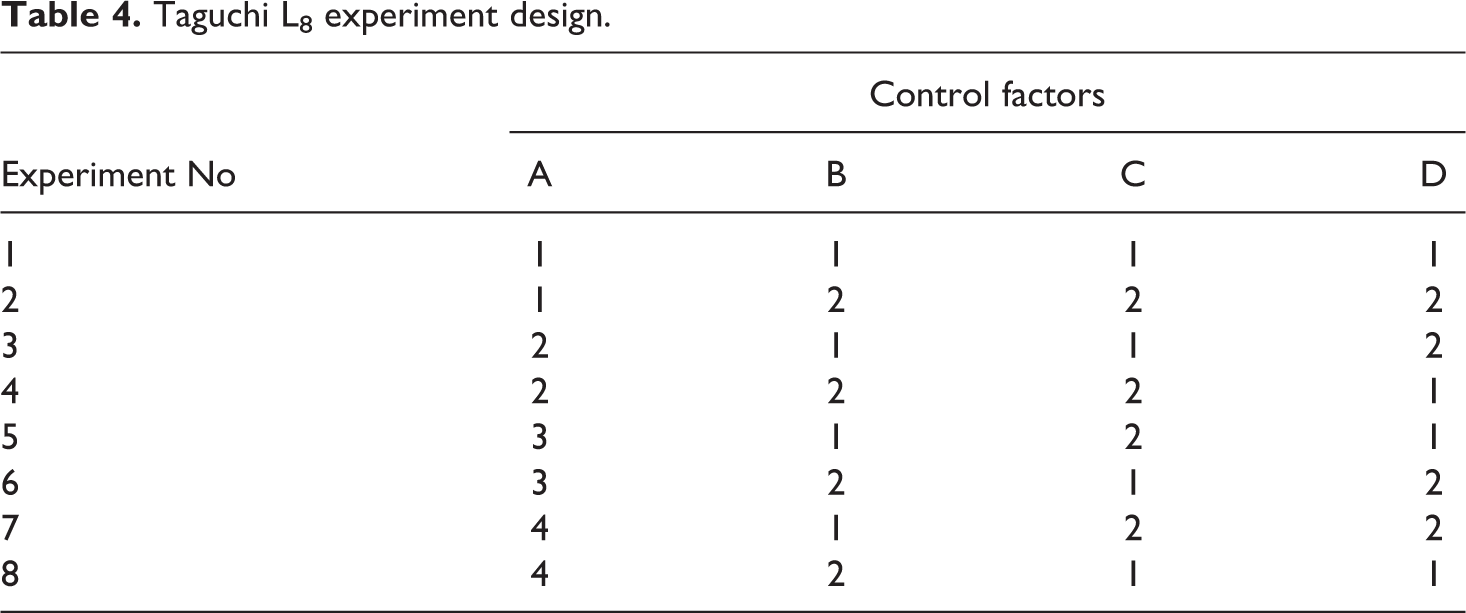
In the Taguchi method, a special array called orthogonal arrays is used. These standard arrays help us determine the minimum number of experiments that will give full information of all factors affecting performance parameters. Printing process parameters such as the occupancy rate (%), filling structures, layer thickness (mm), and extruder temperature (°C) of the test samples affecting the mechanical properties in production with the FDM method were shown in Table 3 and the L8 sequence was chosen because the parameters were limited. L8 experiment order and order were given in Table 4. The Taguchi method is one of the most widely used optimization methods. This method has been developed to overcome the results that can be achieved with the help of a large number of experiments associated with multifactorial full factorial designs.20,22
Process parameters and levels (Taguchi L8).
Taguchi L8 experiment design.
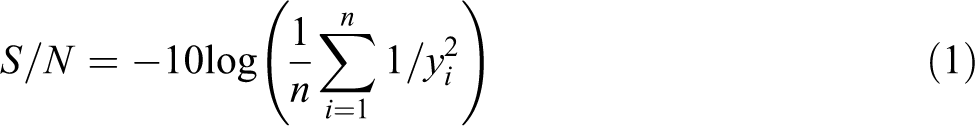
In Equation (1), yi is the measured mechanical properties values; n is the number of experiments performed.
In studies conducted to improve mechanical properties, layer thickness, extruder temperature, occupancy rate and filling structure were determined as the most effective parameters.20,22 Values from 0.1 to 0.25 are preferred as the levels of the layer thickness parameter. Extruder temperature value is the recommended as 250-275° printing temperature of PA12 material 28 Occupancy rate values are chosen as 25% and 50% because when the occupancy rate exceeds 50%, production times increase significantly despite the increase in mechanical properties and production cost exceeds reasonable limits. The values below the 25% occupancy rate are ineffective for strength and the reduction in production time is low. As the filling structure, rectilinear and honeycomb are the most widely used filling structures in terms of mechanical properties.27–30
Results and discussion
Taguchi design method is provided the optimum mechanical properties values with 8 experiments instead of 32 experiments. The effect of the printing process parameters on the mechanical properties was determined with an analysis of variance (ANOVA).The findings obtained from the experiments were estimated with a regression analysis.
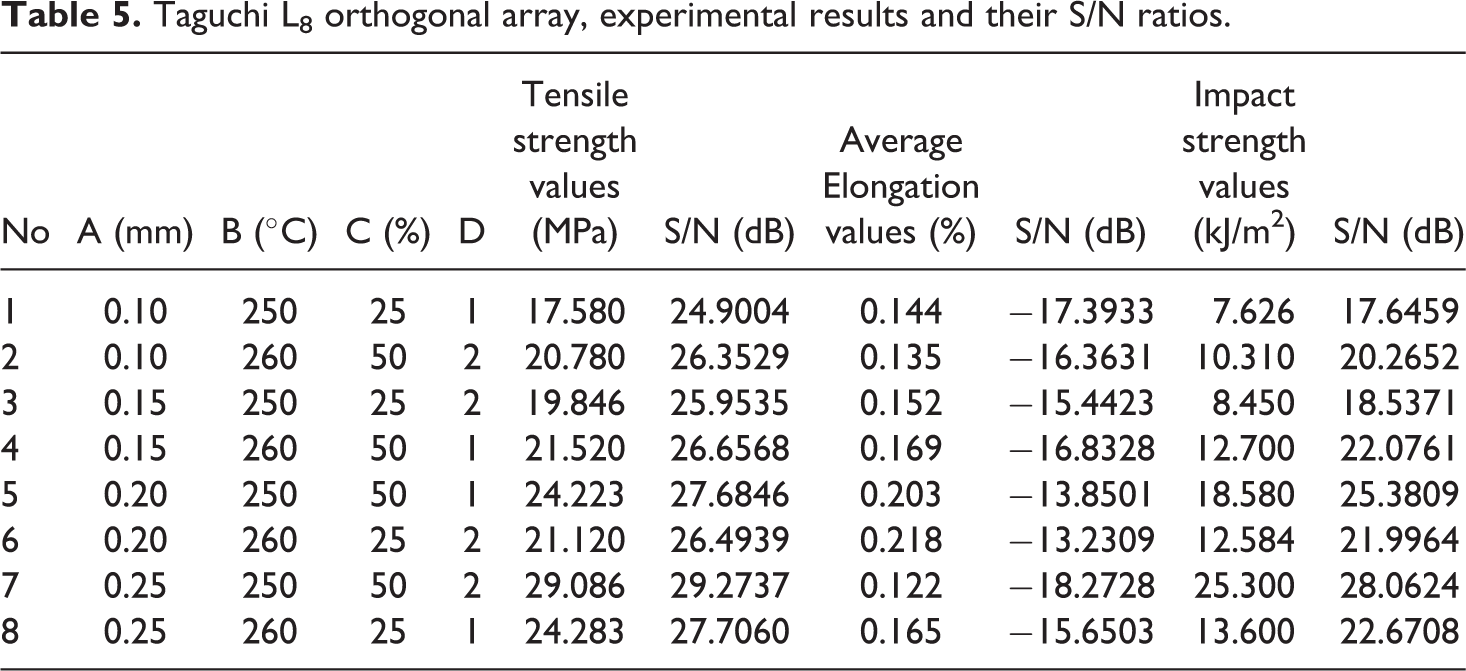
The standard tensile test samples were produced, tensile tests were performed, and the tensile strength, elongation, and impact strength values obtained from mechanical tests were averaged. Average tensile strength, elongation, and impact strength values signal to noise (S/N) ratios were given in Table 5.
Taguchi L8 orthogonal array, experimental results and their S/N ratios.
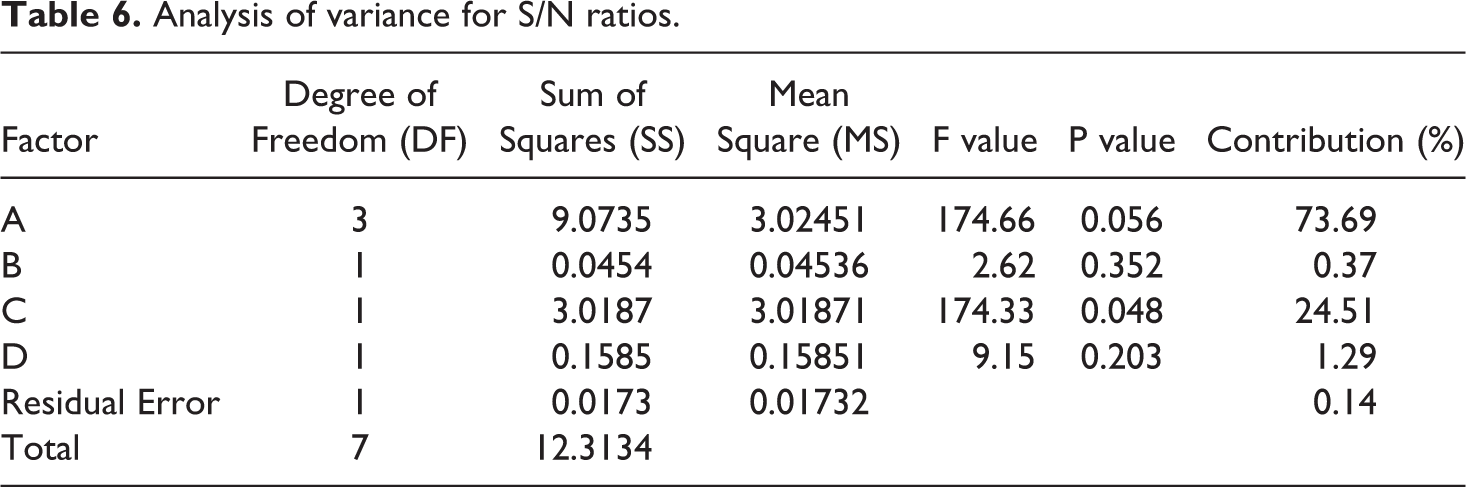
ANOVA results were given in Table 6. A and C parameters were statistically significant. The main effect plot for the effects and levels of the parameters is shown in Figure 5. It is desired to have high mechanical properties in 3D printing. Therefore, “larger is the better” method was chosen. 22 The larger is better calculation for calculating the S / N ratio was carried out using the Minitab18 software statistics program. The optimized process parameters and their corresponding order obtained from Taguchi analysis are shown in Tables 7 and 8. Linear Regression Equation is given in (2) for estimation of tensile strength at 95% confidence interval (CI). Effect on the tensile strength, the layer thickness parameter is 73.69% and the occupancy rate is 24.51%. The effect of other parameters on tensile strength is negligible.

Analysis of variance for S/N ratios.
S/N rates for tensile strength.
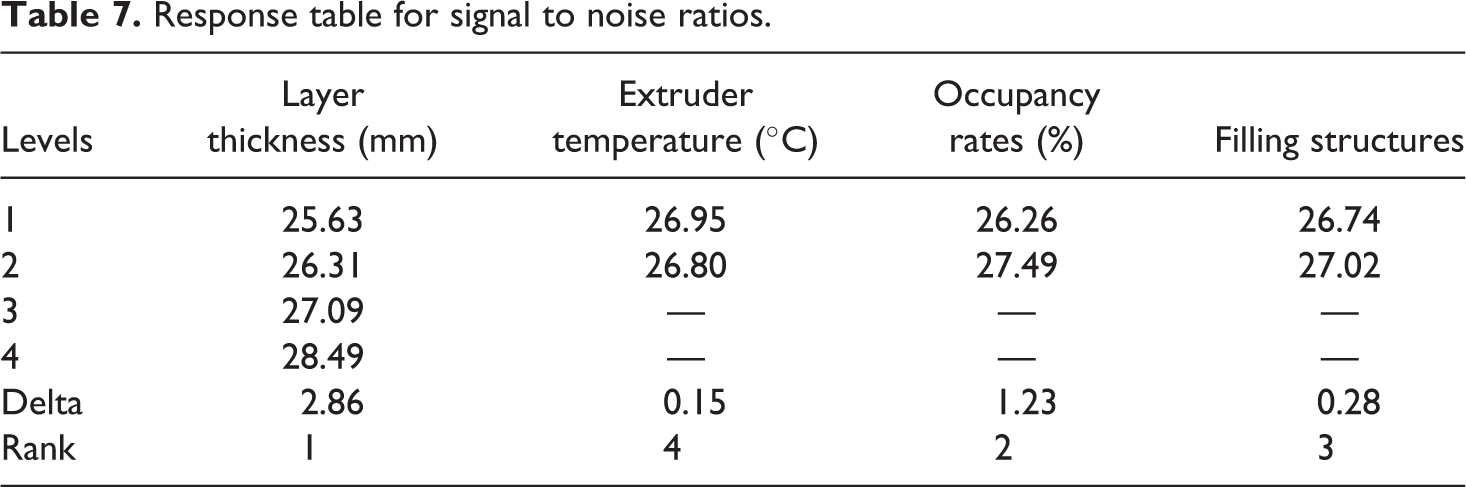
Response table for signal to noise ratios.
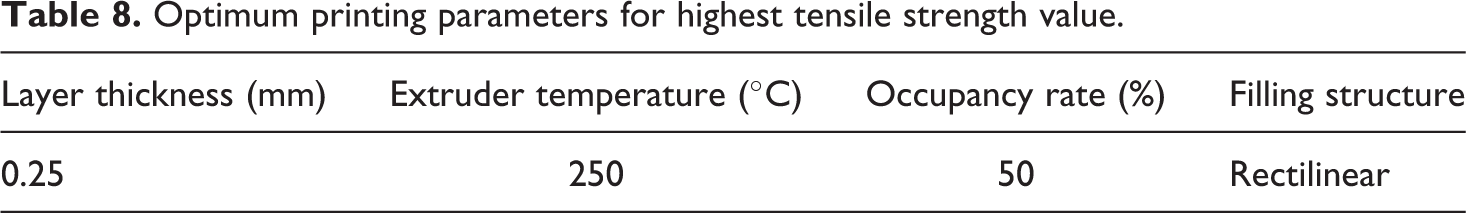
Optimum printing parameters for highest tensile strength value.
In Equation (2), A, B, C values can be selected in numerical values as mm, degree, and %, respectively; The number D should only be used as 1 for the full honeycomb form of filling structure and 2 for the rectilinear form of filling structure.
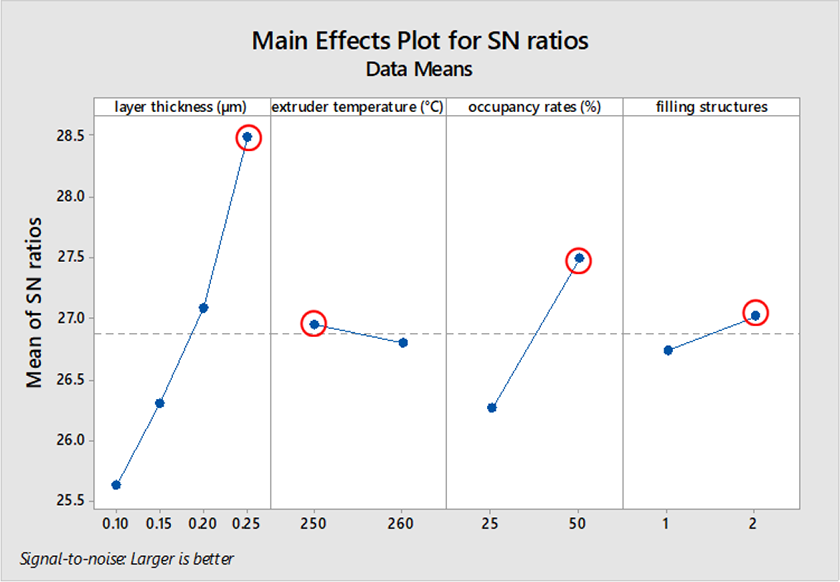
The most important factors for the tensile strength values were the layer thickness, occupancy rates, filling structures and extruder temperature. The results obtained from tensile tests were confirmed by the ANOVA. The optimum tensile strength for the FDM process parameters using PA12 filament was obtained at fourth level (A4) of layer thickness, at second level (C2) of occupancy rate, at second level (D2) of filling structure, and at first level (B1) of extruder temperature.
In Figure 5, the main effect plot for S/N ratios for tensile strength and FDM process parameters were shown. The printing process parameters (layer thickness, occupancy rates, filling structures and extruder temperature) for the optimum tensile strength were 0.25 mm, 50%, Rectilinear (2), and 250°C, respectively. Table 8 gives optimum printing parameters for highest tensile strength value. In Figure 6, surface plot graphs of tensile strength values were given.
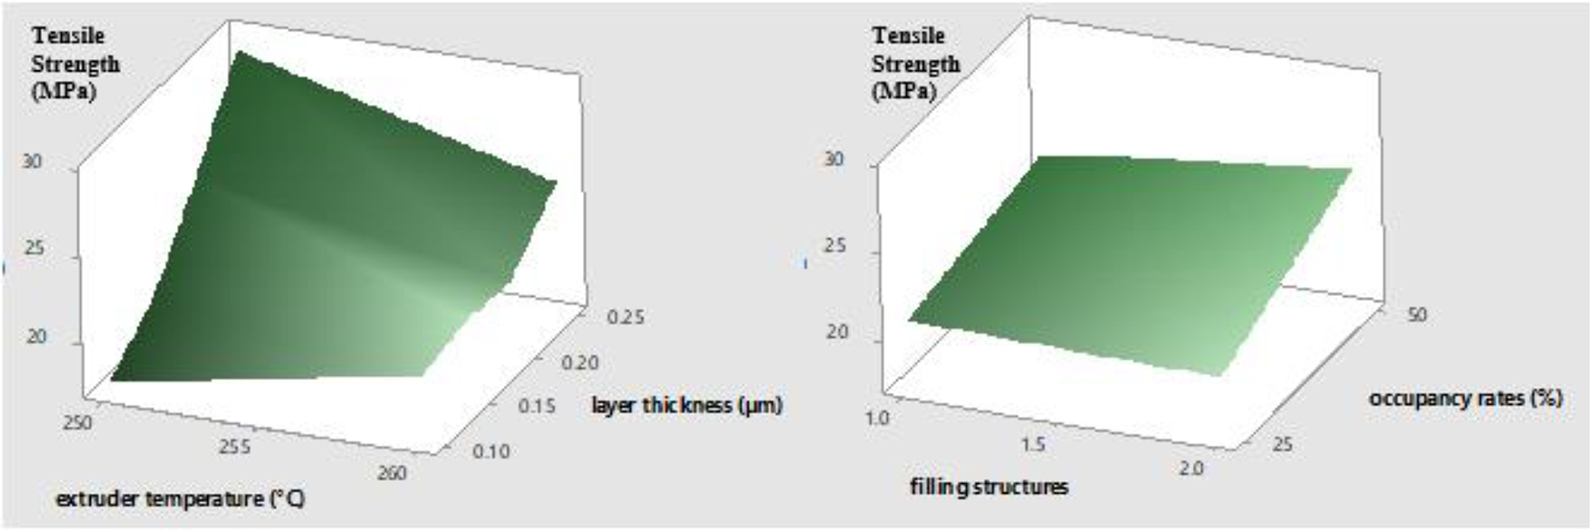
Surface plot of tensile strength.
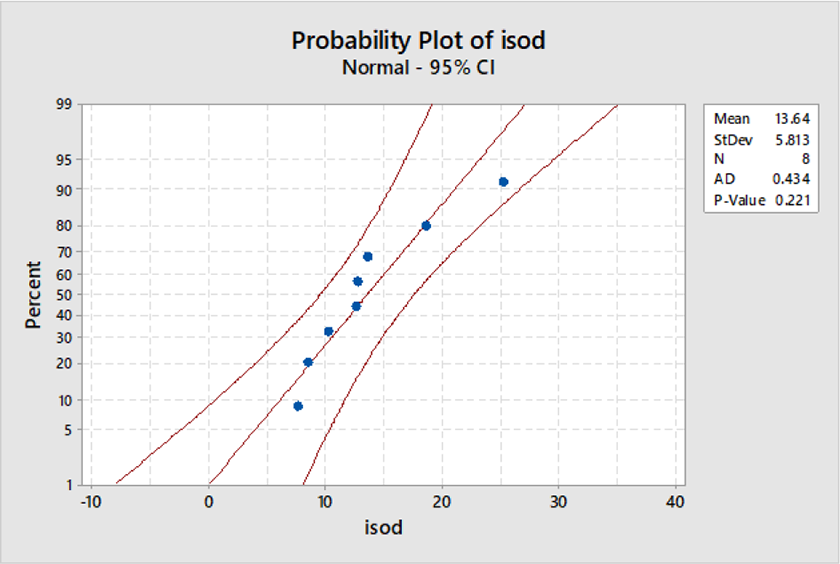
In the probability plot graph (Figure 7), as the layer thickness and occupancy rates increased, the tensile strength values increased proportionally. Other parameters (filling structure and extruder temperature) a little improved to tensile strength. Similar results in the literature studies were found.5,20,22,26–30
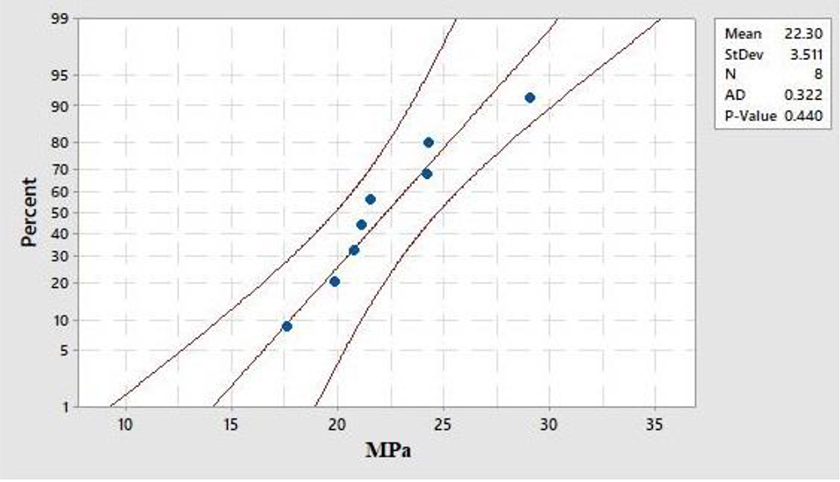
Probability plot.
The effects of layer thickness and occupancy rate parameters, which are the most effective on tensile strength, are given in the surface plot graph proportionally. As observed from the surface graphics, the contribution of parameters is mutually compared.
Figure 7 shows the strength values corresponding to the normal distribution percentages of the tensile strength values obtained from the test samples produced according to the selected parameters. In addition, the distribution close to the middle axis indicates that the established experimental order is balanced.
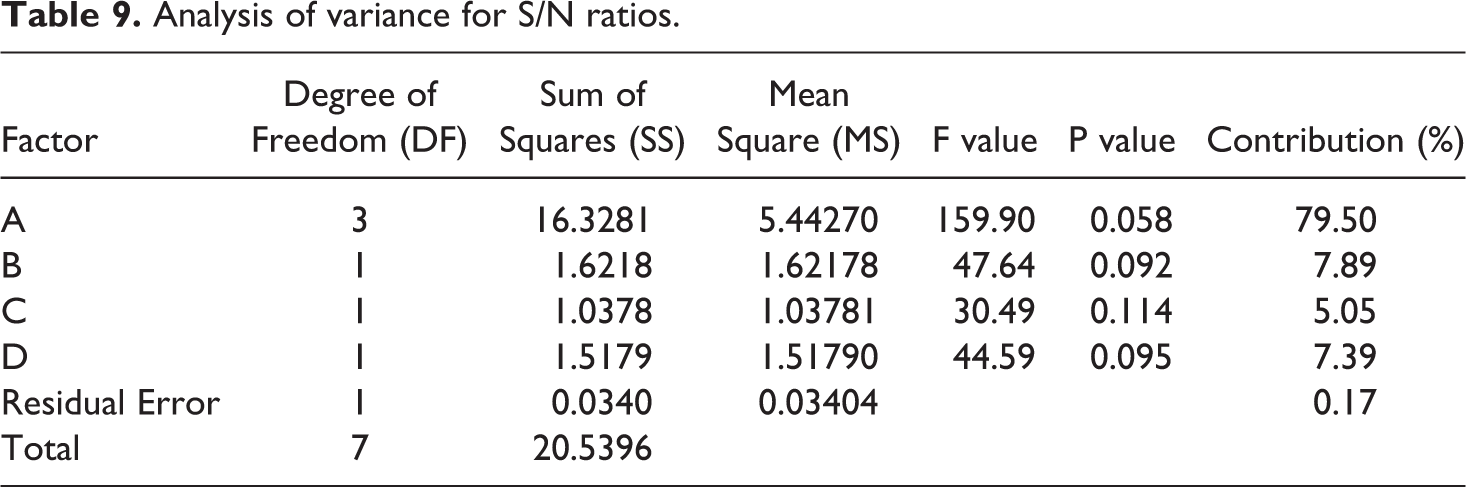
ANOVA results were given in Table 9. According to the ANOVA results, layer thickness was statistically significant. The main effect plot for the effects and levels of the parameters is shown in Figure 8. It is desired to have high mechanical properties. The optimized process parameters and their corresponding order obtained from Taguchi analysis are shown in Tables 10 and 11. Linear regression equation is given in (3) for estimation of elongation value. Effect on the elongation values, the layer thickness is 79.50%. The effect of other parameters on elongation values is negligible.

Analysis of variance for S/N ratios.
S/N rates for elongation.
Response table for signal to noise ratios.
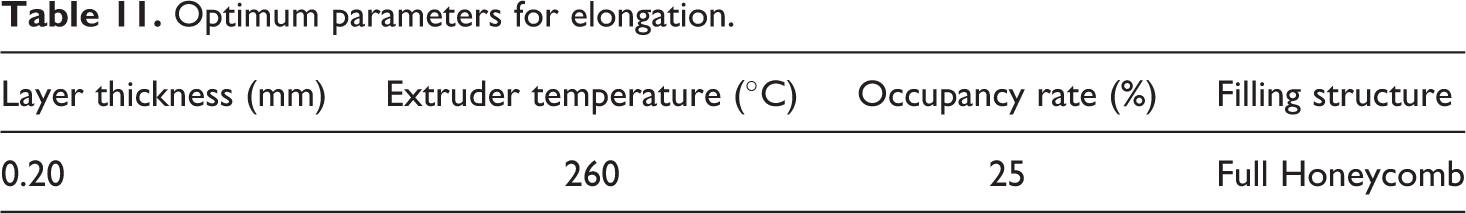
Optimum parameters for elongation.
In Equation (3), A, B, C values can be selected in numerical values as mm, degree, and %, respectively; The number D should only be used as 1 for the full honeycomb form of filling and 2 for the rectilinear form of filling.
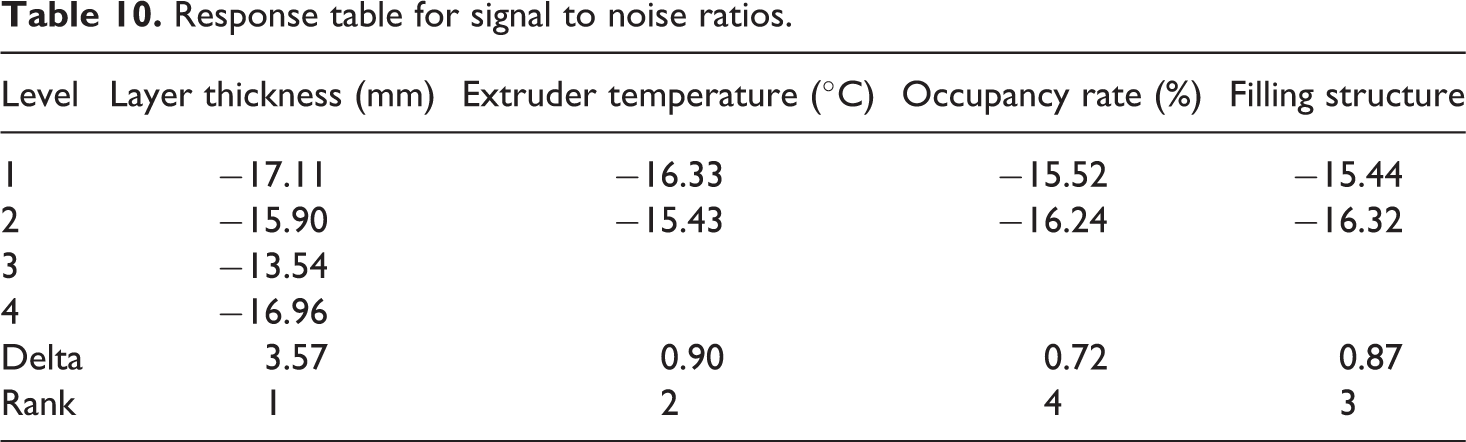
Table 10 shows that the most important factors for the elongation values were the layer thickness, occupancy rate, filling structure, and extruder temperature, respectively. The optimum elongation value for the FDM process parameter was obtained at third level (A3) of layer thickness, at second level (B2) of extruder temperature, at first level (D1) of filling structures, and at first level (C1) of occupancy rates.
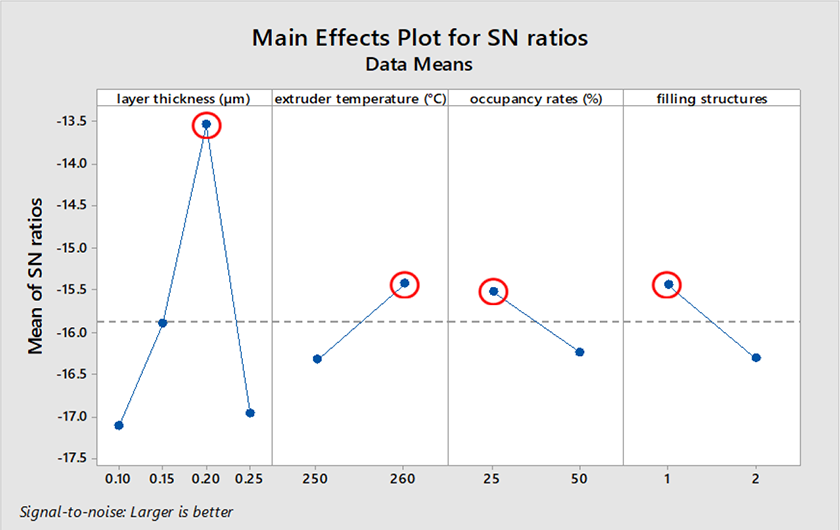
In Figure 8, the main effect plot for S/N ratios for elongation and FDM parameters were shown. The optimum elongation value of determined for the printing parameters (layer thickness, extruder temperature, filling structures, and occupancy rates) were 0.20 mm, 260°C, Full Honeycomb (1), and 25%, respectively (Table 11).
In Figure 9, surface plot graphs of elongation values were given. In the probability plot graph (Figure 10), as the layer thickness and occupancy rates increased, the elongation values decreased proportionally. 26–30
Surface plot of elongation values.
Probability plot.
The effects of layer thickness, extruder temperature, filling structure, and occupancy rate parameters, which are the most effective on elongation values, are given in the surface plot graph proportionally. As observed from the surface graphics, the contribution of parameters is mutually compared.
Figure 10 shows the strength values corresponding to the normal distribution percentages of the tensile strength values obtained from the test samples produced according to the selected parameters. In addition, the distribution close to the middle axis indicates that the established experimental order is balanced.
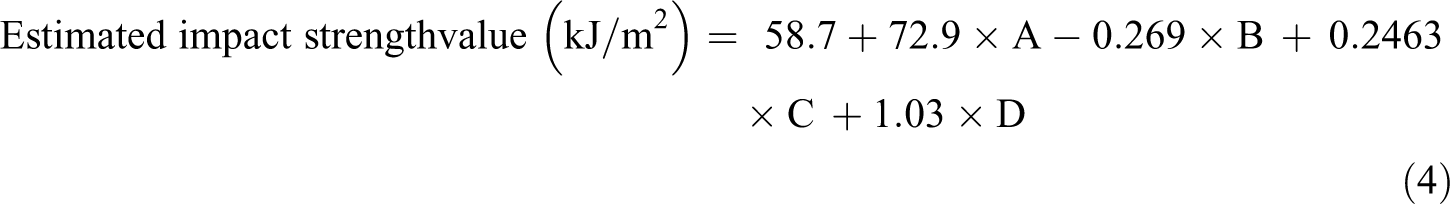
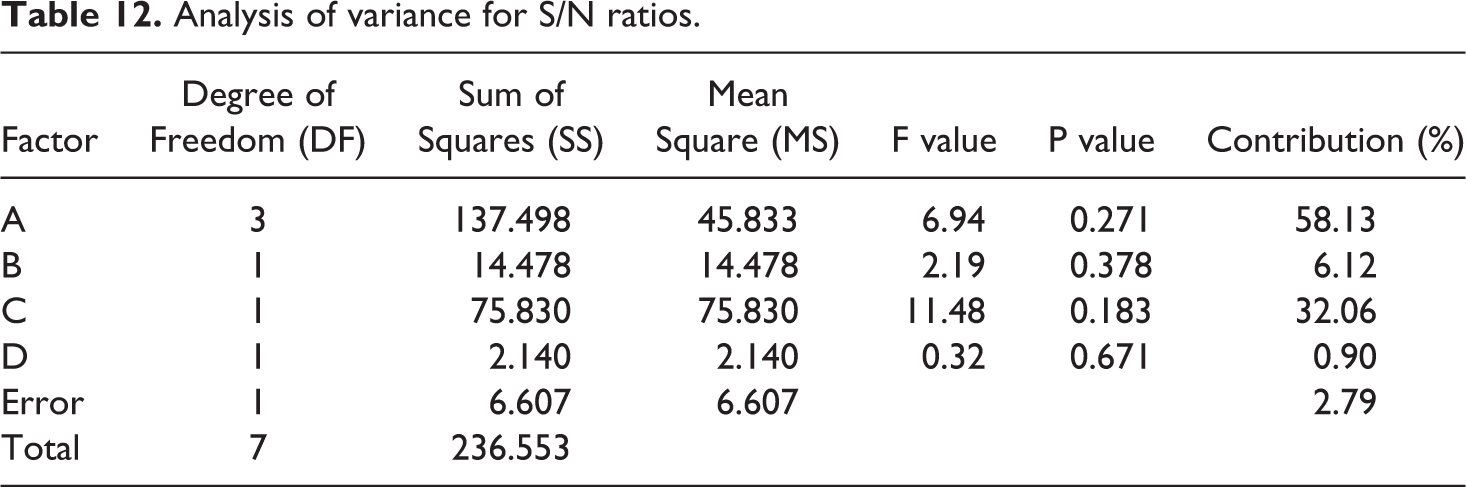
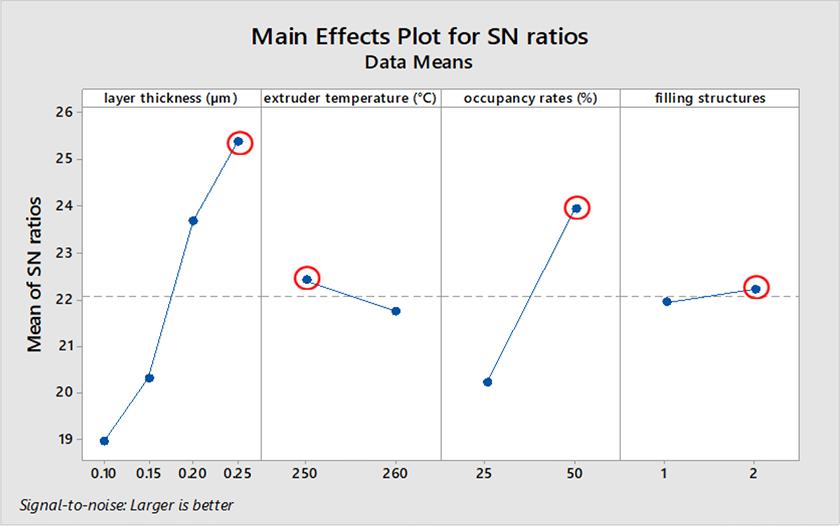
ANOVA results were given in Table 12. According to the ANOVA results, layer thickness was statistically significant. The main effect plot for the effects and levels of the parameters is shown in Figure 11. It is desired to have high mechanical properties. The optimized process parameters and their corresponding order obtained from Taguchi analysis are shown in Tables 13 and 14. Linear Regression Equation is given in (4) for estimation of impact strength value. Effect on the impact strength values, the layer thickness parameter is 58.13% and the occupancy rate is 32.06%. The effect of other parameters on impact strength values is negligible.
Analysis of variance for S/N ratios.
S/N rates for impact strength values.
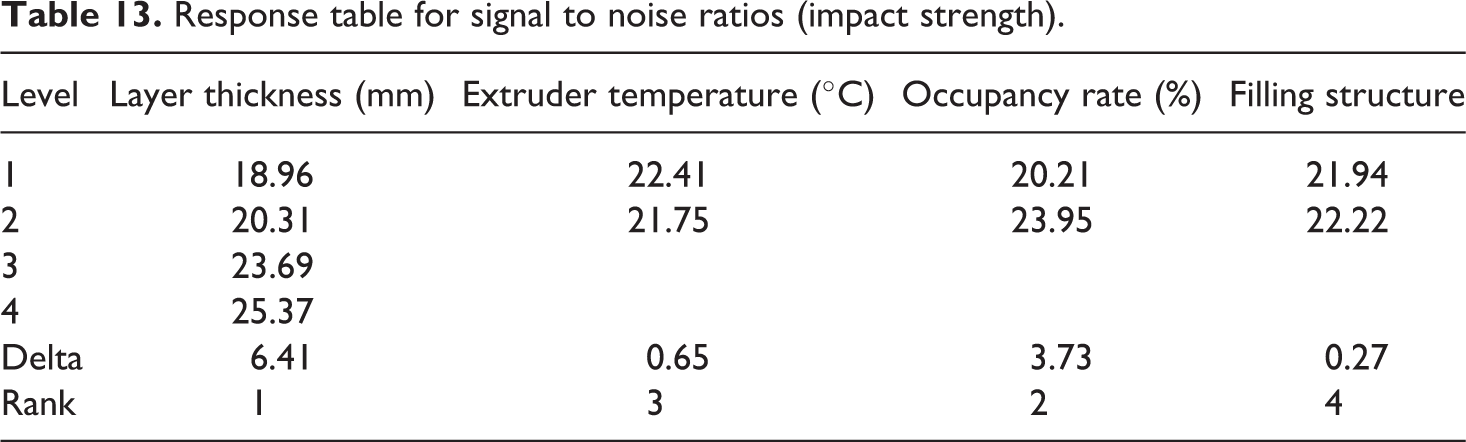
Response table for signal to noise ratios (impact strength).
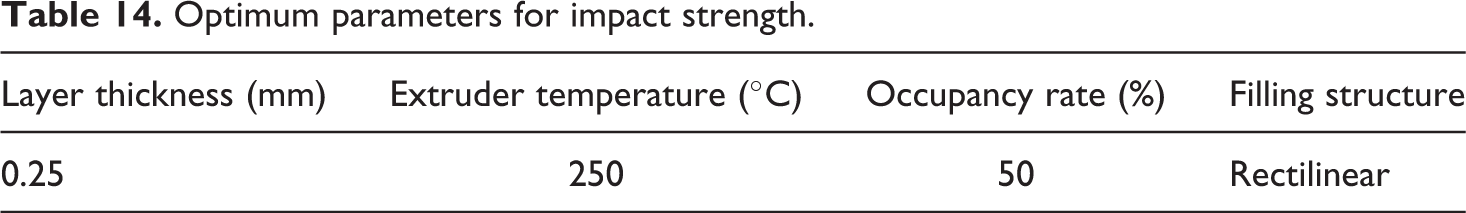
Optimum parameters for impact strength.
In Equation (4), A, B, C values can be selected in numerical values as mm, degree,% respectively; The number D should only be used as 1 for the full honeycomb form of filling and 2 for the rectilinear form of filling.
The results obtained from impact strength value were confirmed by the ANOVA (Table 12). Table 13 shows that the most important factors for the mechanical properties (impact strength values) were the layer thickness, occupancy rates, extruder temperature, and filling structures, respectively. The optimum impact strength value for the FDM parameter using PA12 filament was obtained at fourth level (A4) of layer thickness, first level (C2) of occupancy rate, first level (B1) of extruder temperature, and second level (D2) of filling structure.
In Figure 11, the main effect plot for S/N ratios for impact strength values and FDM parameters were shown. The optimum impact strength value for process parameters (layer thickness, occupancy rates, extruder temperature, and filling structures) were determined as 0.25 mm, 50%, 250°C, and Rectilinear (2), respectively (Table 14).
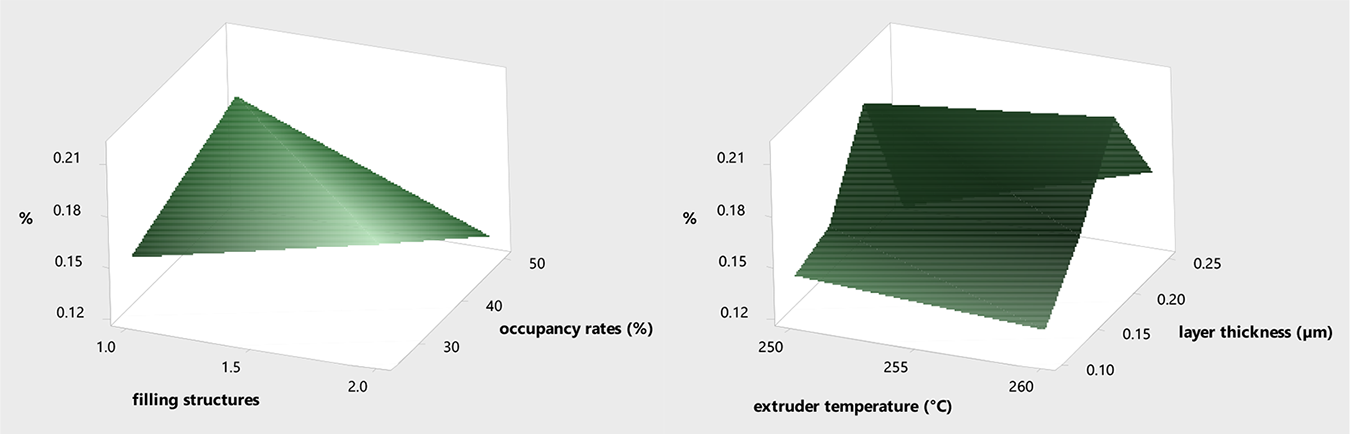
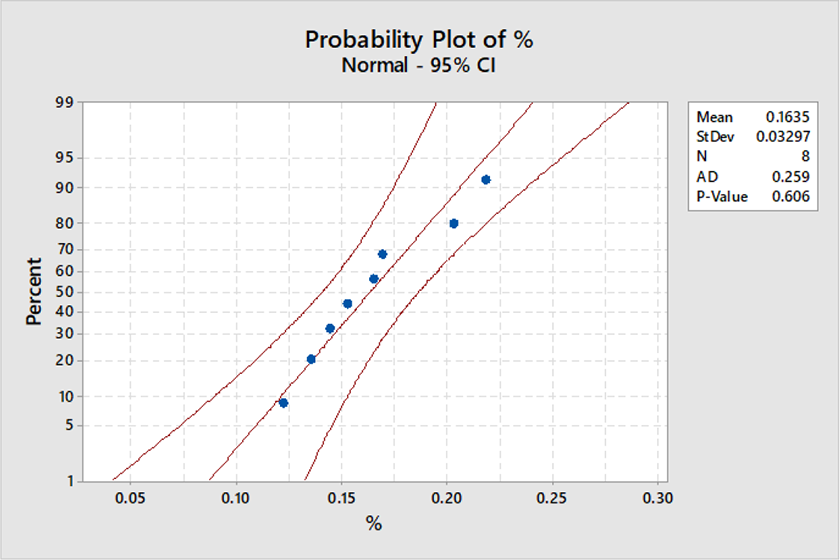
In Figure 12, surface plot graphs of impact strength values were given. In the probability plot graph (Figure 13), as the layer thickness and occupancy rates increased, the impact strength values increased proportionally. Other parameters (filling structures and extruder temperature) a little improved to impact strength values.26–30
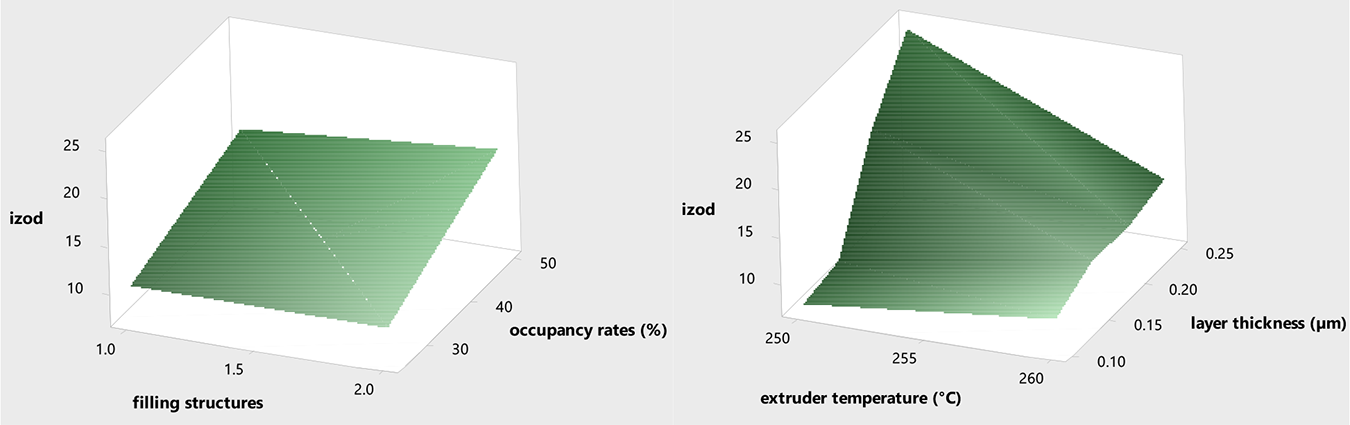
Surface plot of impact strength.
Probability plot.
The effects of layer thickness, extruder temperatures filling structures and occupancy rate parameters, which are the most effective on impact strength values, are given in the surface plot graph proportionally. As observed from the surface graphics, the contribution of parameters is mutually compared.
Figure 13 shows the strength values corresponding to the normal distribution percentages of the tensile strength values obtained from the test samples produced according to the selected parameters. In addition, the distribution close to the middle axis indicates that the established experimental order is balanced.
Figure 14 shows the damages of samples after tensile tests. It can be shown that layer thickness is the most important process parameters for elongation rates (%). The damage images were taken to convey the angle of fracture and the plastic deformation at the fracture zone of the material, and no zoom or scaling was used. A dino-lite digital camera was used as a camera. It has 5 mp resolutions, with a numerical aperture in the range of ∼0.05 – 0.3.
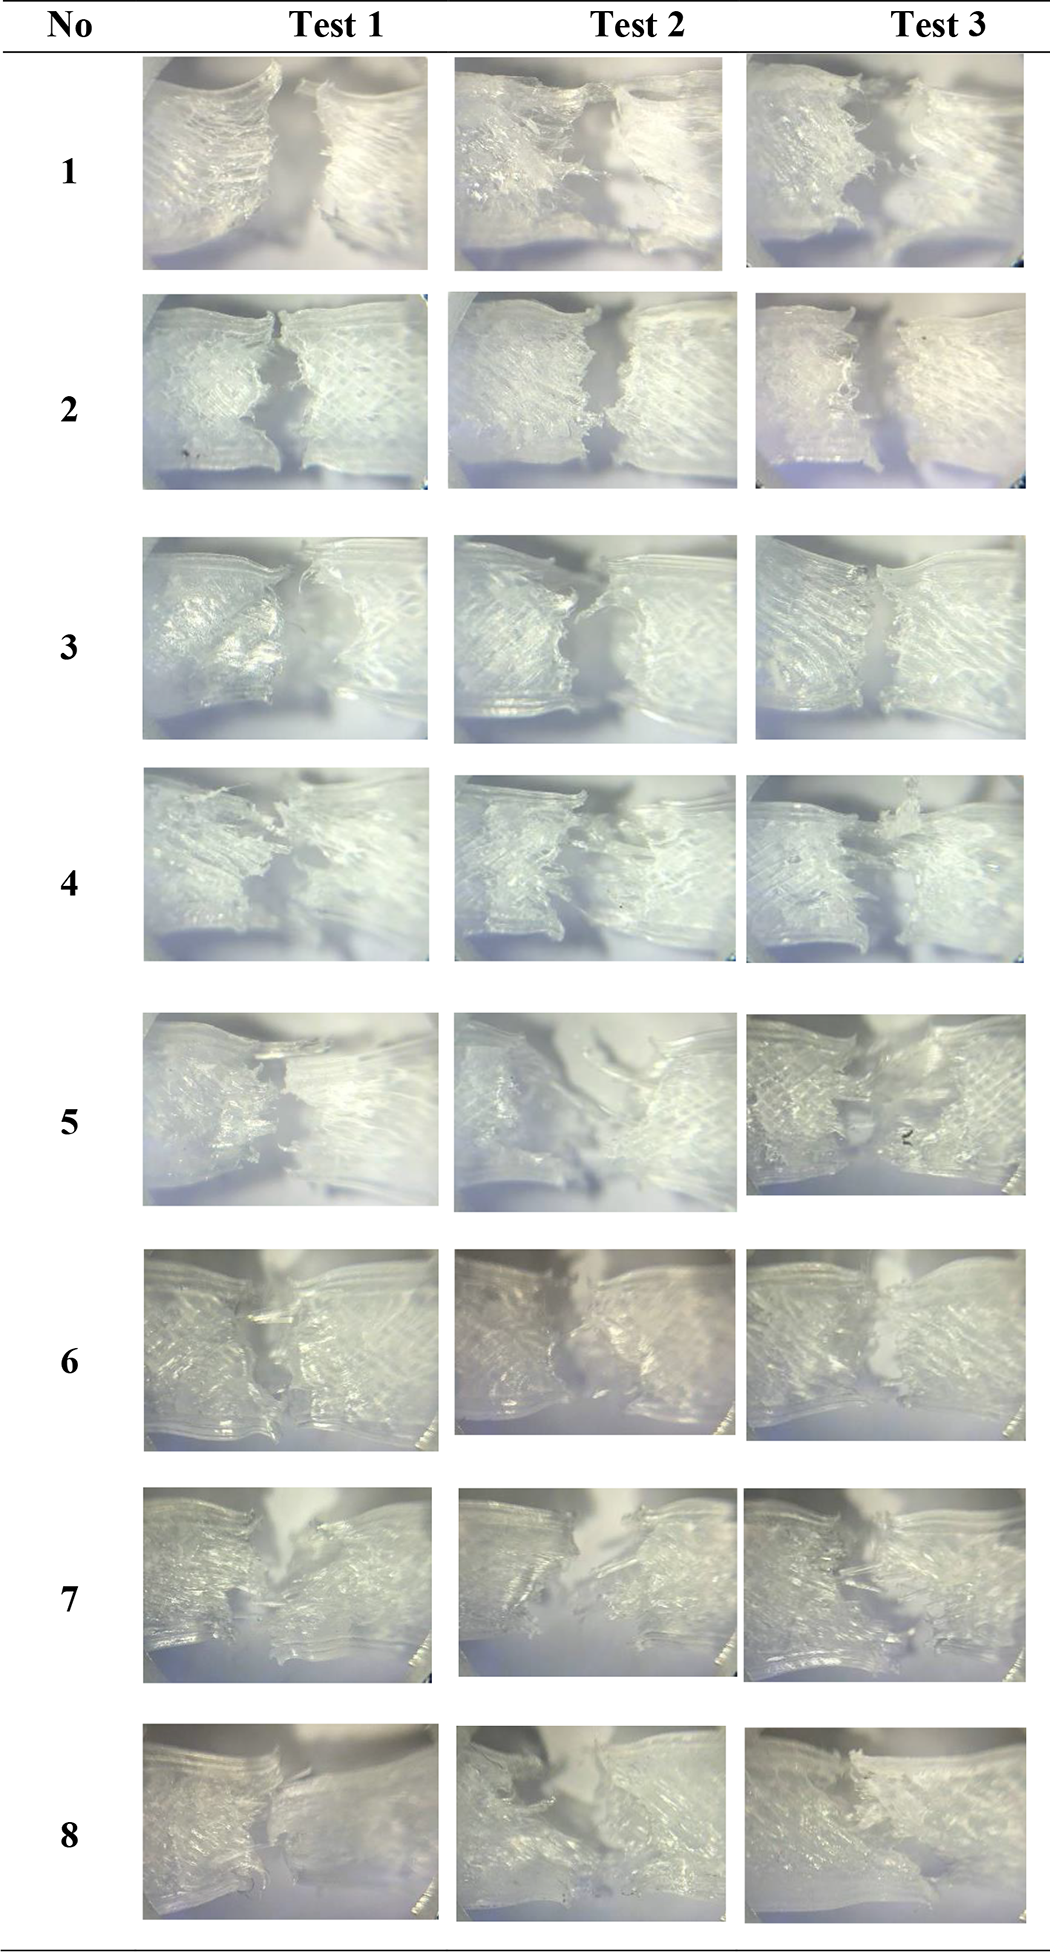
Picture of samples after breaking in tensile tests.
Other parameters (occupancy rates, filling structures, and extruder temperatures) have affected damages less than layer thickness. And also, it can be seen that the layer thickness has inverse proportion with elongation rate. Layer thickness as the most influential parameter on mechanical properties was observed as the main result of the study. Mechanical properties for PA12 material generally increase with increasing layer thickness. This is because it has higher extrusion temperature compared to other thermoplastic filament materials and melt flow properties can be shown.
Conclusion
In this experimental and statistical study, tests were carried out at the levels determined for process parameters such as layer thickness, extruder temperature, occupancy rate, and filling structure, which are selected as FDM process parameters, and the effects on the mechanical properties were statistically investigated with the help of these experimental results. The following results can be drawn from the tests obtained within the limits specified in this study; ➢ The process parameters (layer thickness, occupancy rates, filling structures and extruder temperature) for optimum tensile strength were found as 0.25 mm, 50%, Rectilinear, and 250°C, respectively. ➢ The process parameters (layer thickness, occupancy rates, filling structures and extruder temperature) for optimum elongation were found as 0.20 mm, 260°C, Full Honeycomb, and 25%, respectively. ➢ The process parameters (layer thickness, occupancy rates, filling structures and extruder temperature) for optimum impact strength were found as 0.25 mm, 50%, 250°C, and Rectilinear, respectively. However, these parameter levels may be not applied to other environment, materials, and devices. ➢ It was found that the most effective parameter for improving the mechanical properties is as layer thickness. It can be seen that layer thickness is the most important process parameters for elongation rate. Layer thickness parameter has inverse proportion with elongation. ➢ It can be said that the developed regression model is sufficient and safe for the prediction of mechanical properties due to higher confidence value. ➢ PA12 filament material can be used to printing for sleeve bearing due to their mechanical properties. It can be used in the production of many machine parts and component due to its tensile strength, impact strength resistance, and damping properties.