
Abstract
This study aims at developing the screen-printed sensors as a viable means of depositing sensing tracks on composites for their on-line structural health monitoring. Conventional silk screen was employed in order to deposit a nano-composite solution comprising of a conductive nano-filler (carbon nano-particles) dispersed in a thermoplastic matrix (high density polystyrene) on laminated composite specimens. The solution was deposited using a squeegee and was allowed to dry. Commercially available metal foil strain gauges were also bonded alongside screen-printed sensor in order to compare the response of the screen-printed sensors with the commercially available strain gauges. The sensing ability of these screen-printed sensors was tested on a universal testing machine (MTS 810) in four-point bending configuration using a load cell of 100 kN. The sensor deposited using screen-printing technique underwent tensile loading at the lower side of the laminate. A data linearization and amplification module comprising of commercially available instrumentation amplifier (INA 118) was used in conjunction with data acquisition module (Keithley KUSB 3100). The results obtained show that the screen-printed sensors have higher gauge factors in tensile loading scenario with reasonably linear response as compared to traditional metal foil strain gauges. The ease of the deposition of a nano-composite solution via screen printing also makes the technique a viable alternative to the traditional resin bonded metal foil strain gauges which have to be bonded on the surface. Moreover, screen printing offers unlimited options for the development of smart composites in various configurations for a multitude of structural applications.
Introduction
Nondestructive evaluation (NDE) techniques have been developed for advanced composite structures in order to keep them operating safely and reliably. These techniques include ultrasonic scanning, acoustic emission (AE), shearography, stimulated infrared thermography (SIT) and vibration testing etc. 1 These technologies, although well established and mature, are difficult to adapt for in-situ implementation during on-line monitoring of structures.
Various sensing mechanisms should thus be explored for integration during the manufacturing phase of different structural components so as to reduce the manufacturing cost and resulting monitoring system. The new sensor integration scheme should also be easy to incorporate in traditional manufacturing process and should have minimal effect on the cost, duration and manpower requirements of the manufacturing cycle.
Composite materials, because of their heterogeneous nature and possibility of designing a vast array of properties such as very high specific modulus and strength, tailoring of near zero thermal expansion coefficient and adoption of innovative production techniques and formability into complex shapes are an interesting choice not only for structural components but also for the sensors. One emerging trend in composites is that of rendering the composites intelligent and self-sensing by incorporation of suitable sensor networks. This paradigm of making composite structures intelligent and constant on-line damage diagnosis and prognosis regimes has much in common with human body and is termed as structural health monitoring. Such an approach helps detect onset of damage and mapping stress-strain history of critical composite structural components such as aircraft fuselage and wings. Moreover, need of heavy and often incompatible extraneous sensors is eliminated. The advent of self-sensing smart composite structural parts will eventually reduce reliance on costly scheduled maintenance and condition monitoring as the aircraft has to remain out of service for the programmed maintenance/monitoring.
In carbon fiber reinforced plastics (CFRPs) the conductive carbon fiber tows and insulative matrix form conductive percolation networks. Fiber fractures and delaminations inevitably result in the alterations in these conductive networks. Therefore, measuring changes in global electrical resistance of the composite structure gives valuable information about the onset of damages which may compromise safety and integrity of the structure. A.C. and D.C. electrical properties were analyzed by Abry et al. for the detection of in-situ damage in carbon fiber reinforced plastics (CFRPs).2,3 The electrical resistance and capacitance were monitored under monotonic test conditions for cross-ply laminates. The onset of damage and related void creations and alterations in percolation networks allowed mapping of damage initiation. These percolation networks only exist in CFRPs because of high conductivity associated with carbon fibers which are impregnated by highly insulative thermoset matrix. For the same reason matrix dominated failure modes may go undetected.
Metal foil strain gauges are used to monitor strains in the structures they are attached to. These gauges comprise of a metallic pattern on an insulative polymeric backing film. A stretching force applied within the elastic limits reduces the cross-sectional area of the patterned resistor, thereby increasing its electrical resistance. Alternatively, a compressive force which precludes buckling will tend to increase cross-sectional area with an accompanying shortening of the sensing pattern. This results in a decrease in its electrical resistance. Therefore, in metal foil strain gauges, the change in electrical resistance with applied strain is only dependent on the conductor geometry. This results in lower gauge factor (sensitivity) of around 2. 4 Their gauge factors are not only low; these gauges can only be attached to the surface, thereby allowing deformation features such as matrix cracking, splitting and delaminations to go undetected. Semi-conductor strain gauges have been reported with improved sensitivities. AS Mohammed et al. fabricated MEMS based miniaturized strain microsensor from doped single crystal silicon. 5 They integrated the sensor along with its circuitry on a single chip. The authors have reported exceptionally high gauge factor of ∼140, high absolute resolution (1 µε) and low power consumption (100 µA) with a maximum range of ±4000 µε. The sensor was found to work in temperature ranges spanning from −50°C to +50°C. Polycrystalline silicon has also been exploited for the manufacturing of strain gauges using micro-fabrication techniques. 6 Maximum gauge factors reported were of the order of 14.1 with an intrinsic resolution of 30 nano strain.
A promising approach used to incorporate sensitivity in composite structures for their health monitoring appears to be that involving networks of nano-fillers as they offer higher gauge factors and are compatible with composites manufacturing process since the fillers can be added in the matrix during manufacturing. When the concentration of these fillers is maintained at a critical threshold known as the percolation threshold the resulting composite does not only show piezoresistivity but is also highly sensitive to applied strain. The conductivity in the composites at the percolation threshold is dictated by the “Tunnel effect” whereby the electron “tunnels” through the insulative barrier between two conductive particles even if the potential barrier is greater than the kinetic energy of the electron. 7 For nano-composites the tunnel effect ensures high gauge factors at relatively low volume fractions of the filler material. 8
Various types of fillers including carbonaceous nano-fillers having so called 0D, 1D and 2D geometries have been thoroughly investigated owing to their high conductivities and elevated specific mechanical properties. Among 0D geometries carbon nano-particles have been extensively used to enhance U.V stability,9–12 endowing anti-static properties, 13 for making composite sensors,14,15 making conductive films 16–18 and reinforcing polymeric matrix materials.19–21 Because of their high aspect ratios in addition to very high moduli and strength properties 1D geometries such as single walled and multi-walled carbon nanotubes have been employed to improve specific modulus and strength of polymeric matrices.22,23 CNTs have also been incorporated in polymeric matrices to serve as conductive fillers in order to make nano-composite sensors by maintaining the CNT concentrations at the percolation threshold. These randomly dispersed conductive nano-fillers allow monitoring the state of structural integrity and damage detection as the conductive nerve like networks are perturbed with strain resulting in more or less linear variation in electrical resistance with strain.24–27 Carbon nanotube networks have been found to be especially sensitive to initial matrix dominated failure modes such as matrix micro cracking, splitting and delaminations.28–30 Graphene nano-platelets having flat 2D geometries have also been investigated for applications where their exceptional mechanical and electrical properties are exploited.31–34
A range of fabrication methods have been cited in the literature for the fabrication of sensors. Table 1 reproduces key features of some of these as an example.
Summary of some sensor configurations found in the literature.

In light of the above research cited in the area of nano sensors and structural health monitoring, it is evident that a multidisciplinary research approach needs to be developed for a viable structural health monitoring system for composites by adopting the most suitable nano-fillers and a fabrication process that would deposit strain sensing networks at low cost and high consistency. The present study aims at doing just that by using a simple and cost effective sensor fabrication process together with a data acquisition, archival and presentation system.
Materials and methods
Smart nano-composite
High density polystyrene was used for the synthesis of conductive polymer composite “CPC” as matrix material. Carbon nano-particles supplied by Degussa with an average diameter of 25 nm were used as the conductive filler for loading into the matrix.
The concentration of carbon nano-particles was maintained at 35% wt. This concentration lies in the percolation threshold found for these particles through extensive investigations reported elsewhere.15,43–47
Polystyrene was weighed and heated in a vacuum oven in order to remove moisture. Requisite amount of carbon nano-particles were also weighed and added to nitro benzene. The mixture was subjected to sonication for half an hour in order to achieve uniform dispersion of the nano-particles in the solvent. The dispersion was then subjected to magnetic stirring and polystyrene was added gradually to the dispersion in tandem with continuous stirring. After the addition of the polystyrene the hot plate was set to a temperature of 70°C with continuous stirring for 24 hours. This ensured homogeneous solvation of polystyrene in nitro benzene. After 24 hours the solution was again subjected to sonication for 2 hours in order to ensure uniform dispersion of nano-particles in the polystyrene solution.
Fabrication of laminated composites
Interglas 92125 plain woven glass filament fabric provided by Swiss Composites was used as the reinforcement in conjunction with epoxy resin Araldite LY5052 and accompanying hardener Aradur 5052 provided by HUNTSMAN as the matrix material. Eight layers of the reinforcement were laid on top of one another in cross-ply configuration so that the final composite was symmetric; [0/90/0/90]s. Manufacturing process employed for resin impregnation was selected to be VARTM (vacuum assisted resin transfer molding) for its ease of implementation at small scales, low cost and reasonably low porosity in the final composite products. Schematic diagram of a typical VARTM setup is shown in Figure 1.
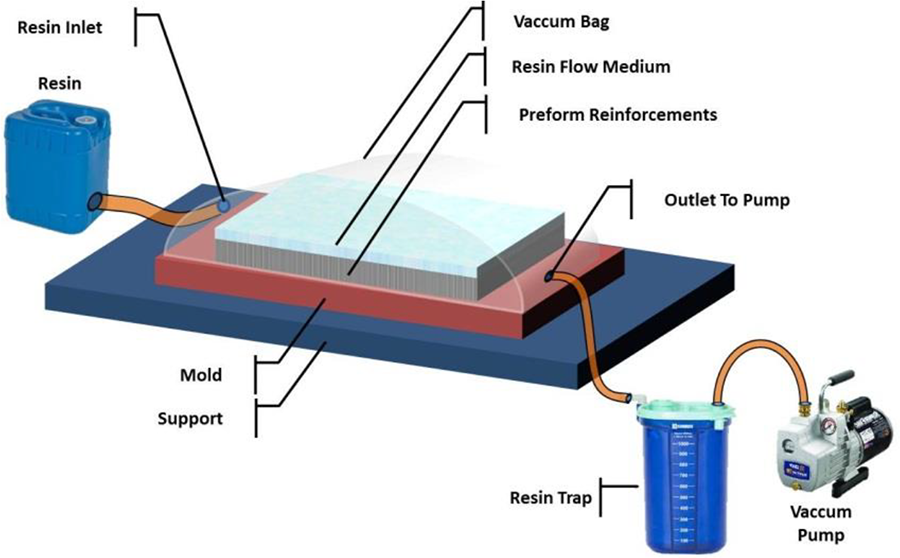
Schematic diagram of VARTM setup.
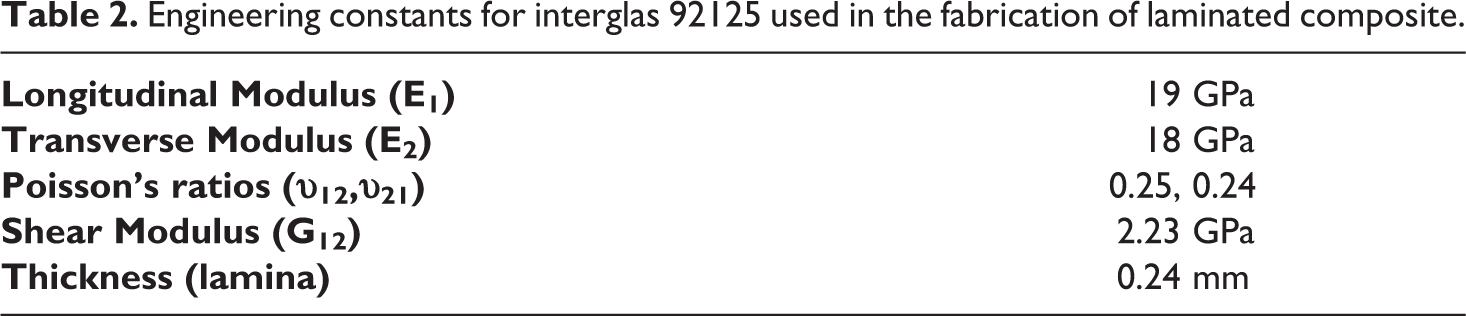
Engineering constants for the reinforcement are given in Table 2.
Engineering constants for interglas 92125 used in the fabrication of laminated composite.
The laminated composite sheet was cured at room temperature for 24 hours and then subjected to post curing at 80°C for 6 hours. The completely cured composite laminate sheet was cut into four specimens each of 25 cm × 2.5 cm × 1.9 cm dimensions with the help of Metacut supplied by Metkon industries.
Screen-printing process
Screen-printing process was selected to deposit the sensing pattern on the laminated composite specimens once they were cured. A polyester screen with a mesh size of 100 T was employed. The “CPC” solution was poured on the screen and was deposited using the squeegee which helped smear the “CPC” solution on the laminated composite specimen. The coated layer was dried with the help of a hand-held hot air blower. Three layers having a rectangular pattern of 5 cm × 0.5 cm were deposited on top of one another using the process described above in order to achieve a reasonably low resistance that could be measured and monitored with the help of data acquisition system described in the next section. The schematics of a typical screen-printing setup are shown in Figure 2.
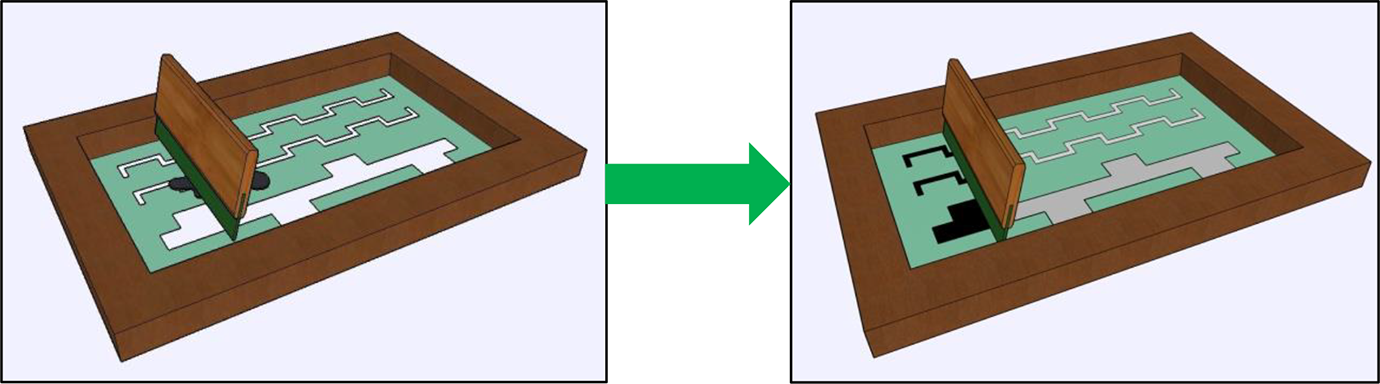
Illustration of screen-printing process.
Data acquisition and linearization
A schematic diagram of the data acquisition system is shown in Figure 3.
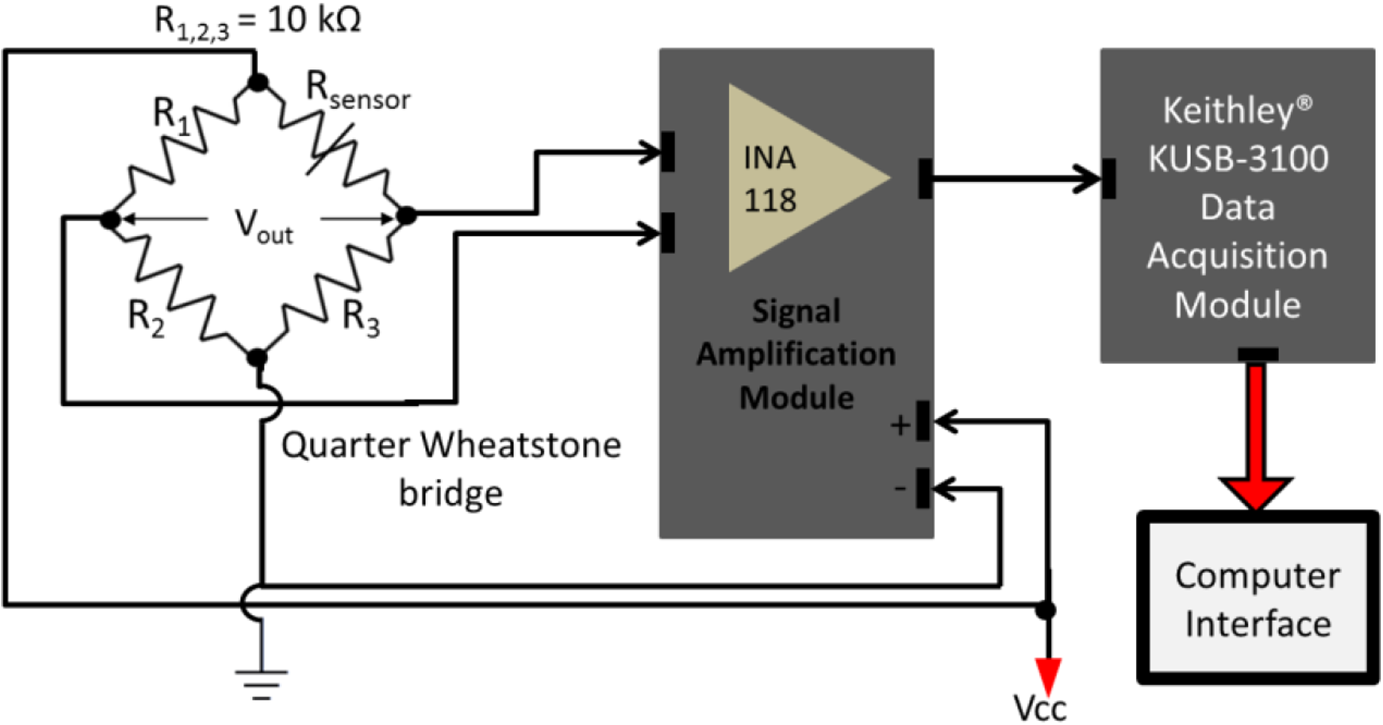
Schematic diagram of data acquisition system employed for data acquisition, linearization and amplification.
An ADC (Analog to Digital Converter), KUSB 3100, supplied by Keithley was used for the purpose of data acquisition. KUSB 3100 allows data logging in real time to a computer for in-situ monitoring, storage and manipulation. A data amplification circuit comprising of instrumentation amplifier INA 118 (National Instruments) and a Wheatstone bridge was also developed in order to acquire data from the screen-printed sensor during mechanical testing, amplify it and pass it on to the ADC. Low pass filters were also employed in order to reduce noise and suppress harmonics in the acquired data.
Each of the specimens was also bonded on the surface with a strain gauge provided by Tokyo Measuring Instruments Lab. The strain gauge had gauge length of 10 mm and gauge resistance of 120 Ω.
Sensor connections
The screen-printed sensing layer as well as the strain gauge were attached to thin and flexible copper wires with the help of silver conductive paint supplied by RS paints in order to minimize contact resistance. The two wires were meant to connect the screen-printed sensing layer and the strain gauge in Wheatstone bridge configuration to the data acquisition and linearization module. In this way the sensing layer resistance served as the unknown resistance in the Wheatstone bridge whereas all the other three resistors in the bridge were fixed resistors meant for bridge balancing (Quarter bridge configuration). The details of screen-printed sensing layer, bonded strain gauge and wire connections at the extremities of the sensor are shown in Figure 4.
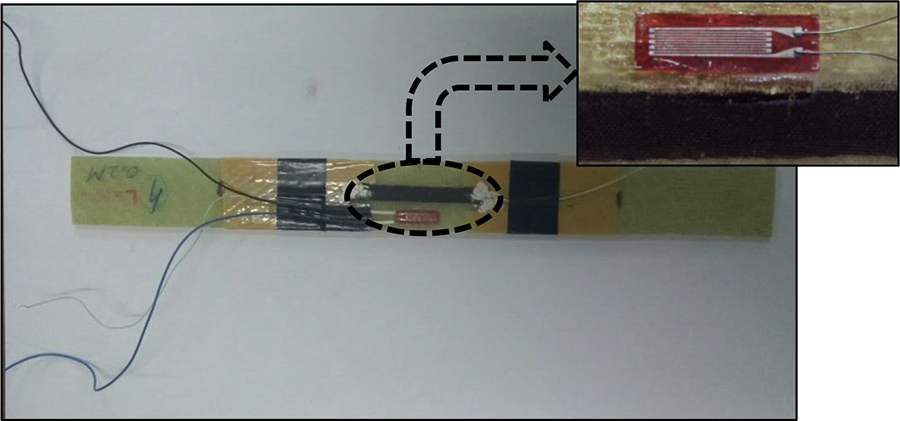
GFRP specimen with details of screen-printed sensing layer, bonded strain gauge and wire connections at the extremities of the sensor.
Results and discussion
Thermogravimetric analysis
Pristine polystyrene specimens and the nano-composite specimens “CPC” (35 wt.% CNPs + PS) were subjected to thermogravimetric analysis. The heating rate was 10oC/minute and was kept the same for all the specimens. The TGA and DTG plots are shown in Figure 5(a) and Figure 5(b) respectively.
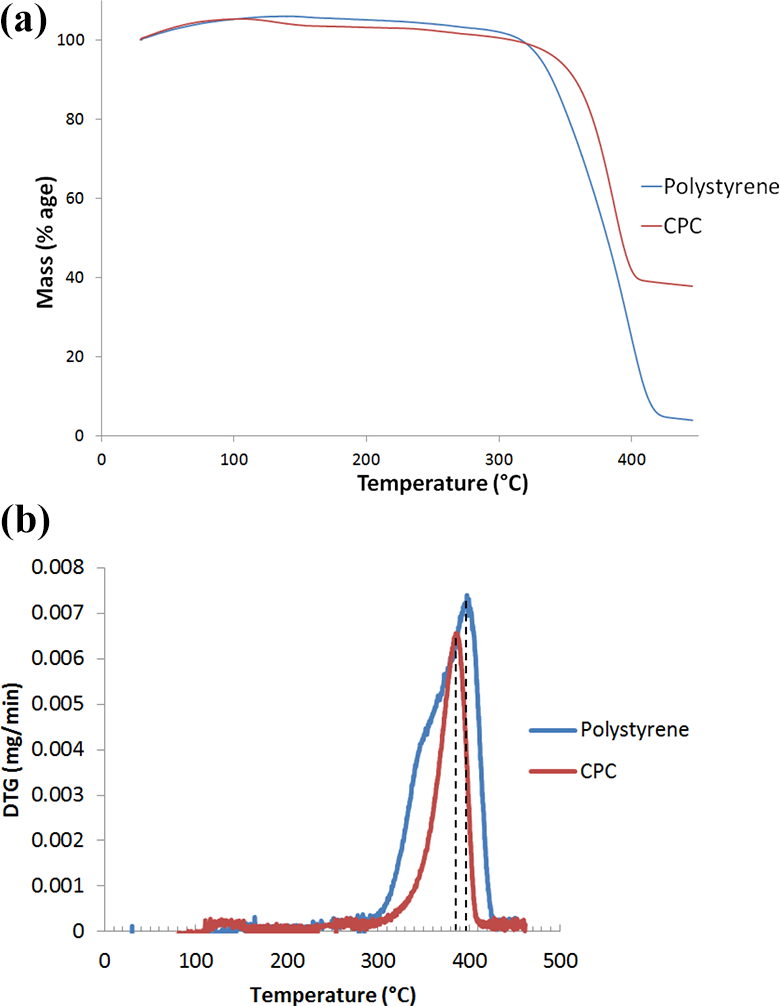
(a) TGA plots and (b) DTG plots for nano-composite specimen (35 wt.% CNPs + PS) “CPC” and for pristine polystyrene specimen at the heating rate of 10oC/min.
The results show that the nano-composite is slightly more stable thermally with higher char residue owing to the high filler loading. The initiation of degradation at around 300°C due to extensive intermolecular transfer and depolymerization causing decrease in the degree of polymerization and volatilization respectively is in agreement with the decomposition temperature of polystyrene reported in the literature. 48 When the DTG curves for polystyrene and conductive thermoplastic polymeric composite were compared, it was found that the DTG curve for polystyrene has greater area indicating that greater amount of polystyrene has decomposed as compared to the conductive polymeric composite. Slightly smaller height of the CPC peak also indicates that it is more thermally stable.
Mechanical testing
Four point bending tests were performed on a total of four specimens with the screen-printed layer and the parallel strain gauge at the underside in order to register the response of the sensor under traction. MTS 810 Material Test System was used for the purpose.
The upper rollers were kept 9.4 cm while the bottom rollers were kept 15.5 cm apart. The crosshead speed was maintained at 10 mm/min during the tests. The tests were performed until the final fracture in order to register the sensor and strain gauge response at the failure. The bending stress and strain were determined according to the ISO standard 49 (see Appendix 1).
Stress-strain response of the tested specimens is plotted in Figure 6.
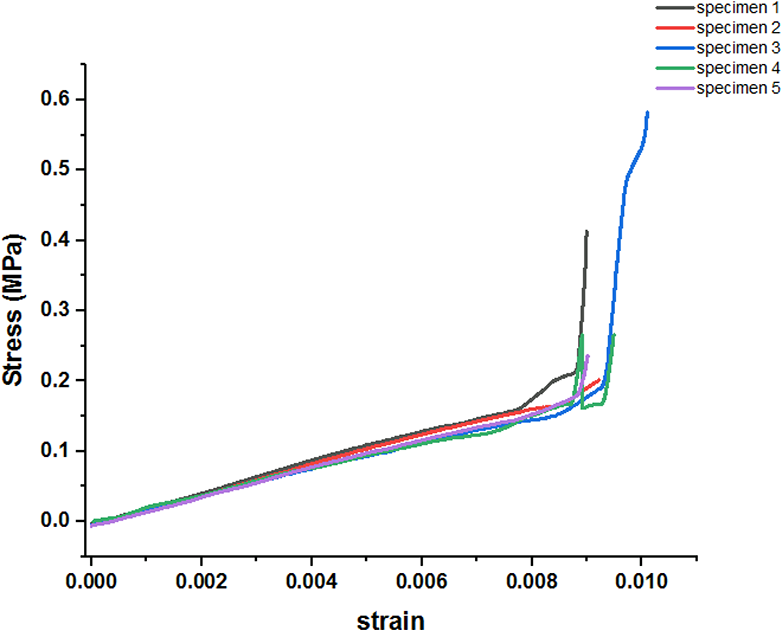
Stress-strain response of the laminated composite specimens tested in four point bending scenario on UTM (MTS 810).
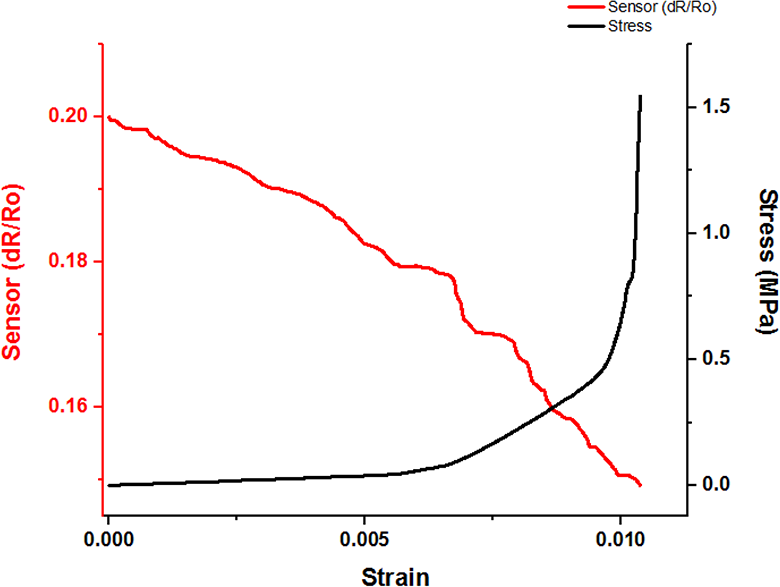
The strain gauges and screen-printed sensors were characterized by their normalized resistance response during the four-point flexural testing. The gauge factor (G.F.) is determined using the following relationship:
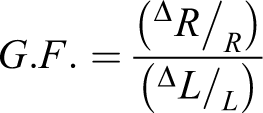
where R = Initial electrical resistance of the sensor in Ohms and L = Initial dimension of the sensor in mm.
Typical responses of strain gauge and screen-printed sensors are plotted in Figure 7(a) and Figure 7(b) respectively.
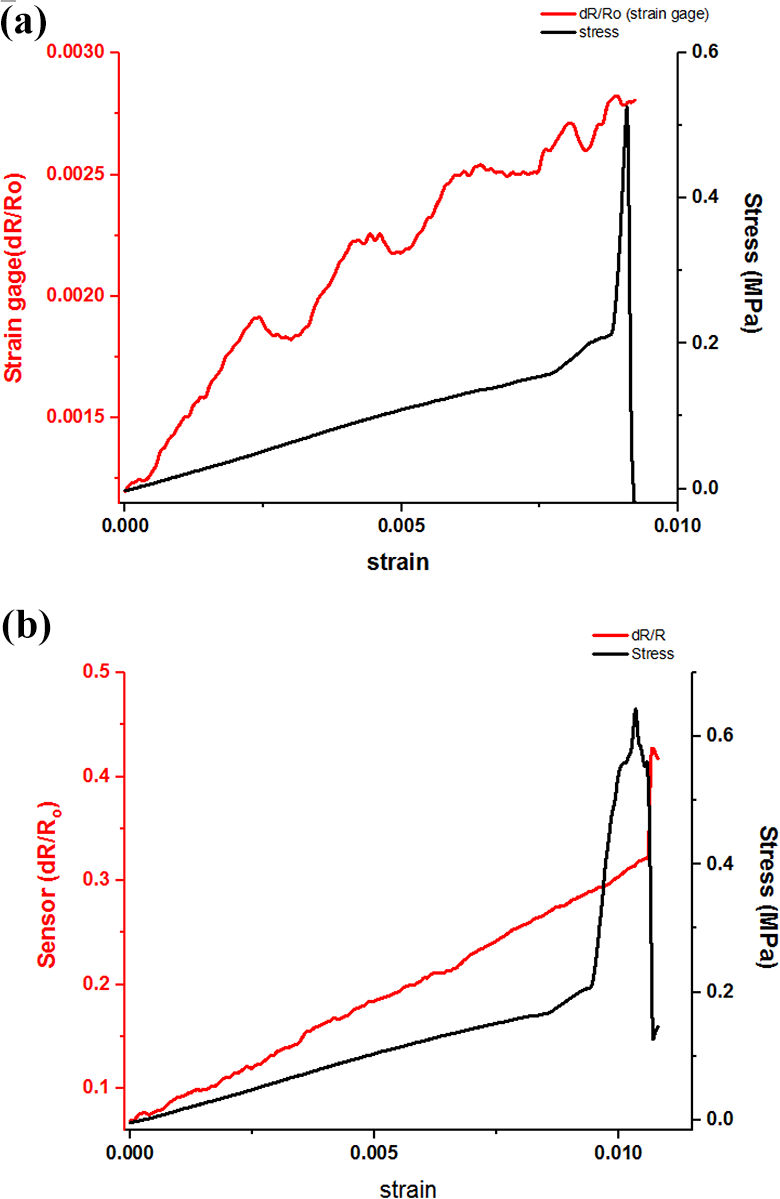
Normalized resistance and stress plots against strain for (a) strain gauge (b) screen-printed sensor printed at the bottom of composite specimens.
The screen-printed sensor not only registered a linear response but it also displayed higher gauge factor as compared to the strain gauge. It can be conjectured that failure initiates with the ply splitting in outer layers. Ply splitting is matrix dominated failure mode. With the failure of matrix in the interfacial region, the load is transferred onto the fibers. The transfer of load onto the fibers is accompanied by sharp rise in load. The load is progressively transferred onto the fibers followed by progressive failure of fibers until most of the fibers have failed and are no more available to support the load. This is depicted by the drop in load marking the failure of the composite. The normalized resistance curve continues to increase with little indication of these failure modes as the sensing pattern is only printed at the surface and is incapable of following all the failure modes due to this reason. A spike in electrical resistance with the final failure of the specimen whence the electrical resistance of the sensor jumps to infinity can only be observed in the sensor response due to the failure of the screen-printed sensing layer.
A summary of the measured average composite and sensor properties along with their respective standard deviation is given in Table 3.
Laminated composite and sensor properties.
Even though the average gauge factor registered for screen-printed sensing layer is much higher (∼ 150 times) as compared to metal foil strain gauges, higher standard deviation for screen-printed sensors signifies greater variability in its properties owing to manual nature of screen-printing process adopted in this research work.
Fractographic analysis of the smart composite specimens
Firstly, the surface of screen-printed sensing layer was analyzed prior to failure. The SEM images were obtained on MIRA3 TESCAN in the secondary electron mode (Figure 8).
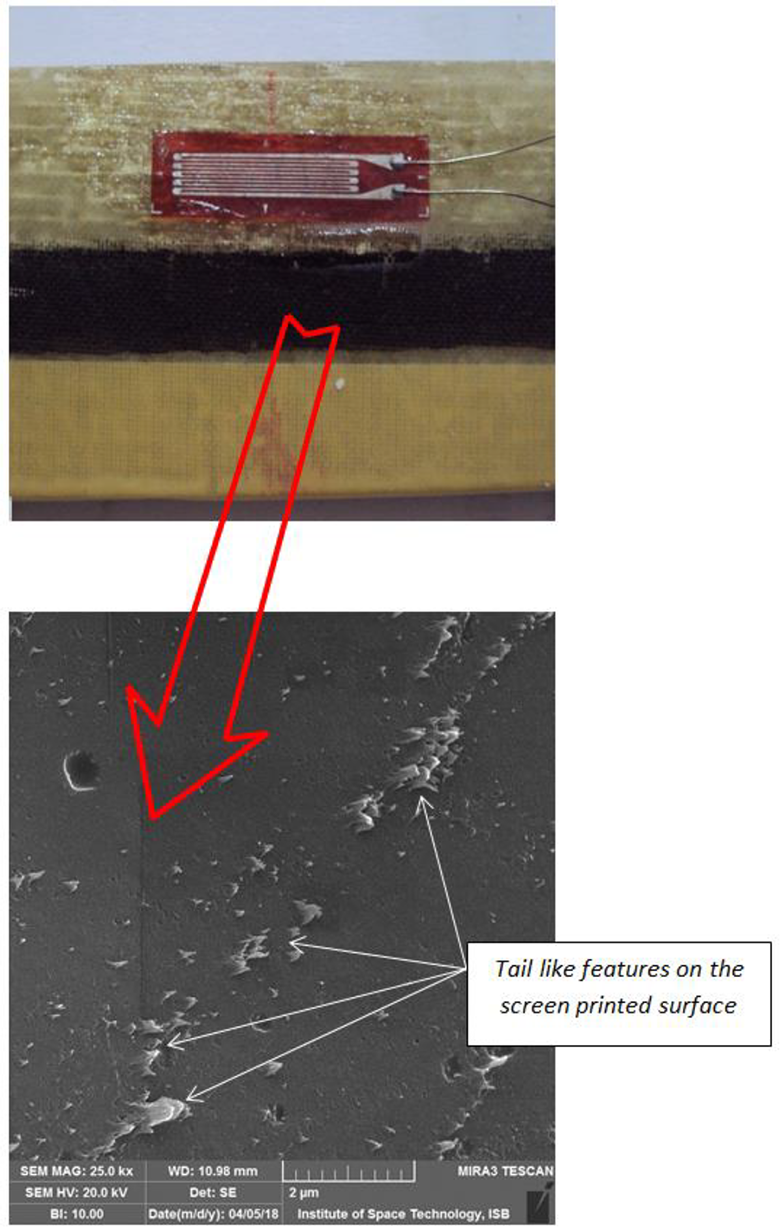
SEM image of screen-printed sensing layer surface prior to failure.
The surface of the screen-printed layer at high enough magnification (25 KX) resembles that observed during crack pinning. The reason for this particular appearance lies in the dynamics of screen-printing process. When the squeegee is swept over the CPC solution, the solution is smeared over the surface. Any inclusion in the solution at that point acts like the particles which pin the cracks in composites during their propagation. The process of screen printing whereby solution layer is smeared over the substrate is thus much like “reverse crack pinning mechanism.” The crack pinning mechanism results in local step fracture resulting in the release of local pinned points. As a result, tail like features are observed on the fracture surface. The reverse crack pinning mechanism can be thus explained as the one in which the composite layer moves over the inclusion instead of the crack moving toward the inclusion/particle. The result in both the cases is the same i.e. appearance of tail like features on the surface.
The surface of screen-printed sensing layer was then analyzed to determine failure modes in the screen-printed layer. The SEM images were again obtained on MIRA3 TESCAN in the secondary electron mode (Figure 9).
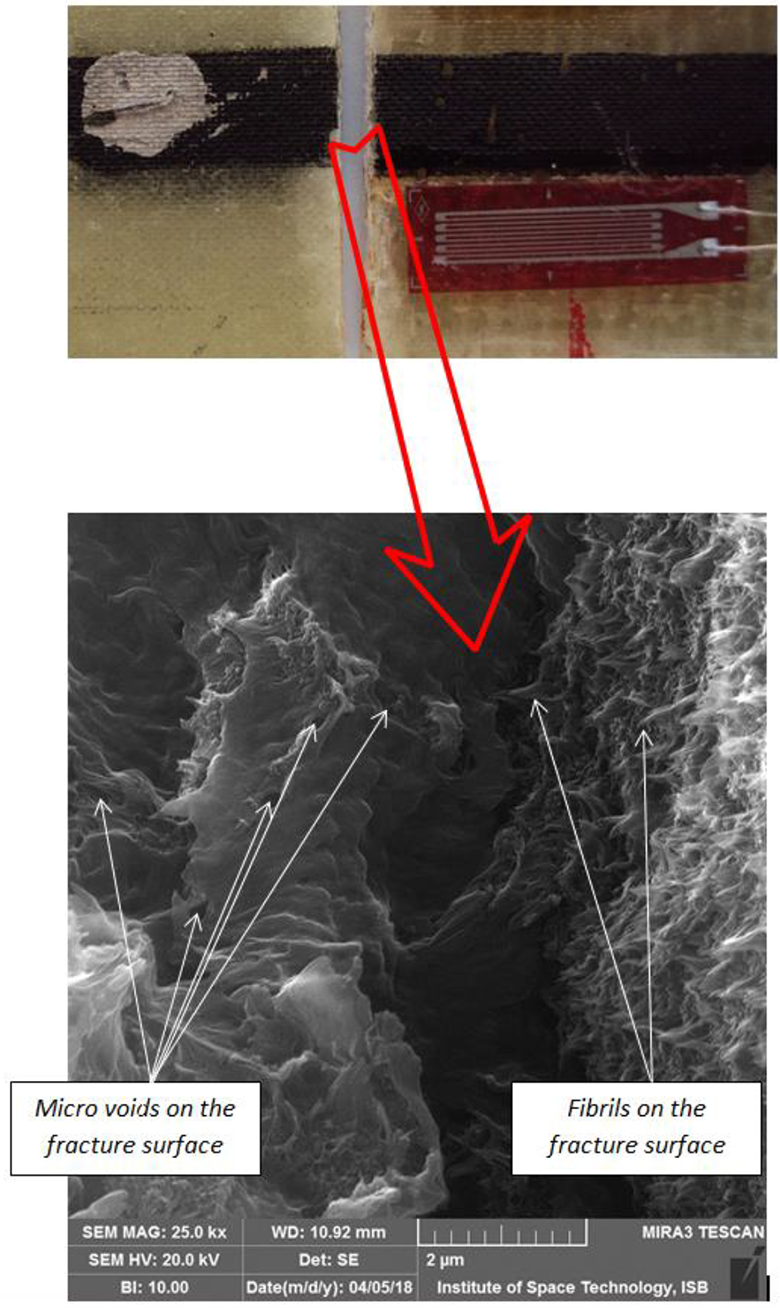
SEM images of fracture surface of screen-printed nano-composite.
The CPC layer deposited via screen printing has undergone ductile failure typical of thermoplastics owing to its inherent nature and small thickness. Complete cracking of the screen-printed thermoplastic composite (CPC) layer has resulted from crazing. Crazing causes localized plastic deformation of spherulites, formation of micro voids and fibrillar bridges which can be seen in the micrograph (Figure 9). Ultimately at the fracture load the fibrillar bridges have elongated and broken enabling crack propagation across the screen-printed layer. Even though crazing is expected to absorb fracture energy and enhance fracture toughness in the thermoplastic composites, the CPC layer has not been able to interfere with the overall brittle fracture of the composite because of its low thickness and consequently little contribution in the structural properties of the laminated composite over which it was deposited. The unique failure mechanism described earlier however results in gradual increase in electrical resistance of the CPC layer because of the progressive failure of conductive networks/percolation networks allowing continuous monitoring of the laminated substrate via monitoring of electrical resistance.
The failure analysis of the laminated composite was performed using VEGA3 TESCAN microscope. The SEM images of the surface ply of the woven laminate obtained in secondary electron mode are given in Figure 10.
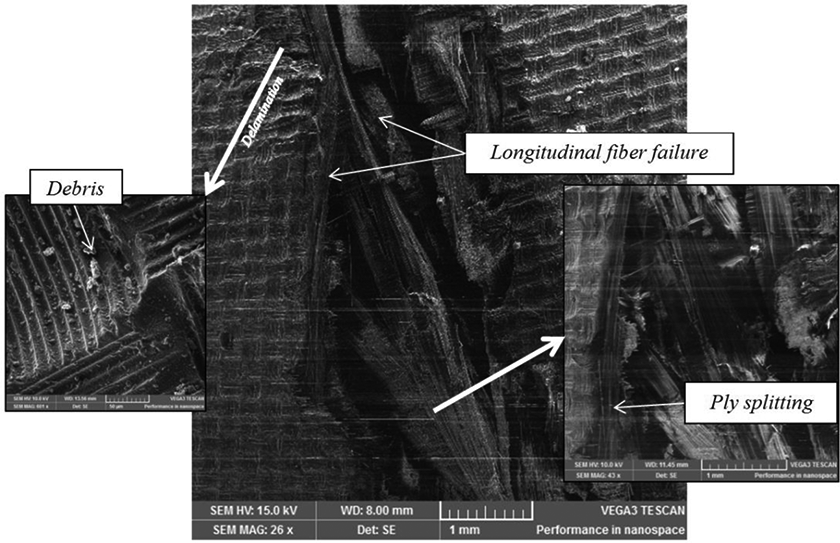
SEM images of fracture surface of laminated composite; insets show magnified regions with different failure features such as ply splitting & fiber strand failure due to tensile loading at the lower face of the specimen and delamination.
Ply splitting in the inset on the right in Figure 10 directly results from matrix microcracking which generally initiates failure. The laminated composite surface shows the features of delamination with imprints of the delaminated woven ply as shown in the inset on the left in Figure 10. Figure 10 also shows fiber strand failure in the longitudinal direction leading to final fracture of the laminated composite specimen undergoing tensile loading at the lower end of the specimen. The failure of longitudinal fibers leads to further ply splitting as well as delamination which ultimately leads to complete fracture of the laminate as the failure modes continue to propagate through the thickness of the composite.
The screen-printed sensor printed at the top of the specimen was also tested in four-point bending test configuration in order to characterize the performance of the sensor in compression. These results are shown in Figure 11. As expected the sensor resistance progressively decreased with compression as percolating nano-particles came closer with applied compression resulting in the formation of percolation networks and hence an increase in electrical conductivity.
Normalized resistance and stress plots against strain for screen-printed sensor printed on top of the composite specimen.
Conclusion
The screen-printing technique has been shown as a viable and low-cost alternative to traditional metal foil strain gauges. The implementation of this technique is rapid as well. The screen-printed patterns developed on the laminated composite specimens detect onset of damage and monitor strain with greater linearity and sensitivity (G.F. of ∼34 for screen-printed sensors against G.F. of ∼0.22 for commercial metal foil strain gauges). However higher standard deviation registered for screen-printed sensors (19.16 for screen-printed sensors against 0.021 for metal foil strain gauges) indicate the limitation of the manual screen-printing process. This short coming can be easily addressed by adopting an automated screen-printing system equipped with mechanical CPC solution deposition system and a metering device for better control of the amount of solution deposited during screen printing.
The screen printing of simple rectangular pattern was found to be feasible using the available mesh count (100 T). The printing of an intricate strain gauge using this technique generally requires the use of finer mesh counts. Given the promising results produced by screens with relatively coarse mesh counts in these preliminary studies, the use of finer mesh counts for printing of intricate sensing patterns is envisaged for future studies.
The nanoparticle based strain gauges presented in this article are composed of isotropic “CPC.” These screen-printed sensors can be conjectured to have identical properties in both the longitudinal and transverse directions. On the other hand, metallic strain gauges are anisotropic by virtue of their geometry. They have high sensitivities in the longitudinal direction whereas transverse sensitivities are low. The isotropic properties of “CPC” make the printing of these gauges easy and relatively straightforward to plan using screen printing, inkjet printing or 3D printing technologies. On the contrary, traditional metallic strain gauges have to be integrated in a particular direction with their length aligned with the direction where measurements are intended (principal loading direction).
It is expected that this technique can be used for manufacturing fully functional smart composite structures such as aircraft skins at a reasonably low cost. The thermoplastic nature of the CPC layer deposited via screen printing has resulted in various failure features such as localized plastic deformation of spherulites, formation of microvoids and fibrillar bridges typical of ductile failure in such materials. The percolation networks however keep on altering during the progressive failure of CPC layer resulting in increase in electrical resistance at high gauge factors. These features along with its non-intrusive nature of the deposited CPC layer because of smaller thickness and consequently its little contribution to the structural properties results in high fidelity sensors which follow the deformation and failure pattern of the composite laminates over which they are deposited.