
Abstract
The present work focuses on evaluating the tribological behavior of ultrahigh molecular weight polyethylene (UHMWPE) with 316L stainless steel and Ti6Al4V under dry and lubricated sliding conditions using human body fluids (synovial fluid and human serum). Eighteen trials of experiments were performed using a reciprocating sliding tribometer (pin-on-disc) at 37°C based on Taguchi’s L18 (21 × 32) array. The in-vitro experimental results revealed that UHMWPE offers better tribological performance under synovial fluid lubrication conditions irrespective of the counterface material. The optimization of the response variables (coefficient-of-friction (COF) and specific wear rate (WR)) was performed using optimization techniques (Taguchi and Grey relational analysis). It was revealed that Ti6Al4V counterface material under synovial fluid lubrication and normal load of 52 N exhibits the optimal tribological performance with UHWMPE. The contribution of process parameters on the COF and WR was evaluated using analysis of variance. It was established that load is the most significant parameter, affecting COF and WR.
Introduction
Synovial fluid present in hip and knee joint plays a vital role in activities like walking, running, and stair climbing, facilitating smooth movement, during strenuous tasks.1,2 However, the mechanism of lubrication involved during the state of rest (sleep) is transformed to boundary/mixed lubrication and hence leads to wear of joints due to starved lubrication. This continued process if persists for a long time results in osteoarthritis, thereby resulting in wear of joints.3,4 The functioning of these joints is affected due to osteoarthritis, which also leads to the reduction of their mechanical performance. Thus, to improve the functioning of the affected joints, these are replaced by artificial implants by a surgical process known as total joint replacement (TJR).5–7
The application of TJR is for the patients suffering from osteoarthritis or rheumatoid arthritis. TJR facilitates patients in relieving pain and improves the working ability of the affected joint.8–10 TJR helps these patients to recover their walking ability and get relief from pain. However, the life span of an artificial joint is approximately 15–25 years.11,12 As such, research is on to develop load-bearing biomaterials for medical implants (bone joints) having adequate biocompatibility, mechanical properties, and wear resistance.13–17 The exceptional properties of ultrahigh molecular weight polyethylene (UHMWPE) have made it an essential material for TJR, and presently, it is considered a gold standard in the orthopedic industry, making it the best material for TJR.18–26 As of now, several material tribopairs have been used in artificial implants for joint replacement. However, the most commonly used tribopair is UHMWPE spacer, which slides against a polished metallic substrate.27–35 Some researchers have used the process of gamma irradiation and surface modification on UHMWPE to improve the mechanical and wear resistance properties.36–38 Moreover, research studies have been carried on the ultrahigh molecular weight polymer matrix composites like high-density polyethylene/UHMWPE composite, zinc oxide/UHMWPE composite, and carbon nanotubes/UHMWPE composites for engineering applications.39–41 In some research studies, it has also been revealed that the control factors can also be optimized during the development and characterization of composite materials using Taguchi approach to achieve the desired results.39,42 Taguchi technique is one of the optimization methods, which has been used on a wide scale. In this technique, the design of experiments is used to analyze the significance of processing parameters affecting the performance of the materials. Taguchi approach is an effective statistical method that used to optimize the design parameters and allows to attain data in a controlled pattern. Optimal factor setting facilitates in analysis and optimization of the process, which leads in decreasing the sensitivity of performance to the source of variation.43–45
Doubtlessly, extensive literature is available on the friction and wear characteristics of biomedical implant materials, yet the studies have not been carried out on artificial implant tribopairs, such as UHWMPE/316L, UHWMPE/Ti6Al4V, and so on, under dry and lubricated conditions with human body fluids for optimization of process parameters. Therefore, this study aims at optimizing the process parameters, viz., load, counterface hardness, and testing environment for minimal friction and wear of UHWMPE against 316L and Ti6Al4V using Taguchi and Grey approach. Further, analysis of variance (ANOVA) was carried out to study the effect of process parameters on friction and wear characteristics. The morphology of the wear surfaces was studied for wear mechanism involved. The outcome from this study can be used in design and fabrication of human body implants.
Experimental details
Materials
In this study, UHMWPE was used as pins with 6 mm diameter and 8 mm height. The UHMWPE pins were further tapered to 3 mm diameter at the bottom end. The discs were prepared from 316L and Ti6Al4V rods with 24 mm diameter and 10 mm height. The material used in this study was provided by Nanoshell (USA). The chemical constituents of medical-grade Ti6Al4V and 316L used in this study are provided in Table 1.
Chemical constituents of disc materials in wt%.
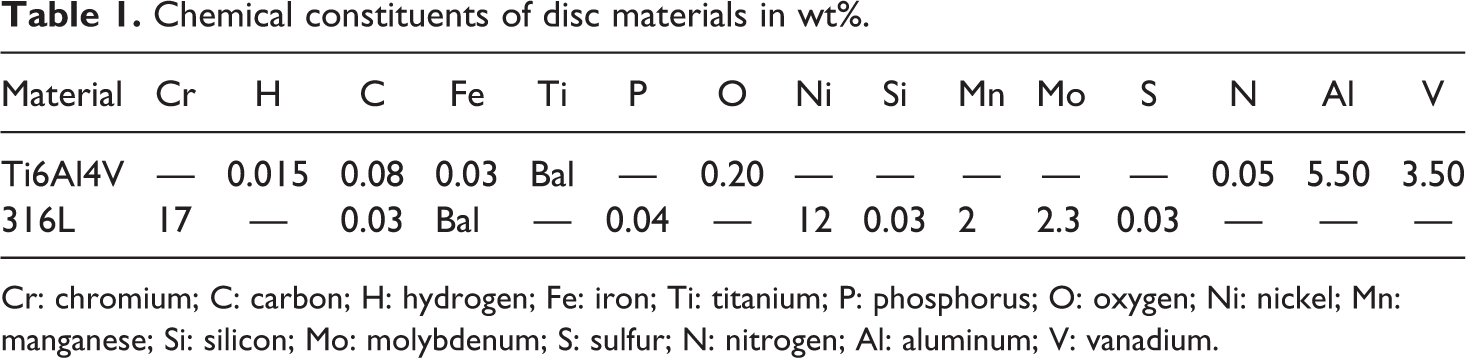
Cr: chromium; C: carbon; H: hydrogen; Fe: iron; Ti: titanium; P: phosphorus; O: oxygen; Ni: nickel; Mn: manganese; Si: silicon; Mo: molybdenum; S: sulfur; N: nitrogen; Al: aluminum; V: vanadium.
Tribological testing was carried out under (i) dry condition, (ii) synovial fluid, and (iii) human serum body fluid environments. Human serum and synovial fluid were obtained from Government hospital.
Hardness tests
Using ASTM D-2240, hardness measurements were done on UHMWPE pins on shore-D scale. According to ASTM E384-17, Vickers microhardness tester was used to carry out the hardness measurements of medical-grade 316L and Ti6Al4V. Moreover, hardness test of each sample was repeated five times and the mean of the values was obtained, as presented in Table 2.
Hardness of materials.
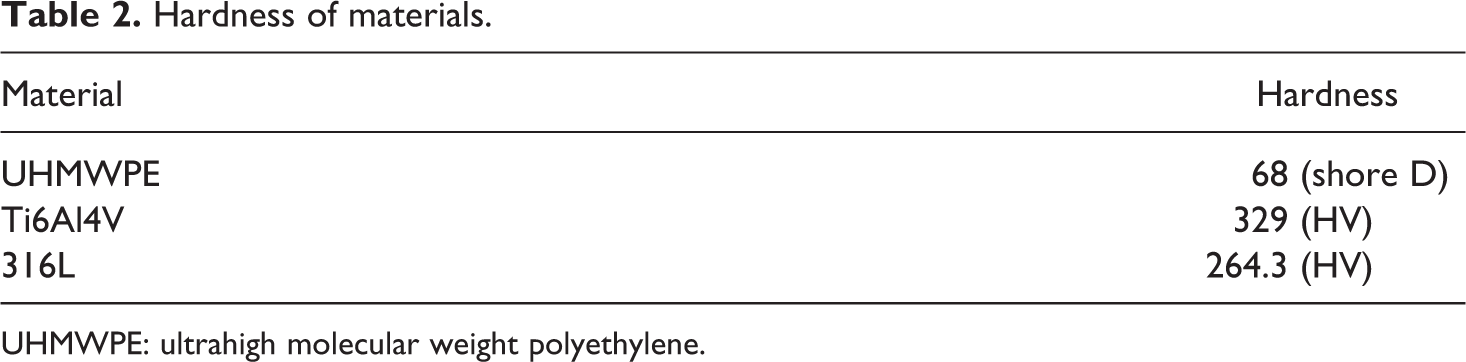
UHMWPE: ultrahigh molecular weight polyethylene.
Wear tests
A reciprocating sliding pin-on-disc (POD) tribometer was used for all wear tests in accordance to ASTM F732 practice, a specific wear test for materials used in total joint prostheses. 46 The reciprocating tribometer is shown in Figure 1 and the schematics of the disc and pin arrangement is shown in Figure 2. These experiments were performed in dry and body fluid lubrication at 37 ± 1°C. Unfilled thermoplastics like UHWMPE, the maximum pressure loading to which such materials can be subjected to 10 MPa. 47 In view of this, normal loads of 39, 46, and 52 N were chosen to develop contact pressures of 5.52, 6.51, and 7.36 MPa, respectively, for contact area of 7.068 mm2. The diameter of the pin is 3 mm. The developed contact pressures are well within the acceptable limit of 10 MPa. Therefore, the load for the tests was taken as 39, 46, and 52 N. Each test was performed for a duration of 60 min and the frequency at 5 Hz was kept constant, respectively. A stroke of 4 mm was maintained. Each test was repeated three times and the average values were reported. The POD tribometer shown in Figure 1 is connected to the computer, which is used to acquire the COF data. Each test was repeated and the average value was reported. Scanning electron microscope (SEM) is used for conducting the morphological examinations of the wear surfaces.
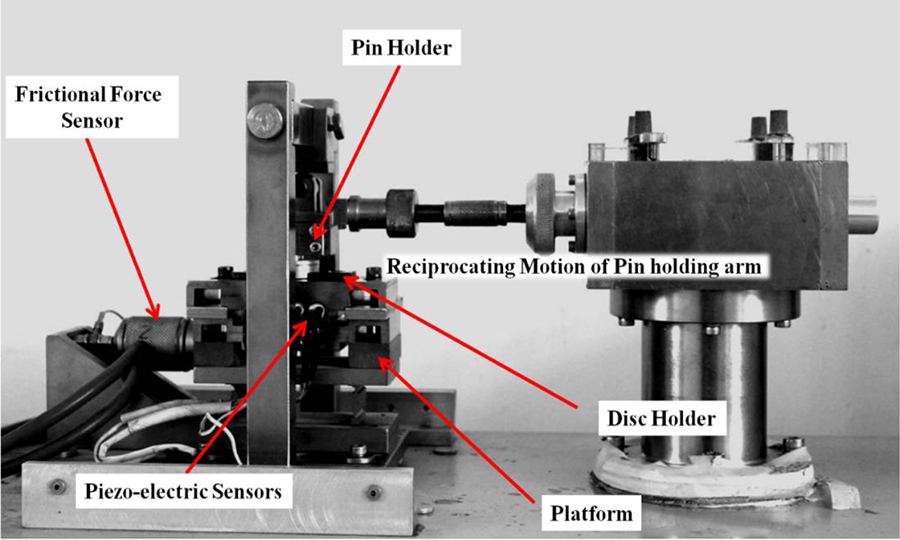
Reciprocating tribometer.
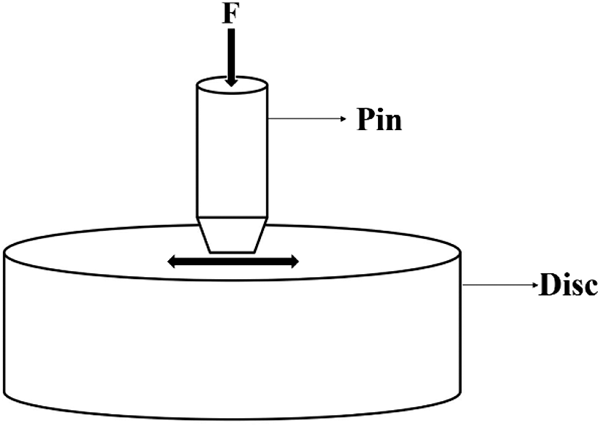
Disc and pin arrangement.
The following relation was used to evaluate the “specific wear rate” (SWR)
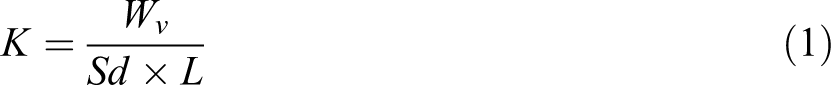
where K denotes the SWR (mm3/Nm), Wv denotes wear volume (mm3), L denotes the applied load (N), and Sd indicates sliding distance (m).
Taguchi approach for experimental design
To optimize the chosen set of process variables, the technique of Taguchi analysis is used for design of experiment. Taguchi approach being simple and systematic is used to optimize parameters, which includes design for cost, quality, and performance.42,48,49 Various industrial experts and researchers have adopted Taguchi approach effectively to optimize their experimental studies.43–45,50,51 In Taguchi method, deviation between measured and desired values is obtained by employing a loss function, which is then converted to a signal-to-noise (S/N) ratio. Three quality characteristics are available for the S/N ratio, viz., the lower-the-better (LB), the nominal-the-better, and the higher-the-better. 52 In this work, Taguchi is employed to find the best tribopair for friction and wear properties. Hence, the quality characteristics, LB is used, which is given by 52
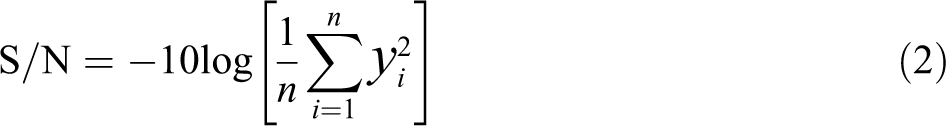
where n signifies the no. of test runs and yi signifies the investigational data of the i’th test run.
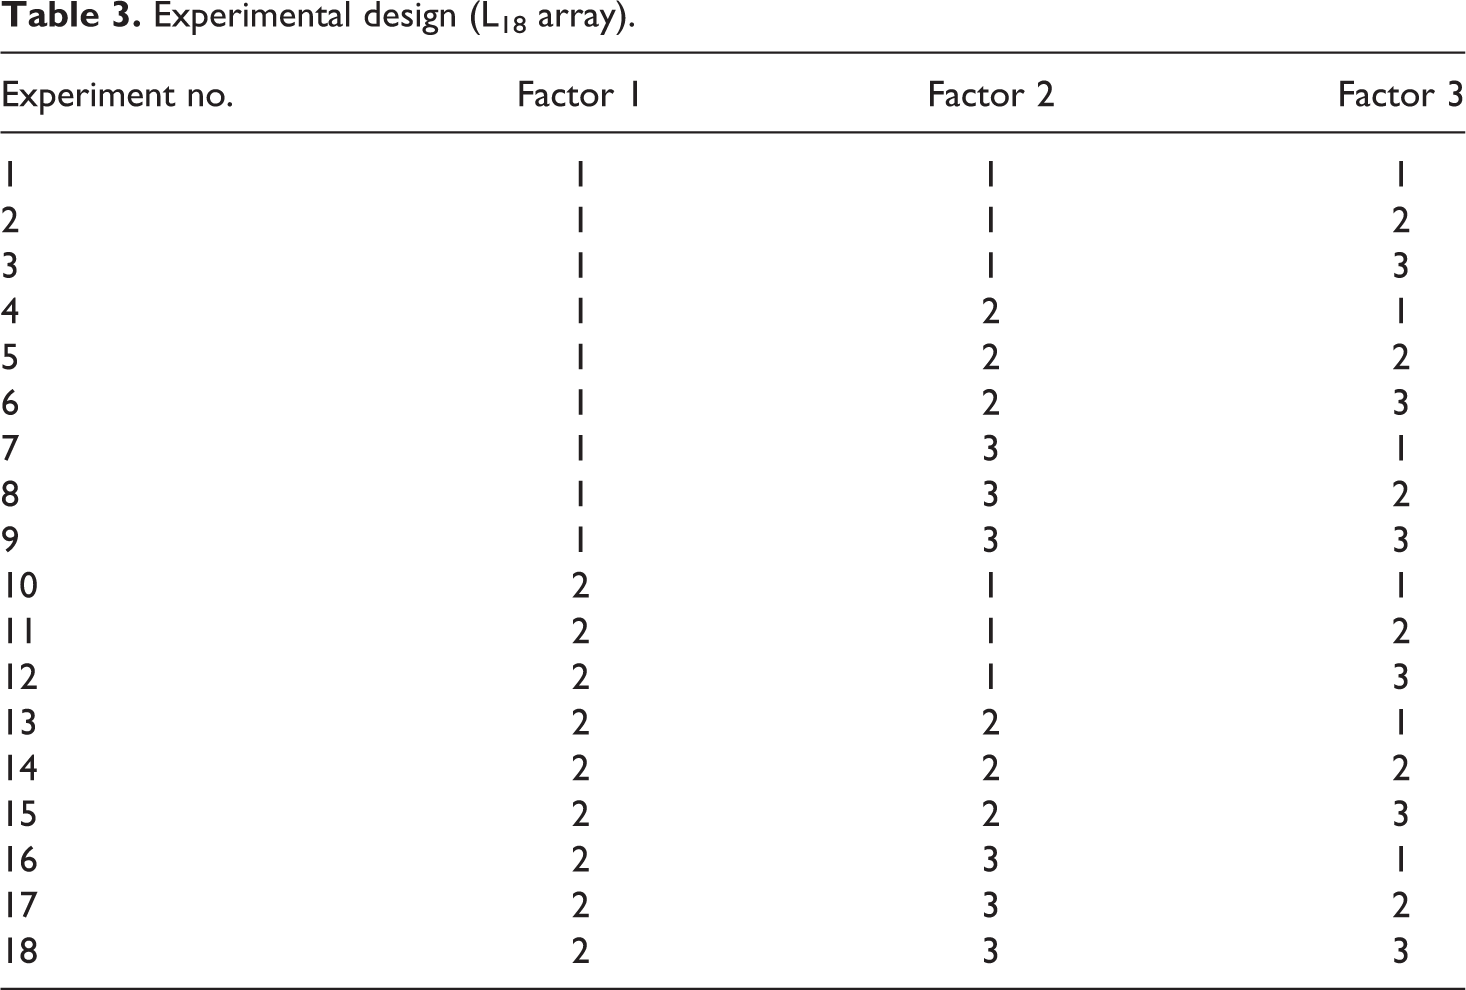
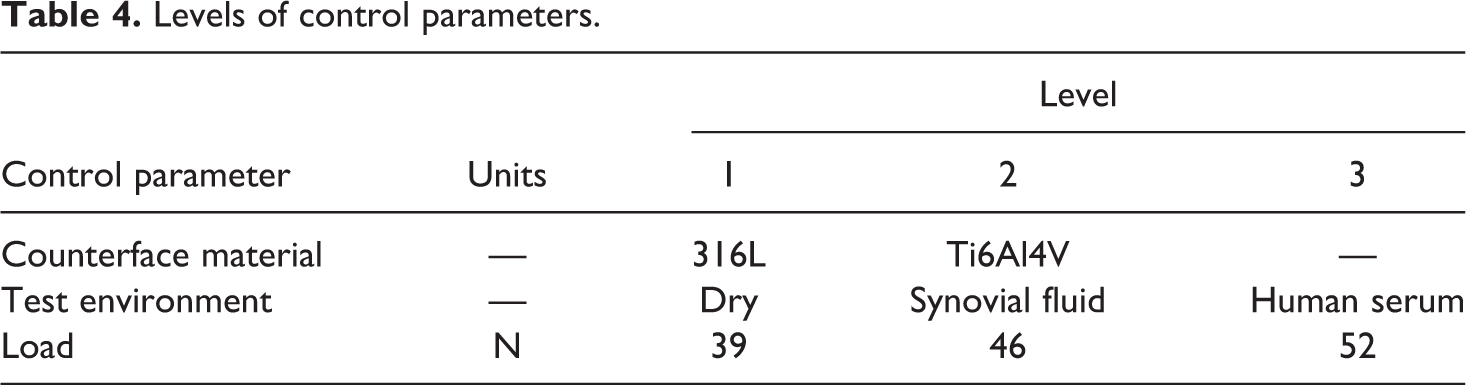
Table 3 displays L18 (21 × 32) array, which was used for experimental design based on control parameters and their levels, as demonstrated in Table 4.
Experimental design (L18 array).
Levels of control parameters.
Grey relational analysis
Grey relational analysis (GRA) is a suitable method, which is used to solve a multiobjective problem with intricate interrelations between multiple parameters and variables. This multiobjective problem can be optimized by the GRA method. For complex multiobjective problems, GRA forms an ideal approach by reducing a multiresponse variable problem to a single-response variable problem.53,54 The detailed procedure for carrying out GRA of data is given elsewhere in the literature.54,55
Results and discussion
The in-vitro friction–wear tests were performed using Taguchi’s L18 standard array, and the results are tabulated in Table 5. The LB quality characteristic is used to determine the investigational values of average COF and SWR; their corresponding S/N ratio is given in Table 5. Minitab 17 was used to carry out the analysis.
Experimental observations and S/N ratios.
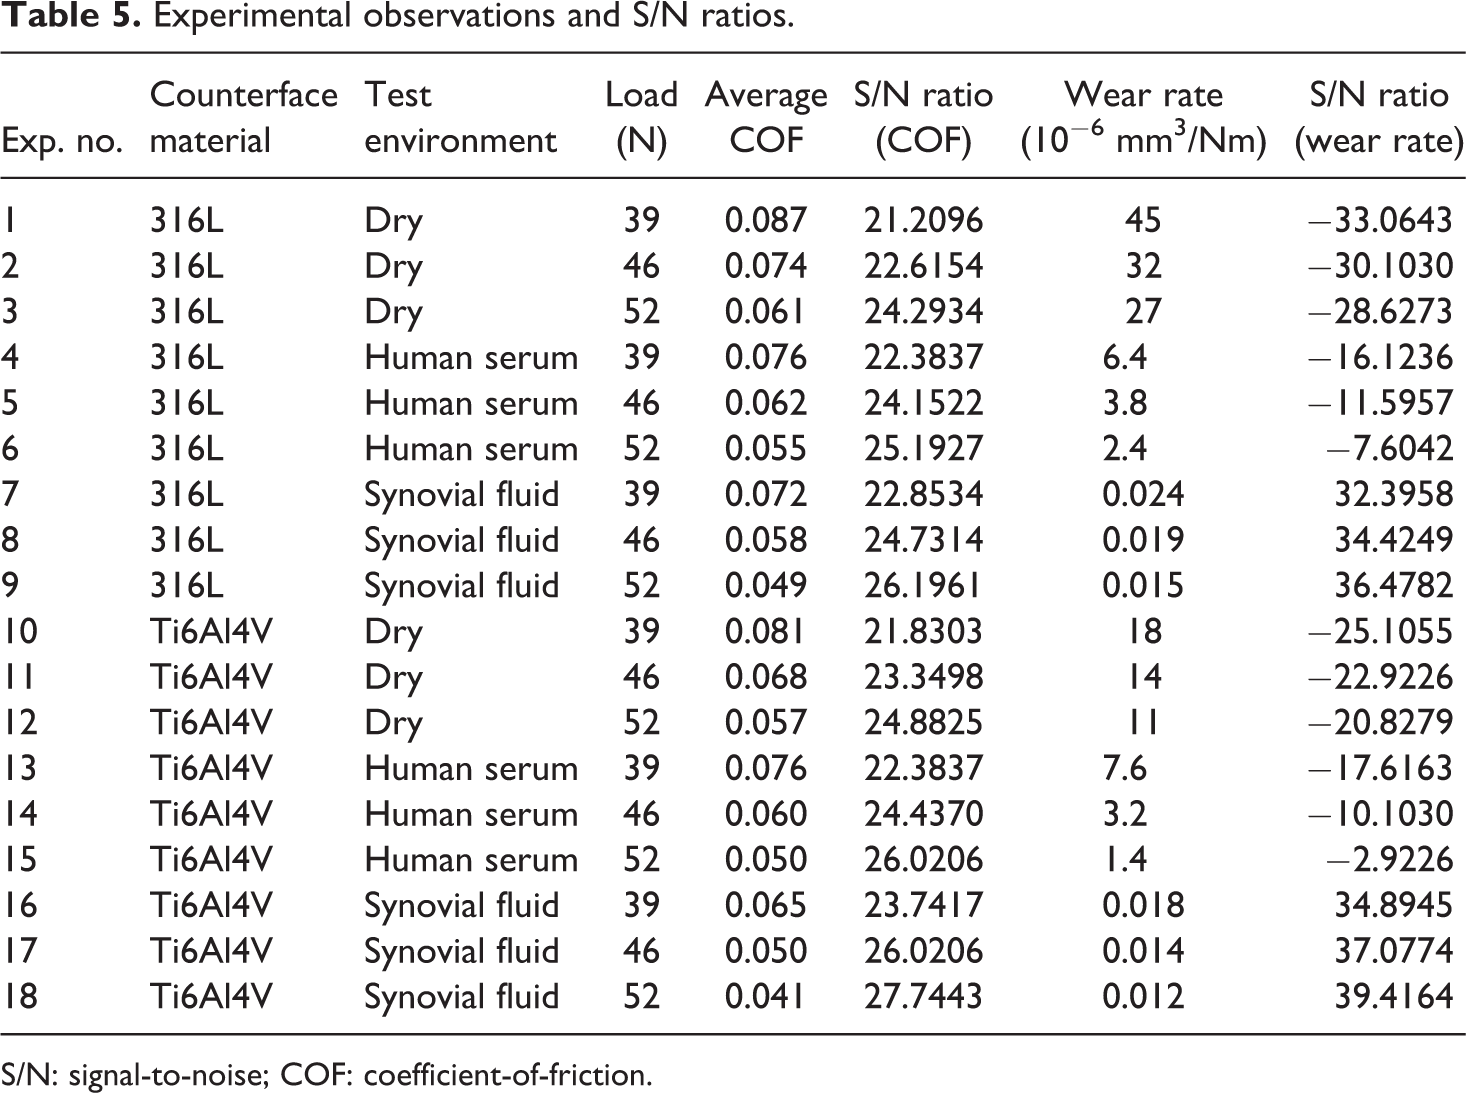
S/N: signal-to-noise; COF: coefficient-of-friction.
S/N ratio analysis
The response factors governing the tribological properties (COF and SWR) are formulated in Table 6. The influence of control parameters on average S/N ratio for SWR and COF is shown in Figures 3 and 4. To achieve better performance, the control factors can be optimized by taking greater values of S/N ratios. The bold italic data values in Table 6 represent the largest values of S/N ratios. Figure 3 and Table 6 depict the grouping of factors—test environment: synovial fluid (level 3), load: 52 N (level 3), and counterface material: Ti6Al4V (level 2)—resulting in minimum average COF. Figure 4 and Table 6 depict that the grouping of factors—test environment: synovial fluid (level 3), load: 52 N (level 3), and counterface material: Ti6Al4V (level 2) —results in minimum wear rate (WR). Table 6 also depicts that COF is a stronger function of load followed by counterface material and test environment, while WR is a stronger function of load followed by test environment and counterface material.
S/N ratio response table.a
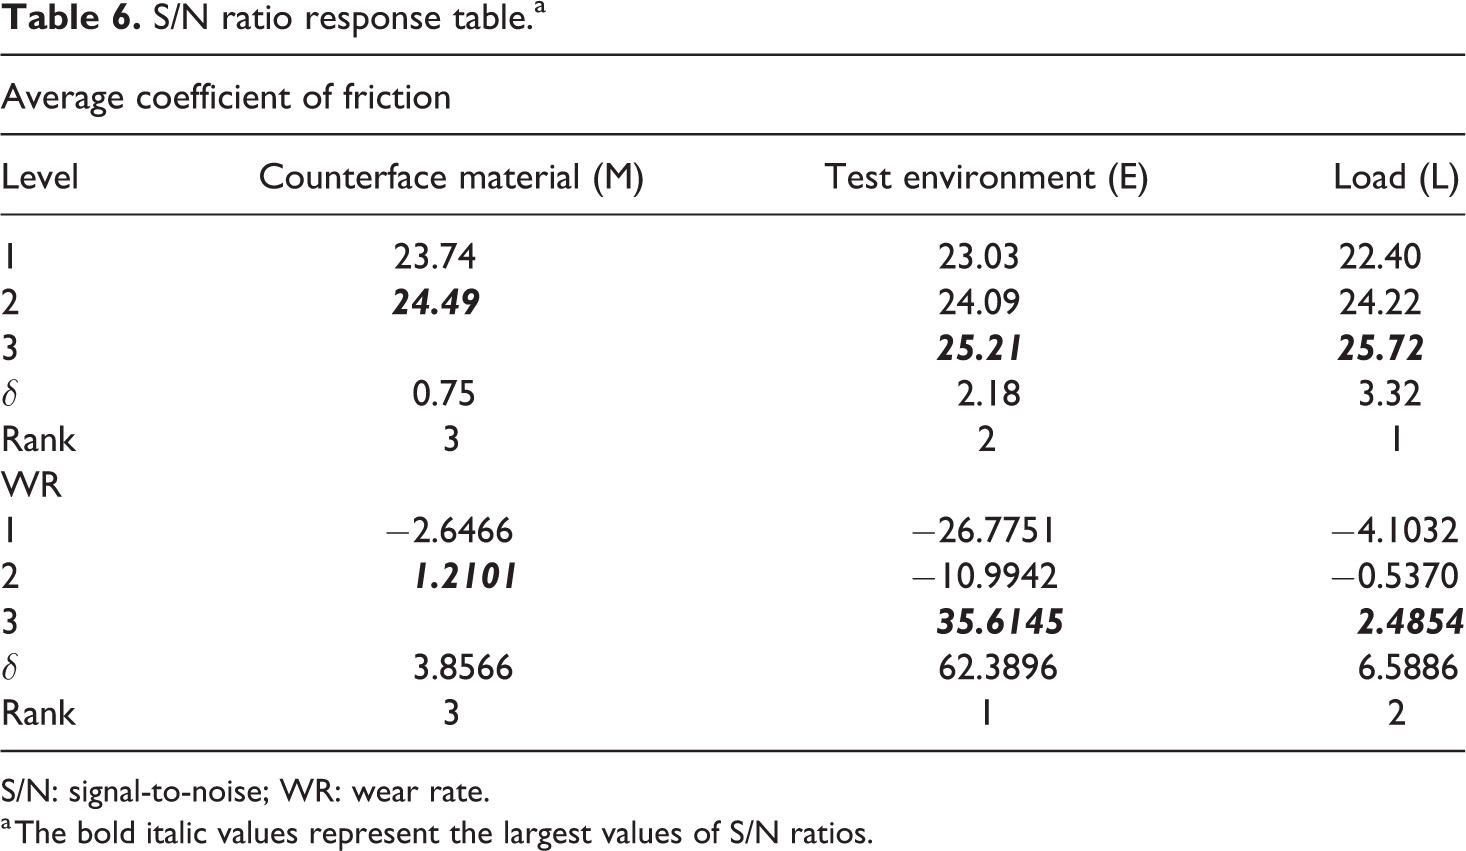
S/N: signal-to-noise; WR: wear rate.
a The bold italic values represent the largest values of S/N ratios.
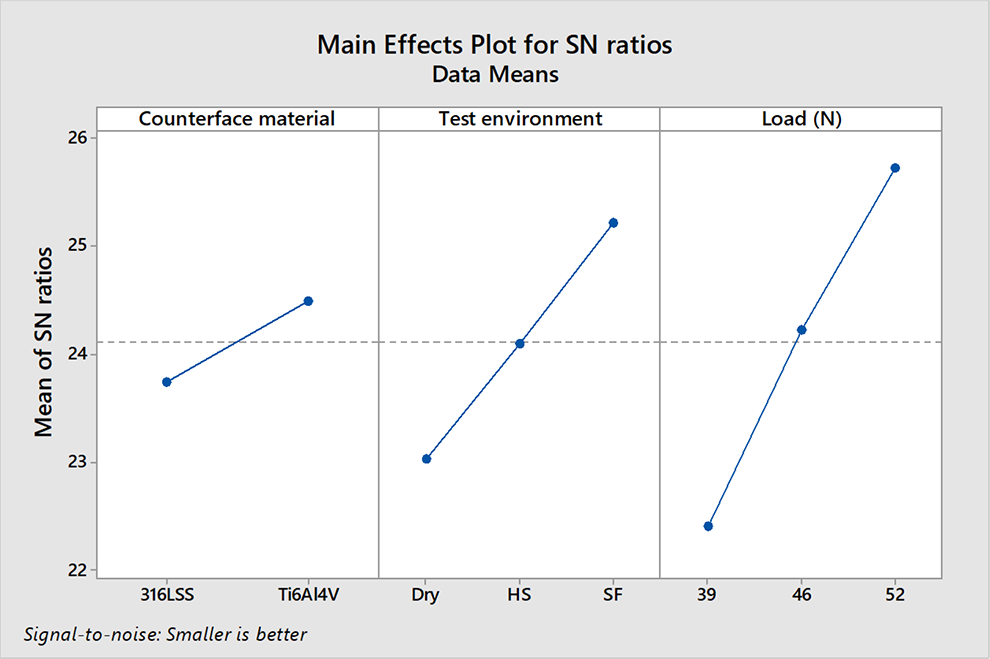
Effect of control factors on average S/N ratio for average COF.
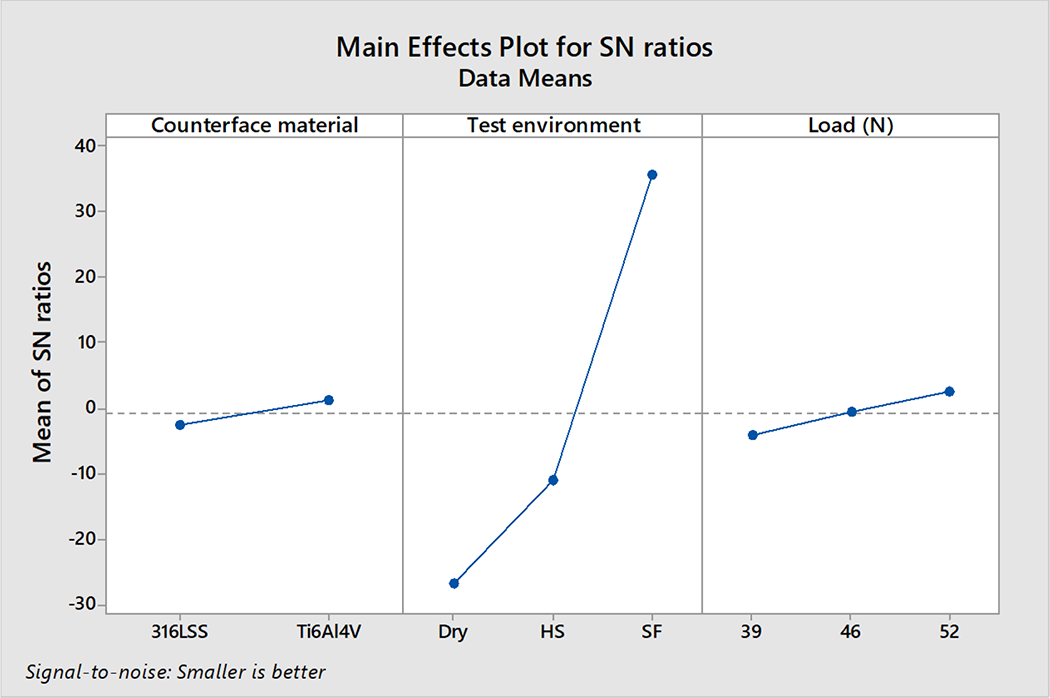
Effect of control factors on average S/N ratio for WR.
Analysis of variance
The statistical method ANOVA determines the result of analysis by obtaining the impact ratio and ranking of each response factor. In addition to this, ANOVA was used to recognize the control parameter and the linking between material, load, and testing environment (parameters that affect the values of COF and WR). A sureness level of 95% and a significance level of 5% were employed for the ANOVA. Tables 7 and 8 depict ANOVA results for average COF and WR separately, the test results signify that the average COF is the strong function of load and that the contribution of load toward COF is 64.64% followed by test environment, whose contribution toward the same is 27.82% followed by counterface material, whose contribution is 4.93%. The interactions of counterface material × test environment, test environment × load, and counterface material × load contribute to 1.05%, 0.37%, and 0.23%, respectively, for COF. Table 8 depicts that SWR is a strong function of test environment, whose contribution toward the same is 97.81% followed by load and test environment, whose contribution is 0.98% and 0.50%, respectively. The interaction of test environment × load, counterface material × test environment, and counterface material × load is 0.24%, 0.23%, and negligible, respectively.
ANOVA for S/N ratio of COF.
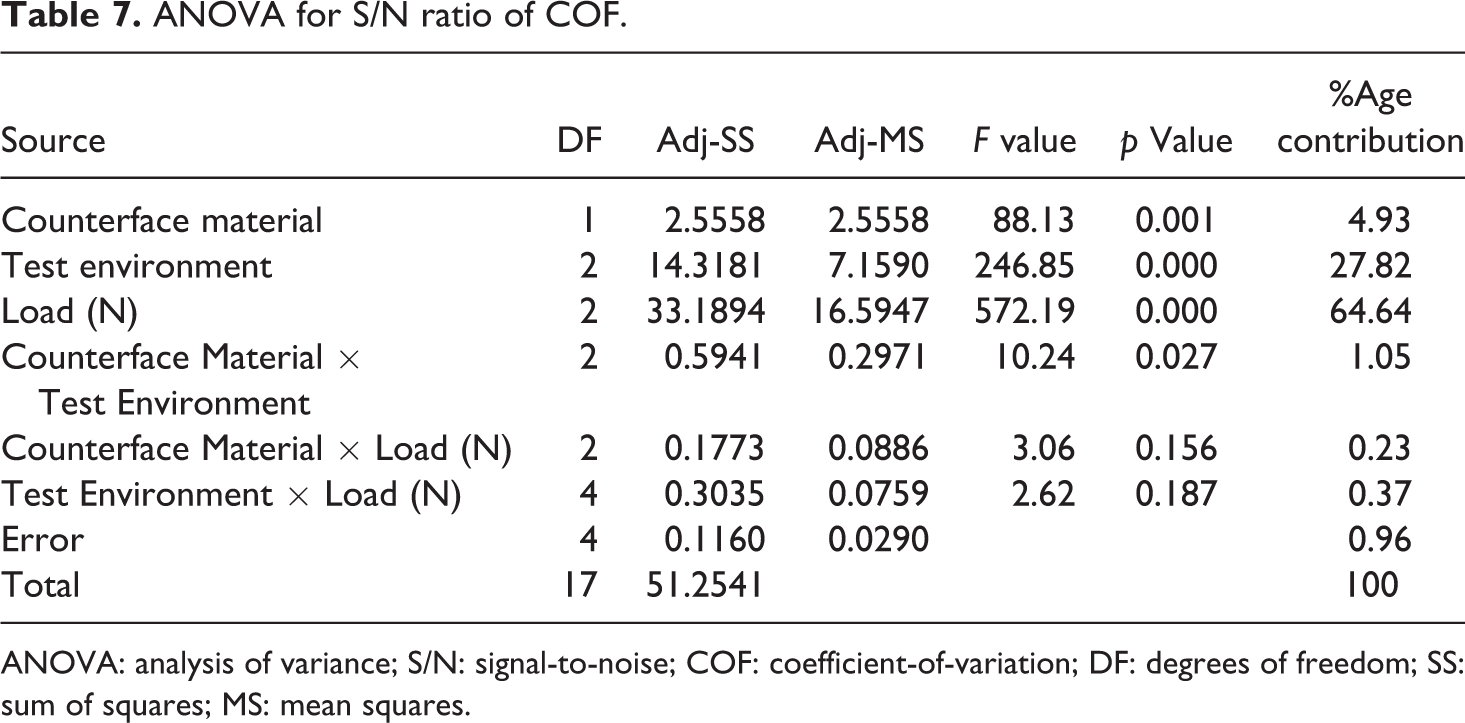
ANOVA: analysis of variance; S/N: signal-to-noise; COF: coefficient-of-variation; DF: degrees of freedom; SS: sum of squares; MS: mean squares.
ANOVA for S/N ratio of SWR.
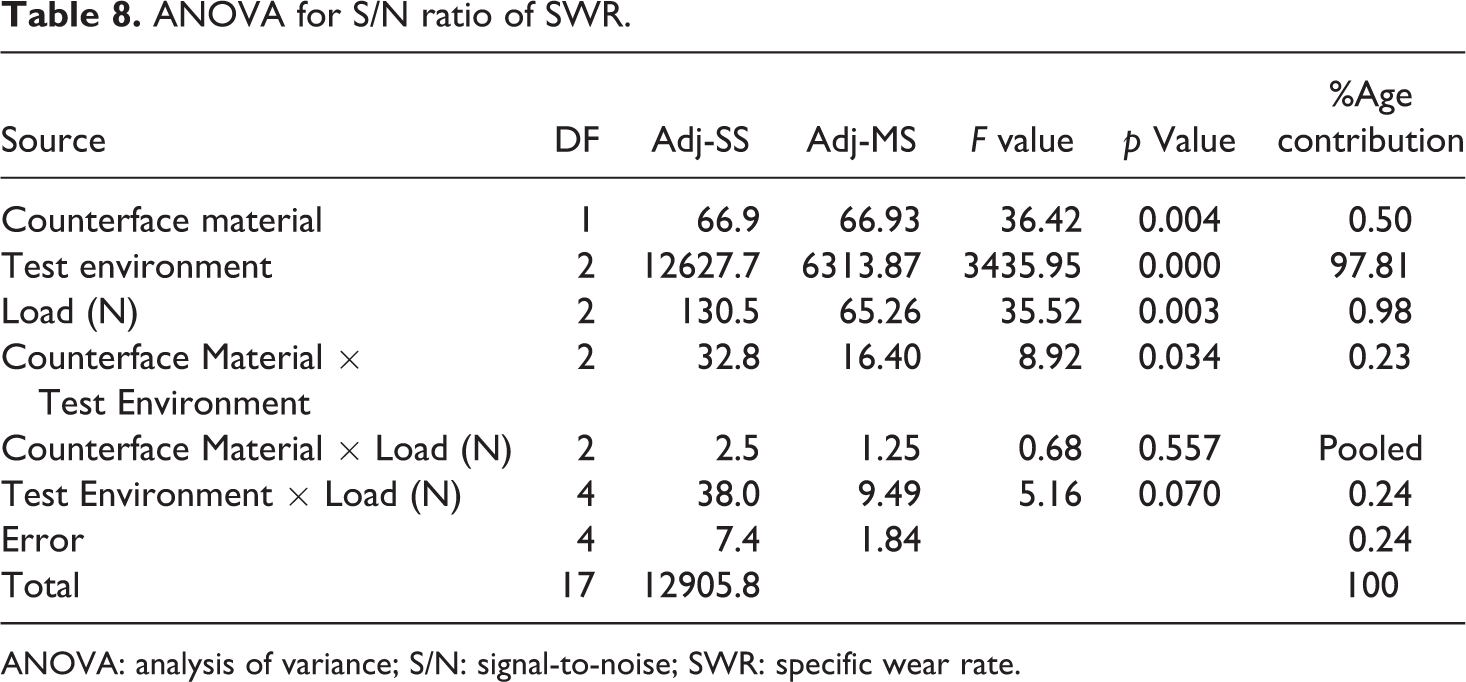
ANOVA: analysis of variance; S/N: signal-to-noise; SWR: specific wear rate.
Confirmation test
To validate the optimal values of average COF and WR, confirmation tests were carried out at the optimum parameters. From S/N ratio (smaller-the-better) analysis, the optimum setting for average COF was attained for Ti6Al4V (M1) with lubricant as synovial fluid (F3) under a load of 52 N (L3). The same optimum setting was obtained for WR. The optimum parameters of S/N ratio for average COF and WR can be calculated by equation 3 56
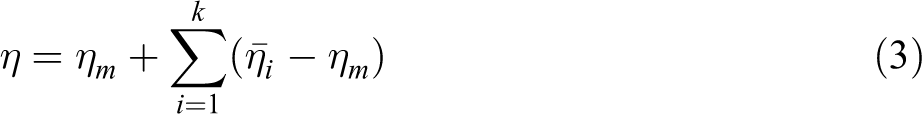
where the estimated S/N ratio at optimal value is denoted by η, the average of S/N ratio of response variable is denoted by ηm, the average S/N ratio at the optimal level is indicated by ηi, and the number of design parameters is given by k. The comparison of average COF and WR values for S/N ratio at optimal levels is tabulated in Table 9. The values obtained and predicted for S/N ratios are in high agreement with each other.
S/N ratio at optimal levels.
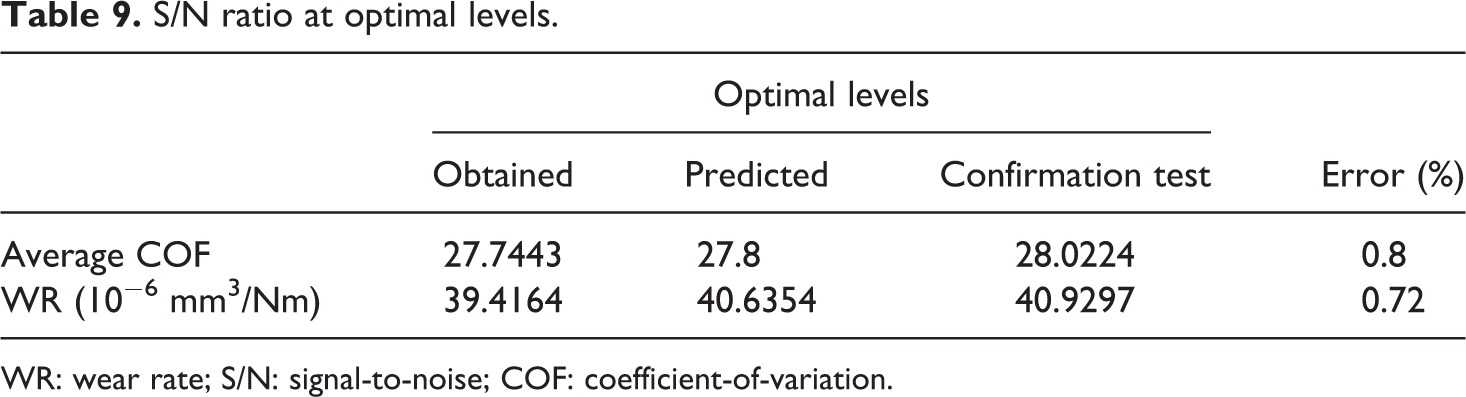
WR: wear rate; S/N: signal-to-noise; COF: coefficient-of-variation.
Grey relational analysis
Friction and wear occur concurrently in a tribological system. Consequently, the evaluation of these properties in conjunction becomes important and it is important to optimize them together. Optimization technique GRA was used in this study as GRA reduces a multiresponse variable problem to a single-response variable problem. Table 10 depicts the gray relational grade (GRG) values attained in this study, which were obtained using GRA. The GRG values have been obtained by considering the reference sequence as 1 and distinguishing coefficient as 0.5 giving equal weightage to performance characteristics.
Grey relational grade for average COF and WR.a
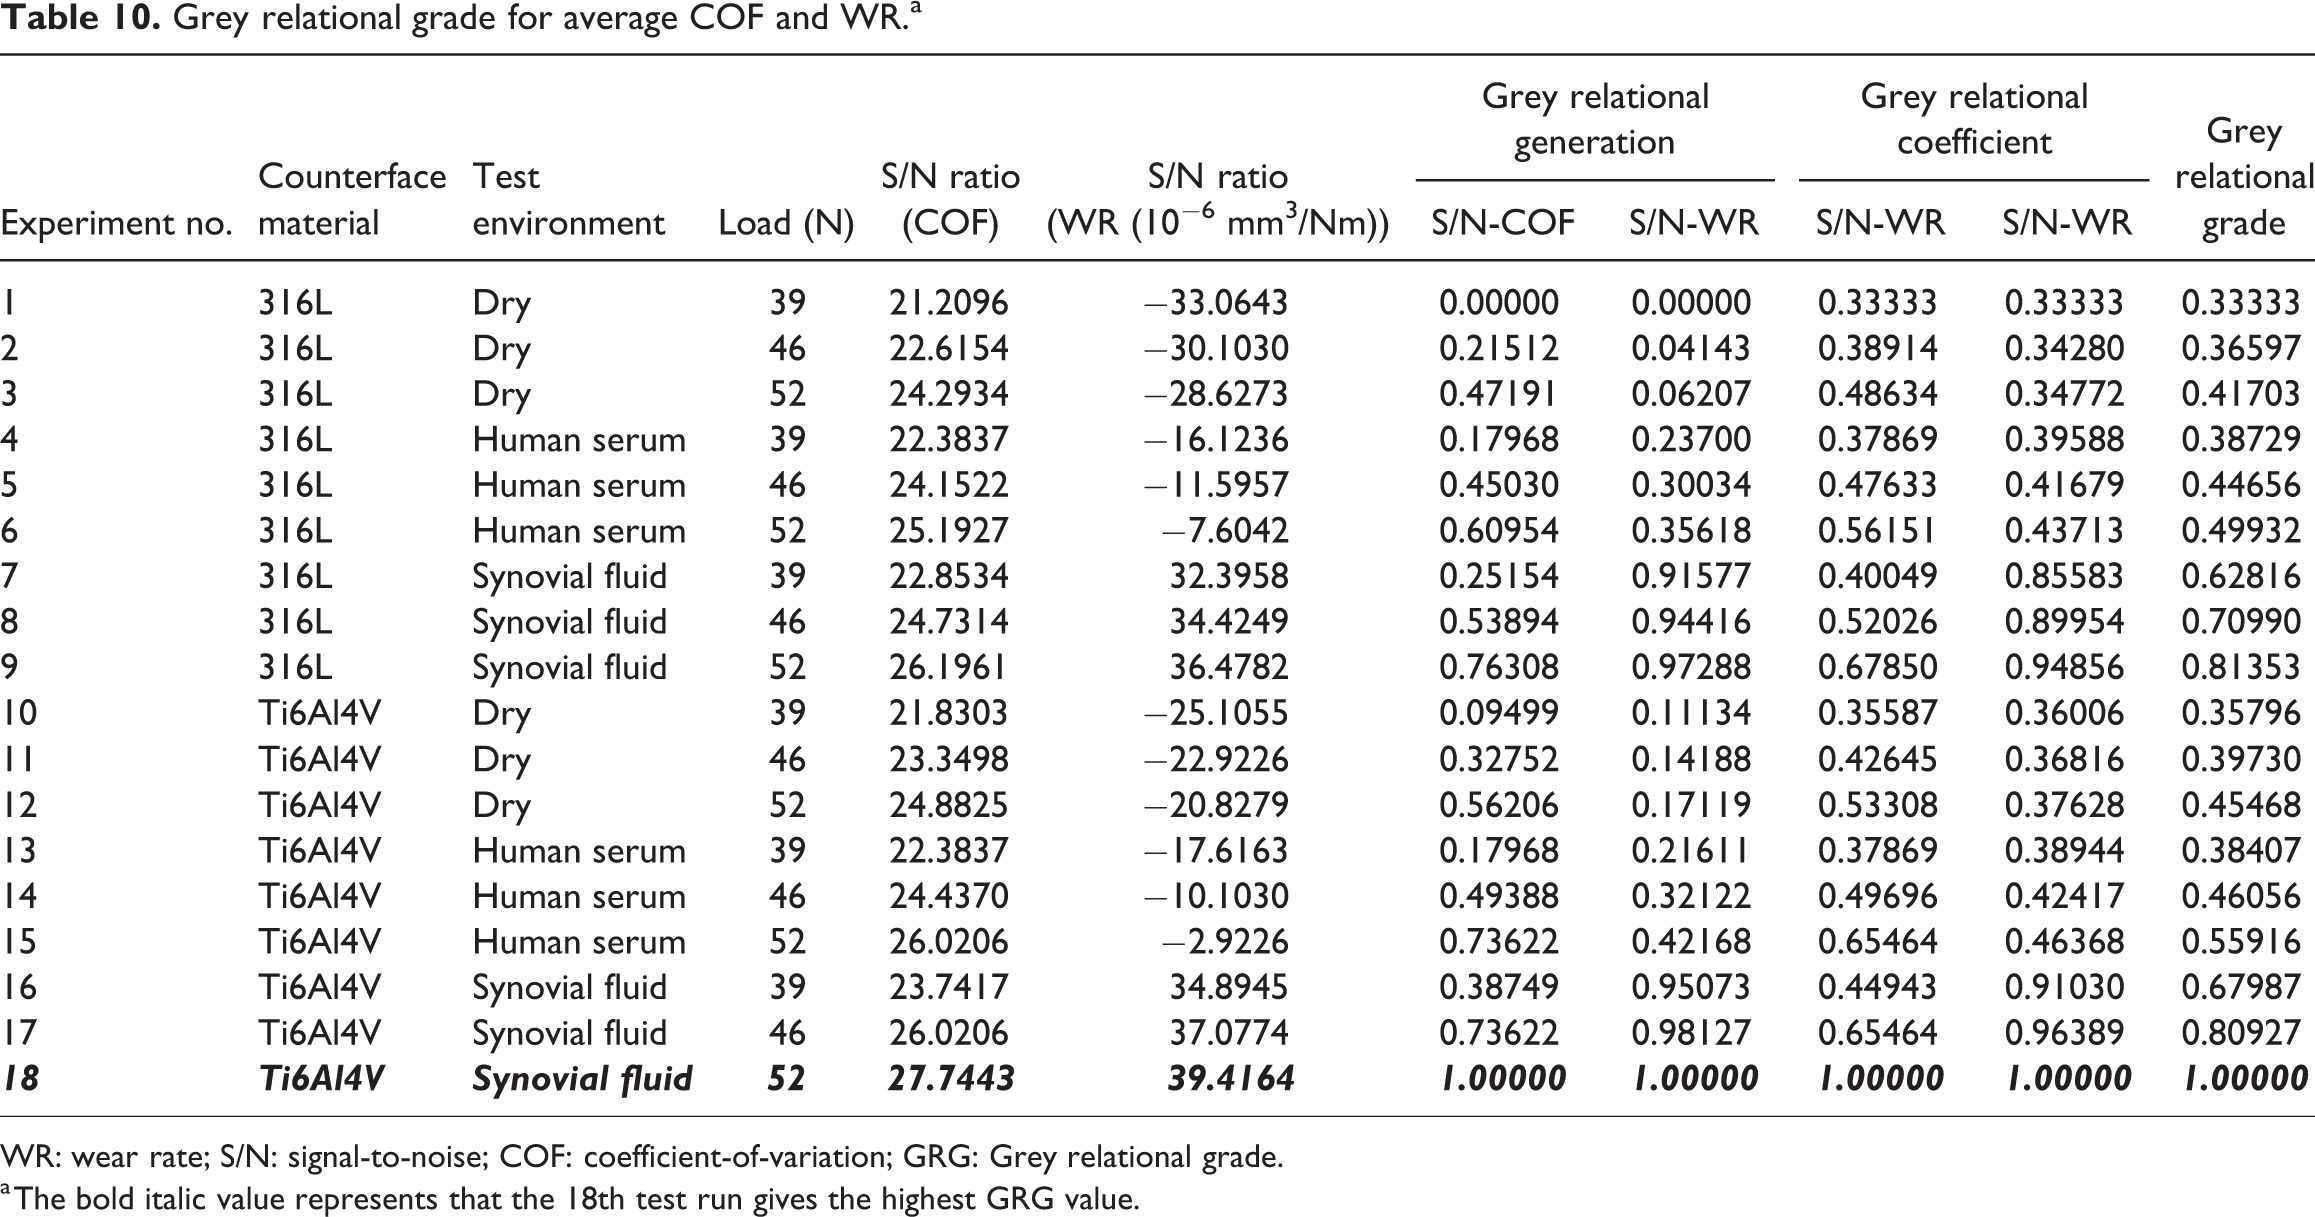
WR: wear rate; S/N: signal-to-noise; COF: coefficient-of-variation; GRG: Grey relational grade.
a The bold italic value represents that the 18th test run gives the highest GRG value.
The 18th test run gives the highest GRG value, which is bold italic in Table 10. Therefore, from Table 10, it is evident that the combination of parameters—counterface material: Ti6Al4V, test environment: synovial fluid, and load: 52 N—has the highest GRG value and hence is the optimum factor setting for COF and WR of UHMWPE together.
ANOVA of GRG
ANOVA results are given in Table 11 for the GRG of average COF and WR. Table 11 shows that the test environment with a percentage influence of 80.70% is the most important parameter that affects GRG trailed by load (12.48%) and counterface material (2.15%). The involvement of interaction of test environment × load, counterface material × test environment and counterface material × load is (1.90%), (1%), and (0.46%), respectively.
ANOVA for GRG.
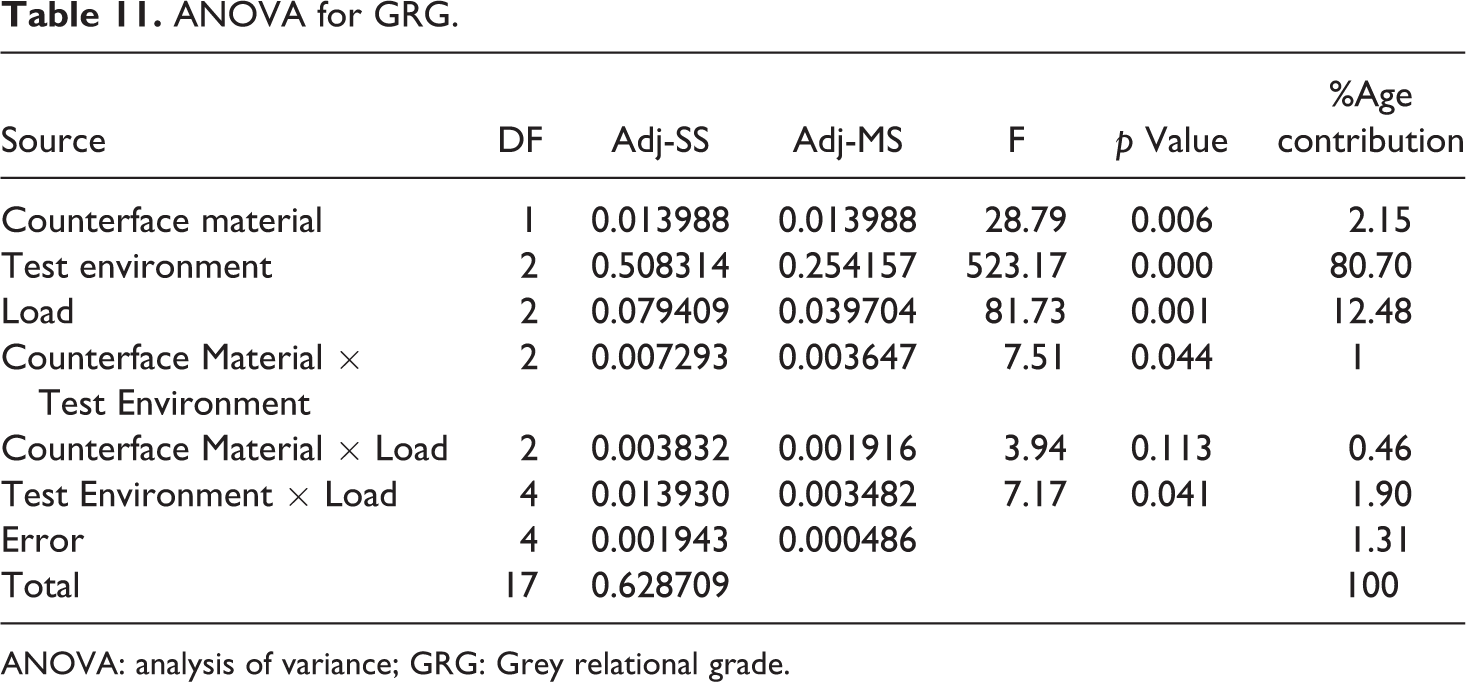
ANOVA: analysis of variance; GRG: Grey relational grade.
Wear surface analysis
The wear surfaces were examined using SEM. Figure 5 displays the SEM images of the UHMWPE, after the testing was conducted under dry sliding and human body fluids lubrication (synovial fluid and human serum) at a load of 52 N. The SEM images of the UHMWPE surface after sliding with 316L and Ti6Al4V under dry sliding environment at 52 N load are depicted in Figure 5(a) and (b), respectively. It is observed from Figure 5(a) that severe abrasion with plowing marks has taken place on the surface of UHMWPE after sliding against 316L under dry sliding conditions. The formation of grooves is also observed in Figure 5(a). However, from Figure 5(b), it is observed that slight abrasion with minor grooves is present on the surface of UHMWPE after sliding against Ti6Al4V under dry sliding. This indicates that UHMWPE has better wear resistance on sliding with Ti6Al4V than 316L under dry sliding. The SEM results are in accordance with the wear results obtained in this study, as given in Table 5. Further, in Figure 5(c) and (d), the SEM images of UHMWPE surface after sliding with 316L and Ti6Al4V lubricated by human serum are shown. It is perceived from the figures that human serum has adhered to UHMWPE surface. However, it can be observed from these figures that dense and homogeneous serum film has formed and adhered on UHMWPE surface on sliding with Ti6Al4V than sliding with 316L. This indicates that the tribological performance of UHMWPE is better on sliding with Ti6Al4V than sliding with 316L. Moreover, the friction and wear results given in Table 5 are in accordance with these observations. On the other hand, from Figure 5(e) and (f), it is observed that more dense and homogeneous films have formed on the surfaces of UHMWPE after sliding with 316L and Ti6Al4V under synovial fluid lubrication. The wear surfaces are fully covered with the films and as such no worn-out features are visible. Hence, it is evident that synovial fluid film has better lubricating properties as compared to human serum film. The results of friction and wear in Table 5 indicate that Ti6Al4V sliding with UHMWPE under synovial fluid lubrication provides the best tribological performance as compared to human serum lubrication and dry sliding environments.
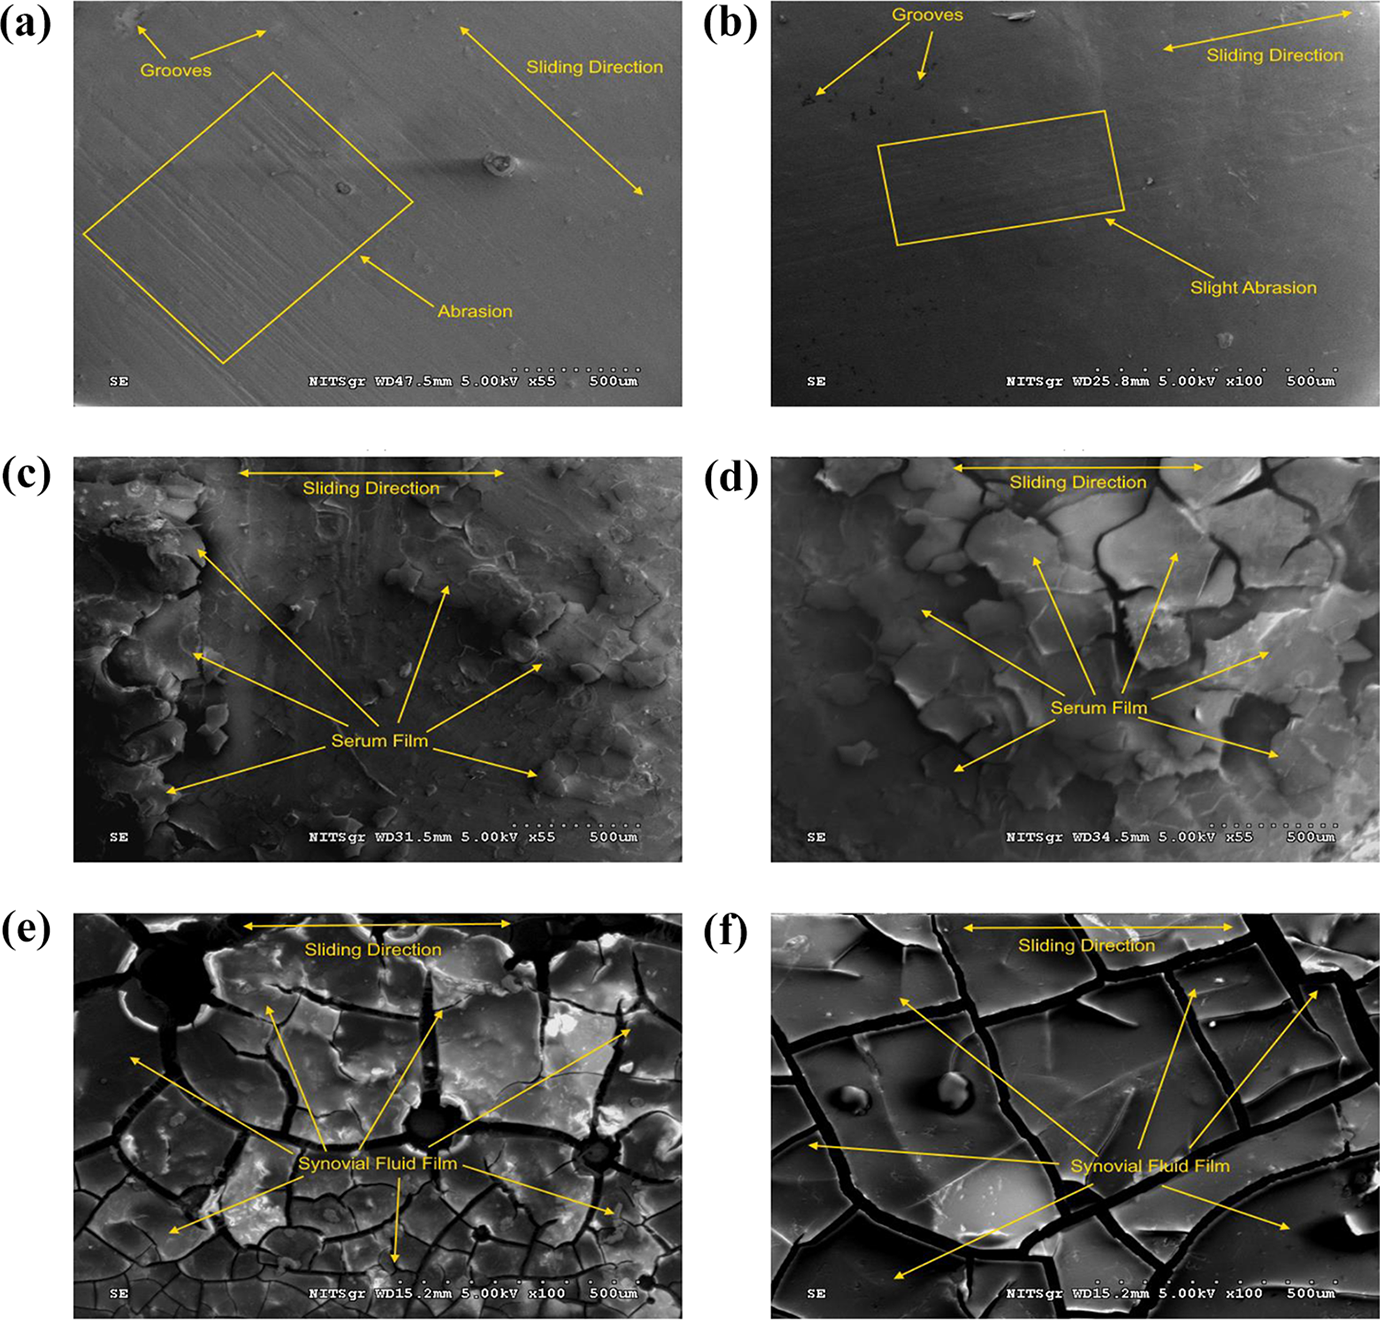
Worn-surface morphology of UHMWPE at 52 N load, sliding under dry and body fluid environments (a) with 316L under dry sliding, (b) with Ti6Al4V under dry sliding, (c) with 316L under human serum lubrication, (d) with Ti6Al4V under human serum lubrication, (e) with 316L under synovial fluid lubrication, and (f) with Ti6Al4V under synovial fluid lubrication.
Conclusions
From the tribological tests conducted in this study, it is observed that synovial fluid possesses better lubricating properties than human serum irrespective of the combination of parameters.
S/N ratio analysis indicated that the grouping of control factors—counterface material: Ti6Al4V, test environment: synovial fluid, and load: 52 N—results in minimum WR and COF. Load is the greatest contributing factor for COF, whereas WR is the most affected by test environment.
ANOVA for COF revealed that the load factor contributes mostly to the COF with (64.64%), followed by the test environment with 27.82% contribution and counterface material with 4.93% contribution. Further, the ANOVA for WR revealed that the test environment affects WR with 97.81% contribution. The other factors are relatively insignificant for WR according to the results of ANOVA.
The combination of parameters derived from GRA results revealed that counterface material: Ti6Al4V, test environment: synovial fluid, and load: 52 N are the optimum control factor situation for WR and COF of UHMWPE optimized together.
ANOVA of GRG depicted that the test environment is the most influential parameter with a contributing percentage of 80.70%, trailed by load (12.48%), and counterface material (2.15%) for COF and WR.
Wear-surface analysis indicated dense, homogeneous, and tenacious synovial fluid film formation, sliding with UHMWPE resulted in better friction and wear behavior of UHMWPE under lubrication with synovial fluid.