
Abstract
Nonisothermal crystallization kinetics of ethylene–acrylic acid copolymer (EAA) and thermoplastic vulcanizate (TPV) based on EAA/chloroprene rubber (CR) were extensively studied using differential scanning calorimetry. Several methods, including the Avrami, Ozawa, and Mo equations, were carried out to analyze the process of nonisothermal crystallization kinetics of EAA and EAA/CR TPV. The results showed that the Avrami analysis modified by Jeziorny and a method developed by Mo could describe the nonisothermal crystallizations of pure EAA and the EAA/CR TPV very well. However, the Ozawa analysis did not give an adequate description. The crystallization processes of pure EAA and the EAA/CR TPV were accelerated by increasing the cooling rates. Moreover, the initial crystallization temperature and the crystallization termination temperature of EAA/CR TPV were higher than those of pure EAA at the same cooling rate, thus showing the nucleating function of CR in the beginning. While the crystallization half time of EAA/CR TPV was apparently longer than that of pure EAA, meaning that the more CR could cause the steric effect and retard the crystallization process of the TPV during the late stages of crystallizing. Although the CR phase of EAA/CR TPV could provide more nucleation sites, the presence of more CR phase must impose a much more significant confinement effect on the crystal growth of EAA. It was believed that this confinement effect overweighed the nucleation effect, thereby slowing down the overall crystallization rate.
Keywords
Introduction
Thermoplastic vulcanizates (TPVs), in which cross-linked rubber particles dispersed in continuous thermoplastics matrix, are a special category of high-performance thermoplastic elastomers prepared via dynamic vulcanization.1–4 Because TPVs have good processability of thermoplastics and excellent resilience of traditional vulcanized rubbers, in recent years, TPVs are currently drawing more and more attention and have been widely used in building, automotive, and wearable devices.5–10 Meanwhile, dynamic vulcanization is a method to produce new TPVs, which was firstly discovered by Gessler 11 in 1962 and then further studied by Fischer, 12 Coran 13 and Abdou-Sabet. 14
Ethylene–acrylic acid copolymer (EAA) is a technologically important semicrystalline thermoplastic; shows excellent adhesion, easy processing, good mechanical property and thermal stability; and has been considered as an ideal plastic for preparing TPVs with outstanding physical and chemical performance.15–18 Chloroprene rubber (CR), a kind of polar rubber, with its exceptional physical and chemical properties, is categorized to be suitable for applications of ozone resistance, flame retardancy, and good adhesion of sealing and gaskets.19–21 However, it is barely reported for the EAA/CR TPV until now.
The crystallization kinetics of both polymer and TPVs are particularly important for the analysis and design of processing operations, which would be able to crystallize not only when cooled from the melt but also when heated from the amorphous state.22–27 The former is so-called “melt crystallization” and the latter one is “cold crystallization.”
In this article, the EAA/CR TPV was prepared by dynamic vulcanization where the CR phase had played a role in impacting the nonisothermal crystallization of the EAA/CR TPV significantly. The nonisothermal crystallization kinetics of pure EAA and the EAA/CR TPV were further investigated systematically; meanwhile, it was expected that the research reported herein was of great help for a better understanding of the structure and properties relationship of semicrystalline polymer and TPVs.
Experimental
Materials
EAA, grade N300 (melting temperature (Tm) = 106.4°C, 9.7 wt% acrylic acid content), with a melt flow index of 8.5 g/10 min (190 °C/2.16 kg), was provided by Dow Chemical Co., Ltd (USA, Midland Michigan). CR, SN244X type, the Mooney viscosity (ML1+4 (100°C)) is 75, was commercially obtained from Shanna Synthetic Rubber Co., Ltd (Shanxi, China). Zinc oxide (ZnO) and magnesium oxide (MgO) were used as vulcanizing agents and were purchased from NewLe Qinshi Zinc Co., Ltd (Xinle, China). Stearic acid was used as a softening agent and manufactured by Wanyou Co., Ltd (Zibo, China). N-Phenyl-2-naphthylamine (antioxidant D) was used as an antioxidant and supplied by Shengao Chemical Co., Ltd (Caoxian, China).
Preparation of dynamically vulcanized EAA/CR blends
Commercially available EAA and CR, as mentioned above, were manufactured for the TPVs. The concentrations for cross-linking CR system are expressed in parts per hundred CR by weight (phr). The metallic oxides-containing accelerating system recipe consisted of the following ingredients: 100 phr CR, 5.0 phr ZnO, 4.0 phr MgO, 0.5 phr SA, and 2.0 phr antioxidant D.
The dynamically vulcanized EAA/CR TPVs were produced via a two-step mixing process. Firstly, the preblend CR including the cross-linking ingredients was compounded in a two-roll mill (X(S) K-160, Shanghai Qun Yi Rubber Machinery Co., Ltd, China) at room temperature. After 3 min of mixing time, the preblend was removed from the mixer. Secondly, the requisite quantities of EAA were charged into another two-roll mill (SY-6215-AL, Shi Yan precision instruments Co., Ltd, China) and allowed to melt. Then the preblend was also charged into the two-roll mill and continued at 165°C for another 8 min to allow dynamic vulcanization. The CR phase was gradually broken down into dispersed particles by initially large CR entities under the local stress that evolved during melt mixing, the phase morphology was stable then. Finally, the compound was removed from the mixer and then passed through a cold two-roll mill in the molten state to obtain sheet samples about 2 mm thick. All test specimens were used for testing after 24 h.
Characterization
Differential scanning calorimetry
Nonisothermal crystallization kinetics was carried out using a DSC Q20 (TA Instruments, New Castle, Delaware, USA) differential scanning calorimeter calibrated the temperature with indium. All differential scanning calorimetry (DSC) analyses were performed under nitrogen atmosphere; sample weights were between 5 mg and 8 mg.
Nonisothermal crystallization process
The nonisothermal crystallization was performed as follows: The samples were firstly heated from 40°C to 140°C (above Tm), allowed for 5 min to eliminate thermal history, and then cooled down to 40°C. Heating rate was fixed at 10°C min−1, and the cooling rate was set at different cooling rates: 5, 10, 15, 20, 25°C min−1 under nitrogen atmosphere. The exothermic curves of heat flow as a function of time were recorded and investigated.
Results and discussion
Nonisothermal crystallization behavior of pure EAA and EAA/CR TPV
The nonisothermal crystallization exotherms of the pure EAA and EAA/CR TPV at five cooling rates of 5, 10, 15, 20, and 25°C min−1 are shown in Figure 1. As shown in Figure 1(a) and (b), the crystallization process of all samples demonstrated a single peak. Some kinetic parameters could be derived from the DSC curves, including the initial crystallization temperature (T0), the crystallization termination temperature (Tc), the crystallization peak temperature (Tp), the half crystallization time (t1/2), and the crystallization enthalpy (Hc) which are listed in Table 1. The effect of the different cooling rates is as follows. The values of T0, Tc, Tp, t1/2, and Hc of pure EAA and the EAA/CR TPV were decreased with the increase in cooling rate, respectively. Moreover, T0 value of pure EAA was lower than that of the EAA/CR TPV, indicating that the CR could act as a nucleating agent and promote crystallization of EAA matrix; however, t1/2 showed that the crystallization rate of EAA/CR TPV was higher than the EAA with the given same cooling rates, displaying that the CR in TPV had a certain inhibitory effect due to steric hindrance. At lower cooling rates, the macromolecules got sufficient time to crystallize and crystallization had taken place at narrow temperature region, but at faster cooling rates, the reorganization of the macromolecules took place in a wider temperature region due to the insufficient time for the molecular orientation. When the specimens were cooled fast, the characteristic time of reptation was relatively long and the chain mobility lagged the cooling rate. Thus, macromolecules had a short time to diffuse into crystallite structures and adjusted themselves in a suitable conformation; moreover, crystallization started later, and the small number of large crystals yielded a broad peak at lower temperatures, compared with behavior at low cooling rates (Figure 1(a) and (b)).
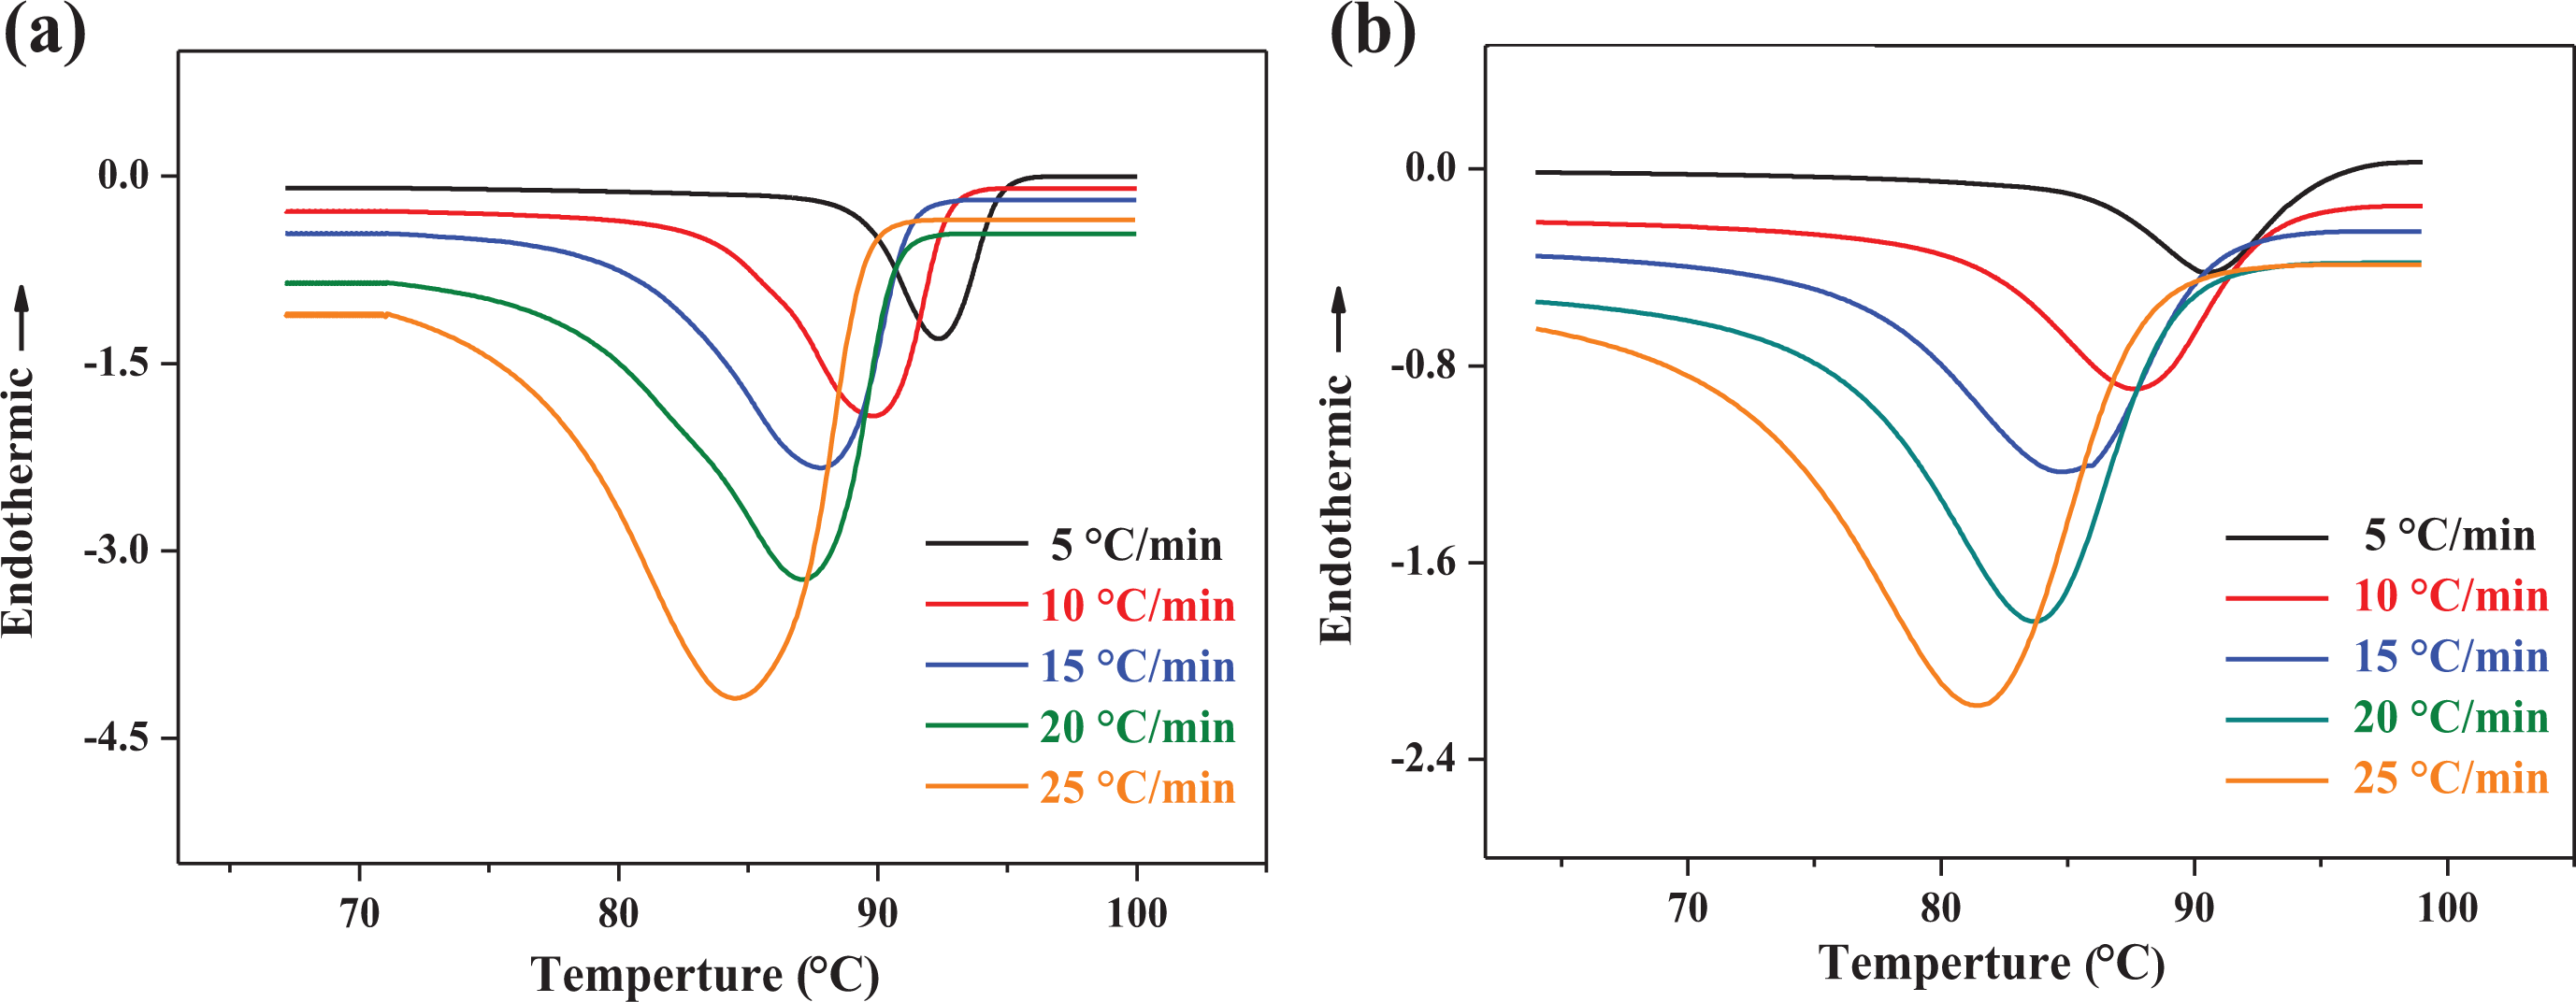
Nonisothermal crystallization DSC curves of samples at different cooling rates. (a) pure EAA, (b) EAA/CR TPV (EAA/CR = 60/40).
Kinetic parameters of nonisothermal crystallization of pure EAA and the EAA/CR TPV.
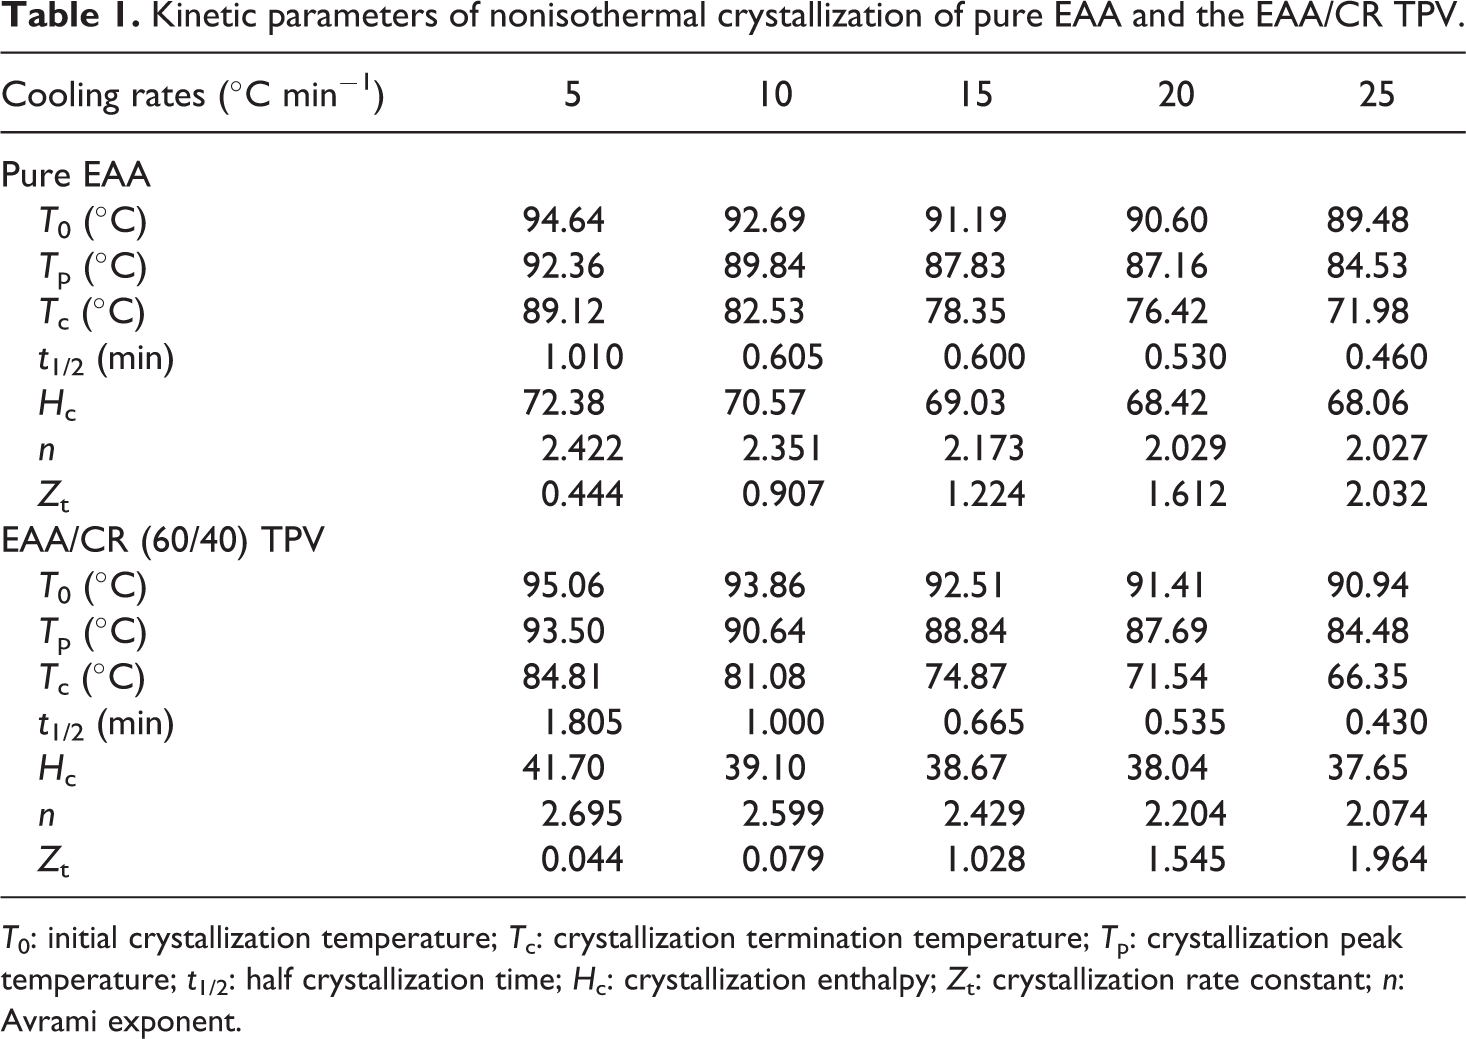
T0: initial crystallization temperature; Tc: crystallization termination temperature; Tp: crystallization peak temperature; t1/2: half crystallization time; Hc: crystallization enthalpy; Zt: crystallization rate constant; n: Avrami exponent.
Effect of cooling rate on crystallization temperature
During the nonisothermal crystallization process, the relative crystallinity as a function of temperature could be expressed as:
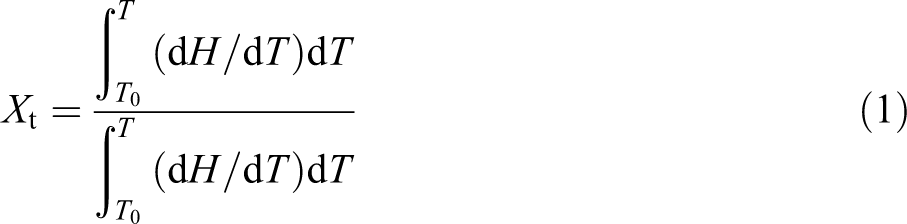
where T0 stands for the initial crystallization temperature, Tc stands for the crystallization termination temperature, Xt is the relative crystallinity, and dH/dT is related to the heat flow rate.
Figure 2 shows the development of relative crystallinity as a function of temperature for the pure EAA and EAA/CR TPV at various cooling rates. As can be seen from Figure 2(a) and (b), the development of relative crystallinity displayed the familiar sigmoidal shape with the increasing of temperature, manifesting fast primary crystallization during the early stages and slow secondary crystallization in the later stage. Moreover, the crystallization curve shifted to lower temperature with the increase in cooling rates, signifying rapid crystallization rates. However, because of shorter crystallization time at a faster cooling rate, the values of Xt were lower than those that do at a slower cooling rate at the same crystallization temperatures.
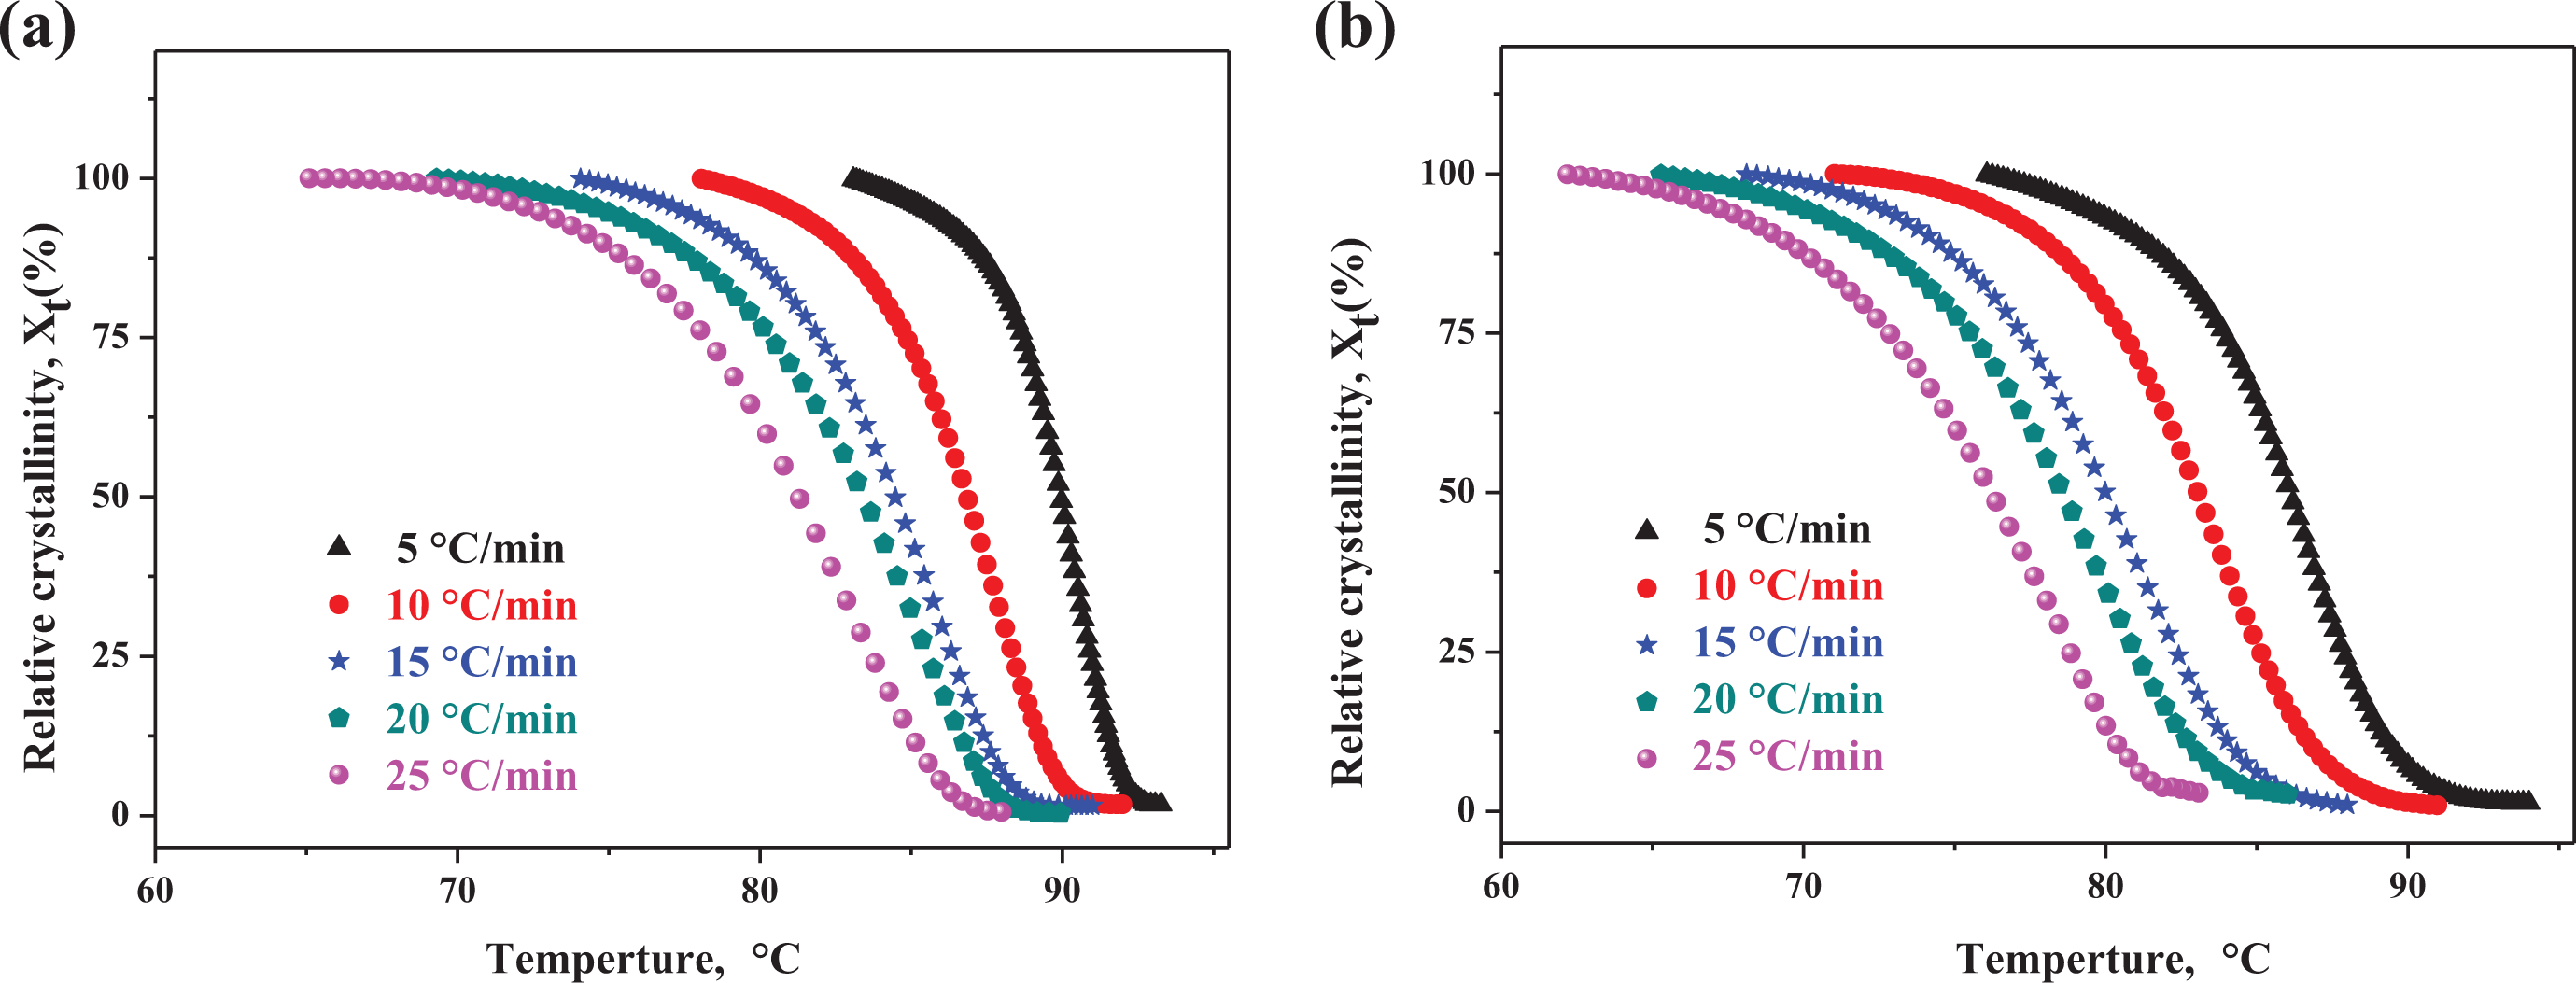
Development of relative crystallinity versus temperature during nonisothermal crystallization: (a) pure EAA and (b) EAA/CR TPV (EAA/CR = 60/40).
Effect of cooling rate on crystallization time
The relationship between crystallization temperature (T) and time (t) during nonisothermal crystallization experiments was given by:
where φ is the constant cooling rate, T is the temperature at crystallization time t, and T0 is onset temperature of crystallization.
Figure 3 shows the plots of relative degree of crystallinity versus crystallization time at various cooling rates for the pure EAA and EAA/CR TPV. It could be seen from Figure 3(a) and (b) that the development of relative crystallinity also displayed the familiar sigmoidal shape with increasing time. Moreover, the plots shifted to more time range with increasing the cooling rates. As shown in Figure 3(b), it could be easily found that the plots of EAA/CR TPV shifted to more time range at the same cooling rate, compared the plots of pure EAA in Figure 3(a). On the one hand, the CR particles could act as a nucleating agent for the EAA matrix under nonisothermal conditions, due to T0 of pure EAA was lower than that of the EAA/CR TPV; however, the steric hindrance caused by the large space volume structure of the CR phase could delay the crystallization of TPV inevitably.
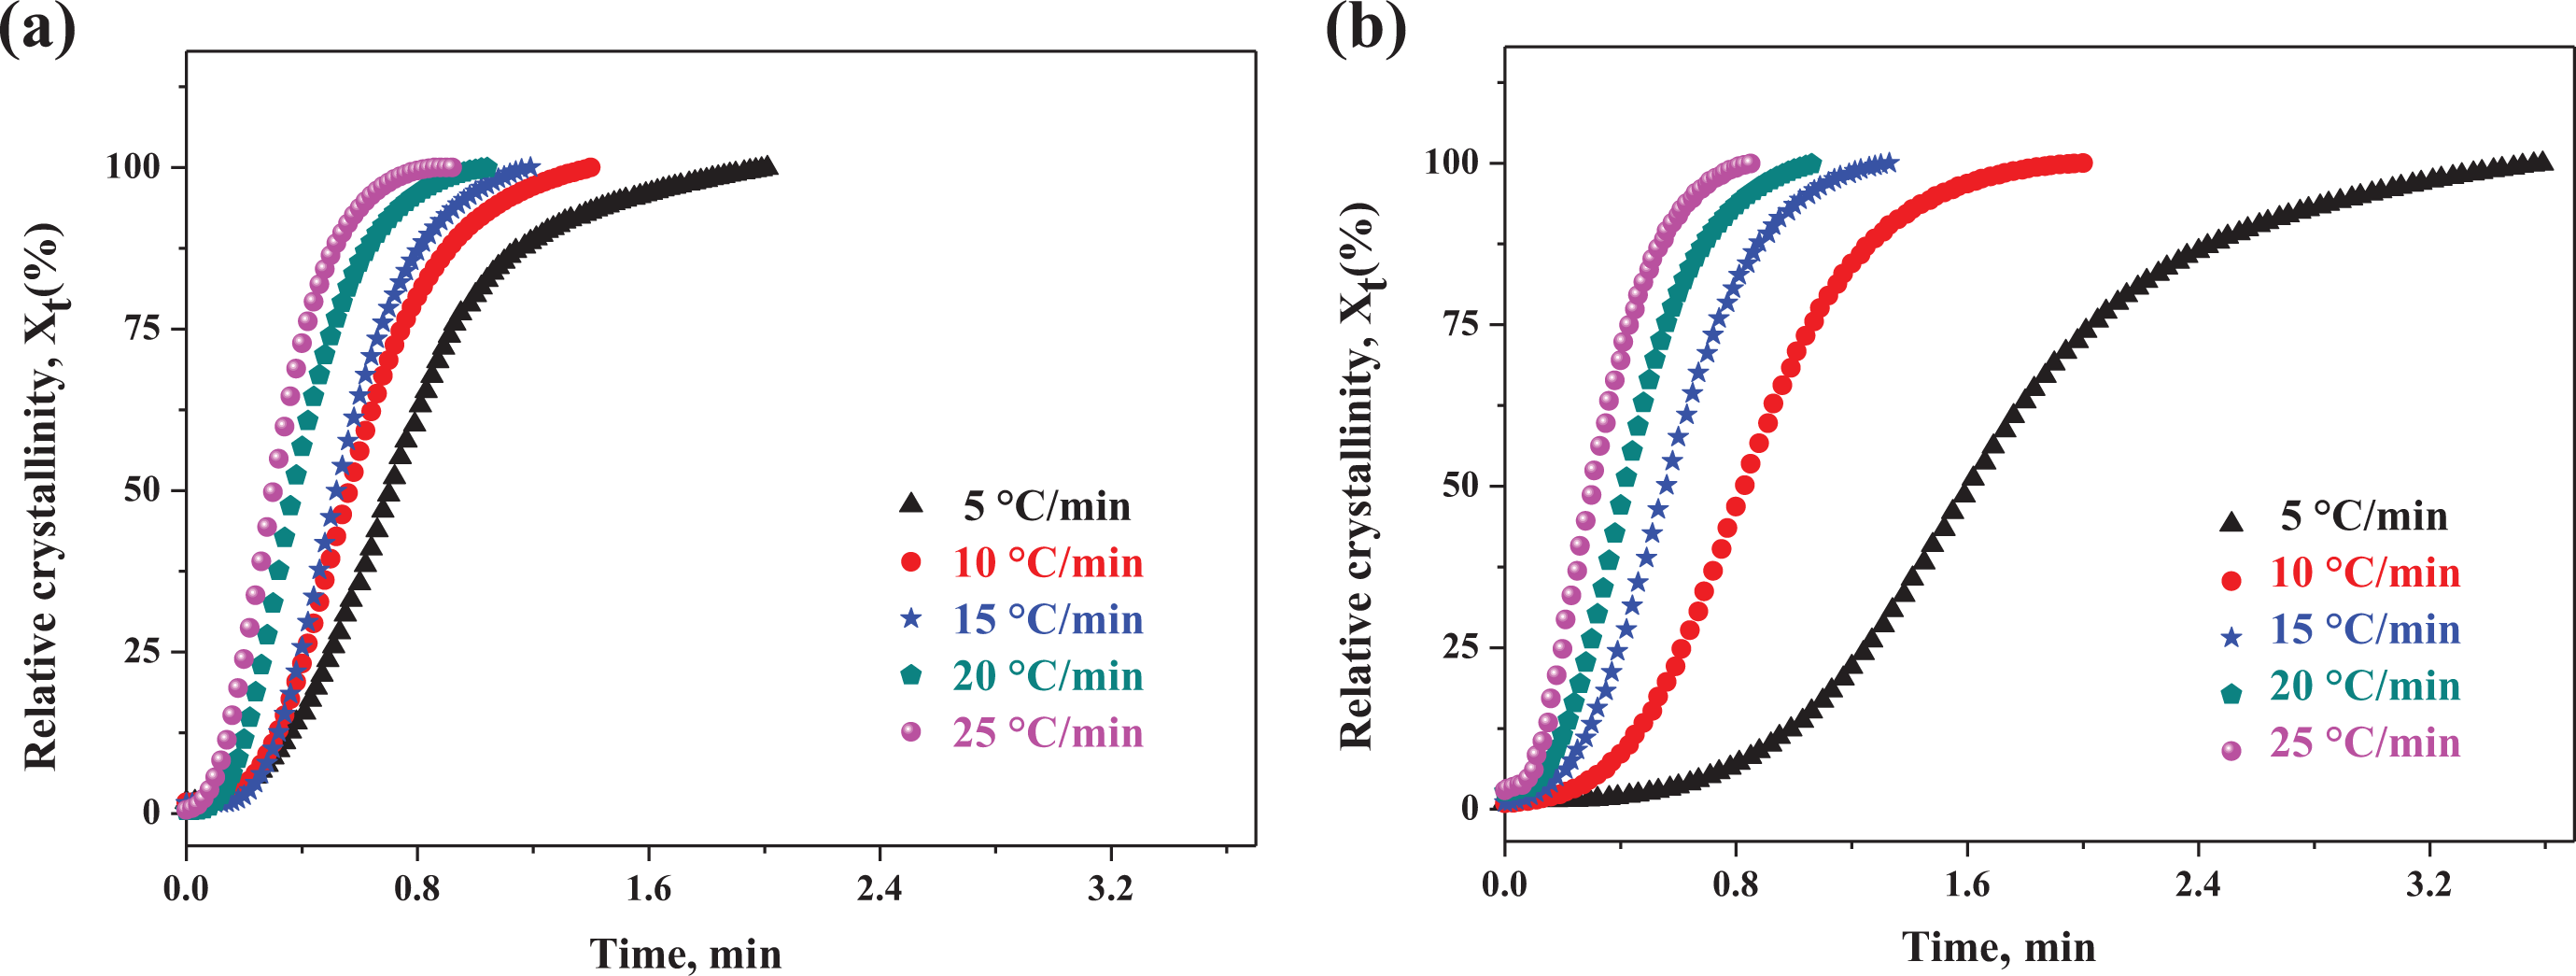
Development of relative crystallinity versus time during nonisothermal crystallization. (a) pure EAA and (b) EAA/CR TPV (EAA/CR = 60/40).
Avrami method
The Avrami equation is usually used to describe the kinetics of isothermal crystallization of polymers; however, it has also been employed to investigate nonisothermal crystallization kinetics,28–31 the Avrami equation was shown as follow:

where the Zt and n values denote the crystallization rate constant and the Avrami exponent, respectively. Both Zt and n depend on the nucleation and growth mechanisms of crystals. Xt is the relative crystallinity of the polymers at different temperatures or times and t is the time taken during the crystallization process. Considering the nonisothermal characterization of the process investigated and the effect of the cooling rate, Jeziorny 32 thought that was corrected by the cooling rate as follows:
where φ is the constant cooling rate and Zt is the kinetic crystallization rate constant.
The plots of ln[−ln(1 − Xt)] versus ln t for the nonisothermal crystallization of the pure EAA and the EAA/CR TPV at five cooling rates of 5, 10, 15, 20, and 25°C min−1 are shown in Figure 4. It could be seen that five almost-parallel straight lines were obtained after linear fitting of Avrami plots by adjusting from Figure 4, which suggested that the Avrami method could be reasonably employed to describe the nonisothermal crystallization of pure EAA and the EAA/CR TPV. The Avrami exponent n and the crystallization rate Zt can be determined from the slope and intercept of the lines. Meanwhile, the crystallization half-time t1/2 was defined as the time when the extent of crystallization was 50%. The Zt, n, and t1/2 at different crystallization temperatures are listed in Table 1. The Zt and n parameters did not have the same physical meaning as in the isothermal crystallization because the temperature varied constantly in the nonisothermal crystallization. This affected the rates of both nuclei formation and crystal growth, which were ascribed to their temperature dependence. Therefore, Zt must be calibrated by the Jeziorny method. The range of the n value was approximately 2–3, which suggested that the nonisothermal crystallization of the EAA/CR TPV corresponded to a growth with heterogeneous nucleation. For the pure EAA and the EAA/CR TPV, the Zt increased roughly while n decreased with increasing the cooling rates; moreover, this result was consistent with that of Eder and Wlochowicz’s work. 33 Usually, two factors would lead to the decrease values of n, the first factor is that the fast crystallization rate at lower temperatures prevented the crystals from their full development, and the second factor is that the growth site impingement, truncation of crystals, and secondary crystallization might change the crystallization mechanism. When the crystalline volume fraction was high, the effects of impingement, truncation of crystals, and secondary crystallization would become very important and decrease the overall crystallization rate obviously. It should be noted that under the same cooling rate, the Zt value of EAA/CR TPV was lower than that of pure EAA, indicating that existence of CR phase in the EAA/CR TPV would hinder the crystallization of the TPV, and steric hindrance caused by the large volume fraction of CR in the EAA/CR TPV was the main reason for delaying the crystallization of EAA/CR TPV.
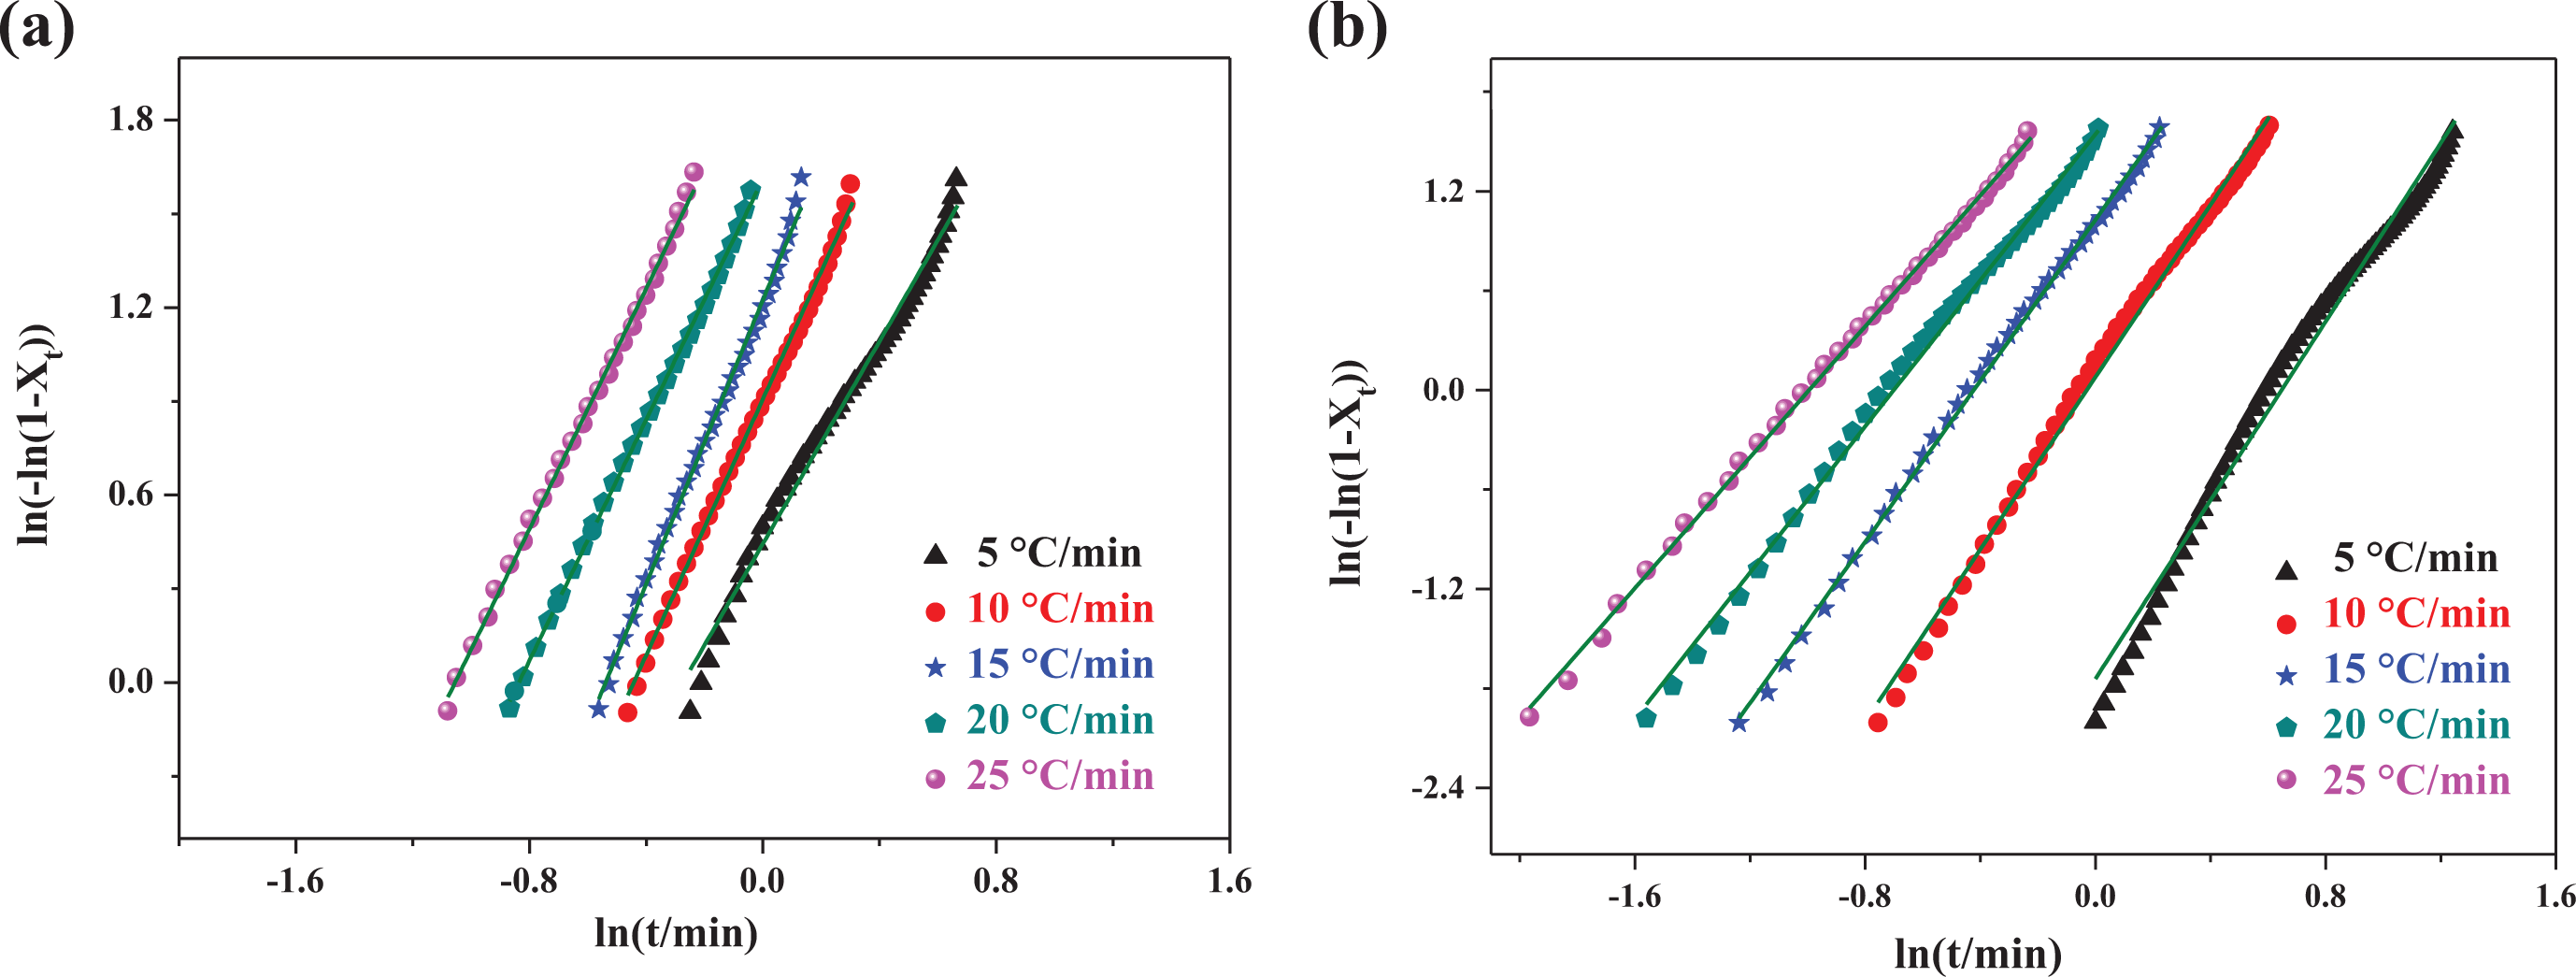
The Avrami plots of ln[−ln(1 − Xt)] versus ln t for the nonisothermal crystallization at five cooling rates of 5, 10, 15, 20, and 25°C min−1: (a) pure EAA and (b) EAA/CR TPV (EAA/CR = 60/40).
The Ozawa method
Ozawa 34 extended the Avrami equation to the nonisothermal condition. Assuming that the nonisothermal crystallization process may be composed of infinitely small isothermal crystallization steps, the following equation was derived:

where Xt is the relative crystallinity, φ is the cooling rate, K(T) is crystallization rate constant, and m is the Ozawa exponent depending on the crystal growth and nucleation mechanism. According to the Ozawa’s theory, Xt can be calculated from these equations. By drawing the plot of ln[−ln(1 − Xt)] versus ln φ at a given temperature, we should obtain a series of straight lines if the Ozawa analysis is valid, and the kinetic parameters m and K(T) can be derived from the slope and the intercept, respectively.
The nonlinear dependence of ln[−ln(1 − Xt)] upon ln φ are shown in Figure 5, from which the Ozawa equation is not suitable to describe the nonisothermal crystallization of the pure EAA and the EAA/CR TPV. For pure EAA and the EAA/CR TPV, crystallization was complicated due to an additional slow process, referred to as secondary crystallization, which was considered to involve the improvement of the crystalline order. The secondary crystallization effect for the pure EAA might be due to the unfulfilled Ozawa equation.
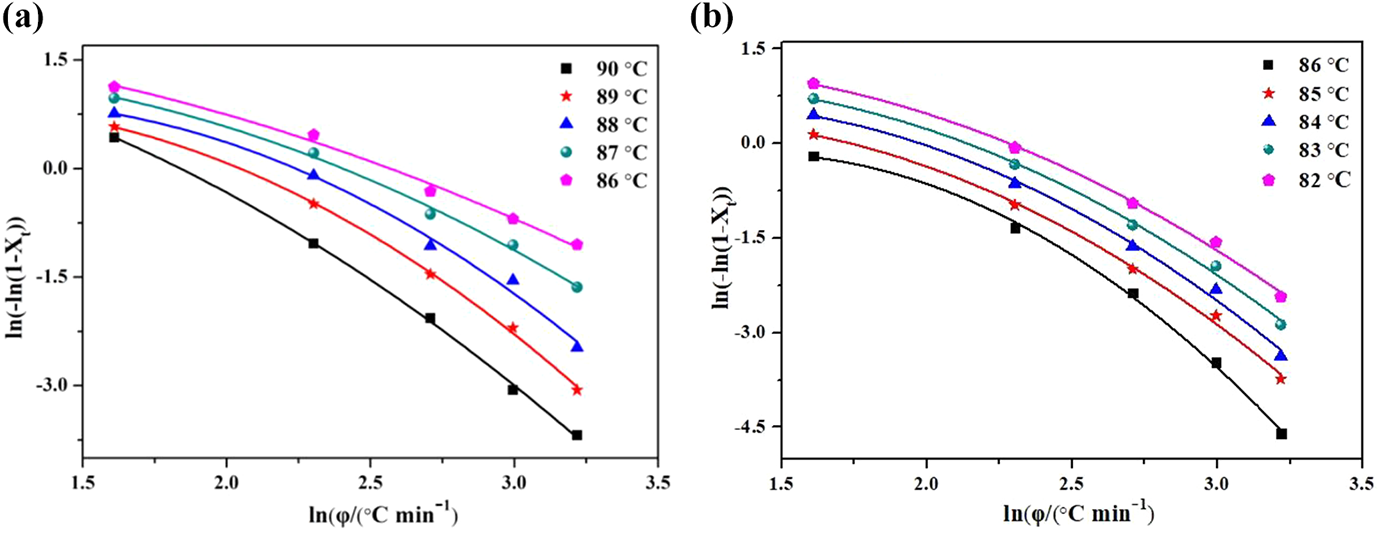
The Ozawa plots of ln[−ln(1 − Xt)] versus ln φ for the nonisothermal crystallization: (a) pure EAA and (b) EAA/CR TPV (EAA/CR = 60/40).
The Mo method
A method developed by Mo was also employed to describe nonisothermal crystallization which combines the Avrami equation with the Ozawa equation. Its final form was given as follows 23 :

where the parameter F(T) = [K(T)/Zt]1/m, and F(T) refers to the value of cooling rate chosen at unit crystallization time when the system amounted to a certain degree of crystallinity. The smaller the value of F(T), the higher the crystallization rate. Therefore, F(T) had a definite physical and practical meaning. α of the formula refers to the ratio of the Avrami exponent n to the Ozawa exponent m (α = n/m). Plotting ln φ versus ln t yields a linear relationship between ln φ and ln t. The data of kinetic parameter F(T) and α can be estimated from the intercept and slope.
The plots of the ln φ versus ln t for the nonisothermal crystallization of the pure EAA and the EAA/CR TPV at various relative crystallinities are shown in Figure 6, from which the values of α and F(T) can be obtained by the slopes and the intercepts of these lines, respectively (Table 2). It can be seen from Table 2 that the values of F(T) increased systematically with an increase in the relative degree of crystallinity. At a given degree of crystallinity, the higher the F(T) value, the faster the cooling rate needed within unit crystallization time, indicating the difficulty of polymer crystallization. Comparing the values of F(T) of different samples, we found that the values of pure EAA were lower than the EAA/CR TPV, indicating that the overall crystallization rate of pure EAA was faster than that of EAA/CR TPV, which was in accordance with the result obtained from the Avrami approach.
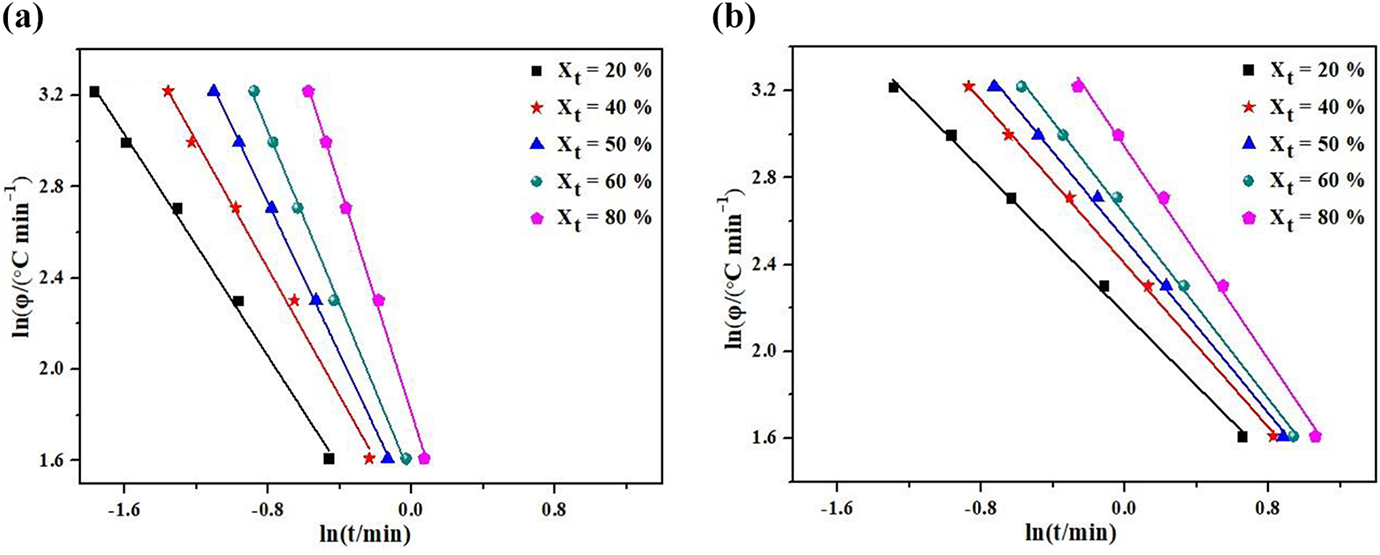
The Mo plots of the ln φ versus ln t for the nonisothermal crystallization: (a) pure EAA and (b) EAA/CR TPV (EAA/CR = 60/40).
The Mo kinetic parameters of nonisothermal crystallized EAA/CR TPV determined using the DSC method.
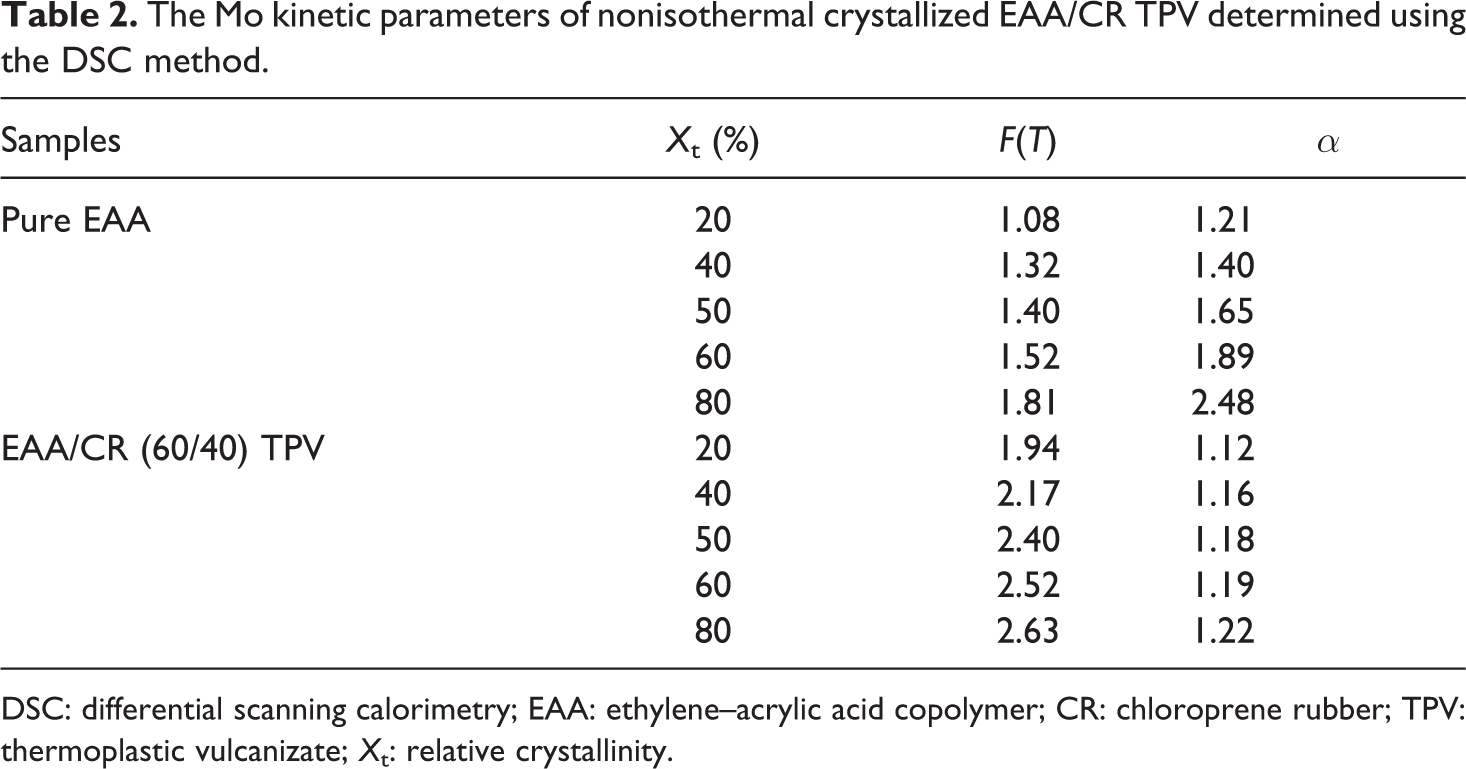
DSC: differential scanning calorimetry; EAA: ethylene–acrylic acid copolymer; CR: chloroprene rubber; TPV: thermoplastic vulcanizate; Xt: relative crystallinity.
Conclusion
In this work, according to three various kinetic models, namely, the Avrami, the Ozawa and the Mo method, nonisothermal crystallization kinetics of pure EAA and the EAA/CR TPV were investigated in detail. The Avrami equation modified by Jeziorny’s method and the Mo method were successful for describing the nonisothermal crystallization process of the pure EAA and the EAA/CR TPV. Meanwhile, the Ozawa equation failed to provide an adequate description of nonisothermal crystallization. Both cooling rate and CR dosage were the two main factors that influence the nonisothermal cold crystallization behavior of EAA in the EAA/CR TPV. On the one hand, with the increasing of cooling rates, the crystallization exotherm shifts to larger temperature range, and the crystallization process was enhanced for both pure EAA and the EAA/CR TPV. On the other hand, at a given cooling rate, the addition of CR enhanced the nonisothermal cold crystallization of EAA; however, the more CR could cause the steric effect and retard the crystallization process of the TPV; furthermore, in the Avrami method, the parameters Zt and t1/2 suggested that the rates of crystallization for all samples increased with the increasing of cooling rates. The changes in the n value illustrated that the crystallization mechanisms of the pure EAA and the EAA/CR TPV were different. Particularly, t1/2 showed that the crystallization rate of pure EAA was higher than that of the EAA/CR TPV with the given cooling rates.
Footnotes
Funding
The author(s) disclosed receipt of the following financial support for the research, authorship, and/or publication of this article: This work was supported by Shandong Provincial Natural Science Foundation, China (ZR2017MEM021) and Upgraded Project of Shandong Province for Guidance Ability of Graduate Tutors (SDYY17044).