
Abstract
The nanocomposites of high-density polyethylene, low-density polyethylene, polypropylene, and poly(vinyl chloride) reinforced with Azadirachta indica wood flour (WF) and different amounts of the organomodified nanoclay and titanium dioxide (TiO2) nanopowder were produced by melt-blending process followed by compression molding. Polyethylene-co-glycidyl methacrylate (PE-co-GMA) was used as a compatibilizer. TiO2 nanopowder was synthesized by sol–gel method and characterized using transmission electron microscopy (TEM). The average size of the synthesized nano-TiO2 was 17.5 nm, which was confirmed both by TEM and X-ray diffraction (XRD) study. The distribution of nanoparticles in the nanocomposites was also examined by the XRD study. The surface modification of the TiO2 nanoparticles by organic surfactant cetyl trimethyl ammonium bromide and their interaction with the wood and the polymer were studied by Fourier transform infrared spectroscopy. Incorporation of compatibilizer PE-co-GMA, nanoclay, and nano-TiO2 significantly influenced the mechanical and thermal properties of the WF-reinforced composites. Wood polymer composites (WPC) reinforced with nanoclay and nano-TiO2 showed improved tensile strength, tensile modulus, flexural strength, flexural modulus, and hardness. Maximum improvement in mechanical properties was shown by WPC loaded with 40 phr WF, 2 phr nanoclay, and 2 phr of nano-TiO2. On inclusion of organically modified nanoclay and nano-TiO2, the WPC samples showed lower water uptake and higher chemical resistance. The nanocomposites were further examined by TEM study and thermogravimetric analyzer.
Introduction
Wood polymer composites (WPCs) have various applications ranging from outdoor purposes to construction industries and are considered a new generation of green composites.1–3 Wood and plastics are extensively used all over the world due to their versatile properties; however, they do exhibit certain limitations. For instance, woods are susceptible to microbial and fungal attacks, have poor mechanical properties due to water absorption property, and are vulnerable to photodegradation process, 4 while plastics are nonrenewable and nonbiodegradable. Owing to such limitations, in the last 40 years, an engineered material called WPC became the dynamic sector of the present-day construction material industry. WPCs are formed by impregnating wood with thermoplastics and thermosetting resin by in-situ polymerization and thus have two main constituents (Figure 1(a)): a polymer matrix and a wood component, which is the reinforcing phase. 5 Polypropylene (PP), polyethylene (PE), poly(vinyl chloride) (PVC), poly(ethylene terephthalate), and so on, are used as the matrix in WPC. Apart from wood, the usage of other lignocellulosic and inorganic filler materials, such as sisal, jute, wood fiber (WF), sugarcane, wheat, pulp fibers, peanut hulls, bamboo, straw, and so on, to improve mechanical properties and to reduce the shrinkage of material was also reported.1–7 However, despite its popularity, a major concern for WPC is that wood continued to be susceptible to microbial and fungal attacks due to its carbon constituents like cellulose, lignin, and hemicellulose. Furthermore, the lack of chemical compatibility and interfacial adhesion within the composite system resulted in filler debonding from the matrix. Thus, to improve the adhesion between the components, the addition of compatibilizers and coupling agents was employed.8–11 Improved mechanical properties of the composites were reported with the addition of additives, such as maleated polypropylene, polyethylene-co-glycidyl methacrylate (PE-co-GMA), glycidyl methacrylate (GMA), coupling agents, such as silane, peroxide, acetic acid, and so on.12–14 Currently, nanoscale fillers are used in the polymer composites due to their exceptionally high surface to volume ratio and high aspect ratio. Among many nanofillers, titanium dioxide (TiO2) and silicon dioxide nanopowders are commonly used while montmorillonite clay mineral stands as the most heavily used fillers for polymer layered silicate. Using layered silicate and montmorillonite clay improves the tensile and flexural properties, flame retardancy, and reduces water absorption in WPCs.15–20 Deka and Maji found that the reinforcing of the plastic matrix with wood gave composites of high strength and stiffness with low carbon dioxide emission and superior biodegradability and renewability. 14 They also found that a higher concentration of wood filler resisted ultraviolet degradation. Ismaya et al. and Arora et al. found that apart from improving the physical and mechanical properties, nanoscale TiO2 is used in photocatalysis for chemical degradation and antimicrobial activity.21,22 Madidi et al. found that TiO2 nanocomposites are used for preparing self-cleaning superhydrophobic coatings. 23 The majority of the literature reports reveal that disposed postconsumer plastic materials predominantly consist of the thermoplastics polyethylene, polypropylene followed by polyvinyl chloride, and comparatively lesser amounts of polystyrene, polyethylene terephthalate, and so on. The segregation of these postconsumer plastic materials is a major concern. Therefore, it is assumed that the use of multiple types of polymers in making WPCs may provide useful practical information contributing toward the reduction of environmental pollution caused by the waste plastics.8,13,24,25 Keeping in view of all these, the present study focused on the development of wood polymer hybrid nanocomposite (WPNC) using polymer mixture of high-density polyethylene (HDPE), low-density polyethylene (LDPE), PP, PVC (1:1:1:0.5), Azadirachta Indica (Neem) wood flour, PE-co-GMA as compatibilizers with incorporation of organically modified nanoclay and TiO2 nanopowder. Further investigation was done on the effect of compatibilizers and nanofillers in the physical and mechanical properties of the developed composites.
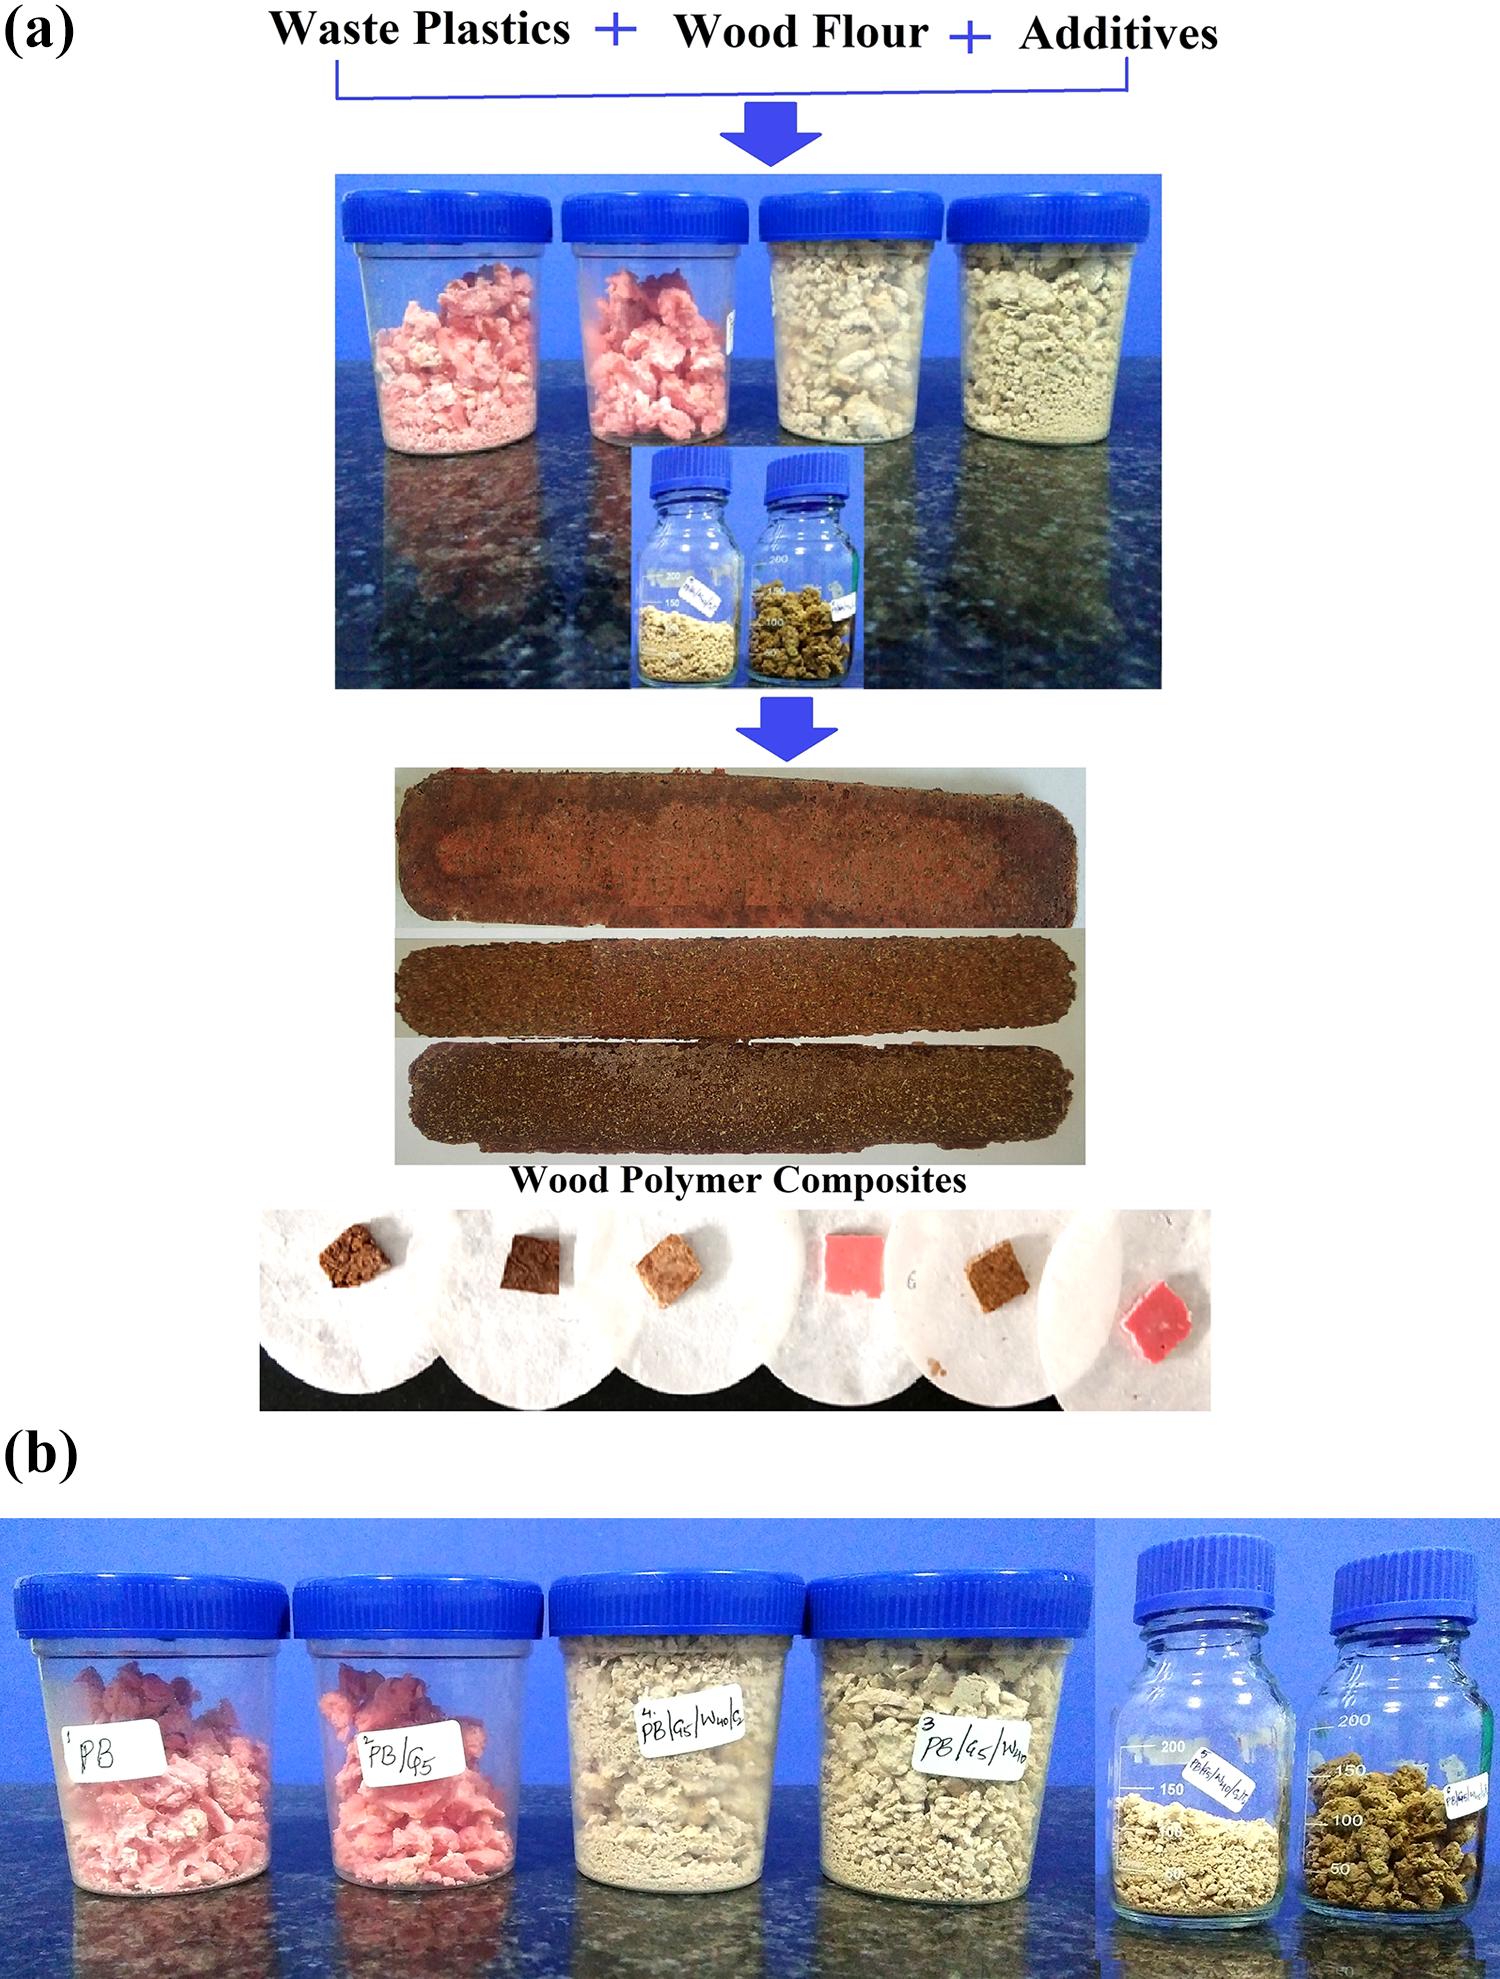
(a) Pictorial representation of wood polymer composites and (b) optical image of different wood polymer nanocomposites.
Experiment
Materials
Waste LDPE, HDPE, and PVC were obtained from the laboratory of the Department of Science and Humanities, National Institute of Technology Nagaland. Injection grade-recycled PP was collected from the Central Institute of Plastics Engineering and Technology (CIPET), Guwahati. The compatibilizer PE-co-GMA brought from Otto chemicals, Mumbai, India, was used as received. N-cetyl-N, N, N-trimethyl ammonium bromide (CTAB) and sodium hydroxide pellets were obtained from Sisco Research Laboratories, Mumbai, India. Nanoclay (modified by 15–35 wt% octadecylamine and 0.5–5 wt% aminopropyltriethoxysilane) and titanium isopropoxide were brought from Sigma-Aldrich, St. Louis, MO, USA. Waste A. indica wood flour was collected from local furniture shops in Chumukedima, Nagaland, India.
Treatment of wood samples
Wood dust was collected and sieved in 600-µm sized sieving instrument in the Civil Engineering Workshop of NIT Nagaland. The sieved wood flour was treated with 1% sodium hydroxide (NaOH) for 1 h at 60°C. This treated WF was washed several times with deionized water to remove excess NaOH. It was oven-dried at 80°C until having constant weight. 26
Synthesis of TiO2 nanopowder by sol–gel method
TiO2 was prepared using titanium isopropoxide (TTIP), deionized water, and isopropyl alcohol as the starting materials. Isopropyl alcohol (100 mL) was added to 15 mL of TTIP in a 200-mL beaker. The mixture solution was stirred for 10 min using a magnetic stirrer to which 10 mL of deionized water was added dropwise. The solution was stirred continuously for 2 h after which the mixture transformed into gel on aging for 24 h. The gel was then filtered and dried. The dried nano-TiO2 was calcinated at 550°C. After calcination, the synthesized nano-TiO2 powder was grinded in a mortar and used for further work.
Modification of TiO2
The prepared TiO2 (1.5 g) was taken in a round-bottom flask containing 1:1 ethanol–water mixture. The round-bottom flask was fitted with spiral condenser and stirred at 80°C for 12 h. In another beaker containing ethanol–water mixture (1:1), 1.85 g of CTAB was taken and stirred for 3 h at 80°C. After then, both the mixtures were mixed and stirred for another 6 h. It was followed by filtration and washing with deionized water several times. The modified TiO2 nanopowder was collected, dried in an oven at 45°C, grinded, and stored in a desiccator to avoid moisture absorption. 27
Preparation of wood polymer nanocomposites
The waste plastics were collected and first washed with soap and deionized water. This was then finally chopped and dried at 80°C. The wood polymer nanocomposites were prepared by following the method reported in the previous literature.6–8 Briefly, HDPE, LDPE, and PP (1:1:1 ratio, 6 g of each) were taken in a round-bottom flask and fitted with a condenser. It mixed with 105 mL of xylene, to which 5 phr of PE-co-GMA was added. The temperature was then raised to 130°C. Stirring was continued to homogenize the solution. A separate solution containing 3 g of PVC in 35 mL of tetrahydrofuran (THF) was prepared. The PVC solution was then mixed with the previous polymer solution whose temperature has now been decreased to 120°C. The mixture is then stirred for about 1 h. CTAB-modified TiO2 nanopowder (2 phr) and nanoclay (2 phr) were dispersed in 15 mL of THF solution using magnetic stirrer and sonication. This dispersed mixture was added gradually to the polymer solution while stirring. Treated and dried WF (40 phr/45 phr) was added gradually to this nanoparticle-dispersed polymer matrix solution. The whole mixture was continued to stir for an additional 1 h. After then, the mixture was transferred in a wide-open tray. The residual solvent was removed from the wood–polymer mixture. After complete drying, it was grinded. The nanocomposite samples obtained (Figure 1(b)) were designated, as illustrated in Table 1. The composite sheets were obtained by the compression molding press (Santec, New Delhi, India) at 170°C under a pressure of 80 MPa.
The nanocomposite sample formulations.
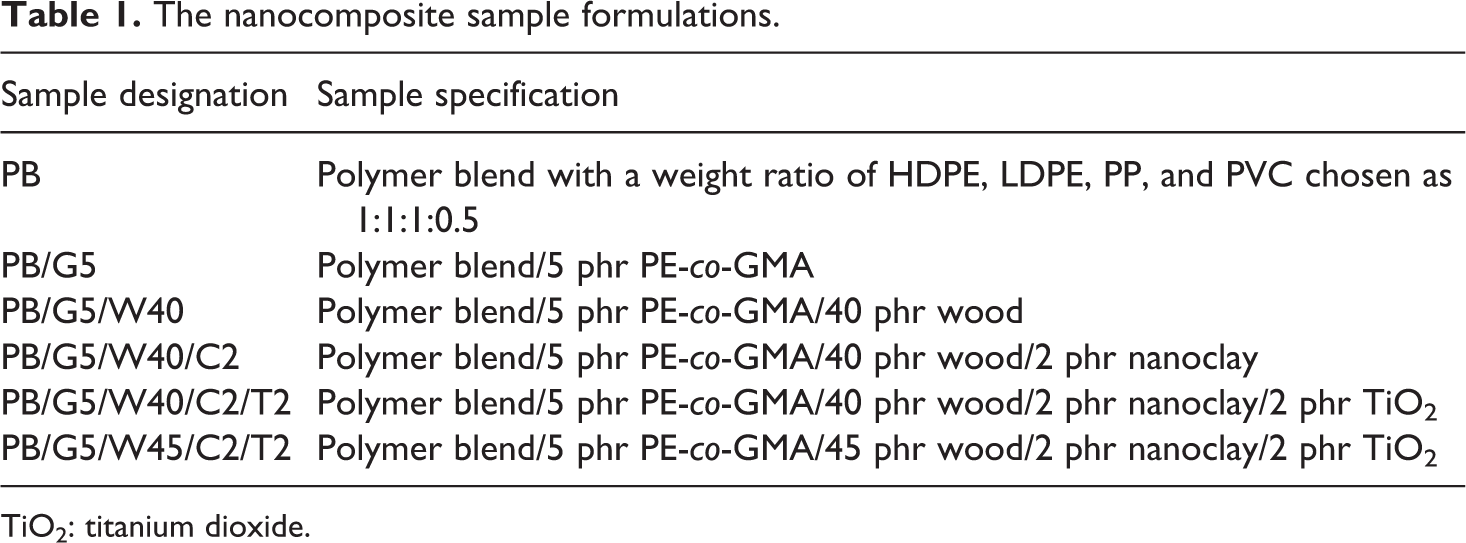
TiO2: titanium dioxide.
Measurements
Fourier transform infrared studies
Fourier transform infrared (FTIR) spectra of wood flour, TiO2 nanopowder, and WPC loaded with nanoclay and TiO2 nanopowder were recorded using a single-beam FTIR spectrophotometer (carry 630 FTIR) at room temperature in the range of 500–3500 cm−1. All the samples were prepared by maintaining the sample and potassium bromide (KBr) ratio as approximately 1:25. Each of the powder samples was mixed with KBr and then, they were finely grounded in a mortar. To make the pallets, 4–10 mg of the sample and KBr mixture was pressed in a hydraulic press.
X-Ray diffraction studies
X-Ray diffraction (XRD) analysis was used to find the degree of dispersion of nanoclay and nano-TiO2 powder in the WPC. The analysis was carried out in a Rigaku X-ray diffractometer (Ultima IV, Tokyo, Japan) using copper Kα (λ = 0.154 nm) radiation at a scanning rate of 3° min−1 with an angle ranging from 10° to 70°.
Transmission electron microscopy studies
The dispersion of the silicate layers of nanoclay and TiO2 nanoparticles in WPNCs was studied and performed using transmission electron microscopy (TEM; JEOL JEM 2100, Tokyo, Japan) at an accelerated voltage of 200 kV.
Study of mechanical properties
The universal testing machine (Zwick, Germany; model Z010) was used to study the tensile and flexural tests for the polymer blend (PB), compatibilizer-treated PB, and WPC loaded with nanoclay and TiO2. All the tests were carried out at a crosshead speed of 10 mm min−1 at room temperature. Tensile and flexural tests were carried out according to ASTM D638 and D-790, respectively. Two specimens of each category were tested and their average values were reported.
Study of hardness
The hardness of the samples was measured according to ASTM D-2240. A durometer (model RR12) was used to measure the hardness of all the nanocomposite samples and the result was expressed as shore D hardness.
Water uptake and water absorption test
Water uptake test was performed by cutting the WPC samples into 2.5 × 0.5 × 2.5 cm3 and then by immersing the samples in distilled water at room temperature (27°C) for different time periods (1, 3, 18, 24, 48, and 72 h). The samples were then conditioned at room temperature (27°C) before measuring the weights of the samples. Percentage of water uptake was then calculated using the formula

where Ws is the weight of the water-saturated specimen and W1 is the weight of the oven-dried specimen. The experiments were performed in triplicate and represented as a mean value.
Chemical resistance test
For chemical resistance test, the ASTM D-543-95 method was followed. The samples were submerged for 5 days in hydrochloric acid (HCl) (10%) and hydrogen peroxide (H2O2) (10%) at room temperature. After then, the samples were dried in an oven and the percentage weight change of the samples was measured. The tests for every sample were carried out in triplicate and represented as a mean value.
Thermal stability test
Thermogravimetric analysis (TGA) provides quantitative information on weight change process. Thermal behavior of the PB matrix, WF, and composites was recorded by employing a thermogravimetric analyzer (Mettler-Toledo, India) at a heating rate of 10°C min−1 in the temperature range of 30–600°C. All the investigations were done under nitrogen atmosphere.
Results and discussions
FTIR study
Figure 2 shows the FTIR spectra of CTAB, TiO2, CTAB-modified TiO2, and nanoclay. The absorption peaks at 2916, 2842, and 1476 cm−1 in the spectrum of CTAB (Figure 2(a)) can be explained by asymmetric, symmetric, and scissor modes of –CH2 stretching in the methylene chains, respectively. 28
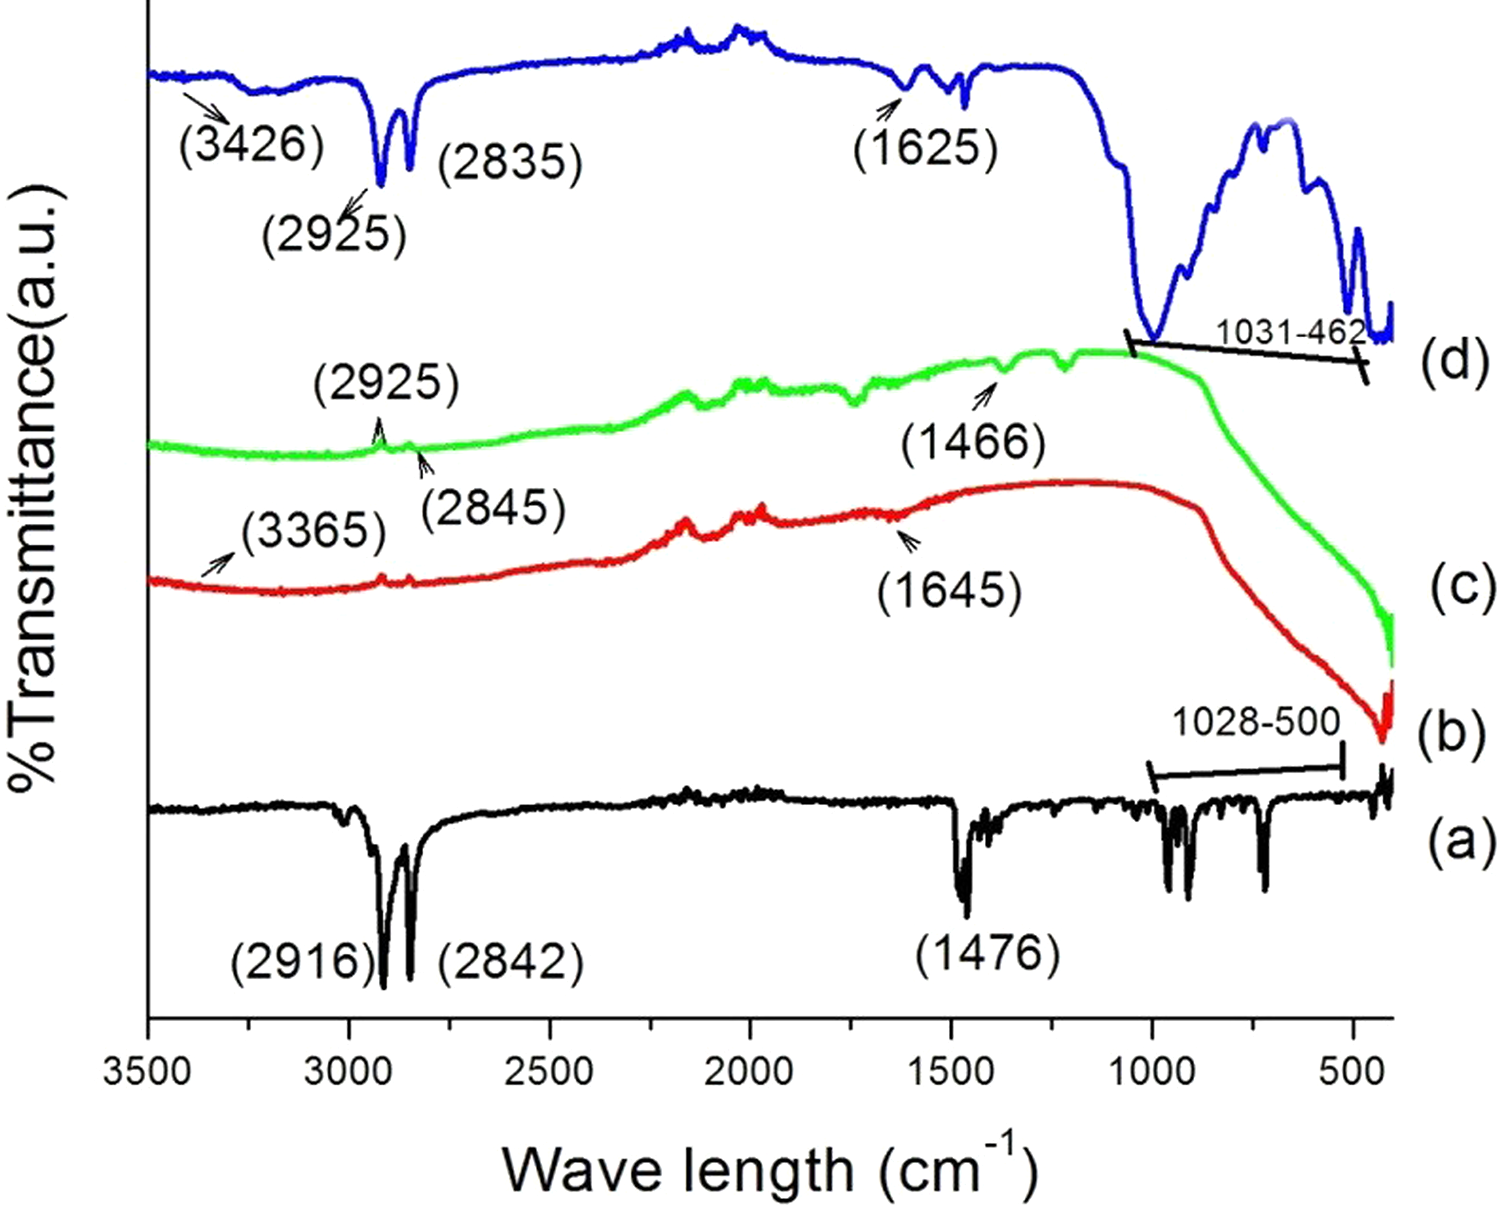
FTIR spectra of (a) CTAB, (b) TiO2 nanopowder, (c) CTAB-modified TiO2, and (d) nanoclay.
Spectrum of unmodified TiO2 nanoparticles in curve (b) has strong absorbance peak at 1028–500 cm−1, which attributes to Ti–O–Ti stretching. Xu and Yang and Qu et al. assigned peaks at 3365 and 1645 cm−1 to the surface hydroxyl groups of TiO2. –OH stretch intensity in CTAB-modified TiO2 increased, indicating an interaction of the hydroxyl group absorbed on TiO2 surface with CTAB (curve c). The reported literature further explained that the shift of frequencies from 2916, 2842, and 1476 cm−1 of CTAB to 2925, 2845, and 1466 cm−1, respectively, is due to incorporation of –CH2 group of CTAB.29–31 When CTAB-modified TiO2 was dispersed in a flask containing xylene, dispersion of TiO2 was found to be stable. This indicated the incorporation of CTAB on the surface of TiO2 particles, as explained by Qu et al. 32 Organically modified nanoclay (curve (d)) shows –OH stretch at 3426 cm−1 and –OH bending at 1625 cm−1. –CH stretching of modified hydrocarbon was observed at 2925 and 2835 cm−1 and oxides of Si, Al, and Mg peaks were seen at 462–1031 cm−1. 33
Figure 3 shows the FTIR spectra of wood, WPC, and WPC loaded with nanoclay (2 phr) and TiO2 (2 phr). In curve (a), –OH stretching is seen at 3433 cm−1 and –CH stretch at 2944 and 2798 cm−1. The peaks at 1731 and 1638 cm−1 denote C=O stretching while peaks at 1000–500 cm−1 indicate C–H bending vibration of the wood sample. PB curve shows bands at 2920 and 2841 cm−1 for –CH stretching and 1459 and 1375 cm−1 for C–O stretching. PB/G5/W40 curve showed –OH stretching at 3303 cm−1 followed by –CH stretching at 2914 and 2847 cm−1, C–O stretch at 1459 and 1375 cm−1, and –CH2 bending at 1016 cm−1. Curves d and e show the FTIR spectra of WPC/G5/W40/C2/T2 and WPC/G5/W45/C2/T2, respectively. From the figure, it was observed that the position of –CH stretching as compared to wood (2944 cm−1) was shifted to 2902 cm−1 (curves d and e). The position of the hydroxyl group was found to shift from 3433 cm−1 to 3267 cm−1 (curve d) and (curve e). This suggested a steady interaction between the hydroxyl group of wood, clay, and TiO2. The decrease in intensity of metal oxides band at 500–1000 cm−1 (curves d and e) also confirms the formation of bond between wood, TiO2, and polymers.
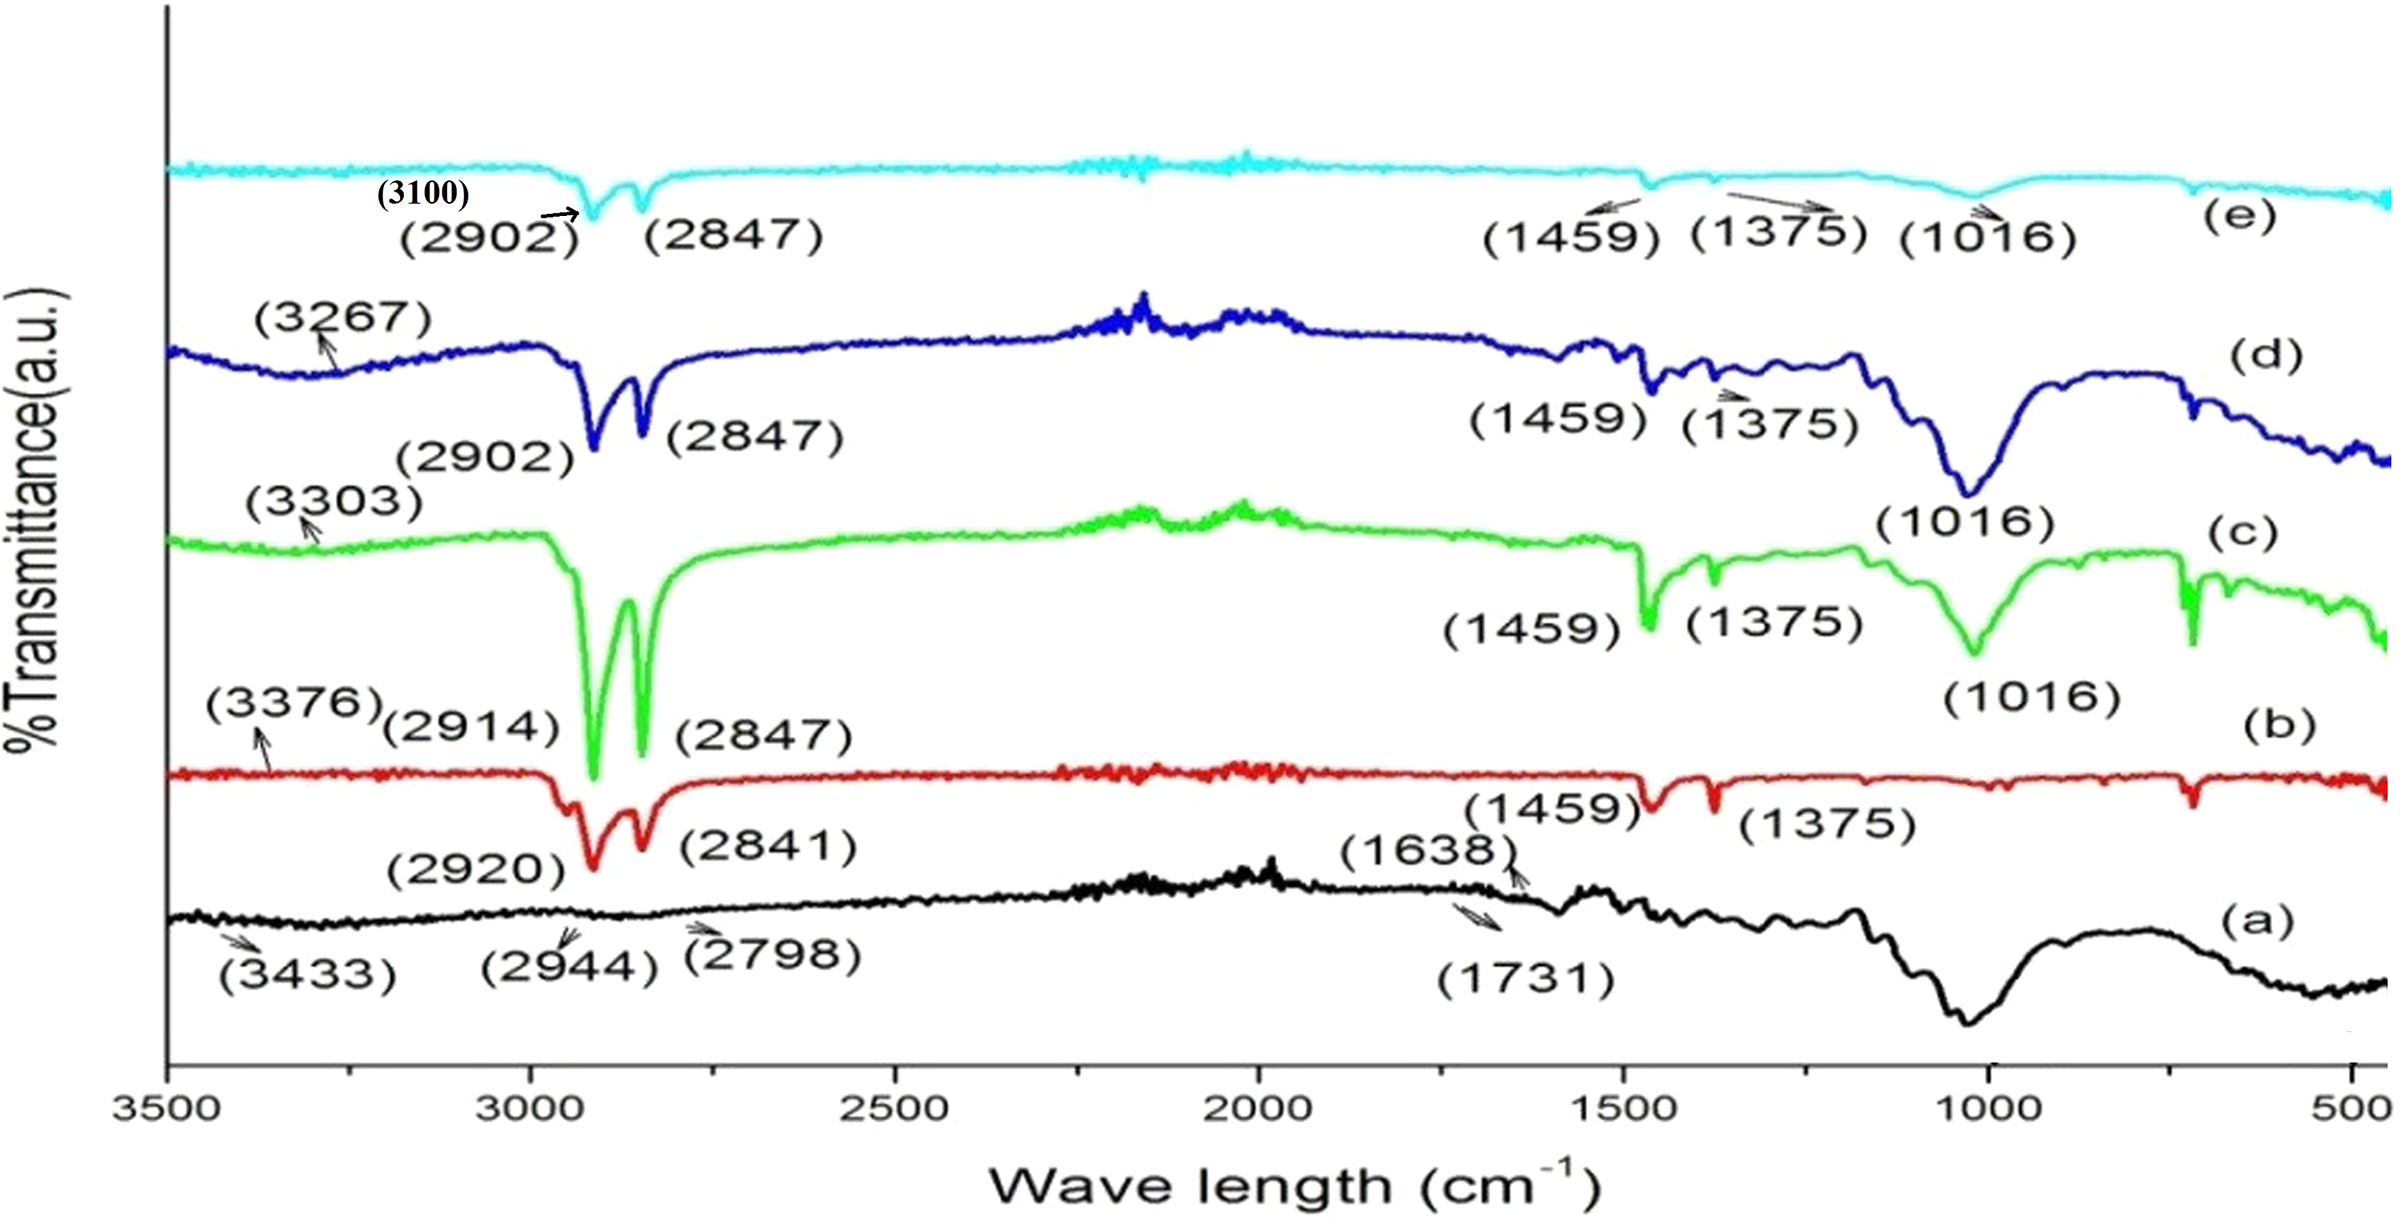
FTIR spectra of (a) wood, (b) PB, (c) PB/G5/W40, (d) PB/G5/W40/C2/T2, and (e) PB/G5/W45/C2/T2.
XRD study
XRD results of nanoclay, PB, TiO2, and WPC loaded with clay (2 phr) and TiO2 (2 phr) are shown in Figure 4. Organically modified nanoclay (curve a) showed the diffraction peak at 2θ = 19.61°. In the diffractogram of PB (curve b), the most prominent wide-angle XRD peaks appeared at 2θ = 14.12° (200), 17.06° (040), 18.64° (211), and 21.62° (110). According to Yeha et al., 34 Rulison et al., 35 and Zhang et al., 28 the peaks were for crystalline portion of the various polymers present in the blend. The peaks of crystalline portion of nano-TiO2 (curve c) appeared at 2θ = 27.33° (110), 36.11° (200), 37.79° (111), 47.87° (210), and 54.32° (211).34–36 From powder XRD results, the crystallite size can be estimated from width of the peak through the use of Scherrer equation: D = K λ/β Cos θ, where D is the crystallite size, λ is the wavelength of X-ray radiation (λ = 1.54060 Å), K is a constant and usually taken as 0.9, β is the full-width at half-maximum after subtraction of equipment broadening, and θ is the Bragg angle of the peak.37–39 From the powder XRD spectrum, the average crystallite size of nano-TiO2 is found to be 17.5 nm. Curves d to f represent the diffractograms of WPC loaded without/or with nanoclay (2 phr) and TiO2 (2 phr), where the spectra did not exhibit any characteristic peak of nanoclay. This disappearance of nanoclay diffraction peak may be due to exfoliation of silicate layers in the wood polymer matrix. However, the crystalline peak intensity of the PB in the range of 2θ = 15–30° was found to be same because of using the same amount of TiO2 (2 phr).40–44 All the data obtained suggested that nanoclay layers were exfoliated and TiO2 particles were dispersed in the wood polymer matrix.
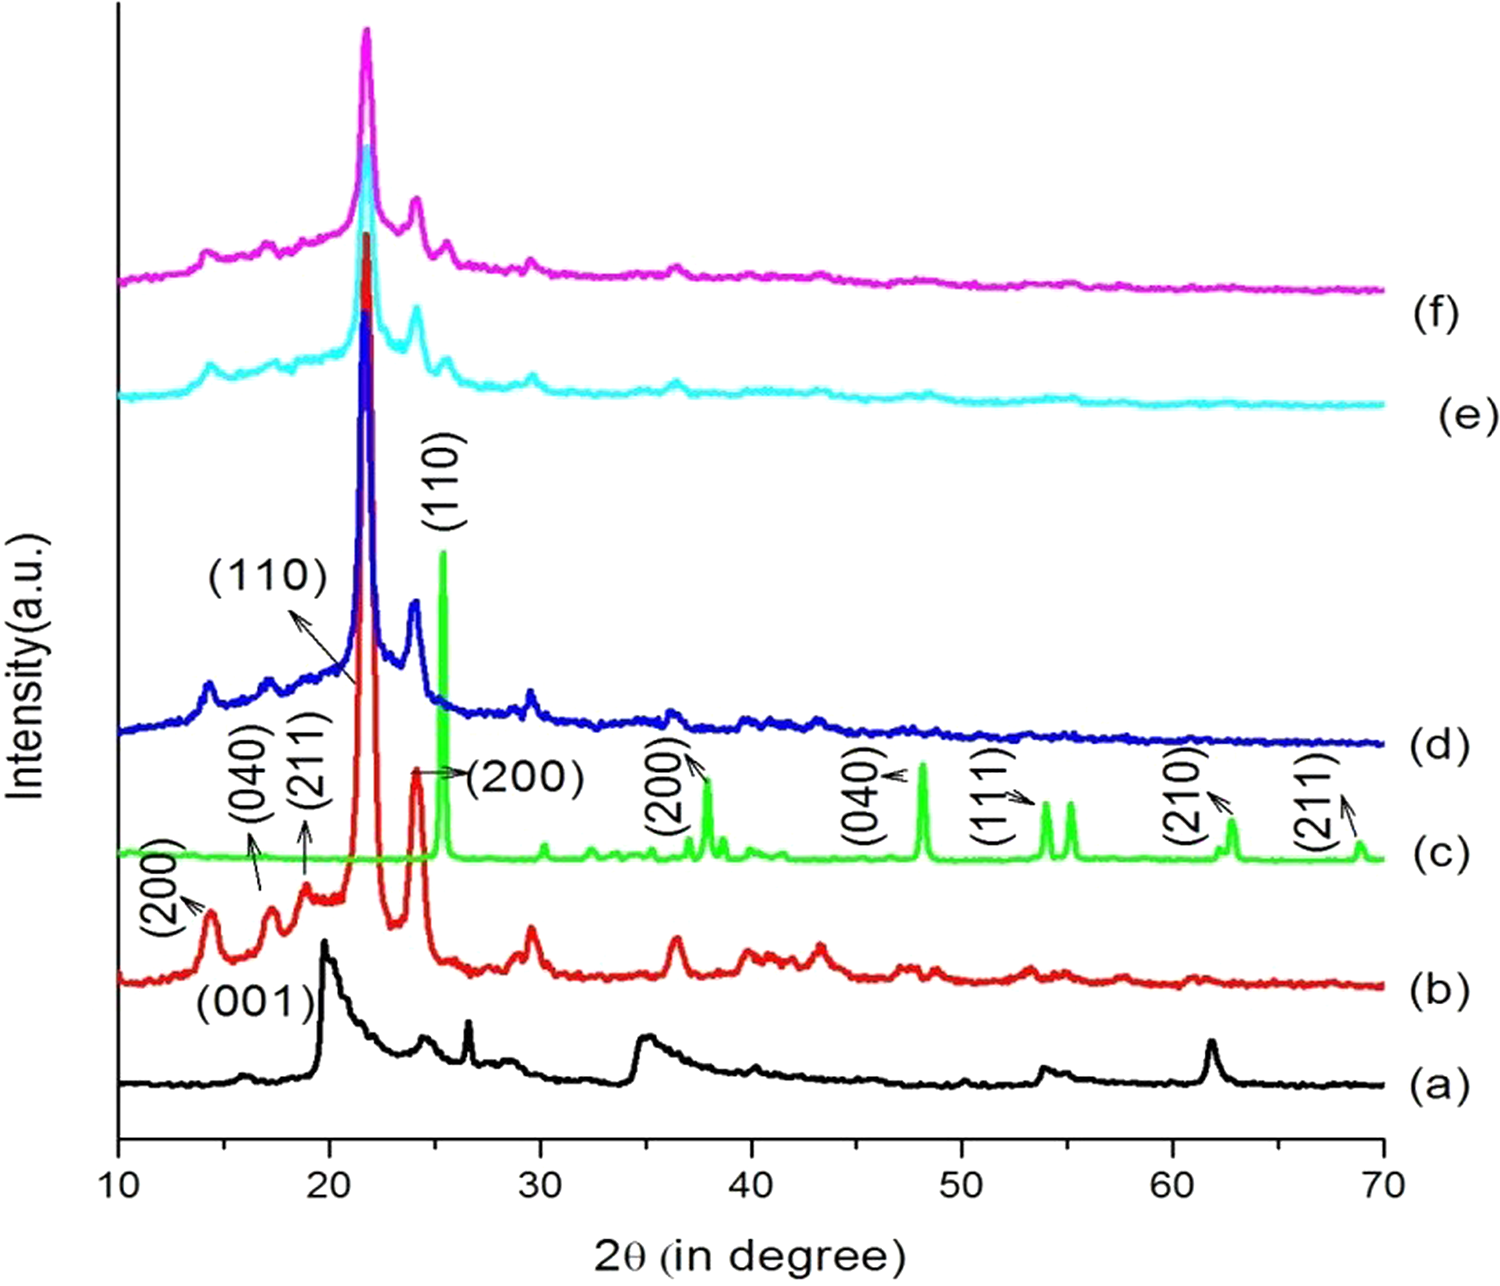
X-ray diffraction of (a) nanoclay, (b) PB, (c) nano-TiO2, (d) PB/G5/W40, (e) PB/G5/W40/C2/T2, and (f) PB/G5/W45/C2/T2.
TEM study
Figure 5 shows the TEM micrographs of nano-TiO2, nanoclay, PB/G5/W40/C2/T2, and PB/G5/W45/C2/T2 composite samples. From the micrograph of nano-TiO2 (Figure 5(a)), it is seen that the nano-TiO2 are spherical-like shapes having size distribution ranging from 7 nm to 25 nm. The average size calculated is 17.5 nm, which is also confirmed by XRD studies. It was further seen that most TiO2 crystallites formed close-packed domains.45,46 TEM micrograph in Figure 5(b) shows the compact arrangement of packed layered structure of montmorillonite clay. The thin gray dark lines arranged like zebra pattern in the TEM micrograph of nanoclay, as depicted in Figure 5(b), indicate the segregation of individual clay platelets as a result of Van der Waal’s bond breakage by high shear force.47,48 Figure 5(c) and (d) shows the TEM micrographs of WPC loaded with nanoclay, TiO2 (2phr), and different percentage of wood flour. The dark lines shown in the figures showed the incorporation of the silicate layers of nanoclay, while the black spots were the TiO2 nanoparticles. Deka et al. studied the effect on TiO2 and nanoclay on WPC and observed a similar pattern, which indicated an even dispersion of clay and TiO2 in the polymer.6–8,13 At lower resolution (Figure 5(c) and (d)), we can clearly see the comparatively long wood fibers along with spherical TiO2 nanoparticles and thin dull gray lines due to nanoclay. At higher resolution, the gray layers of nanoclay become clearer in the TEM micrographs (inset image in Figure 5(b) to (d)).
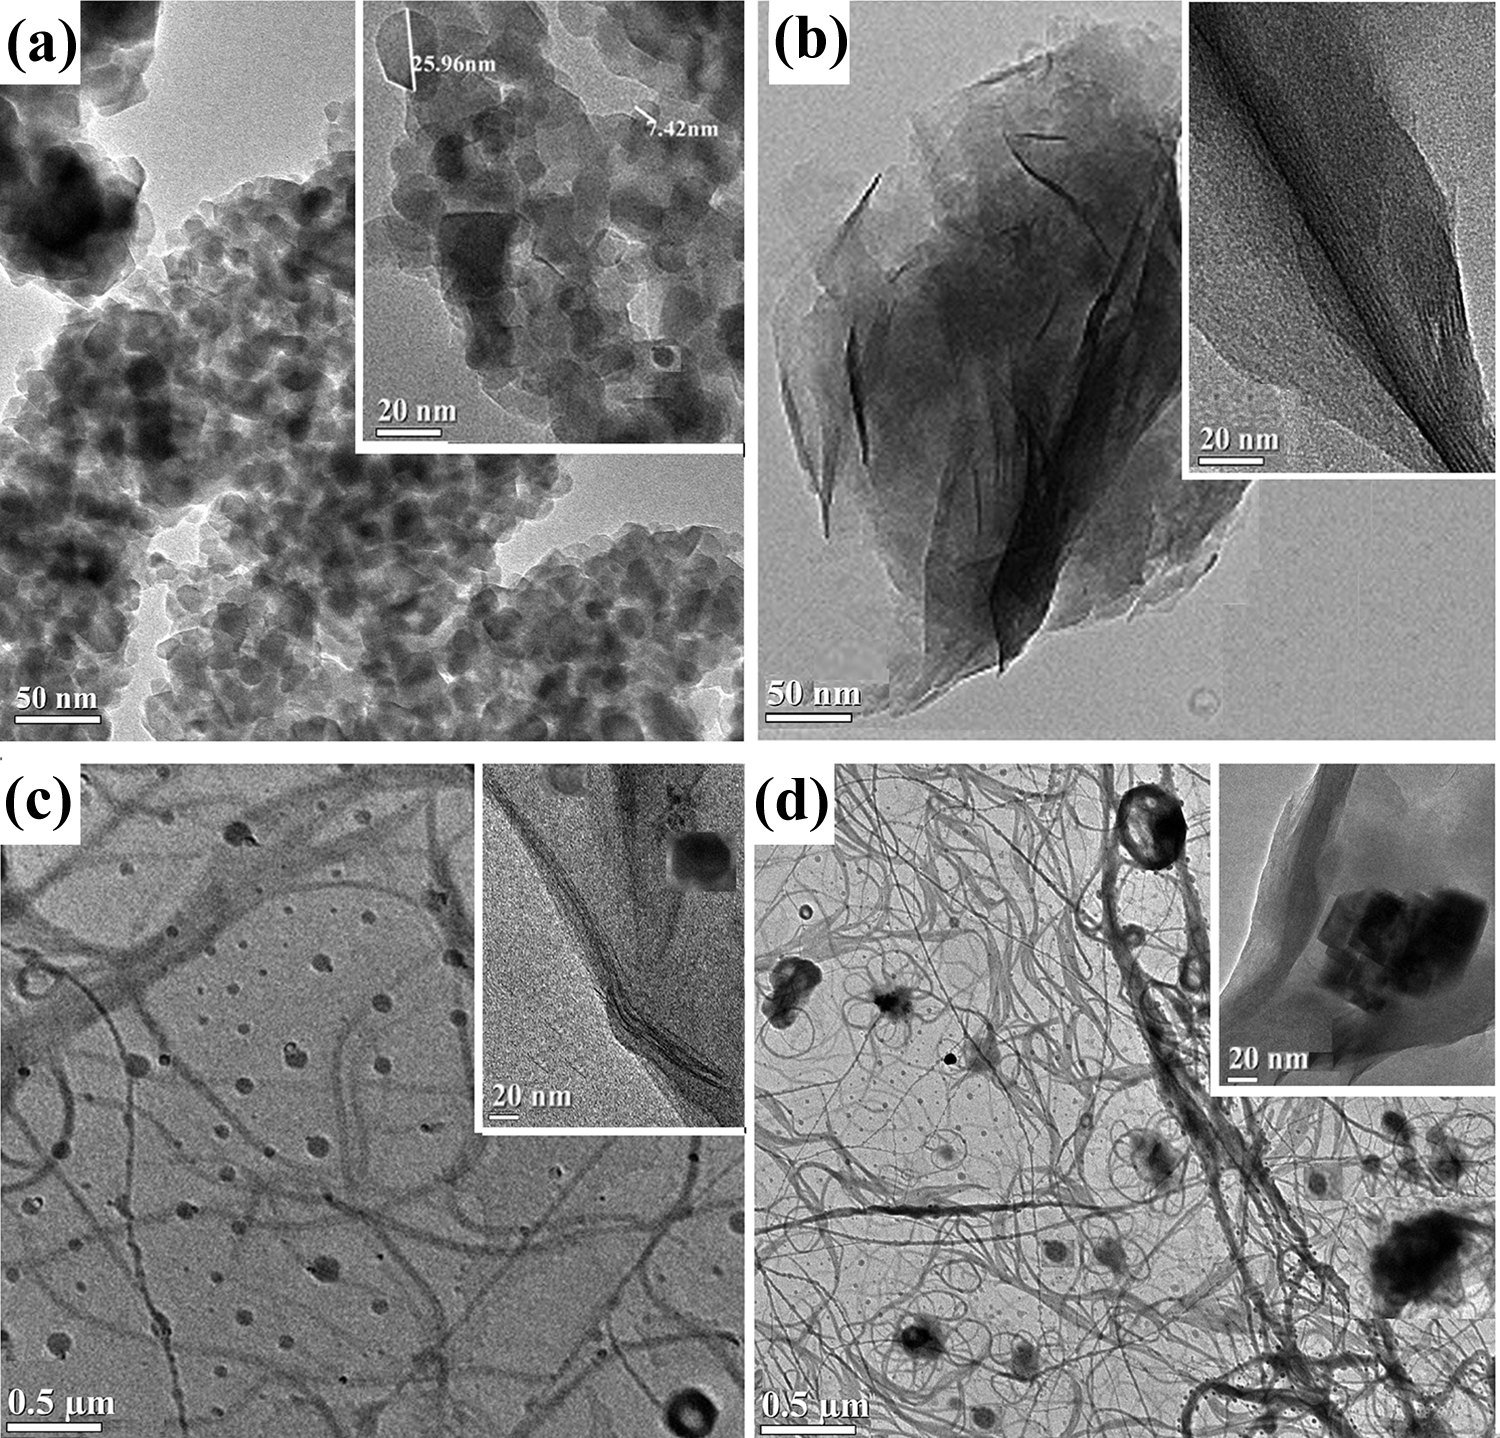
TEM micrographs of (a) nano-TiO2, (b) nanoclay, (c) PB/G5/W40/C2/T2, and (d) PB/G5/W45/C2/T2.
Study of mechanical properties
The flexural and tensile properties of PBs, WPC, and WPC loaded with organically modified nanoclay and TiO2 nanopowder are provided in Table 2. It was observed that flexural and tensile properties of the PB increased on adding the compatibilizer and on reinforcing with the WF. Majority of the literature reports revealed that wood flour reinforcement improved the mechanical properties of WPCs. 49 However, the flexural modulus and tensile modulus of WPCs were found to decrease beyond wood flour loading value of 40 phr. The flexural modulus and tensile modulus of PB/G5/W45/C2/T2 were much lower than PB/G5/W40/C2/T2. The decrease in flexural modulus and tensile modulus of the composites with a high loading of wood flour beyond 40 phr was attributed to the decrease in adhesion of the fibers with the matrix, which leads to uneven distribution of applied stress and required less energy for fiber debonding. The polymer matrix content was not sufficient to provide complete adhesion of the fibers with the matrix. While studying mechanical properties of WF/polypropylene composites, Ashori found that the fiber loading of 40 wt% provided adequate reinforcement to increase the tensile and flexural modulus of the composites. 50 Similar type of observation was reported in the earlier literature, which indicated that although, in general, the tensile and flexural modulus of WPC increased with the amount of WF present in the composite, however, high contents of the WF lead to difficulty in molding process due to high melt viscosity of the composite. 51 This might lead to the formation of inhomogeneous sheet decreasing the overall mechanical property of the composite with 45 phr of wood flour. Though high-processing temperatures beyond 200°C could be used to overcome the high melt viscosity of WPC but that might cause degradation of the WF. 51 Therefore, in our experiment, the temperature of the compression molding press was kept at 170°C for obtaining all the composite sheets. Compatibilizer, PE-co-GMA, increased the interfacial adhesion between wood and polymers by its glycidyl linkage and long olefinic chain and thus improved the strength properties. Remarkable improvement in compatibility and mechanical properties of the composites was noticed while using PE-co-GMA as compatibilizer in the earlier literature. 52 Additional improvement in properties was observed on the addition of organically modified nanoclay and nano-TiO2. Silicate layers of nanoclay bind the polymer chain inside the gallery space, thereby restricting the mobility of the polymer chains while CTAB-modified TiO2 nanopowder interacts with the hydroxyl groups of wood and long alkyl chain of CTAB interaction with PB, thus improving the mechanical properties. Similar types of observations were reported in the earlier literature,6,9,53 where it was found that tensile properties improved at 2 phr nanoclay and TiO2, and beyond those values, it decreased.
Mechanical properties of the samples.
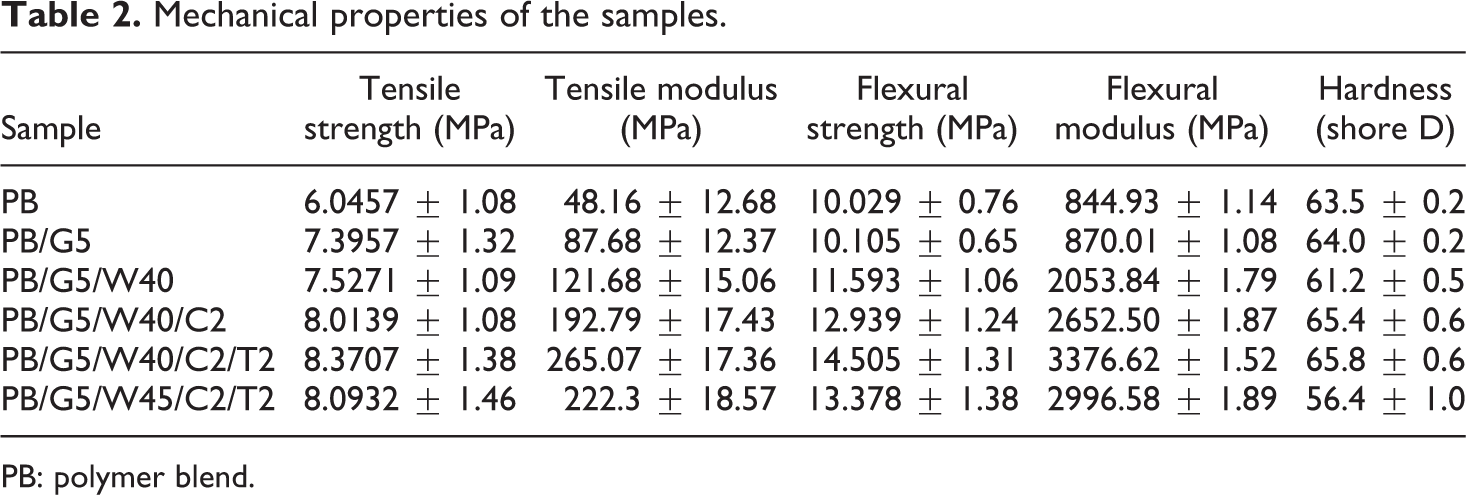
PB: polymer blend.
Hardness
Hardness results of PB and WPC with nanoclay and nano-TiO2 loading were presented in Table 2. Hardness value of the PB increased after the incorporation of compatibilizer, which improved the interfacial adhesion between the polymers and increased the hardness value. Incorporation of nanoclay and nano-TiO2 to the WPC increased the value of hardness due to the restriction in mobility of the polymer chains provided by the silicate layers and also the increase in interaction between nanoclay and nano-TiO2 powder with wood and PB. But on adding 45 phr of wood flour hardness was found to decrease because of the formation of inhomogeneous WPC sheet, as explained already in mechanical property section.50,51 Moreover, agglomeration of TiO2 nanoparticles might have contributed in reduction of hardness. This was supported by the TEM image of the wood polymer nanocomposite reinforced with 45 phr of wood flour in Figure 5(d), which clearly indicated the agglomeration of TiO2 nanoparticles.
Water uptake and water absorption result
Optical photographs of different WPC block samples after swelling study are shown in Figure 6. Figure 7 shows the water uptake results of PB, PE-co-GMA treated PB, and WPC loaded with nanoclay and nano-TiO2. The water uptake capacity of PB decreased on adding PE-co-GMA compatibilizer due to the increase in interfacial adhesion. The value of water uptake capacity suddenly increased after adding WF to the blend due to hydrophilic nature of wood flour. The water uptake capacity of the WPCs decreased on adding both the nanoclay and TiO2. However, WPC loaded with 40 phr WF and 2 phr nanoclay and nano-TiO2 showed lowest water uptake capacity followed by WPC with 45 phr WF and 2 phr nanoclay and nano-TiO2. This is due to the tortuous path provided by the silicate layers of the clay, which increased the barrier property for water transport. 54 Moreover, diffusion of water molecules depends on the extent of distribution of clay nanoparticles. Additionally, nano-TiO2 also provided barrier property for water transport. The movement of water molecules through the composites retarded due to the uniformly dispersed nanoparticles, which in turn decreased the diffusion coefficient of water. Furthermore, modification of the inorganic particles by organic surfactant retarded the water absorption and improved water barrier property in nano-TiO2 incorporated composite. Similar studies were reported by Zhu et al. 55 by incorporating nano-TiO2 in poly(lactic) acid. Chen et al. 56 also observed a reduction in water uptake capacity of polyacrylate coating by modified nano-TiO2 due to even dispersion of nanoparticles. Overall, the loading of nanoclay and nano-TiO2 along with compatibilizer and 40 phr WF showed the average water uptake by 36%.
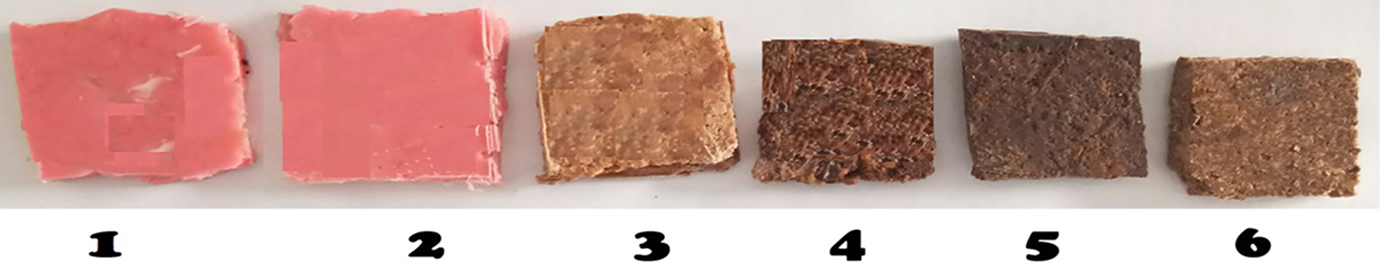
Optical photographs of different samples after swelling studies. 1: PB; 2: PB/G5; 3: PB/G5/W40; 4: PB/G5/W40/C2; 5: PB/G5/W40/C2/T2; and 6: PB/G5/W45/C2/T2.
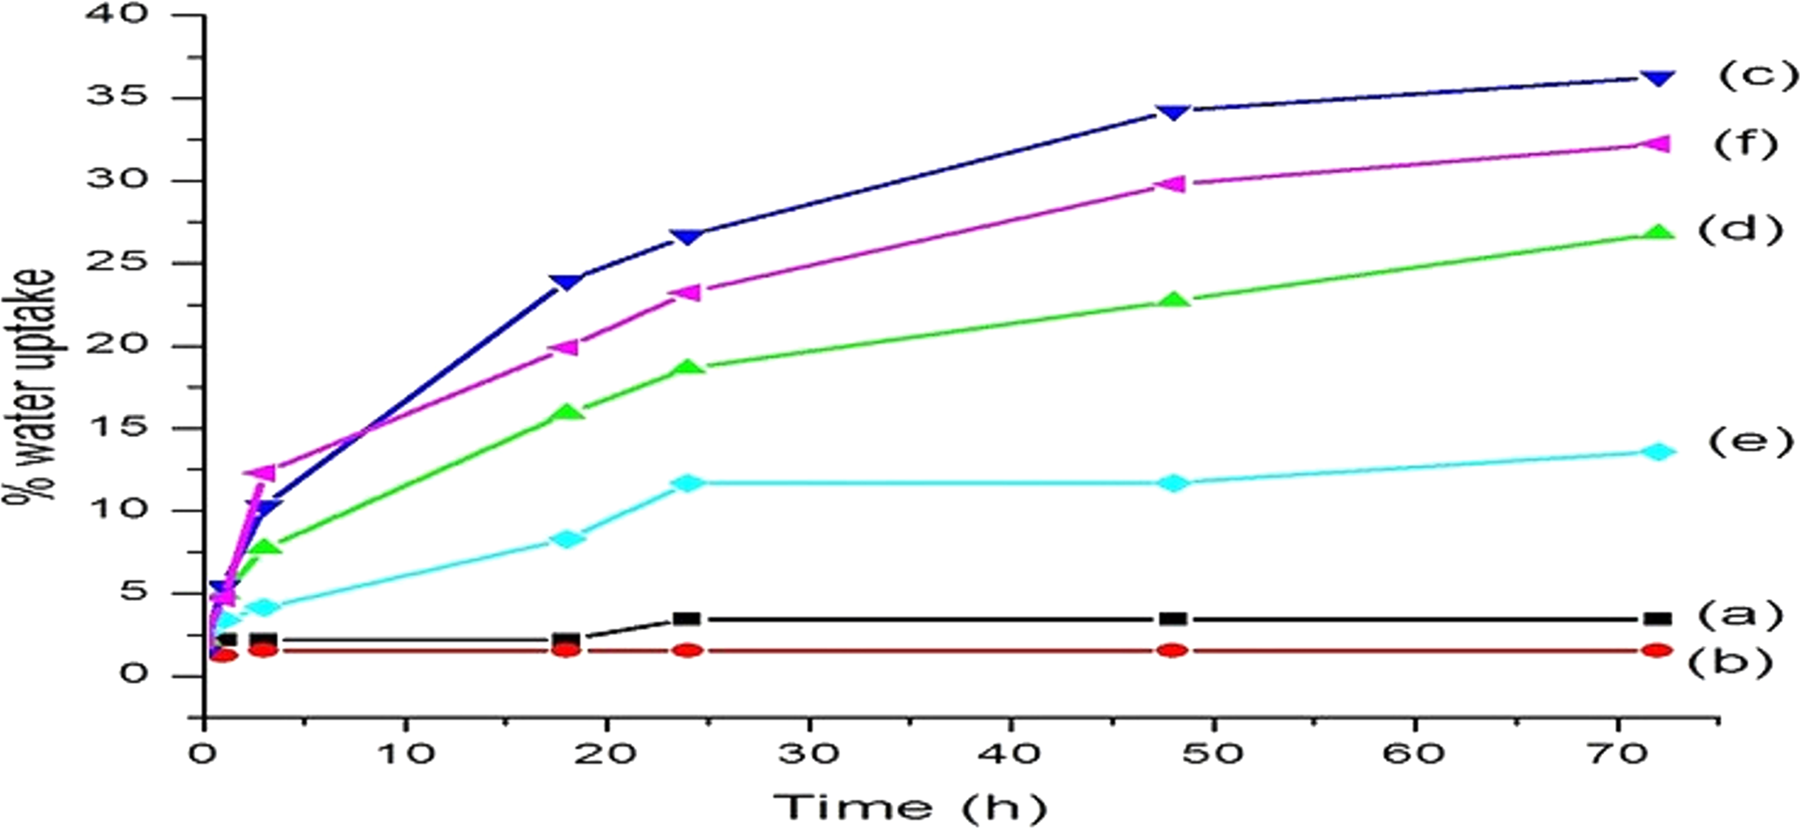
Water uptake pattern of the samples: (a) PB, (b) PB/G5, (c) PB/G5/W40, (d) PB/G5/W40/C2, (e) PB/G5/W40/C2/T2, and (f) PB/G5/W45/C2/T2.
Chemical resistance test
Results of chemical resistance tests of PB and WPC samples loaded with nanoclay, nano-TiO2, and different percentages of wood flour are depicted in Table 3. From the table, it can be seen that HCl solution was more effective chemical compared to H2O2 in reducing the weight of all the samples. PB loaded with compatibilizer showed less decrease in weight compared to PB without compatibilizer due to the increase in interfacial adhesion by the compatibilizer. The reduction in weight percent in WPC samples by the effect of dipping in HCl solution could be attributed to the degradation of the wood flour by HCl solution. Hemicelluloses present in the A. indica wood flour (14%) is lower acid resistant than cellulose and degraded easily by the acid. WPC loaded with 2 phr nanoclay and 2 phr nano-TiO2 showed maximum chemical resistance due to the tortuous path provided by the dispersed silicate layers of nanoclay and the barrier property offered by the uniformly dispersed nanoclay and nano-TiO2 in the composite. For all the samples, a negligible effect in weight change was observed in case of H2O2 solution. However, the opposite weight change trend in H2O2 solution and HCl solution was exhibited by the PB/G5/W40/C2 and PB/G5/W40/C2/T2. The slight increase in weight in case of PB/G5/W40/C2/T2 compared to PB/G5/W40/C2 in H2O2 solution may be attributed to the swelling of the composite on exposure to H2O2, which in turn has resulted in possibility for the chemical to enter small voids in the fiber. 57 These entrapped chemicals remained in the fiber voids even after drying the composite samples. Moreover, it has been reported in the literature that H2O2 could easily be absorbed on the TiO2 surfaces and gave rise to surface complexes, 58 which might contribute to the slight opposite trend in the samples.
Chemical resistance test results for samples.
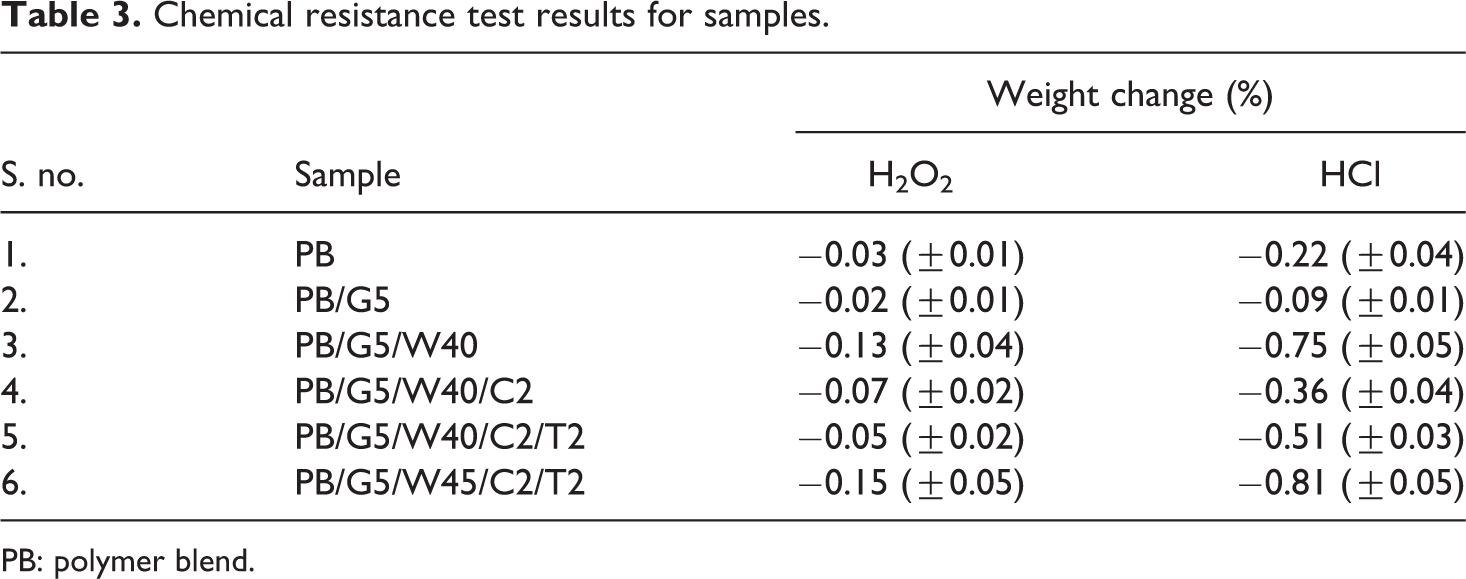
PB: polymer blend.
Thermogravimetry analysis
The thermal degradation of WF and polymer along with its nanocomposites as a function of temperature is shown in Figure 8. The residual weight and the percentage weight loss at different temperatures are presented in Table 4. The table reveals a clear view of the initial decomposition temperature (Ti), maximum pyrolysis temperature (Tm), decomposition temperature at different weight loss (%) (Td) and residual weight (RW, %) for the PB, and wood flour, nanoclay, and nano-TiO2 treated WPCs. Higher Tm values were observed for all the nanoclay and nano-TiO2 reinforced samples. It was observed that the RW (%) value for clay-treated WPC was maximum compared to either the PB or the WPCs. Formation of char by the inorganic clay was attributed for the greater amount of char formation in clay-reinforced WPC. The TGA thermogram (Figure 8) of PB (curve a) showed a negligible mass loss at temperatures lower than 200°C. The significant decrease in the mass loss of the PB began around 330°C. The PB mixed with PE-co-GMA compatibilizer (curve d) showed negligible mass loss until it decreased rapidly at about 332°C and showed a slight increase in thermal stability due to improved adhesion by the compatibilizers within the PB. The addition of wood flour (curve c) showed three significant degradation curves. According to TGA, degradation of neem wood flour was seen at about 240°C and 330°C, which correspond to degradation of hemicellulose, cellulose, and lignin.59–62 The peak at 430°C represented the degradation of PB while the peak at 500°C could be due to the lignin present in the WPCs. The addition of organically modified nanoclay (curve b) slightly lowered the degrading temperature range because the clay initiated grafting between the polymer and fiber, which resulted in reduction of tertiary carbon atoms in the polymer and their subsequent degradation.63,64 In addition to it, the release of low molecular weight compounds from those organic compounds with which clay was treated also decreased the thermal stability. However, according to Nourbakhsh et al., the overall effect of adding nanoclay improved the thermal stability due to the tortuous path created by silicate layers providing barrier to the oxygen and delayed the burning capacity of the composite. 65 In the thermogram obtained from the PB/G5/W40/C2/T2 (curve f) composite, it was seen that the addition of TiO2 nanoparticle showed a higher decomposition temperature, which concluded that the dispersion of TiO2 increased the thermal stability.66,67 Better results were obtained for 40 phr WF rather than 45 phr WF (curve e) although both consisted of TiO2.
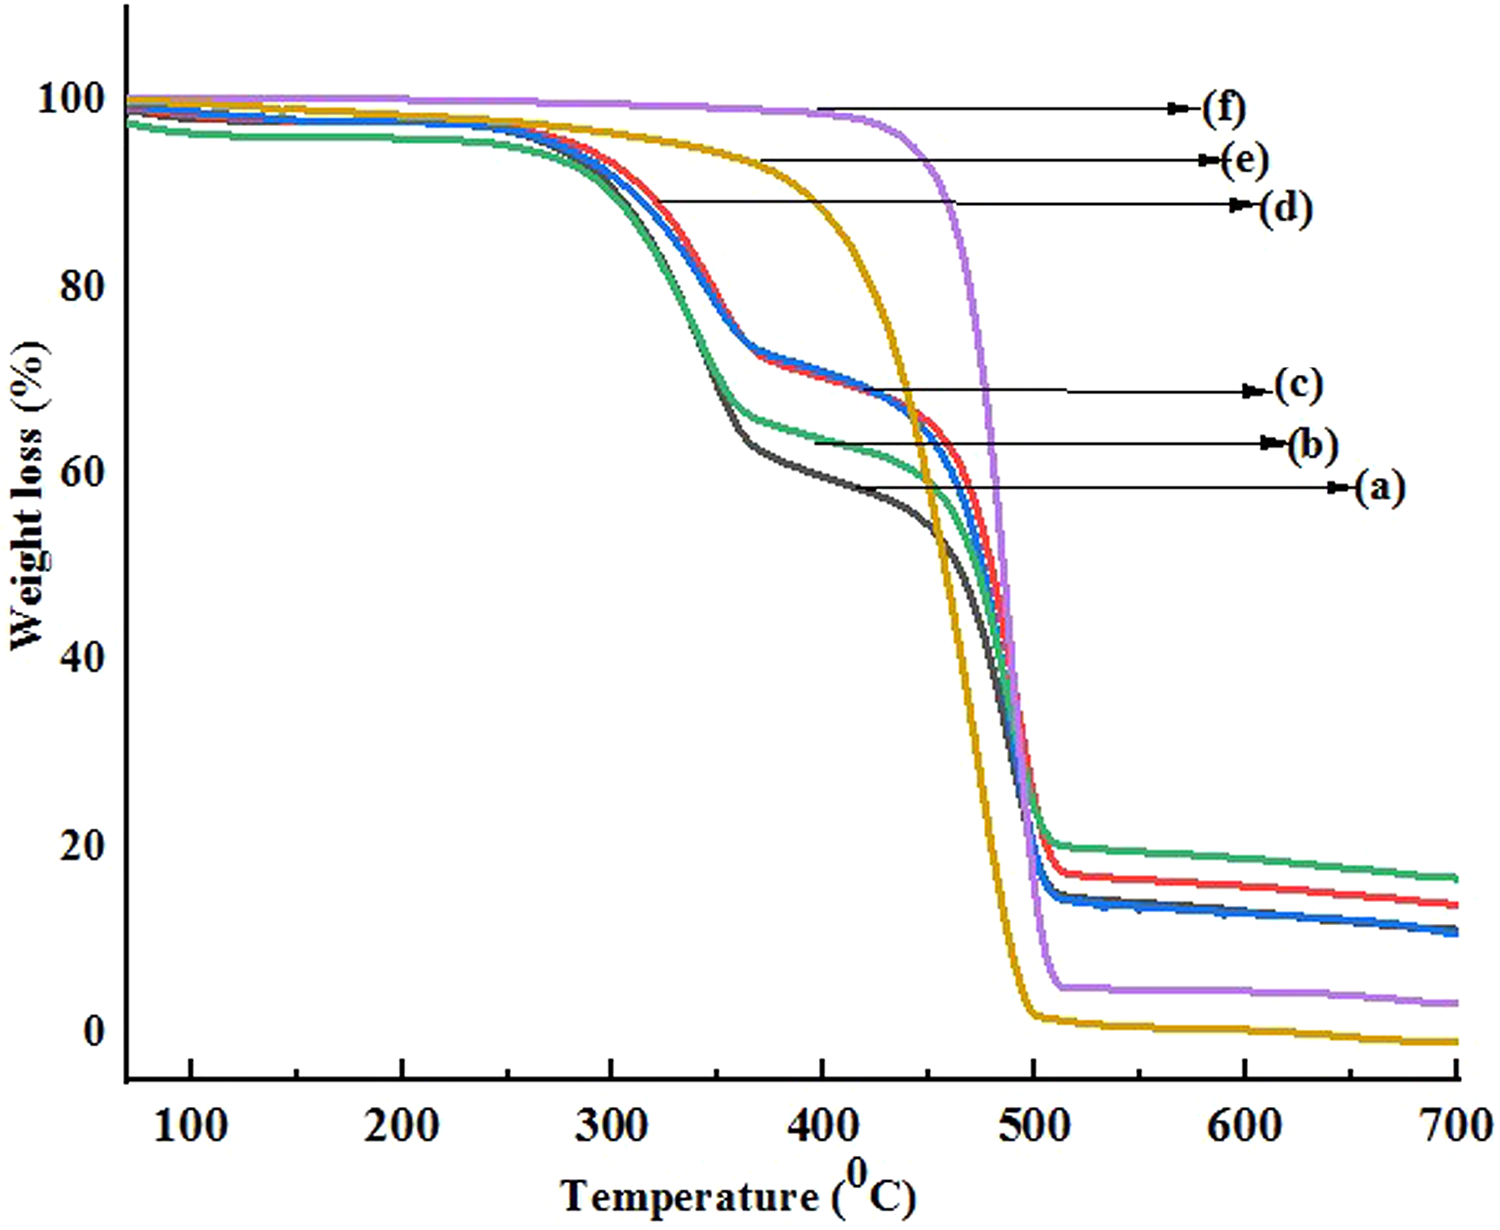
Thermogravimetric curves of (a) PB, (b) PB/G5/W40/C2, (c) PB/G5/W40, (d) PB/G5, (e) PB/G5/W45/C2/T2, and (f) PB/G5/W40/C2/T2.
Thermogravimetric analysis of different samples.
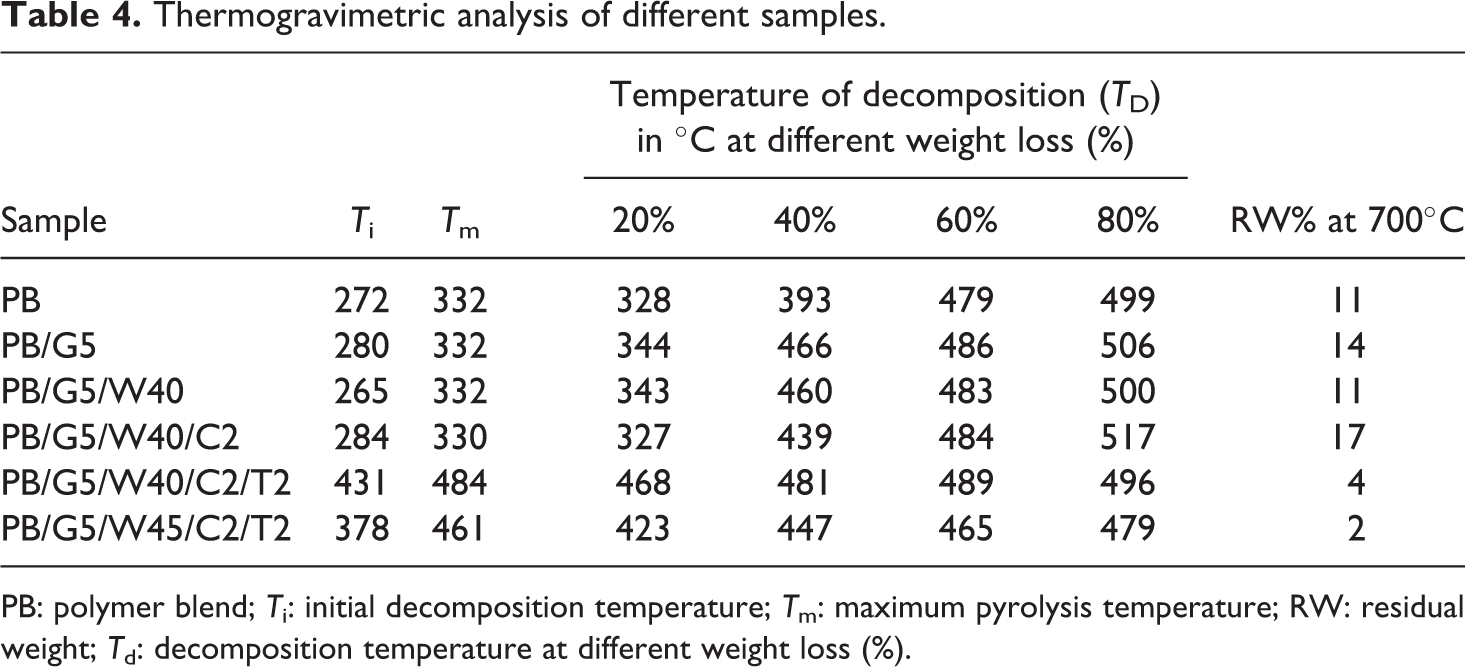
PB: polymer blend; Ti: initial decomposition temperature; Tm: maximum pyrolysis temperature; RW: residual weight; Td: decomposition temperature at different weight loss (%).
Conclusion
From this study, it was found that mechanical properties, namely, tensile strength, tensile modulus, flexural strength, and flexural modulus as well as hardness of the WPCs improved with the addition of PE-co-GMA, A. Indica wood flour, organically modified nanoclay, and CTAB-modified TiO2 (2 phr each) due to the improved adhesion by the compatibilizers between the polymer and the wood and successful dispersion of the nanoparticles in the WPNC, as revealed by the XRD and TEM studies. FTIR study showed effective interaction of organically modified nanoclay and CTAB-modified TiO2 with the wood and the polymer. The data from TGA analysis indicated that wood flour, nanoclay, and CTAB-modified TiO2 gave rise to significant improvement in thermal stability of the WPC. The water uptake capacity of PB decreased after the addition of compatibilizer. The value of water uptake capacity suddenly increased after the addition of WF but decreased on adding nanoclay. WPC loaded with 40 phr WF and 2 phr each of nanoclay and nano-TiO2 showed the lowest water uptake capacity followed by WPC with 45 phr WF and 2 phr each of nanoclay and nano-TiO2.
Footnotes
Declaration of conflicting interests
The author(s) declared no potential conflicts of interest with respect to the research, authorship, and/or publication of this article.
Funding
The author(s) disclosed receipt of the following financial support for the research, authorship, and/or publication of this article: The work was supported by the Department of Science and Technology, SEED Division, New Delhi, India. Financial assistance as Junior Research Fellowship of the author (AK) from the DST, SEED division, is gratefully acknowledged. Authors are thankful to Dr. Biplab Deka, UNIST, South Korea, for valuable discussions on the work.