
Abstract
In the present work, a solvent-based extrusion 3D printing technique has been utilized to fabricate polymer composites comprising of polycaprolactone (PCL) polymer and carbonyl iron particles. A homogenous composite ink containing PCL and carbonyl iron filler particles with suitable solvent was synthesized with required viscosity for the 3D printing operation. Rectangular samples were successfully fabricated using the extrusion 3D printing technology. A response surface methodology was utilized for planning the set of fabrication experiments so as to estimate the effect of process parameters, namely infill density, printing speed and filler concentration on the printed composite density, percentage of shrinkage and compressive strength. Shrinkage was found to reduce with an increase in infill density and filler concentration. However, density was found to shoot up with an increase in infill density and filler concentration. Similarly, compressive yield strength was improved with an increase in infill density and filler concentration. Increase in shrinkage and density values and decrease in compressive yield strength value were noticed with an increase in the printing speed. Furthermore, a genetic algorithm multiobjective optimization tool was utilized to obtain optimum process parameters to minimize shrinkage, minimize density and maximize compressive yield strength for the electronics and microwave applications of the fabricated composite. A microwave shielding performance test of the developed composite was also carried out as a case study. The shielding performance test indicated the efficacy of the polymer composite fabricated using solvent-based extrusion 3D printing technique.
Keywords
Introduction
3D printing technology is extensively utilized and commercialized across several industries such as automobiles, aerospace, electronics and biomedical to name a few. These additive manufacturing technologies are transformational and futuristic owing to the prominent attributes they encompass, such as, potential to fabricate intricate designed parts, accurate and repeatable products with minimal cost, automated processing and zero material wastage and so on. A tessellated computer aided design (CAD) model of the desired physical part is utilized as an input to the 3D printers to fabricate the parts using layer by layer approach. Printability of a gamut of materials like polymers, metals, even composites and ceramics is possible today due to alacritous advancement in 3D printing technology frontiers. Currently available 3D printing technology to print composites include stereolithography, fused deposition modelling (FDM), laser engineered net shaping, ultrasonic consolidation, selective laser melting and laminated object manufacturing.1–5 A considerable size of research explorations have been reported on the composite 3D printing using such techniques. Kalsoom et al. 6 presented a spectrum of 3D printable composite materials recently developed. They further suggested that various composites with improved properties can be obtained by incorporating different fillers in to the 3D printable polymer matrix. Moreover, this technology can sway several electrochemical, optical and physical behaviour of the polymer composites. 6 Torrado et al. 7 investigated the impact of additives on the properties of acrylonitrile butadiene styrene (ABS) parts produced in FDM process. They found that the mechanical property anisotropy along the build direction was reduced for a blend of two materials such as ethylene butadiene styrene and ultra-high molecular weight polyethylene with ABS. The reduction in the anisotropy was 22% as compared to 47% in the case of pure ABS specimens. Ferreira et al. 8 carried out the material characterization and micrography studies of a composite consisting of polylactic acid (PLA) reinforced with carbon fibre and 3D printed using fused filament fabrication. It was found that the stiffness of the composite increased to 2.2 times along the print direction and 1.25 times along transverse to the print direction as compared to the pure PLA specimen. Panda et al. 9 developed a fly ash-based geopolymer composite and investigated its rheology and strength for extrusion-based 3D printing. Authors observed the 3D printed specimen with higher compressive strength than the mould casted ones. Zheng et al. 10 presented an extrusion-based 3D printing of ink with apparent low viscosity using silicone elastomers of varying modulus. They suggested a spectrum of low viscosity and readily mixable silicone inks utilizing a combination of base polymers, cross linkers, chain extenders and photoinitiators. They further demonstrated the extrusion printing of overhanging multimaterial structure using single nozzle printer. Kim et al. 11 optimized the 3D printing parameters for screw-type extrusion-based 3D printing of ceramics. They utilized L9 orthogonal array to determine the effect of independent 3D printing variables such as water content in ceramics ink, revolutions per minute (RPM), diameter of nozzle tip on the discharge volume of material. It was found that RPM was the most significant parameter with a contribution of 70%. Yang et al. 12 investigated the ABS polymer, reinforced with carbon fibre in an FDM process. When compared with the tensile and flexural strength of the composite with that of ABS, the results indicated impressive increase in both accounts. Duty et al. 13 suggested a model for the evaluation of the candidature of different polymeric materials for various extrusion-based 3D printing processes.
Owing to the swift growth on the frontiers of polymer composites, these composites can be utilized as a potential candidature for absorption of electromagnetic radiation. 14 These absorbers are the unique class of materials which are used to minimize or absorb the harmful electromagnetic radiations. The shielding materials are selected considering the design, processing, functional and economical aspects. These materials are as diverse as metals to polymers and more recently the polymer composites. 14 Metals have been considered as the foremost choice for researchers owing to the high electrical conductivity. However, the challenges associated with metal microwave absorbers such as high density, poor corrosion resistance, less ductility, difficulty in processing and high cost compelled the researchers to hunt for other materials. 14 In this context, lightweight, ductility, cost-effectiveness and tailorable functional properties make a polymer composite material as a viable substitute for metal-based absorbers.14–17
Survey of some of the aforementioned prior research work suggested that the extrusion 3D printing process has been used to 3D print composites with improved mechanical properties. However, the capability of this disruptive technology is curtailed owing to the restricted spectrum of 3D printable materials with narrow range of physiochemical properties. Furthermore, there is scanty literature on the solvent-based extrusion 3D printing process, and most of the literature on extrusion 3D printing process are focused on thermal-based extrusion process such as FDM. Hence, there is a contemporary relevance of developing novel polymer-based composites with efficient electromagnetic shielding potential and improved mechanical properties utilizing solvent-based extrusion 3D printing technique.
Thus, the present article is focused on the fabrication of a composite material consisting of polycaprolactone (PCL) polymer and carbonyl iron particle (CIP) filler using a customized solvent-based extrusion 3D printing technique. A design of experiment technique, namely response surface methodology (RSM) was utilized to plan the experiments for the fabrication of prior mentioned composites samples.
The basic idea behind RSM was to capture the effect and interrelationship between process parameters such as printing speed, infill density and filler concentration on the properties of the fabricated composite sample such as shrinkage, part density and the final compressive strength. The properties of the fabricated samples were measured by following specific ASTM standards. Furthermore, a multiobjective optimization technique based on metal heuristic search algorithm such as genetic algorithm was used to optimize the printing parameters for 3D printing of polymer metal composites using solvent-based extrusion 3D printing technique. Additionally, a case study was also conducted to investigate the potential of such 3D printed composites as microwave shielding materials.
Materials and methodology
To 3D print the polymer composite using solvent-based extrusion 3D printing technique, the composite ink was synthesized following a specific procedure. The details of synthesis of ink and fabrication of composite specimens are described in the subsequent segments.
Synthesis of ink
The raw materials used for the preparation of the composite ink were PCL pallets (glass transition temperature (Tg) = −60°C, melting temperature = 60°C, supplier: Sigma Aldrich, Germany), carbonyl iron powder (CIP) (CS grade, supplier: BASF, Germany) and dichloromethane (DCM) (boiling point= 40°C, supplier: Sigma Aldrich, Germany). PCL pallets (size: 3 mm, density: 1.145 g/ml) and CIPs with particle size ranging from 1 µm to 10 µm were mixed separately with DCM solvent in a proportion of 0.5 g/ml and 0.05 g/ml, respectively. The CIP solution was ultrasonicated for 2 h to eliminate agglomerations. After 5 h, the PCL pallets were observed to be completely dissolved in the DCM, and the CIP solution was mixed to the dissolved solution containing PCL. Ultrasonication of this mixture was carried out for 1 h and kept for 12 h to obtain the final homogenous PCL/CIPs composite ink. The detailed specification and composition of CIP is presented in Table 1, and scanning electron microscopic image of CIP is shown in Figure 1(a). A histogram depicting the particle size distribution of CIP is also presented in Figure 1(b). Furthermore, the rheology of the composite ink is measured with the help of rheometer and presented in Figure 2. It can be observed from Figure 2 that the composite ink undergoes shear thinning which is the characteristic of non-Newtonian fluids. Thus, the viscosity of the fabricated composite ink reduces with applied load suggesting better flowability of the ink during extrusion 3D printing process.
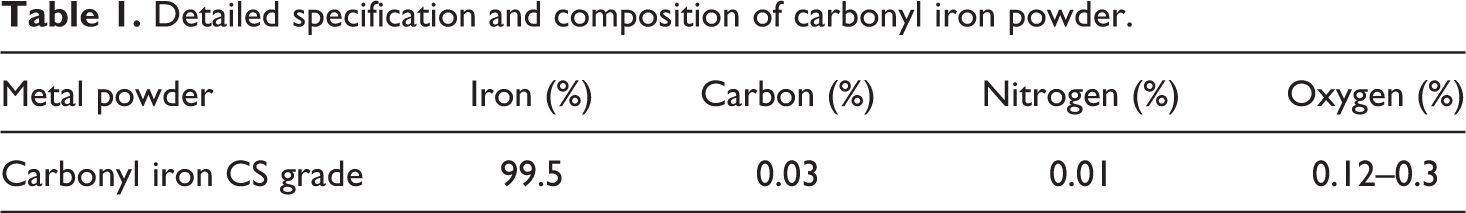
Detailed specification and composition of carbonyl iron powder.
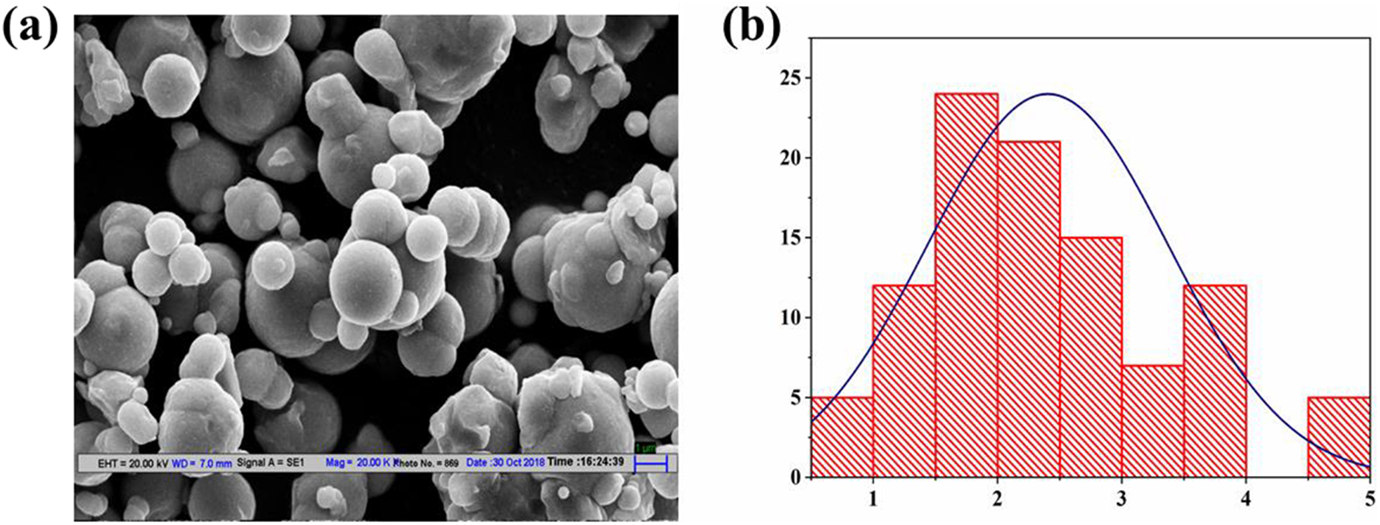
(a) Scanning electron microscopic image of CIP (at 20KX) and (b) particle size distribution histogram.
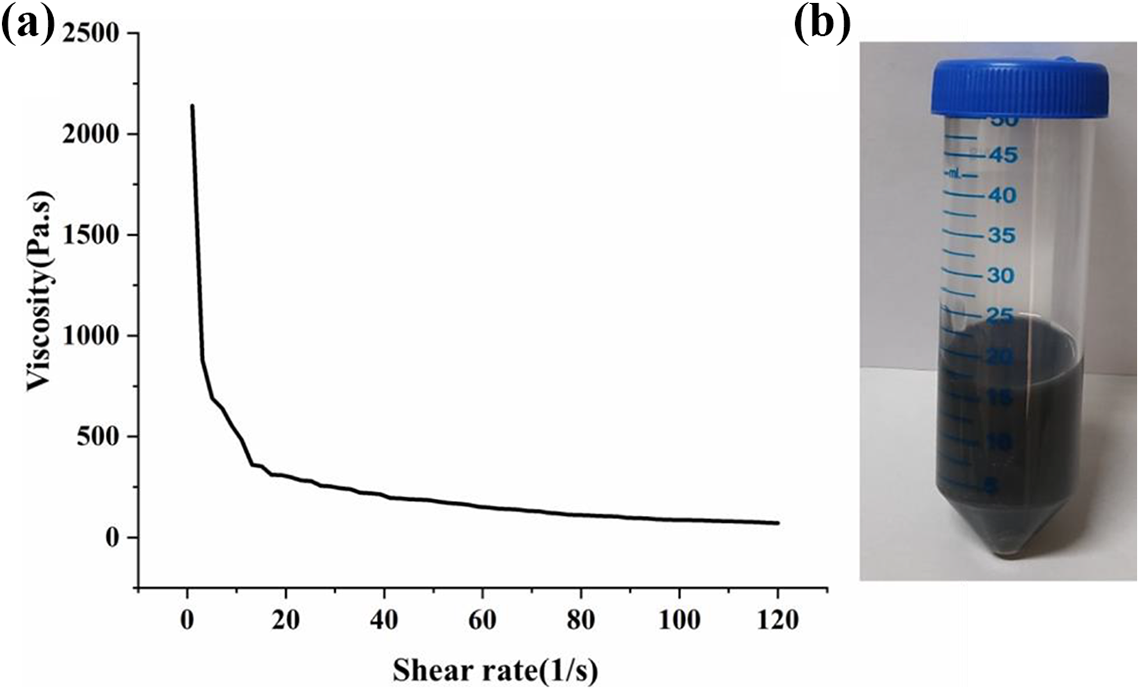
(a) Viscosity versus shear rate for composite ink consisting of PCL and 2% CIP; (b) PCL/CIP composite ink.
Fabrication of the PCL/CIP composite
The CAD model of the polymer composite with a rectangular shape and dimension of
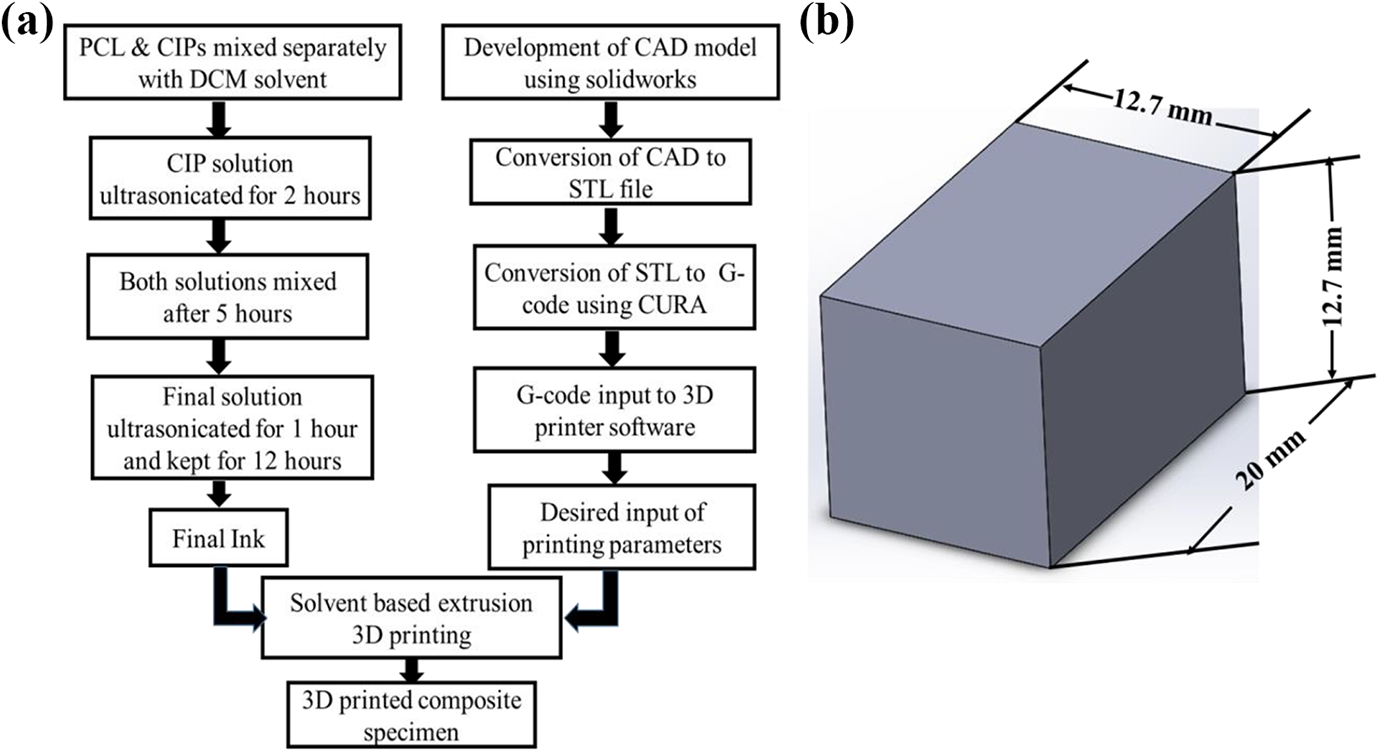
(a) Flow chart of the fabrication route of the composite specimen and (b) CAD model of the composite specimen.
Experimentation
Selection of process parameters
The printing parameters for the fabrication of the aforementioned composite using solvent-based extrusion 3D printing process were selected based on the design of experiments technique. Three input parameters, namely infill density, printing speed and filler concentration were considered with five levels for each parameter. The parameters and levels are illustrated in Table 2.
Factors and their levels.
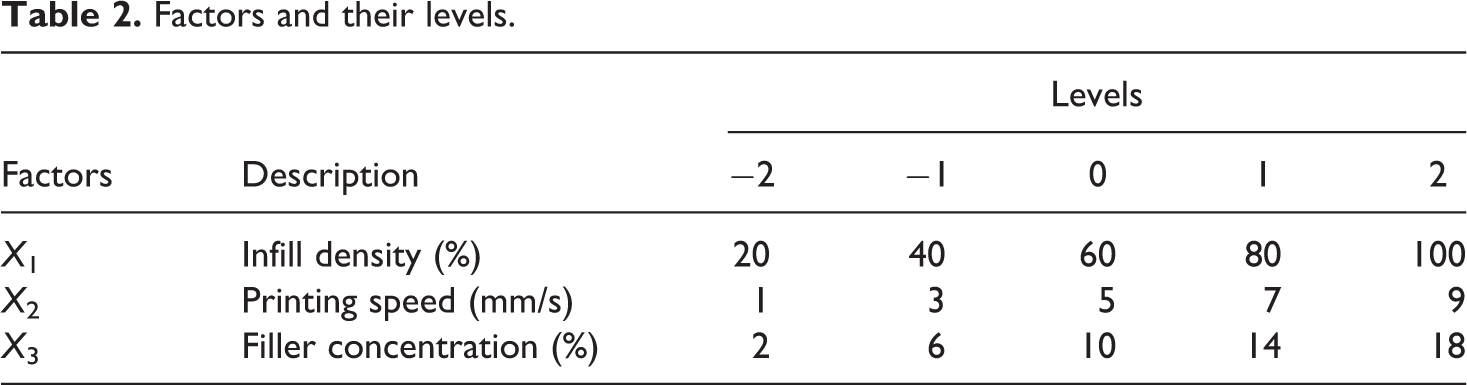
In solvent-based extrusion printing, infill density is the amount of material consumed for printing a part. A higher infill density makes a high-density 3D printed part where as a low infill density makes a lightweight part with larger void spaces. Generally, an infill density of greater than 20% is recommended for a good durability of the 3D printed part. 18 Thus, the infill density range was selected to be between 20% and 100%. Figure 4 demonstrates the infill densities between 20% and 100%. The speed of the nozzle movement on the build platform is defined as the printing speed. At higher speed, the deposited ink does not get sufficient time to solidify, and the previous layer deposited gets disoriented by the next layer. Furthermore, very low speed tends to reduce the adherence between the consecutive layers. Hence, range of the printing speed was selected between 1 mm/s and 9 mm/s. Similarly, the filler (CIPs) concentration range was fixed between 2% and 18% as higher quantity of CIPs tends to increase the density of composite.
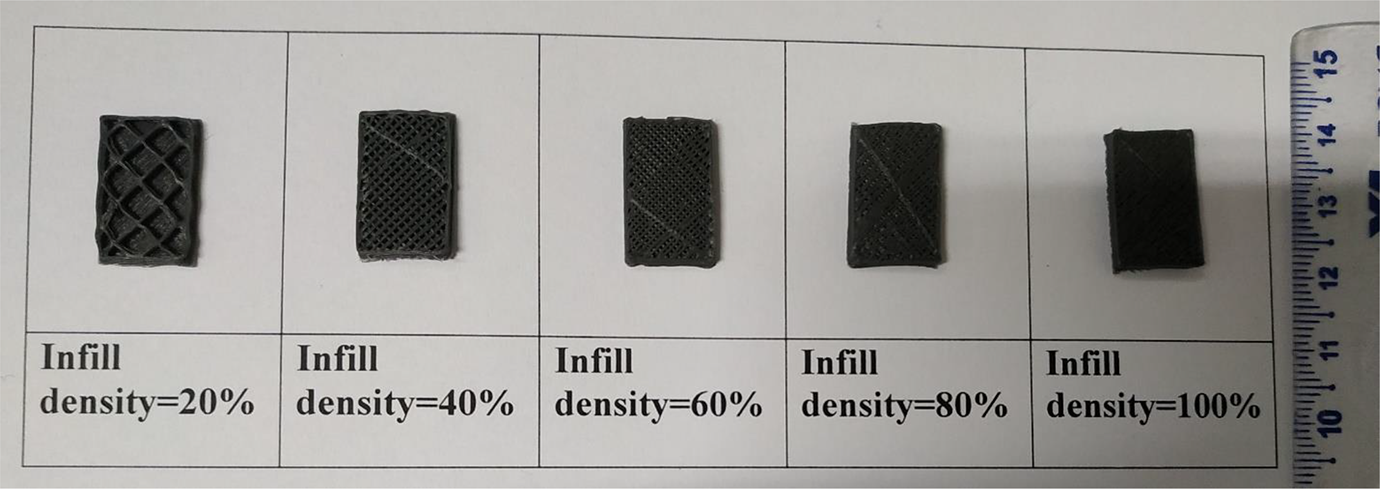
Cross section of the 3D printed specimens with varying infill densities.
Experimental set-up
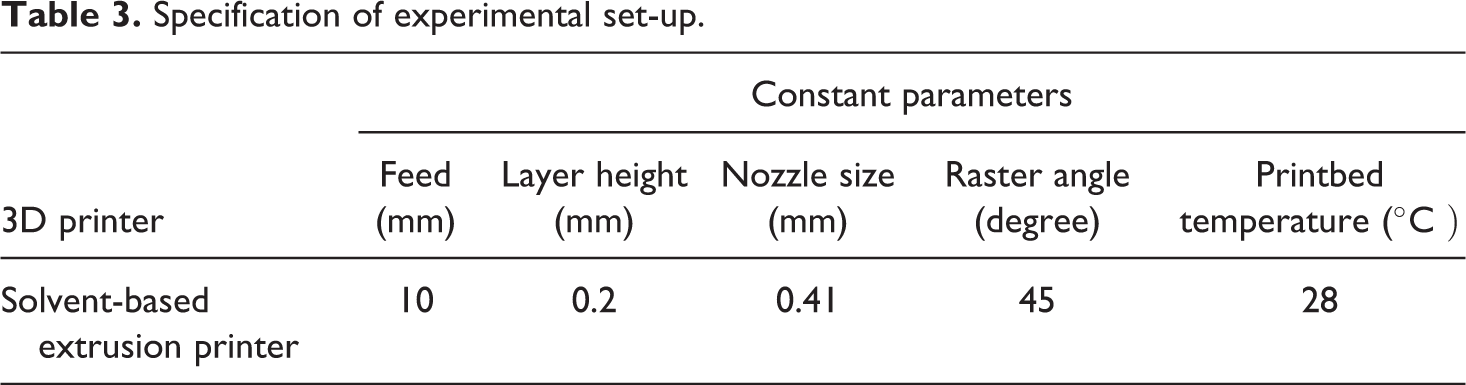
The experimental set-up for the customized solvent-based extrusion 3D printing is shown in Figure 5. The composite ink was loaded in a syringe with 10-ml capacity, and the syringe was inserted in the 3D printer. The movement of the syringe can be done along the X and Z axes, whereas the platform is responsible for the Y-axis movement. The G-code of the CAD model was utilized as an input to the 3D printer software. Finally, the nozzle was driven to the desired position where the printing can be started. The detailed specification of the experimental set-up is given in Table 3.
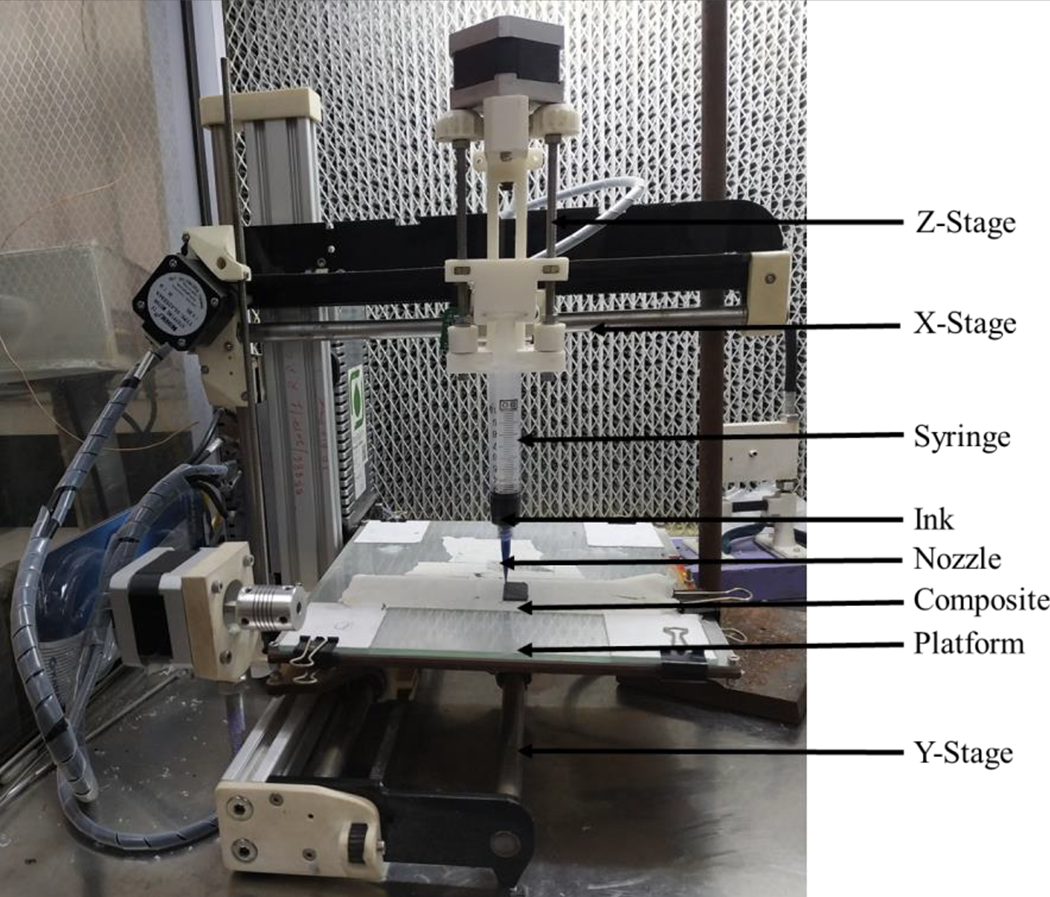
Experimental set-up for solvent-based extrusion 3D printing.
Specification of experimental set-up.
Experimental design methodology
For the fabrication experiments of the PCL/CIP composite, the experimental design approach employed was central composite design (CCD). This method was suitable to capture the effect of process parameters such as infill density, printing speed and filler concentration on the process responses, namely shrinkage, part density and compressive yield strength. The CCD sampling method is very useful in this context, as it builds a robust polynomial function with statistical integrity to couple the responses with the process variables. 19
The second-order response equation satisfies the following form
where Y suggests the response variable; n describes the number of variables;
A total number of 20 experiments were carried out with CCD design using a value of ∝ as 2. The value of ∝ in a CCD is based on the criteria of orthogonal blocking. To yield accurate results, rotatable CCD designs are preferred. However, rotatable CCD design resulted in impractical values of process variables which were difficult to achieve at the existing experimental conditions. Thus, value of ∝ was chosen to be 2. Standards and procedures followed to measure response variables are illustrated in the following segments.
Measurement of shrinkage
The shrinkage of the 3D printed samples were calculated using ASTM B610-13 standard. As per the standard, the longer side dimension of the sample should be measured to calculate the shrinkage. Thus, the shrinkage of the 3D printed sample was calculated using the following mathematical relation
where, ‘S’ is the shrinkage of the printed sample in percentage; ‘LC’ is the CAD dimension in mm of the longer side of the sample; and ‘Lm’ is the measured dimension in mm of the longer side of the printed sample using micrometre.
Measurement of density
Density of the 3D printed composite samples were obtained as per Archimedes principle utilizing ASTM B962-15 standard. Equation (3) is used to estimate the density as per the aforesaid standard
where ‘D’ depicts measured density of composite sample in g/cm3; ‘Ma’ describes mass of the composite sample measured in air in g; ‘Mo’ suggests mass of the composite sample submerged in oil in g; ‘Mt’ suggests the total mass containing both the oil dipped composite sample and the water dipped support in g; ‘Mw’ describes mass of the water submerged support in g; and ‘ρw’ is the density of water.
Measurement of compressive yield strength
Compressive yield strength of all the rectangular 3D printed PCL/CIPs composites were measured using a universal testing machine (Instron, Mechanical Engineering Department, IIT Delhi, India) having 10-kN capacity and a traverse speed of 1 mm/min. The sample size used for the uniaxial compression test was
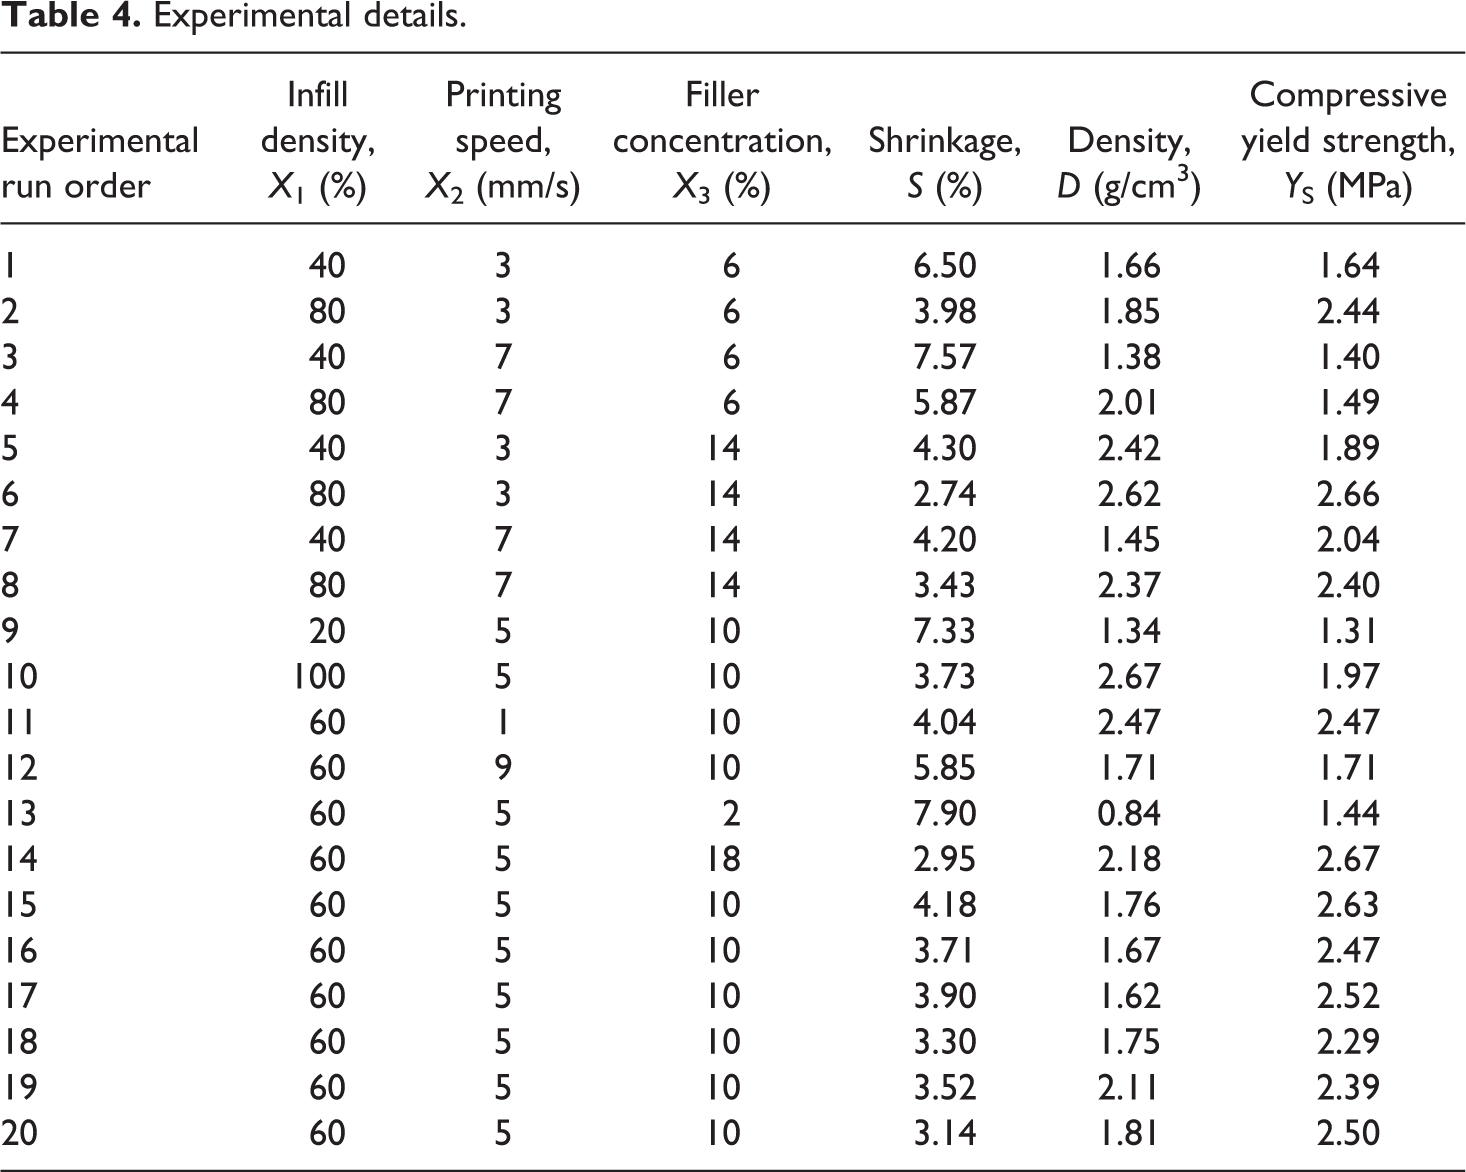
Experimental details along with the responses are compiled in Table 4. Figure 6(a) represents the 3D printed samples fabricated as per the experimental conditions listed in Table 4. The crystallographic planes of the 3D printed composite samples with varying filler concentration is shown in Figure 6(b) utilizing X-ray diffraction (XRD) plots. The XRD plot suggests absence of any foreign material in the composite sample.
Experimental details.
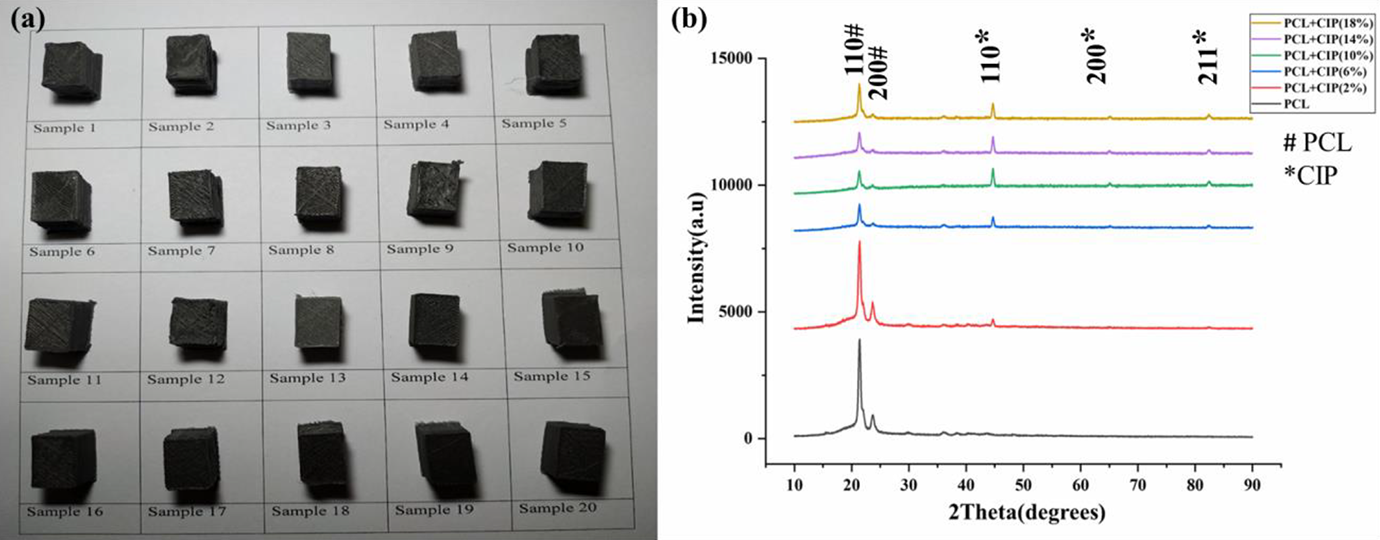
(a) 3D printed PCL/CIPs composite samples; (b) XRD plot of pure PCL sample and composite samples with 2%, 6%, 10%, 14% and 18% CIP filler.
Statistical modelling of process responses
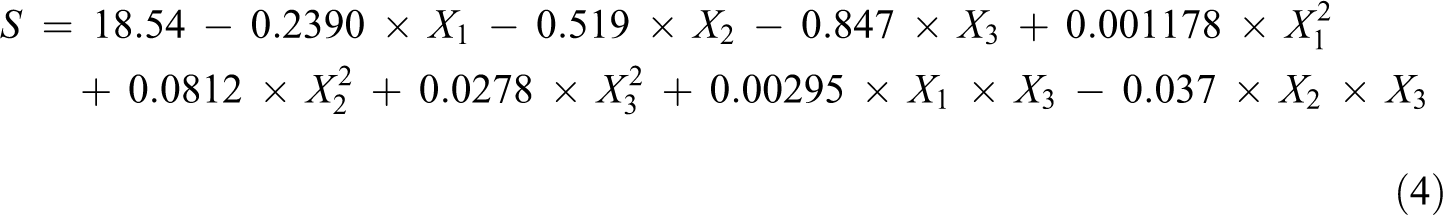
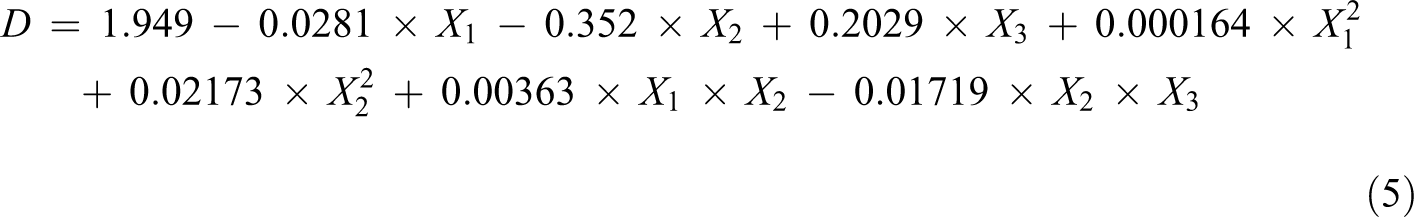
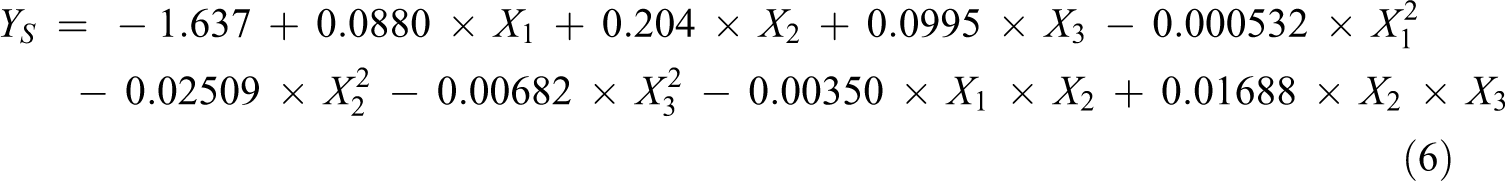
The regression equations for all the responses such as shrinkage, density and compressive yield strength were formulated using CCD methodology. The regression equations for the aforementioned responses after eliminating insignificant terms are presented using equations (4) to (6). A 95% confidence interval was considered while formulating the regression equations
The analysis of variance (ANOVA) tables for the aforementioned responses were obtained using commercially available design of experiment software package (MINITAB 17). After removing insignificant parameters, the final ANOVA table for all the responses are presented in Tables 5 to 7.
ANOVA for shrinkage.
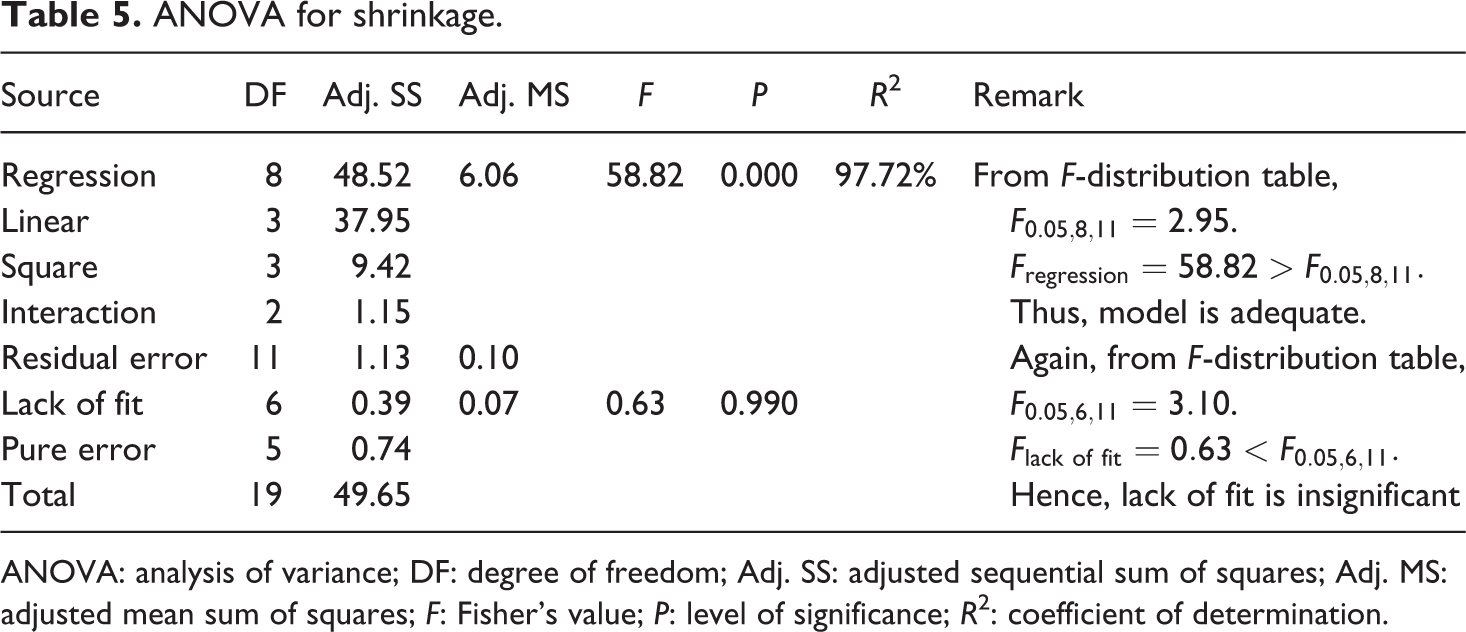
ANOVA: analysis of variance; DF: degree of freedom; Adj. SS: adjusted sequential sum of squares; Adj. MS: adjusted mean sum of squares; F: Fisher’s value; P: level of significance; R2: coefficient of determination.
ANOVA for density.
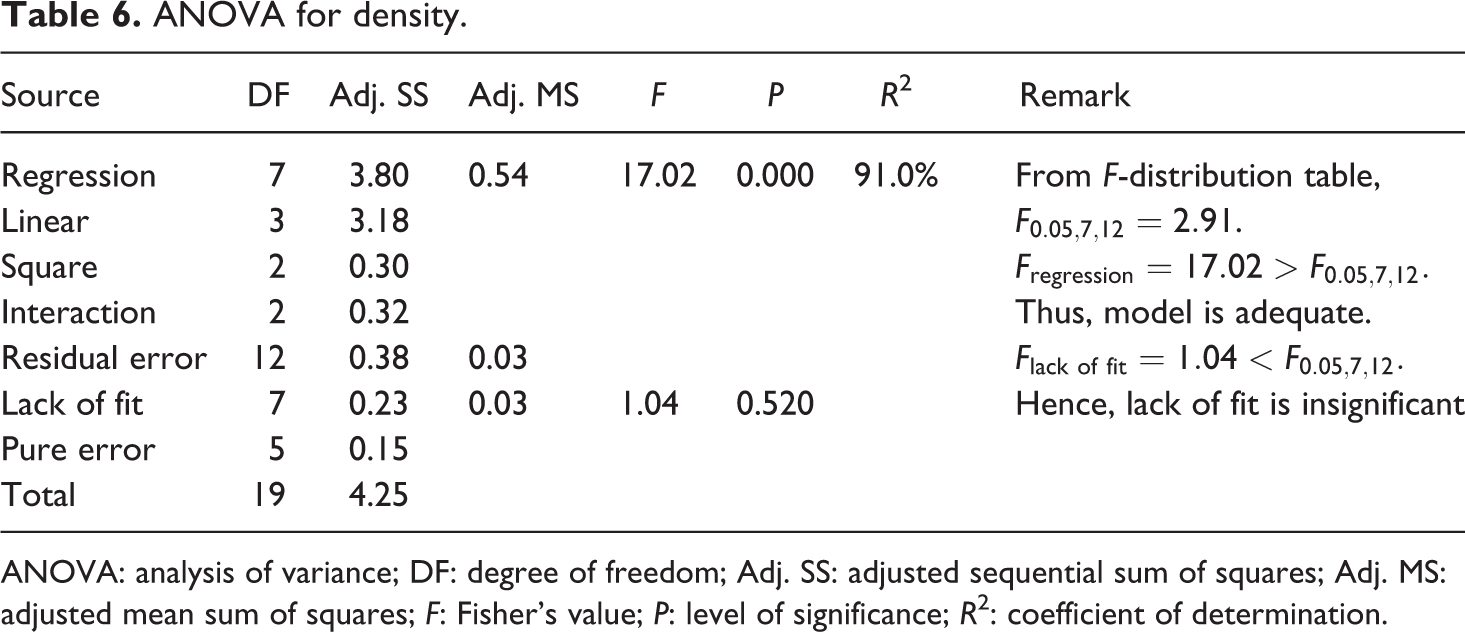
ANOVA: analysis of variance; DF: degree of freedom; Adj. SS: adjusted sequential sum of squares; Adj. MS: adjusted mean sum of squares; F: Fisher’s value; P: level of significance; R2: coefficient of determination.
ANOVA for compressive yield strength.
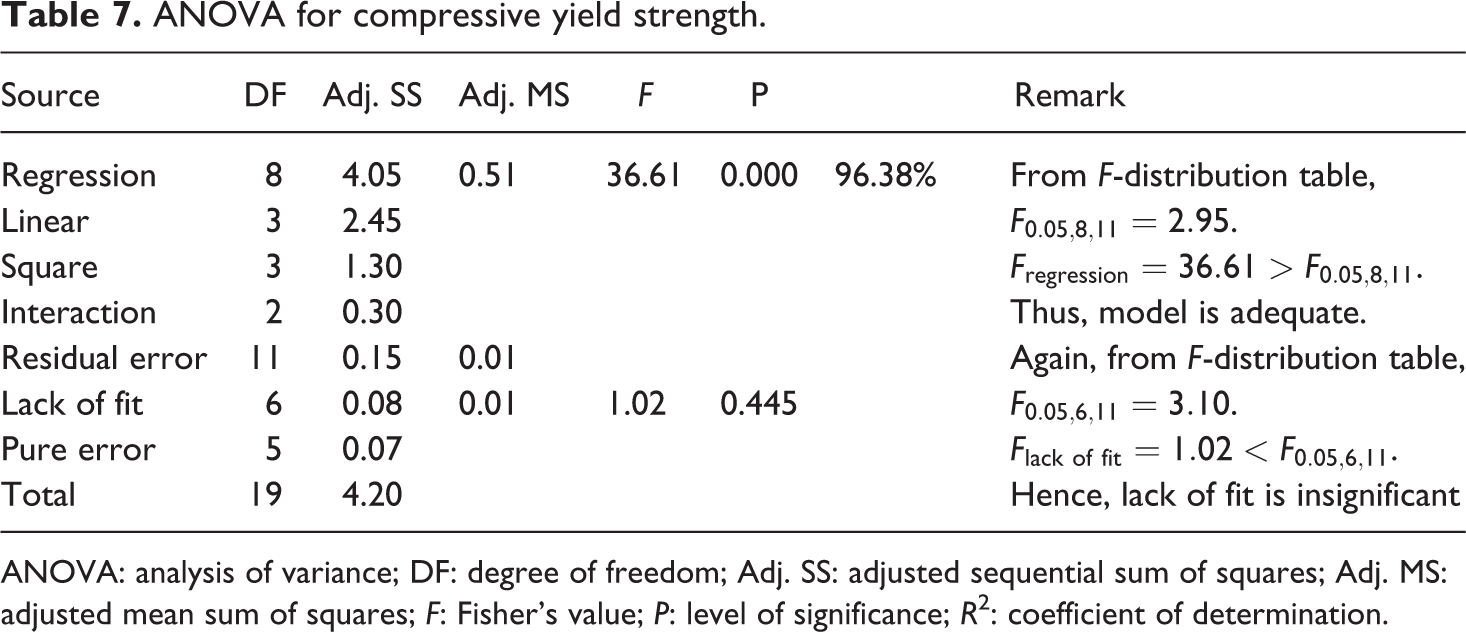
ANOVA: analysis of variance; DF: degree of freedom; Adj. SS: adjusted sequential sum of squares; Adj. MS: adjusted mean sum of squares; F: Fisher’s value; P: level of significance; R2: coefficient of determination.
Statistical uncertainty is inevitable owing to experimental errors. 19 Thus, the prediction of responses using the aforementioned regression equations (4) to (6) may not yield the exact values. However, the spectrum in which the predicted responses may vary can be obtained using the following equation 19

where
Confirmatory experiments.
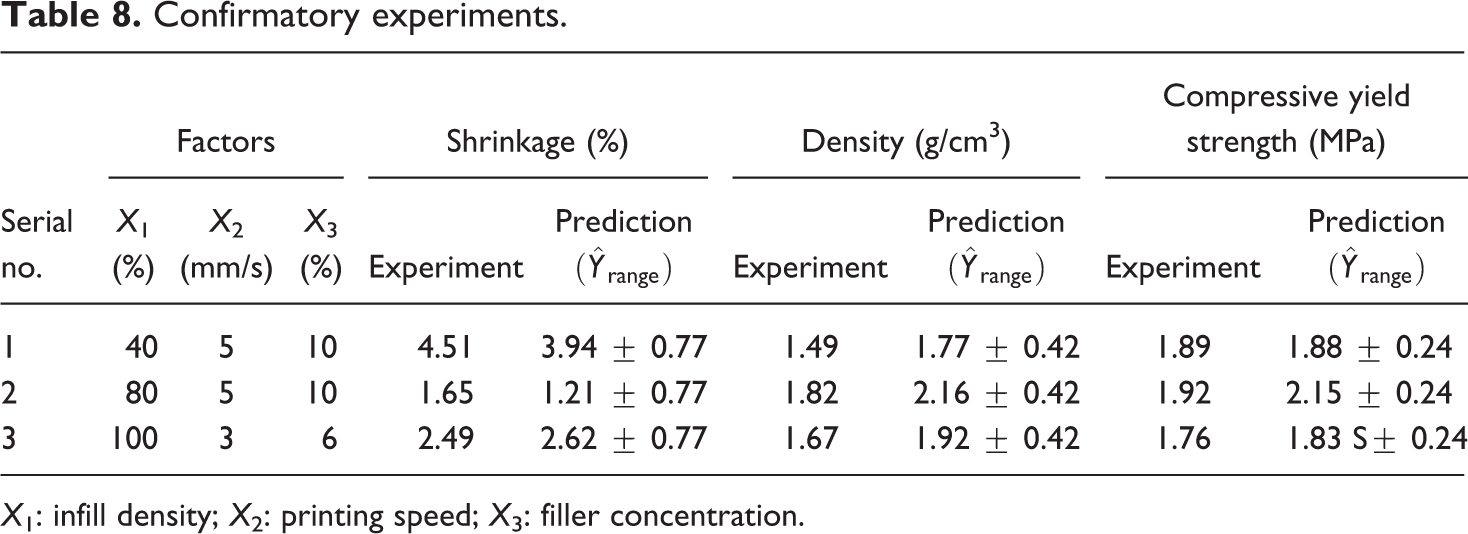
X1: infill density; X2: printing speed; X3: filler concentration.
Results and discussion
Shrinkage
Effect of printing process variables
The main effect and contribution plot of process variables for shrinkage are depicted in Figure 7. From Figure 7(a), it can be deduced that shrinkage was reduced with increase in infill density and filler concentration, whereas increase in printing speed increased the shrinkage. Higher infill density ensures lesser gap between two consecutive printed lines thereby prohibiting the further reduction in dimension of the printed part. Furthermore, higher printing speed does not render sufficient time for the proper flow of the extruded filament thereby producing samples with non-uniform material at different regions of the sample, which in turn increases the shrinkage. From Figure 7(b), it was observed that filler concentration was the most contributing factor affecting shrinkage with a contribution percentage of 46%. The reason for the same may be attributed to the fact that increased filler concentration reduces the polymer percentage and the volume of solvent required to prepare the composite ink. Reduced volume of solvent ensures lesser evaporation to obtain solid samples thereby reducing the shrinkage.
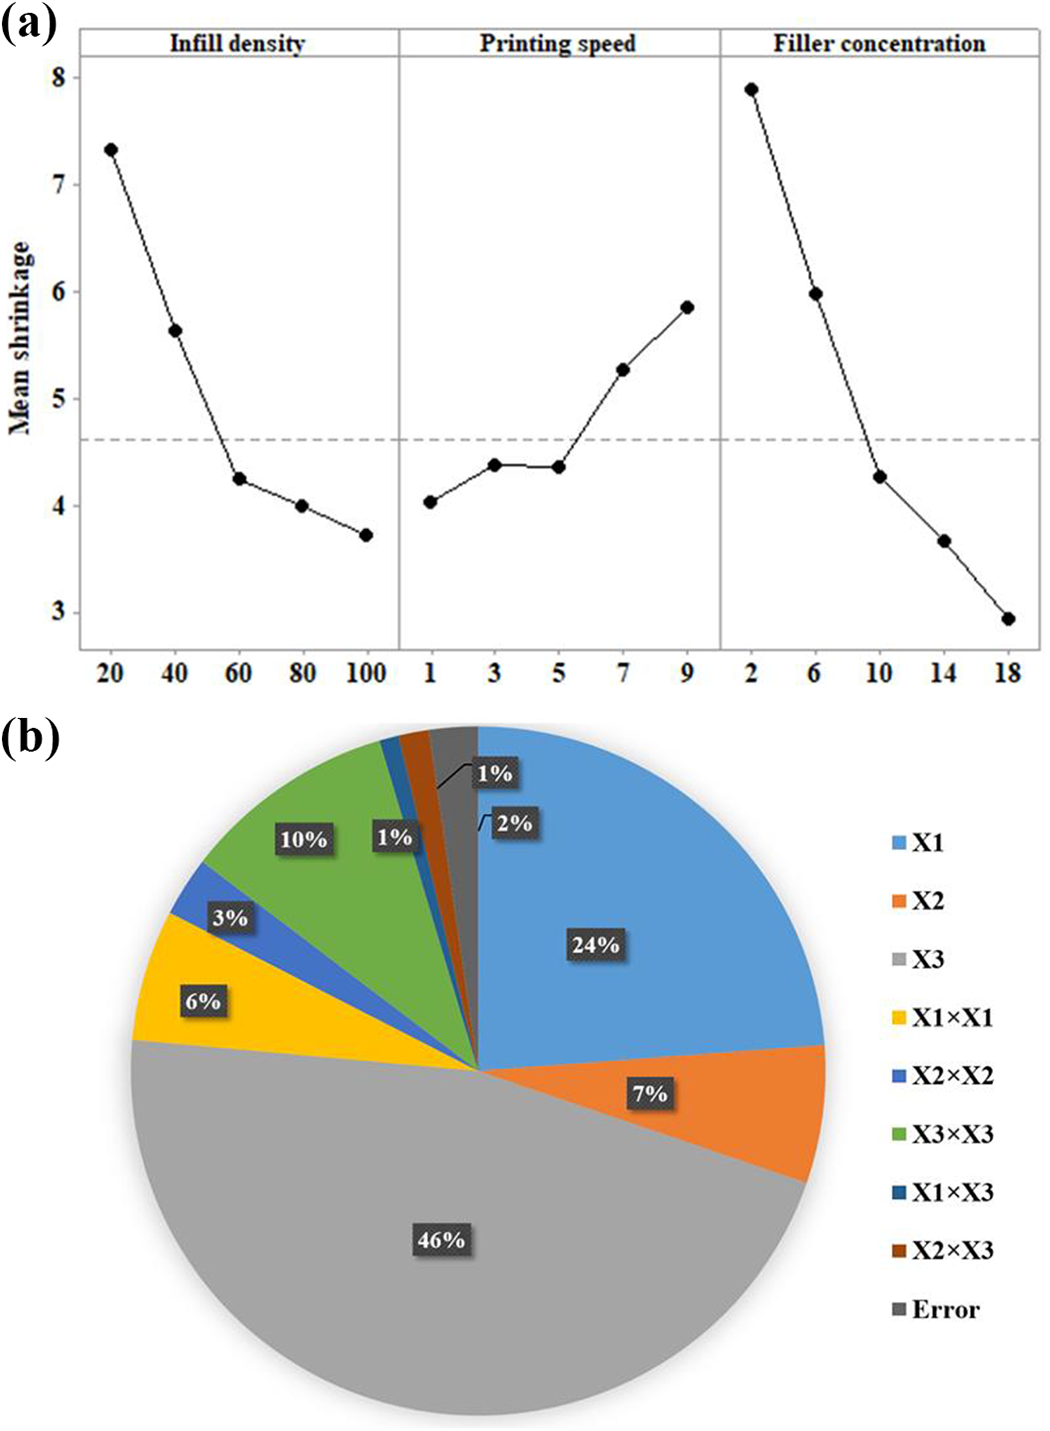
(a) Main effect plot and (b) shrinkage contribution plot.
Effect of interaction
The interaction plot comprising of surface plot and 2D plot between infill density and filler concentration on shrinkage is shown in Figure 8. It can be inferred from the interaction plot that minimum printing shrinkage was obtained at a higher filler concentration and medium to high value of infill density (60%). Furthermore, Figure 9 represents the interaction plot between printing speed and filler concentration on shrinkage. It can be observed from the interaction plot that higher filler concentration and minimum printing speed result in minimum shrinkage in printed parts. The reason for the same has already been narrated in the previous section.
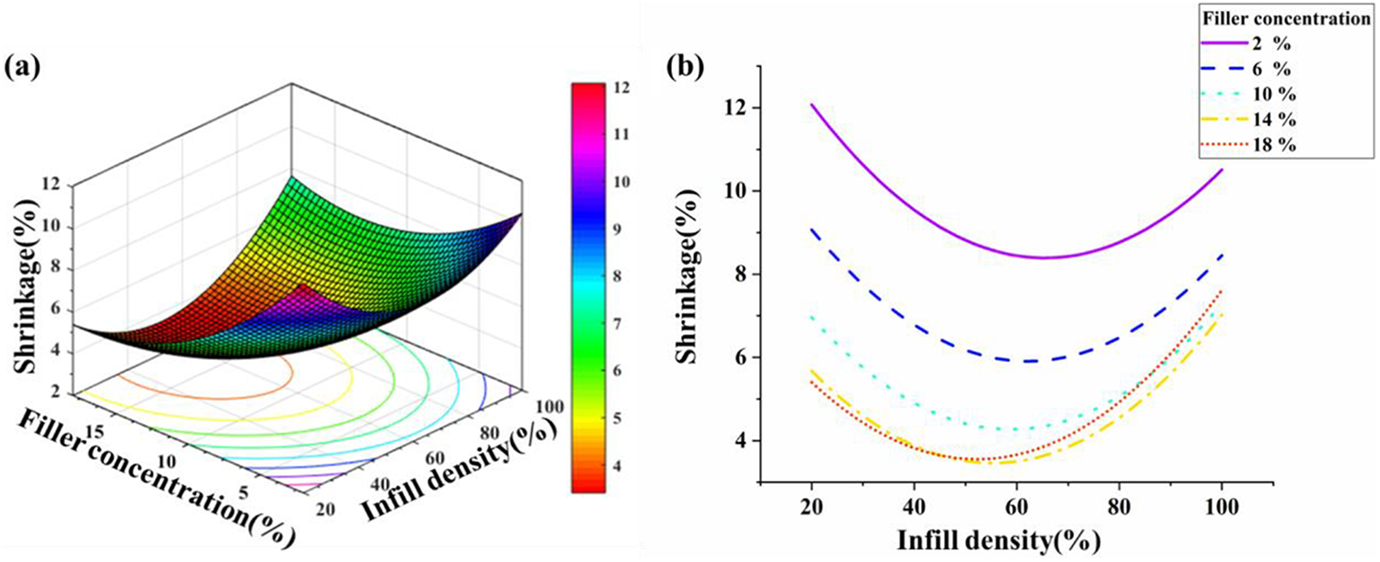
(a) Surface plot and (b) interaction plot of infill density and filler concentration on shrinkage.
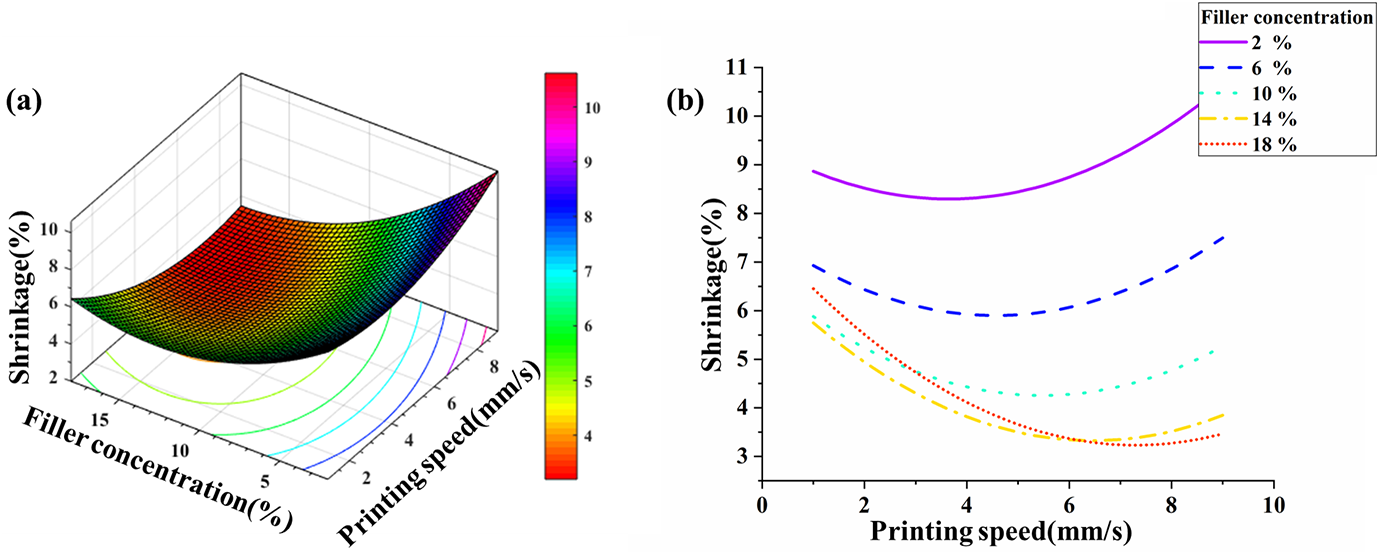
(a) Surface plot and (b) interaction plot of printing speed and filler concentration on shrinkage.
Density
Effect of printing process variables
The main effect and contribution plot of process variables for density is depicted in Figure 10. It can be inferred from Figure 10(a) that density of the 3D printed parts increased with increase in infill density and filler concentration. However, the effect of printing speed on density was contradictory. Higher infill density suggests more amount of material present in the fixed volume of sample thereby increasing the part density. Furthermore, higher filler concentration renders more amount of carbonyl iron particles in a specific volume of sample. Since the density of carbonyl iron is much higher (7.8 g/cm3) than the density of PCL polymer (1.145 g/cm3), thus increased filler concentration suggests rise in part density. Figure 10(b) represents contribution pot of significant process parameters on density. It was observed that both infill density and filler concentration contribute the most on density.
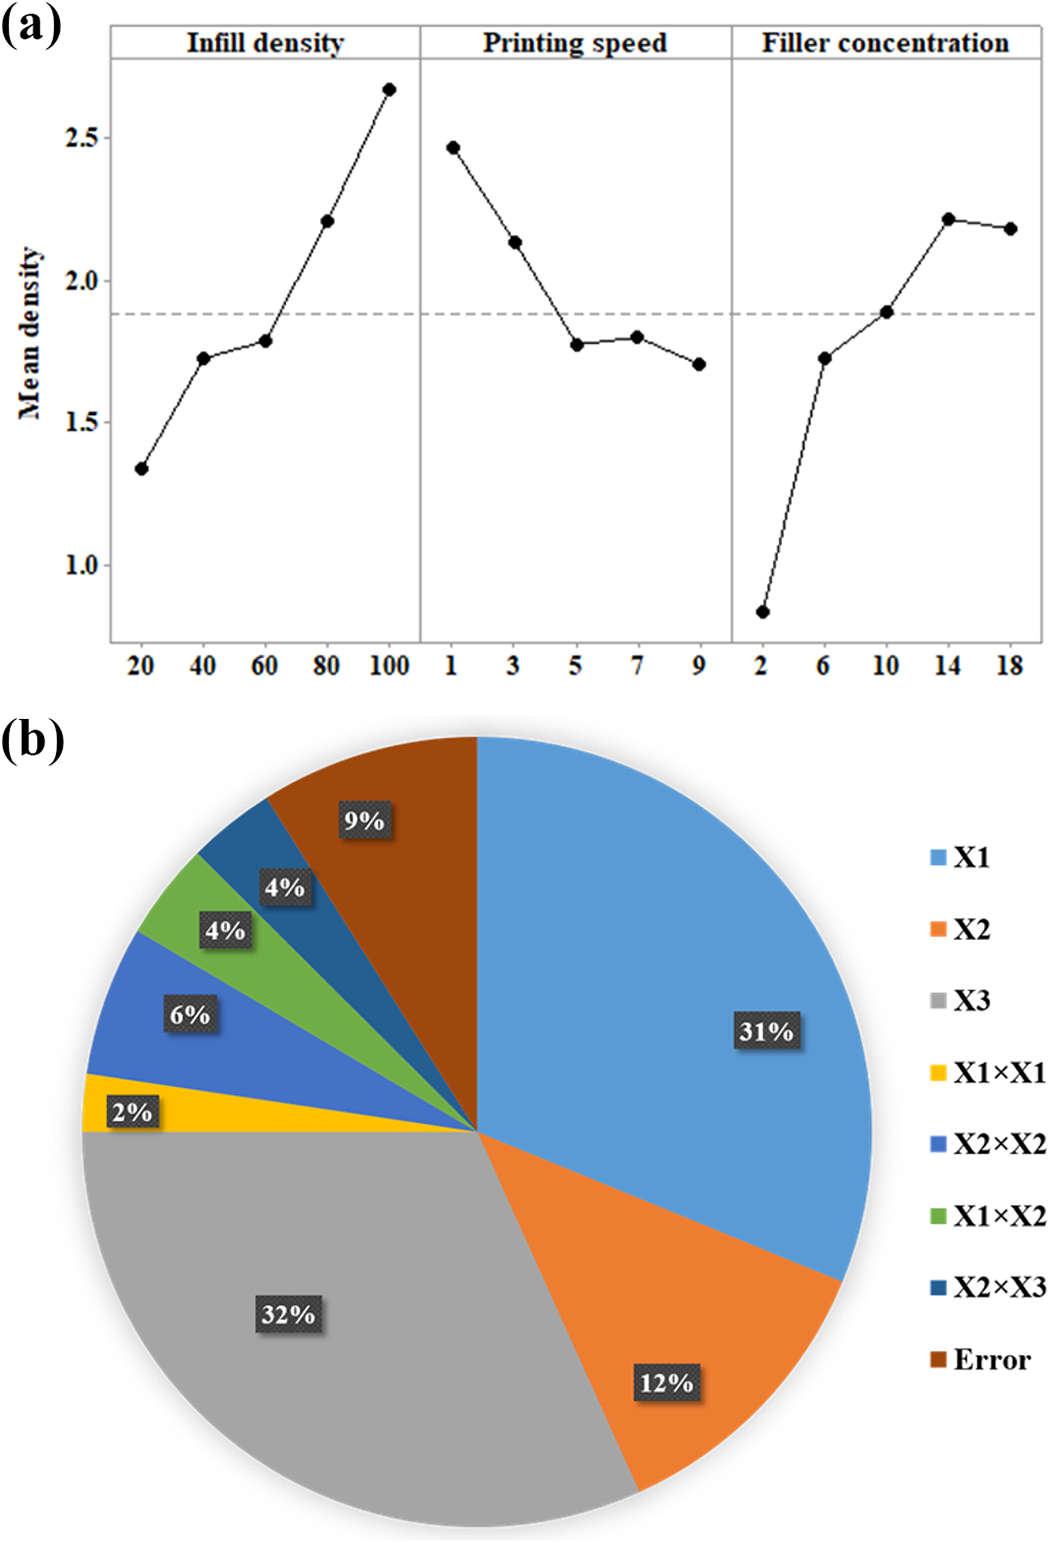
(a) Main effect plot and (b) density contribution plot.
Effect of interaction
The interaction plot between infill density and printing speed is presented in Figure 11. It can be observed from the interaction plot that lowest density was observed for lowest infill density and lower printing speed. However, with increase in infill density, the density of the printed part increased exponentially at a higher printing speed. This increase is on expected lines as higher infill density suggests higher amount of composite material in the same volume. Furthermore, the interaction plot between printing speed and filler concentration is shown in Figure 12. Lower filler concentration and higher printing speed suggested lower density for the printed samples. The reason for the same may be accredited to the cause that lower infill amount renders higher polymer concentration and thus lesser density. Moreover, higher printing speed produces thin filaments of non-uniform cross section thereby reducing the density of printed parts.
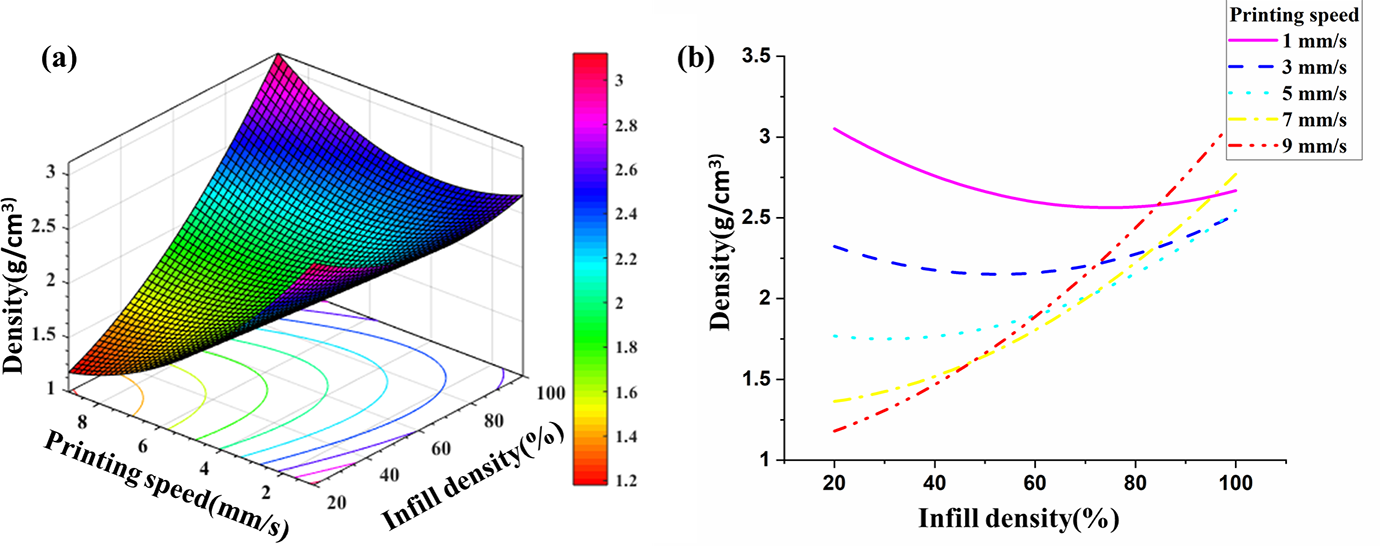
(a) Surface plot and (b) interaction plot of infill density and printing speed on density.
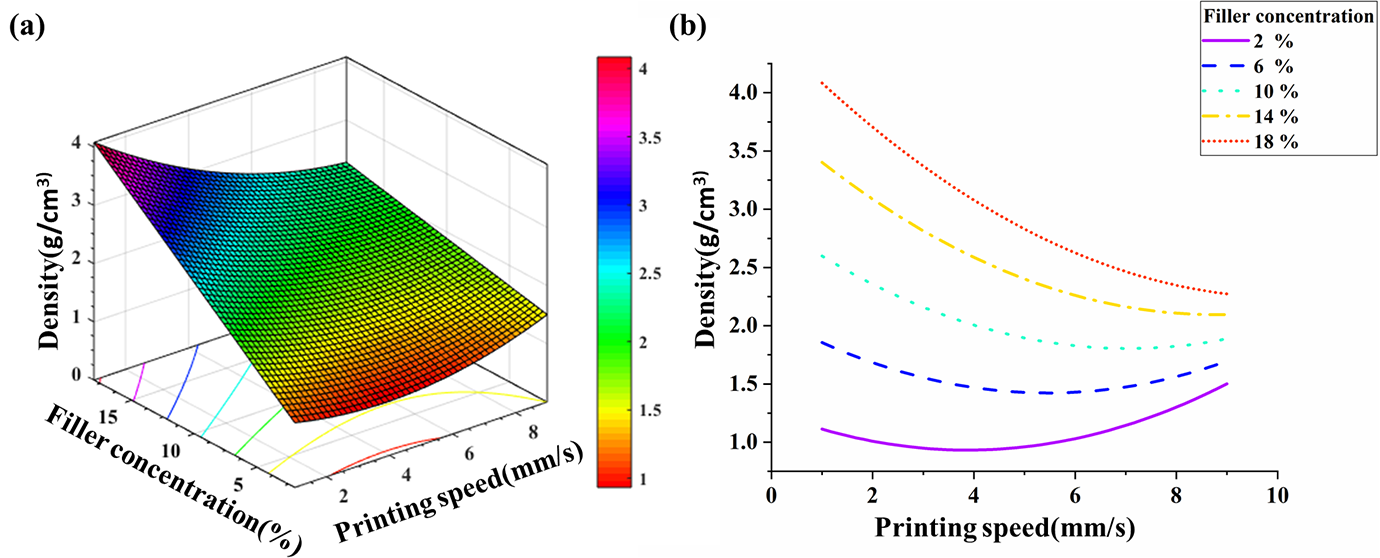
(a) Surface plot and (b) interaction plot of printing speed and filler concentration on density.
Compressive yield strength
Effect of printing process variables
The main effect and contribution plot of process variables for compressive yield strength are depicted in Figure 13. Figure 13(a) illustrates increase in the yield strength with corresponding rise in filler concentration and infill density. Furthermore, a reduction in the yield strength was observed with rising printing speed. Compressive yield strength is higher for brittle materials. 20 Increased metal filler concentration induces brittleness in the material thereby increasing the compressive yield strength of the 3D printed composite. Furthermore, increasing infill density till 60% increases the yield strength due to higher intramolecular adhesion. However, beyond 60% infill density, the compressive yield strength reduces as the ductility of material overcomes the adhesion force. From the contribution plot in Figure 13(b), it is noticed that filler concentration is the highest contributing factor suggesting the increased brittleness due to higher amount of metal fillers, resulting in higher compressive yield strength.
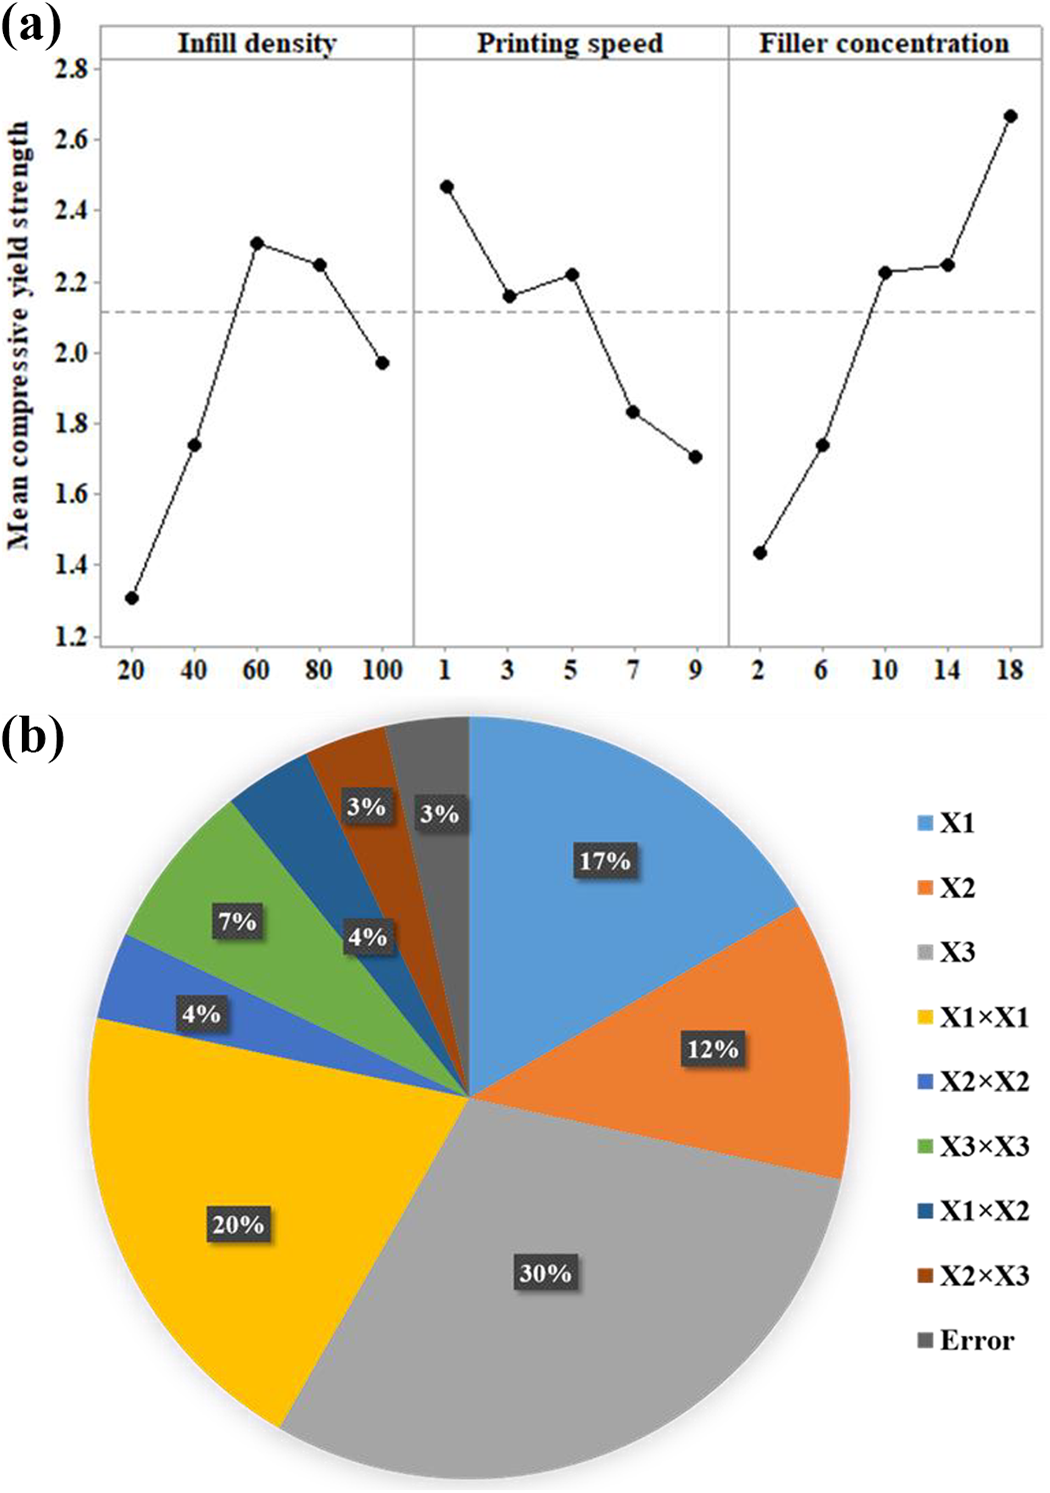
(a) Main effect plot and (b) compressive yield strength contribution plot.
Effect of interaction
Figure 14 depicts the interaction plot between process variables, infill density and printing speed on the response, compressive yield strength. It may be inferred that minimum printing speed and moderate infill density (60%) produced higher compressive yield strength. Furthermore, the interaction plot between printing speed and filler concentration is shown in Figure 15. It can be inferred from the interaction plot that higher filler concentration and lower printing speed resulted largest compressive yield strength. The reason for the same has already been described in the prior section.
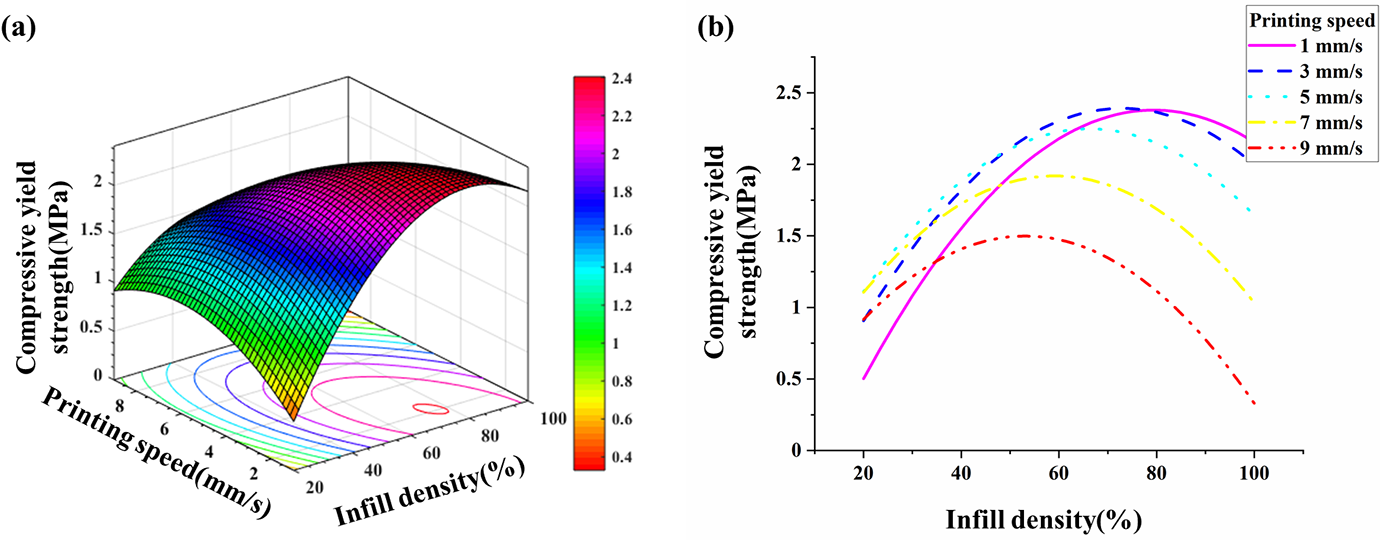
(a) Surface plot and (b) interaction plot of infill density and printing speed on compressive yield strength.
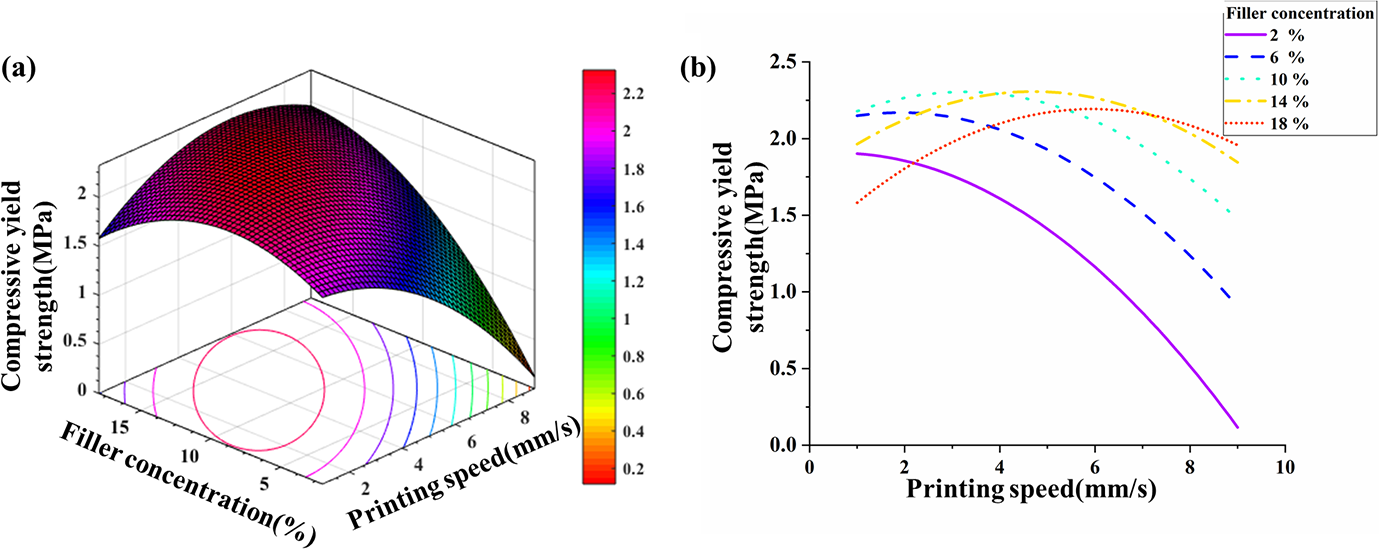
(a) Surface plot and (b) interaction plot of printing speed and filler concentration on compressive yield strength.
Multiobjective optimization
Optimizing the printing process variables for solvent-based extrusion 3D printing process on the development of PCL/carbonyl iron particle composite, multiobjective optimization was performed using genetic algorithm. MATLAB 2015b was utilized to carry out the optimization process using a population size of 200. The objective of the present work was formulated to utilize the 3D printed composite in electronics and microwave applications. Hence, the composite samples obtained using solvent-based extrusion 3D printing technique is supposed to have minimum shrinkage, minimum density and maximum strength. Thus, in the present context, the objective of the present work was to minimize printing shrinkage, minimize density and maximize the yield strength of the printed part. The details of the multiobjective optimization embracing the objective functions and the input arguments are narrated subsequently


where the input argument x is subjected to the following constraints

The Pareto front encompassing all the Pareto solutions obtained from the multiobjective optimization is represented in Figure 16. Another confirmatory experiment was also carried out using one optimum set of input parameters and compared with the solutions from the Pareto front. Table 9 depicts the confirmatory experiment results.
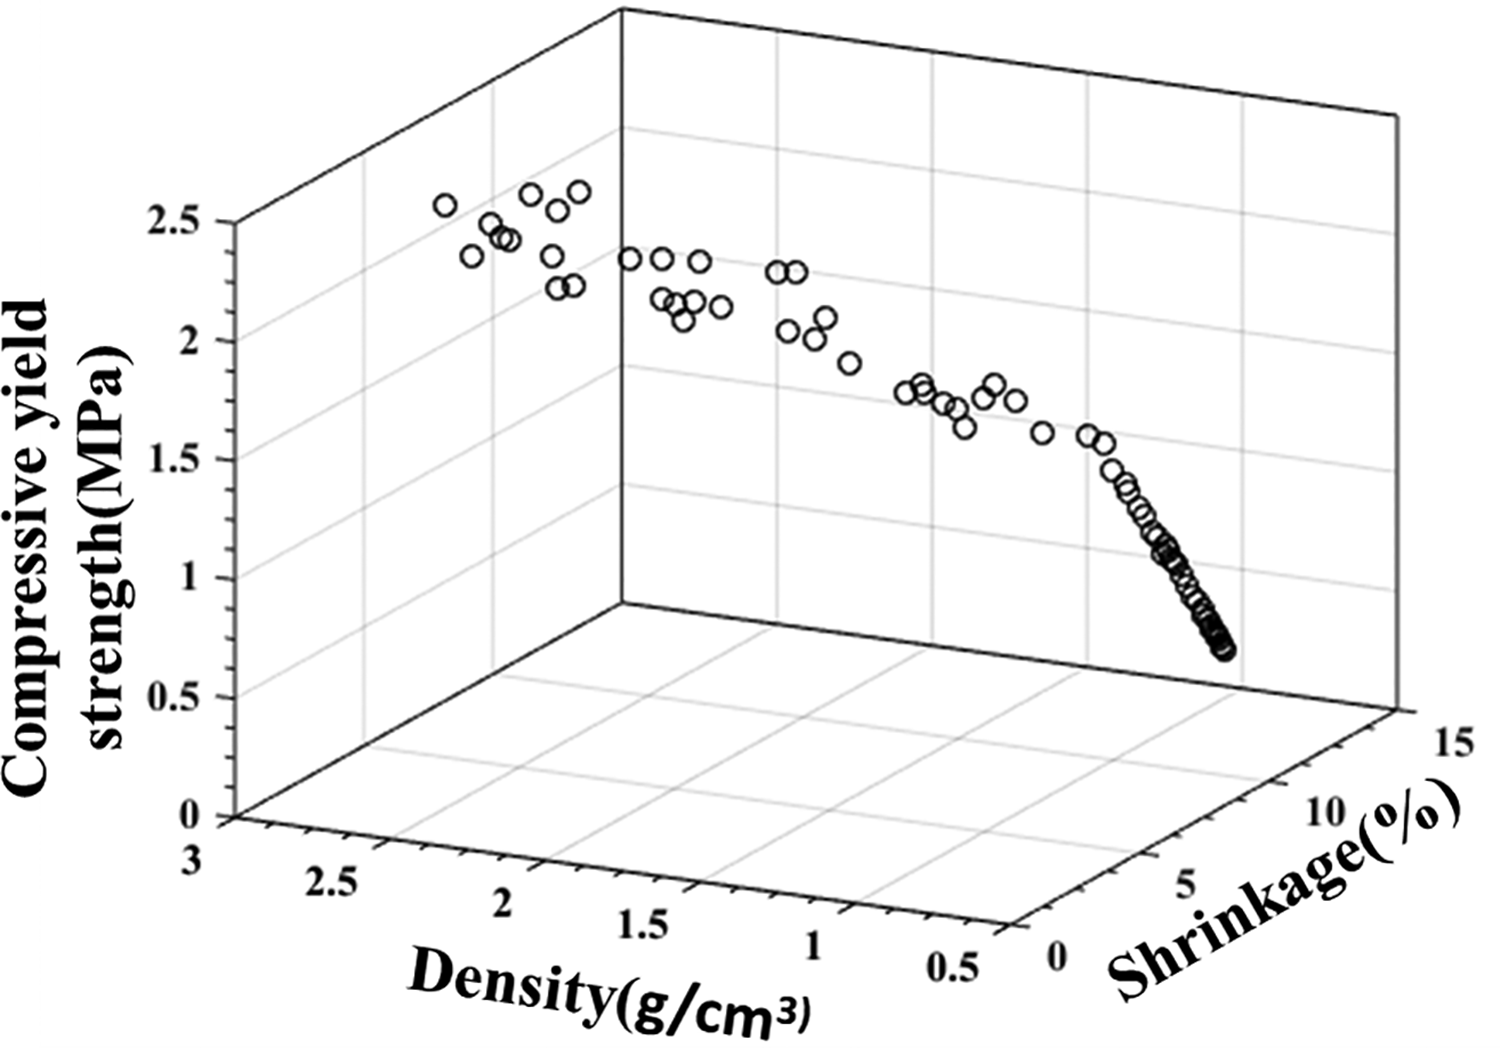
Pareto front with optimum set of solutions.
Confirmatory experiment with optimum set of parameters.
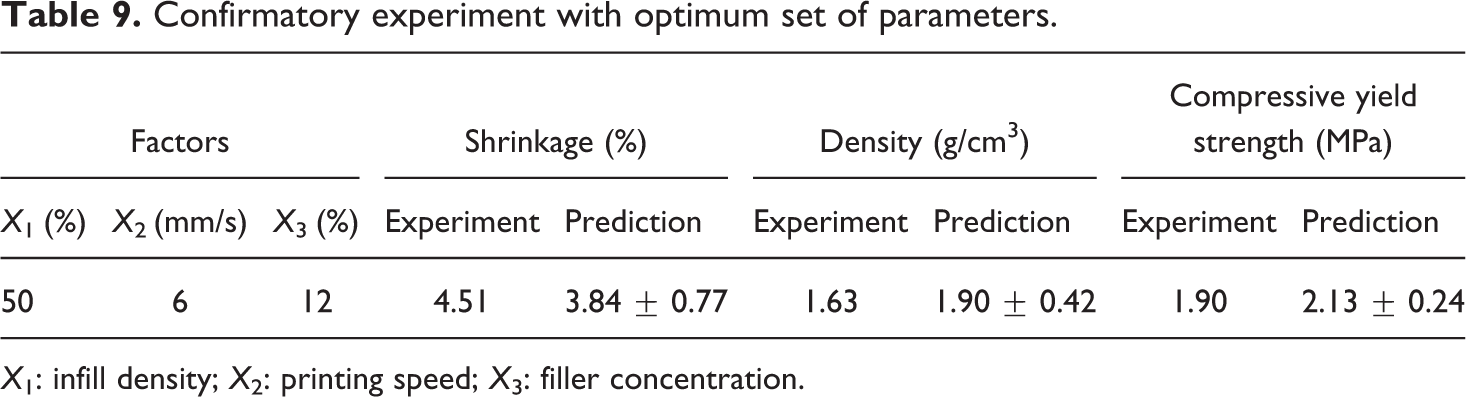
X1: infill density; X2: printing speed; X3: filler concentration.
Case study
To evaluate the potential of the aforementioned 3D printed PCL/CIPs composite for an effective microwave shielding application, the absorption properties in the microwave spectrum of the 3D printed composite were measured. The facility utilized for this purpose was the vector network analyzer via the rectangular wave guide method. The 4-mm-thick fabricated samples were used for the measurement of microwave properties. The measurements were performed at X-band frequency range from 8 GHz to 13 GHz. The microwave shielding properties of the aforementioned polymer composite, 3D printed using the optimum parameters from Table 9, in terms of the reflection loss and transmission loss are presented in Figure 17. Furthermore, a comparative assessment of the reflection loss of the composite fabricated using solvent-based extrusion 3D printing with some of the previous literature is presented in Table 10.
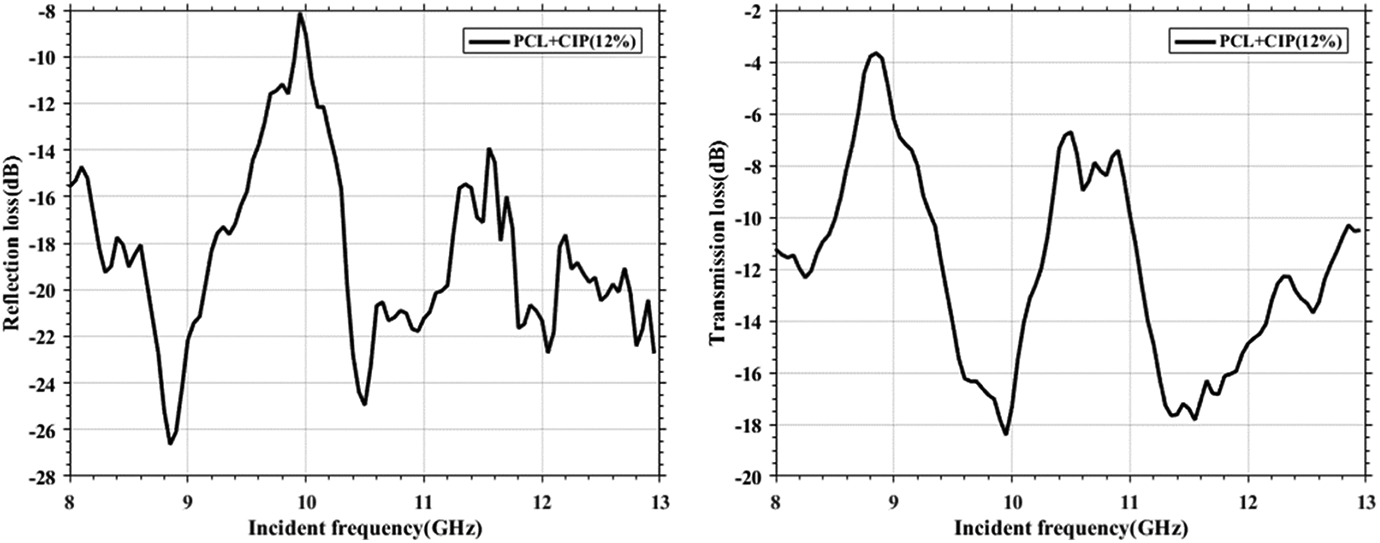
Microwave shielding parameters of PCL/CIP (12%) composite in X band frequency range.
Comparative evaluation of reflection loss.
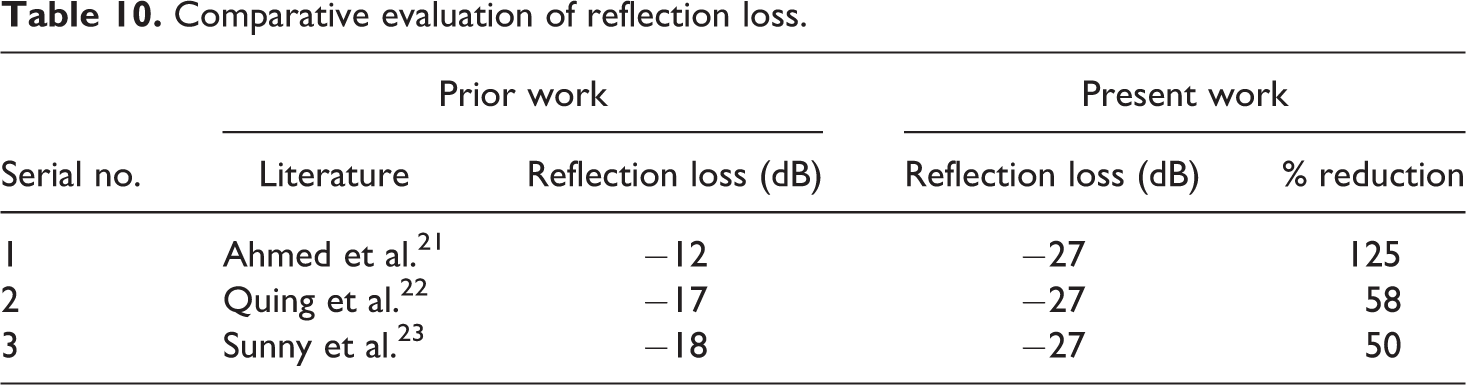
It can be depicted from Figure 17 that the PCL/CIP composite sample fabricated, utilizing the optimum printing parameters in solvent-based extrusion 3D printing, exhibits a reflection loss value as low as −27 dB and transmission loss value as low as −18 dB. The reflection loss value in decibels suggest that 3.7% of the incident electromagnetic energy is reflected back from the composite sample, whereas the transmission loss value suggests that 5.6% of the electromagnetic energy is transmitted forward from the composite sample. Thus, PCL/CIP composites fabricated using solvent-based extrusion 3D printing process can be recommended as a potential candidature for microwave shielding material. Moreover, Table 10 renders a comparison of the reflection loss value of the present composite with some of the prior literature. A conclusive reduction in the reflection loss of the PCL + CIP composite fabricated using solvent-based extrusion 3D printing technique was realized.
Conclusion
In the present work, the experimental investigations followed by statistical modelling and multiobjective optimization of the solvent-based extrusion 3D printing of PCL/CIP composite yielded the following concluding remarks.
Polymer composites comprising of PCL polymer and carbonyl iron particles were successfully fabricated using solvent-based extrusion 3D printing technique. The XRD plots confirmed the absence of any other foreign material in the composite samples.
An RSM-based statistical model was used to study the relative effect and interrelationships between printing process variables such infill density, printing speed and filler concentration on the process response parameters such as the shrinkage, density and compressive yield of the printed composite parts.
A reduction in shrinkage was observed with increase in infill density and filler concentration, whereas the printing speed increase was found to increase shrinkage. On the other hand, density and compressive yield strength were observed to increase with increase in infill density and filler concentration and a decrease in printing speed.
A set of optimum process parameters were obtained using multiobjective optimization, genetic algorithm. The optimum process parameters such as 50% infill density, 6 mm/s printing speed and 12% filler concentration yielded 3.84% shrinkage, 1.9 g/cm3 density and 2.13 MPa compressive yield strength for the composite part.
The case study involving microwave shielding performance test strongly suggested the efficacy of the solvent-based extrusion 3D printing technique in developing lightweight microwave shielding material with reasonable compressive strength.
The reflection loss and transmission loss values of the 3D printed PCL/CIPs composite with 50% infill density, 6 mm/s printing speed and 12% filler concentration was found to be −27 dB and −18 dB, respectively.
The losses in the electromagnetic energy in terms of reflection and transmission were found to be 3.7% and 5.6%, respectively, thereby suggesting the rest energy that is 90.7% to be absorbed by the 3D printed PCL/CIP composite fabricated using solvent-based extrusion 3D printing technique.