
Abstract
This study reports investigation on nano-sized (5–10 nm) graphene (Gr)-reinforced, secondary (2°) recycled acrylonitrile–butadiene–styrene (ABS) as a smart composite material for 3D and 4D applications. Gr was blended (in different weight proportions) with 2°-recycled ABS granules mechanically for selection of composition/proportion after ascertaining rheological property (based upon melt flow index according to ASTM D 1238), thermal stability based upon differential scanning calorimetry, and magnetic property based upon vibration sample magnetometry. The selected compositions/proportions of ABS-Gr composite was further processed with a twin-screw extruder by varying screw temperature and torque. The results of the study suggest that as regards to mechanical properties (peak strength and Shore D hardness) are concerned, the best settings are 20 wt% Gr reinforcement in ABS at a screw temperature 210°C with torque of 0.4 Nm. The corresponding heat capacity and magnetization for the selected composition/proportion was observed as 0.77 J/g and 0.10 × 10⁻⁵ emu (+magnetization), 0.080 × 10⁻⁵ emu (−magnetization), respectively. The coercivity of the selected compositions ranges from 79.19 Oe to 1260.34 Oe (+coercivity) and 4.64 Oe to 639.50 Oe (−coercivity), whereas the retentivity of the investigated compositions ranges from 2.36 × 10⁻⁵ G to 5.44 × 10⁻⁴ G (+retentivity) and 4.31 × 10⁻⁵ G to 3.48 × 10⁻⁵ G (−retentivity). The results have been counter verified based upon optical photo micrographs, porosity analysis, scanning electron microscopy analysis, and energy-dispersive spectroscopy analysis.
Introduction
In the last two decades, the use of electrically conductive filler materials such as grapheme (Gr) and carbon nanotubes-based composites for conductive polymers has been widely explored by different researchers.1–2 Since Gr has good thermal properties, it has been used as reinforcement in various polymers such as styrene acrylonitrile, acrylonitrile–butadiene–styrene (ABS), and nylon for various engineering applications.3–4 The blends of polymers and carbon-based materials add strength to the polymer, and modified composites are prepared with good mechanical properties. 5 The morphological studies of Gr-blended polymers proved that critical composition and change in phase plays a vital role in alteration of properties of material. 6 The monocrystalline form of Gr acted as a 2D semimetal that overlaps between the conducting and the valence bands to attain strong electric field. This behavior helped to prepare composites with high electrical conductivity. 7 It has been outlined by many researchers that the presence of carbon material such as Gr, carbon fibers, carbon nanofibers, and carbon black gave hardness to the material in which it is introduced or mixed. 8 The presence of anomalous behavior has been observed in composite materials due to transfer of electrons between the substrate and the carbon material that possess π bonding. 9 Therefore, there is a possibility that material like Gr can be patterned to complex shape parts by nanolithography technique. 10 The excellent abrasion and chemical resistance along with high surface finish makes ABS a highly useful engineering plastic material. The composite of ABS and ethylene propylene diene monomer (EPDM) filled with Gr has been found more electrically conductive and mechanically strong due to the presence of Gr nanoplatelets. The uniform mixing of Gr in ABS has been proved very useful to enhance its properties. 11 Fused deposition modeling (FDM) and many other platforms of additive manufacturing (AM) have been explored for practical applications of such composites. Gr has been found as a very effective reinforcement in ABS not only to improve the properties of the material, but it has also increased the properties of 3D printed parts. The presence of Gr nanoplatelets in 3D printed parts of ABS (made by FDM process) has increased the elastic modulus and dynamic storage modulus. The 3D printed parts had been found more thermally stable with decreased stress and strain at break. 12 Being an antifriction material, Gr has been used to provide coating on polymers like polycarbonate (PC) and ABS as these polymeric materials are used in numerous machines and technological devices. The Gr has been found as a better material that reduces the coefficient of friction of ABS and PC-ABS polymers when used as a coating material. Gr, a solid lubricant with appreciable electrical, mechanical, wear suppressant, and thermal properties, has been used as an additive for semisolid and liquid lubricants since it can reduce the friction to greater extent. 13 The investigations performed on multifunctional Gr highlighted that high-performance polymeric materials can be developed to improve the quality of industrial products. The nanocomposites of ABS have shown tremendous rise in tensile strength and elastic modulus after incorporation of Gr in it. The multifunctional additive (Gr) has enhanced thermal stability and decreased the total smoke production by reducing the time to ignition and peak heat release rate of ABS. Gr nanosheets acted as thermal barriers for the polymers. Such simultaneous increment in flame retardancy, mechanical strength, and smoke suppression has been found in plastics due to the presence of smartly acting Gr. 14 The presence of Gr in PC and ABS polymer showed that reinforcement of nanocomposites has increased the glass transition temperature of PC and ABS and mass of material decreased with increase in temperature. Gr platelets had increased the Young’s modulus of the polymers that has been 3D printed by FDM method. 15 An efficient method has been proposed to synthesize ABS copolymer by using reduced Gr nanocomposites. By this method one can utilize the excellent conductivity of Gr for consuming ABS polymer that may have good chemical and heat resistance. Also the recyclability of polymers can be increased by this method. 16 It has been reported that Gr can be used effectively as a barrier material for gases to protect polymers from environmental degradation. Gr epoxy when sprayed on 3D printed ABS substrates acted as an oxygen gas barrier to prevent ABS from degradation so that technological applications of ABS can be enhanced. 17 The influence of heat and electricity on composites made by using Gr is very appreciable. Therefore, it has been recommended for blending with polymers to prepare feedstock filament for 3D/4D printing. 18 The recent investigation on meta-materials has outlined the importance of analytical formulas for better bending stiffness in the materials that is effective for mechanical modeling of 3D printed parts with 4D properties. Such innovative meta-materials are very useful in seismic isolation devices. 19 By using AM, metallic pentamode material like Ti6Al4V has been investigated for better applications of 3D printing techniques in fabrication of shear-wave band gap systems. 20 3D printing of Ti alloy-based tensegrity structures by electron beam melting technique has given good response toward elastic stiffening on the application of axial strain during compressive loading. 21 The literature review reveals that lot of work has been reported on reinforcement of Gr with different thermoplastics for enhancing one or other properties of composite matrix. But hitherto little has been reported on rheological, thermal, magnetometric, and mechanical properties of 2°-recycled ABS and nano-sized (5–10 nm) Gr composite for 3D/4D applications. This study reports the detailed investigations for rheological, thermal, magnetometric, and mechanical analysis of 2°-recycled ABS and Gr composite matrix.
Experimentation
Figure 1 shows the process flow chart (work methodology) for experimentation.
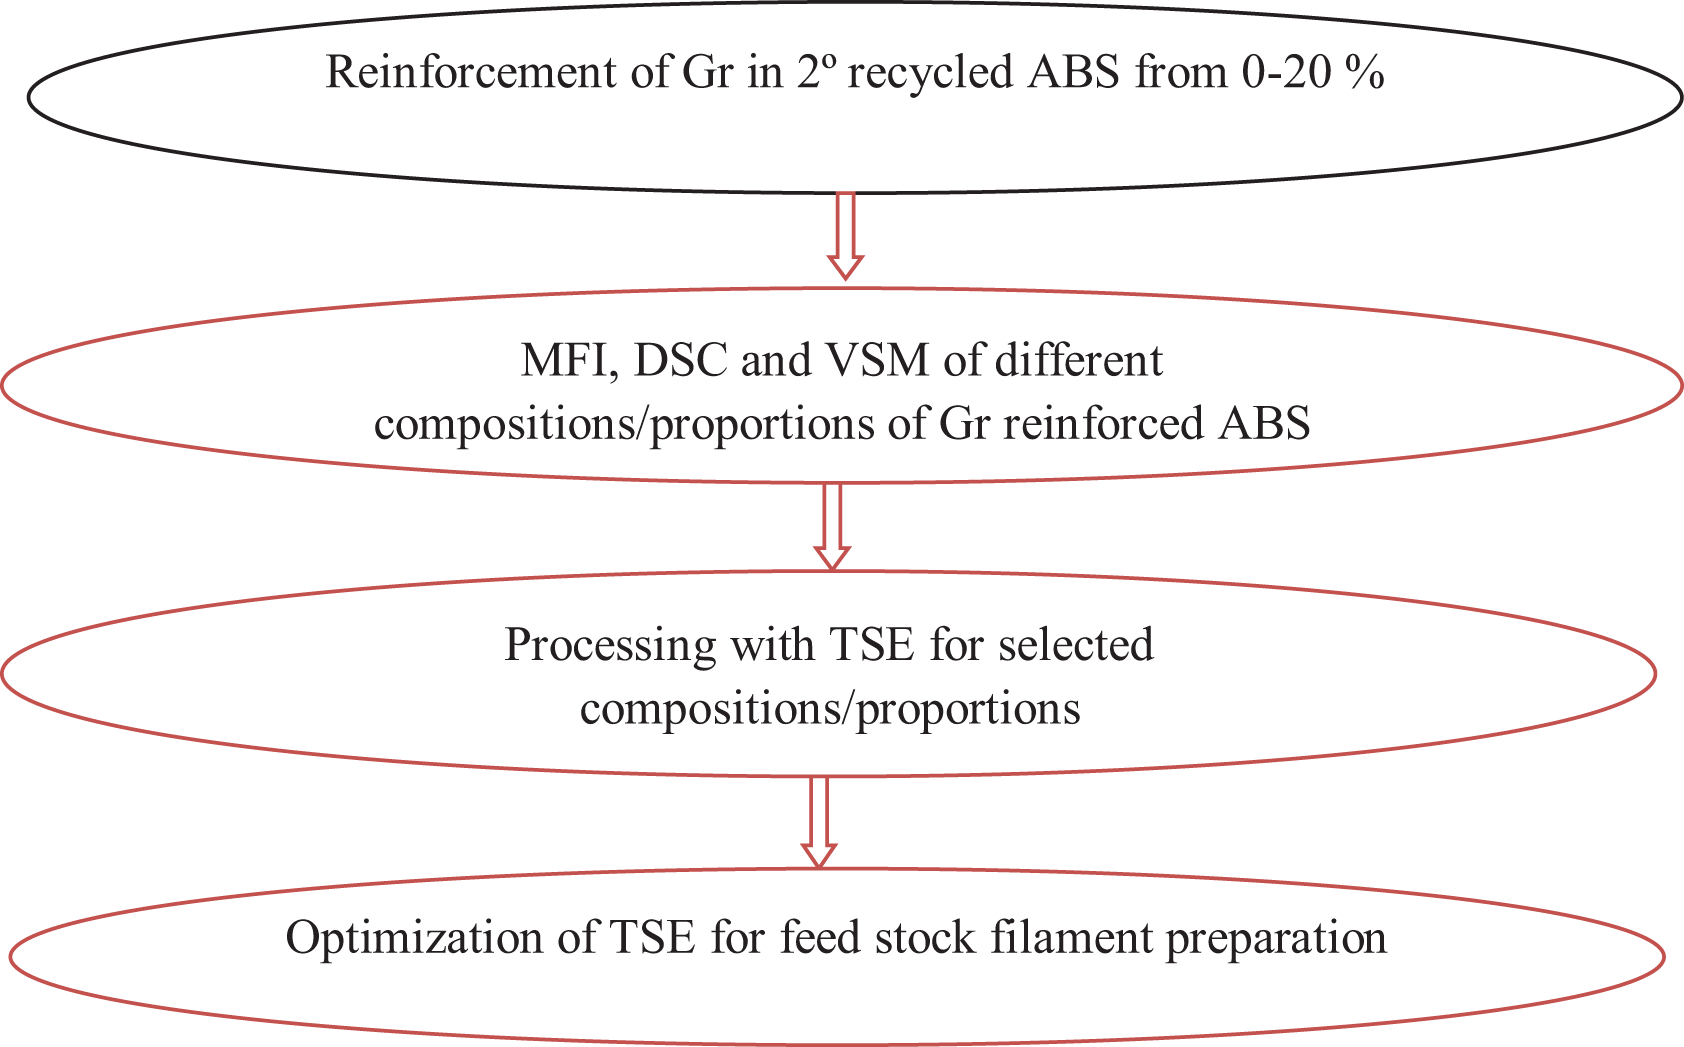
Flow chart of the present work.
Pilot study
MFI testing
To ascertain acceptable composition/proportion of Gr in 2°-recycled ABS, pilot study was conducted to test the MFI of blends having different composition/proportion of Gr (by weight). The ASTM D1238 standard was followed to test the MFI of Gr-reinforced 2° ABS samples by applying a standard load of 3.8 kg, keeping the die temperature at 230°C. The weight of the material that flows through the MFI tester die for 10 min gives the MFI of the material in g/10 min. Figure 2 shows the melt flow tester used for MFI testing of composites.
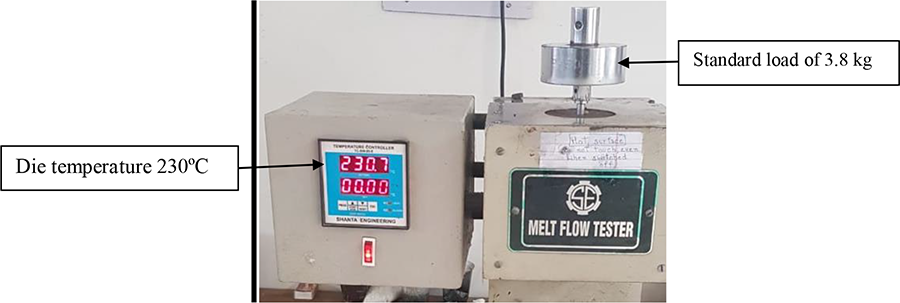
Melt flow tester.
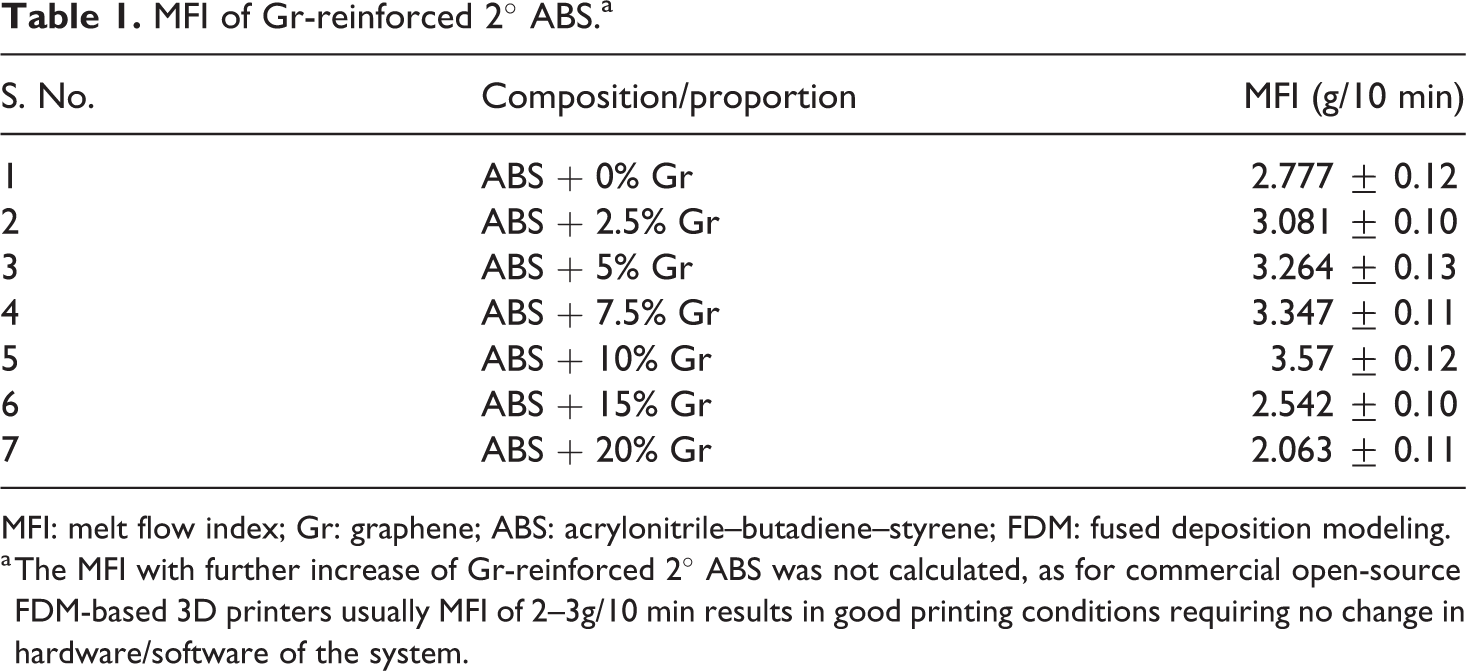
The changes observed in melt flow of 2°-recycled ABS due to the presence of Gr are presented in Table 1. It has been observed that the increase in composition/proportion of Gr (up to 10% by weight) resulted in a steady increase in MFI of the 2° ABS, but reinforcement of Gr more than 10% resulted into further decrease in MFI.
MFI of Gr-reinforced 2° ABS.a
MFI: melt flow index; Gr: graphene; ABS: acrylonitrile–butadiene–styrene; FDM: fused deposition modeling.
a The MFI with further increase of Gr-reinforced 2° ABS was not calculated, as for commercial open-source FDM-based 3D printers usually MFI of 2–3g/10 min results in good printing conditions requiring no change in hardware/software of the system.
Thermal analysis
As observed from Table 1, all compositions/proportions of Gr-reinforced ABS matrix can be used for 3D printing on FDM, but in order to ascertain the useful composition it is important to analyze thermal behavior/stability of prepared composites. Therefore, to investigate the thermal behavior of ABS and Gr composites, DSC testing of samples (Table 1) was performed. METTLER TOLEDO DSC (Switzerland) commercial set up has been used to analyze the thermal behavior of the composites. Each sample was tested for two DSC cycles, and the thermal heat capacity of composites was recorded. The air flow rate of 50 ml/min was provided to aluminum pans (capacity 40 μl) in which sample weighing 4–11 mg can be tested for thermal analysis. The heating of samples was carried to 250°C as the base material (2°-recycled ABS) decomposition started beyond this temperature limit. Figure 3 shows DSC curves for heating and cooling cycles and increment in heat capacity of 2°-recycled ABS after reinforcement of Gr in it. The numbers marked from 1 to 7 (Figure 3) show thermal behavior of selected compositions. Table 2 provides the heat capacity for each type of tested composition.
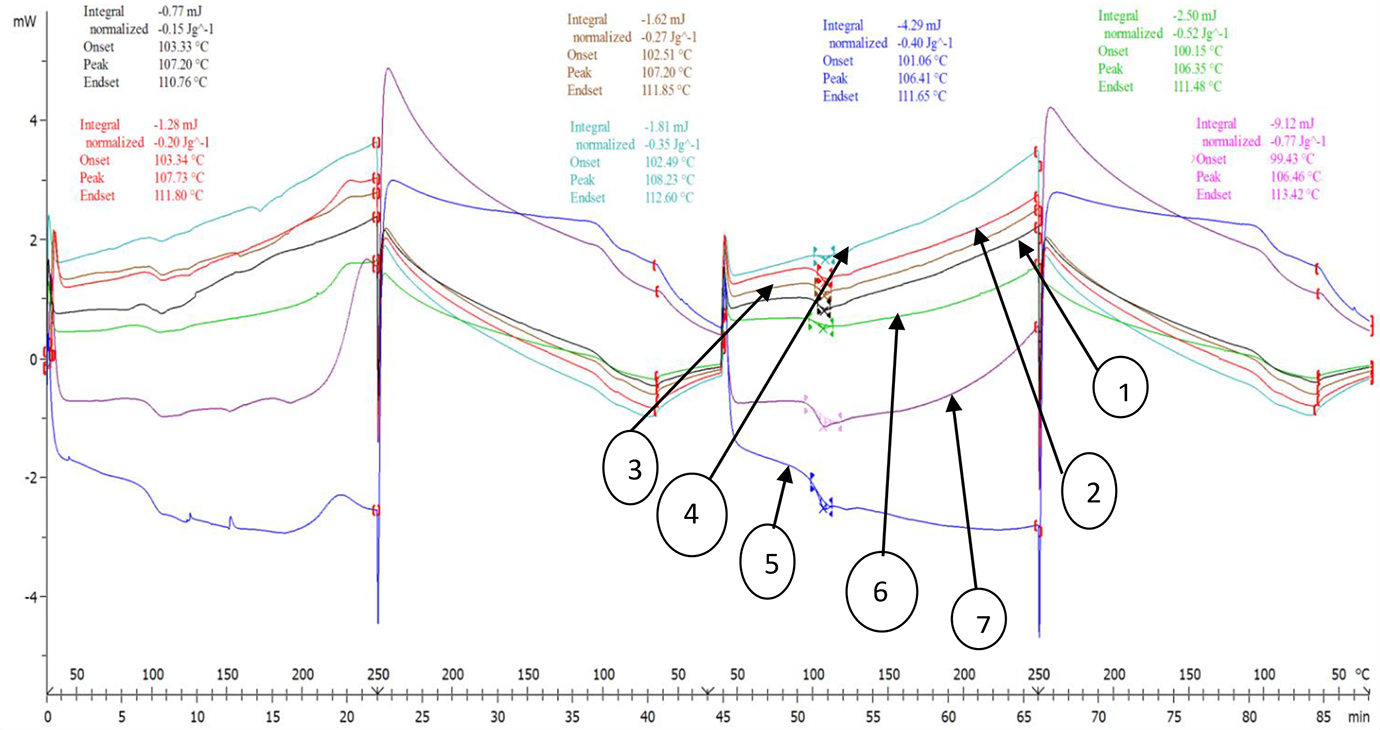
DSC based curves for Gr-reinforced 2° ABS.
Heat capacity of Gr-reinforced ABS.
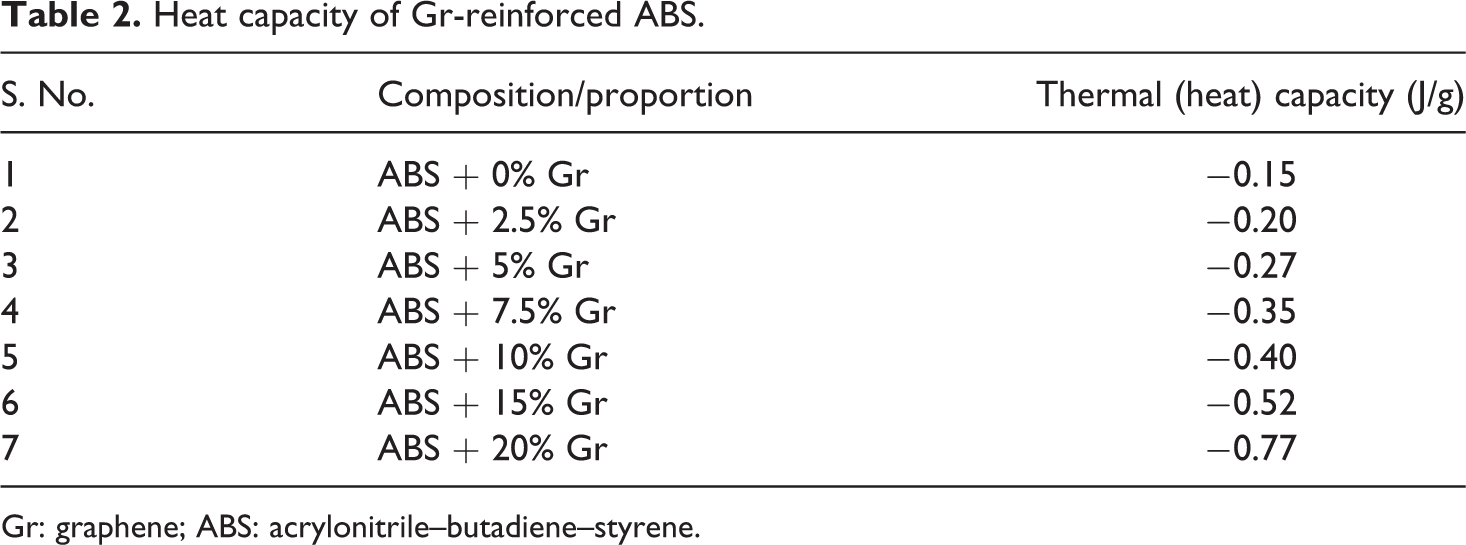
Gr: graphene; ABS: acrylonitrile–butadiene–styrene.
As observed from Table 2, increase of Gr% in ABS improves the heat capacity of 2°-recycled ABS. The composite with 10%, 15%, and 20% reinforcement of Gr showed significant rise in heat-carrying capacity.
Magnetometric (VSM) analysis
After rheological and thermal analyses, the effect of all the compositions/proportions of Gr reinforced 2°-recycled ABS samples for their magnetic properties was investigated by using VSM to ascertain magnetic properties (for 4D applications). Commercial VSM setup (Lakeshore 7404) was utilized for investigating magnetic behavior of composites by giving the samples an external applied field of 1 tesla. Table 3 lists results of VSM analysis in terms of coercivity, retentivity, and magnetization for Gr-reinforced 2° ABS.
Observations for coercivity, retentivity, and magnetization induced in Gr-reinforced 2°-recycled ABS.
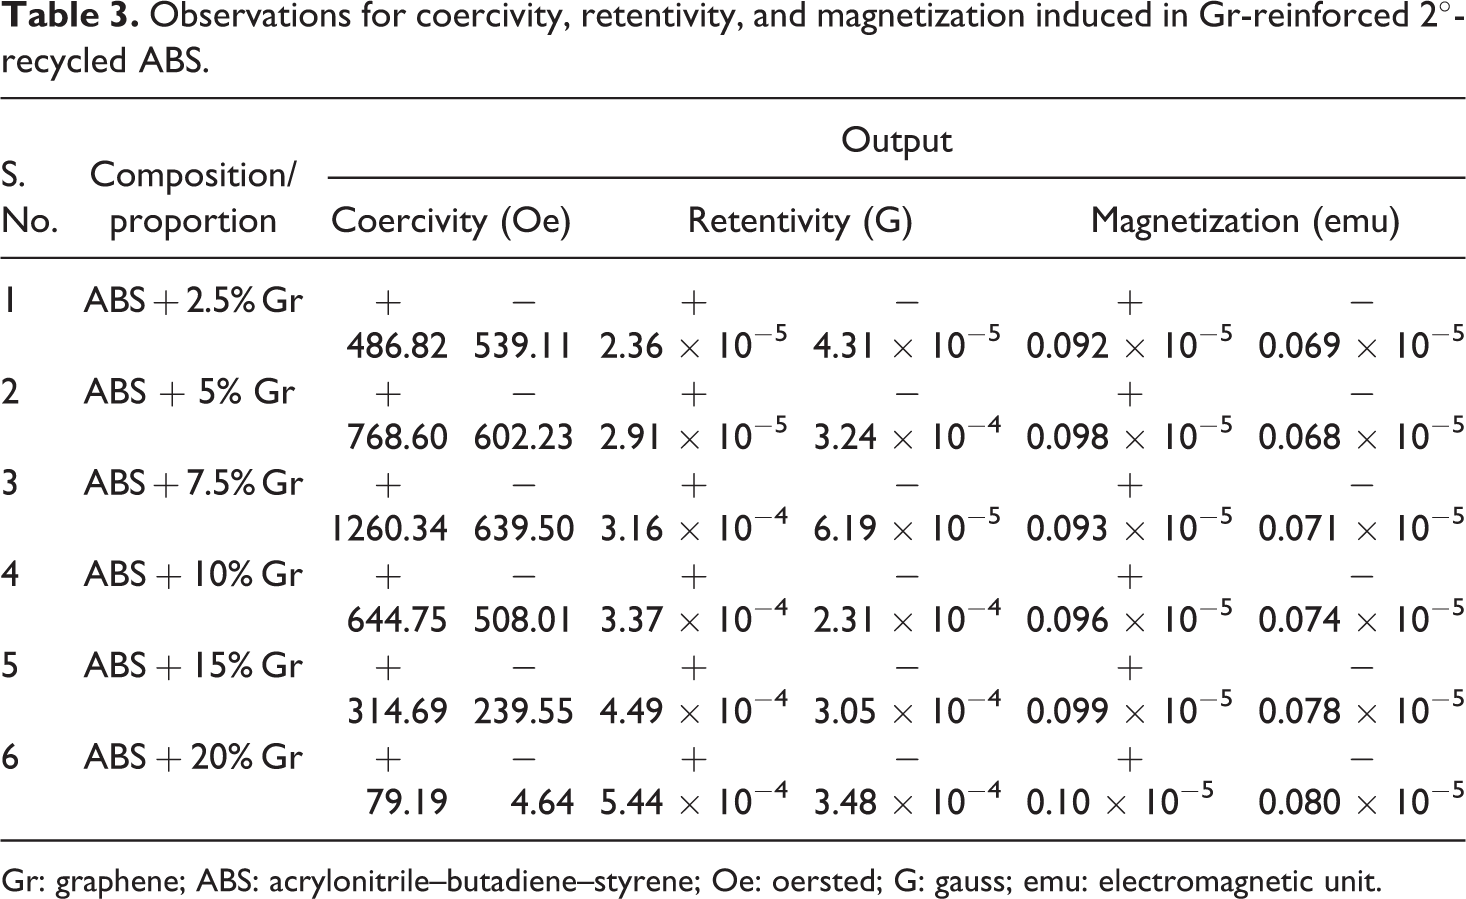
Gr: graphene; ABS: acrylonitrile–butadiene–styrene; Oe: oersted; G: gauss; emu: electromagnetic unit.
Based upon Table 3, under applied magnetic field (gauss), the moment/magnetization (emu) obtained for each sample was used to construct hysteresis loop (Figure 4). As observed from Figure 4, hysteresis loops of Gr-reinforced ABS specimens provide a range of magnetization as it did not follow any linear trend of magnetization.
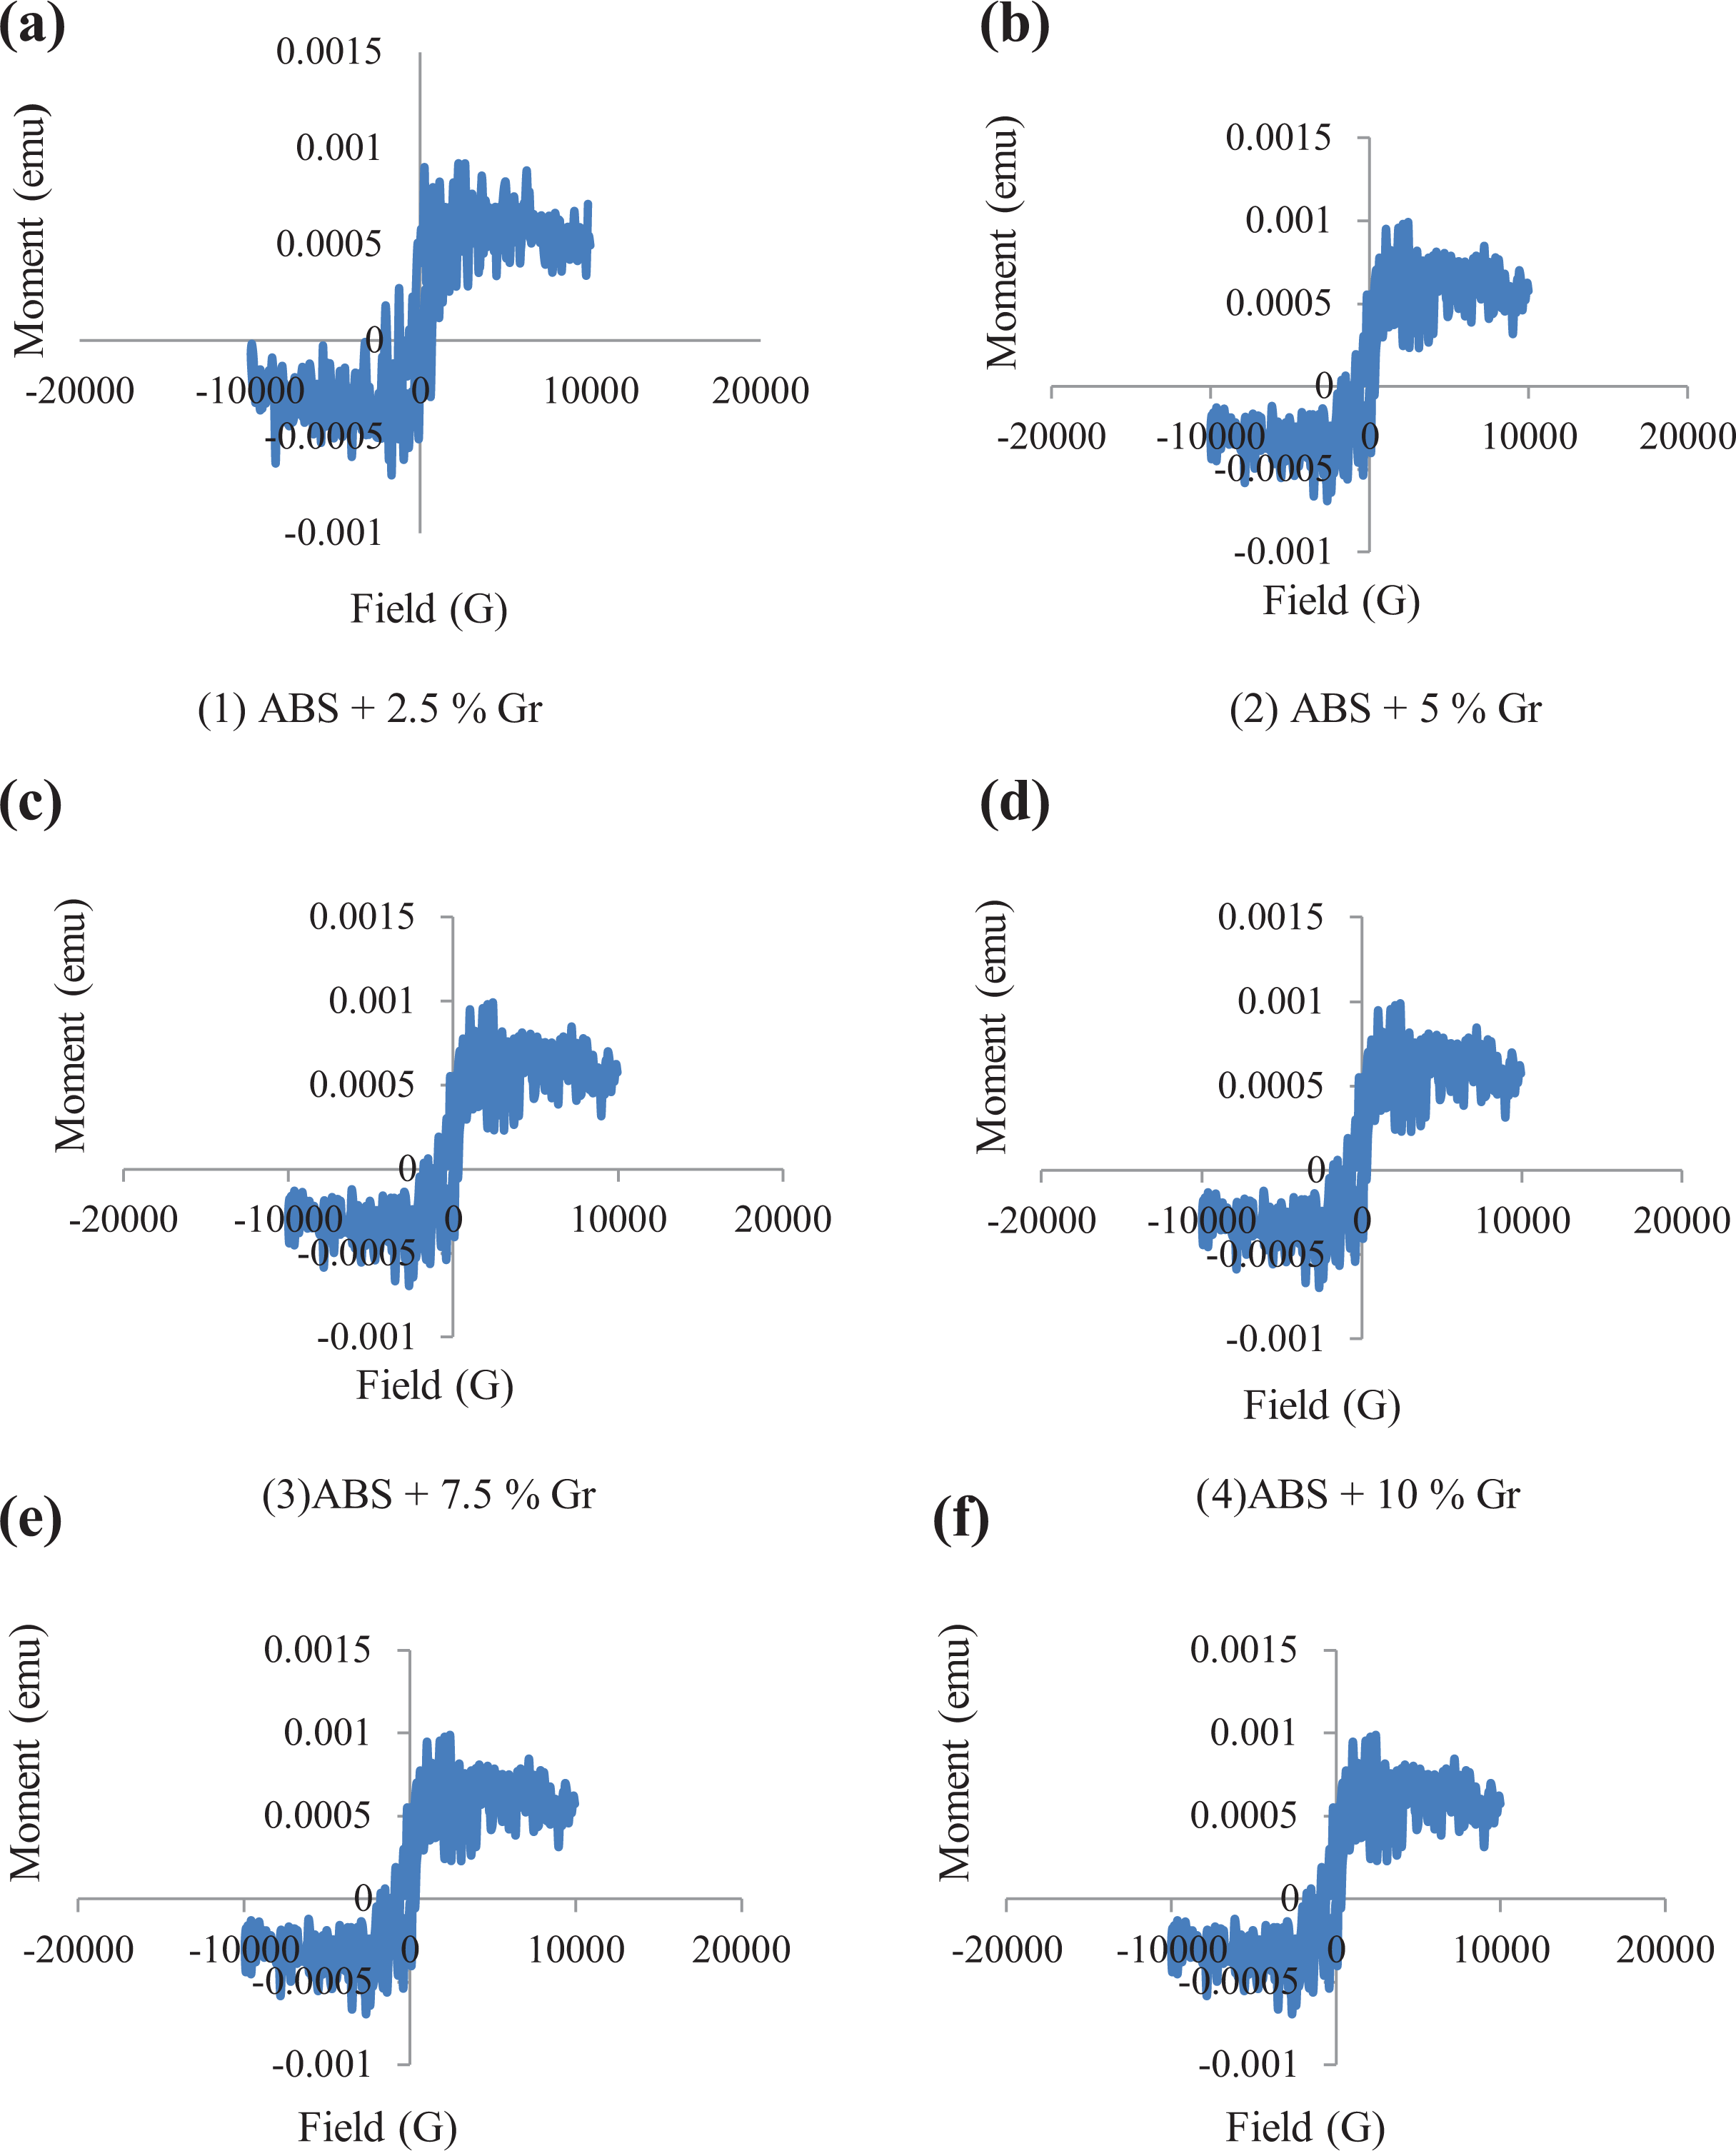
Hysteresis loops obtained by VSM analysis (according to Table 3): (a) (1) ABS + 2.5 % Gr, (b) (2) ABS + 5 % Gr, (c) (3)ABS + 7.5 % Gr, (d) (4)ABS + 10 % Gr, (e) (5)ABS + 15 % Gr, and (f) (6)ABS + 20 % Gr.
Based upon Table 3 and Figure 4, it has been ascertained that higher concentration of Gr in ABS resulted in better value of positive magnetization and retentivity. The compositions/proportions of Gr in 2°-recycled ABS for which acceptable MFI and better heat capacity and magnetic properties (such as positive magnetization and positive retentivity) were obtained have been shortlisted for further mechanical analysis (Table 4). These compositions/proportions were finally selected for processing on TSE.
Selected composition/proportion of Gr-reinforced 2°-recycled ABS based upon pilot study.
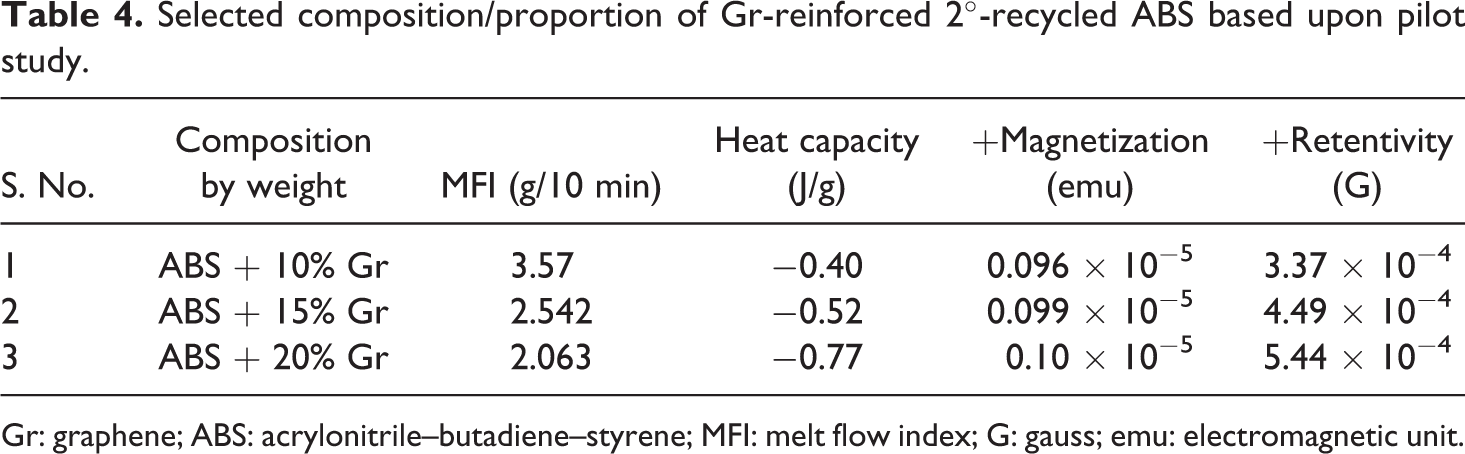
Gr: graphene; ABS: acrylonitrile–butadiene–styrene; MFI: melt flow index; G: gauss; emu: electromagnetic unit.
Final experimentation
Twin-screw extruder
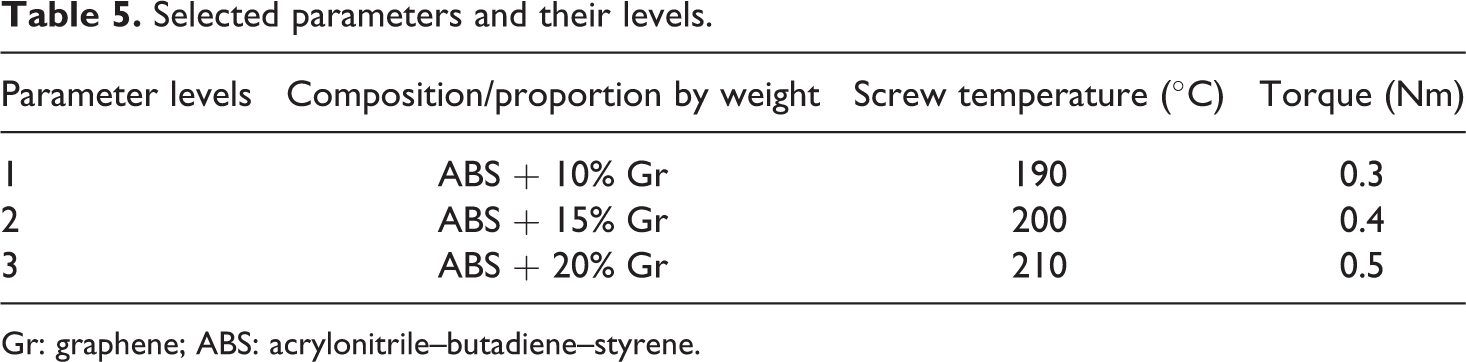
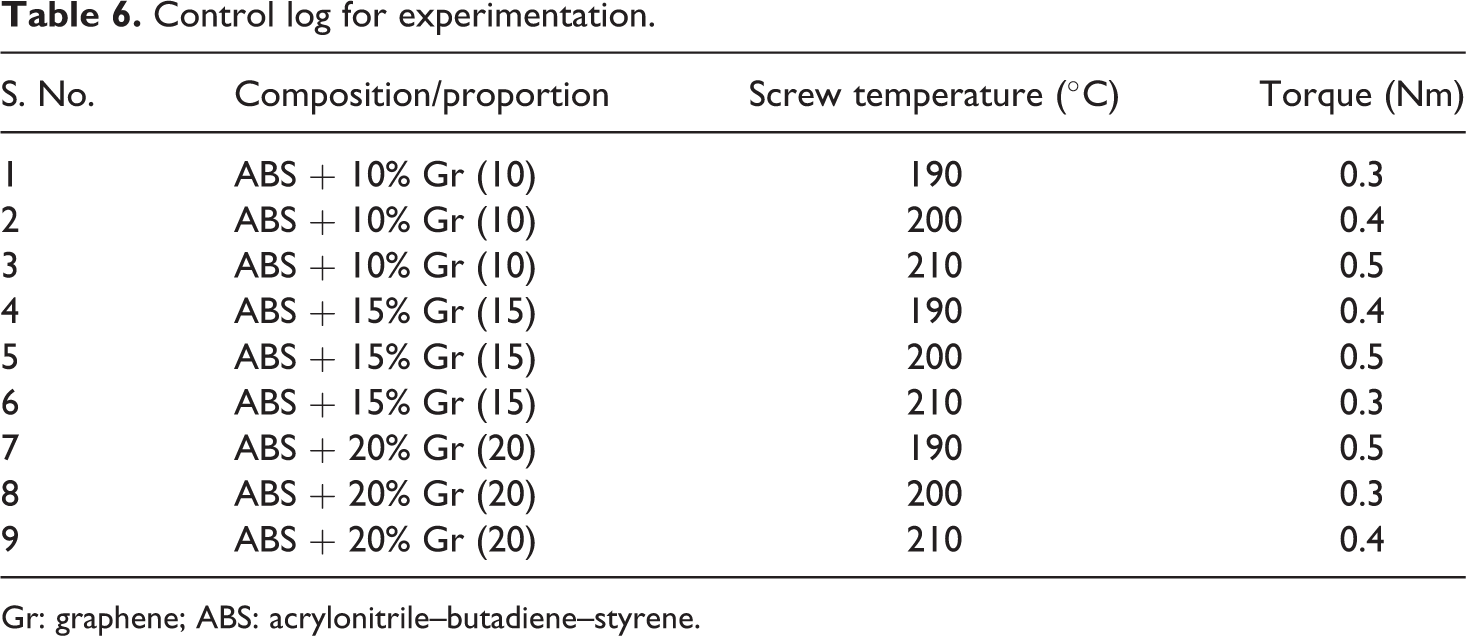
The Gr-blended 2° ABS grains were extruded to wire-shaped specimens using Thermo Fisher Scientific HAAKE miniCTW (Germany) TSE. The wire filament fabrication technique follows the mechanism in which two screws rotate in a manner such that the selected compositions mixed uniformly and got melted inside the preheated chamber that is expelled out from the die cavity. It has been reported that one can control the temperatures of screws, torque, or rotational speed and dead weight that helped in continuous flow of material or prepared composition.22–25 Figure 5(a) and (b) shows the TSE setup and its interface to extrude the wire samples in controlled conditions. Three input parameters were selected with three levels (Table 5) according to Taguchi L9 orthogonal array. Based upon Table 5, Table 6 presents control log of experiment.
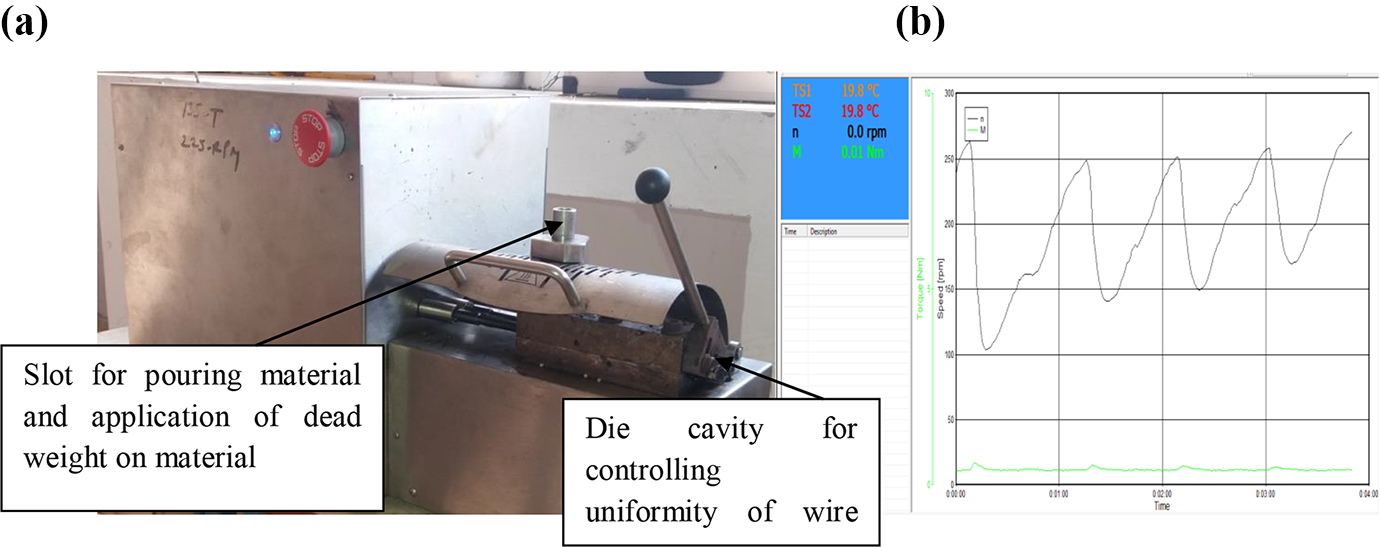
(a) TSE setup (b) TSE interface for controlling working parameters.
Selected parameters and their levels.
Gr: graphene; ABS: acrylonitrile–butadiene–styrene.
Control log for experimentation.
Gr: graphene; ABS: acrylonitrile–butadiene–styrene.
The wire specimens of length 1.5 m were extruded (with diameter 2.00 ± 0.02 mm) for different set of parameters (Table 6). These wires were used for the testing of mechanical and morphological properties. It should be noted that commercial open-source 3D printer comes with different nozzle diameters. In this study, 2-mm diameter nozzle has been used. The wire diameter can be controlled easily based upon die size in TSE. Figure 6 shows successful printing of Gr-blended ABS filament wire on 3D printer. The universal tensile testing machine (UTM) (Shanta Engineering, Pune, Maharashtra, India) has been used to perform tensile testing of wire specimens. The desired length of wired shape specimens has been cut from the wires extruded through TSE. Table 7 presents the results of UTM testing (average of three observations) to investigate the various mechanical properties of wires made up of composite material by TSE. Based upon Table 7, Figure 7 shows stress–strain curves.
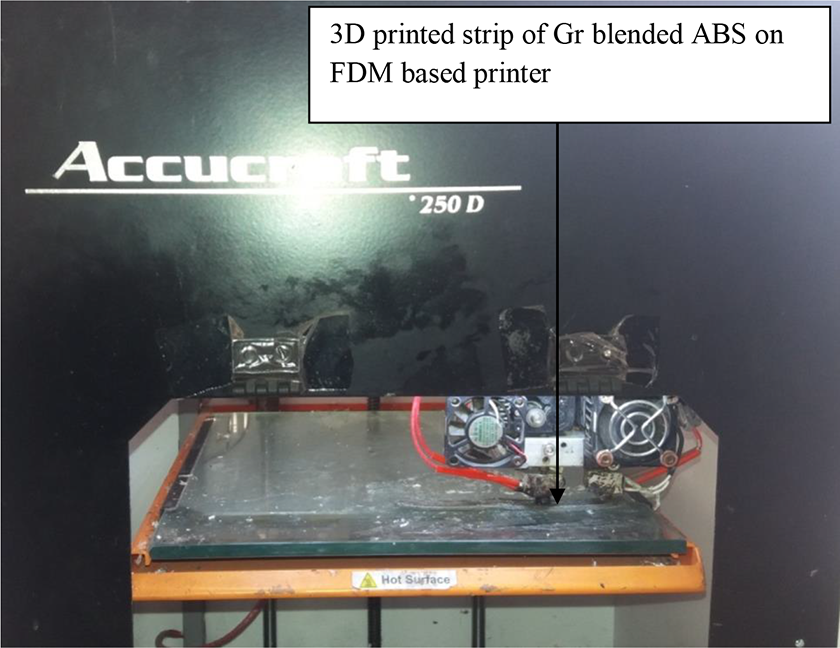
3D printing of Gr-blended 2°-recycled ABS composite prepared by TSE.
UTM results for TSE of Gr-reinforced 2°-recycled ABS.
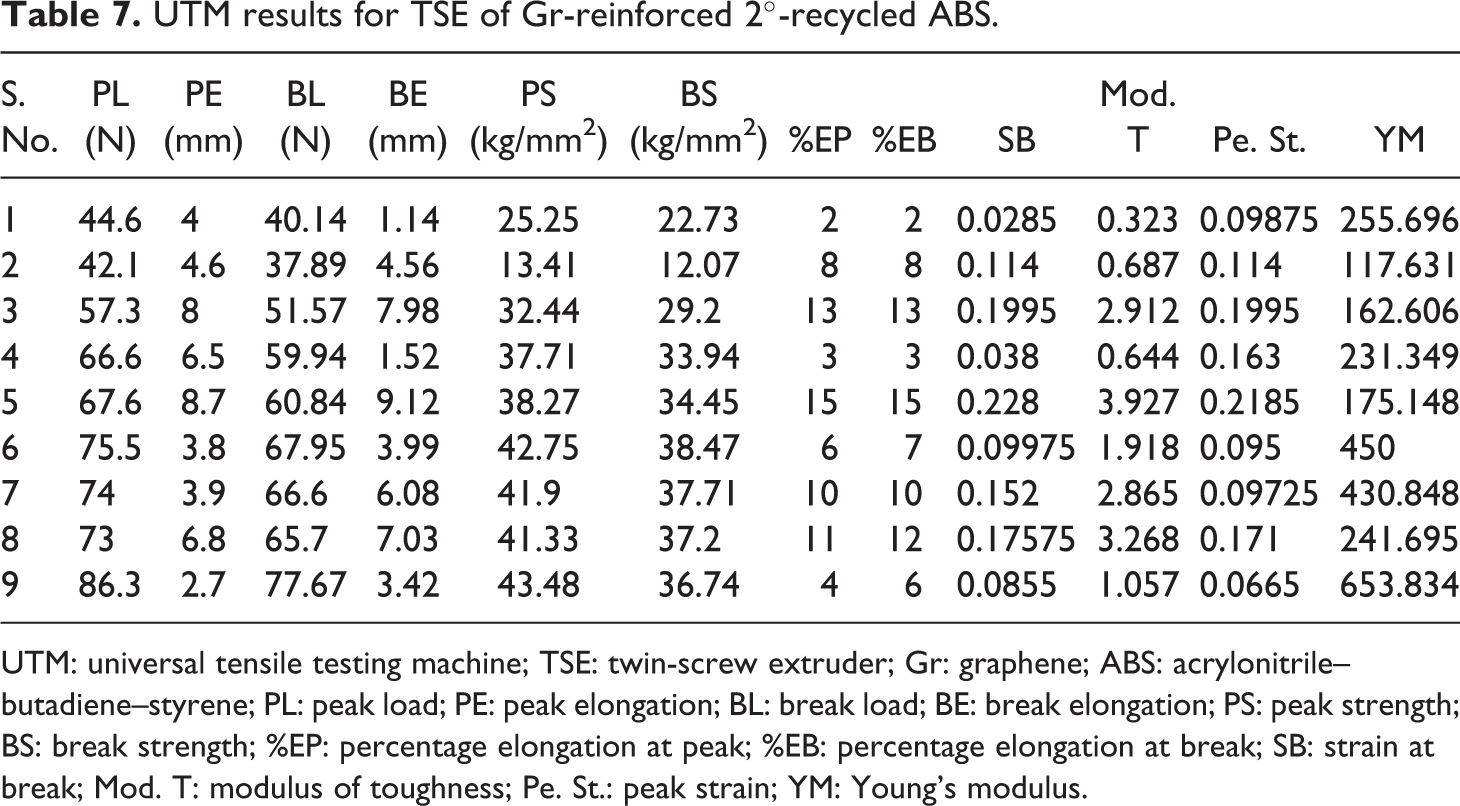
UTM: universal tensile testing machine; TSE: twin-screw extruder; Gr: graphene; ABS: acrylonitrile–butadiene–styrene; PL: peak load; PE: peak elongation; BL: break load; BE: break elongation; PS: peak strength; BS: break strength; %EP: percentage elongation at peak; %EB: percentage elongation at break; SB: strain at break; Mod. T: modulus of toughness; Pe. St.: peak strain; YM: Young’s modulus.
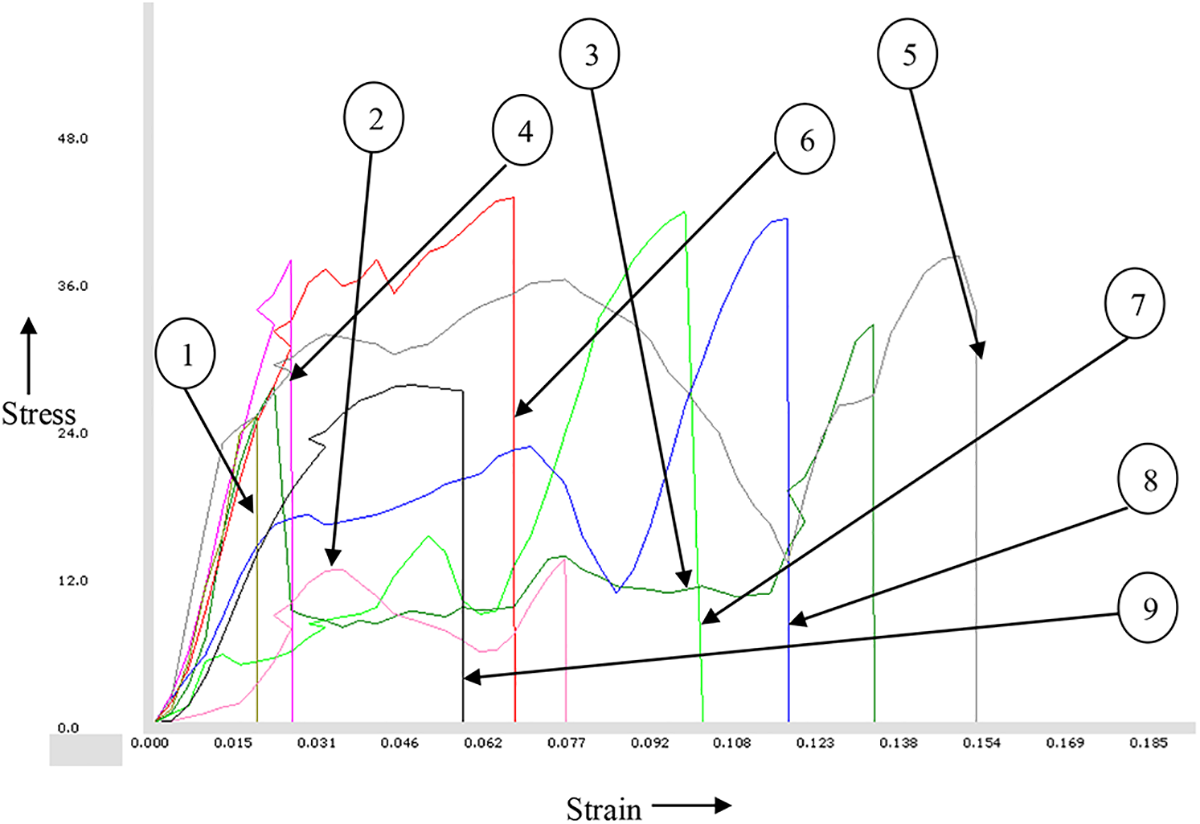
Stress–strain curves obtained by UTM.
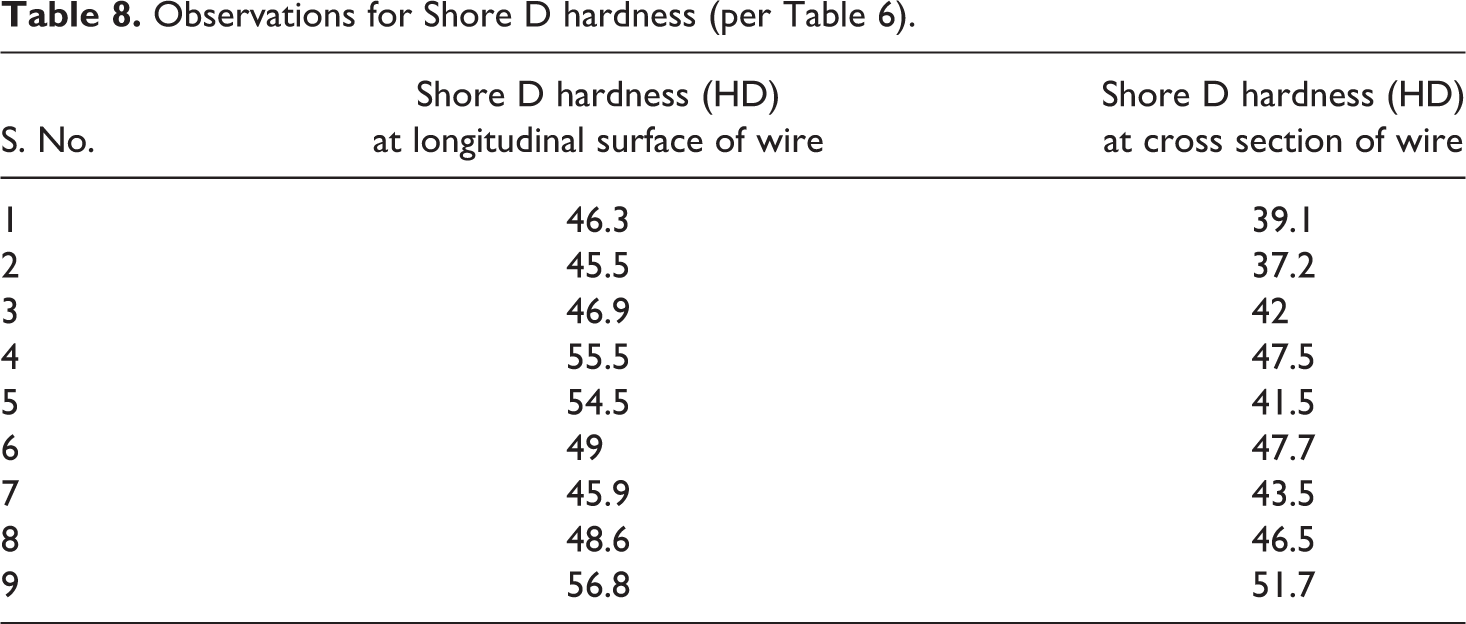
After performing tensile testing of the specimens, Shore D hardness at two different surfaces: first along the longitudinal surface of the wire and second along the cross sectional surface from where the specimen breaks during tensile test was checked for all the nine specimens (Figure 8). ASTM D2240 (ISO 868) standard was followed for Shore D hardness test. The hardness was recorded at three different locations for each wire sample, and the average value of hardness has been reported. Shore D durometer of range 0–100 HD was used for the experimental study. Shore D hardness values of TSE composite ABS wires at two surfaces, that is, along longitudinal surface and along the cross section are listed in Table 8.
Main effect plots for SNRA1.
Observations for Shore D hardness (per Table 6).
Results and discussion
Mechanical analysis
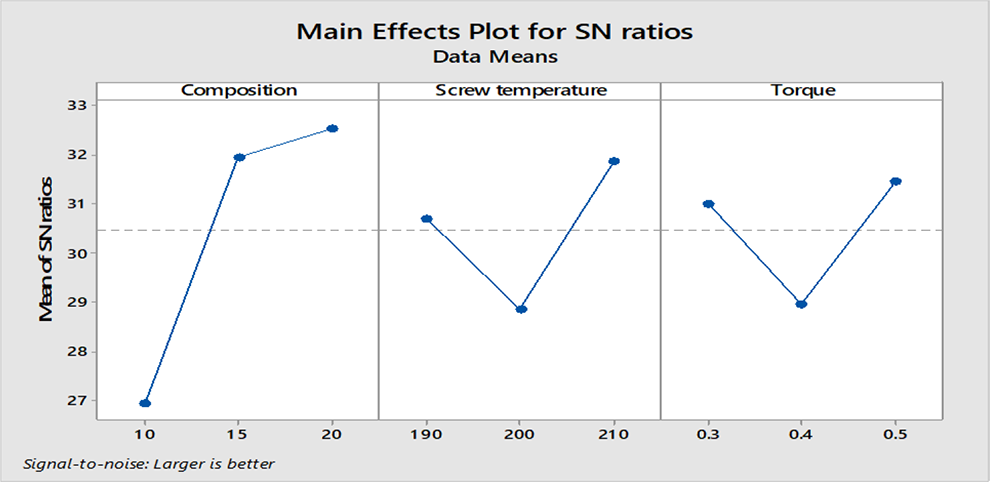
The peak strength (PS) obtained in UTM test showed significant variations in wire specimens (Table 7). These observations were used for the selection of best parametric conditions of TSE. The Minitab 17 software package was used for the analysis of experimental data for PS and Shore D hardness. Based upon Tables 7 and 8, Table 9 presents value of signal-to-noise (SN) ratio obtained for PS (SNRA1) and Shore D hardness (SNRA2) at the cross section (for larger the better type case). Based upon Table 9 and Figure 8, Table 10 and Table 11, respectively, show the mean effect plot for SNRA1, analysis of variance (ANOVA) for SNRA1, and ranking of input parameters for PS.
SN ratios obtained for each set of experiment.
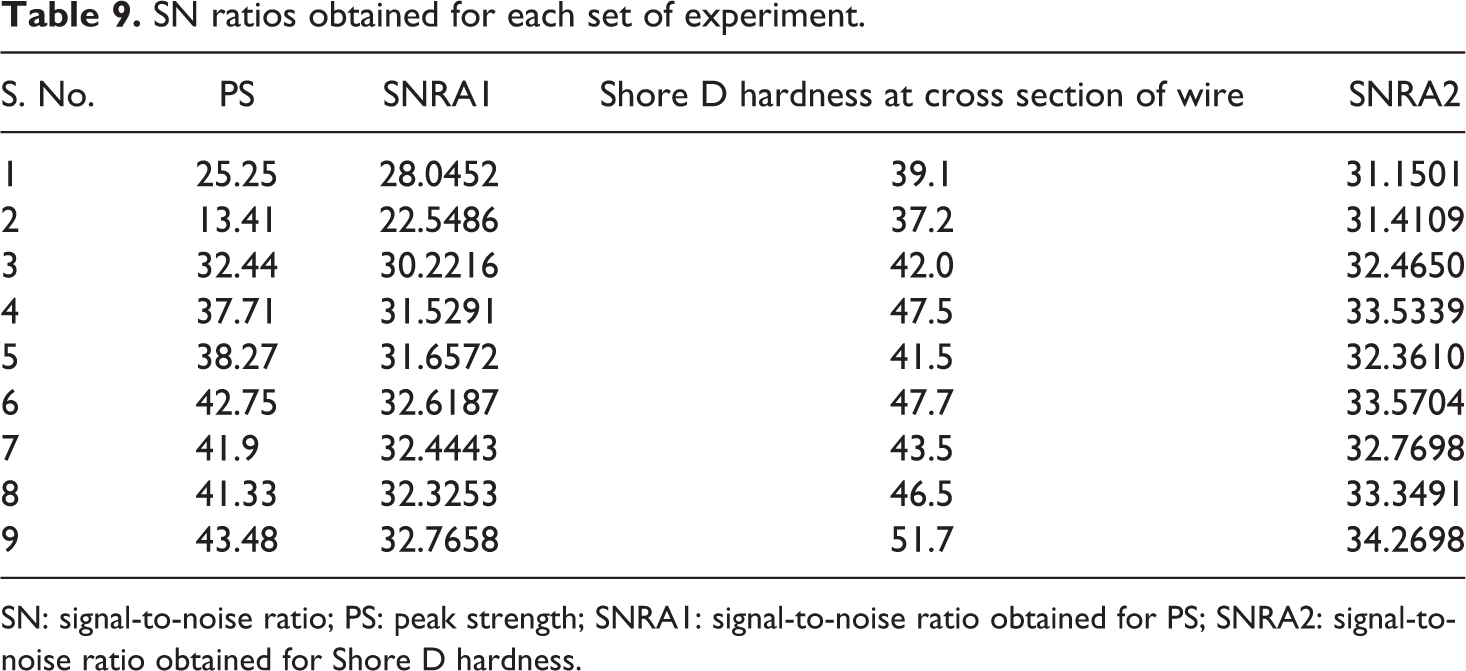
SN: signal-to-noise ratio; PS: peak strength; SNRA1: signal-to-noise ratio obtained for PS; SNRA2: signal-to-noise ratio obtained for Shore D hardness.
ANOVA for SNRA1.
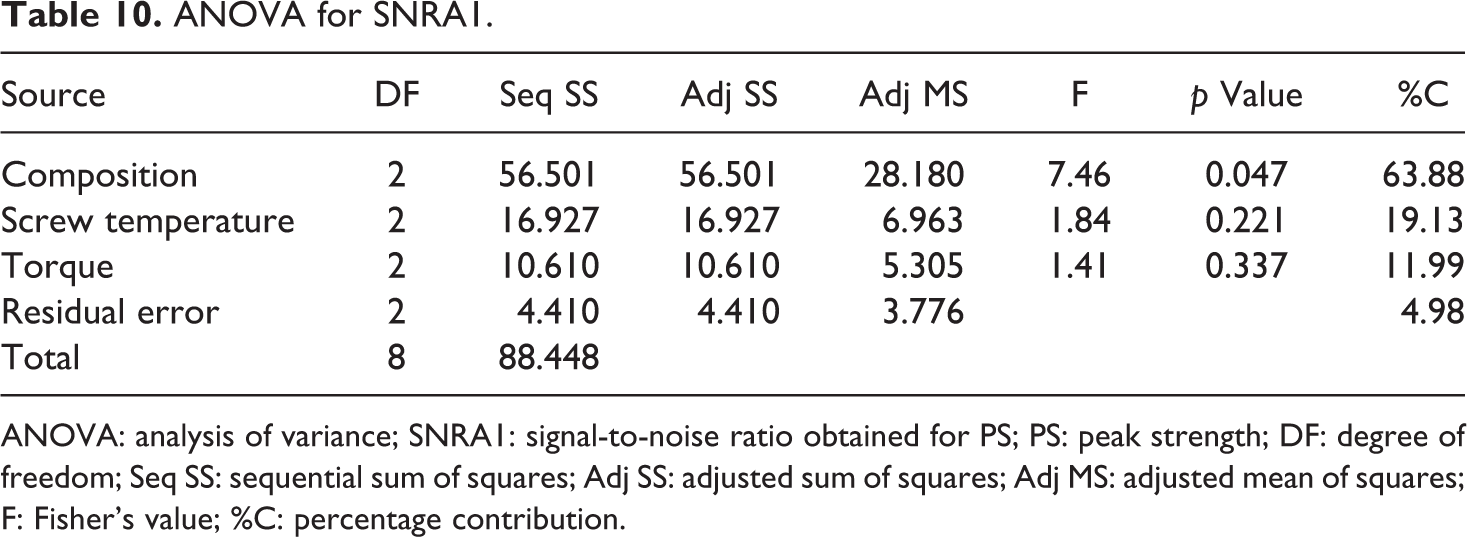
ANOVA: analysis of variance; SNRA1: signal-to-noise ratio obtained for PS; PS: peak strength; DF: degree of freedom; Seq SS: sequential sum of squares; Adj SS: adjusted sum of squares; Adj MS: adjusted mean of squares; F: Fisher’s value; %C: percentage contribution.
Rank table for SNRA1.
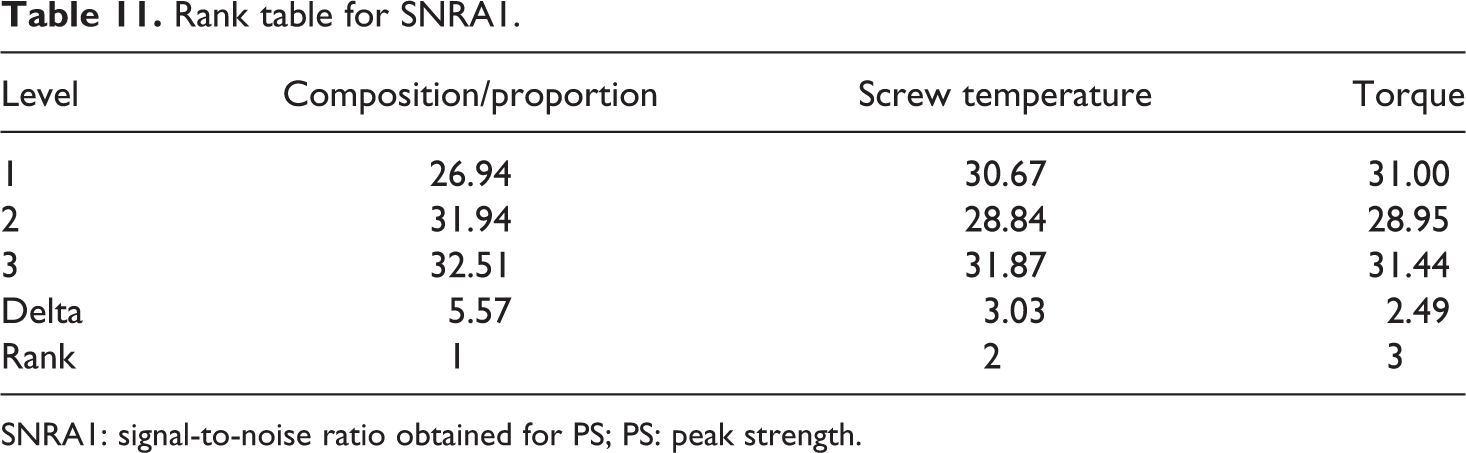
SNRA1: signal-to-noise ratio obtained for PS; PS: peak strength.
As observed from Figure 6, the composition ABS + 20% Gr, screw temperature of 210°C, and torque of 0.5 Nm are the best settings. These settings are but obvious as because higher composition/proportion of Gr in 2°-recycled ABS will give better PS further higher screw temperature and torque will give better/uniform dispersion of reinforcement in the thermoplastic matrix. Further as observed from Table 10, composition/proportion is only a significant factor as p < 0.05 at 95% confidence level. Also the value of residual error is less than 5%, thus confirming the suitability of the present macro model.
Prediction of PS
For prediction of PS, the following equation has been used:

where ηopt is the optimum value of PS and p is the SNRA1 mean for PS = 30.45 (Table 9). PA3 is the maximum value of composition/proportion = 32.51 (Table 11), PB1 is the maximum value of screw temperature = 31.87 (Table 11), and PC3 is the maximum value for torque = 31.44 (Table 11).
Now for larger is better case:
So

Now, for optimization
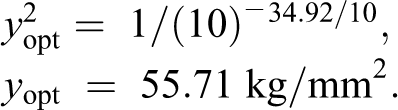
Hence, the predicted value of PS = 55.71 kg/mm2. The confirmatory experiment was conducted at ABS + 20% Gr at a screw temperature of 210°C and torque of 0.5 Nm, and the observed value is 51.3 kg/mm2.
Shore D hardness test
Similarly based upon Table 9 and Figure 9, Table 12 and Table 13, respectively, show the mean effect plot for SNRA2, ANOVA for SNRA2, and ranking of input parameters for Shore D hardness at cross section of wire.
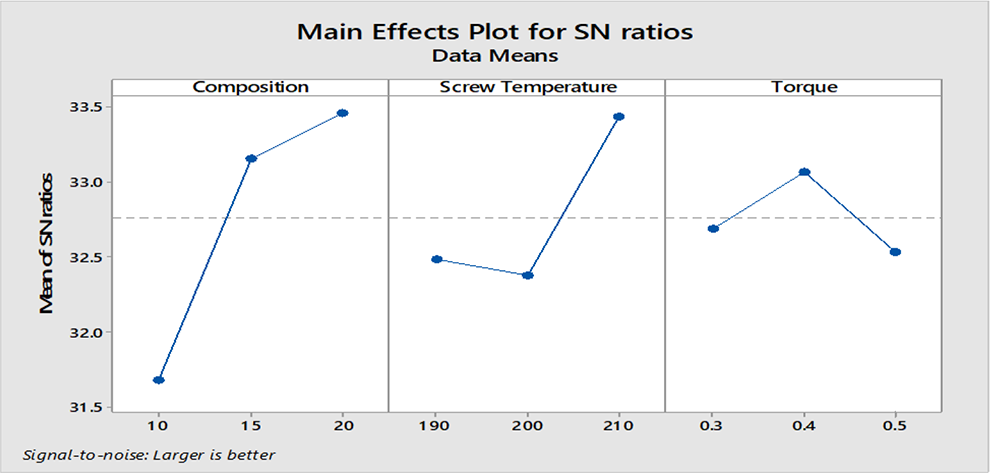
Mean effect plot for SNRA2.
ANOVA for SNRA2.
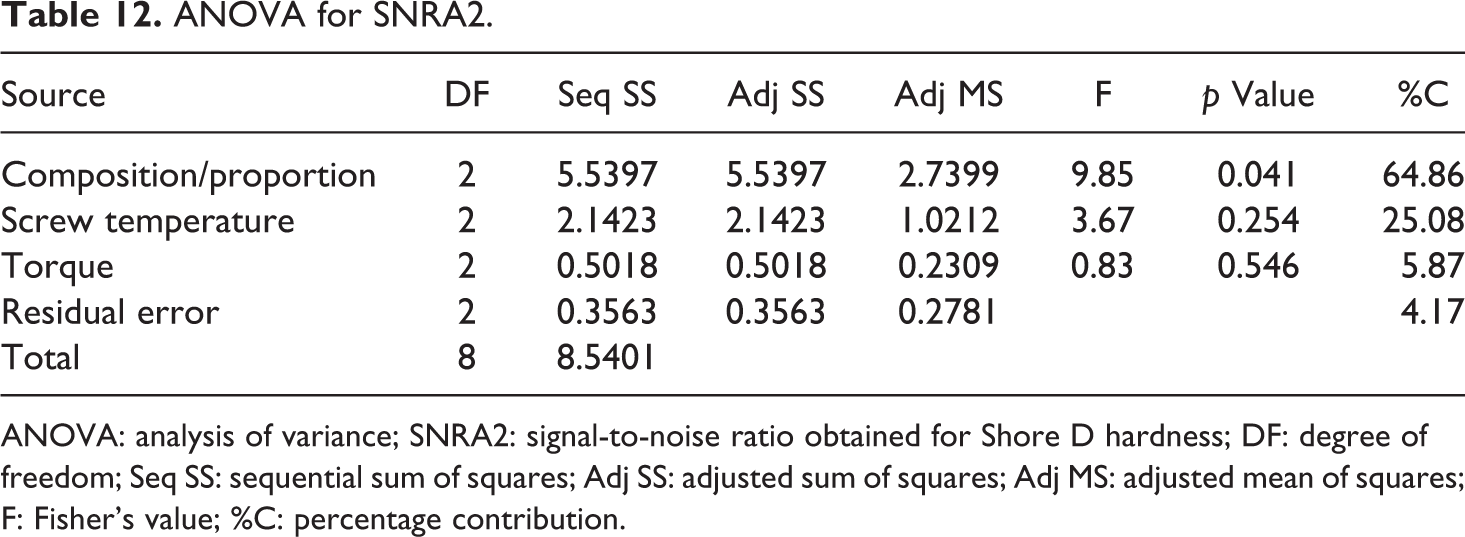
ANOVA: analysis of variance; SNRA2: signal-to-noise ratio obtained for Shore D hardness; DF: degree of freedom; Seq SS: sequential sum of squares; Adj SS: adjusted sum of squares; Adj MS: adjusted mean of squares; F: Fisher’s value; %C: percentage contribution.
Rank table for SNRA2.
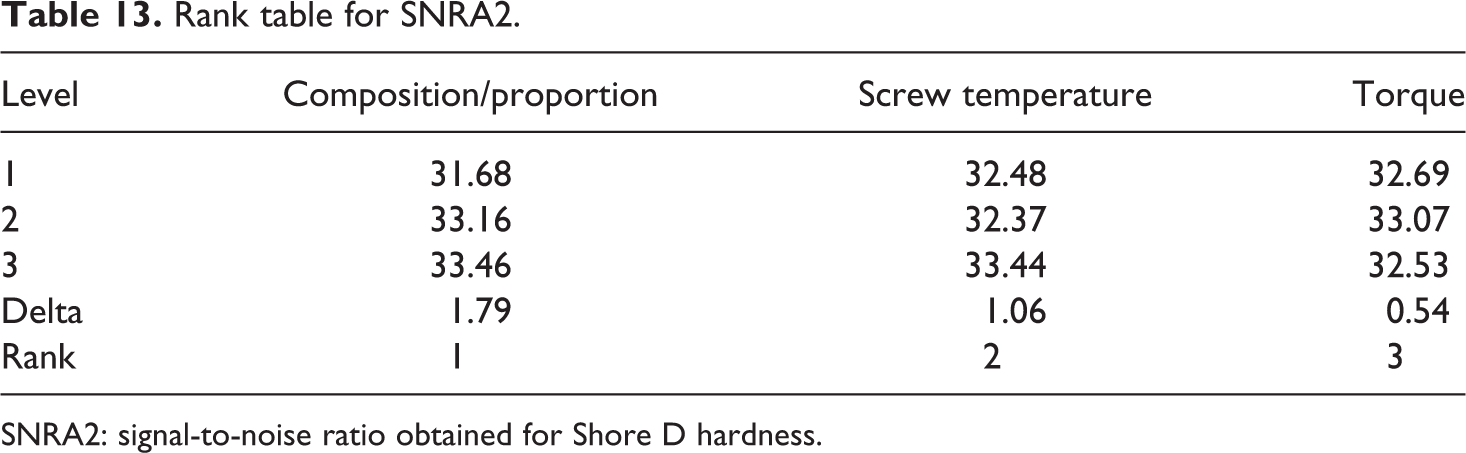
SNRA2: signal-to-noise ratio obtained for Shore D hardness.
As observed from Figure 9, the composition/proportion ABS + 20% Gr, screw temperature 210ºC, and torque 0.4 Nm are the best settings. Further as observed from Table 12, composition/proportion is only a significant factor as p < 0.05 at 95% confidence level. Also the value of residual error is less than 5%, thus confirming the suitability of the present macro model.
Prediction for Shore D hardness
The following formula has been used for the prediction of Shore D hardness:

where ηopt is the optimum value of hardness, H is the SNRA2 for hardness = 32.76 (Table 9). HA3 is the maximum value of composition = 33.46 (Table 13), HB1 is the maximum value of screw temperature = 33.44 (Table 13), and HC2 is the maximum value for torque = 33.07 (Table 13).
For larger is better case,
So

Now, for optimization
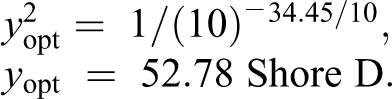
The predicted value of Shore D hardness is 52.78. The confirmatory experiment need not be conducted, as this setting already exists in Table 6, and the observed value is 51.7 (Table 9).
Morphological analysis
The optical-based images of samples have been captured at 100× magnification of the metallurgical microscope. The porosity of processed TSE wires was calculated (based on the images obtained from microscope) using QSMIAS 4.0 image analysis tool. The gray scale images at 100× magnification are shown in Figure 10 and Figure 11 for each set of parameter along the longitudinal axis and cross-sectional axis, respectively (Table 6). As observed from Figure 10, at the top surface along the longitudinal axis, uniform dispersion of Gr was noticed. However, along the cross-sectional surface significant variation in Gr reinforcement was noticed (Figure 11). Hence to ascertain the uniform dispersion of Gr in 2°-recycled ABS, porosity analysis was performed according to ASTM B276 (Figure 12). As observed from Figure 12, minimum and maximum porosity were observed in case of sample prepared at S. No. 9 and S. No. 2, respectively (Table 6). Further to ascertain the uniform dispersion scanning electron microscopy and energy-dispersive spectroscopy analyses were performed (Figure 13(a) and (b)). As observed from Figure 11(a), the sample with poor mechanical properties showed setting of Gr particles on the outer surface only, whereas the sample prepared at S. No. 9 gave better results due to uniform blending of Gr in 2° ABS matrix (Figure 13(b)).
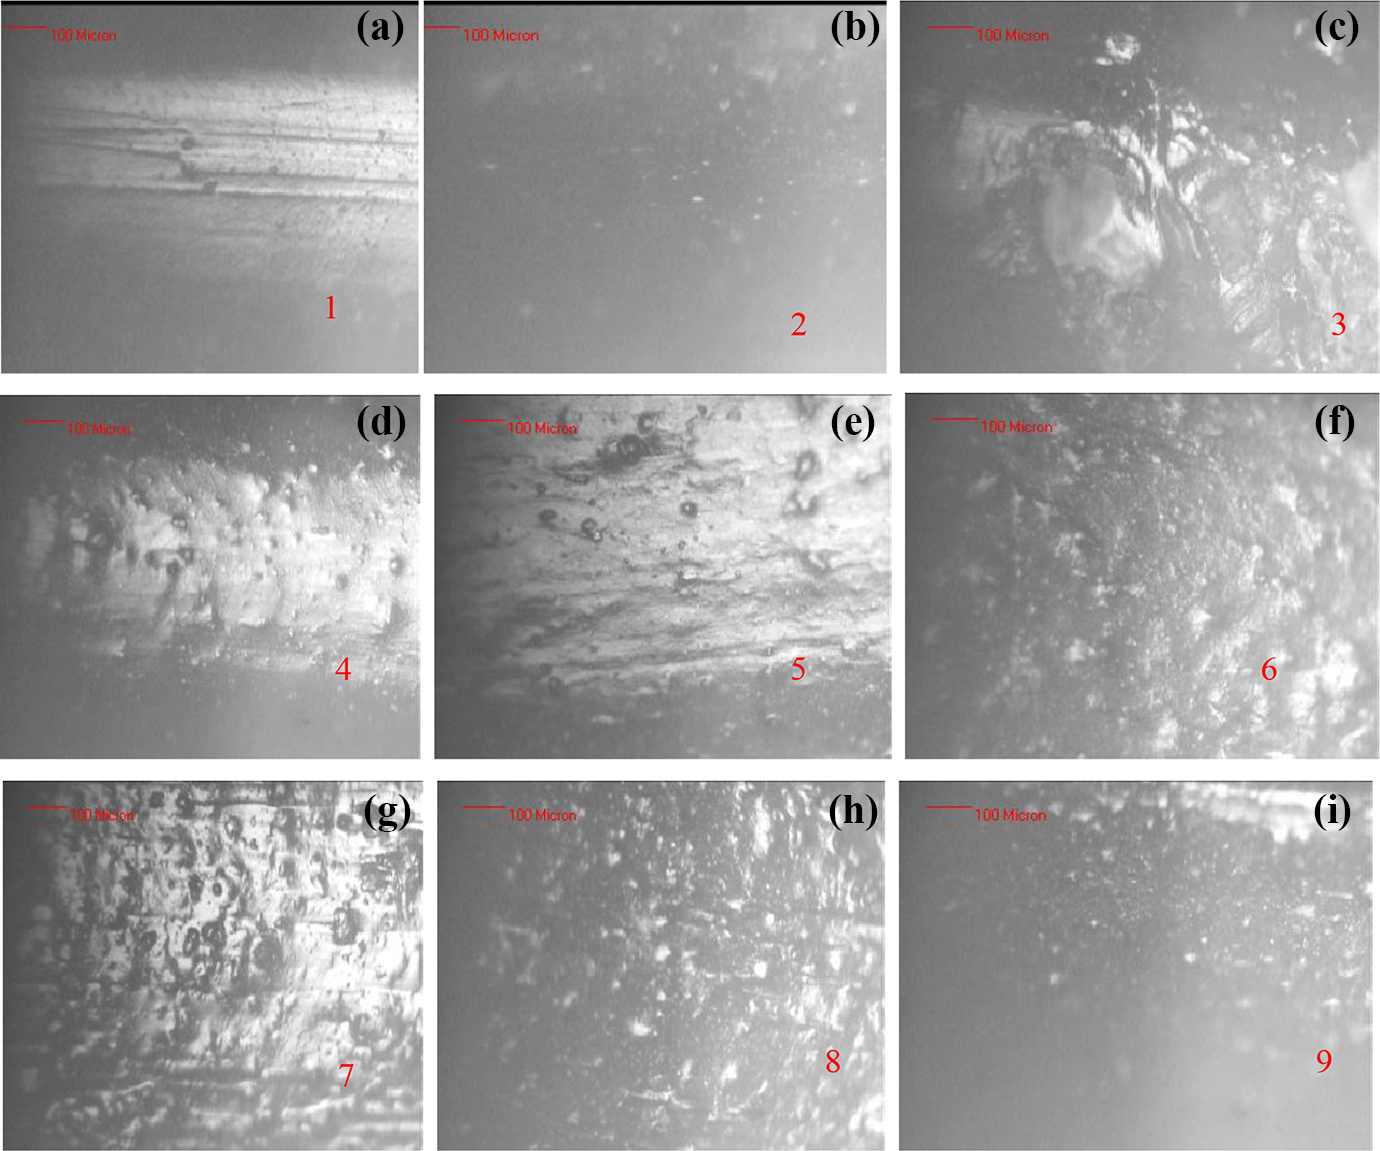
(a to f) Optical photomicrographs along longitudinal surface.
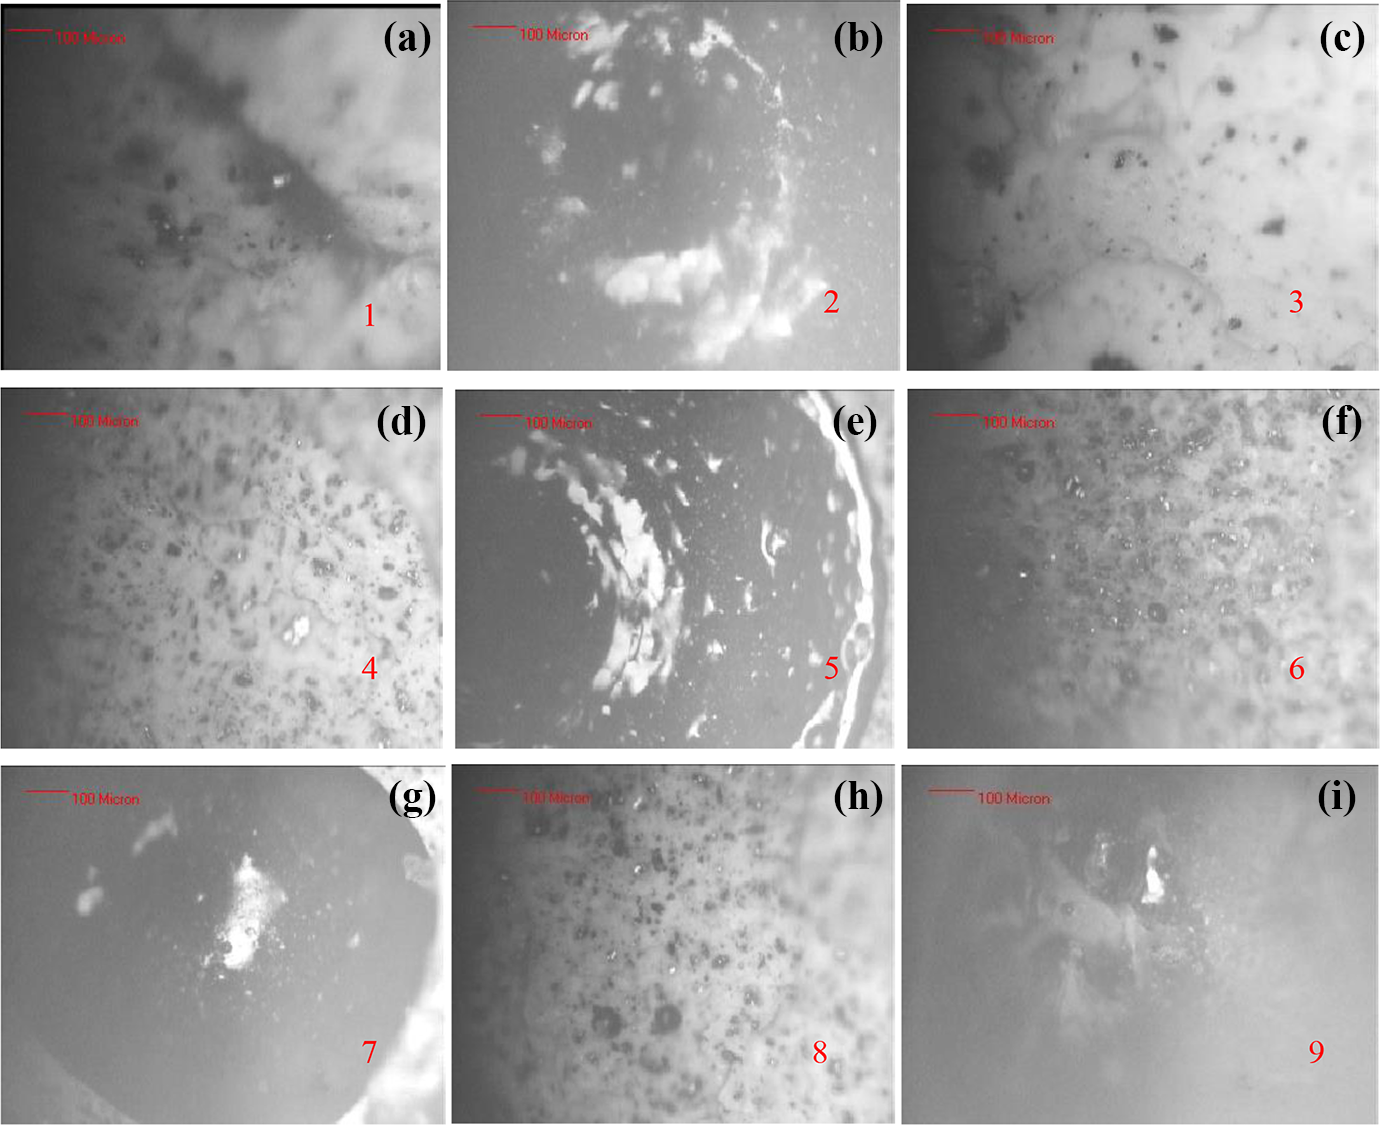
(a to i) Optical photomicrographs at cross sectional surface.
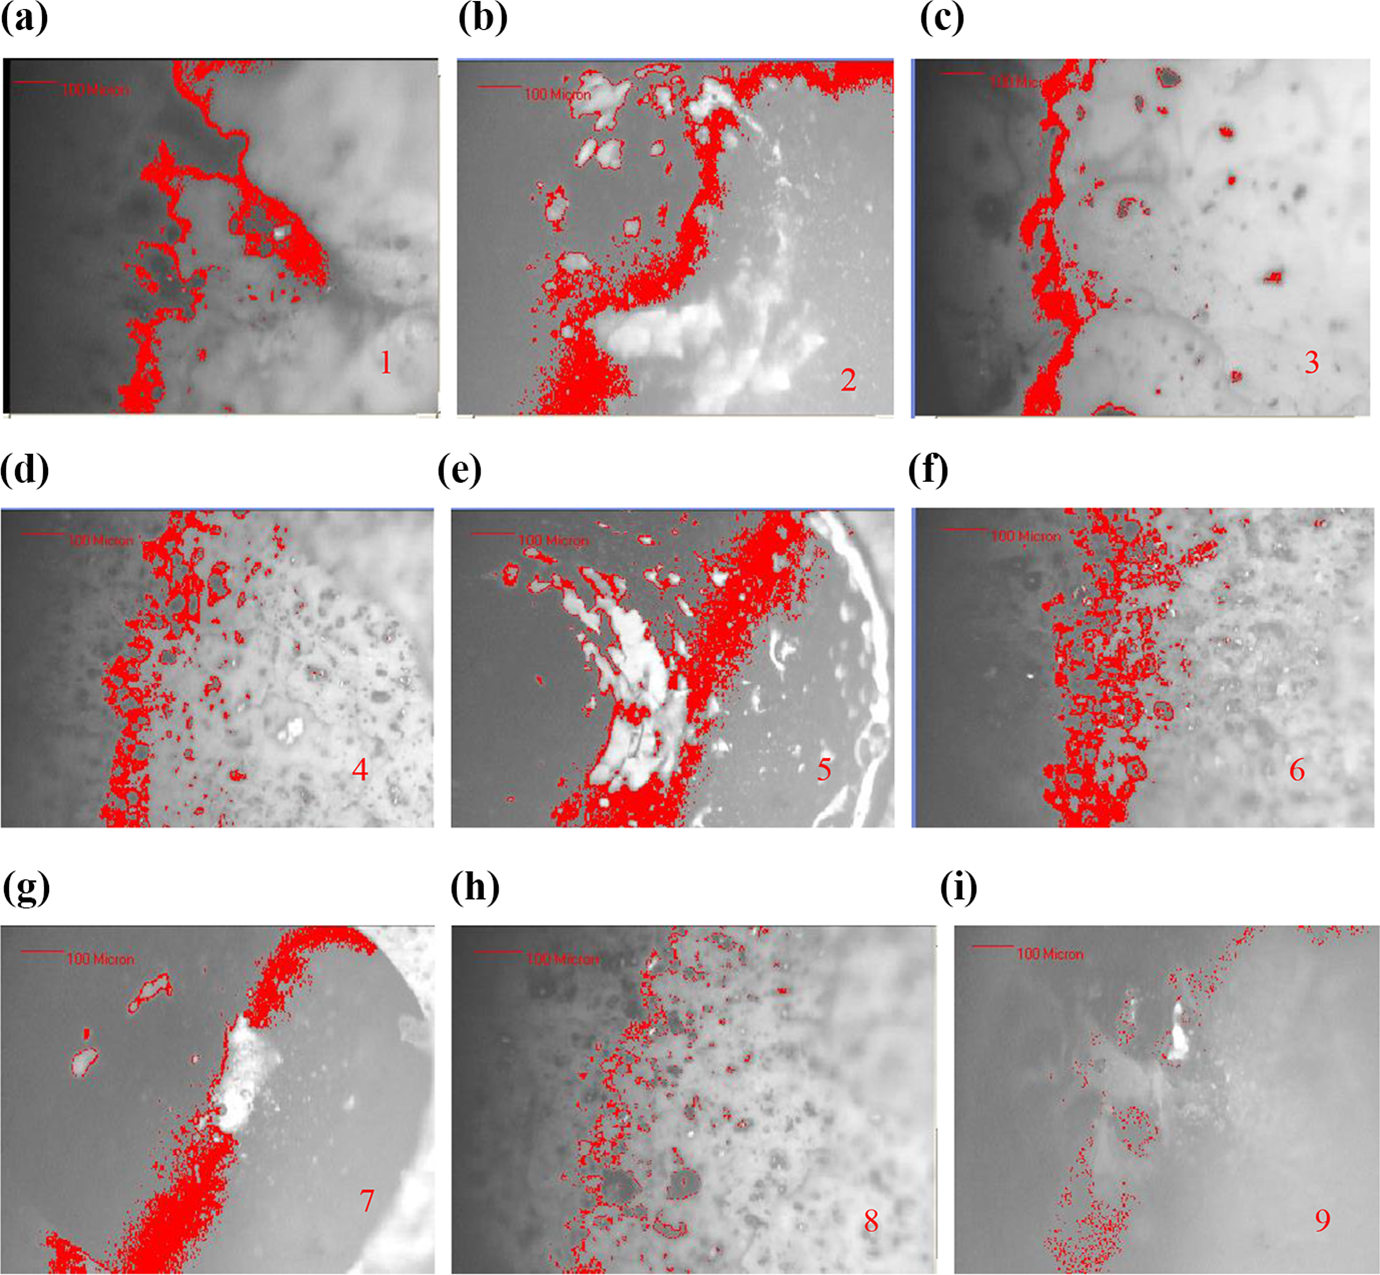
Porosity percentage in Gr reinforced 2°-recycled ABS: (a) porosity % = 10.55, (b) porosity % = 14.9, (c) porosity % = 12.72, (d) porosity % = 9.74, (e) porosity % = 8.17, (f) porosity % = 8.01, (g) porosity % = 5.84, (h) porosity % = 2.43, and (i) porosity % = 1.37.
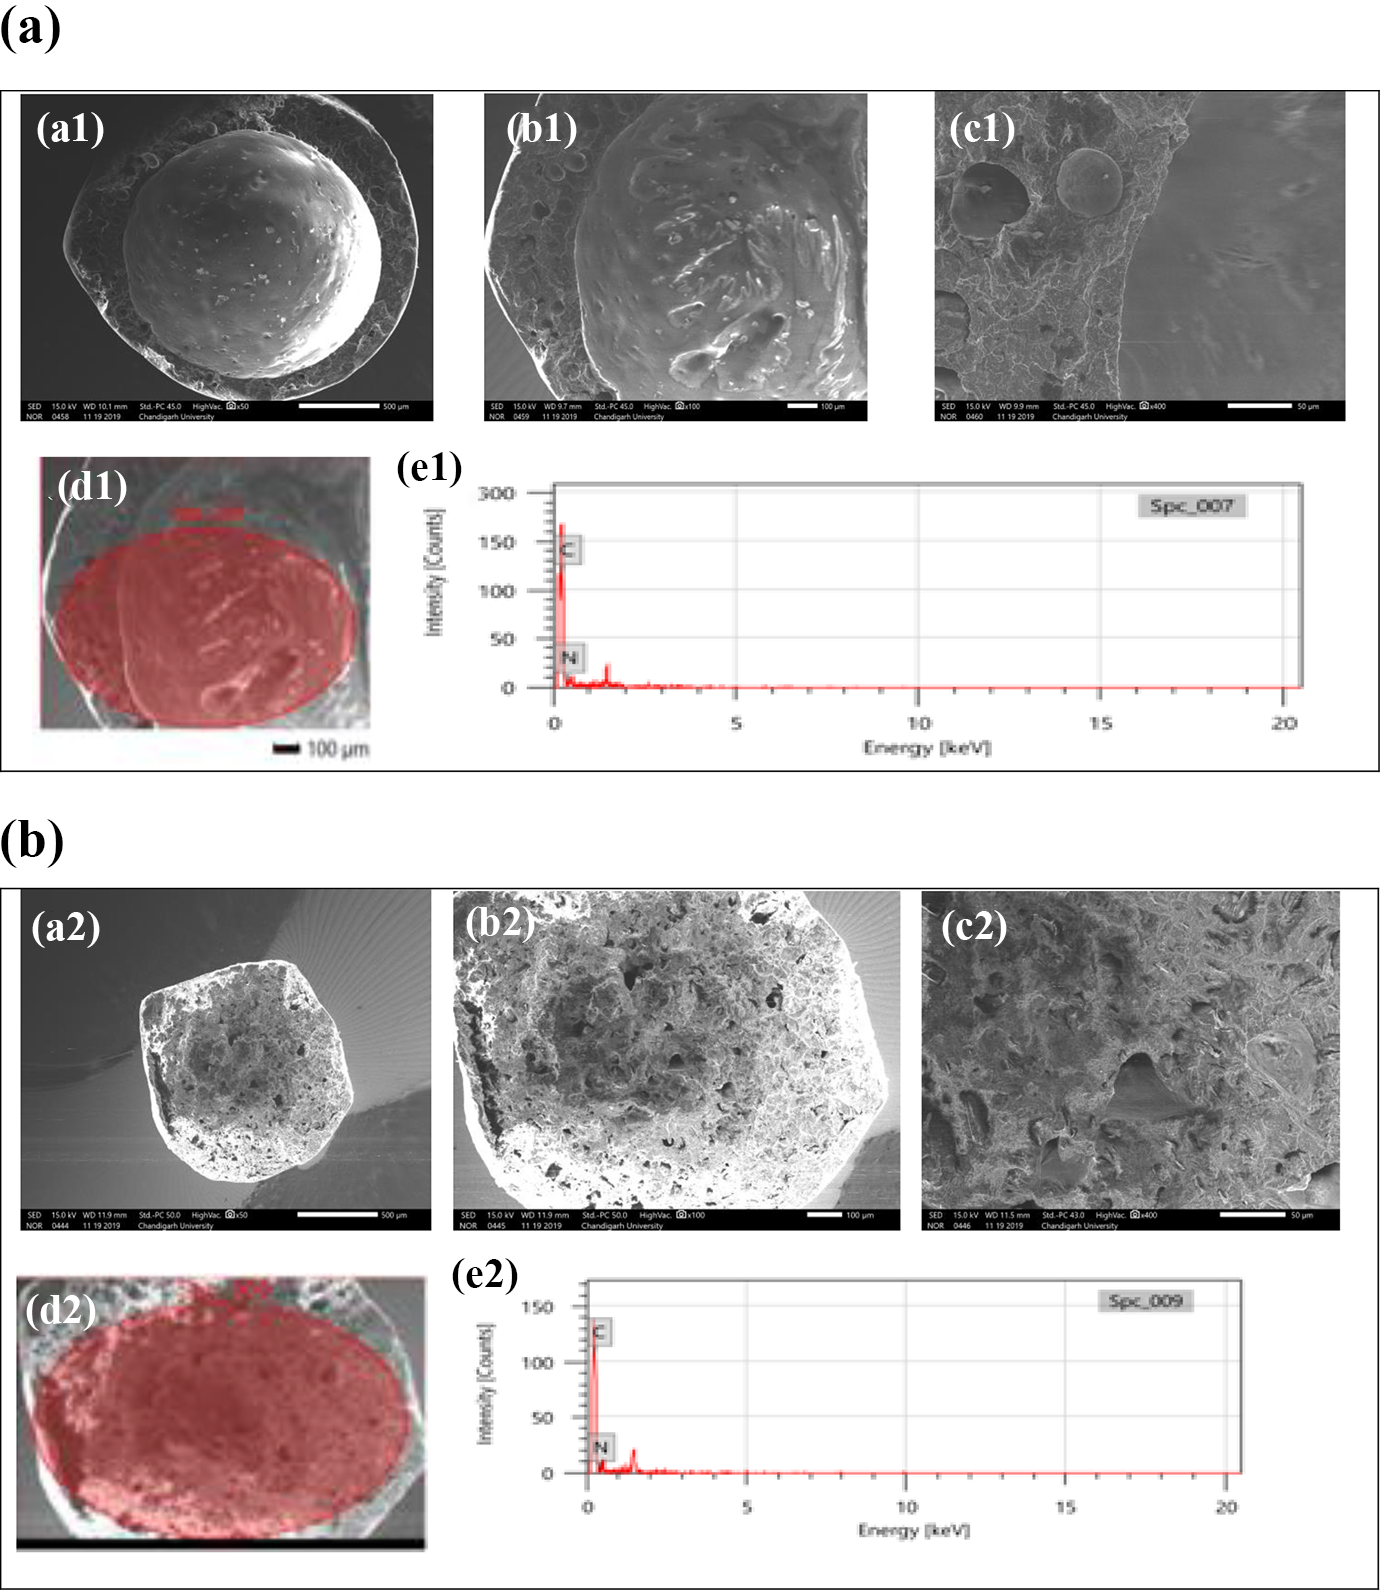
(a) SEM images for sample at S. No. 2 at (a1) ×50, (b1) ×100, (c1) ×400, and (d1) portion of image on which EDS performed. (e1) Elements present as per EDS image (d1). (b) SEM images for sample at S. No. 9 at (a2) ×50, (b2) ×100, (c2) ×400, and (d2) portion of image on which EDS performed. (e2) Elements present as per EDS image (d2).
Conclusions
The following conclusions may be drawn from the present investigations: The 2° recycled ABS shows improvement in melt flow index up to a limited extent (10% by weight in present case) on addition or reinforcement of Gr nanoparticles in it. The reinforcement resulted into formation of a composite material that possesses good thermal, magnetic, and mechanical properties. The improvement in thermal properties outlined that Gr reinforcement in 2°-recycled ABS contributed toward better heat capacity of the material. The Gr reinforced 2°-recycled ABS can be magnetized with respectable coercivity and retentivity, hence the prepared composite can impart smart behavior (with magnetic field as stimuli). The mechanical properties like PS, break strength, strain, and Young’s modulus of toughness of Gr-reinforced 2° ABS are dependent on the quality of wire obtained at specific set of composition/proportion, temperature, and r/min of screws used/torque applied for prepared wire samples. The results of the study suggest that as regards to mechanical properties (PS and Shore D hardness) are concerned, the best settings are 20 wt% Gr reinforcement in ABS at a screw temperature of 210°C and with torque of 0.4 Nm. The corresponding heat capacity and magnetization for the selected composition/proportion was observed as 0.77 J/g and 0.10 × 10⁻⁵ emu (+magnetization) and 0.080 × 10⁻⁵ emu (−magnetization), respectively. The optical photomicrographs along the longitudinal surface and along the cross section outlined that nano-sized Gr particles got settled/reinforced in the ABS polymer matrix uniformly due to which good mechanical properties were obtained. In the present study, the selected composition of Gr-reinforced ABS feedstock filament was used successfully on the available FDM setup, and the investigations were made for optimization of PS and Shore D hardness. Further studies may be focused on optimizing other properties such as surface finish, brittle behavior, and flexibility for different applications.
Footnotes
Acknowledgements
The authors are grateful to Manufacturing Research Lab, Department of Production Engineering, Guru Nanak Dev Engineering College, Ludhiana, Punjab, India, and Department of Mechanical Engineering, Punjabi University, Patiala, Punjab, India, for providing support continuously and lab facilities available in the respective departments.
Funding
The author(s) disclosed receipt of the following financial support for the research, authorship, and/or publication of this article: This work was supported by the Department of Science and Technology (DST, Government of India), file no. DST/TDT/SHRI-35/2018.