
Abstract
In this work, the physicochemical and rheological properties of a nanocomposite of graphene oxide (GO) and thermoplastic polyvinyl alcohol (PVA) are reported. After adding deionized water to PVA, the sample was heated and mixed. The polymer solution was divided in two portions, each of them containing PVA in water. GO nanoribbons were added to one portion of the PVA solution in water to obtain the nanocomposite suspension (1% w/w). The similarity of the Fourier-transform infrared spectra of PVA and its related nanocomposite was assessed (both having similar peaks, an important observation as it indicated the water absorption on the samples). The scanning electron microscopy images showed that PVA lost its spherical shape in composites due to the GO sheets coating. The characteristic peaks O− (m/e 16) and OH− (m/e 17) were observed in the time-of-flight secondary ion mass spectrometry negative mode spectra of PVA and nanocomposite of GO nanoribbons with PVA. The analysis of the OH−, O−, C2H−, and C2− peaks of PVA and the nanocomposite of GO nanoribbons revealed that a reduction occurred for GO nanoribbons when coated with PVA. The rheological behaviors of samples in solution were studied and their shear rate versus shear stress were assessed. A non-Newtonian rheological behavior of the nanocomposite of GO nanoribbons with PVA was observed. The dielectric response of the nanocomposite of GO-PVA featured a simultaneous increase of both real and imaginary part of the complex permittivity toward low frequency due to the contribution of charge carriers. These results provide more understanding about the physical, mechanical, and dielectric properties of GO-PVA nanocomposite to make it appropriate in the construction of embedded capacitors. The novelty of our work lies in the rheological and physical properties of this nanocomposite in comparison with those of PVA that have not been previously reported.
Keywords
Introduction
Polymer nanocomposites have been considerably used during recent decades because of their interesting physicochemical, mechanical, and electrical properties.1–4 The carbon-based nanomaterials such as carbon nanotubes, graphite nanoplatelets, and graphene oxide (GO) nanoribbons have been used with diverse polymers for the preparation of nanocomposites.5–8 Adding nanostructures into the polymers is a well-researched technology.9–12 Conventional micron-scale fillers such as glass or carbon fibers have also been used in order to enhance the properties of nanocomposites with lower loadings than for commonly used polymer composites. 13
GO nanoribbons are oxygenated graphene sheets with much lower van der Waals interactions among them than graphene sheets. 14 They have a two-dimensional structure consisting of covalently bonded carbon atoms with various oxygen functional groups such as hydroxyl, epoxy, and carbonyl groups on their basal planes and edges. Because of these functional groups, GO nanoribbons are hydrophilic and disperse easily in water. 7 The presence of these groups on these nanomaterials facilitates their hydrogen bonding interaction with polymers.11,15–17 The expanded interlayer spacing of GO depends on humidity, which corresponds to intercalation of water molecules. 18 The exfoliation of GO can be carried out using thermal shocking 19 or chemical reduction, 20 which yields a material with similar structure to that of pristine graphene.
GO is generally produced using various methods previously described by Staudenmaier 21 and Hummers and Offeman 22 in which graphite is oxidized using strong oxidants such as KMnO4, KClO3, and NaNO2 in the presence of nitric acid or its mixture with sulfuric acid. Researchers achieved similar levels of oxidation (C:O ratios of approximately 2:1) using these reactions.23,24 GO nanoribbons can also be synthesized using an oxidative unzipping of multi-walled carbon nanotubes. 25
The preparation of nanocomposites with GO can be achieved by its non-covalent dispersion into polymers,26,27 non-covalent in situ polymerization,28–30 covalent bonds between matrix and filler,31,32 or other methods such as non-covalent grafting of polymers to reduced GO platelets, 33 solid-state shear pulverization, 34 layer-by-layer assembly of polymer composite films, 17 backfilling of GO platelets with polymers, 35 and freeze-drying of GO platelets with polymers. 36 The incorporation of GO nanoribbons to polymers can improve the thermal and electrical properties of polymers.16,17,37–39
Polyvinyl alcohol (PVA) is a hydrophilic polymer with hydrated molecules when dissolved in water. 40 It has been widely used for drug delivery systems, wound dressing, and other medical prosthetics because of its biocompatible properties.41–44 A study showed that the diffusion of “small” molecules or ions through the solutions of this polymer was not affected by the presence of “large” polymer molecules. 40
Liang et al. 45 prepared a solution of nanocomposites made of GO nanoribbons with PVA with improved mechanical properties due to the molecular-level dispersion of GO. Another study showed that the same functional groups on the surface of GO and polymer matrix enhance the dispersion of GO in PVA. 46
In this article, the nanocomposite of GO nanoribbons with thermoplastic PVA was prepared and its colloidal stability has been determined. To our knowledge, this is the first time that the surface physical, rheological, and dielectric properties of a GO-PVA nanocomposite are investigated.
Materials and methods
Chemicals
GO nanoribbons in solution with large surface area and high chemical stability and PVA in powder form with molecular weight of 22,000 were purchased from Goographene (Merrifield, Virginia, United States) and Fisher Scientific (Ottawa, Ontario, Canada), respectively.
Nanocomposite preparation
PVA (0.4 g) was dissolved in 10 mL of deionized water (18.2 MΩ cm−1), mixed and heated at 90°C during 2 h. Then, the temperature was increased to 140°C for promoting the dissolution reaction and the solution was mixed during 4 h. The deionized water was added in order to adjust the volume of the heated solution. The polymer solution was divided in two portions, each of them containing 0.2 g of PVA in 5 mL of water. GO nanoribbons (2 mg) were added to one portion of the PVA solution in water to obtain the nanocomposite suspension (1% w/w). Then, it was mixed during 15 min. The other portion of the solution of PVA was kept for the analysis of the polymer.
Fourier-transform infrared spectroscopy
Using a PerkinElmer spectrum 65 Fourier-transform infrared (FTIR) spectrometer in the attenuated total absorbance probe mode in the range of 600–4000 cm−1, FTIR spectra at 4 cm−1 of resolution were recorded. Thirty-two scans were co-added to improve S/N.47–49
Scanning electron microscopy imaging
A JEOL JSM-7600TFE scanning electron microscope (SEM) was used to obtain photomicrographs of samples and images were obtained at 1 kV accelerating voltages. 50 The samples of PVA and nanocomposite of GO nanoribbons and polymer dissolved in deionized water were dried at room temperature on copper substrates. Then, they were coated with a thin layer of gold in order to reduce the charge effect.
Time-of-flight secondary ion mass spectrometry
Positive and negative ion spectra were obtained as in our previous work with an ION-TOF IV time-of-flight secondary ion mass spectrometer (TOF-SIMS) using a 15 kV Bi+ primary ion source. 50
Rheological measurements
The rheological behaviors of PVA and the nanocomposite of GO nanoribbons with PVA were studied using an Anton Paar MCR-502 rheometer. 50 About 4 mL of each sample was used for rheology. Rotational mode was used for both samples.
Dielectric properties measurements
Broadband dielectric spectroscopy (BDS) was carried out using a Novocontrol Alpha-N dielectric analyzer. The samples were deposited on circular aluminum electrodes measuring 30 mm in diameter. The average of the measured data over five points were registered in the range from 0.01 Hz to 3 × 10⁵ Hz. 50
Results and discussion
Nanocomposite preparation
The stability of PVA and nanocomposite of GO nanoribbons with the polymer concerning their dispersion in water was the same. Both samples were permanently dispersive and stable in water.
FTIR analysis of the nanocomposite
Figure 1 shows the FTIR spectra of the nanocomposite of GO nanoribbons with PVA and the polymer alone. A sharp peak at 1650 cm−1 and a broader one at 3500 cm−1 were observed in the spectrum of the nanocomposite (Figure 1(a)). These vibrations are assigned to the C=O and O–H bonds, respectively. 51 The same peaks were observed in the spectrum of the neat PVA (Figure 1(b)).
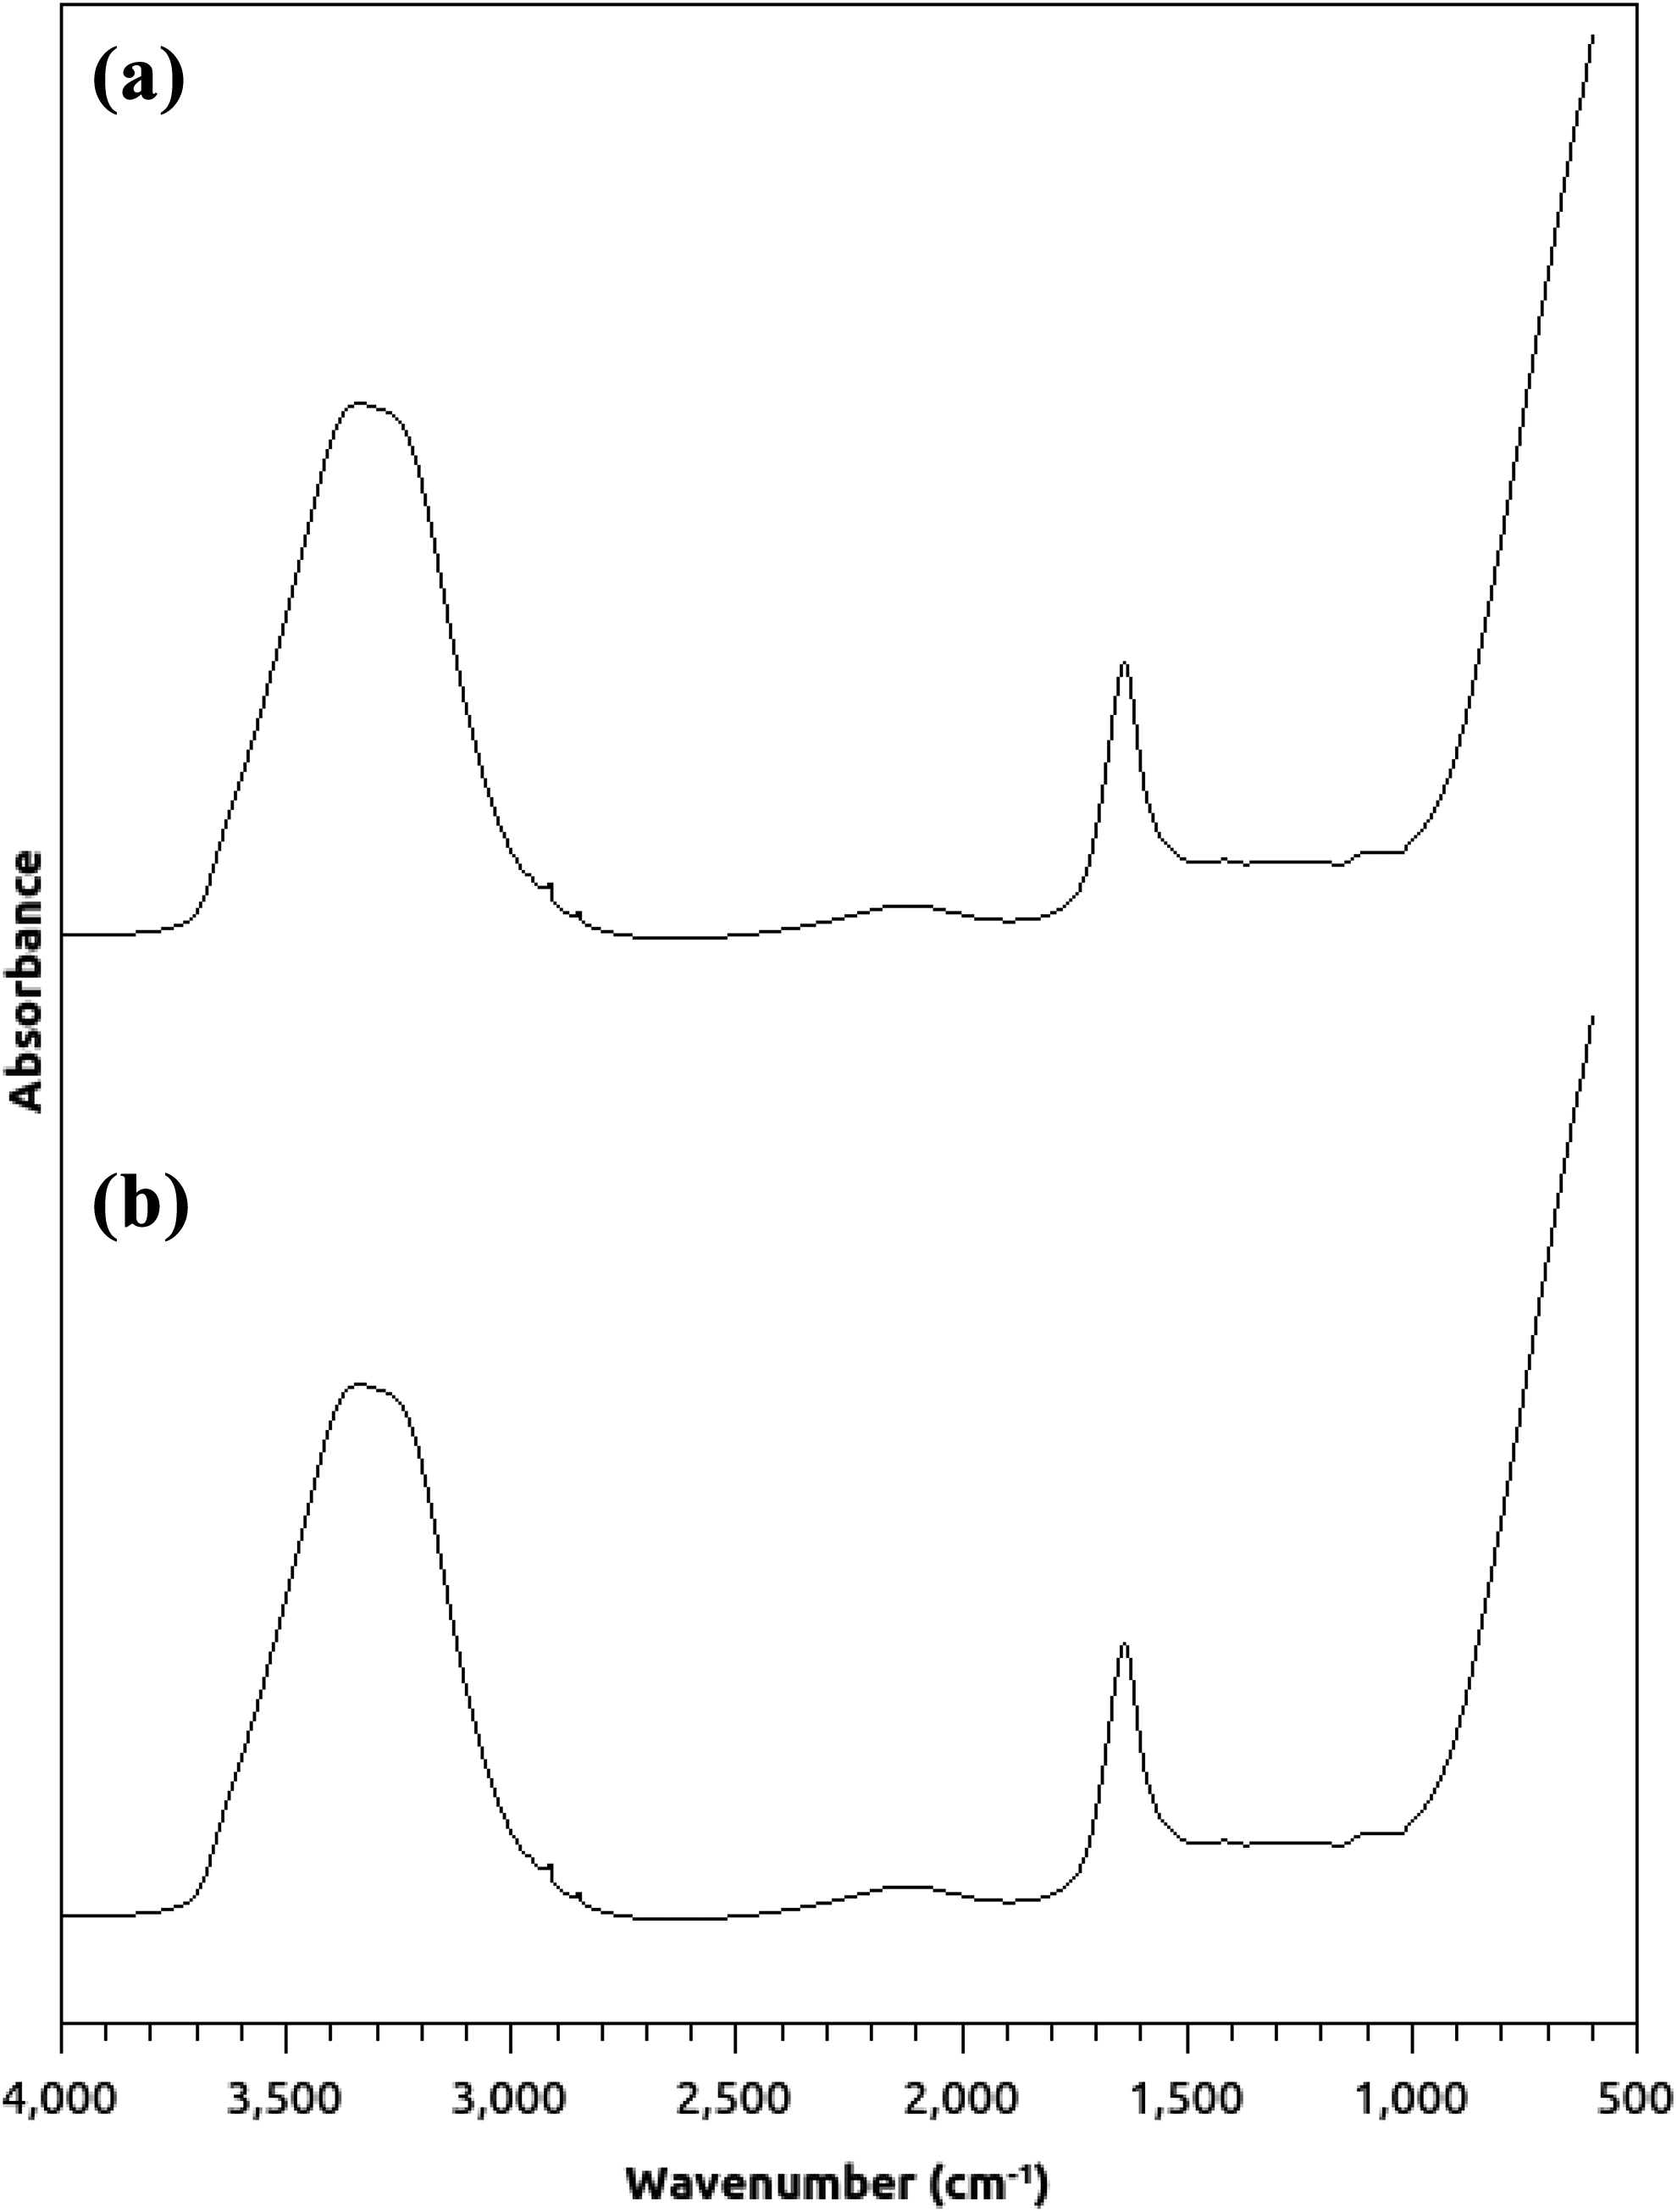
FTIR spectra of (a) the nanocomposite of GO nanoribbons with PVA and (b) PVA.
As seen in Figure 1, the same peaks with the same intensities were observed in both spectra, which indicates the water absorption on the samples. 52
SEM imaging
Figure 2 shows the SEM image of PVA (Figure 2(a)) and the nanocomposite of GO nanoribbons with PVA (Figure 2(b)). The average size of the PVA particles was 0.27 µm. When the polymer was mixed with the GO nanoribbons, it lost its spherical shape due to the coating with the GO sheets. This is because GO nanoribbons have planar structure and the assembly of their sheets is added to the chains of PVA in the nanocomposite.
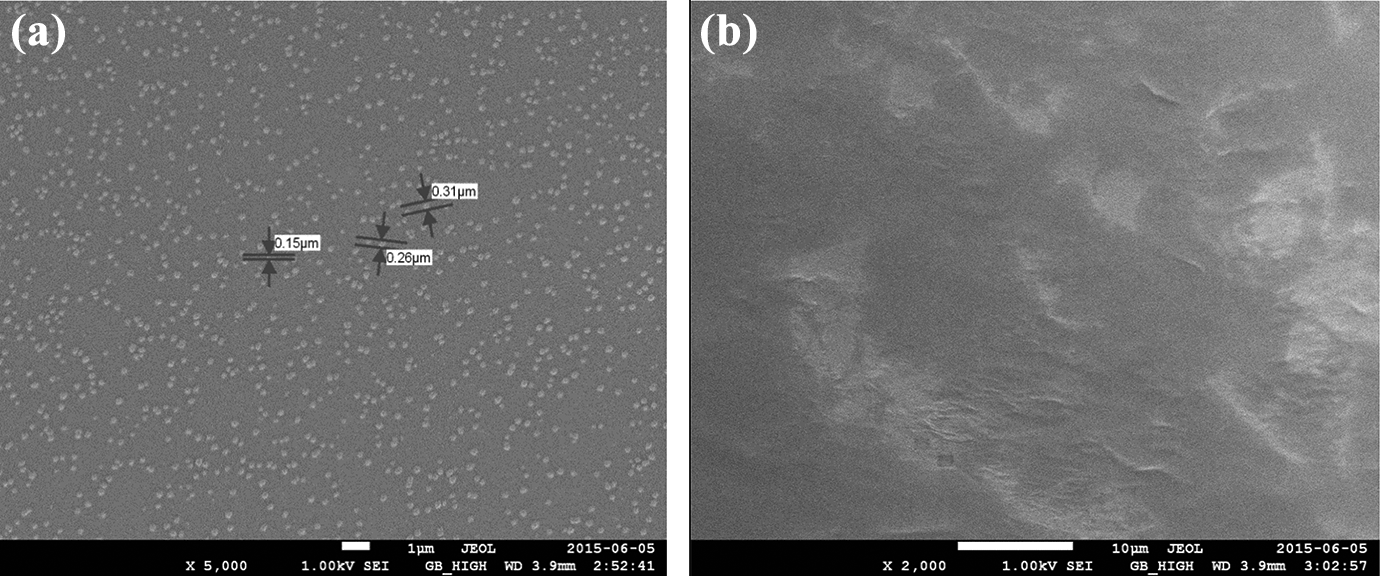
SEM image of (a) PVA and (b) the nanocomposite of GO nanoribbons with PVA.
TOF-SIMS analysis of nanocomposites
Figure 3 shows the positive and negative modes TOF-SIMS spectra of PVA (Figure 3(a) and (b)) and that of the nanocomposite of GO nanoribbons with PVA (Figure 3(c) and (d)).
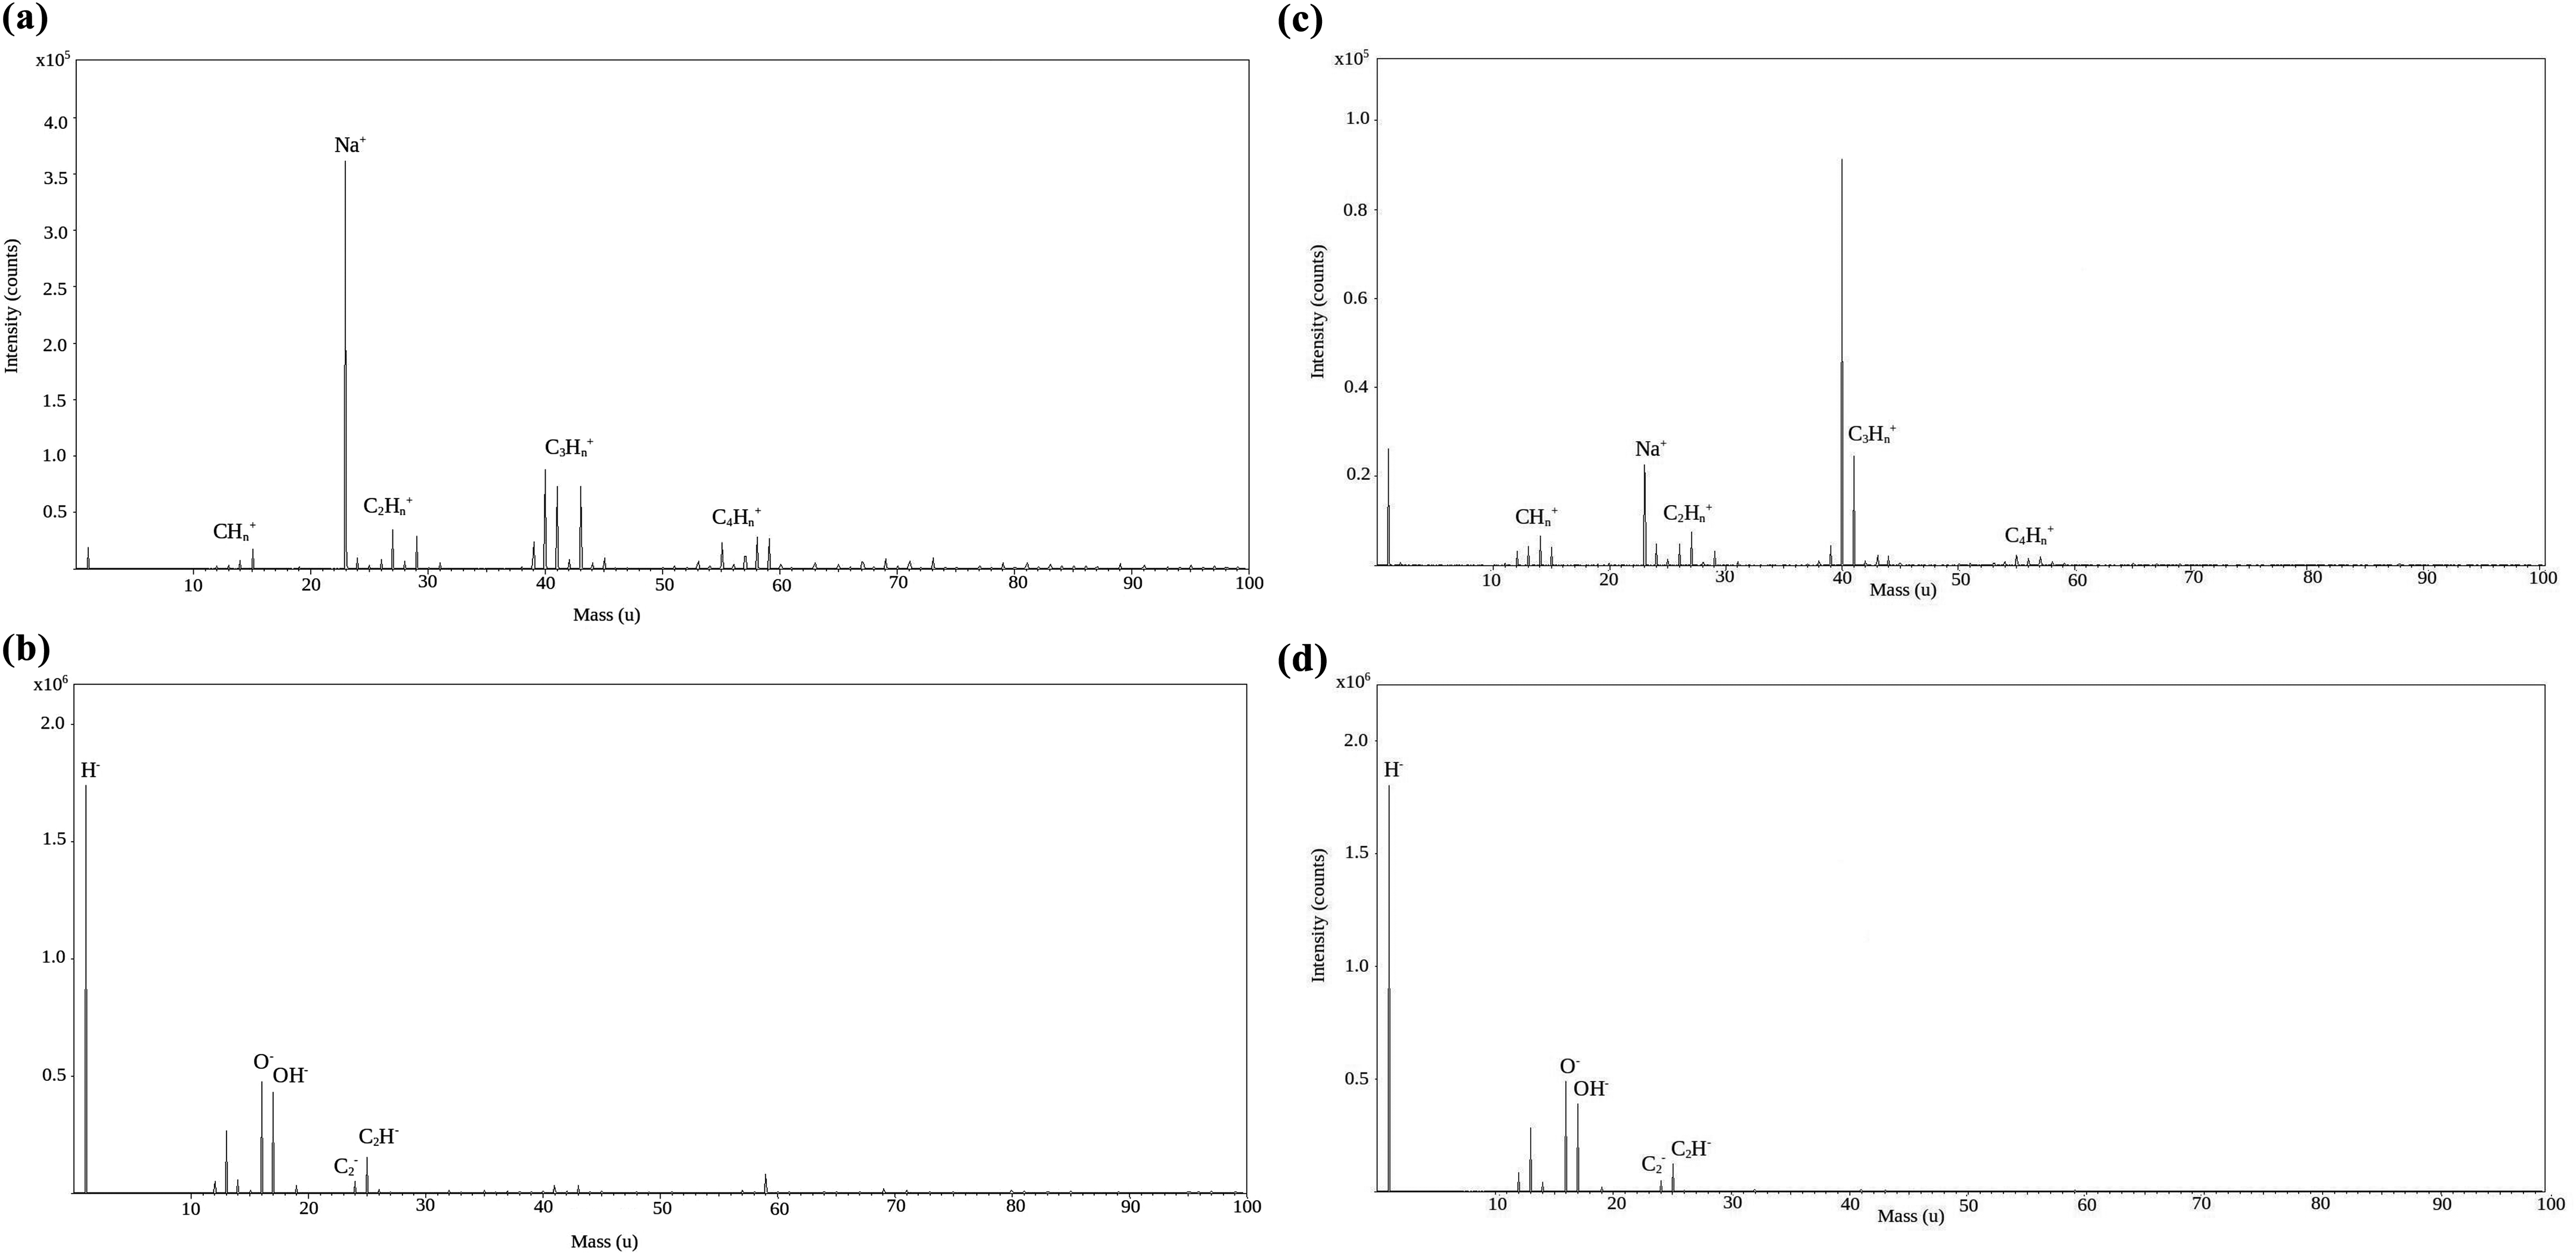
TOF-SIMS spectra of (a, b) positive and negative modes of PVA and (c, d) positive and negative modes of the nanocomposite of GO nanoribbons with PVA.
The characteristic TOF-SIMS peaks were observed in the mass range of 1–100 amu, for both positive and negative spectra. The characteristic peaks observed in the negative mode spectra of PVA and nanocomposite of GO nanoribbons with PVA included O− (m/e 16) and OH− (m/e 17). Impurities, such as Na+ (m/e 23), and hydrocarbon fragments were observed in the positive mode spectra.
Table 1 represents the intensities of the OH−, O−, C2H−, and C2− peaks of PVA and the nanocomposite of GO nanoribbons with the polymer.
The intensities of the OH−, O−, C2H−, and C2− peaks of PVA and the nanocomposite of GO nanoribbons with the polymer.
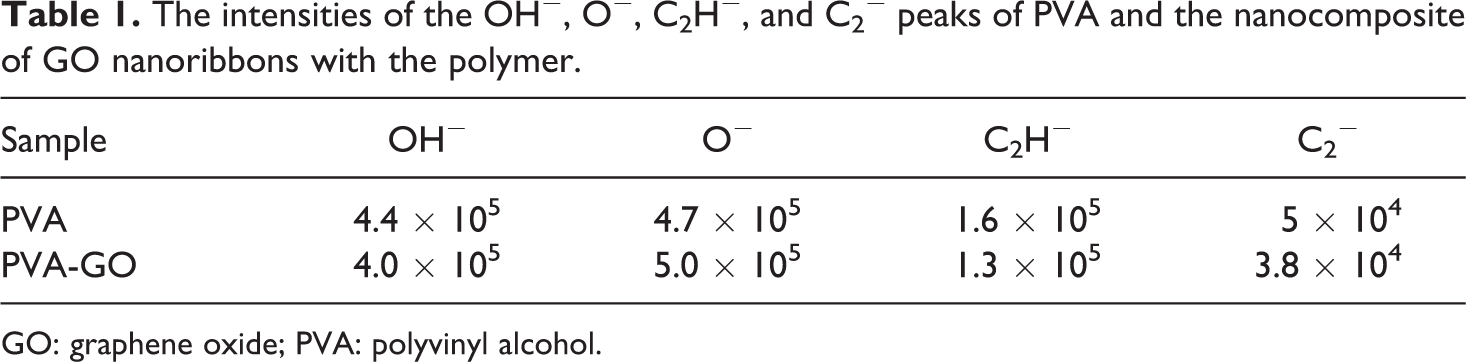
GO: graphene oxide; PVA: polyvinyl alcohol.
Figure 4 shows the intensity ratio change of the OH−/O− and C2H−/C2− peaks of PVA and its nanocomposite with PVA. The intensity ratios of these peaks were not the same for the samples. The chemical reduction of GO when mixed with a PVA water solution could happen during the preparation of PVA/GO nanocomposite. The intensity ratio of the OH−/O− peaks of PVA was a bit higher than that of the PVA-GO nanocomposite, whereas the intensity ratio of the C2H−/C2− peaks of the first one was a bit lower than that of the second one. This indicates that no reduction occurred for the GO nanoribbons when formed the nanocomposite with PVA. It is a good thing that the reduction of GO nanoribbons did not happen during the preparation of their nanocomposite with PVA as we aimed to maintain the molecular structure of GO nanoribbons.
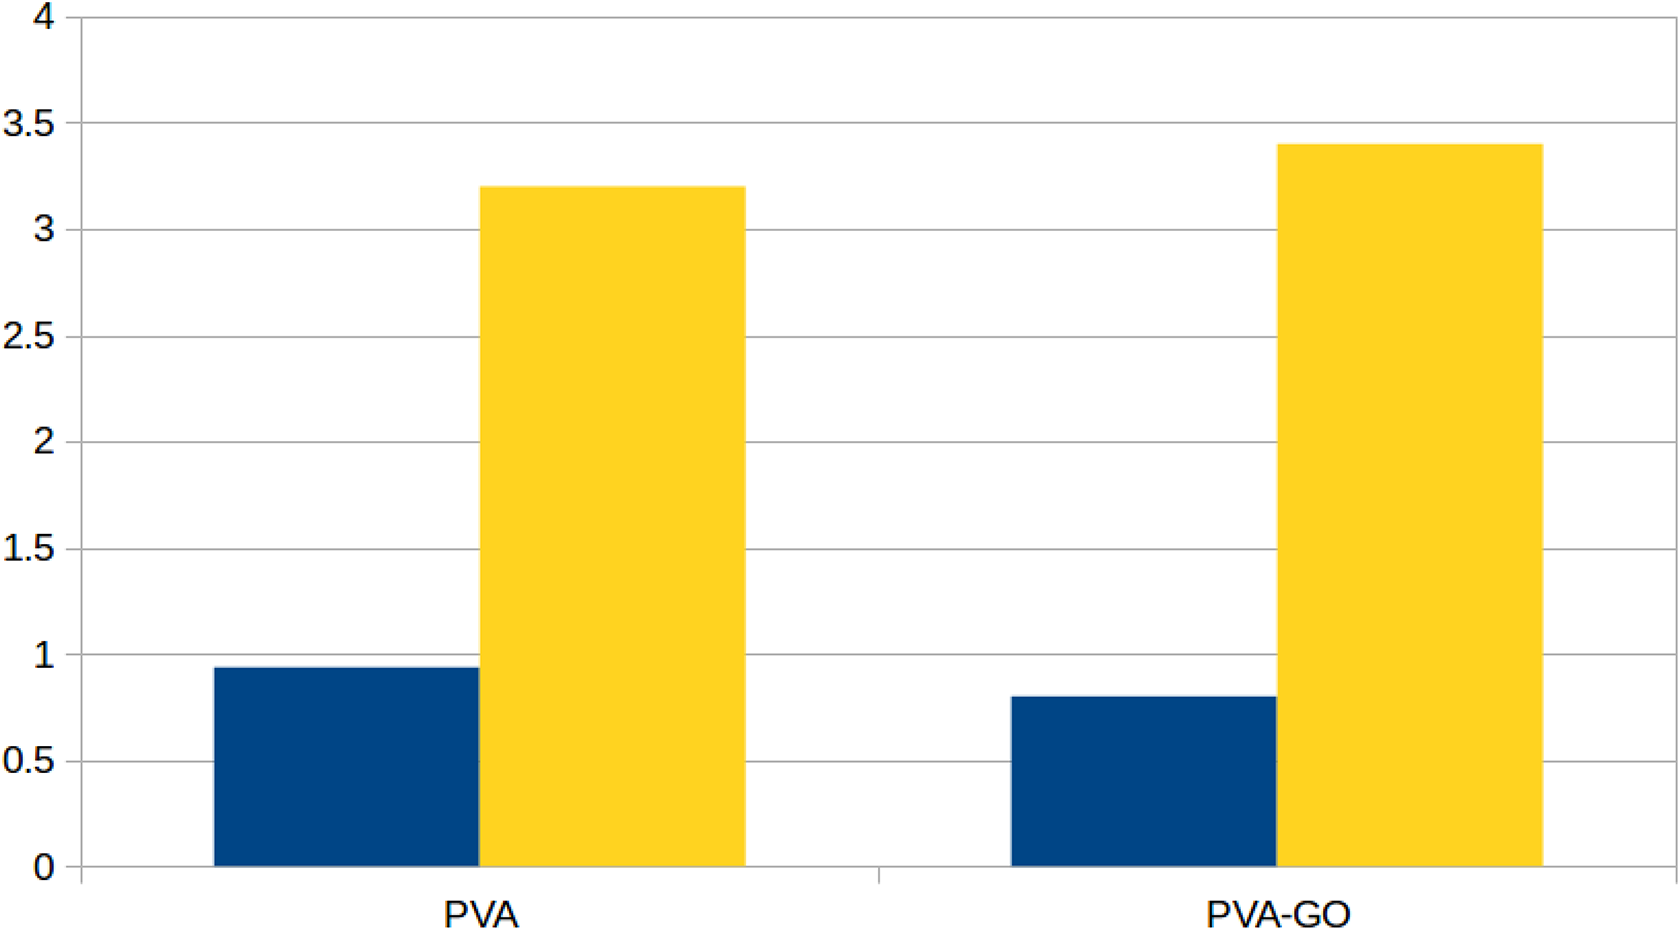
The intensity ratio change of the OH−/O− and C2H−/C2− peaks of PVA and its nanocomposite with PVA. The blue and yellow lines represent the OH−/O− and C2H−/C2− peaks, respectively.
Rheology analysis of nanocomposite
Figure 5 shows the diagram of the viscosity of PVA and that of the nanocomposite of GO nanoribbons with PVA versus shear rate. The pseudo-Newtonian rheological behavior was observed for PVA, whereas the rheological behavior observed for the nanocomposite of GO nanoribbons with PVA was non-Newtonian at 20°C. The pseudo-Newtonian rheological behavior of the polymer was observed as its viscosity did not change with shear rate. The non-Newtonian rheological behavior of the nanocomposite of GO nanoribbons with PVA is due to the network in the structure of this material, whereas the pseudo-Newtonian rheological behavior of PVA corresponds to the absence of the network.
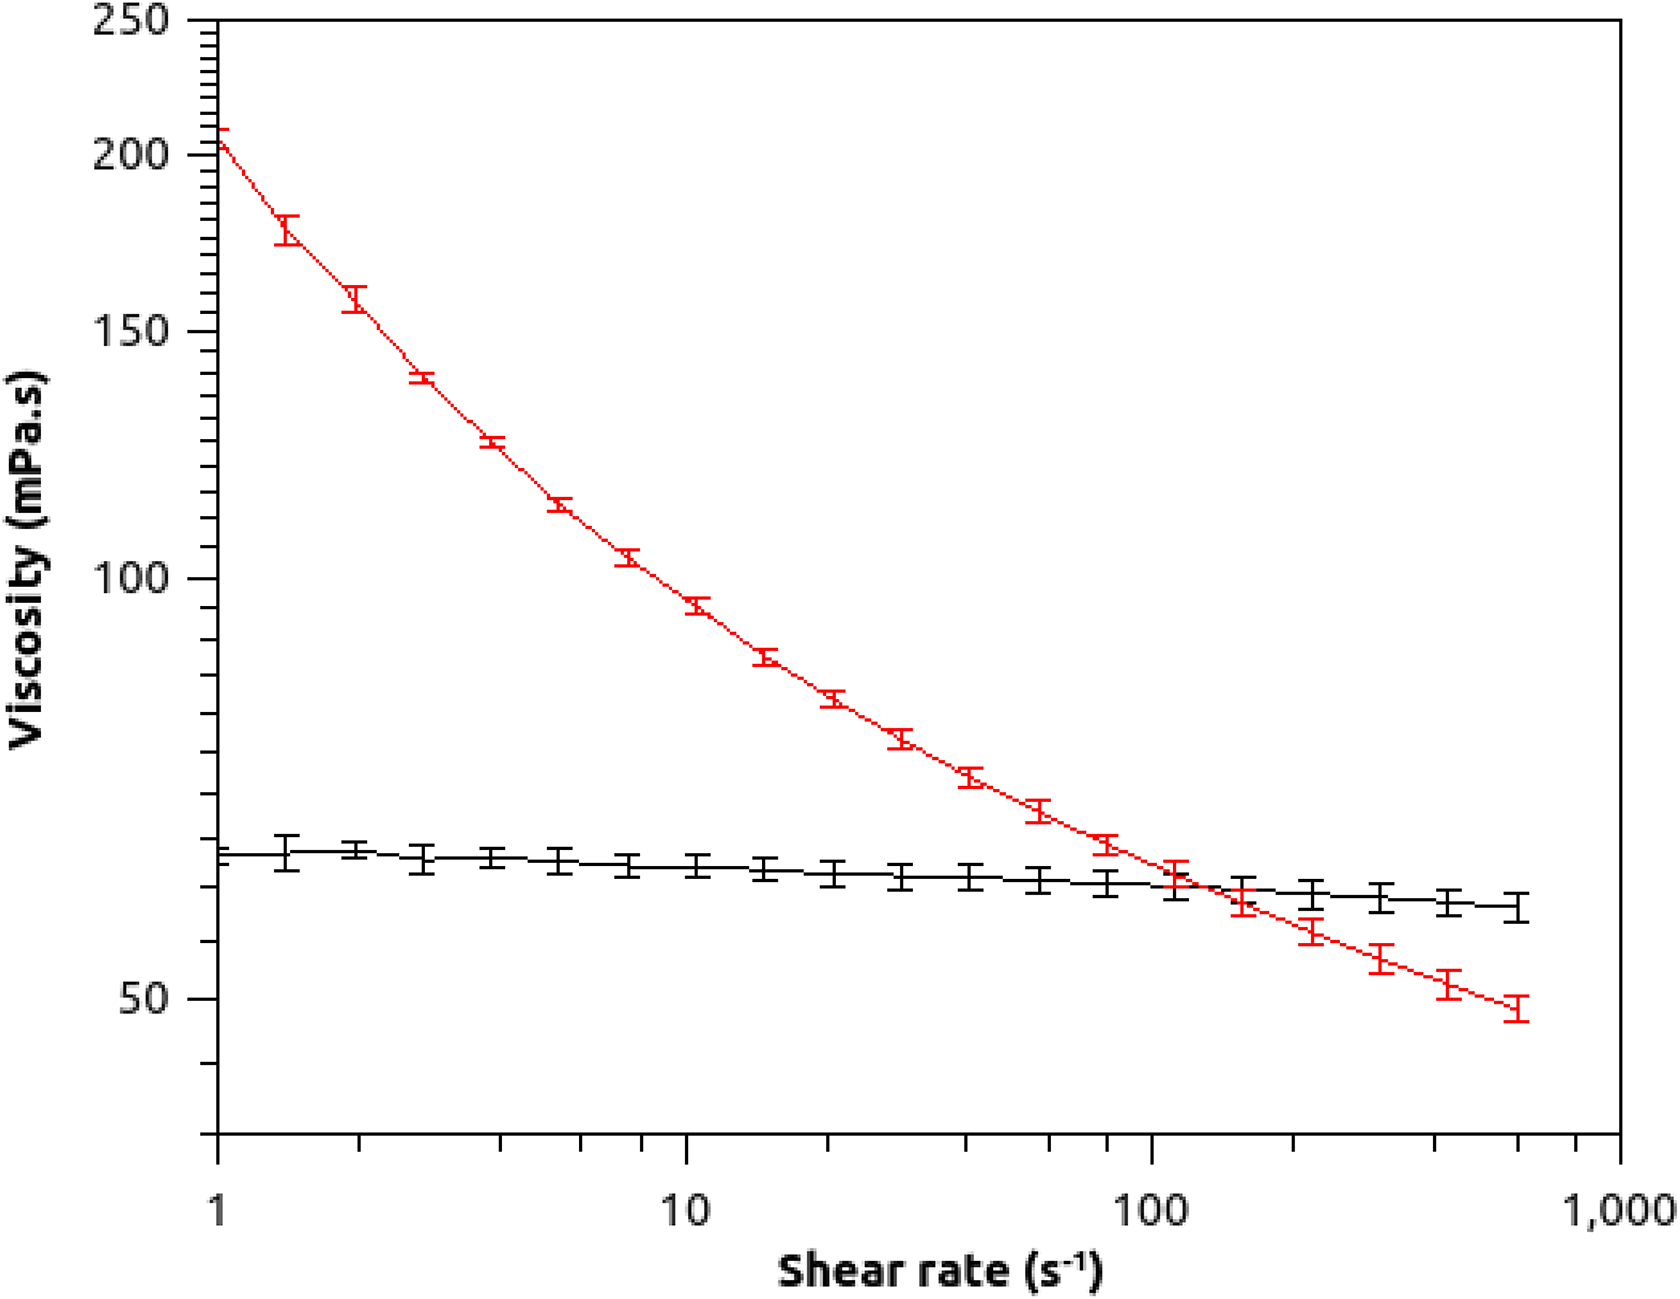
Viscosity of PVA and that of the nanocomposite of GO nanoribbons with PVA versus shear rate. The black and red lines represent the data for PVA and nanocomposite of GO nanoribbons with PVA, respectively.
At high frequencies, shear rates more than 100 s−1, the viscosity of the nanocomposite is lower than that of the matrix. This may be due to the degradation of the PVA in presence of GO.
We used power law, which is one of the most widely spread models for approximation of viscosity data. We fitted the experimental data of apparent viscosity and shear of the nanocomposite of GO nanoribbons with PVA to equation (ln μ = ln k + (n − 1) ln γ) to determine the model parameters, the flow behavior index, n, and consistency coefficient, k, by regression analysis. 53 The values of n and k were 0.79 and 164.02 mPa·s, respectively. Our data showed good fitting to power law model with the coefficient of determination R2 = 0.96.
Our results show that the viscosity of the nanocomposite decreases with increasing shear rate. Thus, it corresponds to flow behavior shear thinning fluid. At a shear rate around 120 s−1, the viscosity values of the nanocomposite and the polymer are the same. This indicates that GO nanoribbons at this shear rate do not affect the viscosity of the polymer.
Figure 6 shows the shear stress versus shear rate of PVA and that of the nanocomposite of GO nanoribbons with PVA. The average values of different experiments are represented in the shear flow curves.
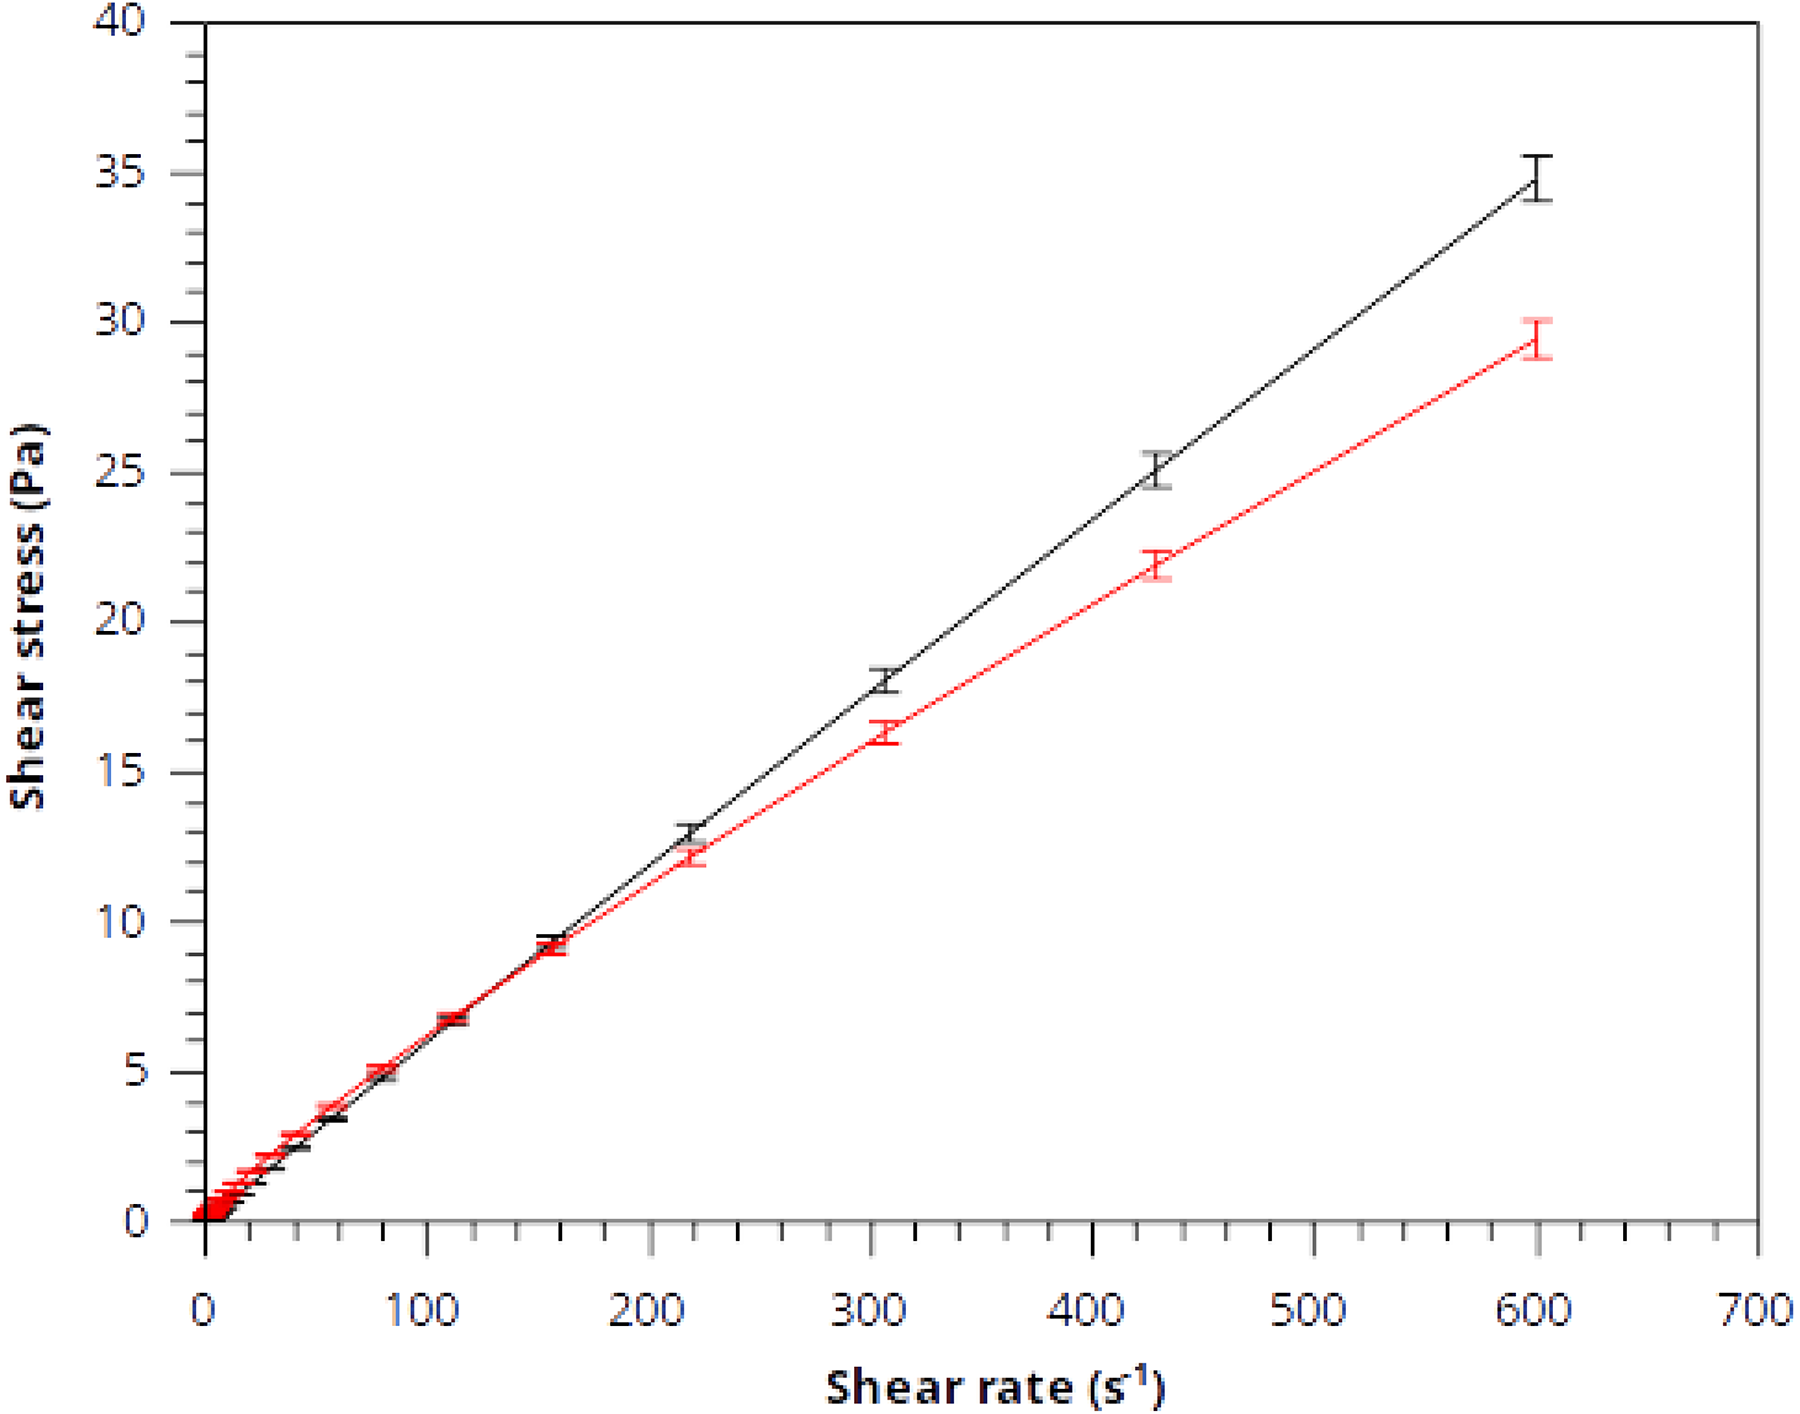
The shear stress versus shear rate of PVA and that of the nanocomposite of GO nanoribbons with PVA. The black and red lines represent the data for PVA and nanocomposite of GO nanoribbons with PVA, respectively.
As reported in Figure 6, the different shear flow curves were superimposed at low shear rates. This indicates that the nanocomposite was stable during the experimental work. We observed the constant increase of the shear stress with shear rate up to 600 s−1. This behavior corresponds to a dynamically stable region in samples and may be related to a homogeneous field of velocities during the viscometric flow of yielding materials. The continuous increase of shear stress in the steady condition and the appearance of stability explain the similar behavior of PVA and its nanocomposite with GO nanoribbons.
Dielectric properties measurements
Figure 7 shows the real and the imaginary part of the complex permittivity as a function of frequency for the nanocomposite of GO nanoribbons with PVA.
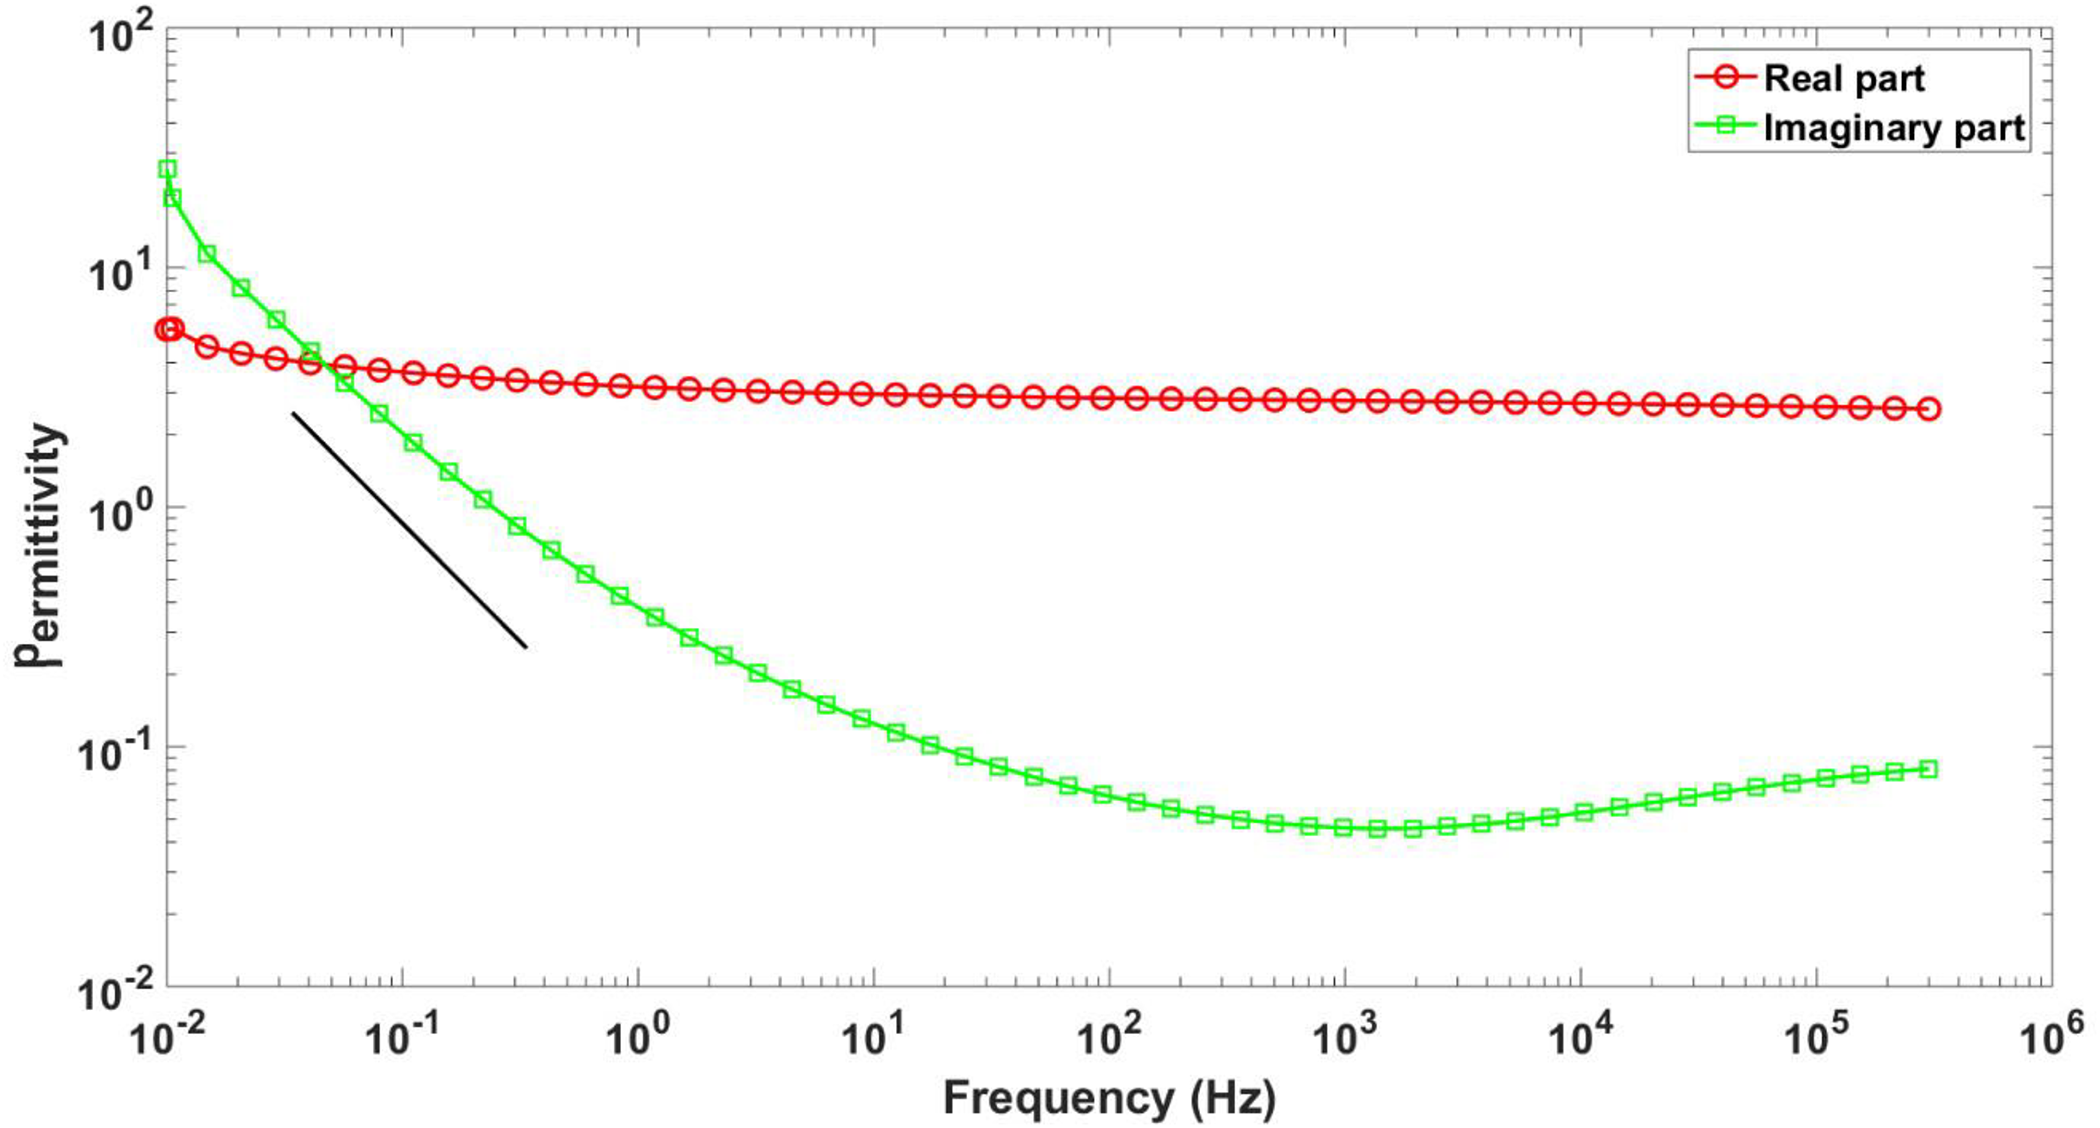
Real and imaginary part of the complex permittivity of nanocomposite of GO with PVA at room temperature. The black line corresponds to the −1 slope indicator.
As shown in Figure 7, the low-frequency tail of a dipolar relaxation was detected at around 105 Hz and the contribution of charge fluctuations was observed at lower frequencies. The addition of GO nanoribbons to PVA improves the electrical properties of the polymer as the real part of the complex permittivity of the nanocomposite increases more than 100 times with the change of frequency from 102 to 10−2 Hz. The increase of the imaginary permittivity toward low frequency is typical of the so-called low-frequency dispersion (LFD) when the dielectric response is dominated by charge carriers’ fluctuation. This behavior, typical of solid dielectrics, is well documented in the literature. 54
The C/O ratio of GO, which is a direct indicator of the amount of its graphitic domains, is 2/1 and it should be reduced to make it conductive. More investigation is required to analyze it with solid-state 13C NMR spectroscopy. The concentration dependencies of the rheological and physical properties of PVA and its nanocomposite with GO nanoribbons will also be investigated in a further work.
Conclusions
Physicochemical, rheological, and dielectric properties of nanocomposite of GO and PVA were investigated in this study. The preparation of this nanocomposite resulted a similar FTIR spectra of PVA and nanocomposite of GO nanoribbons with the polymer. The coating of PVA with GO was shown in the SEM images as the spherical shape of the polymer was lost due to its coating with the GO sheets. The same characteristic peaks in the negative mode spectra of PVA and nanocomposite of GO nanoribbons with PVA showed that the surface characteristic of this polymer and nanocomposite was not significantly different. The non-Newtonian rheological behavior of the nanocomposite of GO nanoribbons with PVA and the pseudo-Newtonian rheological behavior of PVA corresponding to the absence of the network were also observed. The dielectric properties of GO-PVA nanocomposite revealed noticeable LFD due to the fluctuation of ionic carrier. These results can provide some more knowledge about interaction of GO and PVA, which can also help a better understanding of this nanocomposite for mechanical and electrical applications. This nanocomposite of PVA-GO with appropriate physicochemical, rheological, and dielectric properties can be used in the construction of embedded capacitors as it has revealed constant increase of the shear stress with shear rate up to 600 s−1. Our work on the rheological and physical properties of this nanocomposite in comparison with those of PVA has not been previously reported. Further research will help determine the concentration dependencies of the rheological and physical properties of PVA and its nanocomposite with GO nanoribbons.
Footnotes
Acknowledgement
The authors acknowledge the Centre for Characterization and Microscopy of Materials (CM)2 from the Ecole Polytechnique of Montreal for the SEM imaging of the samples.
Funding
The author(s) received no financial support for the research, authorship, and/or publication of this article.