
Abstract
This study focuses on the effects of low-velocity impact (LVI) response of thermoset (TS) and thermoplastic (TP) matrix-based composites. In this study, the effects of the impactor shapes on the low-velocity impact response of the composite panels that produced from different matrix was investigated. Unidirectional E-glass fiber fabrics with an areal density of 300 g/m2 as reinforcement and epoxy matrix were used to produce TS composite. The vacuum-assisted resin infusion molding (VARIM) method was used to manufacture composite panels. The thermoplastic composites were manufactured with E-glass fiber-reinforced polypropylene prepregs. The tensile strength of TS matrix-based composites is higher than TP matrix-based composites that have the same fiber volume fraction. Despite being under the same impact energy, the TP specimens possess higher perforation threshold than TS specimens. The shape of the impactor significantly affected the perforation threshold. Besides, the impact number that caused perforation reduced dramatically in conical impactor. The repeated impact number that caused perforation is 36 for hemispherical (HS) impactor, but it is only 3 for conical impactor for polypropylene matrix-based composite. Moreover, a significant effect of fiber volumetric ratio on impact resistance was observed. The perforation threshold of glass fiber-reinforced polypropylene composites for 40% and 50% fiber volume fraction are 61 and 98 J, respectively. The perforation threshold of TP and TS specimens for HS impactor that has the same stacking sequence is 61 and 55 J, respectively.
Introduction
Nowadays, polymer composite materials are very popular in many applications, such as aerospace, automotive, defense and wind power industries thanks to their high strength–stiffness to weight ratio and improved mechanical properties as compared to metals. 1 On the other hand, polymer composite materials are sensitive to transverse impact, and it has become a serious threat to the composite structures because it produces large internal damages, such as delamination, matrix cracking, and fiber/yarn breakage. These damages that are not visible on the surface of composites degrade the material properties and reduce the load-carrying capacity of the composite structure. 2 Aktaş et al. 3 investigated the effect of low-velocity impact (LVI) on the compression-after-impact (CAI) strength of E-glass fiber-reinforced epoxy composites. The CAI strength decreases from 152 MPa for the undamaged specimen to 90 MPa for specimen impacted at 70 J (approximately 40.8% reduction). Abd El-Baky 4 investigated the effect of water aging on the impact performance of glass–polypropylene reinforced epoxy composites. The results showed that water uptake reduces the impact strength of all tested specimens. The impact response of laminated composites has long been an important area of research since LVI causes a significant reduction in structural stiffness. 5
Many studies in the literature focused on the effect of the shape of the impactor, the fiber type, and some environmental conditions on the LVI response.6–10 In former studies, LVI response of the thermoset (TS) composites was investigated by Azouaoui et al. 11 Ismail et al. 12 focused to analyze the effects of hybridizing kenaf and glass fiber to develop hybrid composites with varying weight ratios on the LVI response and the postimpact properties of the obtained composites. Tuo et al. 13 investigated the damage and failure mechanism of carbon fiber-reinforced epoxy thin composite laminates under LVI and CAI loading conditions. Four levels of impact energy were included in the test matrix. Delamination induced by the LVI was captured using ultrasonic C-scan, and a three-dimensional (3-D) digital image correlation system was employed to measure full-field displacement during the CAI tests. Goodarz et al. 14 studied LVI response of aramid/epoxy laminates containing nano-interlayers with different amounts of the thickness (17.5, 35, and 70 μm) and various stacking configuration (backside, central, and two-sides interleaving).
Nonetheless, thermoplastic (TP) matrix-based composites have seen a renewed interest in recent years, particularly due to their fast processing times and recyclability. 14 Unlike TS composites, a few researchers have studied the effect of LVI response on the capability of TP composite materials to resist penetration and absorb energy. 15 Rizzo et al. 16 proposed a method for the improvement of impact absorption performance of railway composite structures via the addition of TP polyurethane coating to carbon fiber reinforced polymers (CFRP) laminates. Arikan and Sayman 17 investigated that E-glass fiber-reinforced composites have been manufactured with two types of resin, polypropylene and epoxy (TP and TS) and they have been subjected to the low-velocity single and repeated impacts, and the effect of resin type on the impact response of composites is investigated. In addition to the above study, the effects of the different types of impactor shapes and fiber volume fraction on the mechanical properties of glass fiber-reinforced PP were investigated in this study. Carillo et al. 18 presented the LVI behavior of TP metal laminates made of aramid fiber-reinforced polypropylene and aluminum alloy. Mars et al. 19 carried out a numerical study to investigate the LVI behavior of polyamide as matrix reinforced by glass fiber. The assessment of the impact behavior requires tensile tests to determine the elastic–viscoplastic behavior of the composites. The numerical results are confirmed by experimental dropping weight impact tests.
This study aims to compare the LVI behavior of glass fiber-reinforced epoxy and polypropylene composite materials. The effects of impactor shape and repeated impact effects also have been studied. Moreover, the fiber volume fraction effect on the LVI behavior for TP matrix-based composites was investigated. Three different composite materials were produced as two of them TP matrix-based composite and one TS matrix-based composite. In this study, impact energies were chosen as 30, 60, 90 and 120 J for single impact tests while 30 J for repeated impact tests.
Materials and method
Production of composites
The TS composite materials used in this work were produced by the vacuum assisted resin infusion method. Areal density of the unidirectional (UD) E-glass fabrics used was 300 g/m2. An epoxy system consisted of Araldite LY 564 and Aradur 3487 BD, which were used as matrix material in manufacturing. The curing process was performed on a specially designed heating table, at 80°C for 8 h, followed by cooling at room temperature. The TS composite was manufactured with a stacking sequence of [0/90]3S for the investigation of impact response. The average thickness of composite was measured as 2.9 mm. The fiber volume fraction of TS is nearly 50%.
Using a hot press, the TP matrix-based composites were manufactured with UD E-glass fiber-reinforced PP-based prepregs at 180°C. In manufacturing, the TP matrix-based composites retained during 2 h under 0.625 MPa pressure followed by cooling at room temperature. Two different TP composite materials manufactured have different fiber volume fractions. The first TP composite (TP1) was manufactured with prepregs which has a volume fraction of 50%. The stacking sequence of TP1 is [0/90]4S, and it has a thickness of 2.87 mm. On the other hand, the second TP composite (TP2) was produced with prepreg UD E-glass fiber-reinforced PP which has a 40% fiber volume fraction. TP2 was produced from 12 layers with a stacking sequence of [0/90]3S. The thickness of TP2 was measured as 2.92 mm.
Several tests were carried out according to ASTM D3039/D3039M 20 standard to determine some mechanical properties of the TS and TP composites which are given in Table 1. In the table, XT and YT stand for tension strengths while E1, E2, and υ12 for the Young’s moduli and Poisson’s ratio in principal material directions, respectively.
Mechanical properties of the composites.
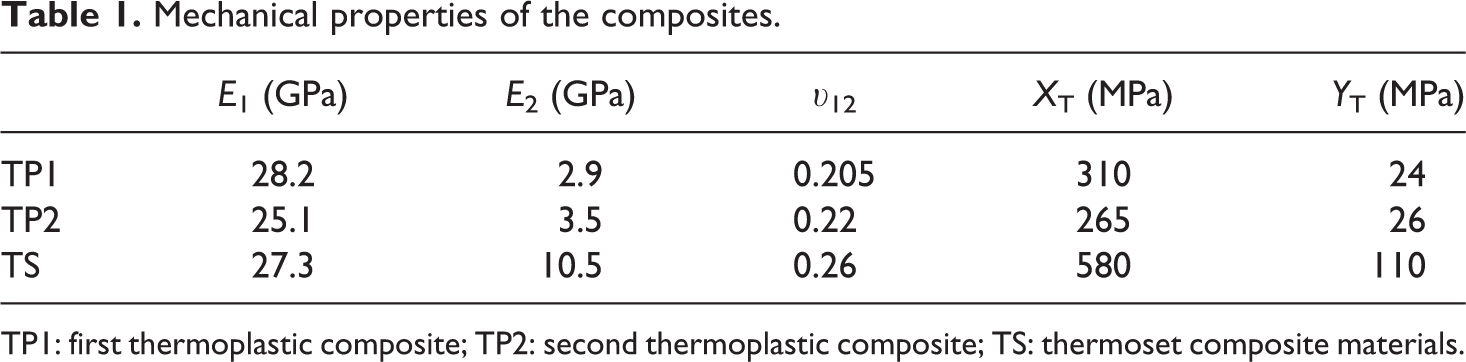
TP1: first thermoplastic composite; TP2: second thermoplastic composite; TS: thermoset composite materials.
LVI tests
The LVI tests were carried out with CEAST-Fractovis Plus drop-weight impact testing machine. A load-cell capacity of 22 kN was used in the tests. The striking mass including crosshead, impactor, and its nose was approximately 4.926 kg. Two different impactor shapes were used. The first one is hemispherical (HS) with a diameter of 12.7 mm. While, the second one is conical, and the impactor nose photos and geometry of the conical nose are given in Figure 1. Composite specimens with dimensions of 100 × 100 mm2 were fixed by a pneumatic fixture with a 76.2-mm-hole diameter. Yalkin et al. 21 showed the impact test cabin of the drop weight test machine. The impact energies chosen from 30 J to 120 J.
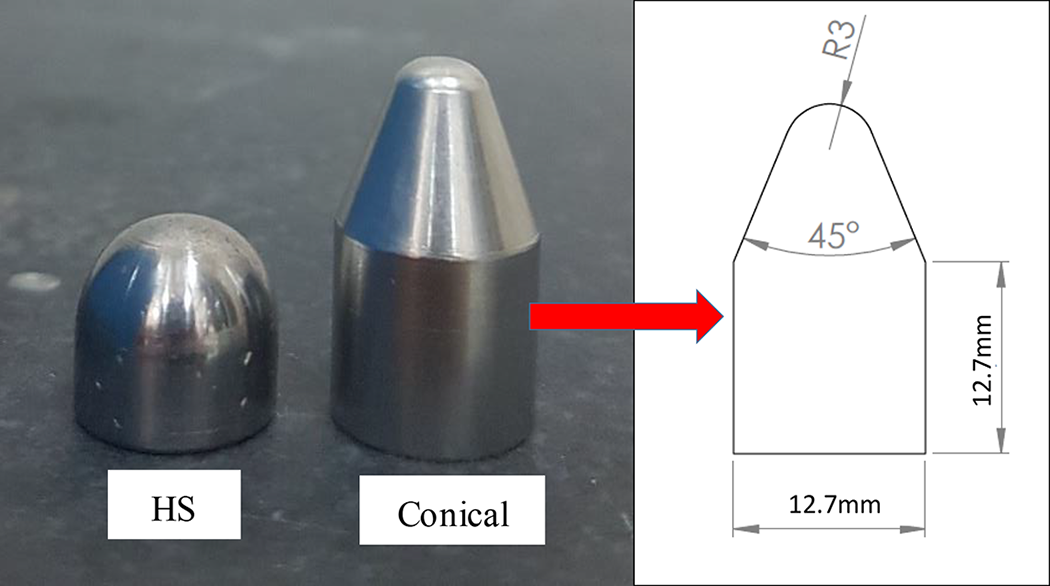
Impactor noses used in this study.
Results and discussion
Single impact response of composites
In an LVI event, the variation of the contact force versus deflection of the sample (displacement of the impactor nose or top surface of the sample) gives significant information about the impact response of the material. 10 Therefore, force–deflection curves of the impact tests are carried out to lead our discussions in this work. The contact force–deflection curves of TP1, TP2, and TS composites plates impacted at 30, 60, 90, and 120 J with HS impactor are shown in Figures 2 to 5. As seen from the figure, three different types of curves are presented. The first one is the rebounding case, in which the curves for 30 J in Figure 2 illustrate this case. The deflection–contact force curves in rebounding cases are closed. The contact force at the beginning of the curve increases with increasing deflection up to the maximum value. Afterward, the deflection and the contact force values decrease. The second one is called as the penetration case shown in Figure 4 for TP2 specimens. The third one illustrated the perforation case as shown in Figure 5 for all specimens. An increase in the impact energy causes more severe failure resulting in decreasing contact force with increasing deflection. The curve does not go toward to the origin but toward the horizontal axis.6,22 Furthermore, the area under these curves yields the absorbed energy.
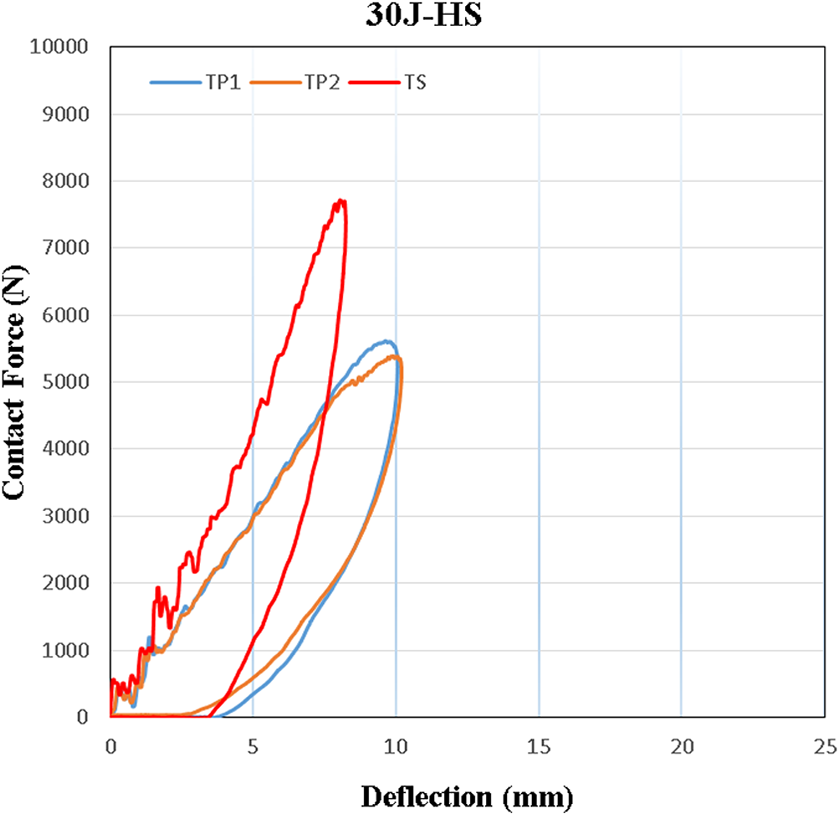
Contact force–deflection curves of TP1, TP2 and TS composite plates impacted at 30 J.
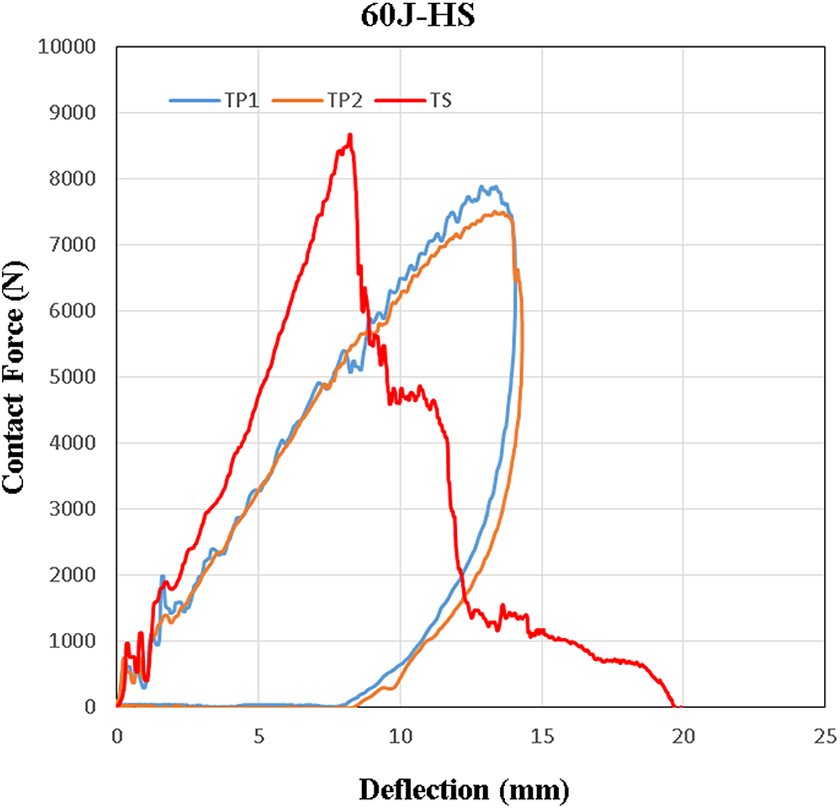
Contact force–deflection curves of TP1, TP2 and TS composite plates impacted at 60 J.
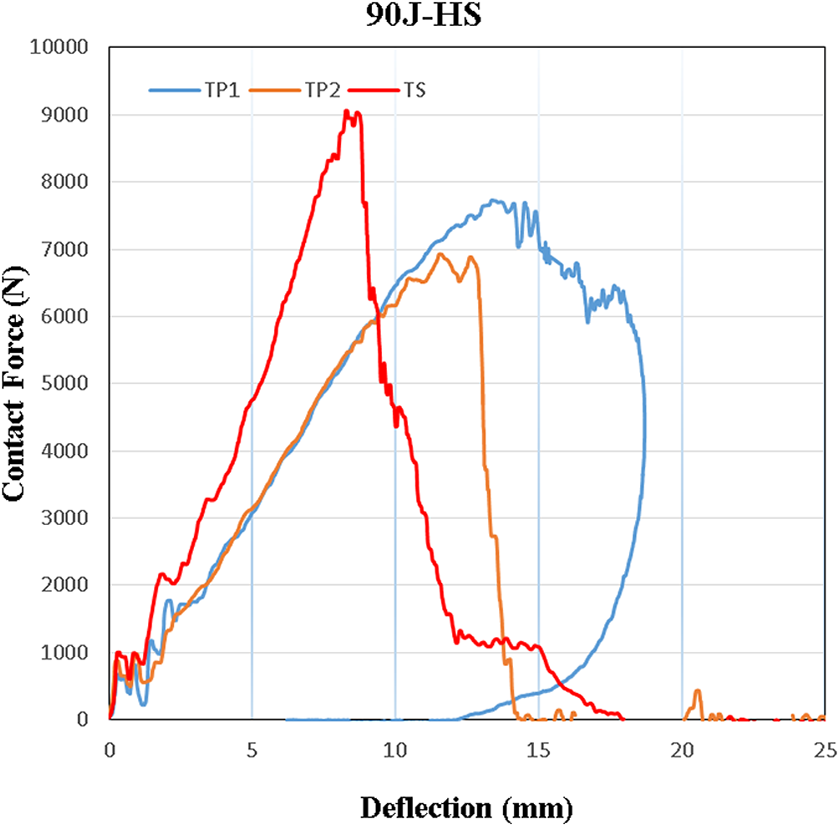
Contact force–deflection curves of TP1, TP2 and TS composite plates impacted at 90 J.
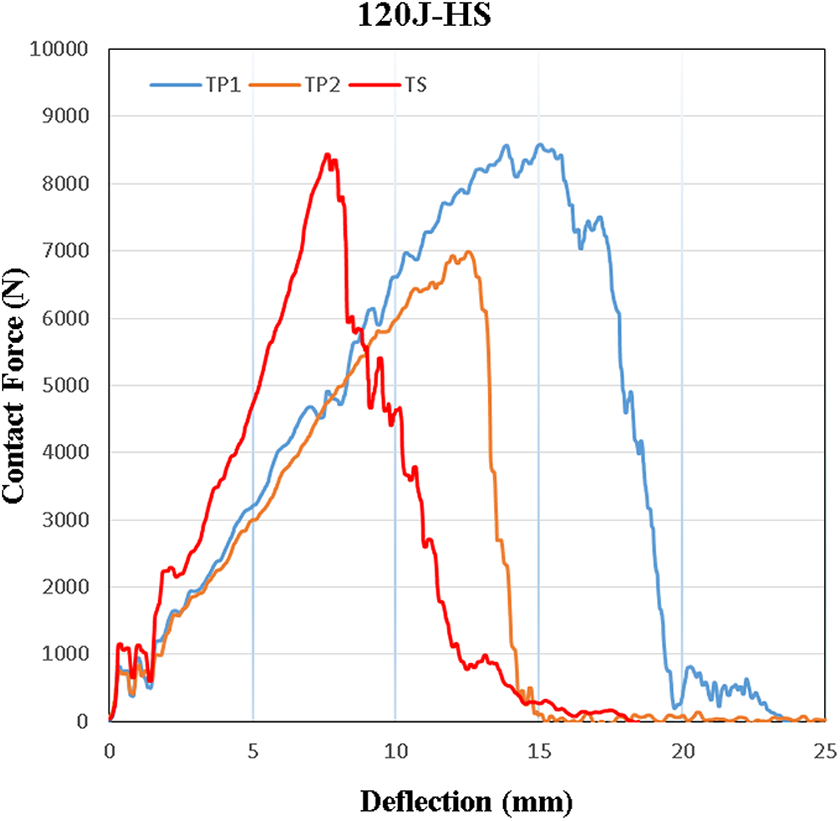
Contact force–deflection curves of TP1, TP2 and TS composite plates impacted at 120 J.
In Figure 2, the contact force–deflection curves of TP1, TP2, and TS composite plates impacted at 30 J for HS impactor are given. All curves are closed curves and this implies that rebounding cases occurred for all composite materials. The carried out tests illustrated that bending stiffness of the TP samples is lower than that of TS samples and this implied that TS composite is more rigid, but the load-carrying capability of the TP composites is higher than TS ones. The maximum contact force realized in TS material. However, the maximum contact forces in the TP materials are very close to each other. In contrast to contact force, the deflection is greater in TP materials. When the impact energy is increased to 60 J, the perforation case occurred in TS material while in TP materials, the rebounding case is still taking place. The TP materials still present similar behavior. While the perforation case occurs in TP2 materials at 90 J, it has observed in TP1 at 120 J. Contact force–deflection curves of TP1, TP2, and TS composite plates impacted for 30 and 60 J for conical impactor are presented in Figures 6 and 7. As seen in figures, the rebounding case took place at 30 J for all materials. However, the perforation case occurred in all materials at 60 J. Moreover, there was a significant reduction in maximum contact forces for all materials. For instance, the maximum contact force for TS impacted at 60 J for HS impactor is nearly 8500 N, while it is only 5800 N for conical impactor at the same impact energy. Besides, the perforation threshold of TS composite for HS impactor and conical impactor is 55 and 51 J, respectively. The slope of the ascending section of curves is called as impact bending stiffness. As seen in fıgures, the TS material has higher impact bending stiffness than TP materials. The impact bending stiffness of both TP materials is very close. For all materials, the impact bending stiffness is higher for HS impactor than conical impactor. The impact bending stiffness of TP1, TP2, and TS composites for the HS impactor is 631 ± 7, 623 ± 6, and 977 ± 10 N/mm, respectively. On the other hand, the impact bending stiffness of TP1, TP2, and TS composites for the conical impactor is 535 ± 8, 460 ± 11, and 818 ± 5 N/mm, respectively.
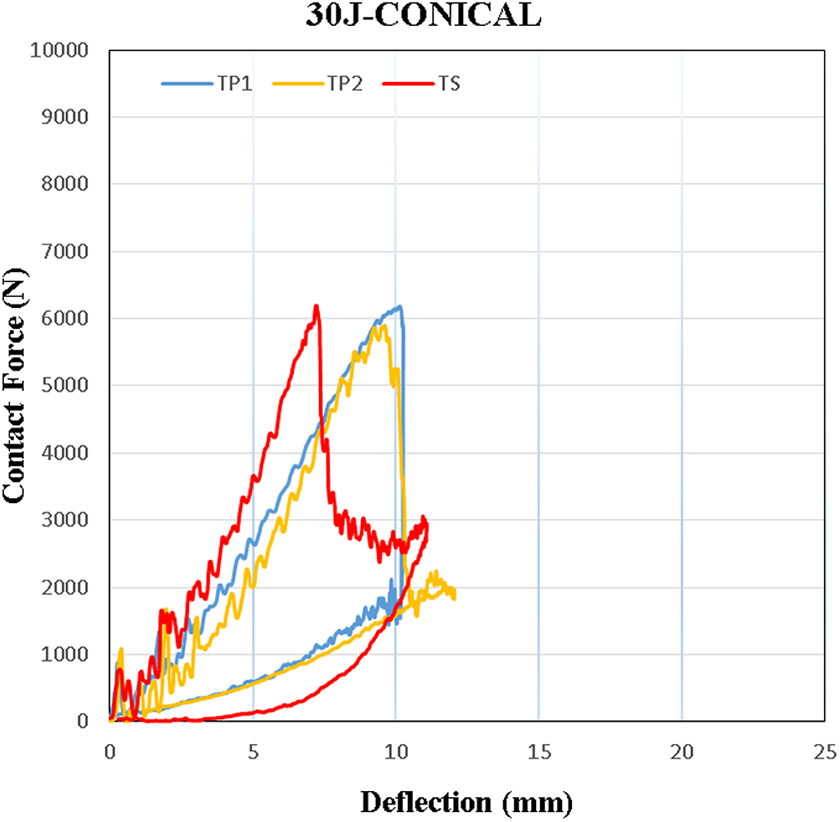
Contact force–deflection curves of TP1, TP2 and TS composite plates impacted at 30 J for conical impactor.
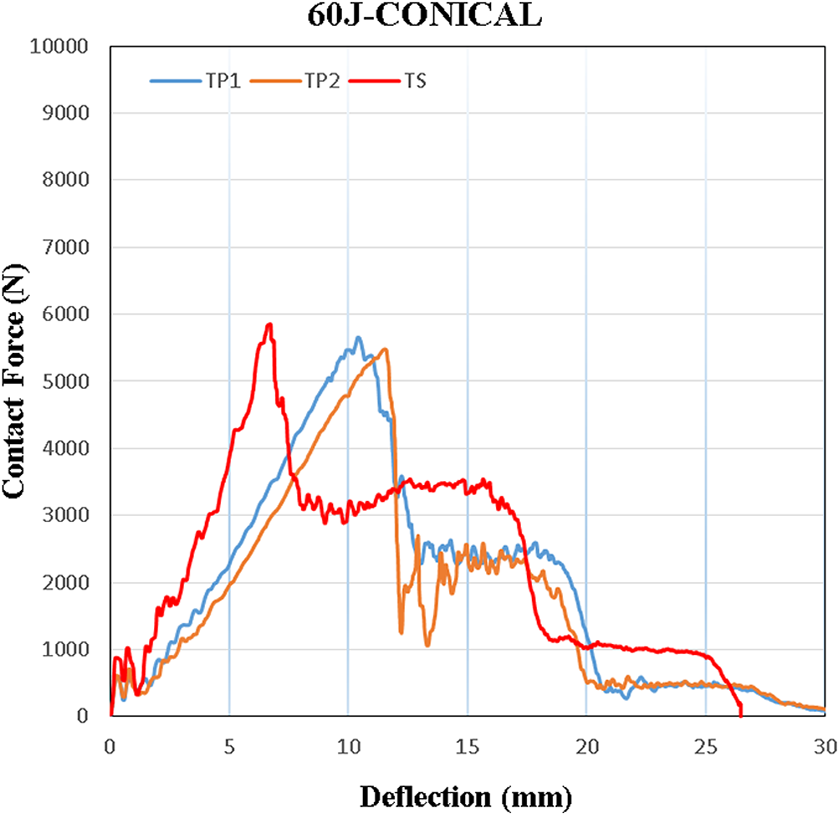
Contact force–deflection curves of TP1, TP2 and TS composite plates impacted at 60 J for conical impactor.
Variation of absorbed energy with impact energy for HS impactor and conical impactor shapes is given in Table 2. The perforation threshold of TP1, TP2, and TS materials is 98, 61, and 55 J, respectively, for HS impactor and 59, 55, and 51 J, respectively, for conical impactor. The maximum reduction of perforation threshold occurred in TP1 materials with 40%. Significant changes have not been observed in other materials in terms of the perforation threshold. Images of the damaged specimens subjected to impact energies of 60 and 90 J with HS impactor and 60 J with conical impactor are shown in Figure 8. For the HS impactor, the delamination and fiber breakage occurs in TS composites at 60 J, while the matrix indentation and matrix cracking seen in TP composites. However, the fiber breakage is the main damage in all materials for the conical impactor at 60 J. Referring to Table 1, TS material has the highest tensile strength. As expected, the tensile properties of TP1 are higher than TP2 composite materials, in the fiber direction. However, the impact-resistant of TP composites is higher than TS composite. The TP materials are more ductile than TSs. Therefore, the toughness of TP materials is higher. This gives a higher resistance to transverse impact loads.
Variation of absorbed energy with impact energy for hemispherical and conical impactor shapes.
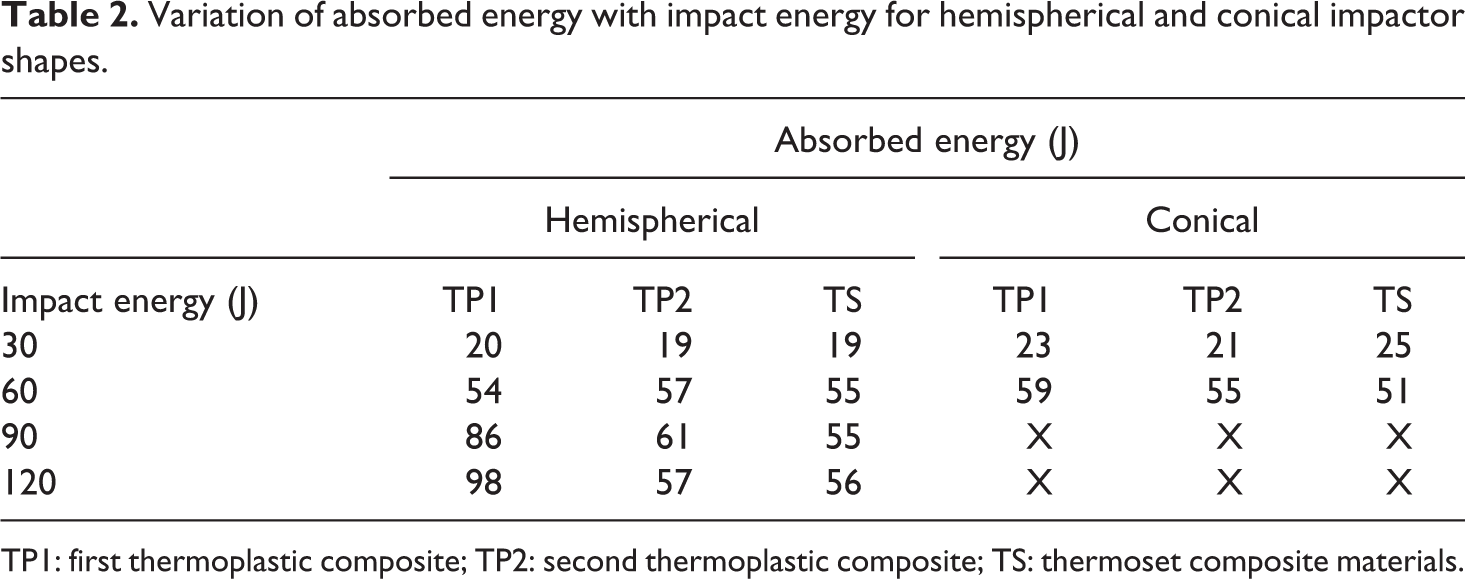
TP1: first thermoplastic composite; TP2: second thermoplastic composite; TS: thermoset composite materials.
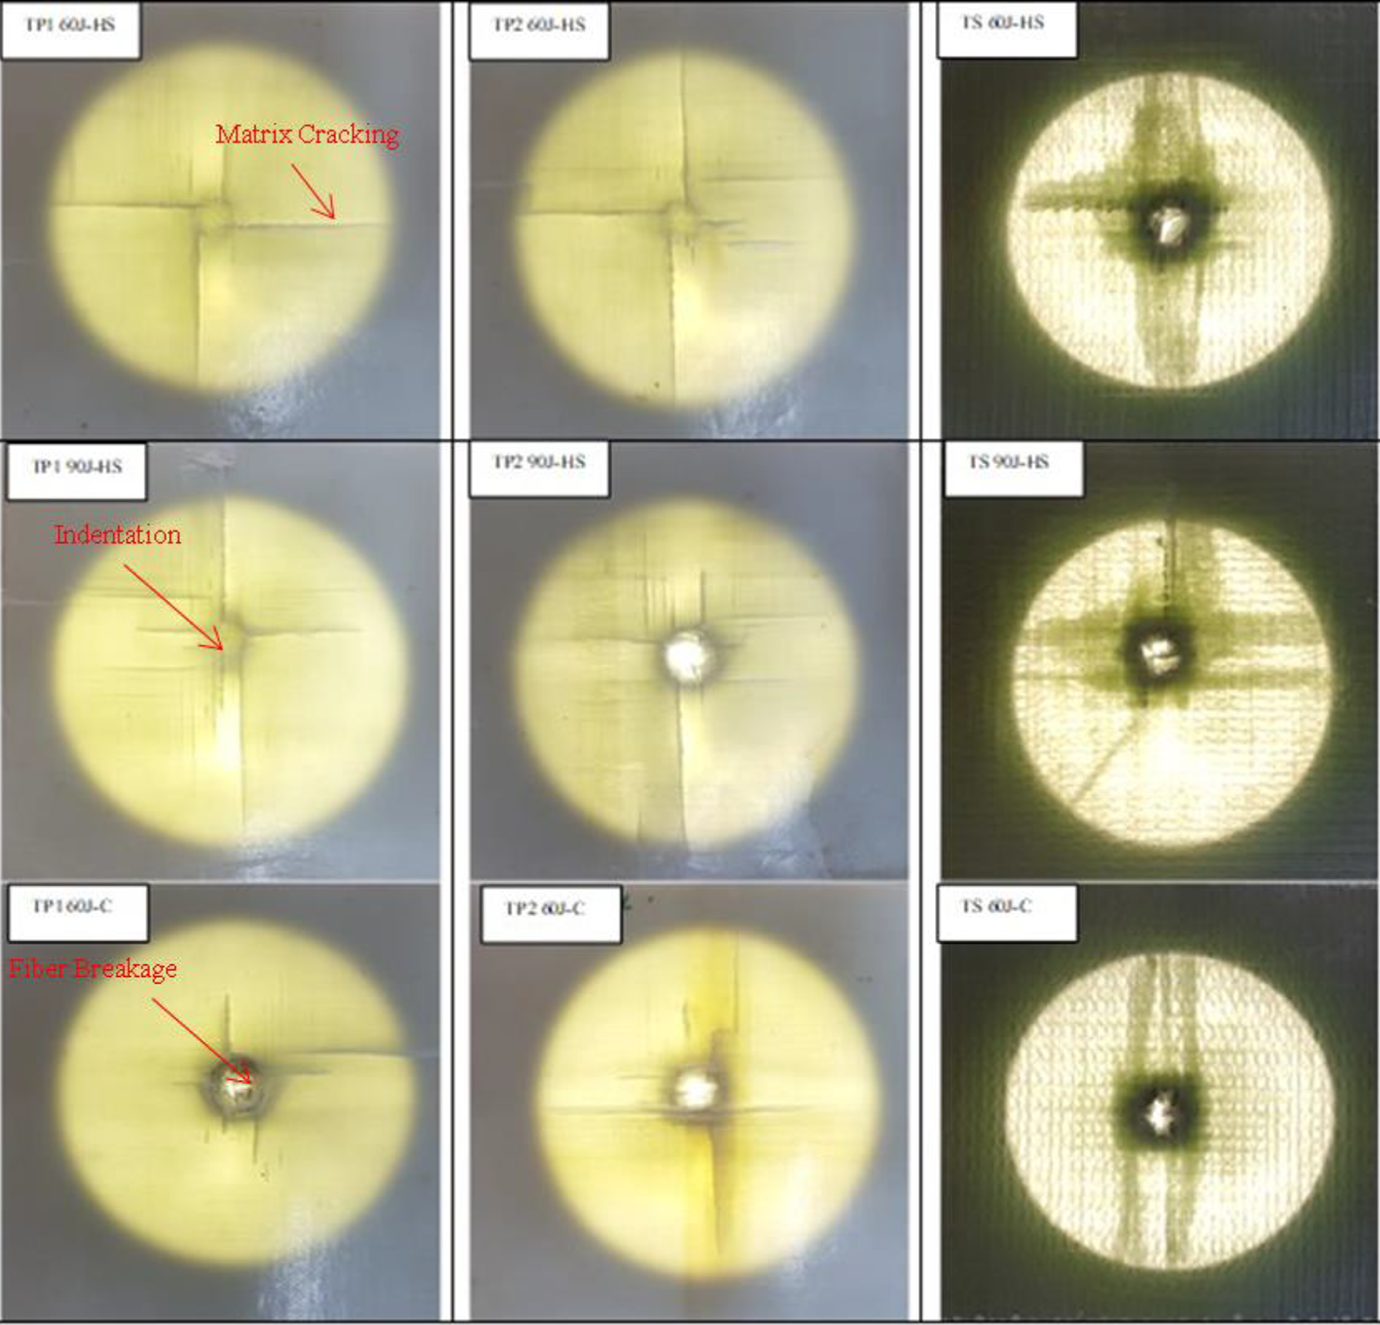
Images of the damaged specimens subjected to impact energies of 60 and 90 J with HS impactor and 60 J with conical impactor.
Repeated impact response of composites
In contrast to the single impact tests, few works have been studied on repeated impact response of composite. However, Atas et al. 5 reported many realistic cases that repeated impacts are of high importance. Ships and offshore structures subjected to repeated impacts from hard objects other than waves can be given as an example. Hereby, the repeated impact response of the TS and TP composites has also been studied in this work. The constant 30-J impact energy was chosen for repeated impact tests. The impact event was repeated until the perforation. For each case, repeated impact tests were conducted for three times, and the given numbers stand for average value.
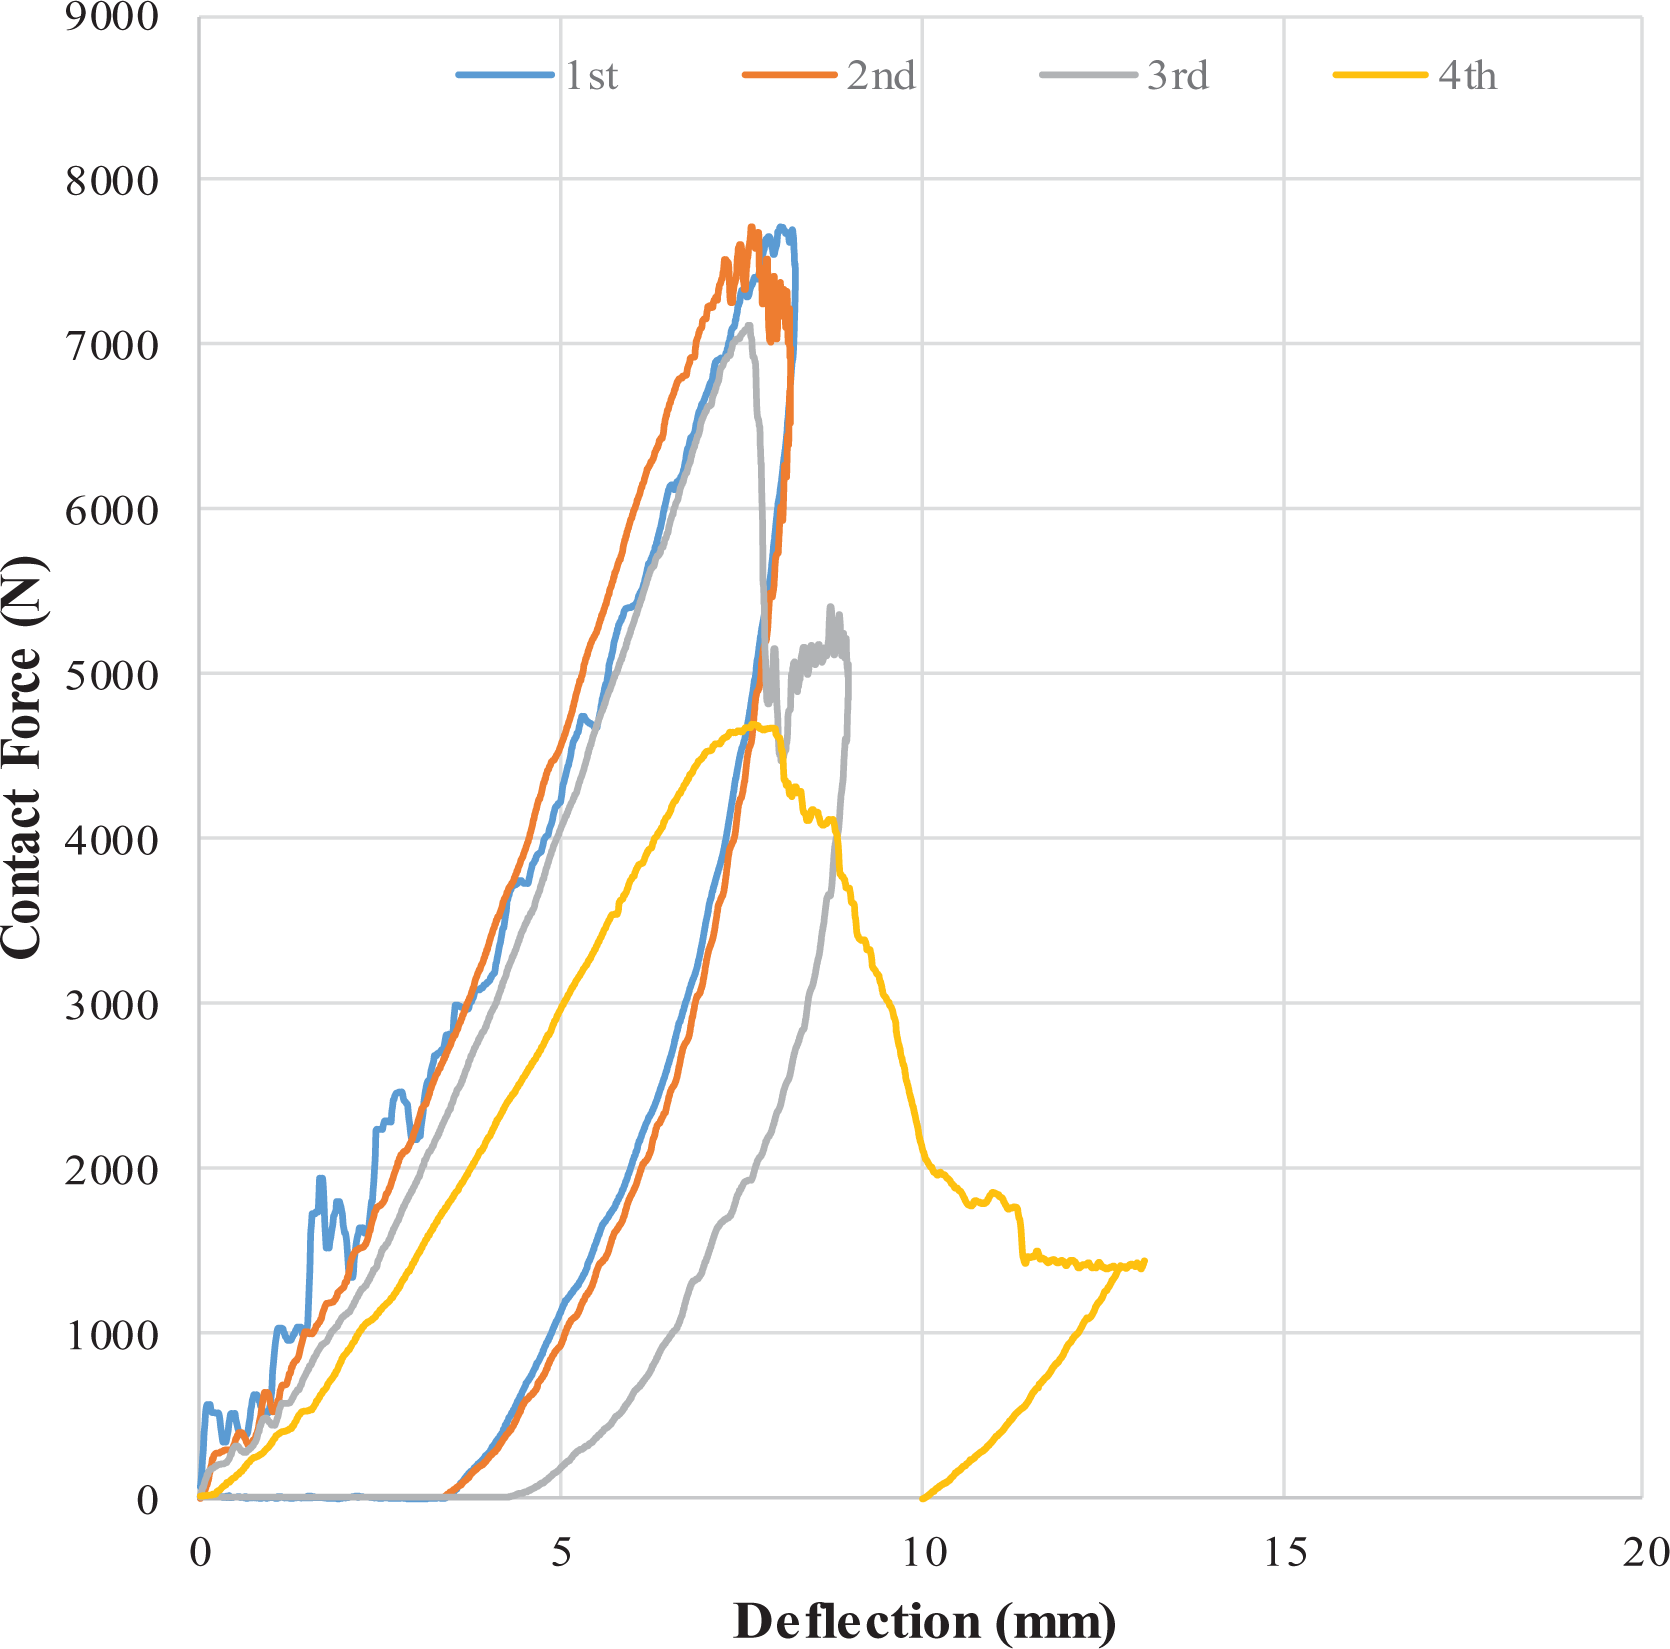
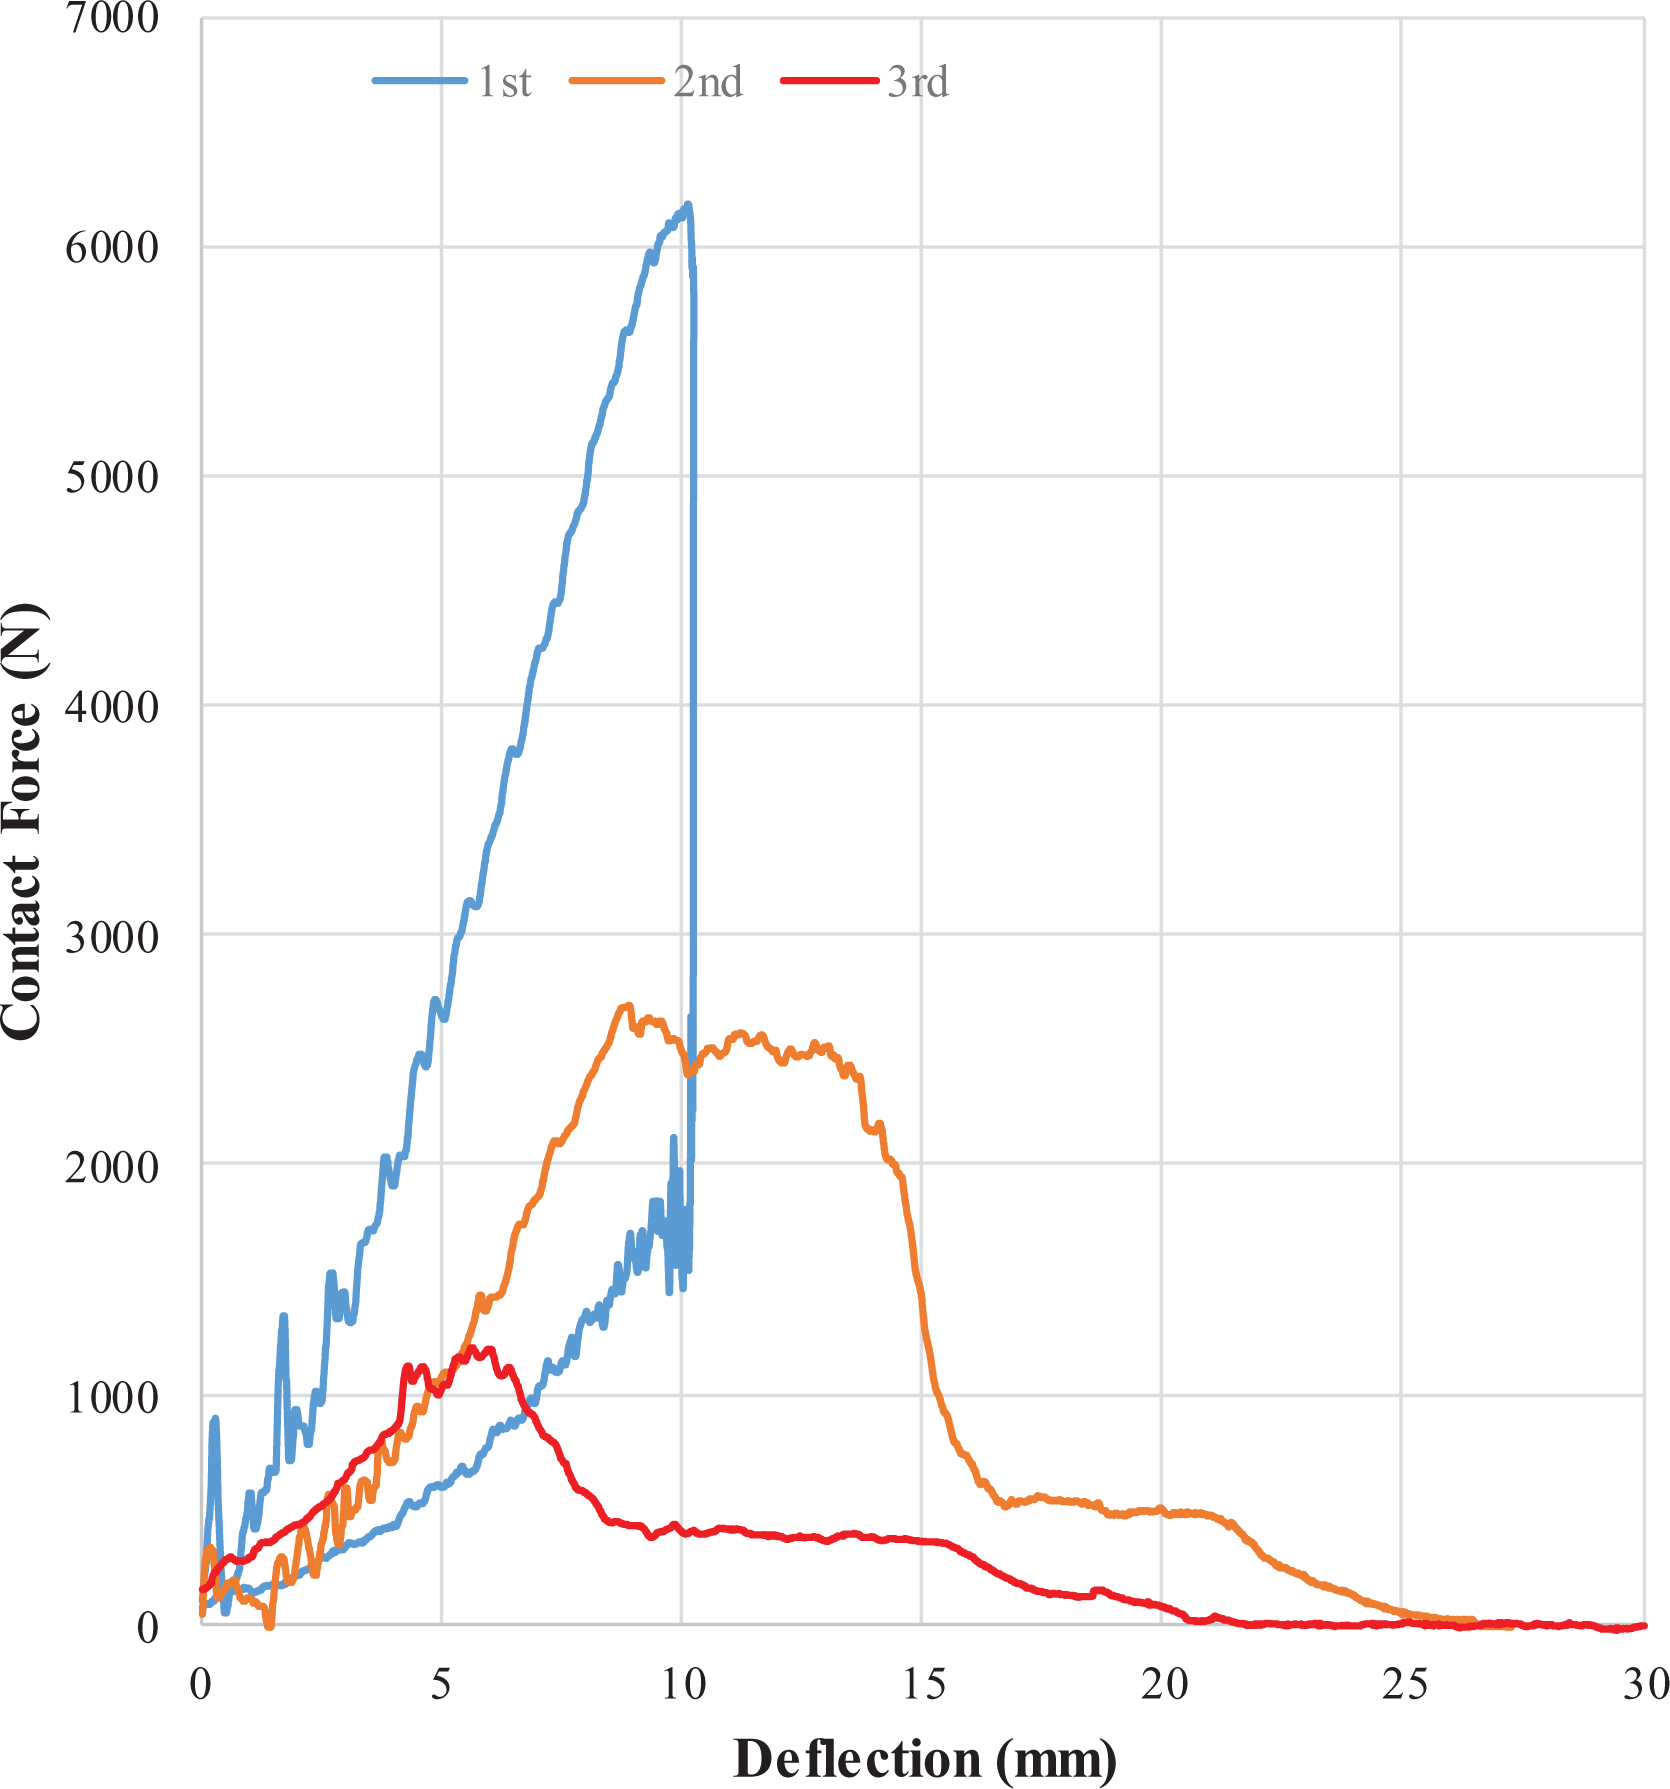
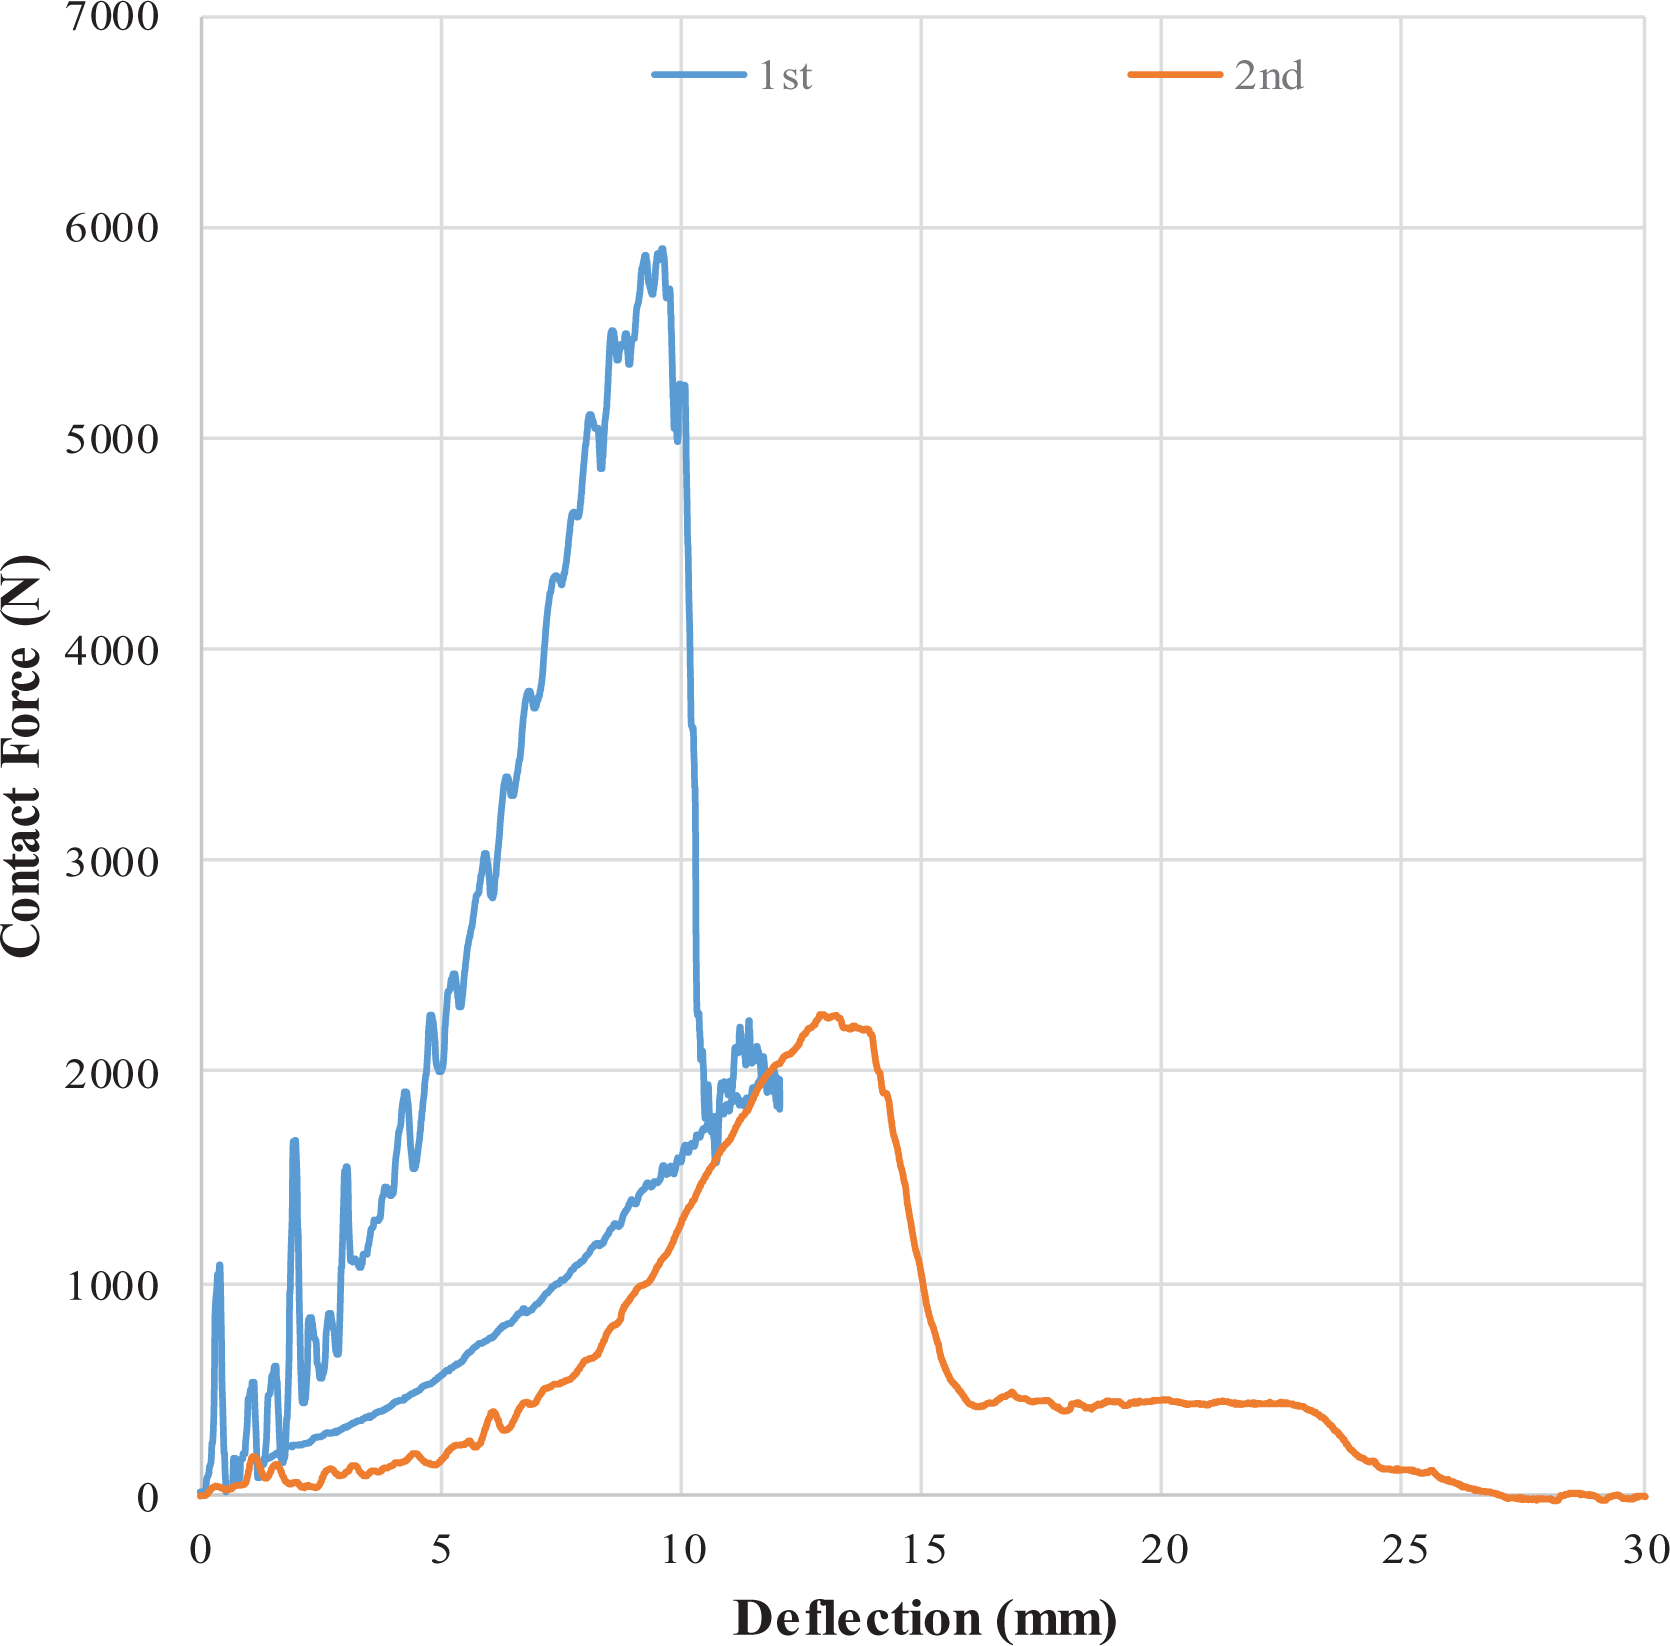
The contact force–deflection curves of TP1, TP2, and TS samples for various impact numbers are shown in Figures 9, 10, and 11, respectively. The repeat number of impact caused perforation under impact energy of 30 J for the HS impactor was found to be 36, 6, and 4 for TP1, TP2, and TS, respectively. As seen in figures, the contact force increases in the initial impact numbers. The first impact results in a smaller contact force than the following impacts due to damage to the relatively soft matrix via indentation. Afterward, contact force increases during a few impacts and remains nearly constant until damage of fibers and then decreases gradually, implying reduced stiffness of the sample step-by-step owing to fiber damages. 10 In addition, it is also seen that the repeated impacts reduced the bending stiffness. It is also seen that the successive impacts increase the deflection for all materials. The dramatic reduction in stiffness and contact force takes place with fiber fractures following matrix cracks and indentation. Afterward, they continue to decrease gradually until the perforation of the samples.
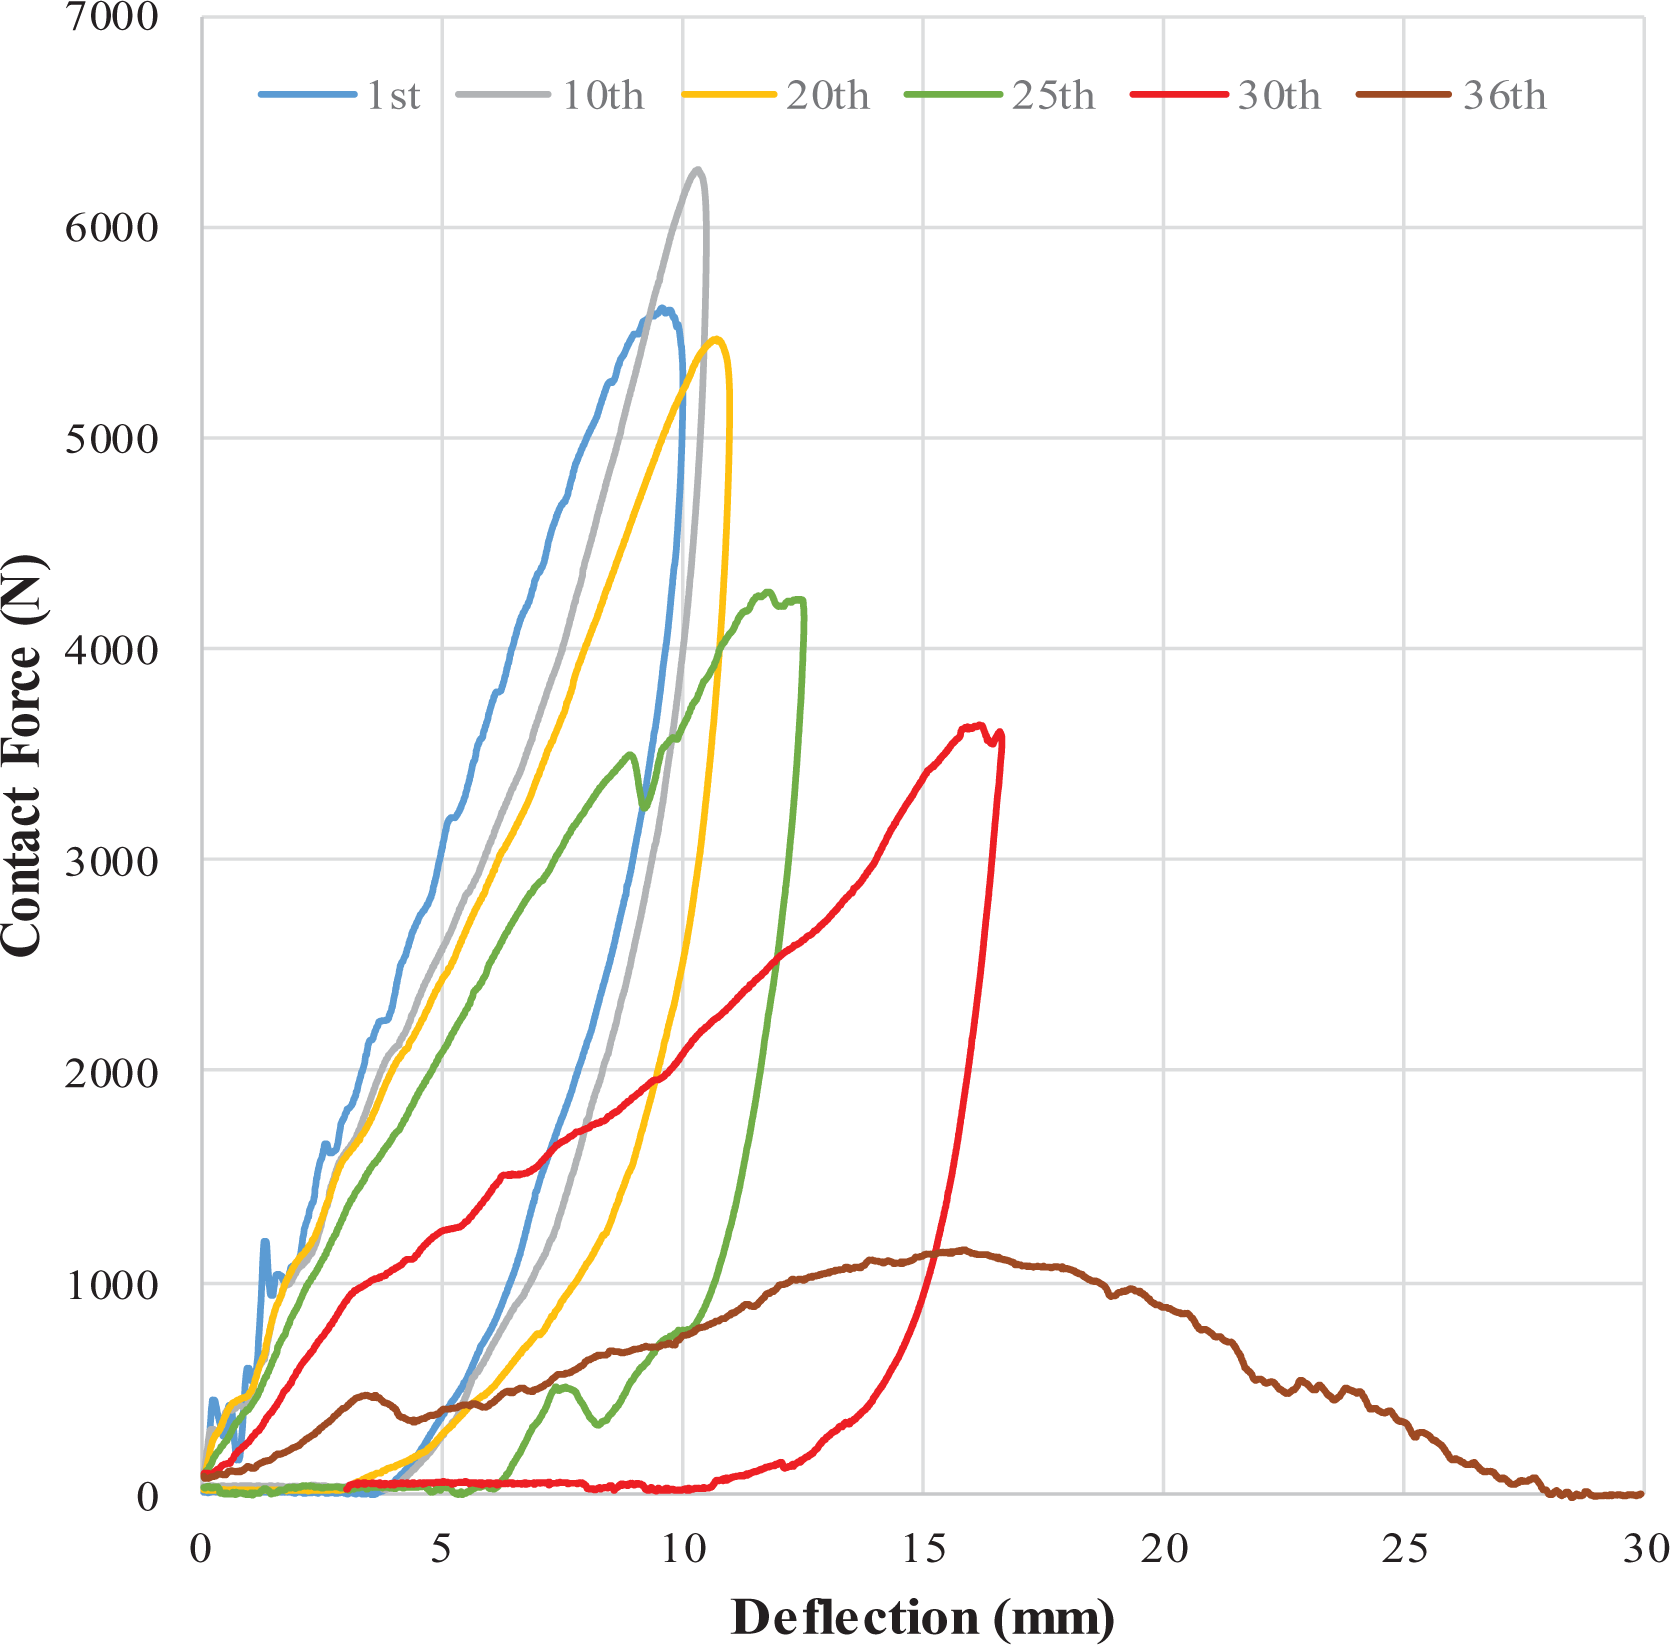
Force–deflection curves of TP1 sample for various impact numbers and hemispherical impactor.
Force–deflection curves of TP2 sample for various impact numbers and hemispherical impactor.
Force–deflection curves of TS sample for various impact numbers and hemispherical impactor.
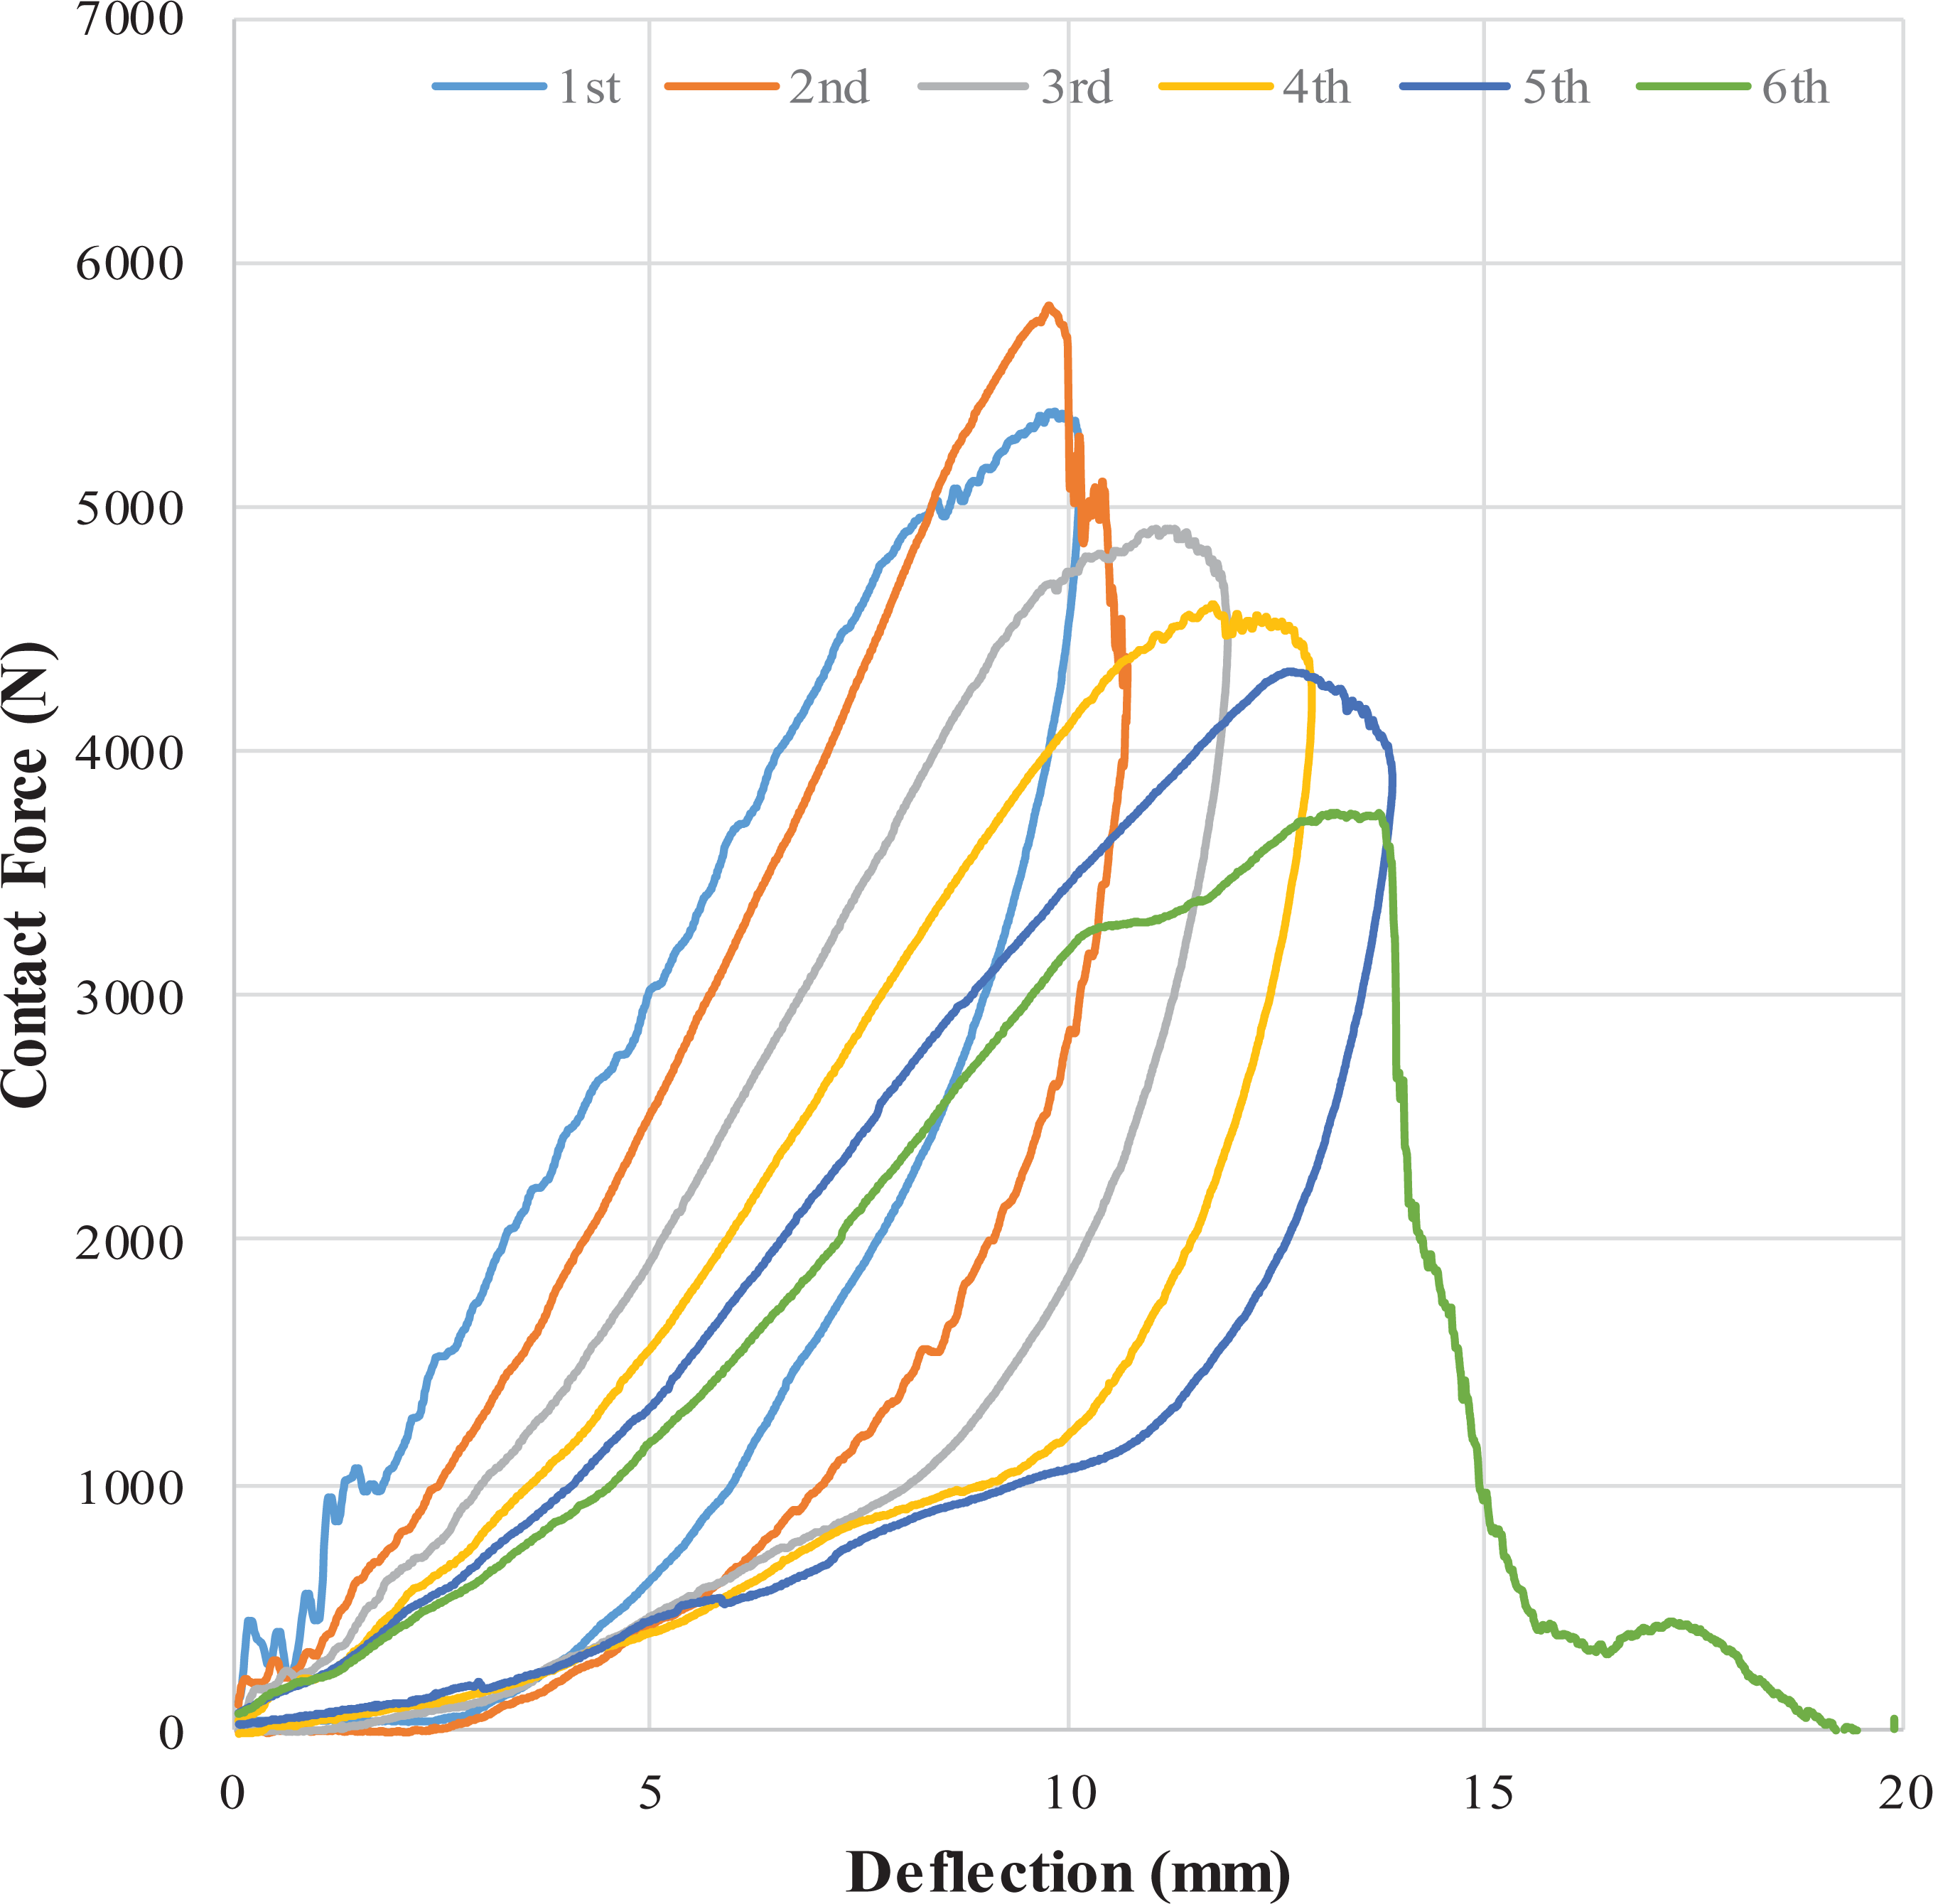
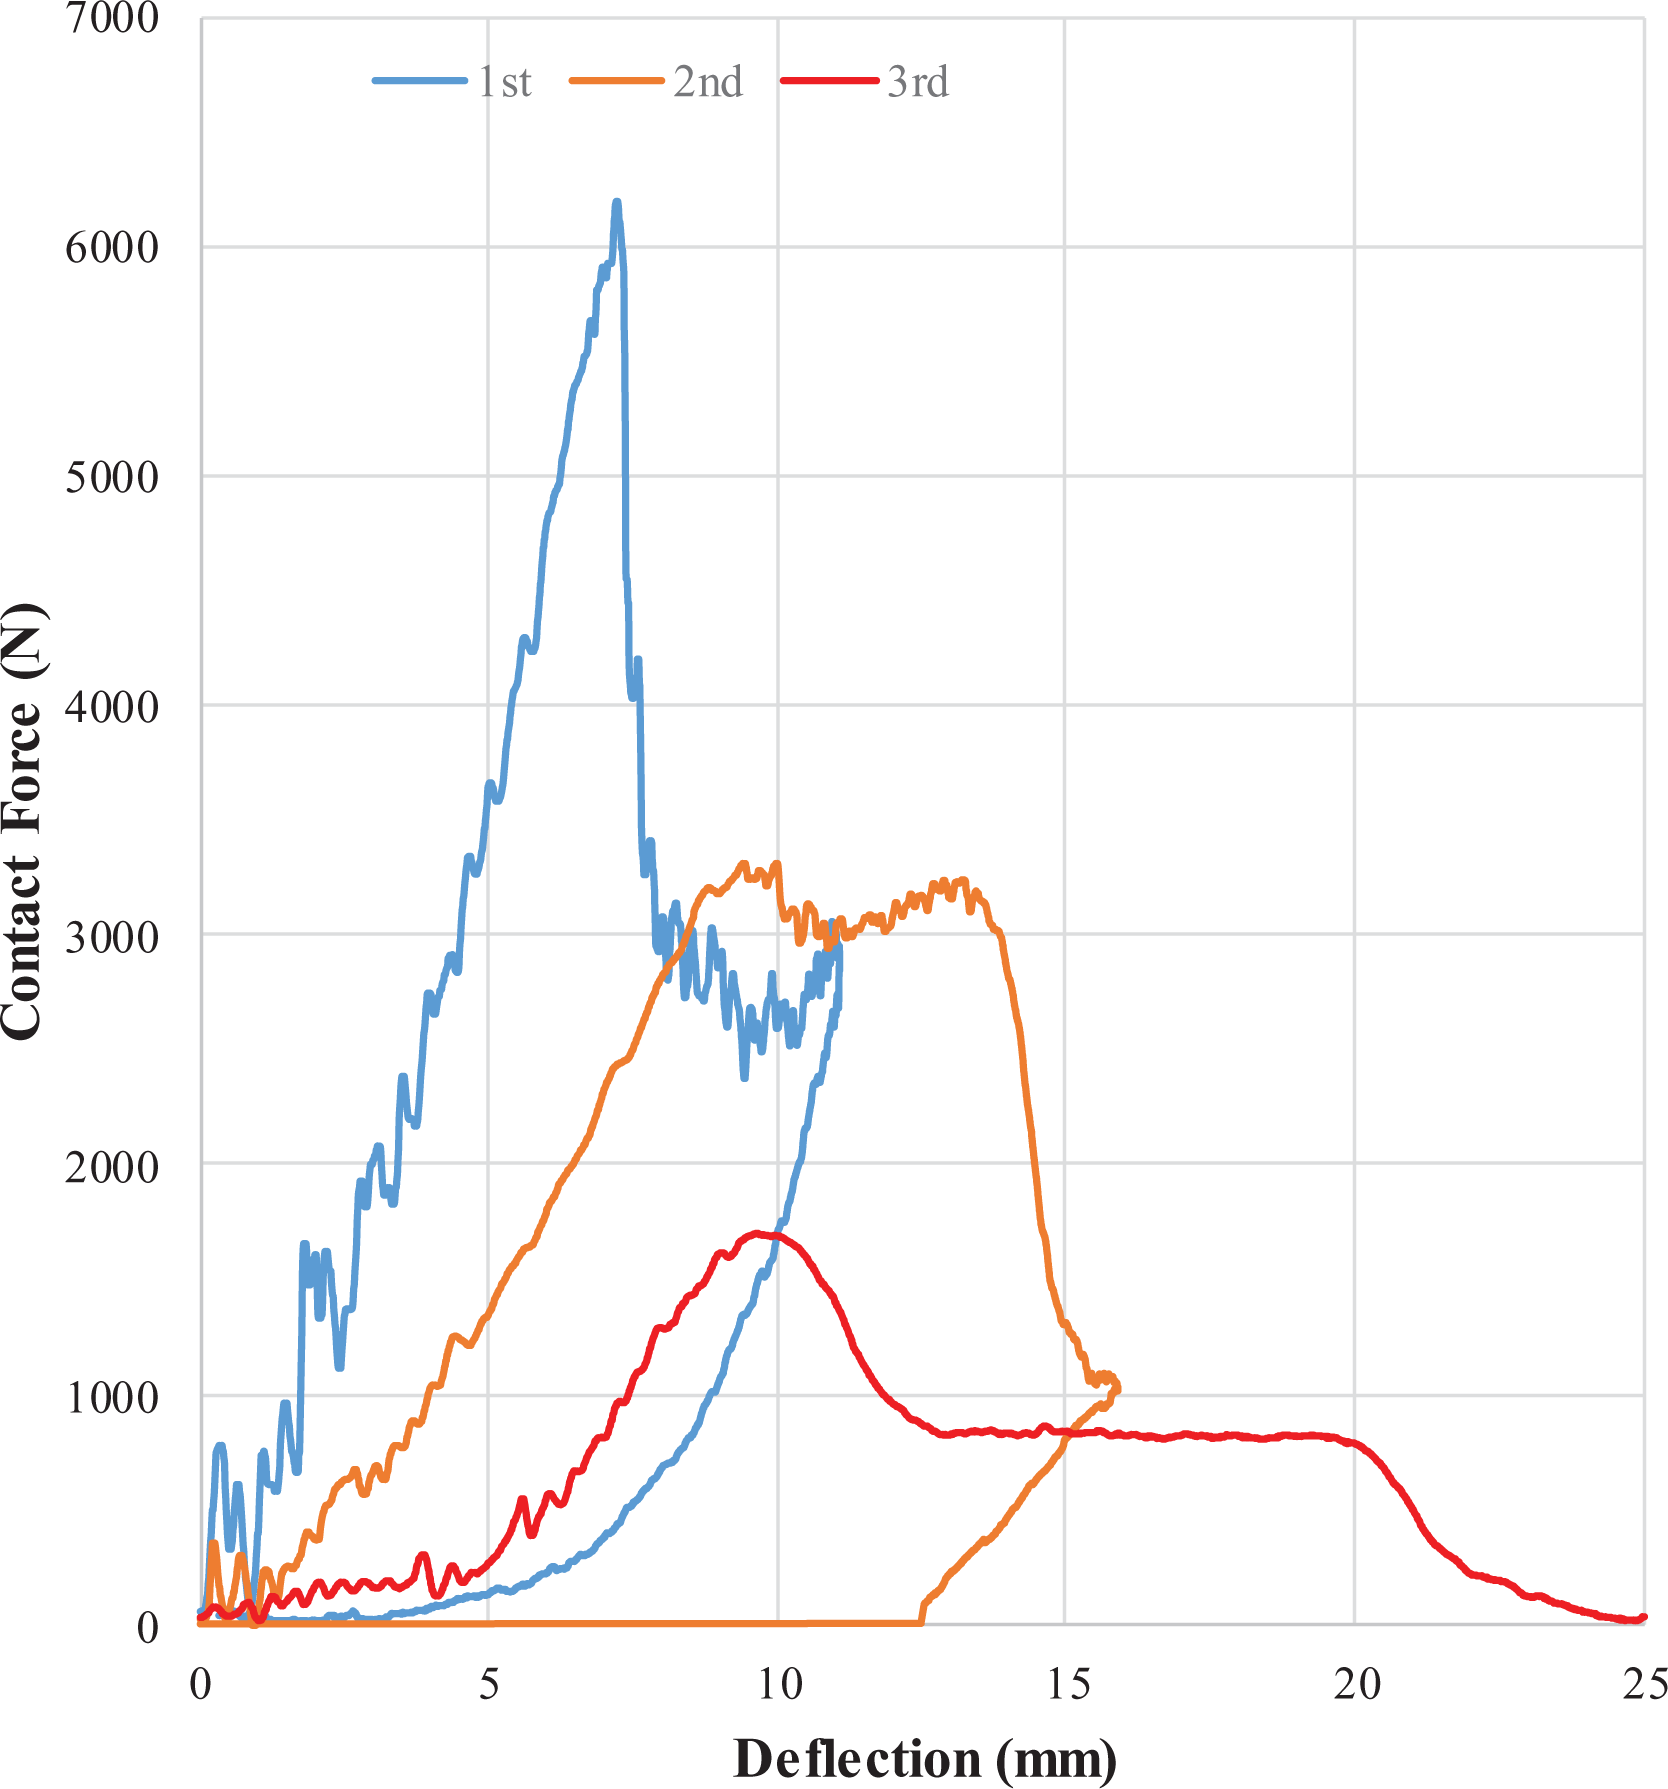
In Figures 12 to 14, the contact force–deflection curves of repeated impact events with conical impactor are shown. The repeat number of impact caused perforation for TP1, TP2, and TS is 3, 2, and 3, respectively. It is seen that the repeat number until perforation decreases dramatically due to impactor shape, especially in TP1 materials. In addition, in the initial impact numbers for the HS impactor, the contact force reduced in TS materials but it increased for TP1 and TP2.
Force–deflection curves of TP1 sample for various impact numbers and conical impactor.
Force–deflection curves of TP2 sample for various impact numbers and conical impactor.
Force–deflection curves of TS sample for various impact numbers and conical impactor.
Variations of the impact characteristics such as absorbed energy and maximum contact force for successive impacts at 30 J until perforation of the samples are shown in Figures 15 and 16. It is seen from Figure 15 that for all materials the amount of absorbed energy increases for HS impactor. Along with slight matrix cracks, it was observed that the dominant damage mode was indentation for the first impact. After a certain repeat number, fiber fractures take place resulting in dramatic increases in the curves. And finally, for the last impacts of all composites, it is seen that the amount of impact energy (30 J) is absorbed completely via the perforation of the samples. Opposite to absorbed energy, the contact force firstly increases and after reduces with impact number for HS impactor. However, the contact force decreases continuously with impact number for conical impactor.
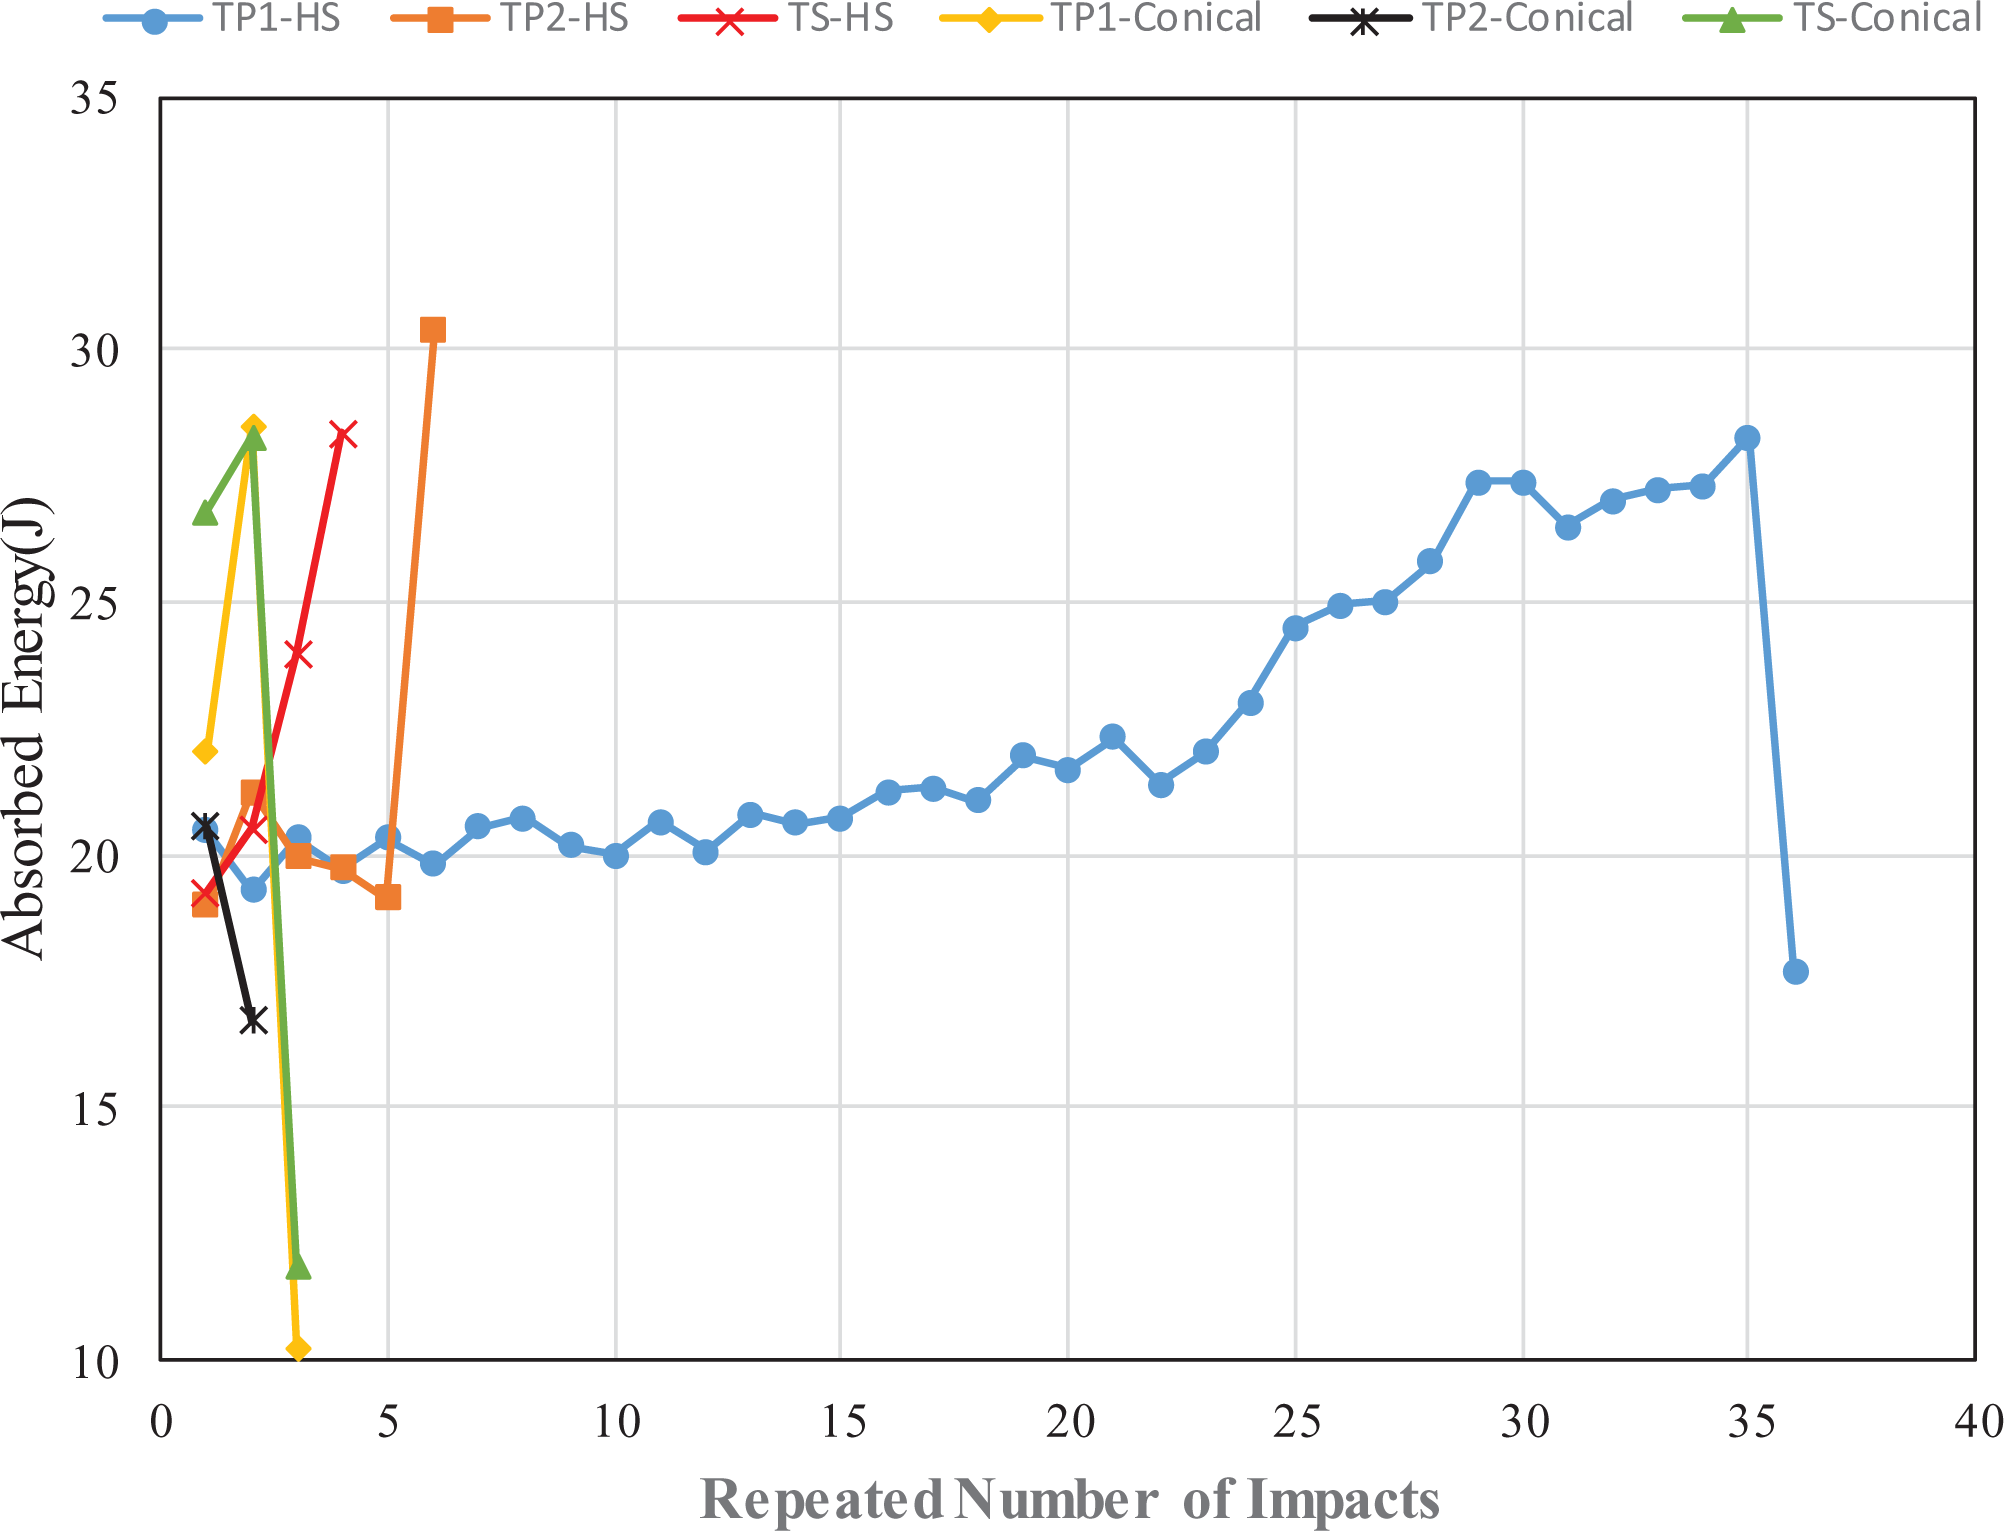
Variation of absorbed energy versus successive impacts for 30 J.
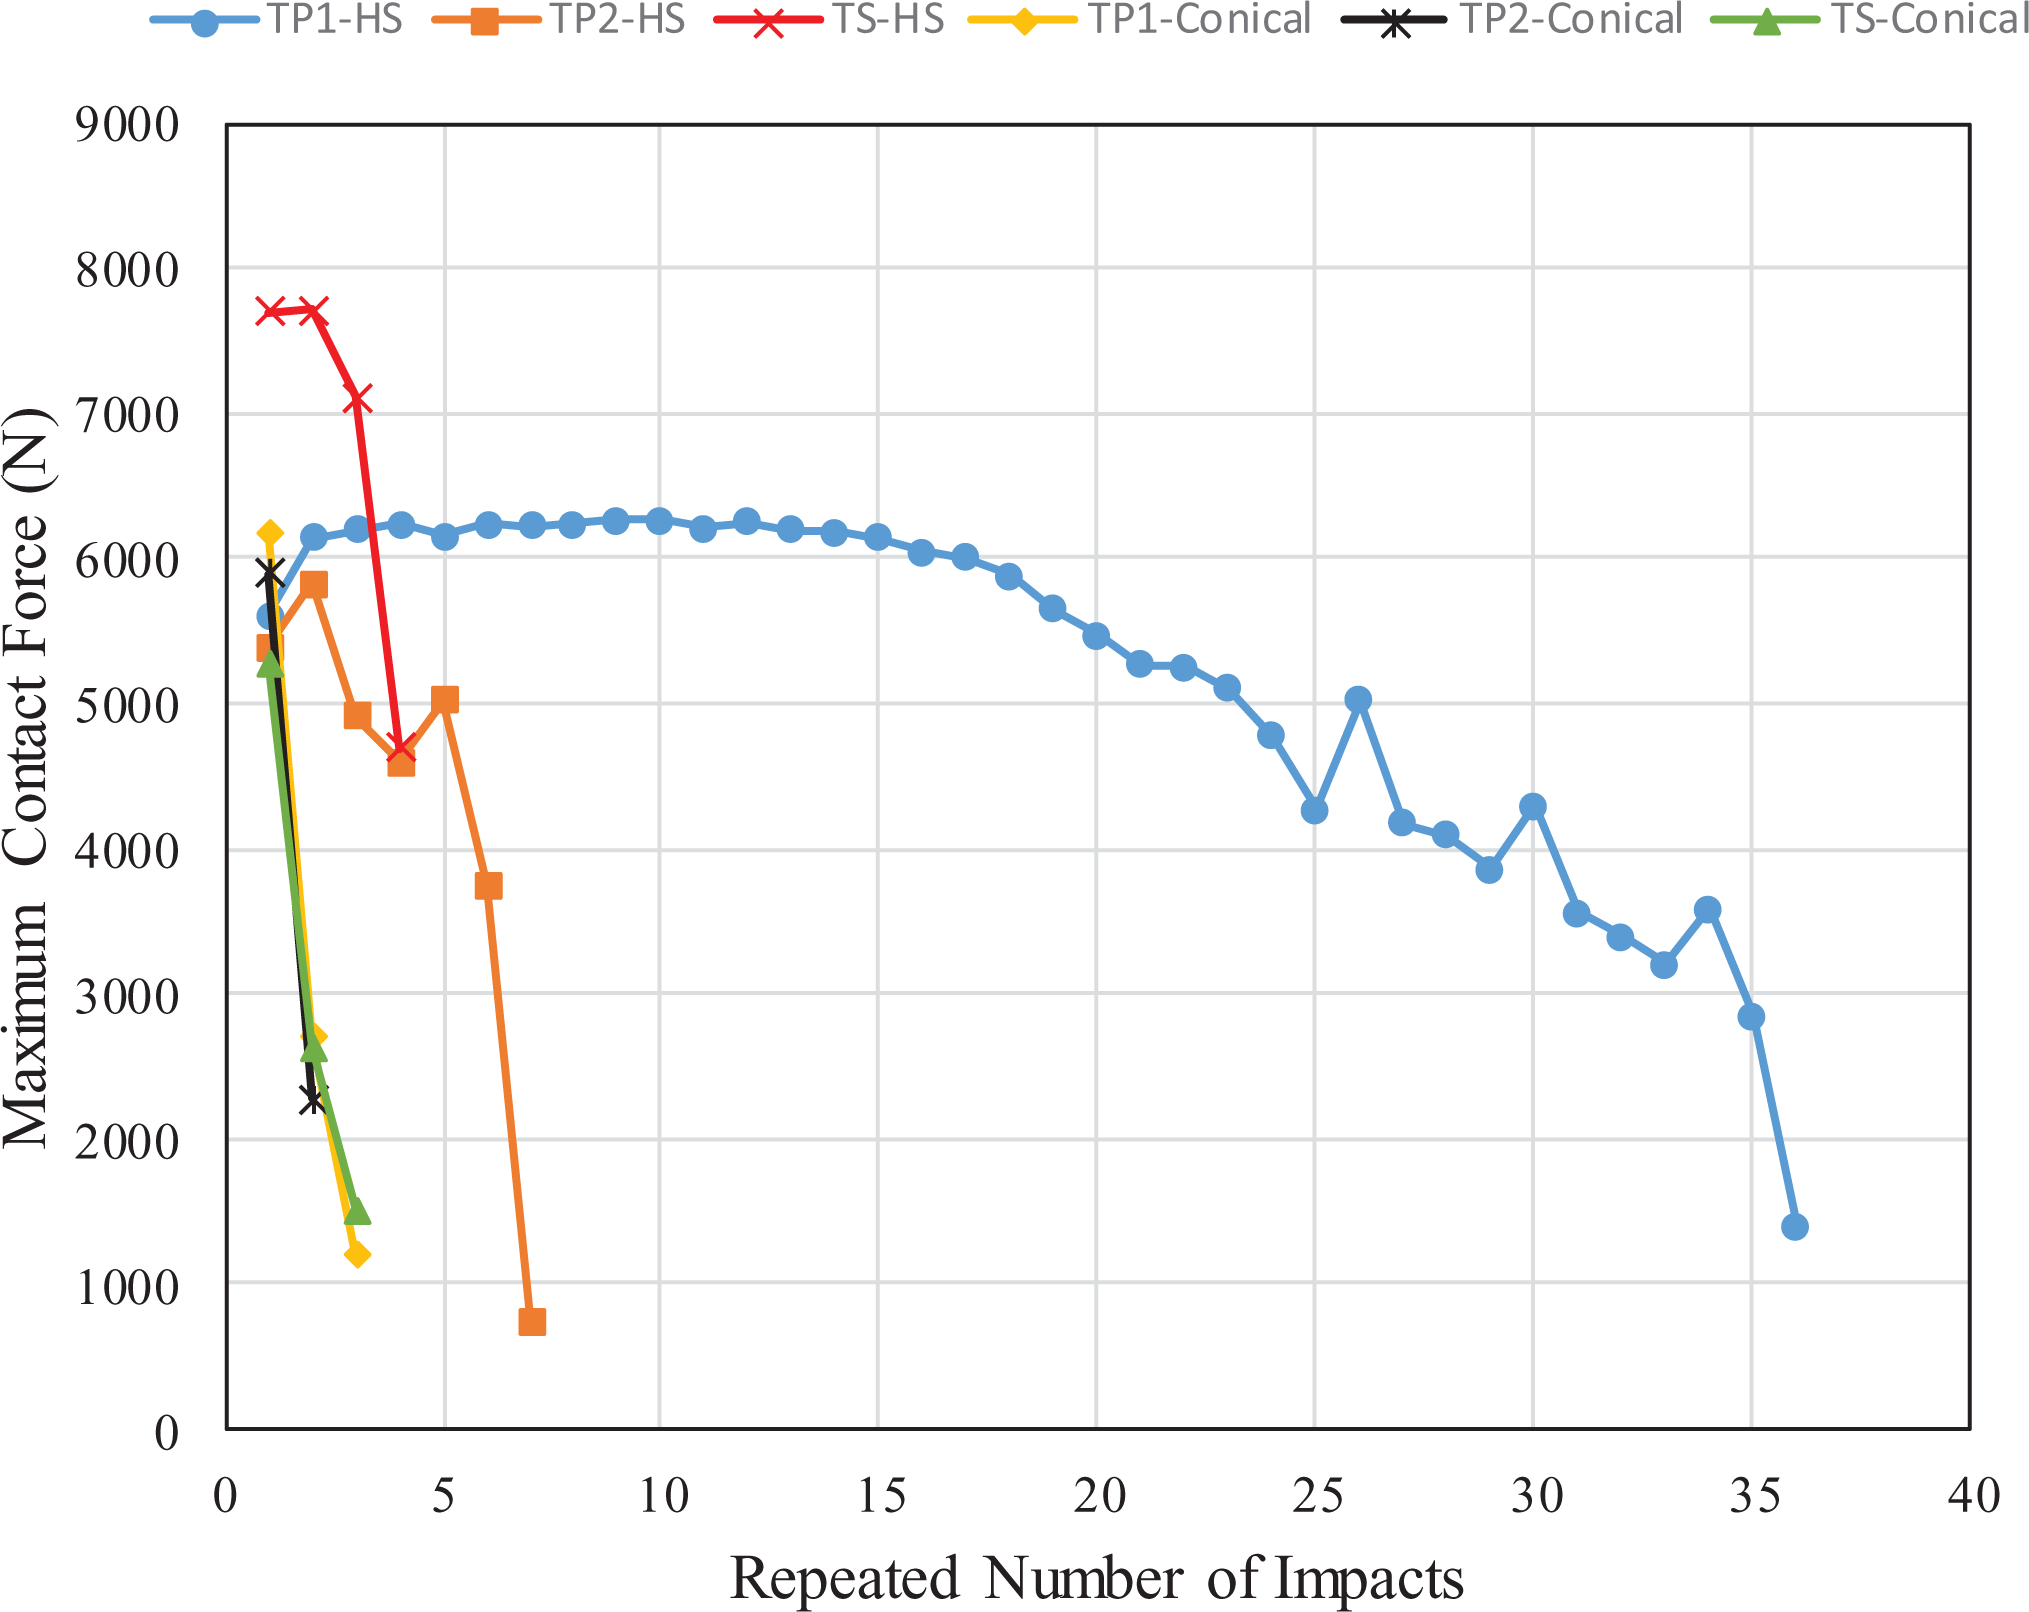
Variation of contact force versus successive impacts for 30 J.
Conclusion
The effect of matrix type on the impact response of composite materials is discussed in the present study. Damage resistance of the samples for both single and repeated impact cases is examined. The results obtained are given here briefly. The perforation threshold of materials significantly was affected by the impactor shape. Especially, the repeated impact number caused perforation to dramatically decrease in the TP composite materials. The TP composite materials have a better LVI resistance than TS composite materials. Although having the same thickness, it was observed that the perforation threshold of the composite material having a high volumetric ratio of fiber was about 42% higher. The maximum peak force was obtained from the TS composite. For the same impact energies, the maximum contact force decreased with a conical impactor for TP and TS materials. The TS composites have higher impact bending stiffness than TP composites. The tensile strength of TS composites is higher than TP composites in both principal directions.