
Abstract
Linear low-density polyethylene (LLDPE) incorporated with single-walled carbon nanotubes (SWCNTs) by mistreatment casting technique. The result of various weight percentage loadings of SWCNTs on the swelling and electrical properties of LLDPE/SWCNTs nanocomposite also γ-irradiation effects had been investigated. It was found that, at low concentration, it uniformly disperses into an LLDPE matrix and provides LLDPE/SWCNTs nanocomposites with abundant improved electrical properties by nine orders of magnitude. Positive temperature coefficient of conductivity (PTCC)/negative temperature coefficient of conductivity (NTCC) was affected by the SWCNT contents. Transmission electron microscopy and scanning electron microscope techniques were used to investigate the dispersion of SWCNTs in the LLDPE matrix. Linear exceptional modification within direct current electrical conduction of percolative threshold-loaded LLDPE as a perform of γ-irradiation dose will be used as a nontoxic, easy, inexpensive, and sensitive method to evaluate the irradiation dose in range 10 Gy–1 kGy also can be used in fabrication of firing sensors with various ranges of temperatures.
Keywords
Introduction
Polymers play a tremendous role in the life of modern society. One of the major trends in the development of the world’s economy is the growth in the production and use of polymers. It is difficult to imagine a branch of industry and transport, culture and consumers’ goods production, agriculture and medicine, the defense industry, and astronauts where it would be possible to do without polymers—absolutely novel materials with previously unknown properties. This relates to polymers such as polyethylene (PE), polypropylene, phenolic plastics, natural and synthetic rubber, poly (vinyl chloride), polystyrene, and polyesters. The economical effectiveness of their production and application is also improving.1–3
PE is one of the most often used polymers. It can be formed even at room temperature, large reversible (or recoverable) deformations. It has good toughness and stability over a wide temperature range. The density of this polymer varies from 0.852 g m−3, (completely amorphous sample) to 1 g m−3 (fully crystalline sample). 4 The electric properties of PE are outstandingly good; therefore, it has filled a long-standing need for a material which would effectively insulate electrical cables without introducing electrical losses at high frequencies, and its chemical inertness, lightweight, and low cost are advantages. 5
The study of composite materials is an intriguing area of materials science because composite often exhibits physical properties that are unlike those of their component materials.6,7 Carbon polymer composites are a good example. Composites made with carbon nanotube (CNT),8–11 long used for elastomer reinforcement, have recently replaced metals in several industrial applications. Understanding the physical properties of the composite on a microscopic, quantum mechanical level is the key to exploiting the usefulness of this material.12–14
Moreover, the interaction of polymers with macromolecular liquids, resulting in swelling and dissolving of the polymers, is of great practical importance both for processing polymers and during service of articles made from them. For example, many of the synthetic fibers and films are produced from solutions. The process of plasticizing, used in the fabrication of articles from polymeric materials, is based on swelling of polymers in plasticizers. Lacquers and adhesives are polymer solutions. In all the mentioned cases, it is very important for the polymers to swell and dissolve well in low-molecular mass liquids.15–21
Also modification by high-energy ionizing radiation (electron beam, X-ray, and γ-ray) has attracted considerable interest in the last few years 22 resulting in an improvement in some physical properties and deterioration in others. 23 Controlled cross-linking may lead in some cases to beneficial changes, but radiation degradation always causes a steady decrease in most of the valuable properties of polymers. Therefore, degradation is usually unwanted in radiation processing of polymers. Research has been done to study how to avoid chain scission while cross-linking, based for example on enhanced cross-linking 24 and protective effects,25,26 but little is known on how to change the radiation effects of a polymer from degradation to cross-linking. 27 The cross-linking of PE contains additives to improve insulating properties, to induce flame and chemical resistance, to increase water impregnability, and to make tapes and tubings that are heat shrinkable. Accordingly, this has opened up the possibility of commercial dosimetry, packaging medical purposes, coatings, and sterilization.28,29
The inert additive or fillers such as CNT, silica, glass fiber, cellulose fiber, tale, asbestos, and wood floor play a part in radiation effects simply by making up a portion of the mass in which the radiation energy is deposited. Since such materials serve both as reinforcing agents and as economical extenders, they are frequently encountered in commercial items. 30
For all polymers, the pulse radiation-induced conductivity is proportional to the dose rate. The conductivity (σ) increases with increasing dose rate (Φ) up to a limiting value related to the dose rate. The electrical properties of PE are affected significantly by radiation-induced cross-linking. The cross-linked polymer retains its high specific resistance at high temperature, which is one of the reasons for the wide spread use of cross-linked polyethylene as an insulator. Beside the change in electric conductivity, there is the change in dielectric constant and dielectric loss with irradiation. The changes are noticed in the study of radiation damage in electronic component 31 and other studies of radiation effect on dielectric properties of some polymer. 27
Irradiated samples of high-density polyethylene (HDPE) by 60Co gamma source had been studied by Mateev and Karageorgiev 19 in the interval dose (0–20 Mrad) and found that the γ-irradiation leads to radiation-induced cross-linking in the inter-crystalline amorphous regions and to fixing of the structural elements, which take part in the super structural molecular organization, but without changing their structure and structural dynamics. Electron-beams, γ-rays, and other forms of high-energy radiation predominantly undergo cross-linking to PE when irradiated with them, 32 which considered an important phenomenon in polymer. It permits a thermoplastic polymer-like PE to exhibit a viscoelastic behavior, characteristic of an elastomer, at temperatures on top of the crystalline melting point of the thermoplastic. This valuable property is wide exploited commercially within the preparation of heat shrinkable materials. 33
Kumar and Pandya 34 found that when γ-radiated PE undergoes cross-linking and increases the gel fraction by dose increasing. HDPE shows a higher gel fraction as compared to the LDPE. The result of γ-irradiation on each electrical conductivity physical phenomenon and therefore the penetration rate of benzene in synthetic resin (LDPE)/styrene butadiene rubber (SBR) conductive blends are studied. 35 They found that the diffusion coefficient (D) and therefore the penetration rate (P) decrease with increasing γ-irradiation dose for blank and loaded samples with 1 and 3 wt% of LDPE content, presumptively due to cross-linking and polymer chain immobilization within the interfacial regions.
Swelling property in suitable low-molecular-weight liquids is 1, which is possessed by a wide range of high polymer, both natural and synthetic. In many respects, this property is akin to solution, and, as in the case of solution, it is markedly dependent on the nature of the swelling liquid. Just as materials may be divided in respect of solubility into those which are soluble in water (hydrophilic) and those which are soluble inorganic—for example, hydrocarbon—solvents (hydrophobic), polymers may similarly be divided in respect of swelling into water swelling and the organic-liquid-swelling classes. The first class includes cellulose (cotton, wood, etc.) and proteins (gelatin, wool, silk, etc.), while the dominant group in the second class consists of rubbers both natural and synthetic.36,37
From the preceding survey, one could conclude that, by lower loading filler, polymer nanocomposites show superior properties and have attracted additional and more attention due to their several blessings such as flexible features, easy processing, and lightweight,38–41 particularly polymers/CNTs nanocomposites.42–45 Polymers/CNTs nanocomposites might use for the event of advanced multifunction materials, thanks to physicochemical properties, their high aspect ratio, and intensely large surface areas, along with the necessity for only small volume fractions to get desired properties46–49
It is well-known that CNTs will exist within the type of single-walled carbon nanotubes (SWCNTs) and multi-walled carbon nanotubes (MWCNTs). CNT-polymer compositions are attention-grabbing as conductive materials and are investigated by several authors.49,50 These materials are used for varied purposes, like the electrical shielding and prevention of accumulation of static electricity51–53 heating.
The percolation theory, that conserves the discovered similarities of the transport properties of heterogeneous media for the varied sorts of heterogeneousness, is a method to elucidate the problem of modeling such a controversy. Moreover, irradiation of γ-rays within the dose that varies from 10 Gy to 10 kGy is widely used for insect control, seed and vegetable sprouting inhibition, packaging medical purposes, coatings, and sterilization. So, several specific radiation applications have become commercially successful. Therefore, the aim of this investigation is to study the effect of SWCNT concentration on the electrical properties in addition as swelling characteristics of linear low-density polyethylene (LLDPE) and using the percolation theory to determine the percolation threshold of this filler in LLDPE matrix. The effect of γ-irradiation on the electrical properties and swelling behavior of the percolated threshold sample can study and apply the results in the radiation dosimeters.
Experimental
Materials and preparation of LLDPE/SWNTs nanocomposites
SWCNTs were supplied by Sigma Aldrich, with carbon basis ≥90%, D × L 1.3 nm × 1 µm bundle dimensions. LLDPE (melt flow index (MFI) at 190°C and 2.16 kg = 2.6 g/10 min, Mn = 27,000 g mol−1, density = 0.918 g cm−3 at 25°C) was supplied also by Sigma Aldrich, Germany in the form of pellets; 200 mg/10 ml LLDPE at 85°C were dissolved in dichlorobenzene (DCB). SWNTs were poured in LLDPE solution using an ultrasonic bath sonicator for 48 h. After sonication, the mixture was cooled to crystallize the SWCNTs/LLDPE. The resulting SWCNTs-LLDPE dried in vacuum at 150°C and prepared with 0.01, 0.02, 0.025, 0.03, 0.035, 0.04, 0.05, 0.06, 0.07, 0.08 wt% SWCNTs in LDPE. The dimension between 0.1 cm and 0.15 cm thick and 1.0 cm in diameter was observed.
Measurements
DC conductivity measurements
The direct current (DC)-conductivity of LLDPE/SWNTs nanocomposites is measured using the Keithley Model 485 electrometer, Germany. It measures the current between 10−10 A and 10−1 A after applying the voltage. The instrument measures resistance via two-probe technique, and the conductivity was calculated and connected with the heated chamber and temperature controller to increase the temperature of the samples, all system is attached to the computer.
AC conductivity measurements
The dielectric properties were measured using a bridge (LCR-821; Instek LCR meter, Hioki, Japan). The dielectric constant (ε′), dielectric loss (ε″), and loss tangent (tan δ) were recorded under varying temperatures (20–100°C) and frequency ranging from 102 Hz to 106 MHz.
Swelling measurements
The LLDPE/SWCNTs samples had the form of discs were immersed in 30 ml of different solvents. The swelling tests were carried out in stoppered glass bottles placed in an electric oven at 25°C containing solvent with certain cohesive energy density (CED) at room temperature. The samples were removed from the solvent at time intervals (5, 10, 15, 20,…min). The excess solvent on the surface of the test samples was removed by blotting with filter paper, then weighed using a digital balance, and reimmersed in the solvent until a constant weight was reached.
Solvents
The effect of different solvents on the swelling phenomenon of LLDPE/SWCNTs has been studied and was chosen to be different in their physical and chemical properties as presented in Table 1.
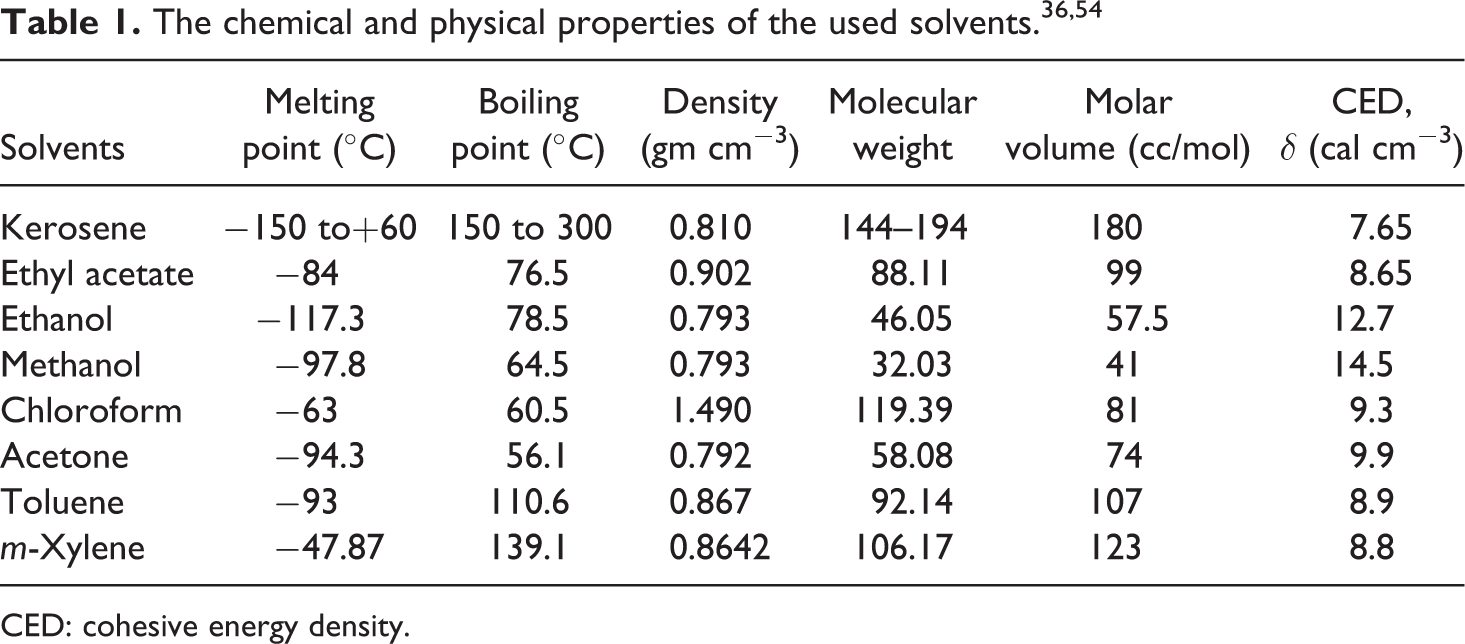
CED: cohesive energy density.
Irradiation facility
The composite samples of LLDPE/SWCNTs were exposed to Co60 γ-rays at a dose rate of 1.24 kGy h−1 and at a temperature of 25°C with doses from 400 Gy up to 20 kGy.
Characterizations
High-resolution TEM
The morphology of 0.025 SWCNTs/LLDPE matrix was analyzed using a transmission electron microscope (model JEM 1011; JEOL) operating at 100 kV. Samples were prepared using DCB as the solvent.
Scanning electron microscope
Certain prepared composite was subjected to microstructural characterization using Scanning Electron Microscopy Model Quanta 250 (from FEI Company, the Netherlands) with accelerating voltage 30 kV, magnification 14× up to 1,000,000, and resolution for Gun is 1 n to identify morphology and distribution of SWCNTs in LLDPE matrix.
Results and discussion
Conductive polymers have become more and more vital class of material for a range of applications in the electronics and electrical industries.55–57 In these materials, prepared by incorporating conductive filler in an insulating polymer matrix, the presence of the conductive filler solely offers rise to high electrical conductivity. A transition from insulating to non-insulating behavior is mostly discovered when the volume concentration of the conductive filler within the mixture reaches a threshold and exceeds the percolation.
SWCNT filler is recognized as a reinforcing agent can have a substantial and somewhat unpredictable result on absorption and diffusion of solvents through the composite.
Polymer–filler interaction
The extent of polymer–filler interaction is estimated from the swelling experiment using a plot of Vpolymer/Vcomposite versus c/(1 − c) according to the Kraus’s equation 58
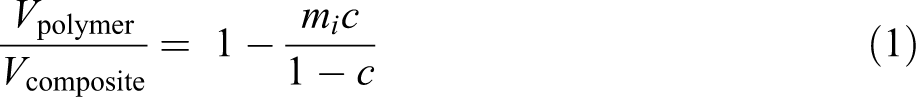
where Vpolymer is the volume fraction of the polymer (LLDPE) in the unfilled composite, Vcomposite is the volume fraction of the filled one, c is the volume fraction of filler (SWCNTs) in the composite, and mi is the polymer–filler interaction parameter obtained from the slope of the Vpolymer/Vcomposite versus c/(1 − c) plot which should be positive for reinforcing filler having a good polymer–filler interaction as clearly observed in Figure 1 with a slope (m) equals to 0.28134. The volume fraction of polymer Vpolymer in the composite was determined using the equilibrium swelling method in kerosene at 25°C and the following equation59,60
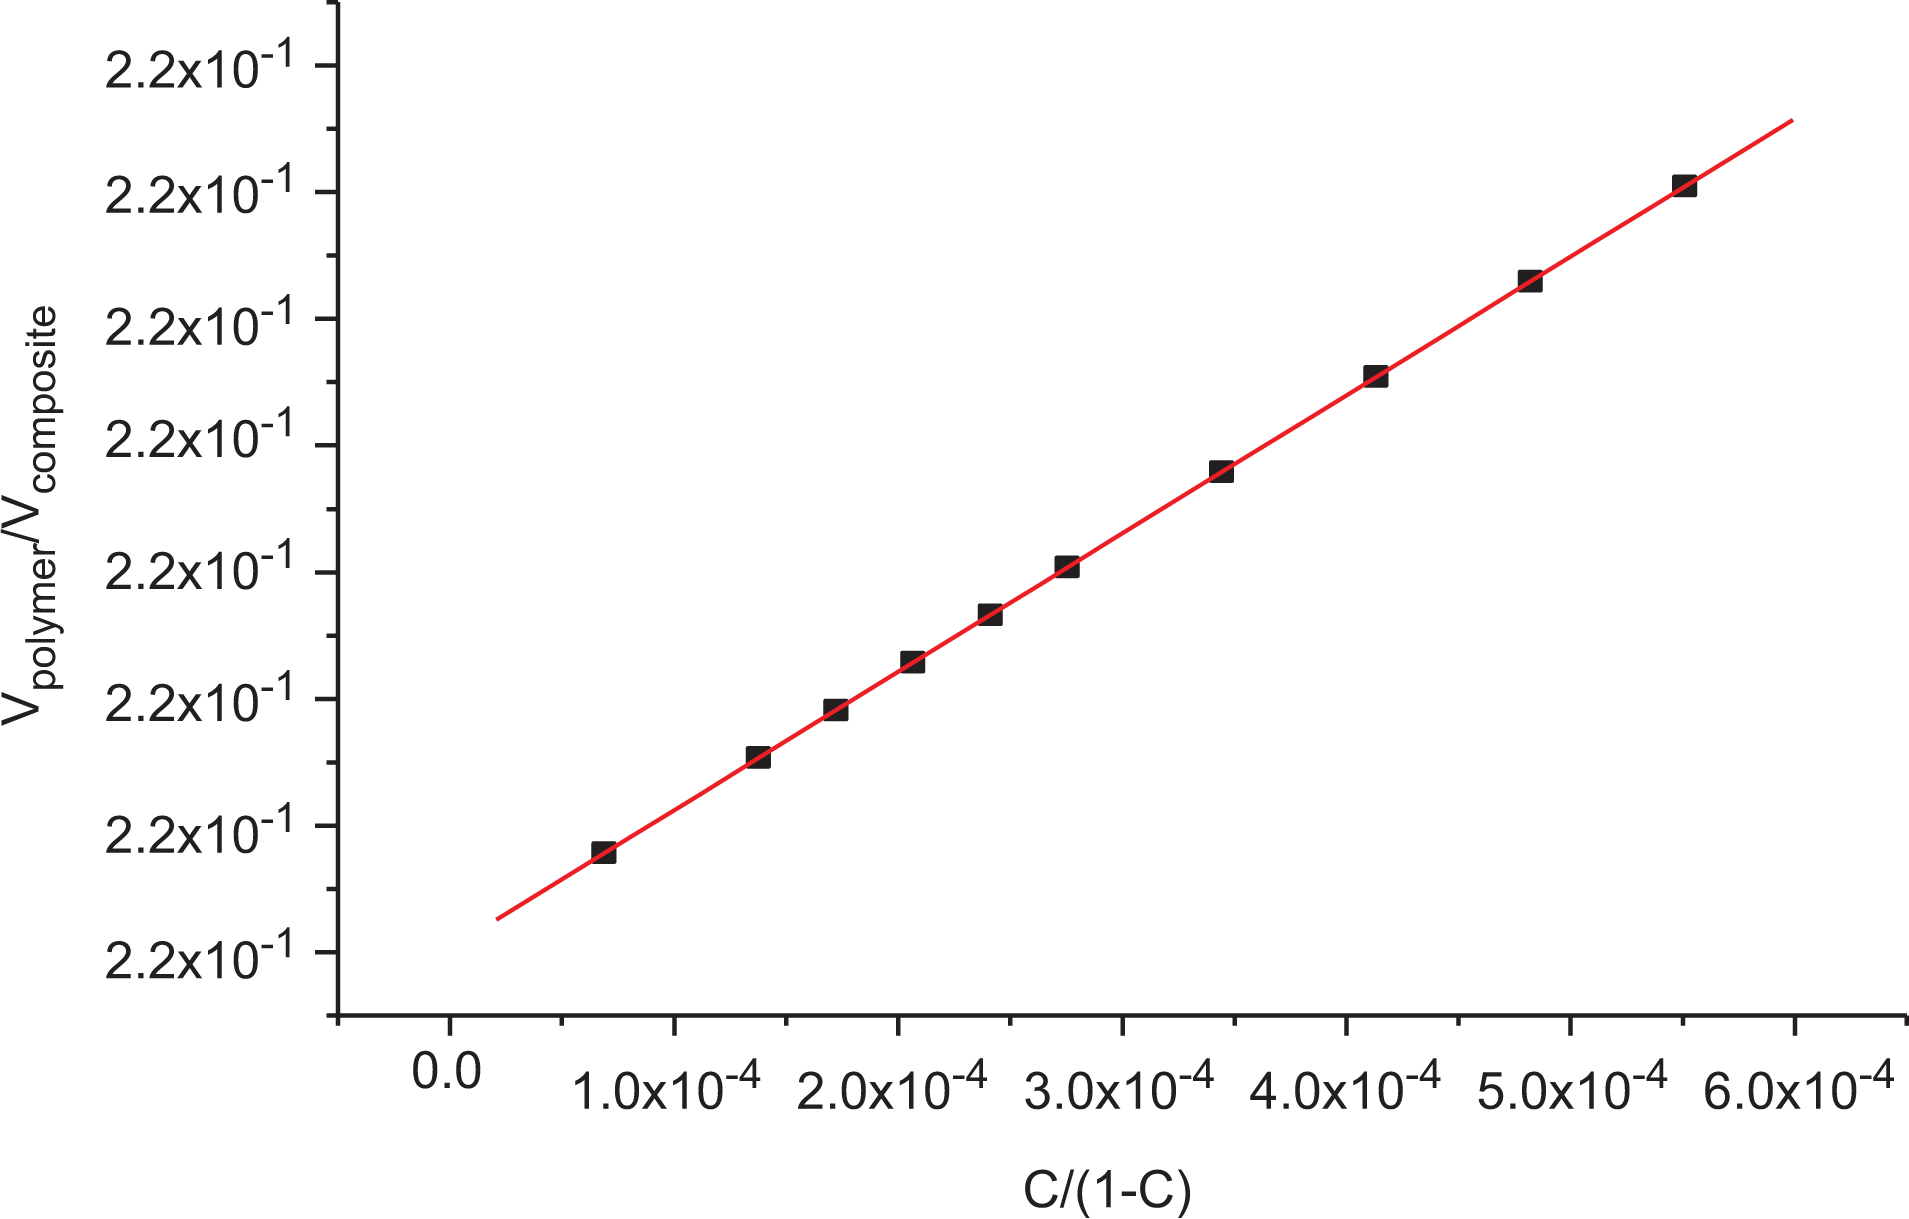
Relation between the Vpolymer/V composite versus c/(1 − c).
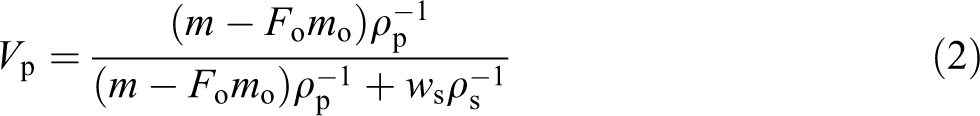
where mo is the weight of the test sample, Fo is the weight fraction of the insoluble components in the sample, m is the deswollen weight of the test sample, Ws is the weight of absorbed solvent, ρ is the density of polymer (0.918 g cm−3), and ρs is the density of kerosene (
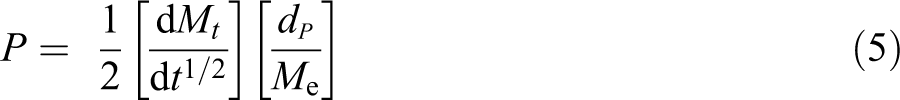
Swelling isotherms were first measured for LLDPE unfilled and filled with different SWCNT contents, with the results shown in Figure 2(a) and (b). The isotherm degree of swelling Q for all samples (in Figure 2) tends to saturate with the increasing time of swelling, suggesting that they may be expressed by Langmuir’s equation 61
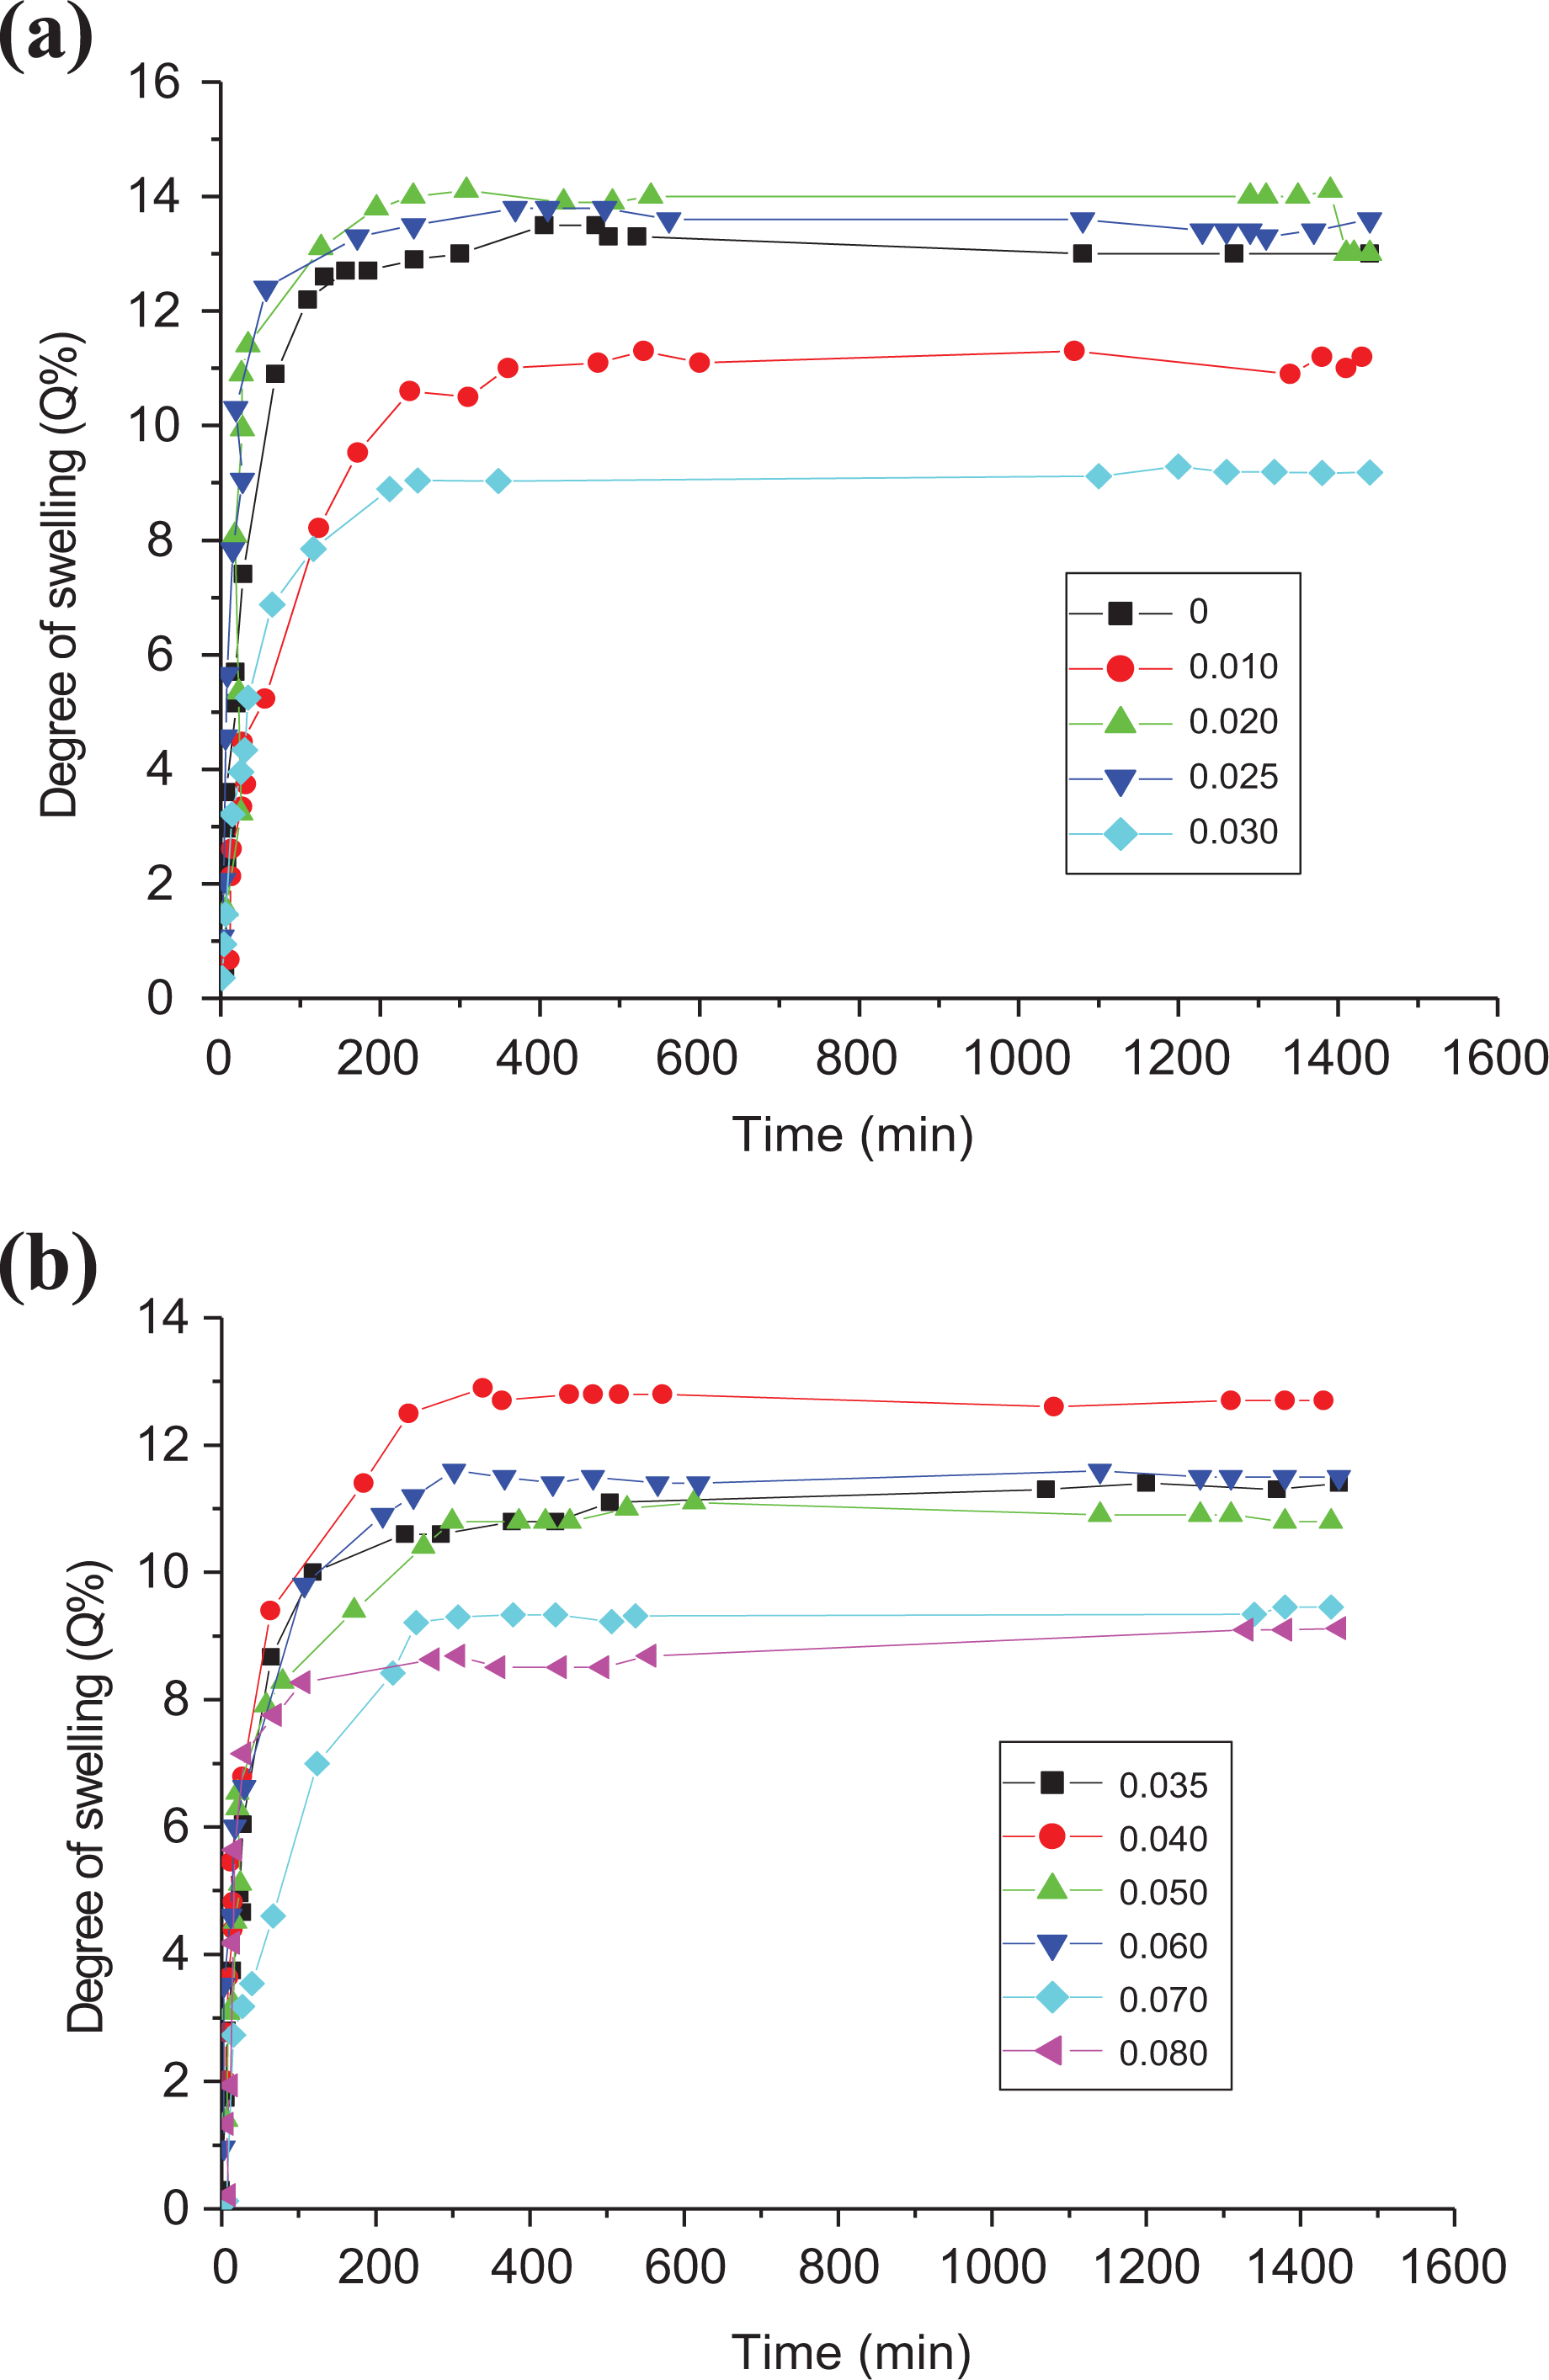
Dependence of the degree of swelling (Q, %) on time of swelling (min) for LLDPE samples with different concentration of SWCNTs in kerosene. 10 prepared samples divided on 3 Figures due to the different regions of measurements.
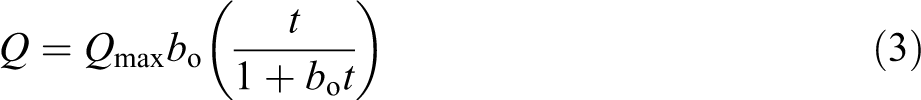
where Q is the degree of swelling at time t, bo is the affinity constant, and Qmax is the maximum degree of swelling. The data in Figure 2 were replotted according to the rearrangement of equation (3)
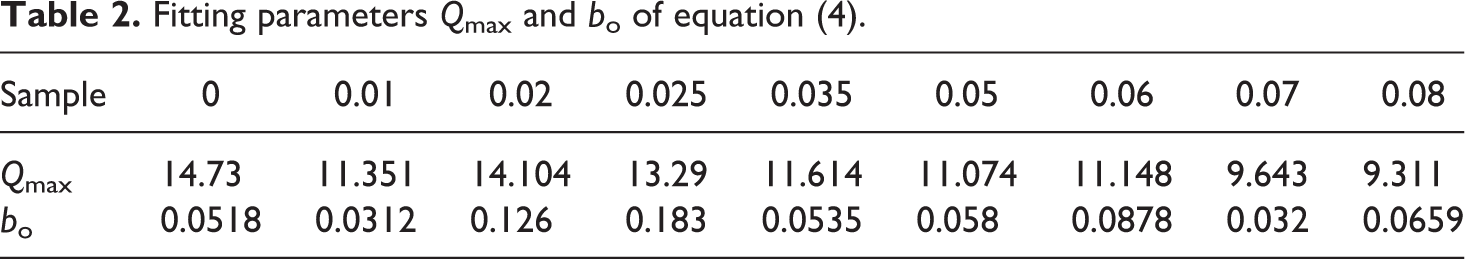
The plots were linear, indicating agreement with equation (4). Qmax and bo were calculated from the slope and the intercept for plots of t/Q versus t as shown in Figure 3(a) and (b). These fitting parameters Qmax and bo are greatly influenced by the SWCNT content as presented in Table 2.
Relation between time/degree of swelling (t/Q) and the swelling time of Langmuir’s equation (10) for all loaded SWCNTs-LLDPE composites in kerosene. 10 prepared samples divided on 3 Figures due to the different regions of measurements.
Fitting parameters Qmax and bo of equation (4).
The swelling of polymer involves a diffusion method by which liquid is transported from one part of the sample to different parts. The diffusion theory for elastomers62,63 relies on the belief that the swelling commences by absorption of liquid within the surface of the sample to a particular concentration adequate that of the whole sample at final equilibrium; then the swelling returns by increasing the depth of the swollen layers at a rate, P,54,64,65 given by
For a polymer sheet of thickness dp, Me and Mt are the weight uptake of liquid at equilibrium and once time t, severally. The slope of the straight lines obtained at the first part of the curves between the percentage increase in weight, thanks to swelling against the root of the time as shown in Figure 4(a) and (b) that represents an example for all samples in minutes, was calculated. The complete penetration curves are similar in character. This slope is equal to Mt/t1/2; and at equilibrium volume swelling, Me values were obtained.
(a) and (b) Percentage weight swelling as a function of square root of time for SWCNTs-LLDPE composites in kerosene.
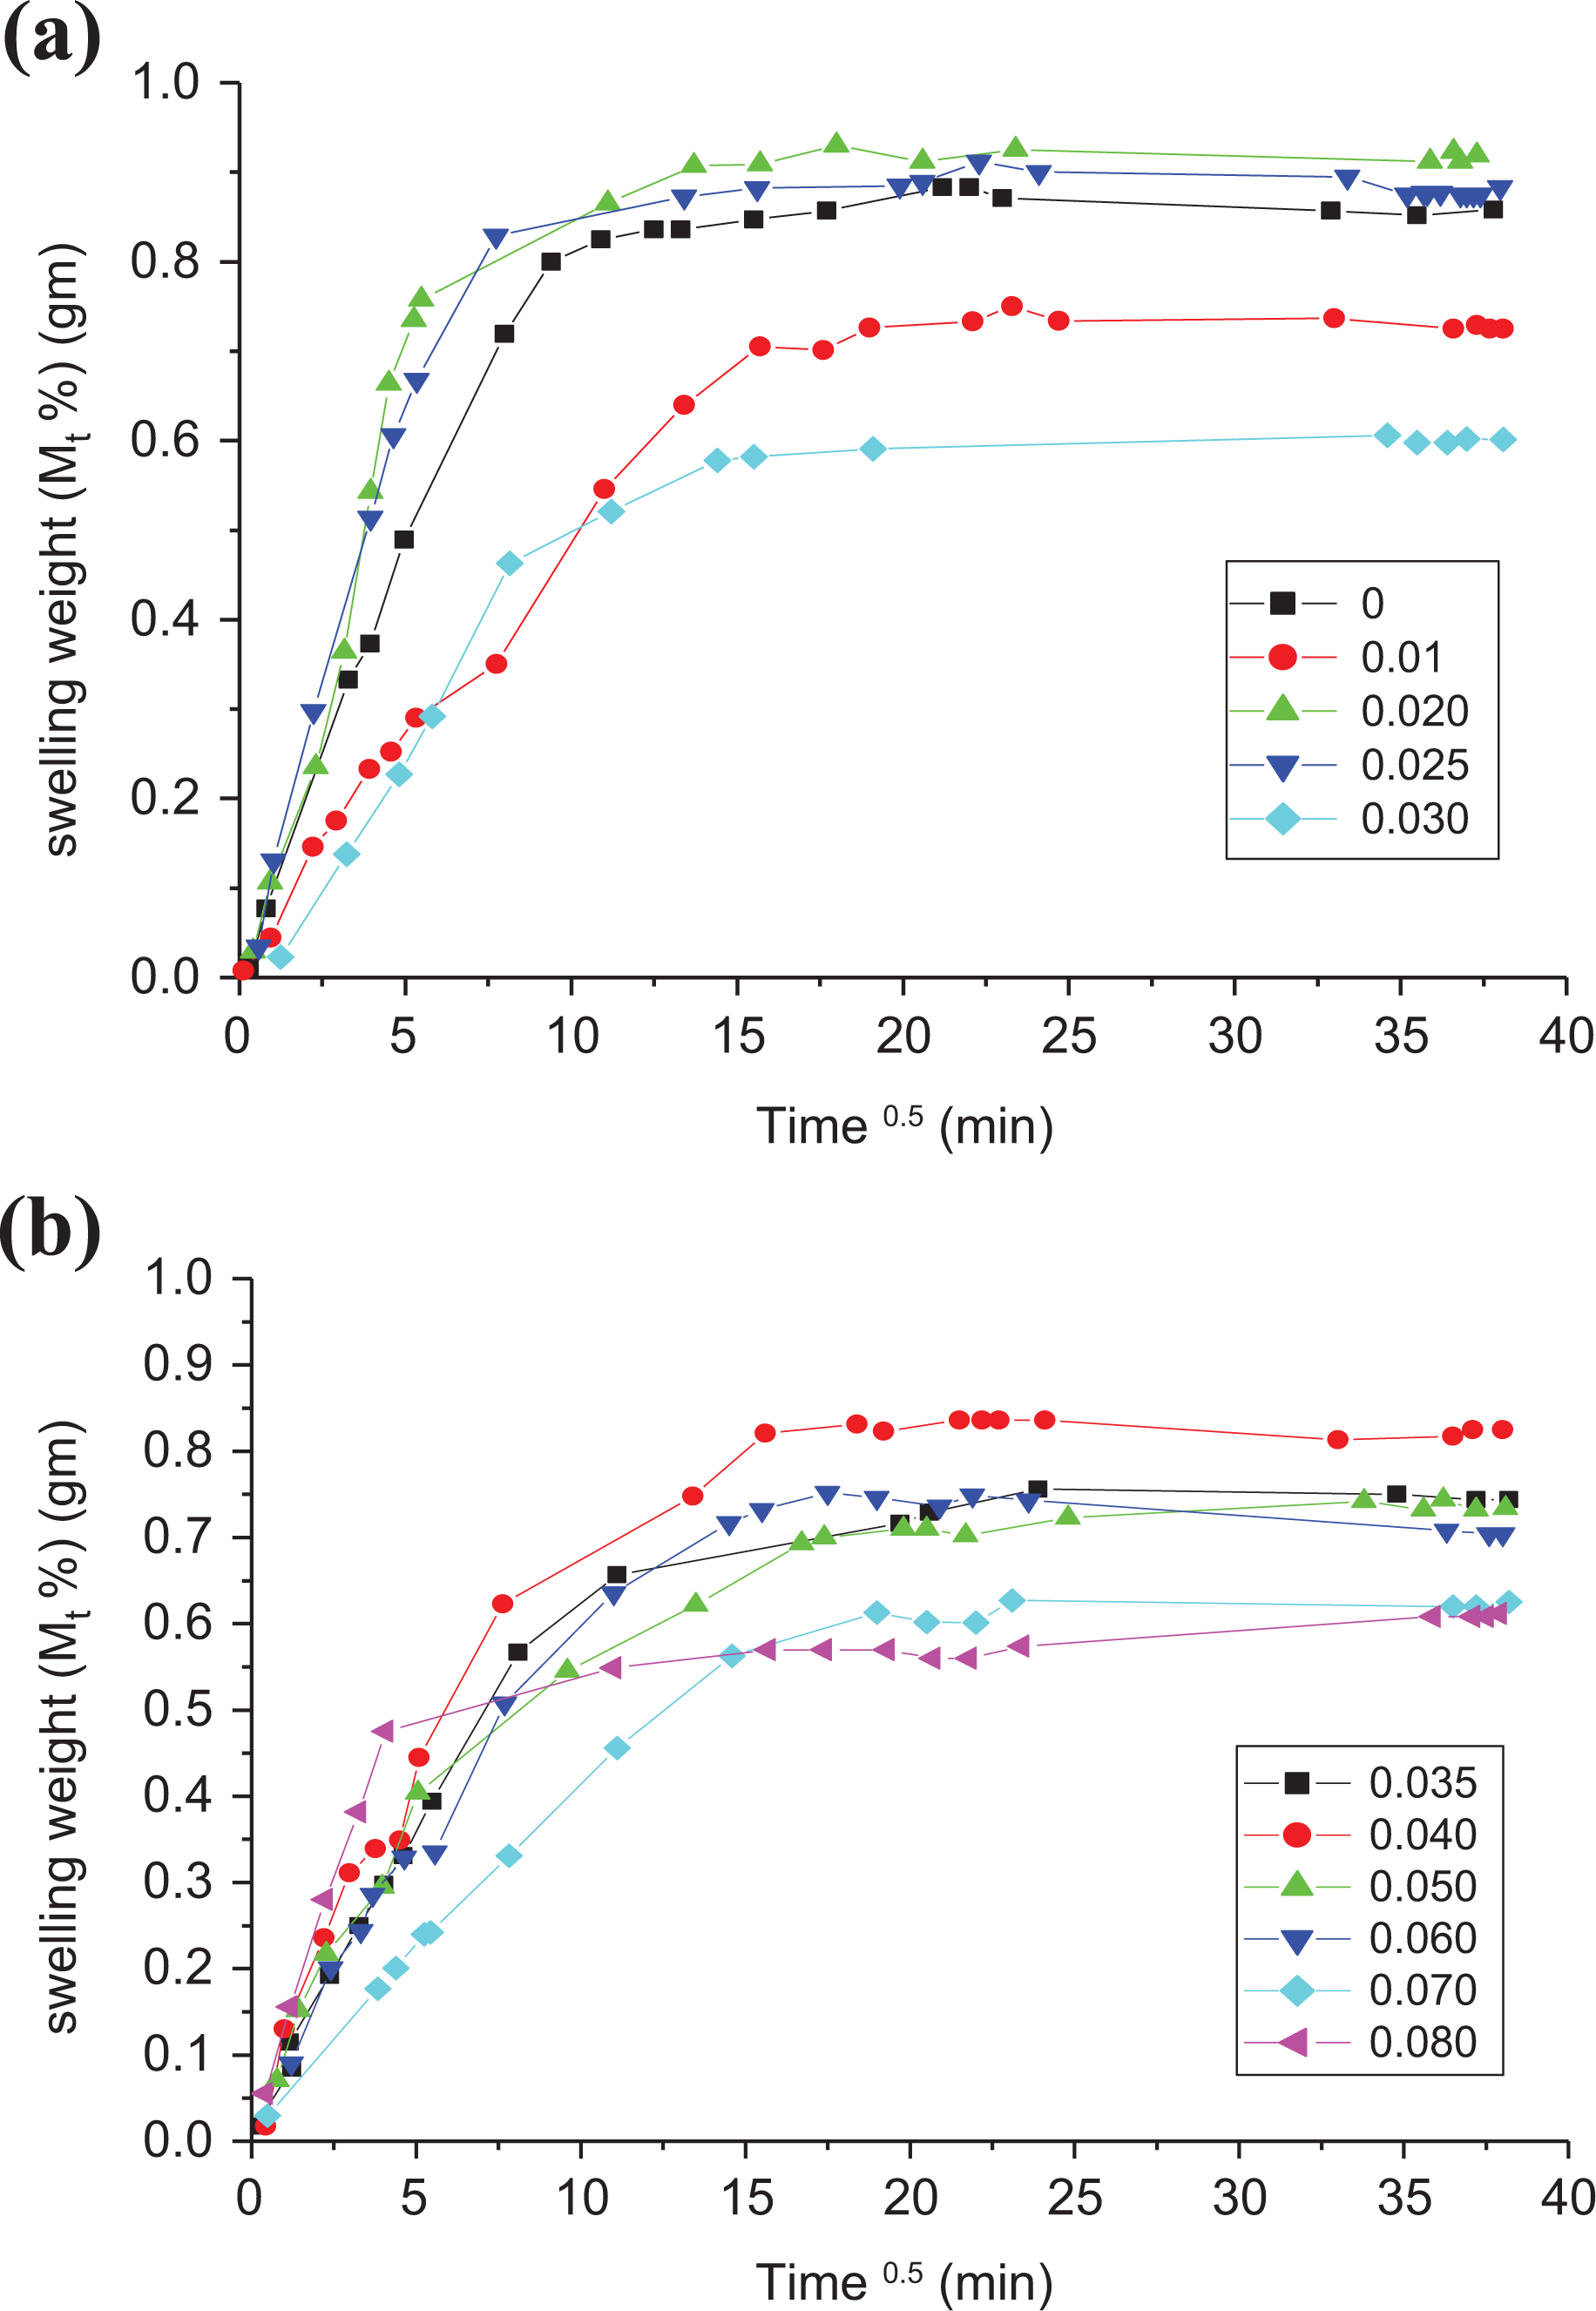
Using equation (5), the penetration rate was calculated. Figure 5(a) shows the relation between SWCNT contents (in wt%) and therefore the penetration rate. From this figure, P decreases with the increase in SWCNT concentration (>0.01 wt%) that reflects the role of carbon aggregation within the polymer mixture. These aggregations delay the penetration rate, P, and conjointly the diffusion, D, of solvent molecules within the polymer matrix. Additionally, SWCNTs-polymer reinforcement causes restriction to the equilibrium volume swelling. The diffusion of the solvent within the bulk of the polymer depends on the homogeneity of the mix and therefore the way that SWCNTs are aggregated.35,65 The relation between the diffusion coefficient, D, and the penetration rate, P, is given by 66
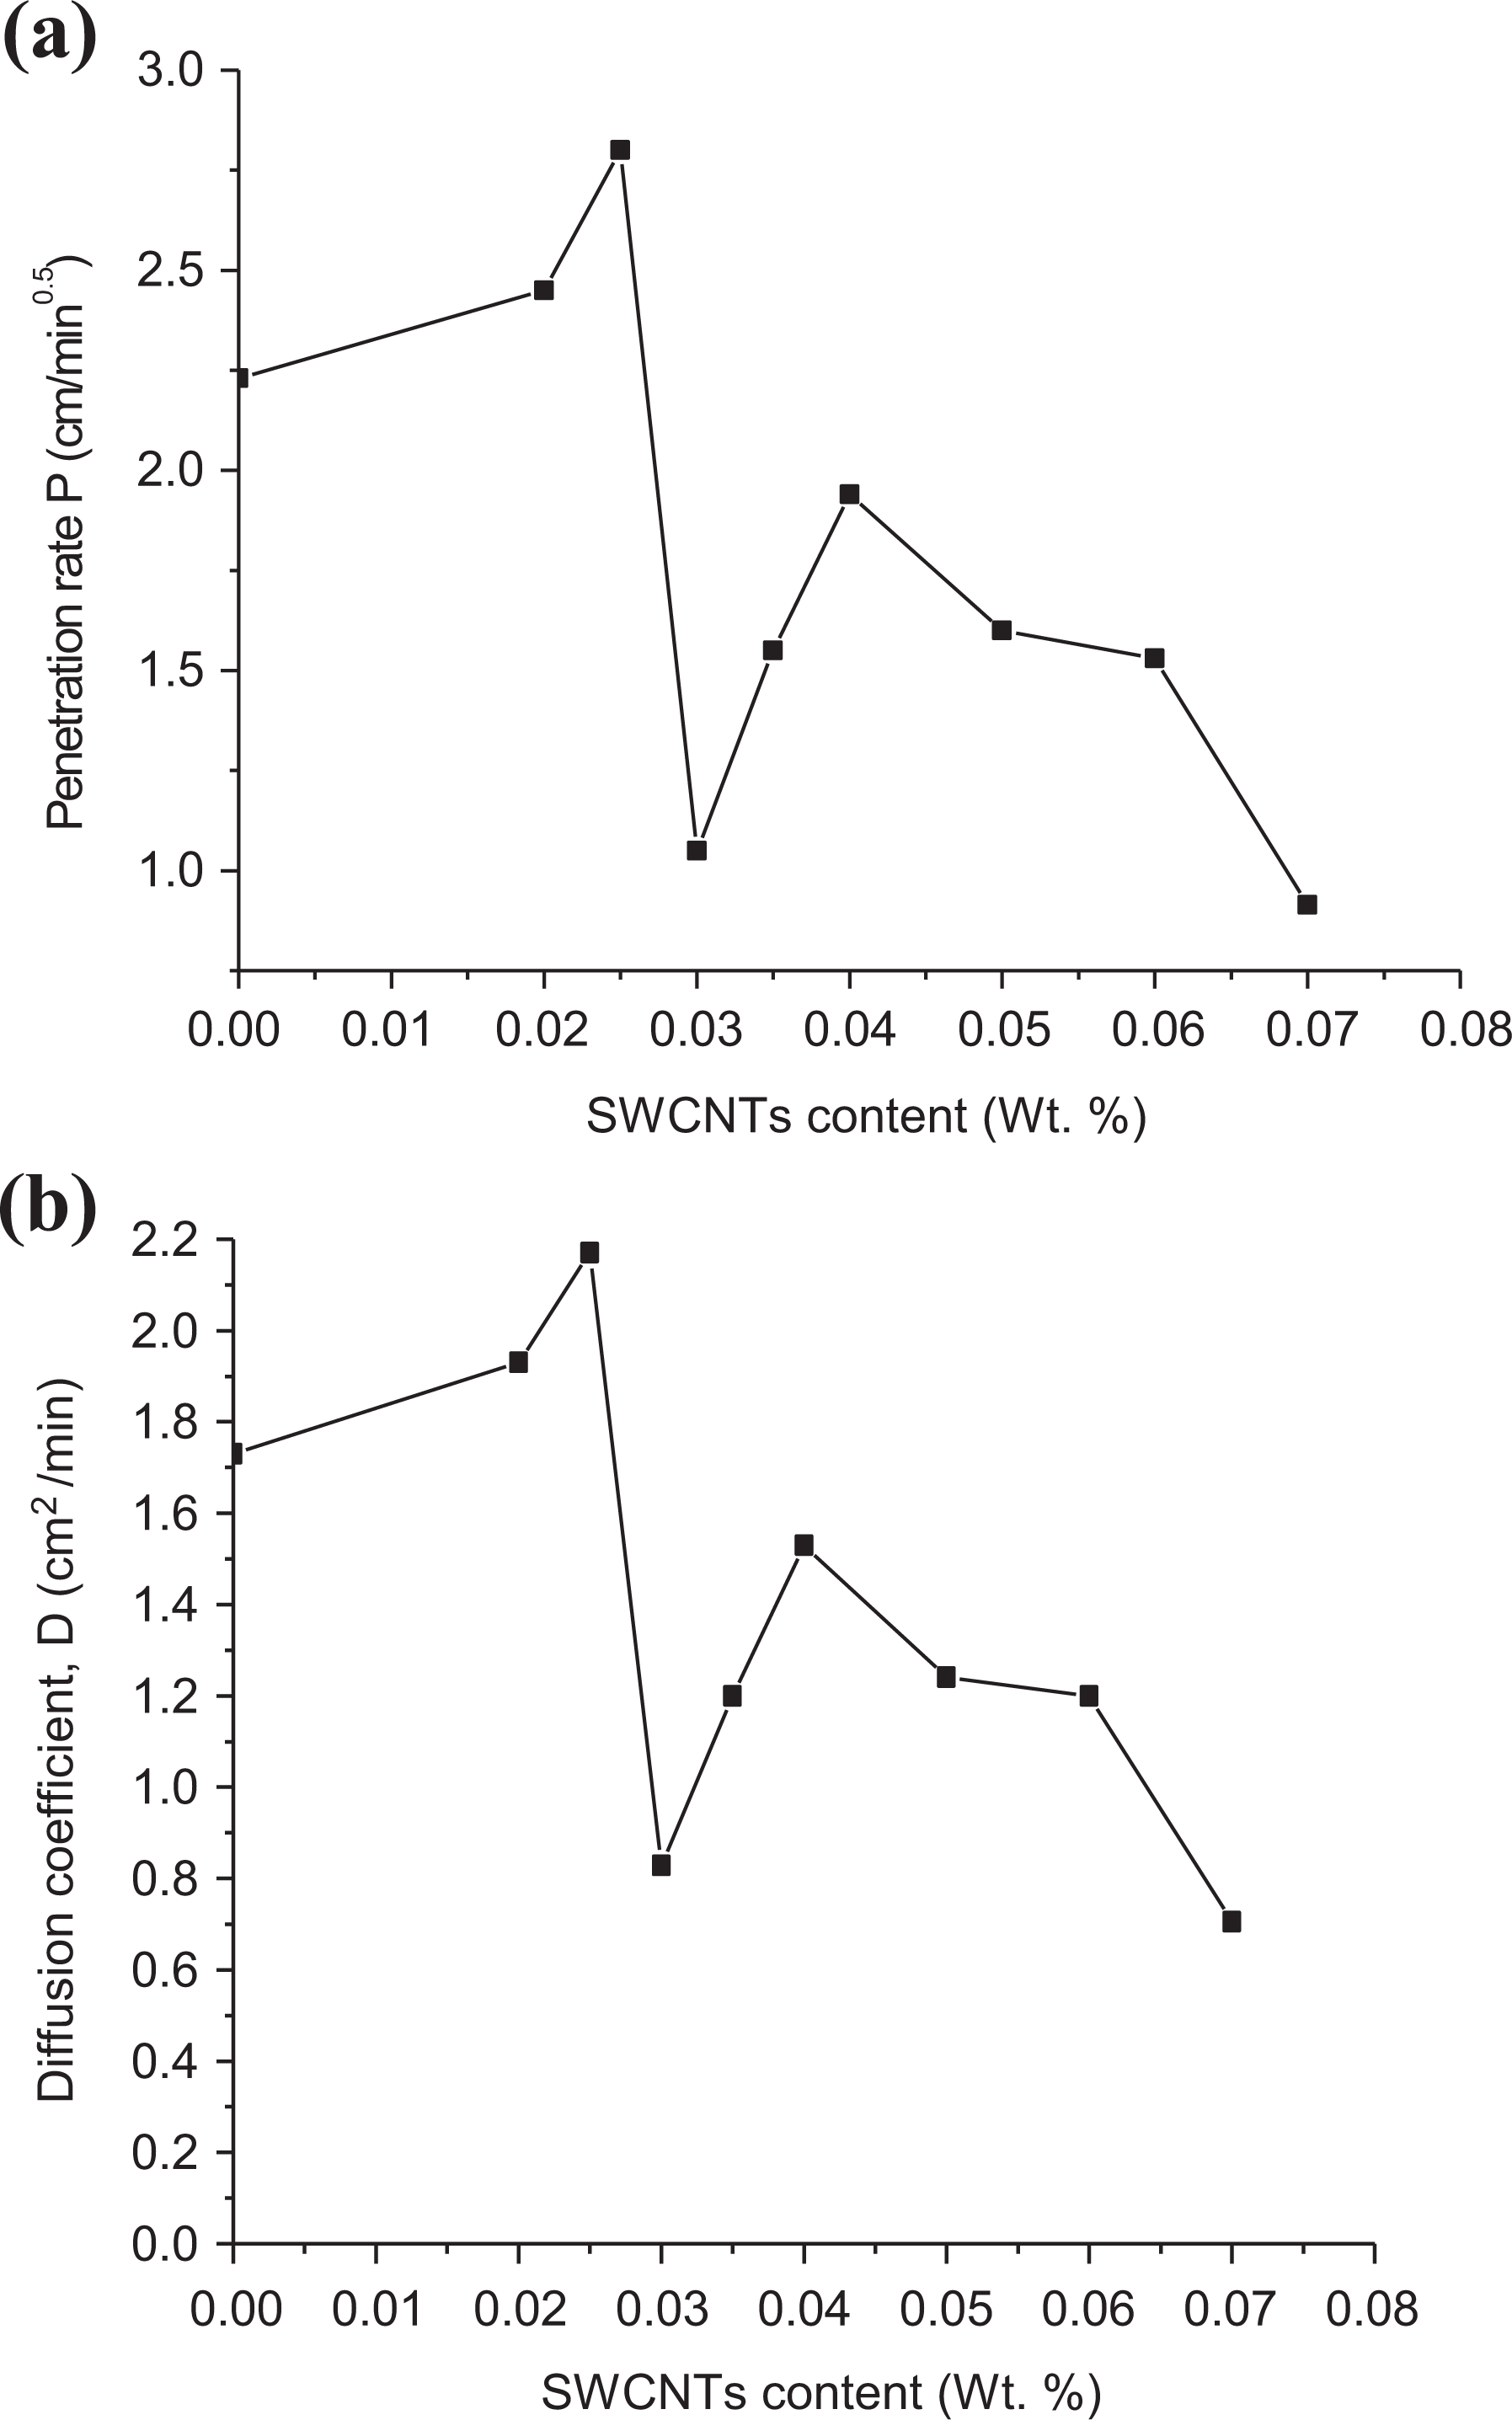
Dependence of (a) the penetration rate and (b) diffusion coefficient on the SWCNTs content for LLDPE samples in kerosene.
Figure 5(b) shows the dependence of D on the SWCNT content and the above conclusion of the dependence of P on SWCNT content could also be suggested.
DC electrical conductivity of conductive cross-linked PE
Electrically conductive plastics are nowadays increasing by important application fields that include antistatic products, self-heating plastics, shielding materials (RFI and EMI), and electromagnetic radiation absorbing materials.
Effect of SWCNT contents
Electron conduction in CNTs—stuffed polymers—happens on particle contacting one another or separated by terribly little gaps. These interaggregate gaps are also thought of as potential barriers for electrons to hope or by tunneling. Reduction of the interaggregate gaps will increase the flow of electrons and increase the macroscopic conductivity. The typical interaggregate distance is stricken by several parameters as well as concentration, structure, size, and form of the aggregate, size distribution, mixing efficiency, temperature, and so on. Conductor–insulator composite becomes conductive solely once a particular threshold concentration of the conductive filler has been intercalary. This crucial percolation threshold represents a system wherever continuous conductive chains are initially shaped. The nature of the host polymer matrix is also important regarding the critical percolation concentration of the conductive filler. In semicrystalline polymer (e.g. LLDPE), the very fine CNT aggregates tend to concentrate in amorphous region. As a result, the threshold percolation concentration in semicrystalline systems is less in amorphous polymers.65,67 Crucial concentration for SWCNTs has been studied and might be deduced from Figure 6 that displays the conductivity composition plot of the loaded LLDPE with totally different weight (W in wt%) of SWCNTs. Consistent with percolation theory, one expects a scaling law 68
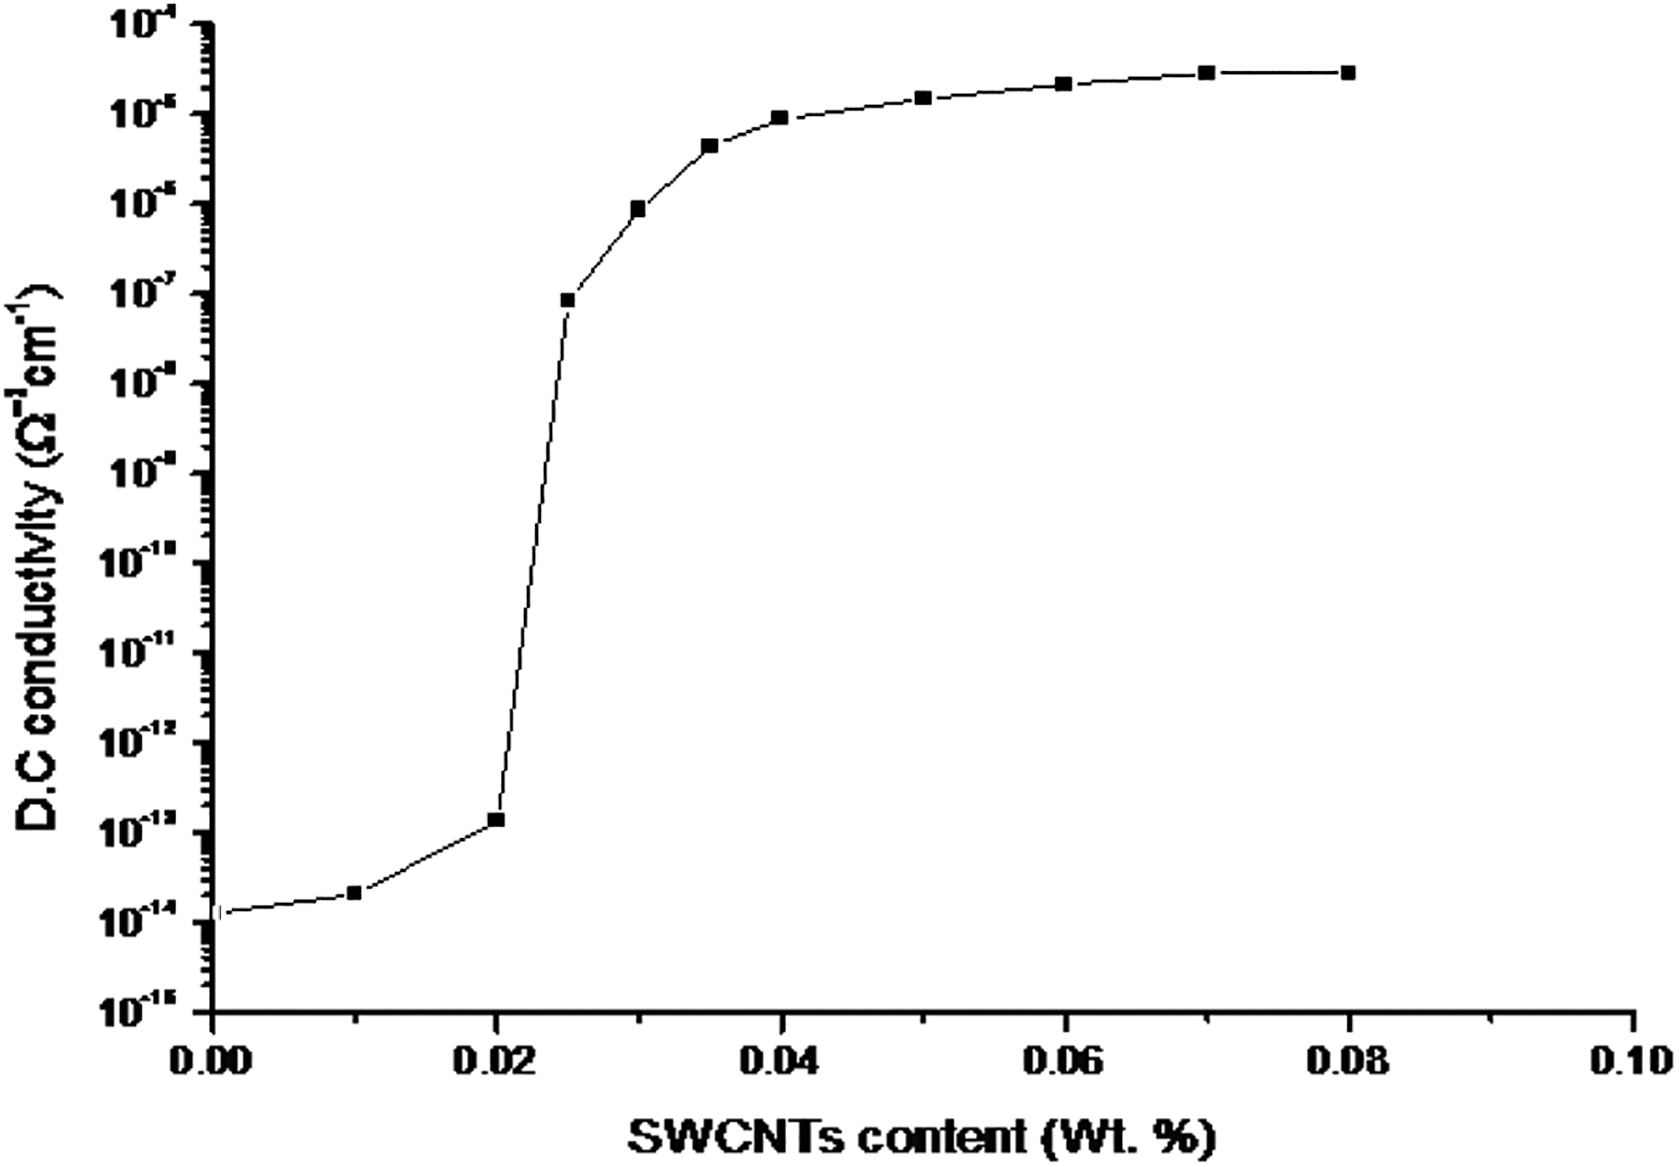
Dependence of the DC electrical conductivity on the SWCNTs content in LLDPE samples at 25°C.

or

where Wc is the percolation threshold, to is a universal exponent, and C1 is a constant. By fitting the data of log σ versus log(W − Wc) as shown in Figure 7, one can find Wc is about 0.02 wt% SWCNTs and t is 1.866 in agreement with the literature. 69
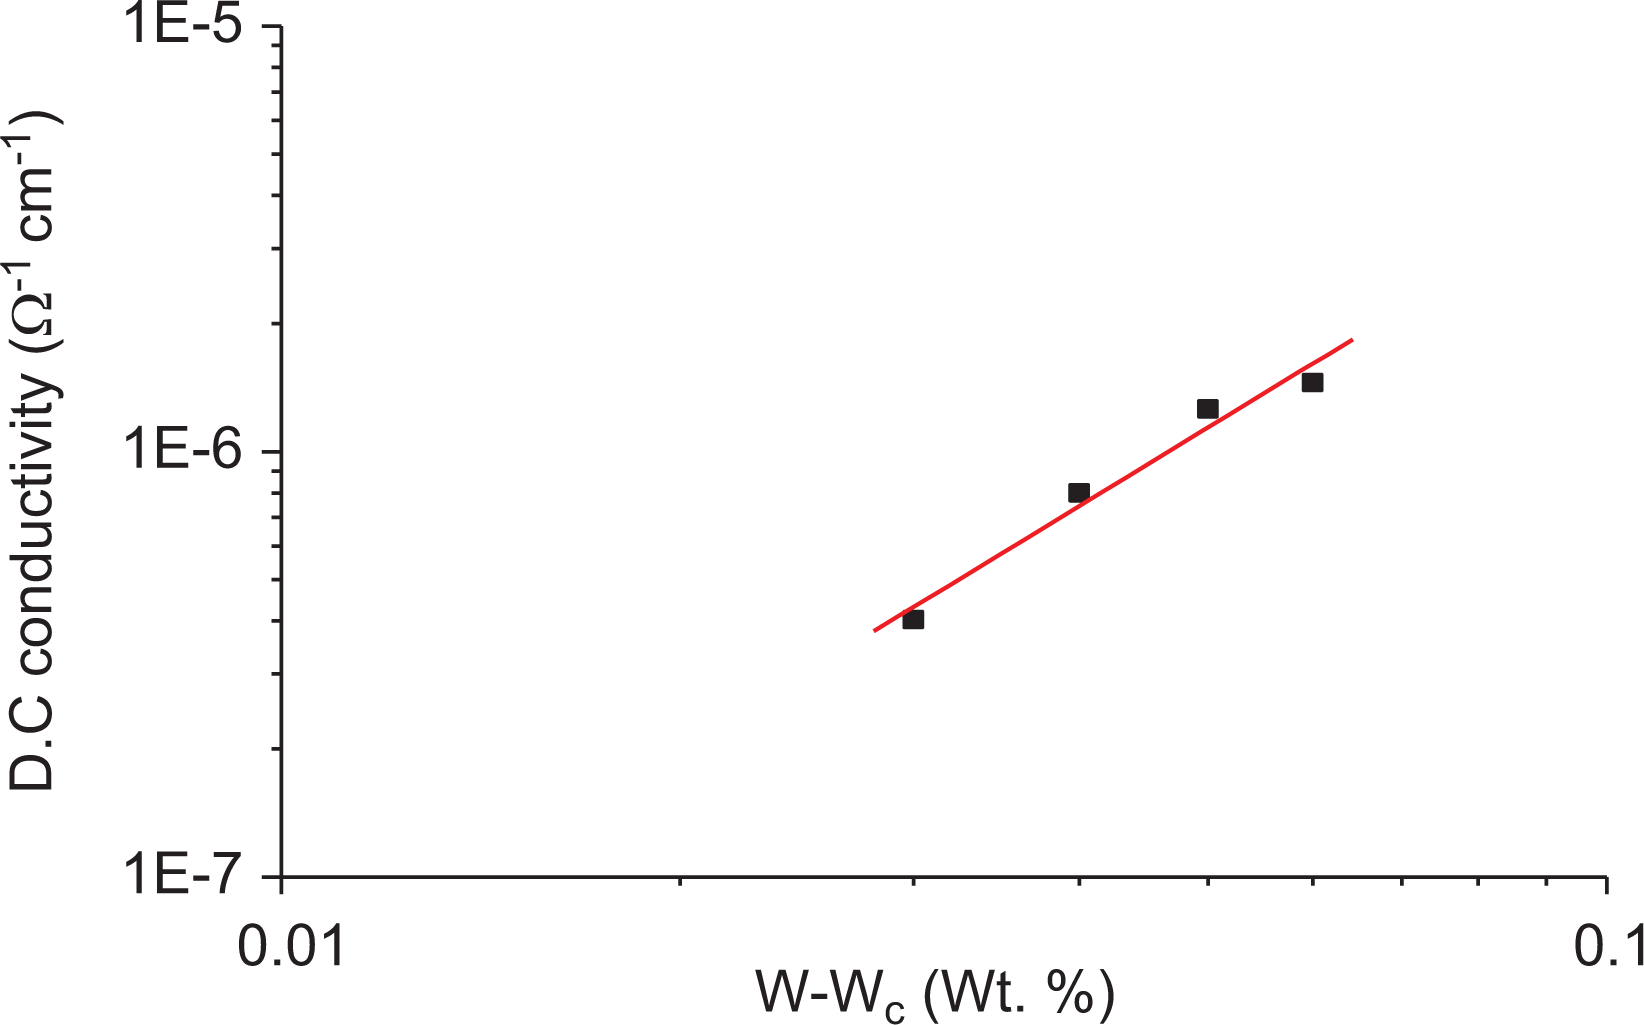
Relation between the DC electric conductivity and log W − Wc.
Effect of temperature
Figure 8 shows the plots of log σ to the base of 0.1 of DC conductivity: log σ of all LLDPE/SWCNT contents versus the environmental temperature T (°C). Higher PTCC intensity (σmax/σroom) was detected for LLDPE loaded with 0.01 wt% SWCNTs, and this value tends to decrease with SWCNT content until it reaches zero value for SWCNT content greater than 0.01 wt% as presented in Table 3, Meanwhile higher NTCC intensity was also detected for the 0.03 wt% and 0.04 wt% SWCNT-loaded samples. The PTCC/NTCC transition temperature was found to be highly affected by the SWCNT contents as shown in Figure 8; these are in the main attributed to the sturdy interactions between CNT and polymer chains. The sturdy polymer–filler interactions will partly prevent the flocculation of CNT aggregates throughout temperature increase. Therefore, the compound loading with 0.01 wt% of SWCNTs has a higher PTCC intensity.
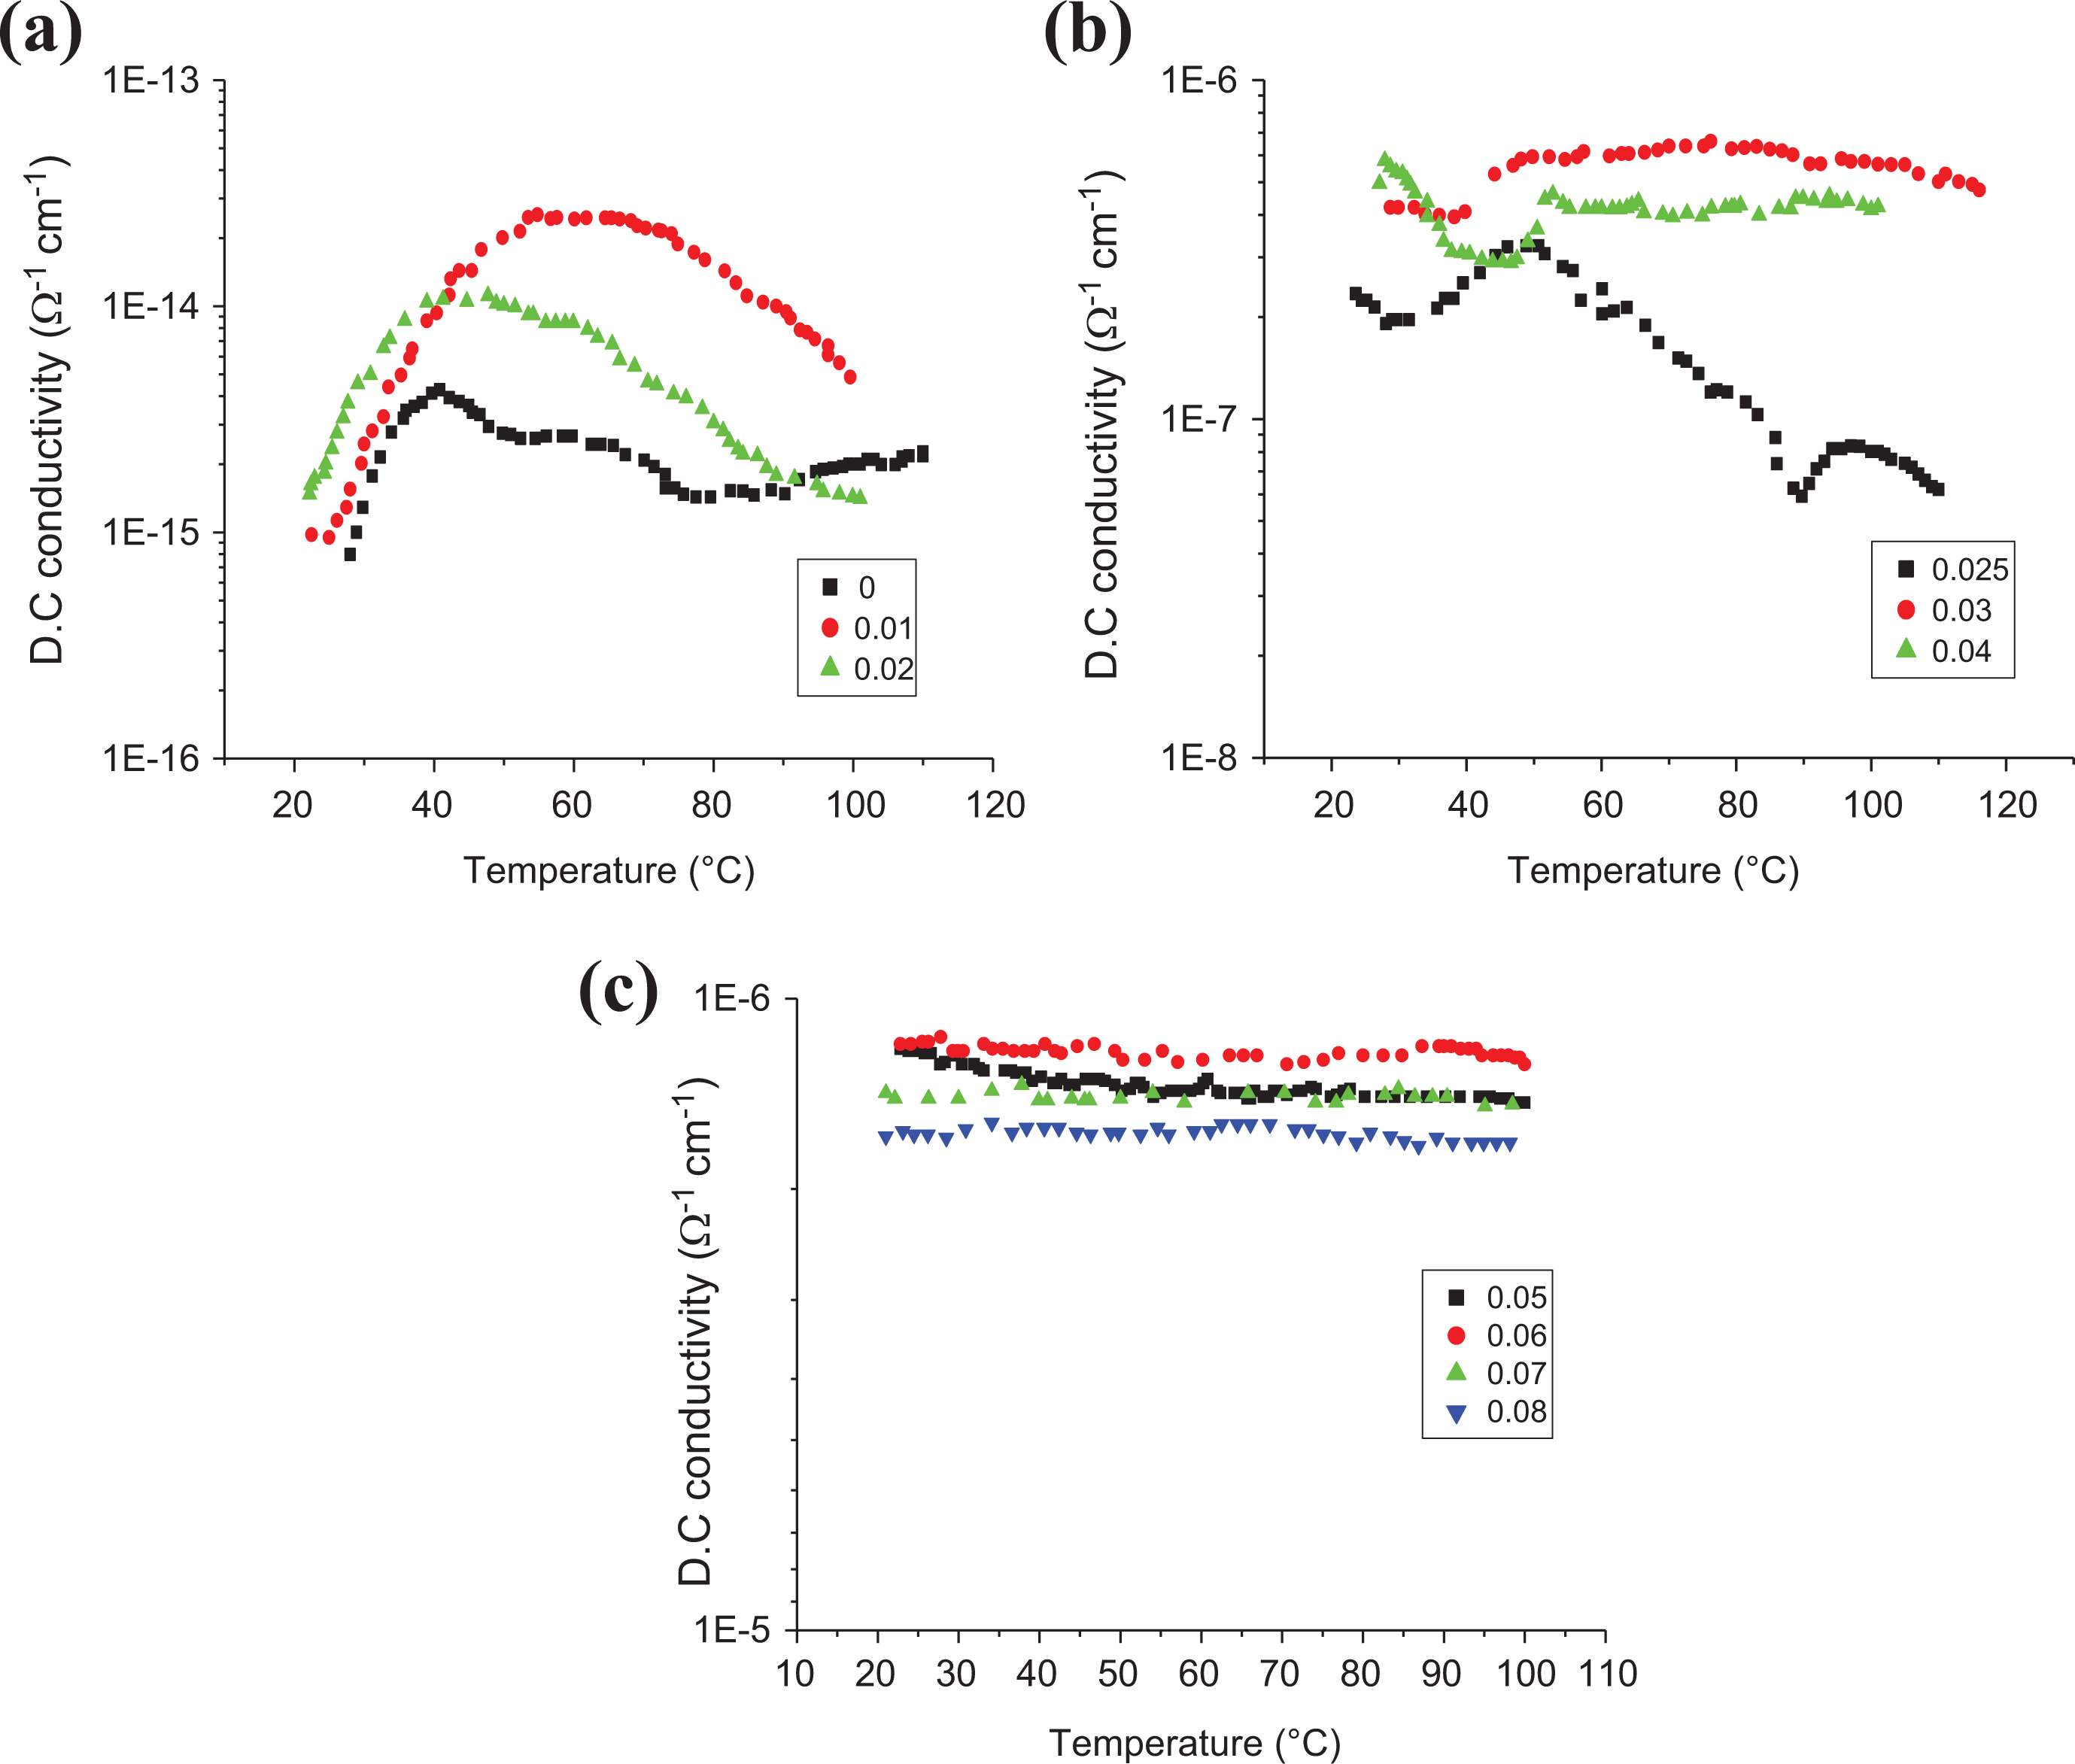
Dependence of DC electrical conductivity on the temperature for all samples with different SWCNT content. 10 prepared samples divided on 3 Figures due to the different regions of measurements.
Values of PTCC and NTCC for LLDPE samples with different SWCNT contents.
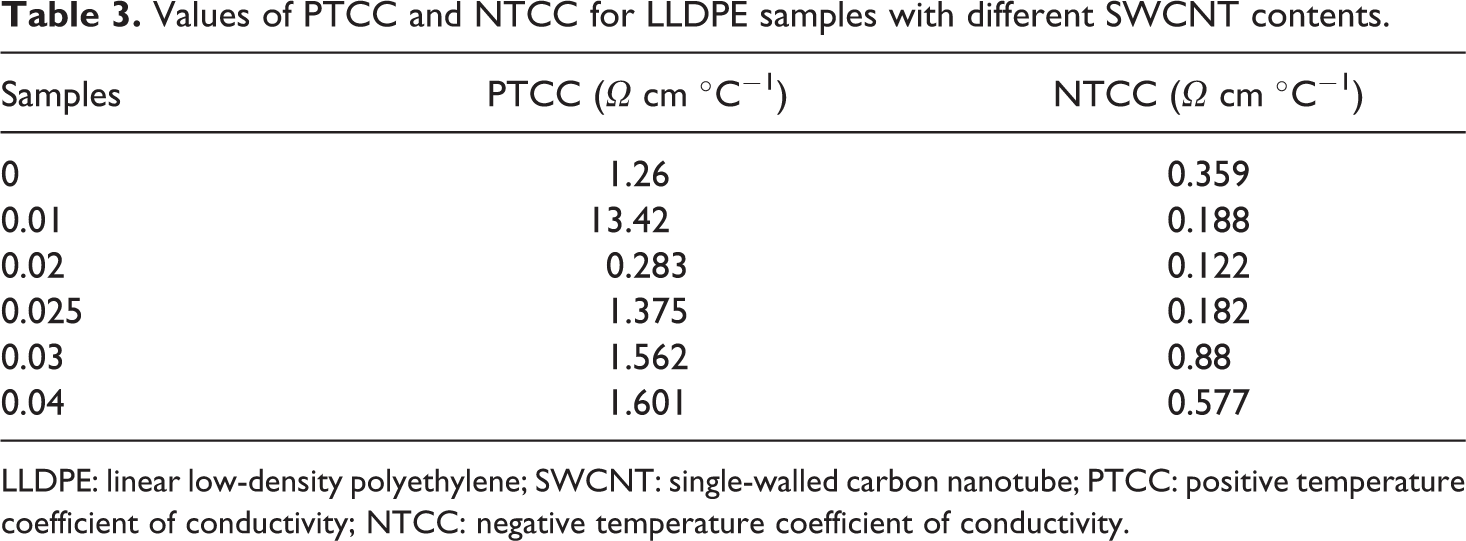
LLDPE: linear low-density polyethylene; SWCNT: single-walled carbon nanotube; PTCC: positive temperature coefficient of conductivity; NTCC: negative temperature coefficient of conductivity.
The conductivity of the LLDPE loaded with <0.03 wt% drops rapidly as the temperature raised above 45°C because of the deagglomeration of SWCNT aggregates. The deagglomeration can decrease the average size of the SWCNT aggregates. The conductivity for LLDPE loaded with SWCNTs (>0.03 wt%) looks to possess an independent behavior on the temperature because of the direct contact between CNT particles or aggregates. The percolative threshold-loaded sample contains pronounced symmetric peak around 45°C that is principally because of the agglomeration and deagglomeration impact of the filler particle with temperature.
AC electrical properties
The conductivity properties of polymer-CNT composites have been extensively reported are extensively rumored, 4 however solely a little part of this work deals with alternating current (AC) conductivity. 70 The insulator–conductor transition in these composite systems is usually sharp and characterized by a critical CNT loading (as already mentioned before) the threshold percolation concentration. The complex permittivity is outlined by ε* = ε′ – jε″, where ε′ is the usual dielectric constant. The imaginary part ε″ (ω) is expressed as a sum of two frequency (ω)-dependent functions, as follows 71

where σdc is the DC conductivity of the sample. The function ε(ω) has the general property of having at least one maximum at which the frequency value is known as relaxation frequency (ωR). In a mixture of poor and good conductors, the relaxation has its origin within the displacement of free charges in the conductors. At high and low frequencies, the charge distribution is different, resulting in the relaxation phenomenon. The dependence of the dielectric constant, ε′, upon frequency and concentration of SWCNTs is shown in Figure 9, The unloaded LLDPE has a dielectric constant of 10, practically independent of frequency in agreement with the result detected by Bergman et al. 71
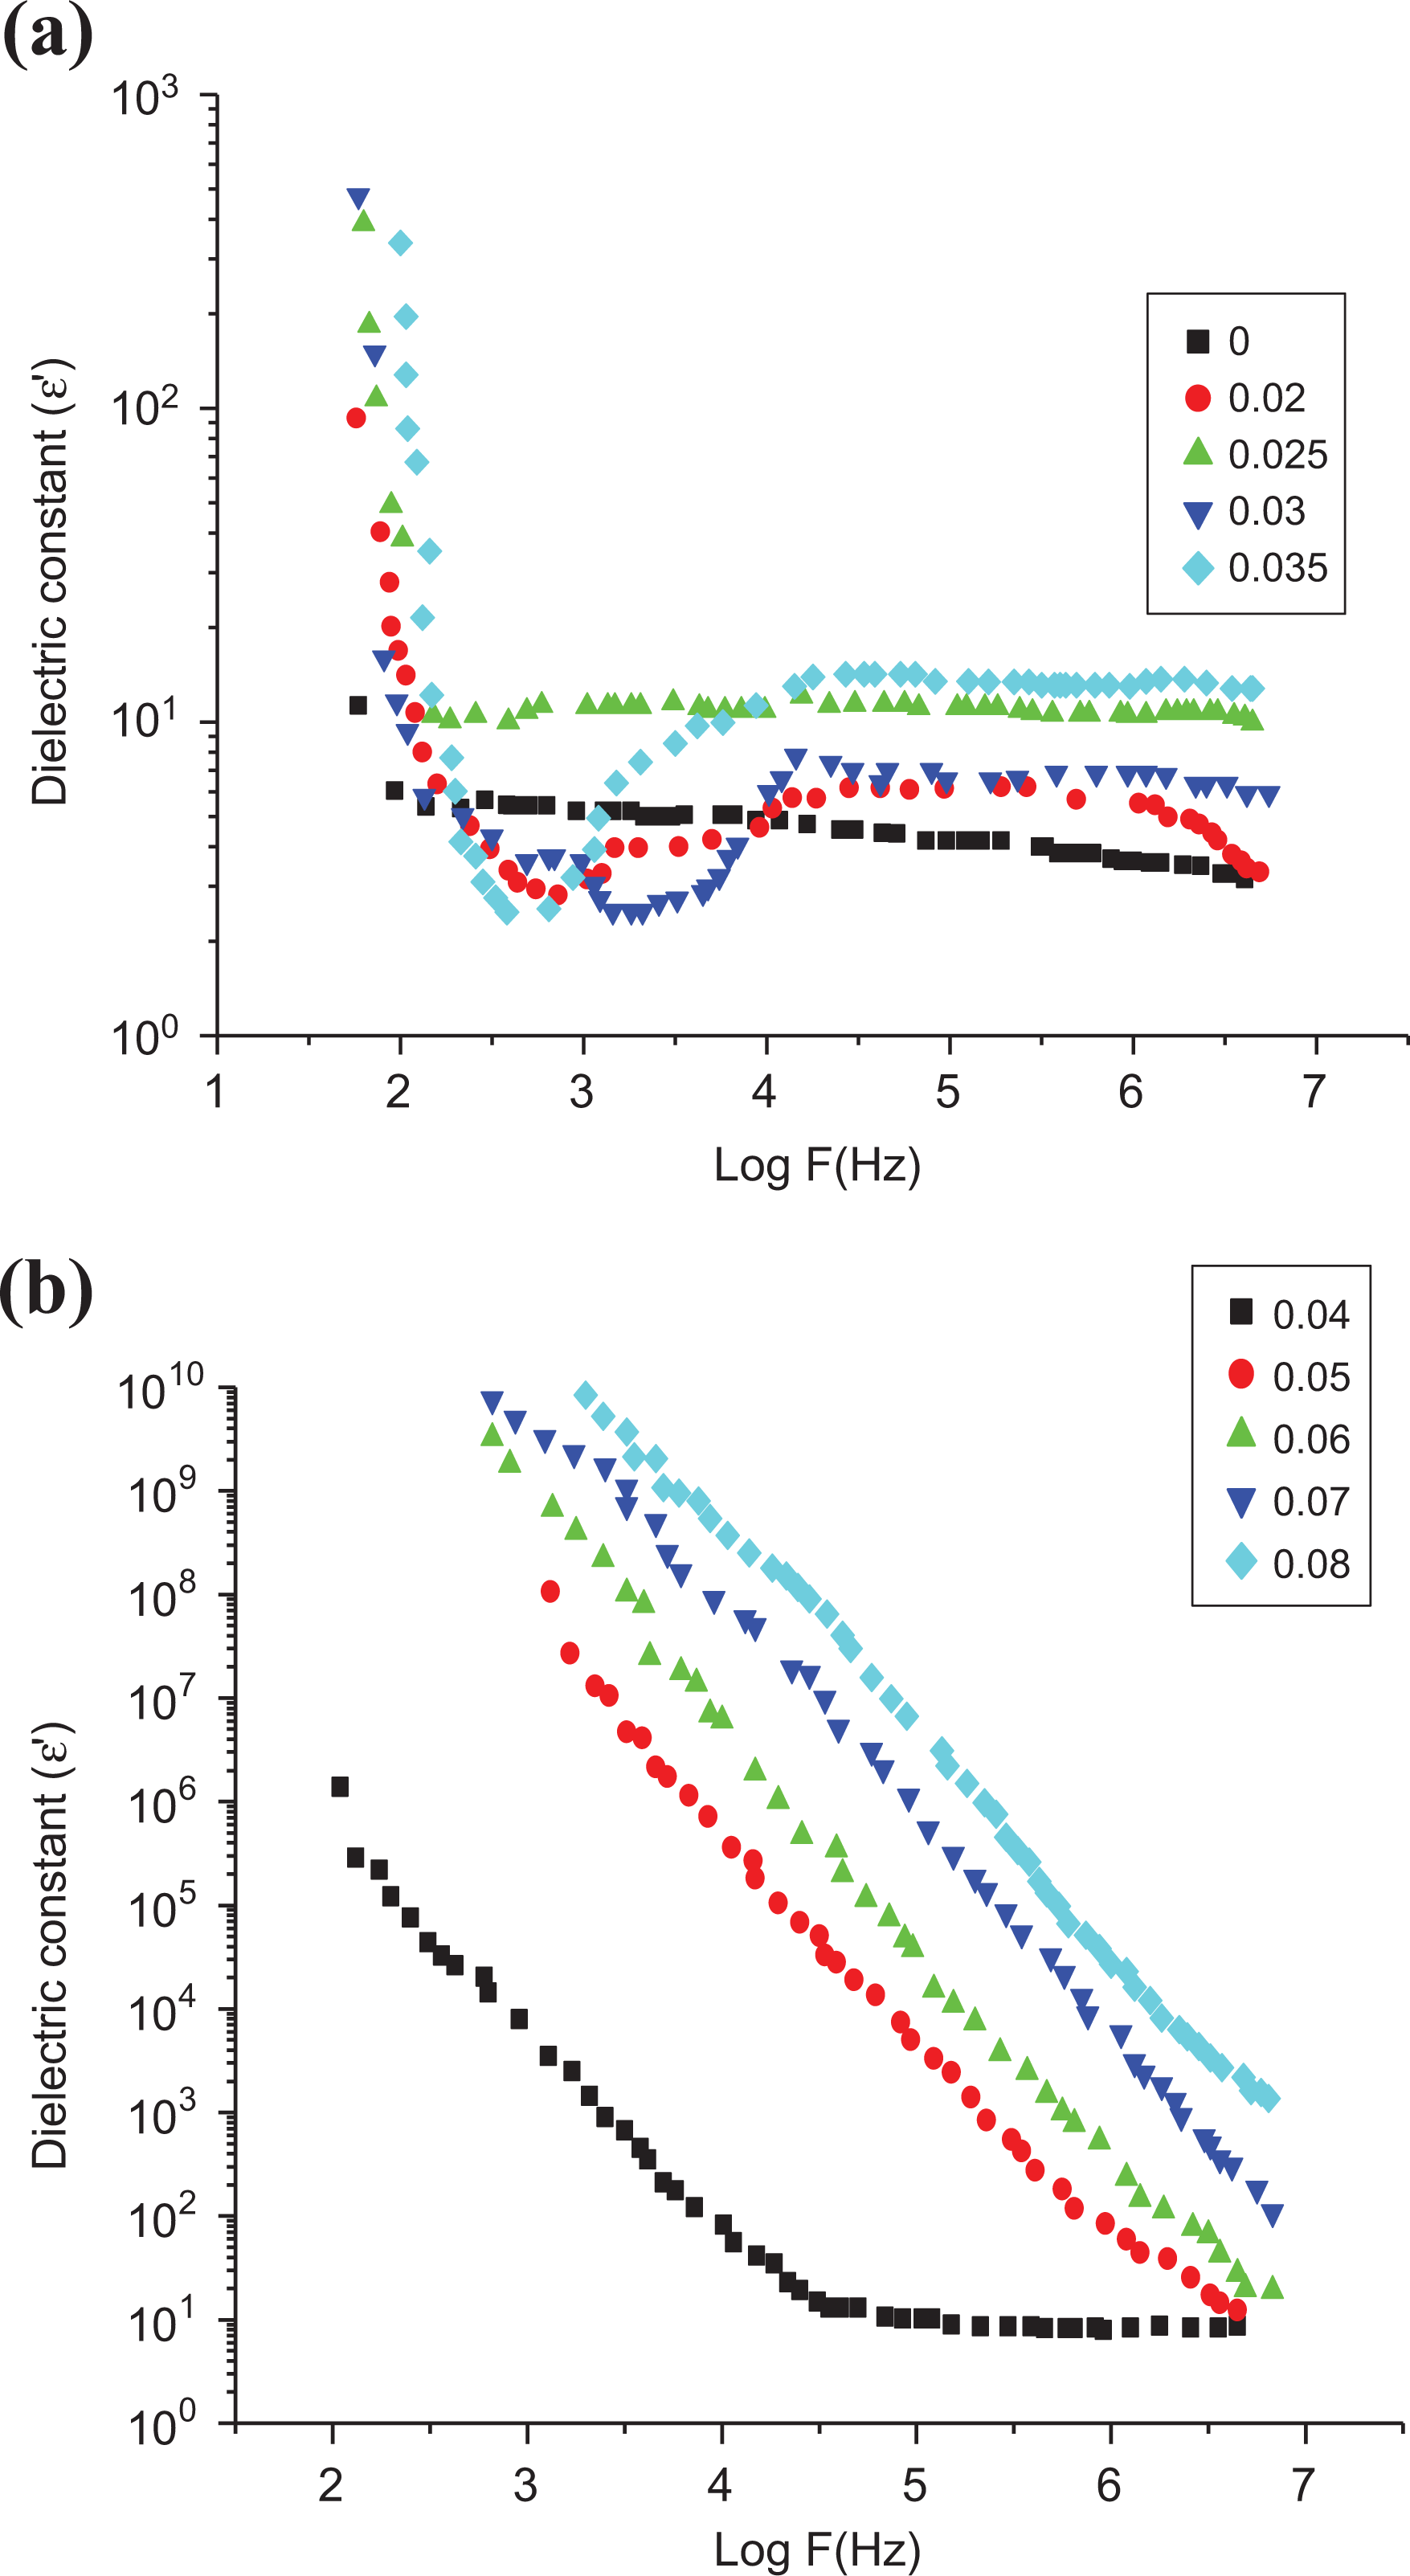
Dependence of the dielectric constant on log (F) at room temperature for LLDPE samples with different SWCNT contents. 10 prepared samples divided on 3 Figures due to the different regions of measurements.
Figure 10 shows ε″ as a function of frequency for different SWCNT contents. Using equation (9), one can qualitatively describe the frequency dependence of ε(ω) by knowing the DC conductivity of each sample. All samples exhibited a relaxation frequency (ωR) that differs according to the SWCNT contents.
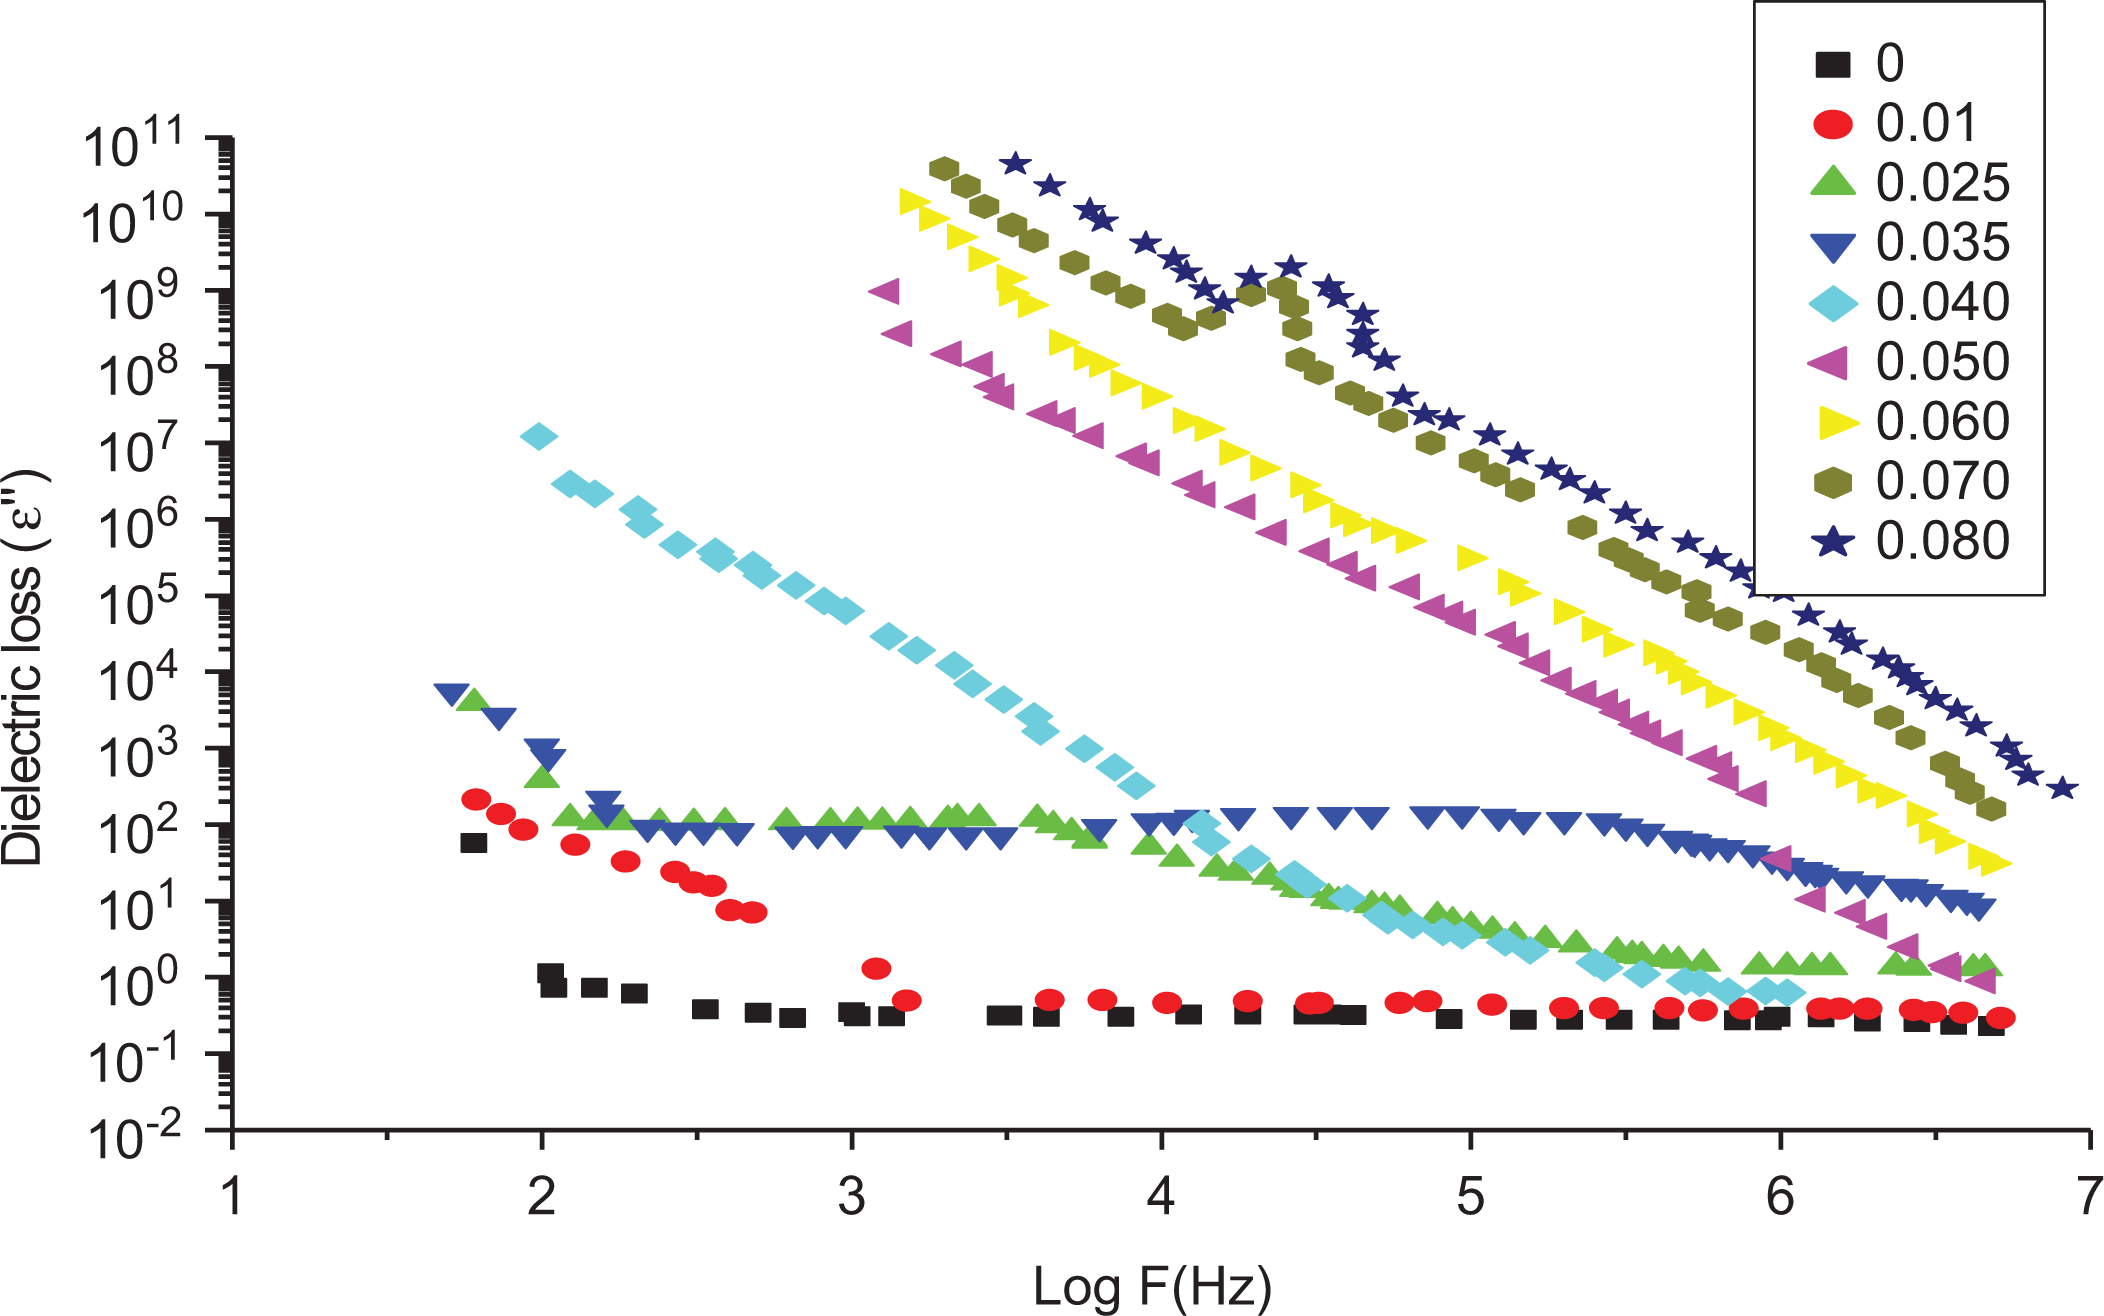
Dependence of the dielectric loss (ε″) on log (F) at room temperature for LLDPE samples loaded with different SWCNT contents.
Percolation theory relates various physical quantities to the difference |w − wo|, below and above We, the critical percolation concentration. For the complex permittivity (ε*), the following expression was proposed 72
where
The following expressions were suggested 71


and if (Z >> 1)

for all values of W.
Considering an LLDPE-SWCNTs composites, one may substitute
W < Wc


and for W > Wc


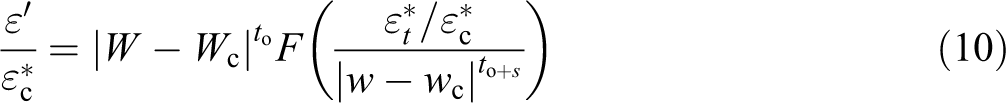
For the high-frequency range, equation (12) is substituted in equation (10) as follows

A representation of the F function for intermediate values of the frequency where relaxation occurs is currently unknown. It has been proposed,
73
however, that
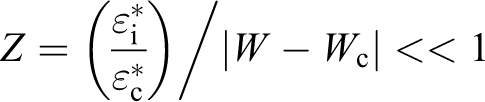
The dependence of the dielectric constant upon filler concentration at different frequencies is shown in Figure 11; from this figure, it is clear that ε′ increases sharply after a critical concentration (around 0.03 wt%) of SWCNTs. Also, it is of great interest to notice that the values of ε′ decrease with frequency for high SWCNT loading (
Dependence of the dielectric constant on the SWCNT content at room temperature (25°C).
Within the low-frequency range,
However, one can easily verify that the proceeding in equality is obeyed by taking εc in the habitual range of the permittivity of covalent material (from 10 to 20). Considering equation (15b) at given frequency, one obtains

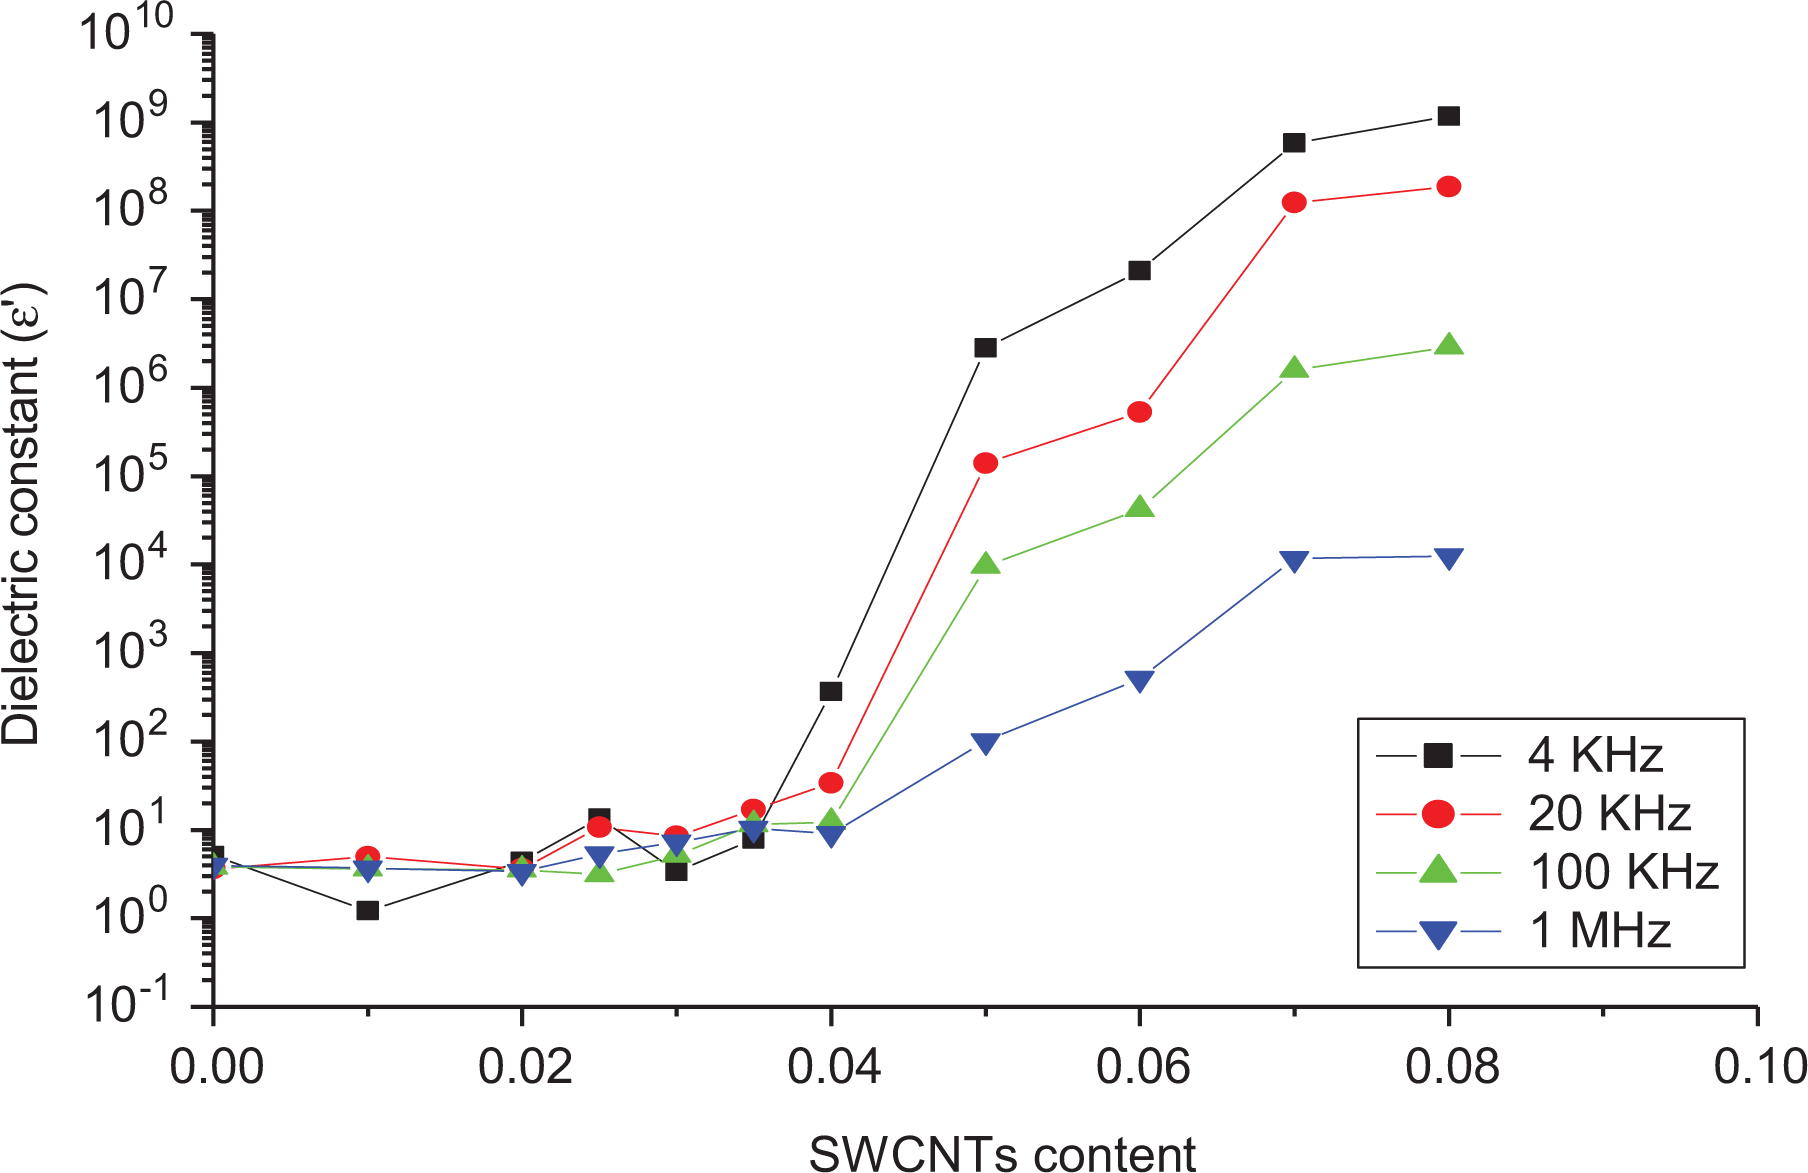
Figure 12 shows ε″ as a function of |W − Wc| at 4 kHz, giving an experimental slope equal to 9.395 for the exponent 2s + to and hence s = 3.765 which is in disagreement with the literature, owing to the improper value of both σc and εc suggested before.
Dependence of the dielectric loss (ε″) on W − Wc at room temperature (25°C).
Effect of γ-irradiation on the electrical and swelling properties
Interaction of radiant energy with substance is very vital from the point of view of theory and applications. This interaction is also thought-about from various aspects. Once radiant energy acts on a material, its electrical properties could modify, and new electrical and swelling phenomena may develop in it, moreover, strength, optical properties, and so on.24,74
Irradiation of various forms of polymers was studied by Tarssova et al. 75 The result of the radiation on the polymer composition induced cross-linking was studied by many workers.20,76,77 It is well-known that the electrical conduction in polymer is often significantly increased by irradiation. The introduction of conducting fillers changes not solely electrical however additionally structural and mechanical properties of the polymer. This can be connected with the distribution of the filler and with the characteristics of its interaction with the polymer molecules (the formation of chemical or adsorption bonds).
The above tested samples were subjected to a repeated measurement to study its electrical as well as swelling properties after γ-irradiation and temperature dependence.
Dose dependence of the swelling parameters
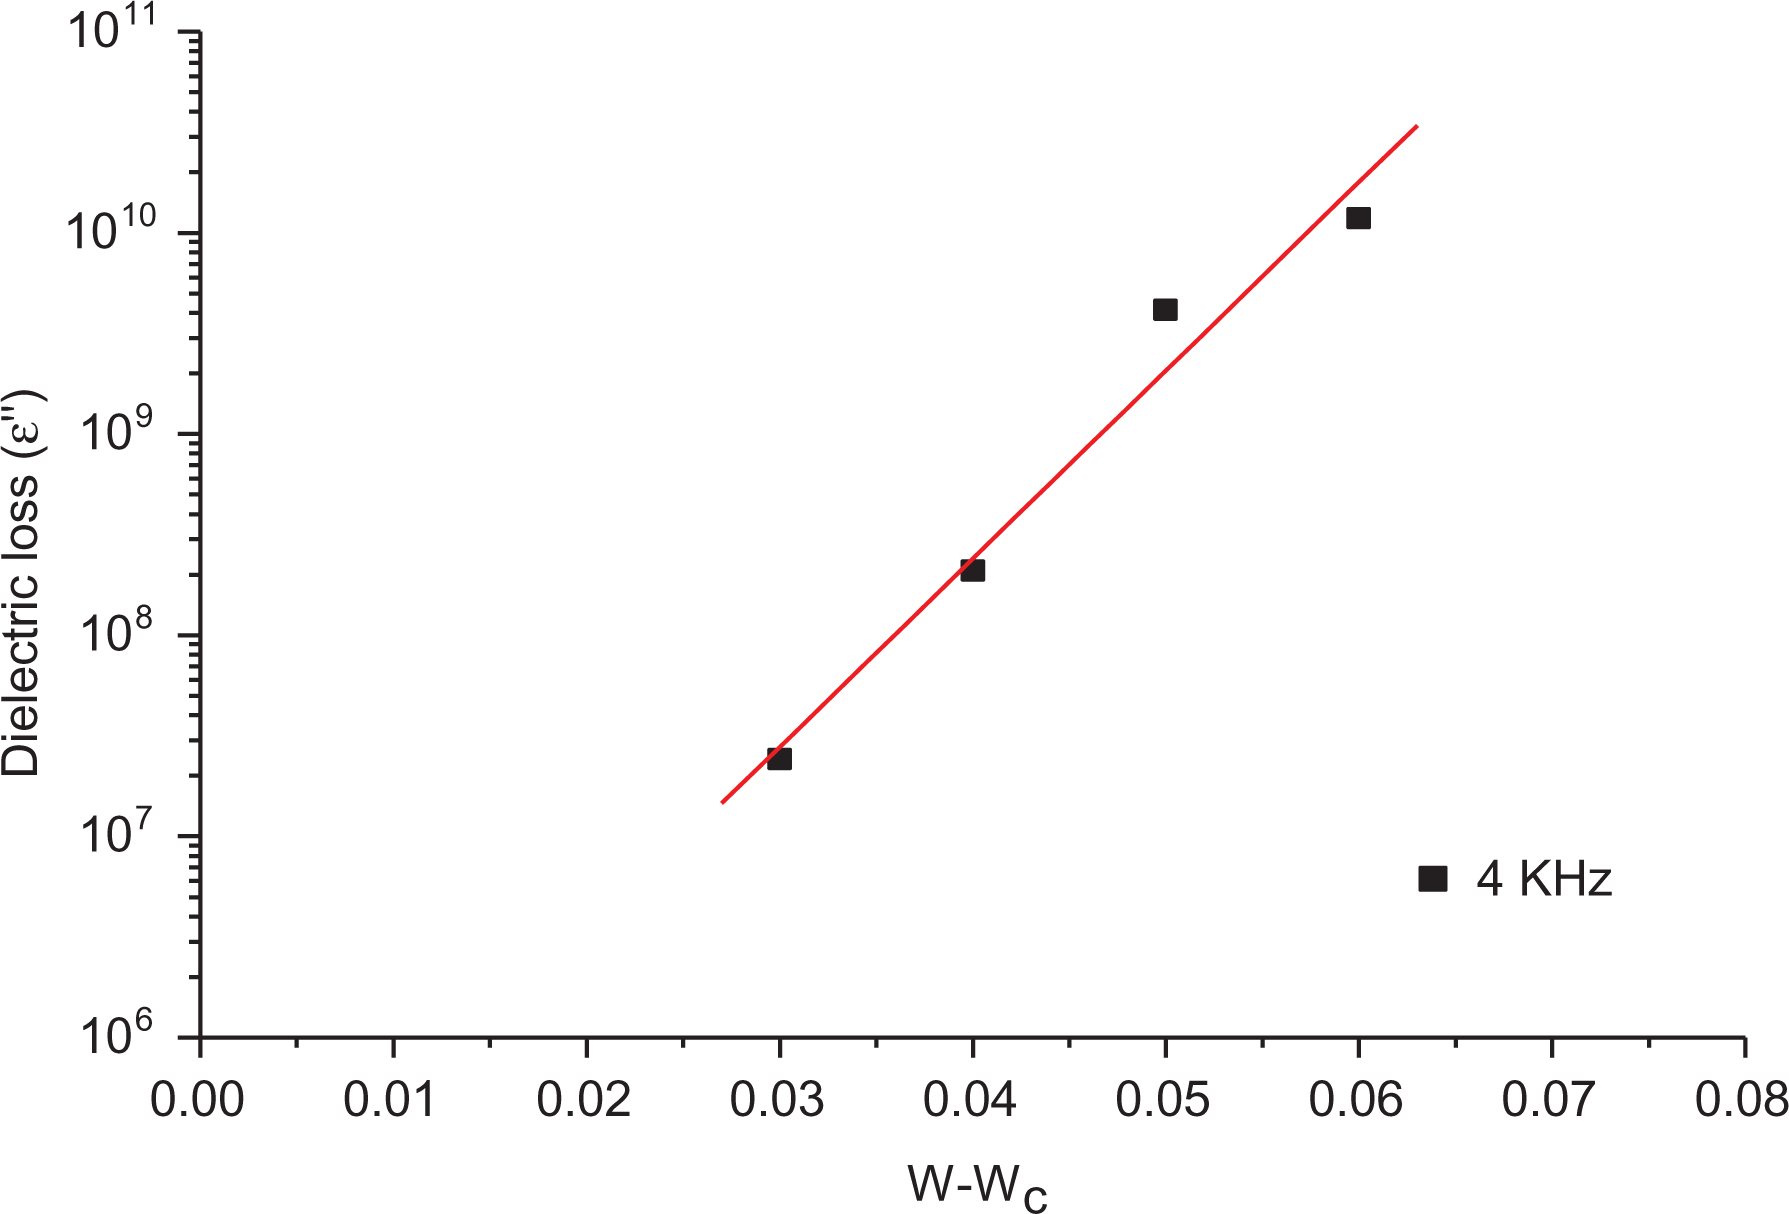
Figures 13 and 14 show the relation between the maximum degree of swelling (in kerosene), Qmax, and the penetration rate, P, measured at 25°C and the irradiation doses (φ in kGy) for LLDPE loaded with 0.025 wt% of SWCNTs (percolation threshold).
Dependence of the Qmax on the γ-doses (kGy) at room temperature (25°C).
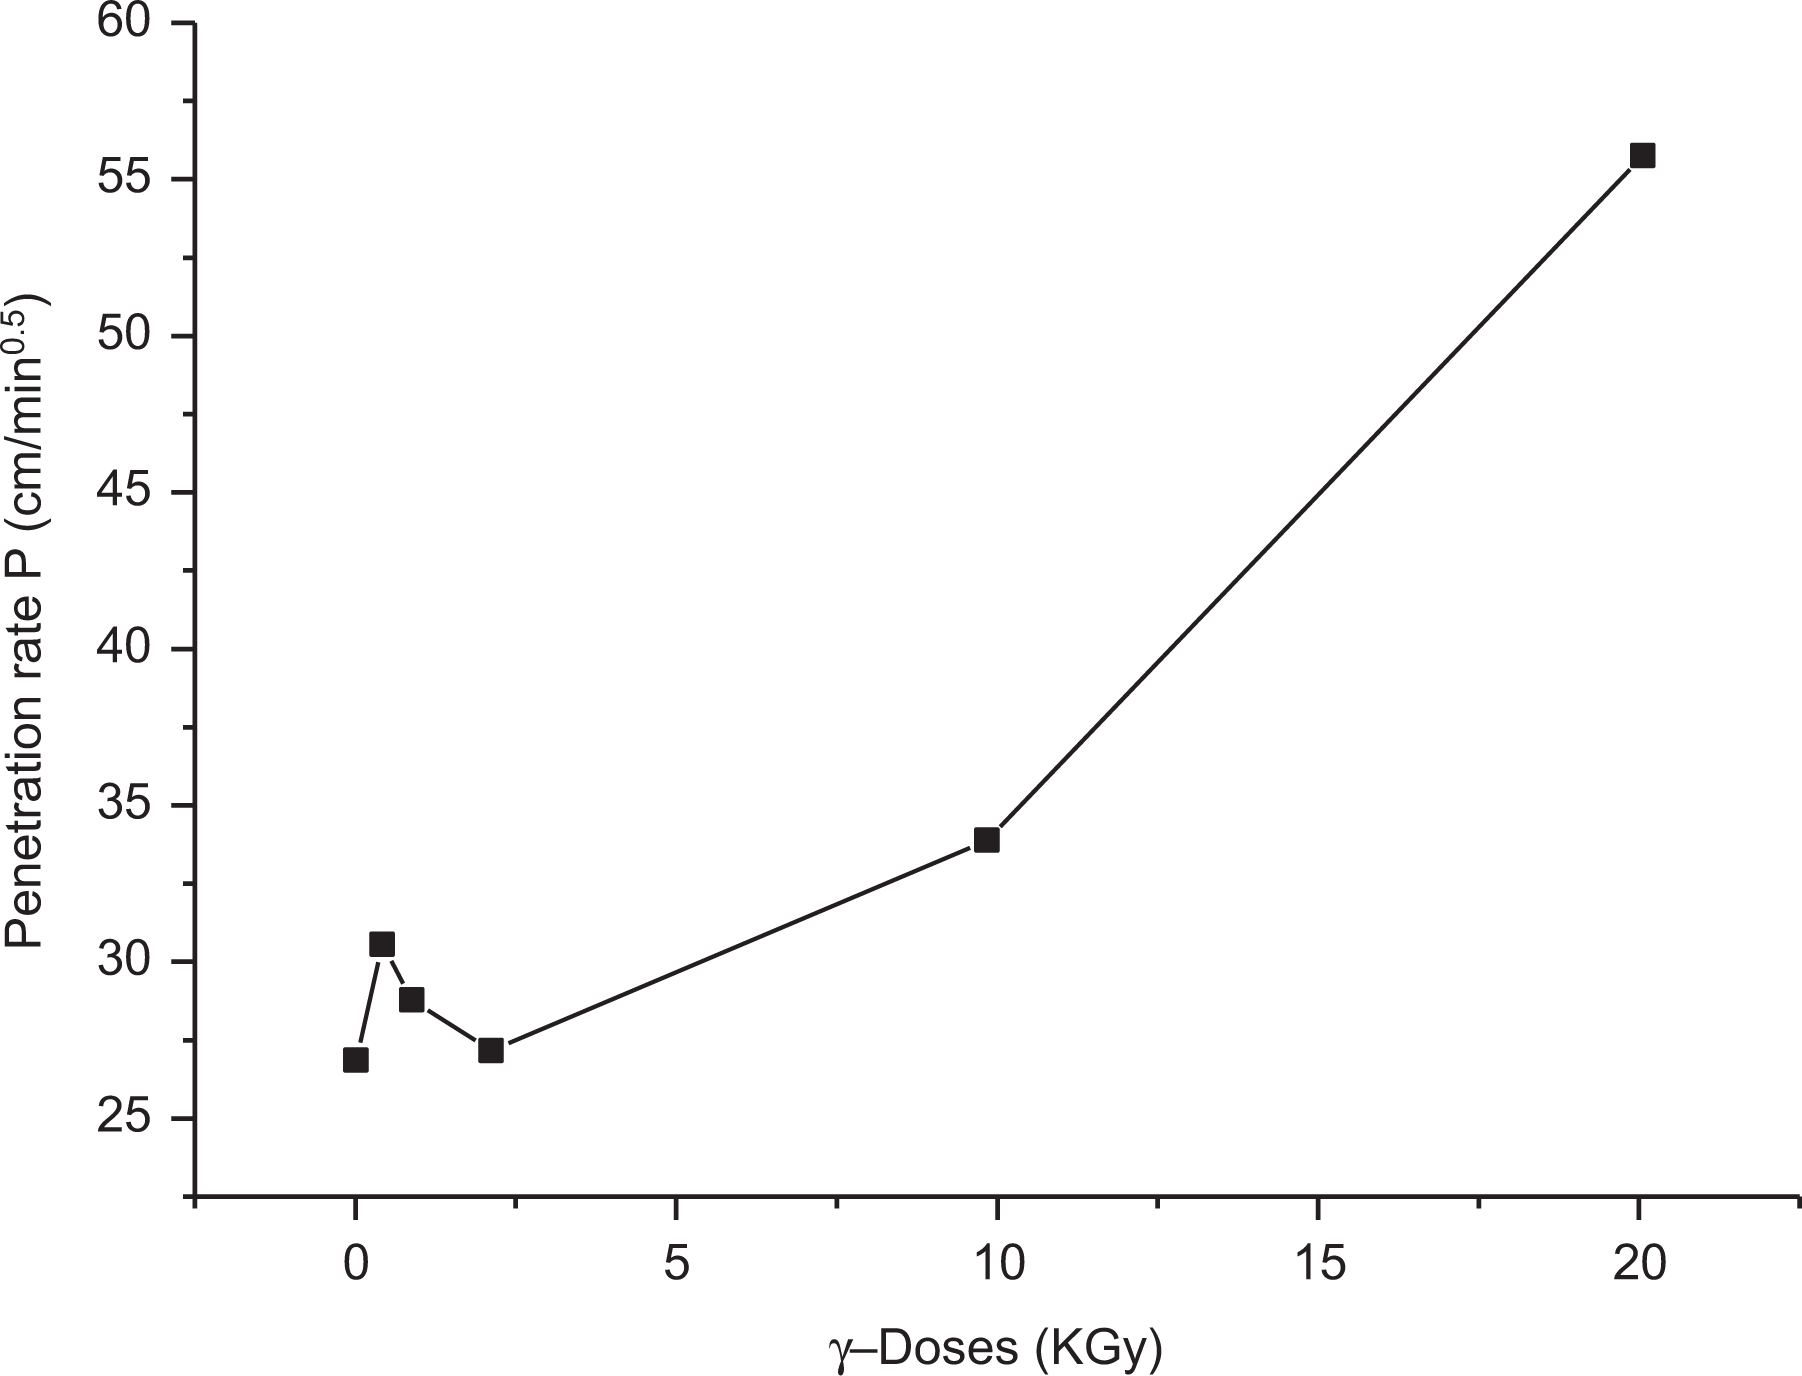
Dependence of the penetration rate, P (cm min−1/2) on the γ-doses (kGy) at (25°C).
It is clear that the variation of both Qmax and P with γ-irradiation dose markedly depends on the type of solvents (kerosene and chloroform). It may be presumed that the action of γ-rays on polymer results in dissociation of C–C and C–H bonds, which lead to different results, degradation and cross-linking, that may occur simultaneously as clearly detected for sample loaded 0.025 wt% of SWCNTs. Cross-linking is the predominant reaction of LLDPE for low γ-dose (φ
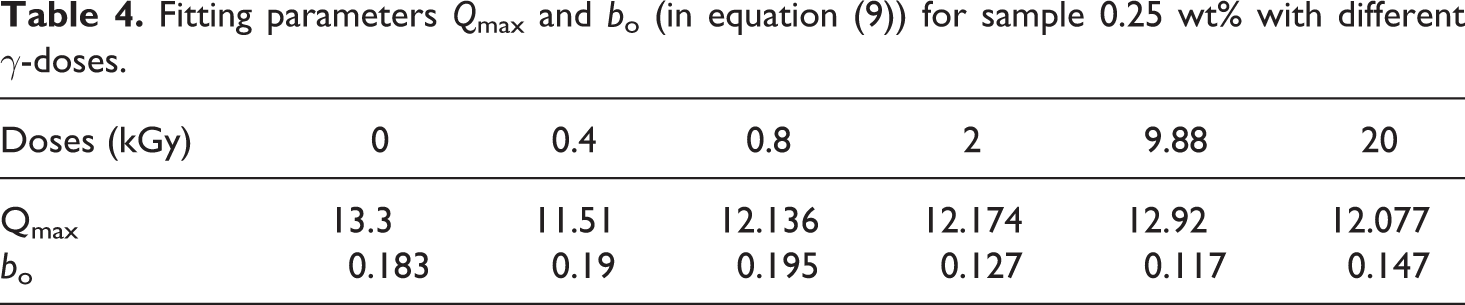
By using Langmuir’s equation (3) and calculating the slope and intercept for plot t/Q versus t for 0.025 wt% after irradiation as shown in Figure 15, the fitting parameters Qmax and b are greatly influenced by γ-doses as presented in Table 4. This indicates that γ-ray induces cross-linking (φ
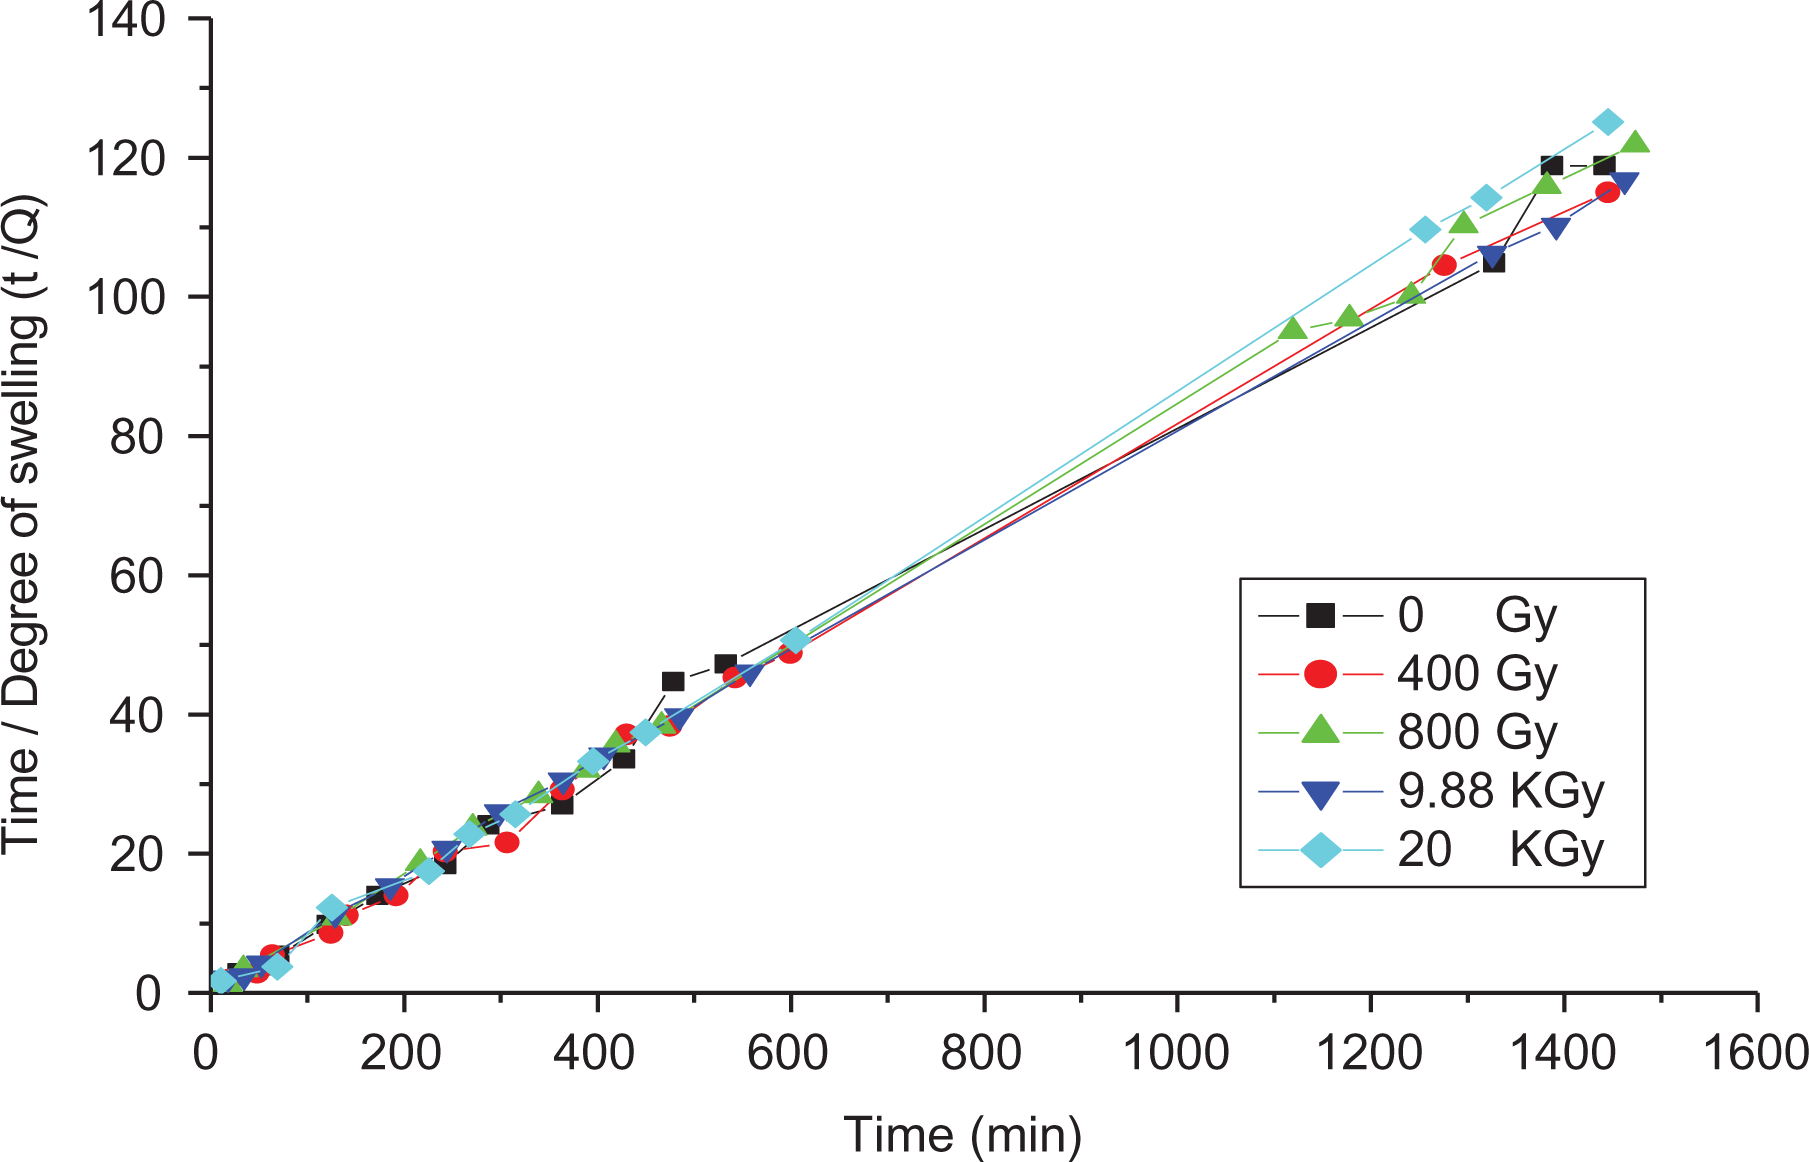
Dependence of t/Q on the time (min) to calculate the fitting parameters of Langmuir’s equation (3) for 0.025 wt% sample irradiated with different γ-doses.
Fitting parameters Qmax and bo (in equation (9)) for sample 0.25 wt% with different γ-doses.
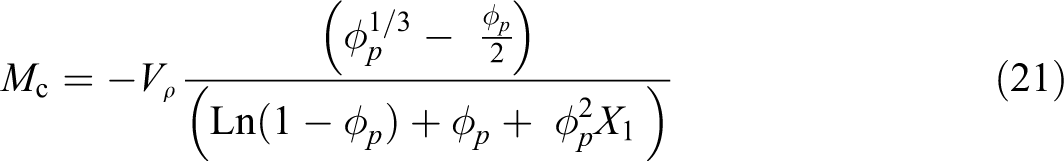
For determining the cross-linking density of polymers, a technique projected by Ebell and Hemsley 19 is used. This technique is predicated on the belief that most swelling occurs for the polymer in a liquid when the cohesive energy density (δ) of the liquid equals the CED of the polymer. When by experimentation determining the degree of swelling of irradiated 0.025 wt% samples at different γ-doses, the equilibrium degree of swelling is aforethought against the cohesive energy density of liquids as shown in Figure 16 that represents example of this relation for unirradiated 0.025 wt% sample. One master curve is obtained for all liquids, having a maximum at the abscissa corresponding to the cohesive energy density of polymer.
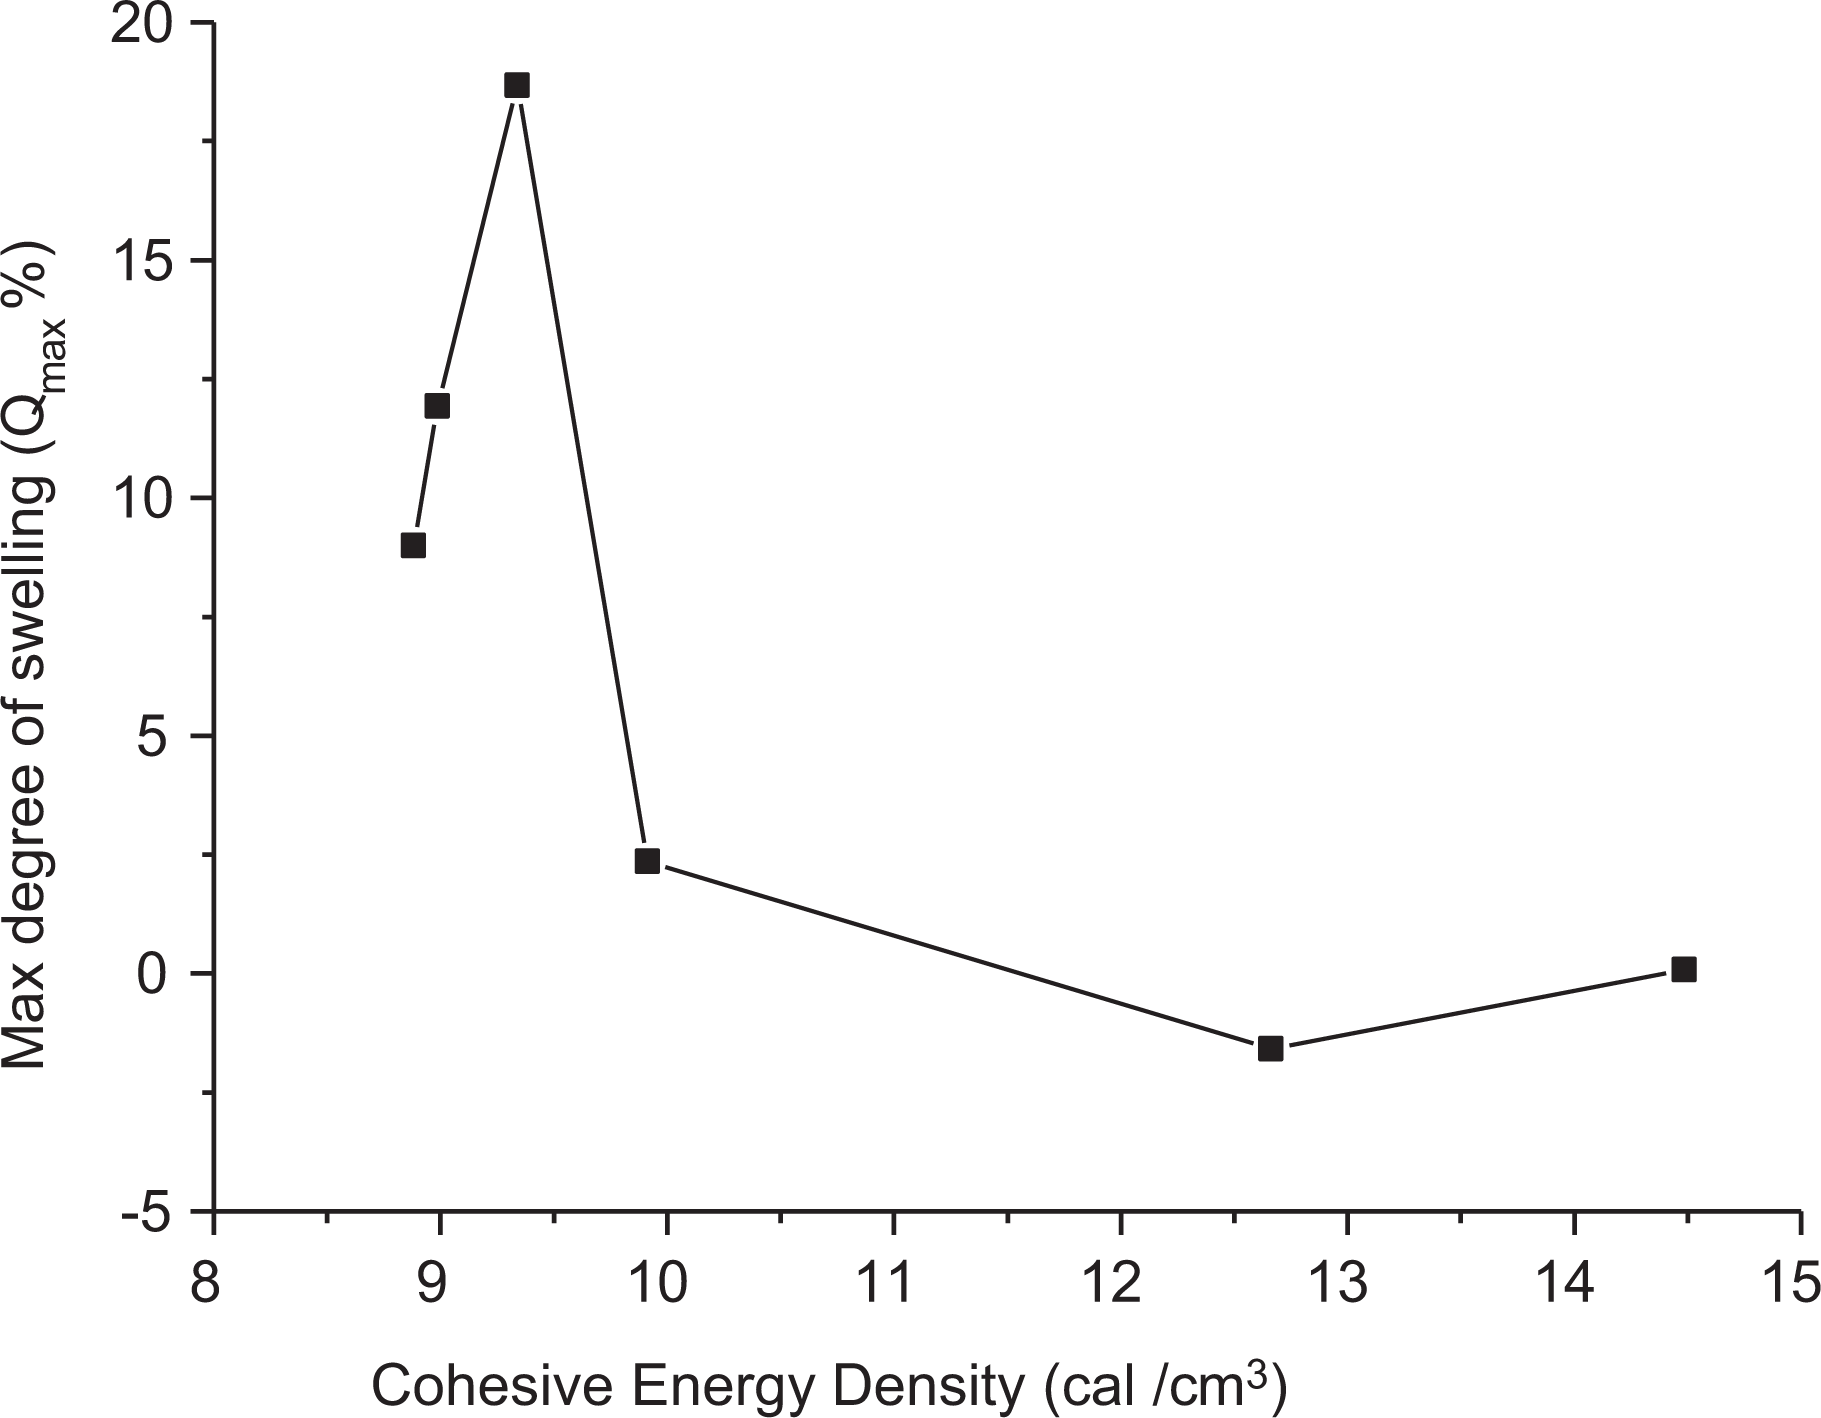
Relation between Qmax and cohesive energy density at zero dose (at 25°C).
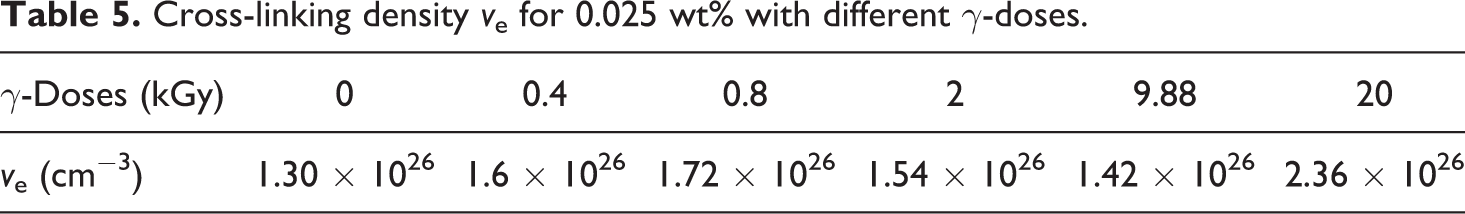
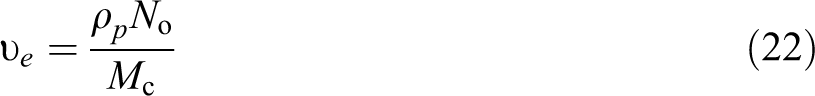
The Flory–Huggins 54 proposed a theory for the interaction parameter χ1 which calculated using equation (20) and by substituting this quantity into equation (20). It was observed that the CED value of 0.025 wt% sample does not change with the γ-dose. Meanwhile, the cross-linking density Ve, calculated by using equation (22), was appreciably increased slightly up to 0.8 kGy and decreased for higher doses that reflect the cross-linking and degradation processes caused by irradiation as presented in Table 5
Cross-linking density ve for 0.025 wt% with different γ-doses.
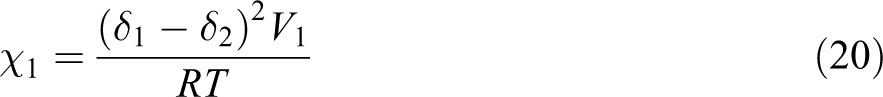
where δ1 and δ2 are the solubility parameter or the cohesive energy density for the solvent and polymer, respectively. V1 is the partial molar volume of the solvent
The cross-linking density related to density ρ, molecular weight Mc, and Avogadro’s No by
Dose dependence of the electrical properties
Figure 17(a) and (b) shows the relation between the DC electrical conductivity σdc measured at 25°C and the γ-irradiation dose, φ, for sample 0.025 wt% at low and relatively higher doses, respectively. It is clearly detected that σdc decreases linearly with γ-dose from 10 Gy up to 1000 Gy which reflects the usage of this sample as a dosimeter in this range of γ-doses. Meanwhile an abrupt increase in σdc at relatively high γ-dose (
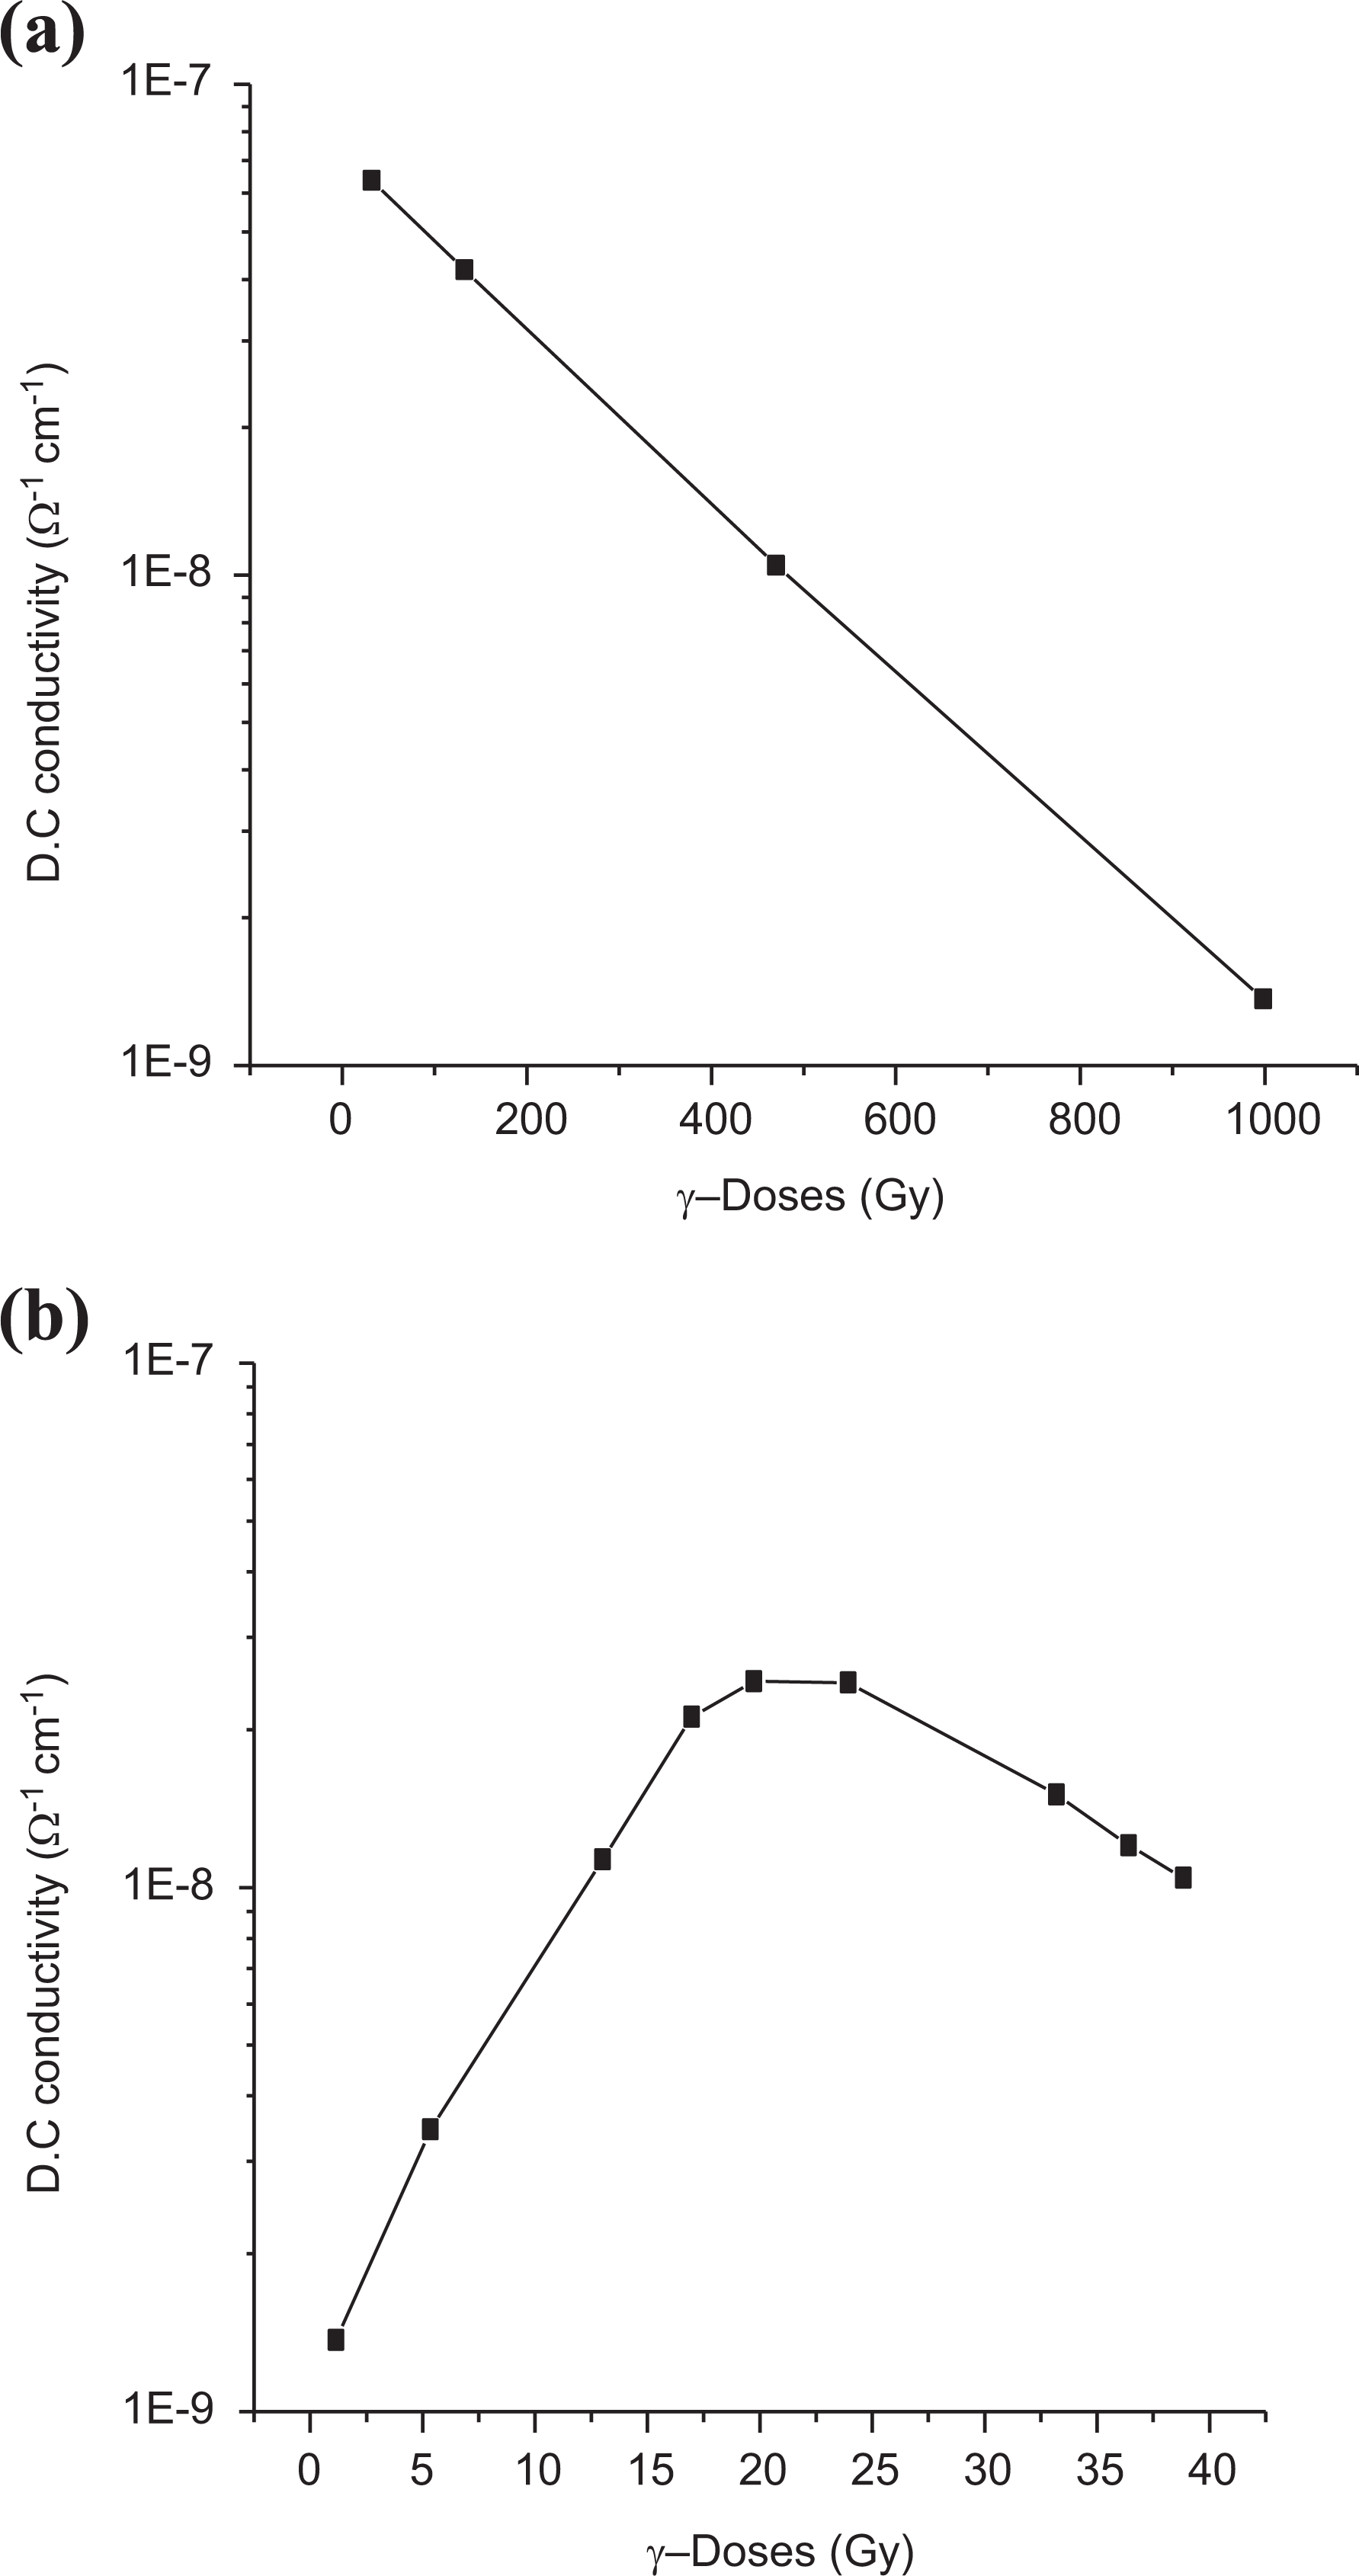
Dependence of DC electrical conductivity on the γ-doses (a) relatively low doses and (b) relatively higher doses.
In addition, it should be probable that the action of γ-rays on polymer leads to excitations of its molecules and creation of free electrons and ions that migrate through the polymer network until they are trapped somewhere, exploit deficient regions. These electronic and ionic configurations cause the changes in the electric conductivity of polymer composite. Generally, the main effects in polymers arise from the dissociation of primary valence bonds into radicals. 3
Figure 18 displays the conductivity composition plot of LLDPE/SWCNTs at different γ-doses. According to percolation theory, one expects a scaling law (as mentioned before) and the percolation threshold Wc is slightly changed with γ-dose.
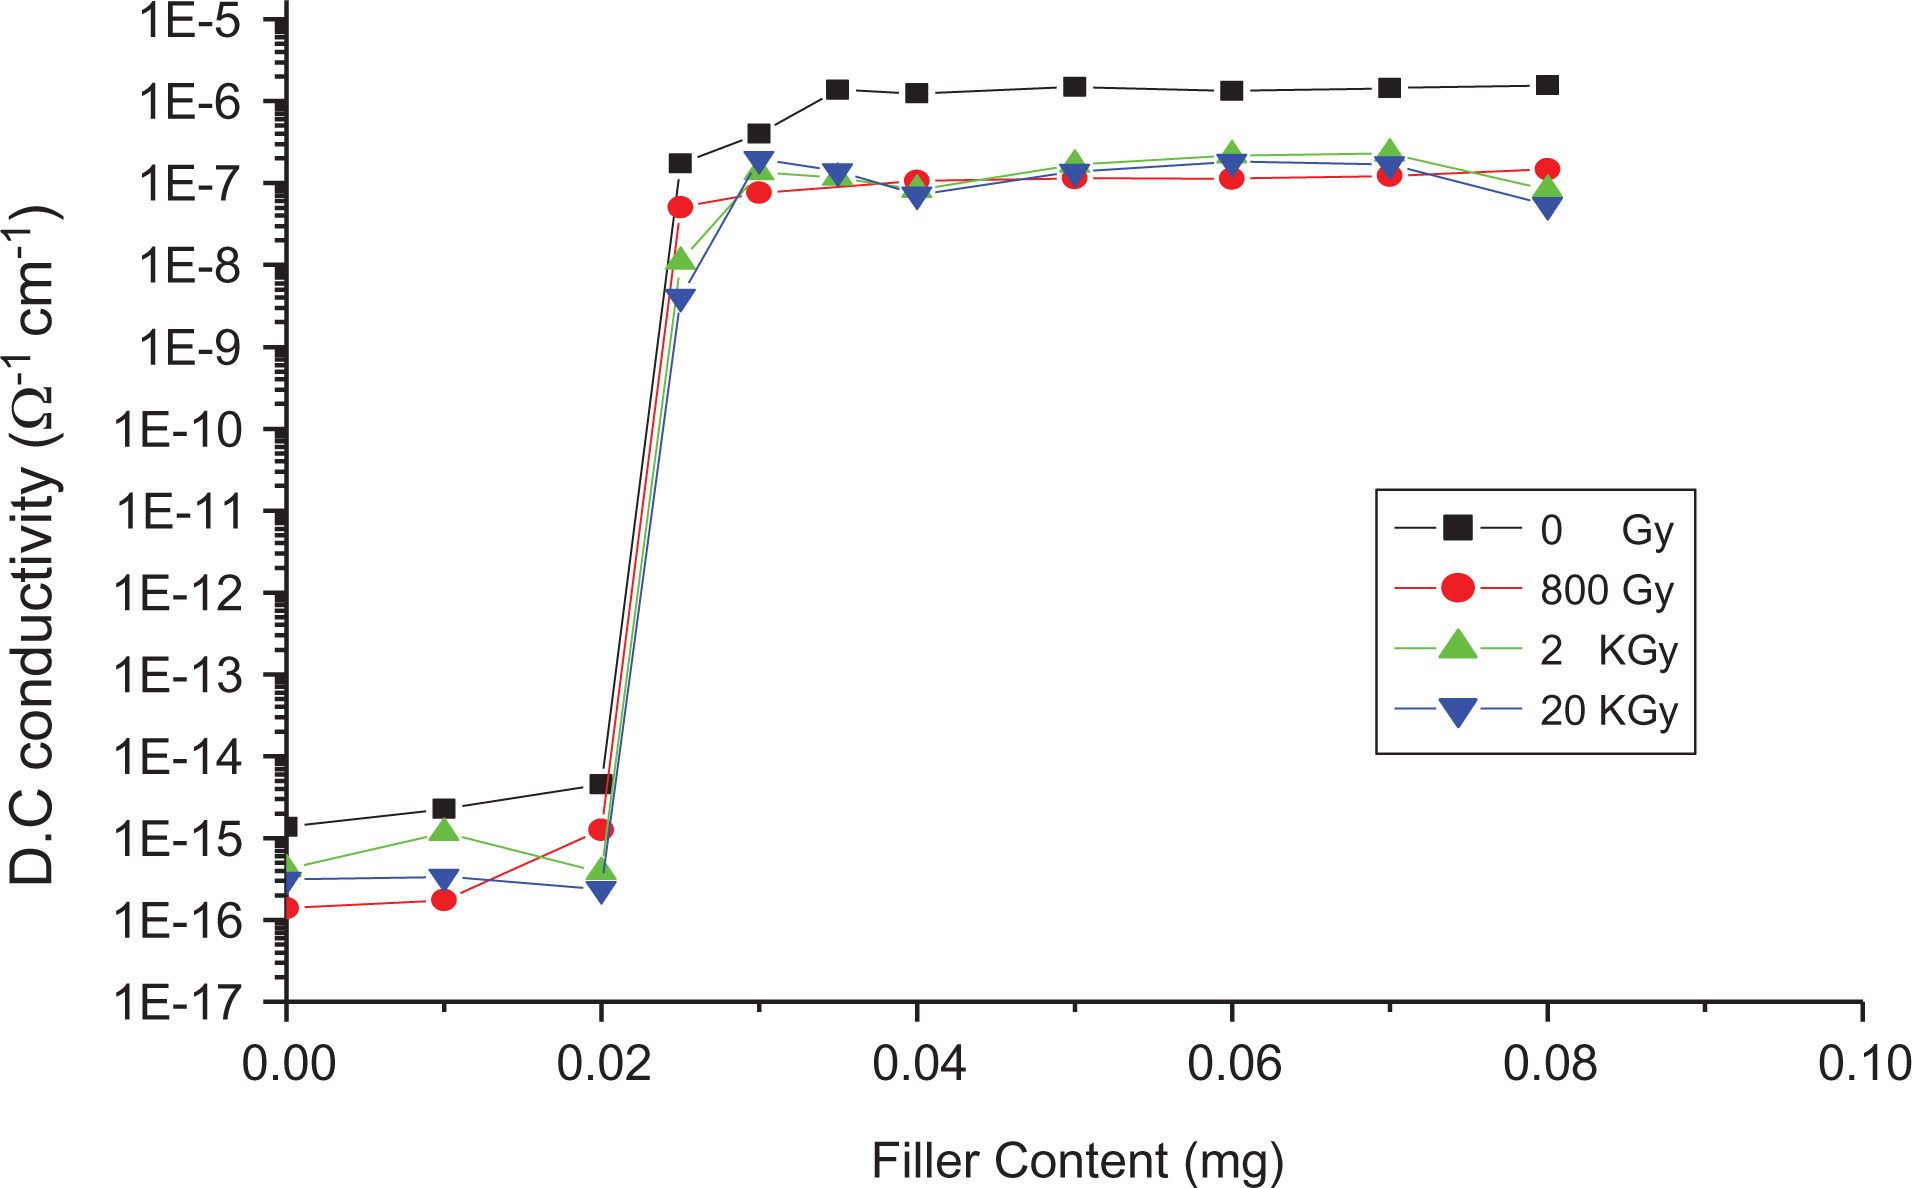
Dependence of DC conductivity on SWCNT content at different γ-doses.
Dose dependence of the J–E characteristics
As appropriate method to detect different degrees of dispersion and influence of γ-irradiation is based on the measurement of the DC as well as AC electrical conductivity of the polymer composite. Figure 19 represents the dependence of log J versus E at room temperature for 0.025 wt% unirradiated sample and irradiated one at different γ-doses. This dependence can readily be fitted to an empirical formula of the form 35
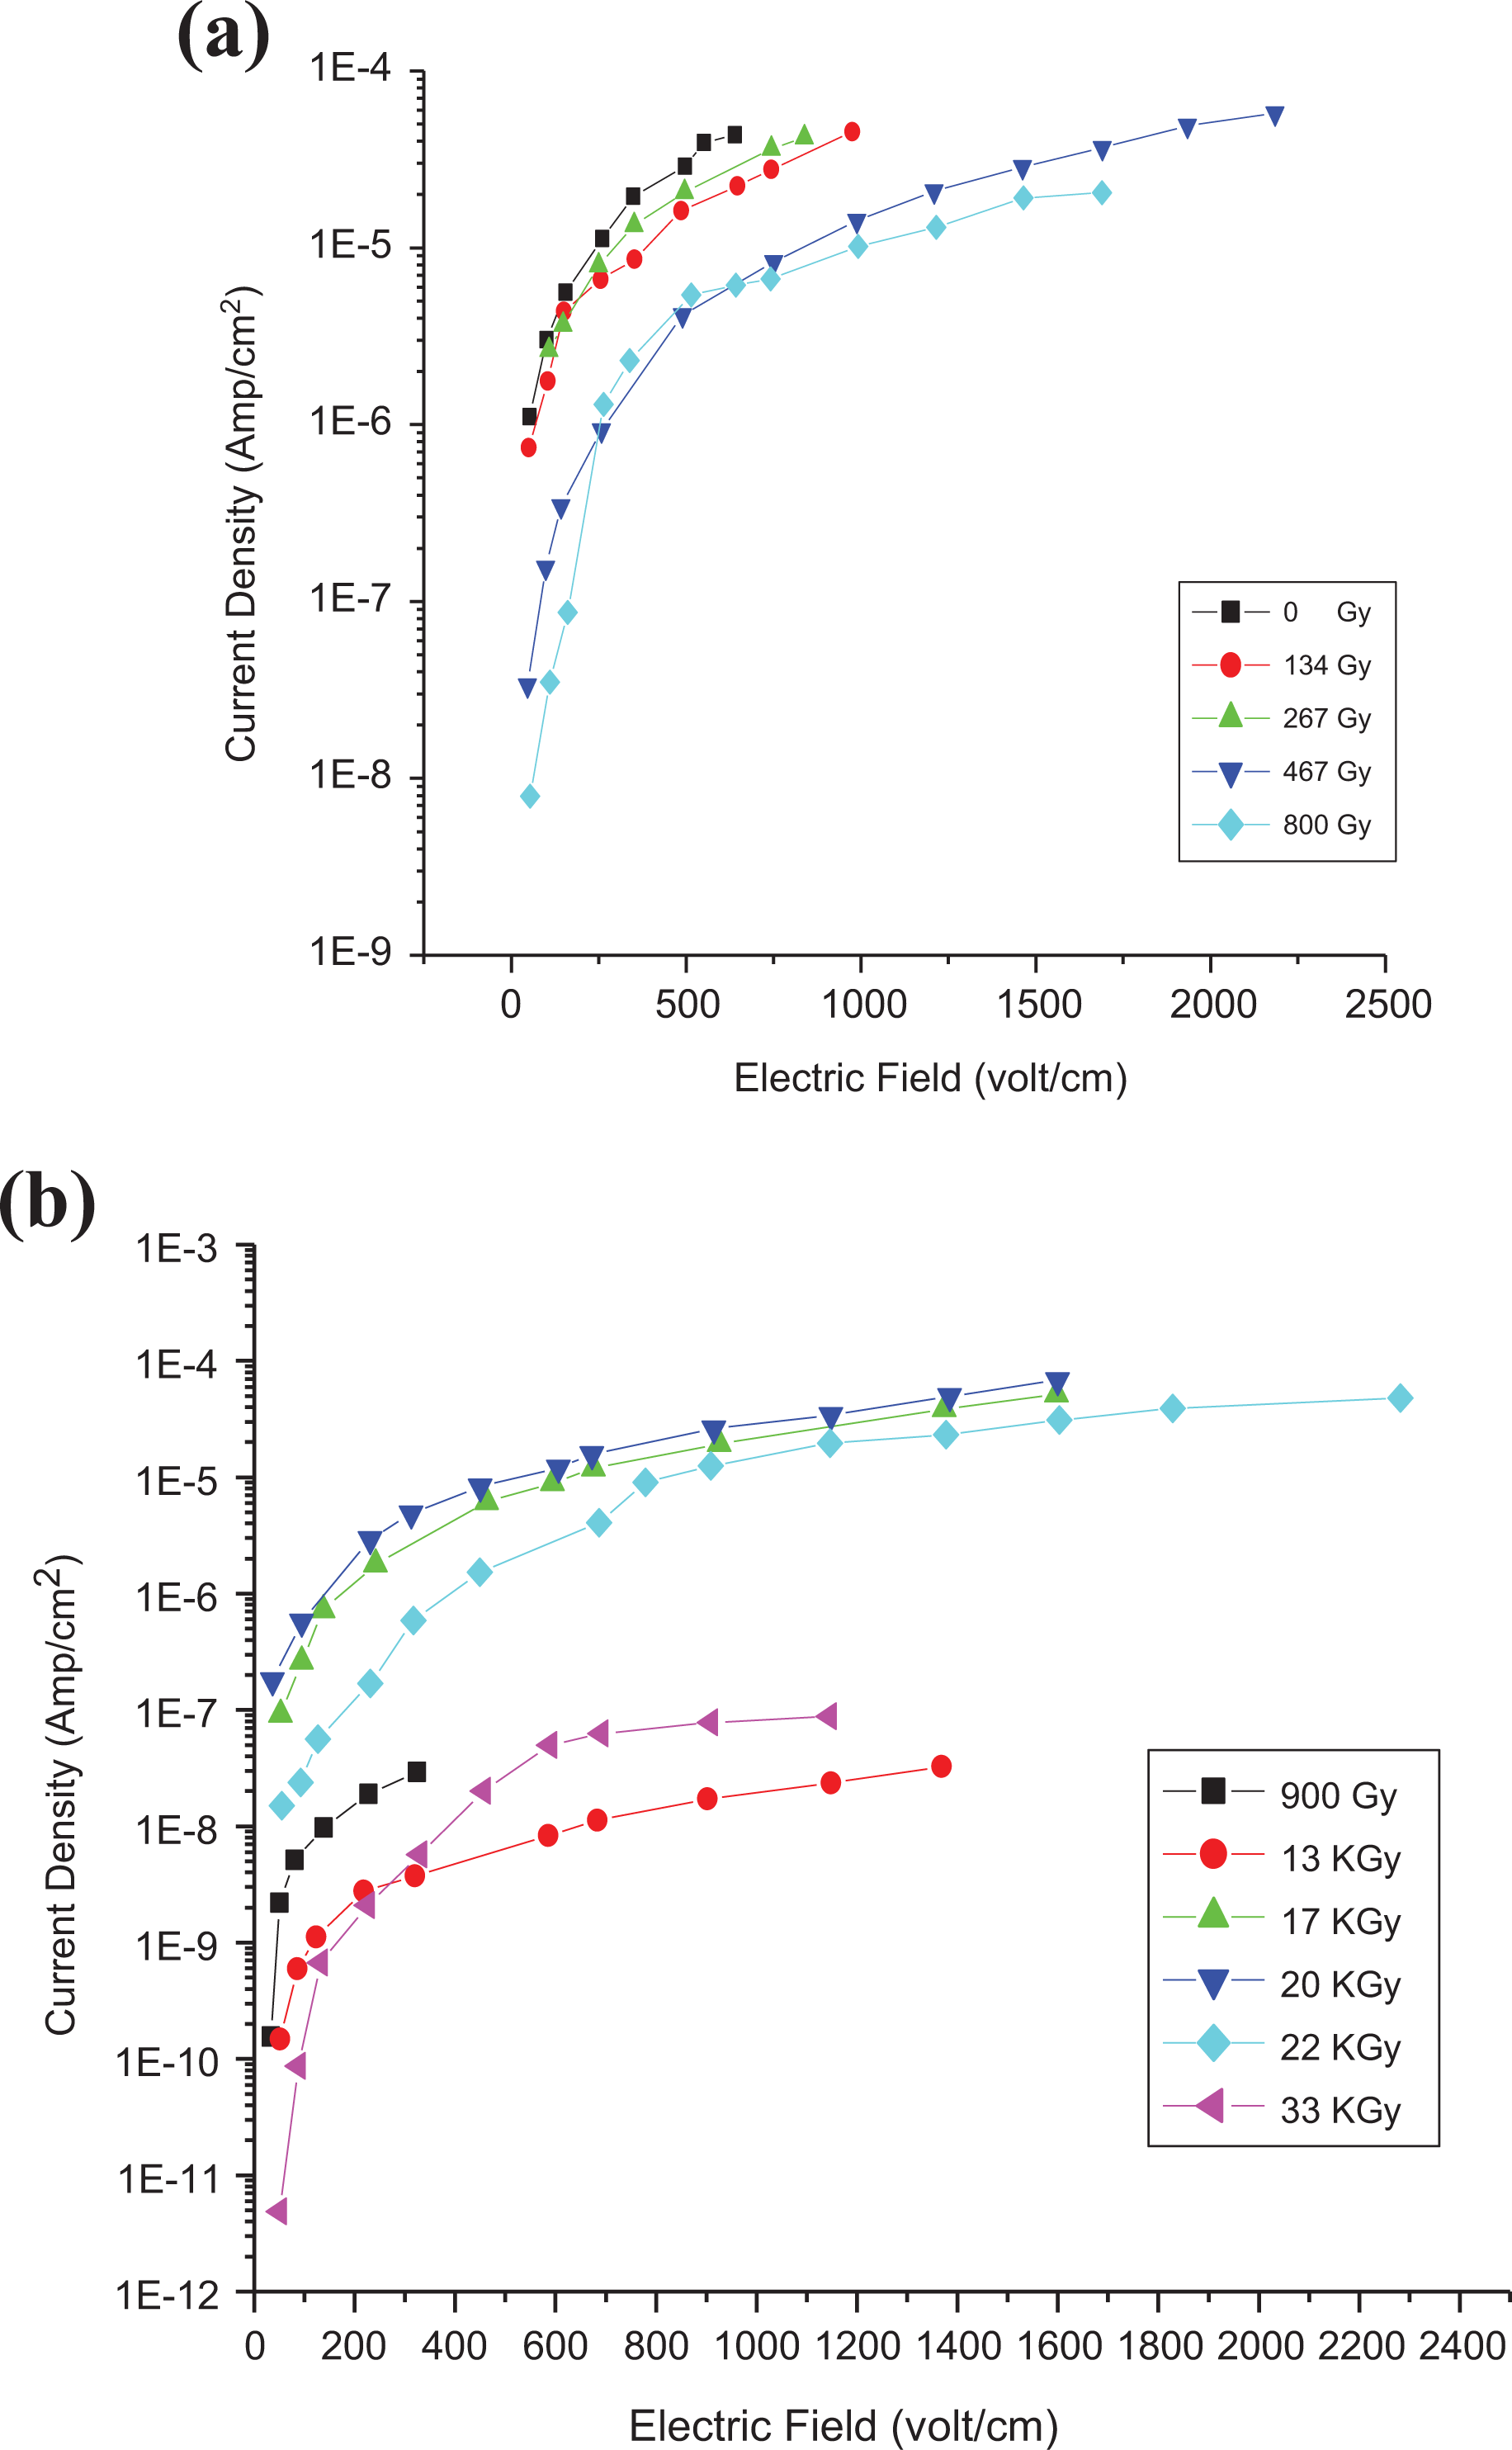
(a and b) Relation between the current density and electric field with different γ-doses for 0.025 wt% (at 25°C).

where ω = deE, k is Boltzmann’s constant, T is the ambient temperature, e is the effective electronic charge, d is the average separation distance between carbon particles or aggregates, and Jo is a fitting parameter which depends on both the carbon concentration and γ-irradiation dose.
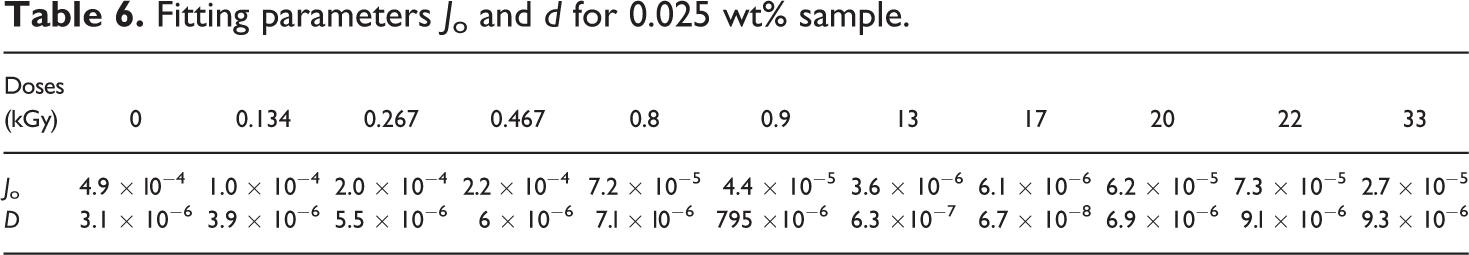
Using the iterative method, approximate values of d could be estimated from Figure 19 and are presented in Table 6. The interspacing distance between carbon particles decreases with CNT content as presented in Table 6. Meanwhile, it increases slightly with γ-doses (from 0 Gy to 800 Gy) followed by an appreciable decrease for doses
Fitting parameters Jo and d for 0.025 wt% sample.
Scanning electron microscope
It is well-known that the dispersion of CNTs within the polymer matrix and therefore the interfacial interactions between the polymer matrix and nanotubes are the key factors to ultimately confirm several properties of polymers/CNTs nanocomposites. A uniform dispersion of CNTs and strong interfacial interactions between them will effectively improve the thermal, solid mechanical, adhesive, and electrical performances of the nanocomposite. To reveal dispersion of SWCNTs within the LLDPE matrix, scanning electron microscope (SEM) observations were performed for cryo-fractured surfaces of LLDPE/SWCNTs nanocomposites, as shown in Figure 20(a) to (c).
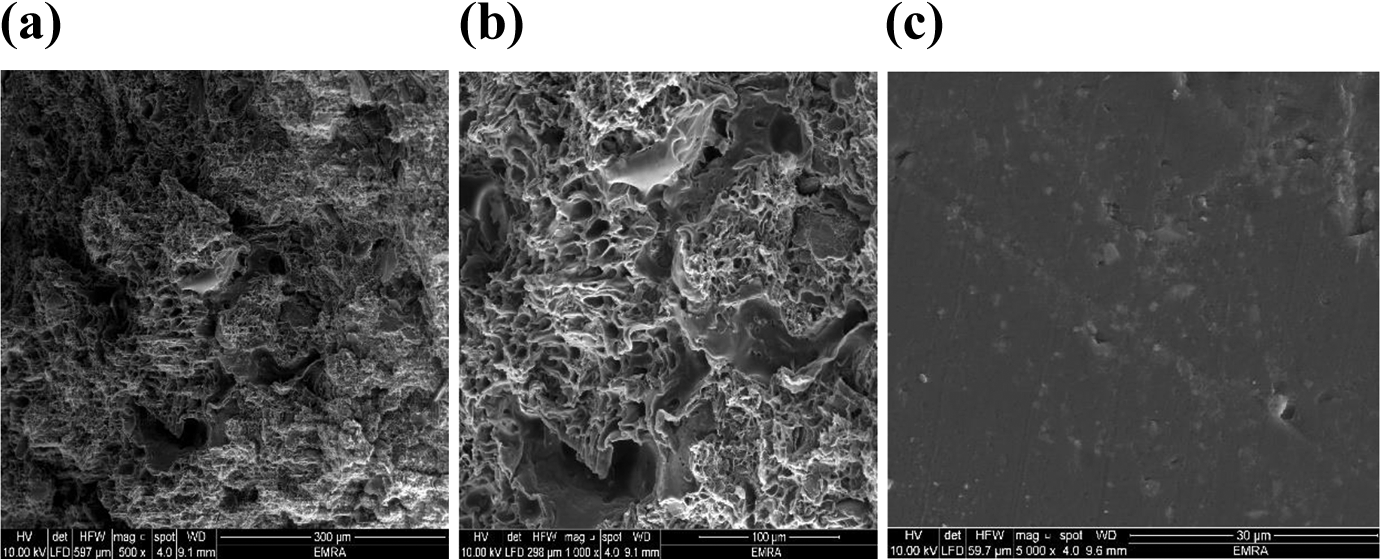
(a) to (c) SEM images of LLDPE/SWNTs nanocomposites in different scale.
The random spread bright dots due to SWCNTs’ high conductivity are the ends of the broken CNTs. Additionally, it is found that some SWCNTs are broken apart, and, as result of poor interfacial adhesion, some SWCNTs are forced out of the matrix before the breakage, forming caves on the broken surface; what is more, other SWCNTs are observed with their one end still strongly embedded within the LLDPE matrix as an inset. Such interesting and typical breakage phenomenon of the SWCNTs indicates that a powerful interfacial adhesion exists between SWCNTs and LLDPE matrix.
Wu et al. 78 and Bikiaris et al. 79 who reported that increasing the content of SiO2 ends up in larger agglomerates; this can be additionally the case in LLDPE/SWCNTs nanocomposites. In fact, there are additional or less agglomerates of SWCNTs formed in Figure 20(a) to (c). It has no value because of the strong interaction among the nanoparticles, the restricted shear force provided by the mixing device and therefore the high melt viscosity of polymer melts, particularly the high viscosity of the LLDPE melt (MFI regarding 1 g/10 min), may be not possible to pursue an efficient nanoscale dispersion of SWCNTs.
Morphology examination by HR TEM
In composite 0.025 wt%, transmission electron microscopy (TEM) techniques were accustomed to investigate the dispersion of SWCNTs within the LLDPE matrix in Figure 21(a) to (d). The SWCNT particles are well spread within the LLDPE matrix and form good conductive networks. However, SWCNT particle aggregation happens throughout the formation of conductive networks. The results show the accomplishment of high electrical conductivity with the addition of high percentage SWCNTs. One will observe the networks of SWCNTs in LLDPE matrix at a higher magnification.
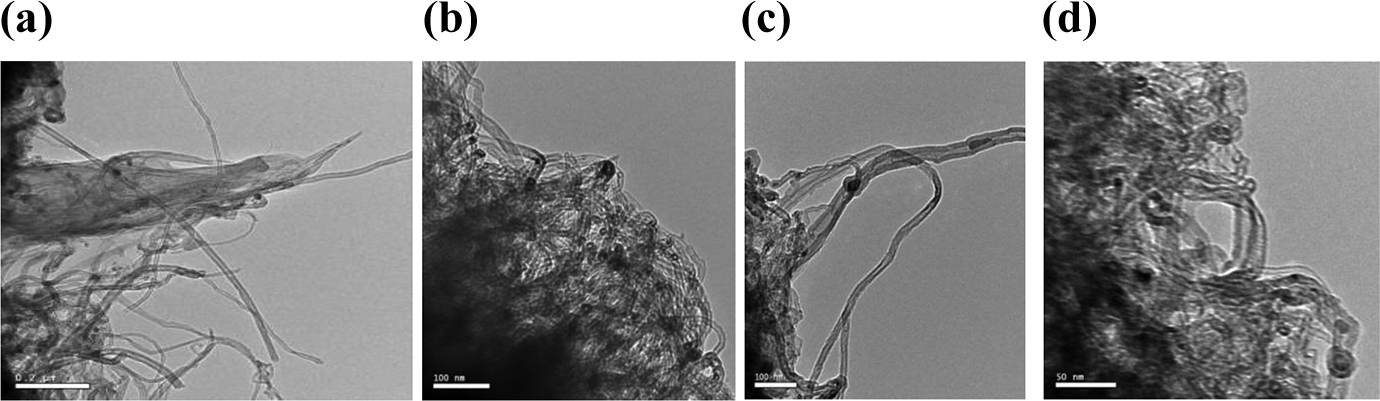
(a) to (d) TEM images of LLDPE with SWNTs in different scales.
Conclusions
SWNTs were dispersed into an LLDPE matrix through casting technique with 0.01, 0.02, 0.025, 0.03, 0.035, 0.04, 0.05, 0.06, 0.07, and 0.08 wt%. Electrical properties showed that the SWCNTs have a positive slope of Kraus equation indicating a good polymer–filler interaction. The CNT aggregation delays the penetration rate, P, and diffusion coefficient, D, in the polymer matrix as a result of the good reinforcement of the LLDPE samples. The percolated threshold of SWCNTs in LLDPE was found to be around 0.02 wt%. High PTCC intensity was detected for LLDPE loaded with 0.01 wt% of SWCNTs. Meanwhile, higher NTCC intensity was detected for 0.03, 0.04 wt% SWCNT-loaded sample. All samples exhibited relaxation frequency ωR which altered with the SWCNT content in the dependence of their dielectric loss on frequency. The dielectric constant ε′ increases sharply after the percolated threshold (around 0.02 wt%) of SWCNTs. Cross-linking is the predominant reaction of LLDPE for low γ-dose (Φ