
Abstract
In this work, response surface methodology (RSM) in combination with central composite design was employed to study the effect of independent variables on the nanoporous characteristics of silica aerogels prepared via ambient pressure drying. Different techniques such as attenuated total reflection–Fourier transform infrared, field-emission scanning electron microscopy, Brunauer–Emmett–Teller, and thermogravimetric differential thermal analyses were used to characterize the aerogel samples. The independent variables in this study were water:Na2SiO3 and trimethylchlorosilane (TMCS):Na2SiO3 volume ratio. The results showed that contemporaneous change of these factors affects the porous structure of silica aerogels considerably. Actually, when water:Na2SiO3 and TMCS:Na2SiO3 volume ratio were 6–7 and 0.8–1.4, respectively, specific surface area was maximum (∼660 m2 g−1). In addition, in this range, mean pore diameter was minimum, approximately 18 nm. Generally, the increasing water:Na2SiO3 volume ratio (to about 8), and the simultaneous increase of TMCS:Na2SiO3 volume ratio (to about 1.6), led to the decrease of mean pore diameter, while the density of the aerogels increased slightly. The combination of using low-cost precursors and ambient pressure drying method followed by applying RSM for producing silica aerogels with optimized properties is a key step toward commercializing these materials. Such a porous structure is ideal for thermal insulation applications.
Introduction
Aerogels are three-dimensional (3-D) solid networks of silica particles that own a wide diversity of extraordinary properties like high porosity, high specific surface area, low density, and extremely low thermal conductivity. 1,2 Due to having such outstanding characteristics, they have found excellent potential for many applications such as acoustic and thermal insulation, thickening agents in paints, catalysis, thermal superinsulators for solar energy systems, transparent windows insulators, domestic uses, and electronics. 2 –6 Among all recognized aerogels, silica aerogels are the most common ones that have gained significant attention over the last two decades. 2,7 However, these materials have a fragile structure that limit their applications. So, high durable silica aerogels, with a more strength and stiffness network, can be obtained via reacting proper introduced functional groups on the surface of silica aerogels with different organic polymers. 2,8,9 One of the most important applications of silica aerogel is in the field of thermal insulation as monoliths or additives. 10 An increasing number of studies have considered the mechanical and thermal properties of polymer/silica aerogel composites. 11,12 Krishnaswamy et al. studied the thermal properties of nylon 6/silica aerogel composites and considered the effect of extrusion and compression molding on their performance. 13
Traditional synthesis of silica aerogels have been restricted by different alkoxides as precursors and supercritical drying process. 14 –16 However, in recent years, there has been growing interest in ambient pressure drying of aerogels and also using inexpensive precursors such as sodium silicate rather than alkoxides because of lower price production and safety issues, with the aid of facilitating their commercialization. 1,17 –19 Generally, there is a considerable number in the literature that dealt with effective factors on structural properties of silica aerogels. 20,21 Motahari and coworkers studied the effect of water content on structural characteristics of tetraethyl orthosilicate (TEOS)-based silica aerogels and found that the aerogels with 1.5 or 2 molar ratio of H2O/TEOS not only had the highest surface area but also displayed lower density and satisfactory gel integrity. 22 They showed that the aerogels produced with higher amount of water were denser and their porosity was reduced. He et al. synthesized sodium silicate-based super hydrophobic silica aerogels via single step sol–gel processes under ambient pressure drying. 20 To gain the highest specific surface area followed by the lowest density, it was found that the best volume ratio of water to sodium silicate is 4, so that the molar ratio of SiO2 to Na2O was 3.55 in the sodium silicate solution (32%). Also, Hwang et al. found that for preparing aerogels with high porosity (∼94%) and specific surface area (∼675 m2 g−1), the best amount of Na2O/SiO2 is 1:3.3 and the silica content in the sol must be in the range of 4–8 wt%. 23
So far, many reports have been published on the effects of surface modifying agents (surface chemical modification) on the physical properties of silica aerogels. 24 –26 Various surface-modifying agents such as trimethylchlorosilane (TMCS) and trimethylethoxysilane were used for silylation with different volume ratio of silylating agent/Na2SiO3. 17,21,27,28 Cheng et al. prepared silica aerogel using fly ash acid sludge and considered the effect of TMCS as surface modification agent on the textural and physical properties of the aerogel. 17
In general, preparation of sodium silicate-based crack-free silica aerogels strongly depends on synthesis conditions such as water:Na2SiO3 and TMCS:Na2SiO3 molar ratio, pH sol, exchanging solvent, and amount of pore water after exchanging and drying method. 23,29
The influence of the synthesis conditions on the porous structure of silica gels have been widely considered, 21,28,30,31 but most of the authors investigated one variable implicitly assuming that the variables are independent. While in many cases, interactions among the variables affect directly the final properties of the product. Response surface methodology (RSM) is a group of mathematical and statistical techniques based on the fit of a model to the experimental data. It is extensively used for improving and optimizing procedures in which the selected response is influenced by a number of independent variables, alone or in combination. 32,33
Limited number of research studies have been published in the case of studying structural characteristics of silica aerogels using RSM: mostly carried out with expensive precursors such as TEOS. 34,35 In this study, RSM with central composite design (CCD) was used to investigate the effect of processing variables on textural properties of silica aerogels based on sodium silicate as a cheap, available, and nontoxic material. We studied the simultaneous effect of water and TMCS, including water:Na2SiO3 and TMCS:Na2SiO3 volume ratio. In addition, the effect of other variables such as pH, aging time, and solvent type was disregarded on account of the fact that these variables have been studied extensively. 2,20,30,36,37 The research studies in the literature drew our attention to using n-hexane as the exchanging solvent at a constant ratio. 20,22 Acetic acid as a reaction catalyst was also chosen based on the importance of the sol pH and solubility of the resulting salt which can be removed from the pores of the hydrogel. 38,39 Furthermore, the hydrogels were formed in one step and without using ionic-exchanging resin. The main purpose of the present study was to obtain aerogels with tailored density, specific surface area, and mean pore diameter to be used as ideal additives for improvement of thermal properties of composite insulators.
Experimental procedure
Preparation of silica aerogels
Sodium silicate solution (Na2SiO3 content 36 wt%, Na2O:SiO2 = 1:3.33) as precursor, acetic acid as an acid catalyst, and isopropanol and n-hexane as exchanging solvents were purchased from Merck. TMCS as surface-modifying agent was obtained from Dae-Jung (Korea). Double-distilled water was used for the preparation of the solutions and washing the hydrogels.
Generally, a single-step sol–gel process followed by ambient pressure drying was used to prepare silica aerogels (Figure 1). Firstly, silica hydrosol was prepared by adding water and acetic acid to sodium silicate solution under continuous stirring. For the preparation of the hydrogels, temperature was kept constant at 50°C. After formation of hydrogel, the gel was aged at 50°C for 5 h to strengthen its network. Then, the hydrogel washed with water three times. To solvent exchange and remove water from the pores of the hydrogel, the gel was soaked in isopropanol and n-hexane once for 24 h each. The surface chemical modification of the alcogels were carried out using a mixture of TMCS/isopropanol/n-hexane for over 24 h. Finally, the silylated gel was washed with n-hexane and dried at room temperature gradually (controlled evaporation of pore liquid in the n-hexane atmosphere). Afterward, to ensure complete drying, the dried gels were heat-treated in the oven at 50°C and 150°C for 5 h and 1 h, respectively.
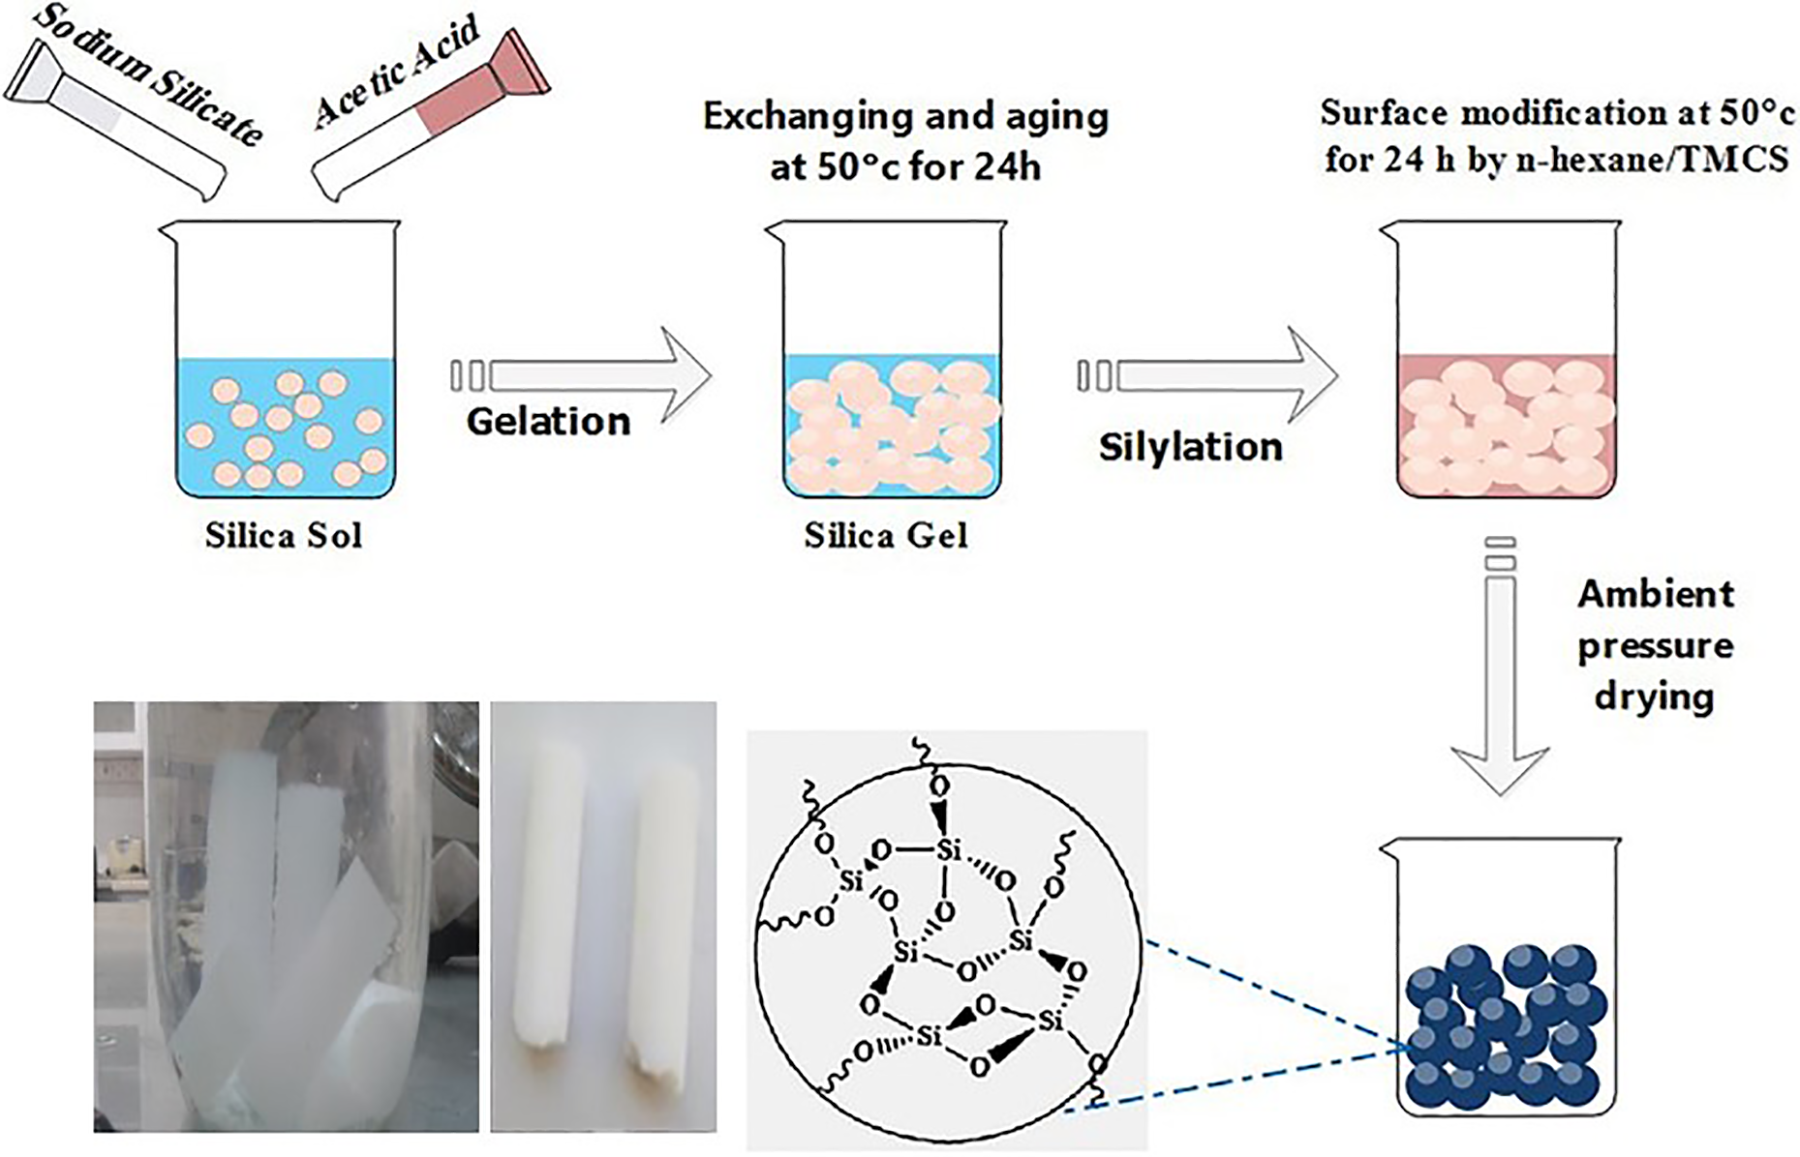
The schematic representation of silica aerogel synthesis processes (the microstructure of silica aerogel was driven from Maleki et al. 2 ).
Characterization
The bulk density of the aerogels was calculated in terms of the mass to volume ratio. Most of the obtained aerogel samples were cracked monolithic pieces. However, according to the synthesis conditions, some crack-free monolithic pieces of the aerogels (Figure 1) can be obtained. The mass of the sample was measured with a microbalance with an accuracy of 10−5 g, and the volume of the aerogel pieces were measured by Vernier calipers with least count of 0.005 cm. 40 All the measurements were taken at least five times for each sample, and the average value was taken as the sample density. The porosity of the aerogel samples was calculated by the following formula 37 :
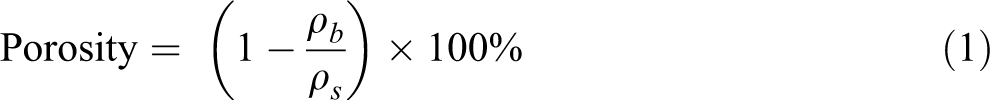
where ρb is the bulk density and ρs is the skeletal density of the silica aerogel which is equal to 2.2 g cm−3. The specific surface area of the samples was determined using nitrogen sorption–desorption isotherms by Brunauer–Emmett–Teller analysis (BELSORP-mini II, Japan). In particular, the pore size distributions (PSD) and mean pore diameter were estimated by Barrett–Joyner–Halenda (BJH) method and desorption isotherm data. After heat-treating the samples in the oven and before the measurement, the silica aerogels were degassed at 200°C for 2 h. The microstructure and morphology of the aerogels were probed using field-emission scanning electron microscopy (FESEM; TESCAN-XMU, Czech). The surface modification of the aerogels was investigated using Fourier transform infrared spectroscopy (FTIR; Thermo Nicolet Avatar, Madison, Wisconsin, USA). The thermal stability and oxidation temperature of –CH3 group on the surface of the silica aerogel cluster was evaluated by thermogravimetric analysis–differential thermal analysis (LINSEIS, TGA-DTA) by heating the aerogels from room temperature to 800°C at a heating rate of 10°C min−1 in an air flow of 25 ml min−1.
Experimental design
Design Expert Software, version 11, based on RSM in combination with CCD was used to perform the statistical analysis and create the regression model. Generally, a CCD has three groups of design points: (a) two-level factorial or fractional factorial design points, (b) axial points, and (c) center points. 41,42 Alpha values depend on the number of variables, so that often a star design (axial points sometimes called “star” points) in which experimental points are at a distance α from its center. For a two-factor design, the star points are the following: (−α, 0) (+α, 0) (0, −α) (0, +α). Totally, for two, three, and four variables, they are 1.41, 1.68, and 2.00, respectively.
To study the effect of water and TMCS on the physical properties of the aerogels, the water:Na2SiO3 and TMCS:Na2SiO3 volume ratio as independent variables were varied from 3.2 to 8.8 and 0.5 to 2.5, respectively. Table 1 displays the range of the independent variables and experiment design levels used in this study. These variables together with their corresponding ranges were selected based on the preliminary studies.
Experimental values related to the codified values (α values).

TMCS: trimethylchlorosilane.
The number of experiments were calculated from the following equation 41,43 :

where N is the total number of runs, n is the number of independent variables, and nc is the number of replicates at the center points. Therefore, according to CCD, the number of experimental runs was 10, which consists of 4 factorial points, 4 axial points, and 2 center point replications.
Results
The experimental design and actual response of the experiments are presented in Table 2. According to the desired response, the mathematical model as a function of designated variables was established by applying the multiple regression equation on the data.
The experimental design with coded values of the variables and actual responses of the experiments.
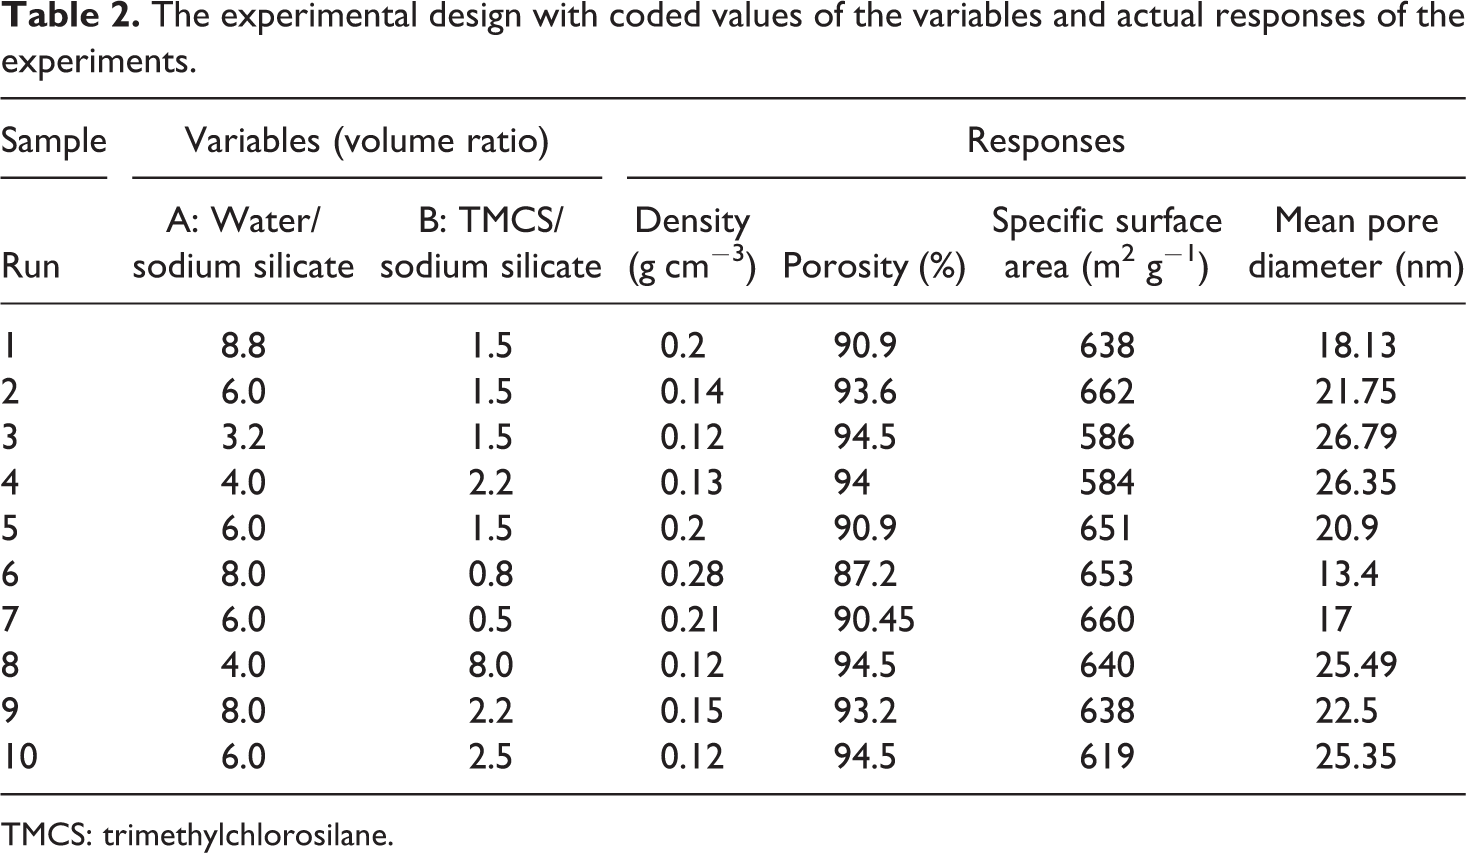
TMCS: trimethylchlorosilane.
Characterization of the synthesized aerogels
The chemical structure and surface modification of the samples was investigated using attenuated total reflection–Fourier transform infrared (ATR-FTIR) technique. As shown in Figure 2, apart from the Si–O–Si absorption peak at about 1060 cm− 1, the presence of strong absorption peaks at around 845 and 1254 cm− 1 are related to the deformation and stretching modes of Si–C bonds. Also, the absorption band at around 2960 is related to C–H functional group. 21 These bands correspond to the terminal Si–CH3 and –CH3 groups, confirming the surface modification of the aerogels. Furthermore, it is revealed that with the progress of the surface modification reaction, the intensity of the –OH peak at 3500 and 1600 cm− 1 decrease and the peaks height corresponding to the C–H and Si–C functional groups increase. 21,44
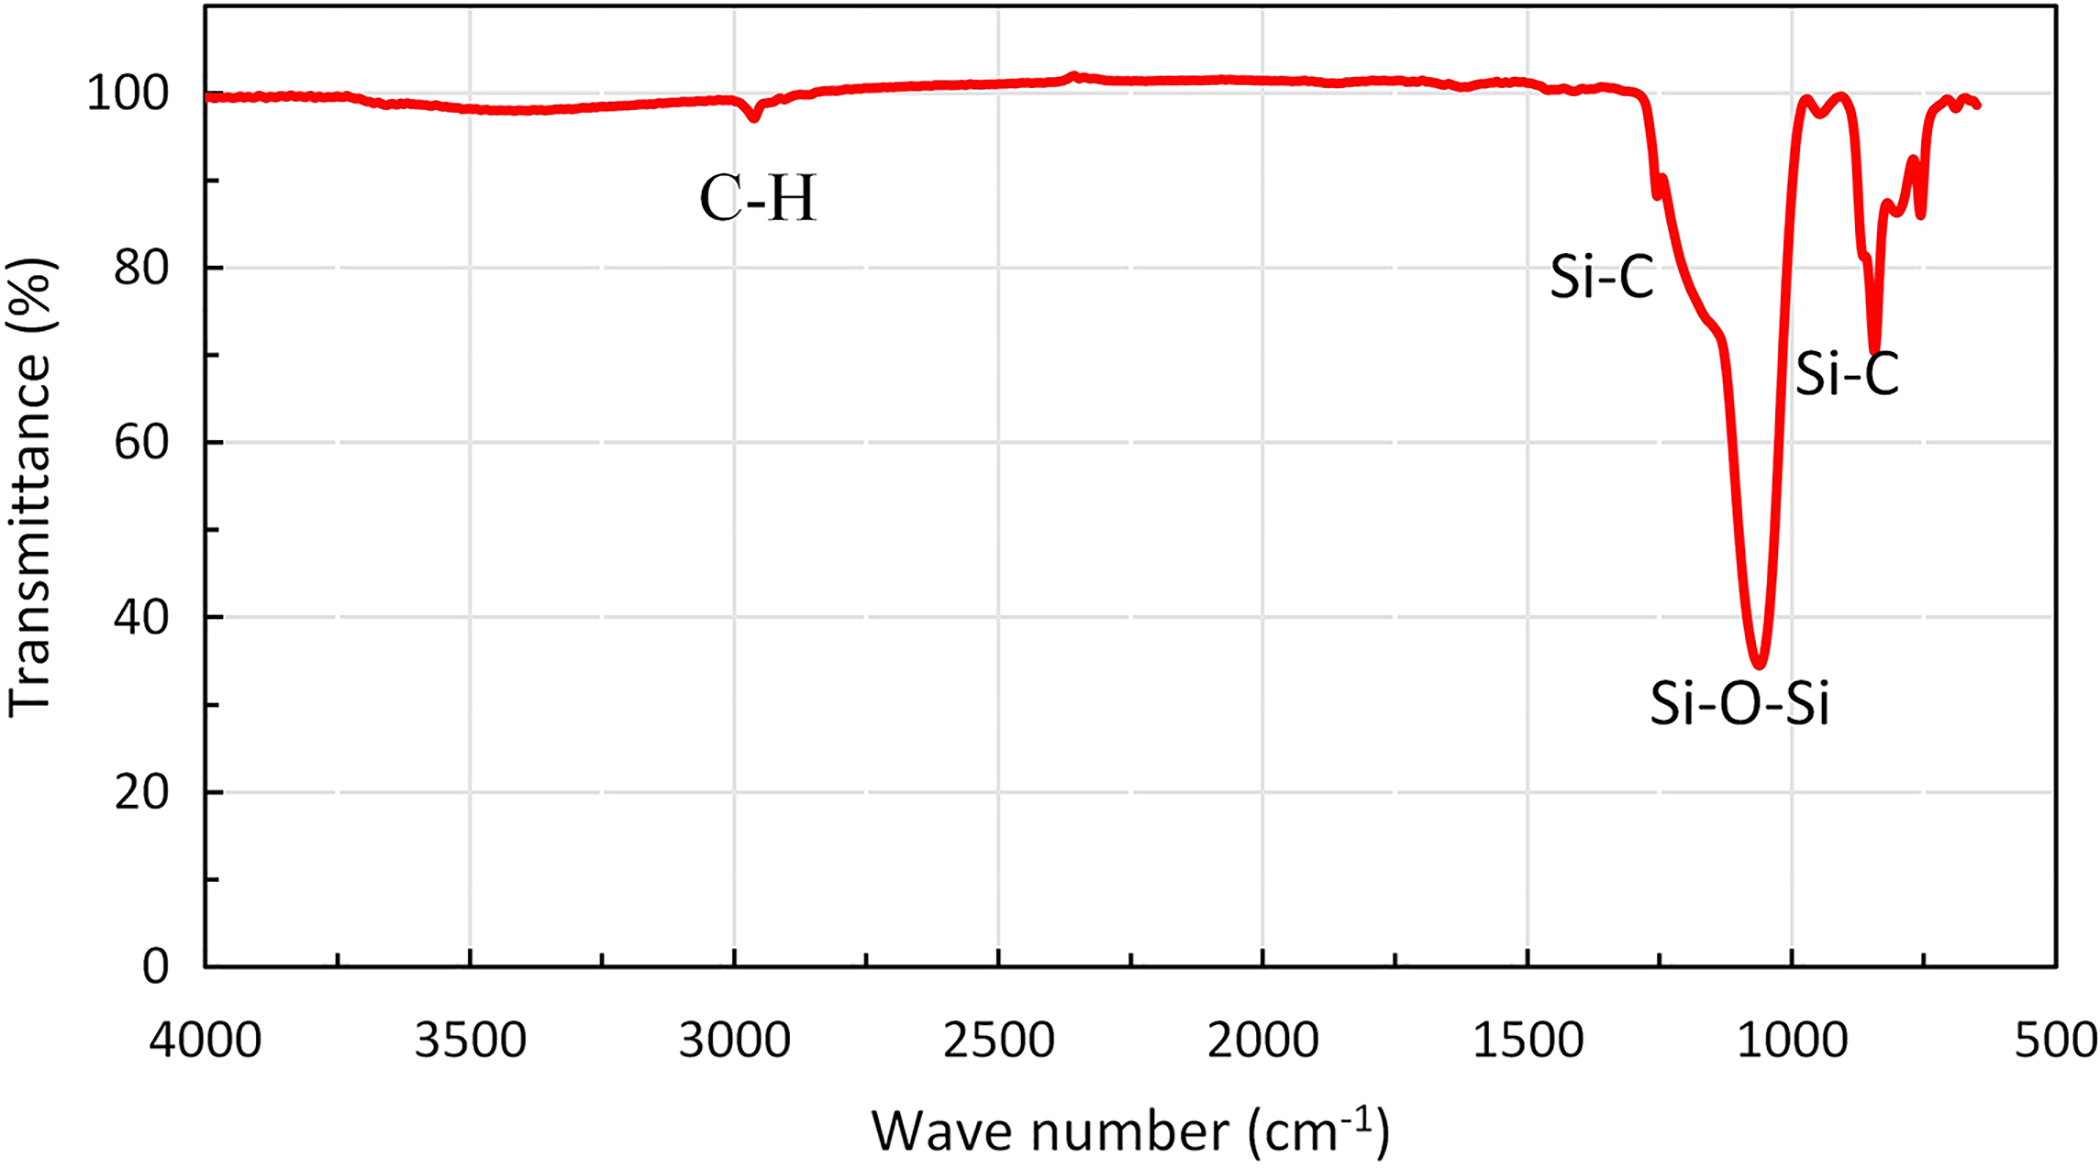
ATR-FTIR spectra of a typical aerogel sample.
The microstructure of the silica aerogel samples was probed using FESEM. As shown in Figure 3, due to the surface modification of the silica aerogel (inert CH3 groups) and spring back effect during drying process, a highly porous structure was observed. The most remarkable result to emerge from the image is that there are no great differences between texture of synthesized aerogels prepared by sodium silicate under ambient pressure drying and that of common route (using silica alkoxides and supercritical drying technique). 19,26,44
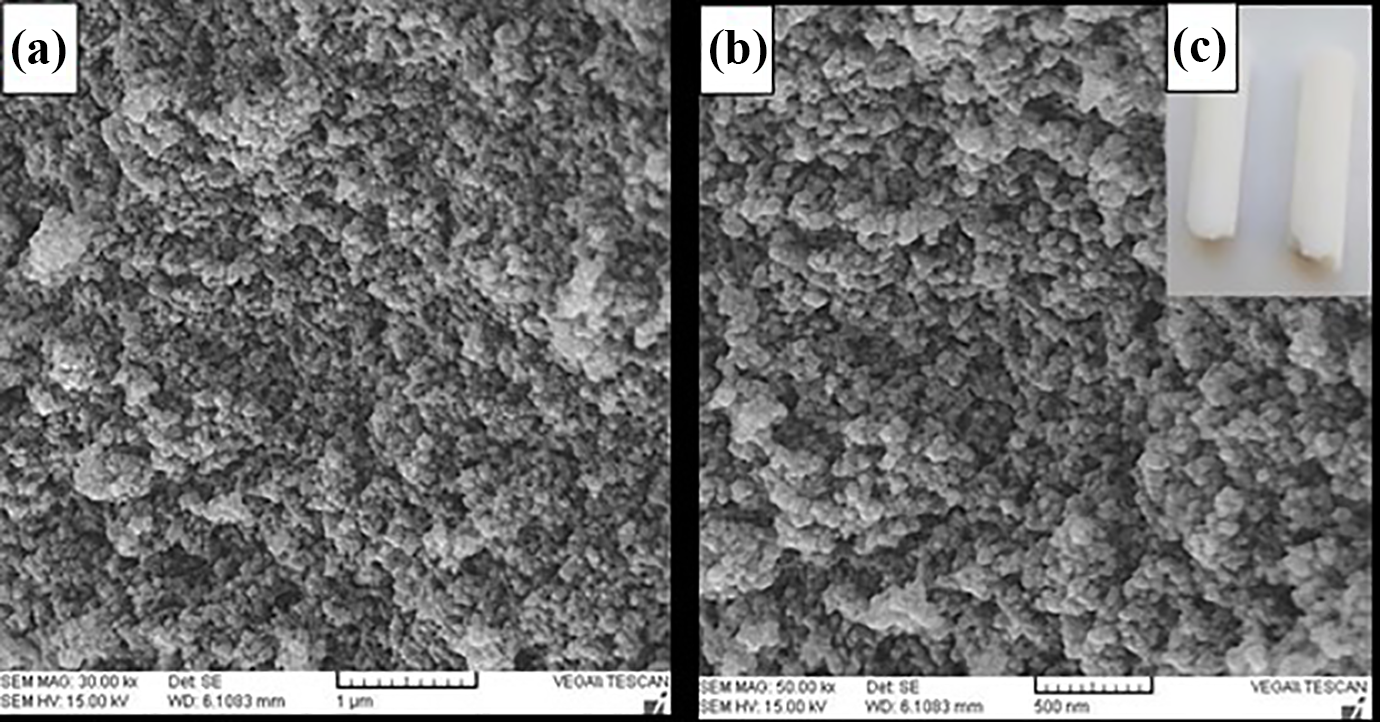
(a) and (b) FESEM image of the synthesized silica aerogel sample via ambient pressure drying with different magnifications and (c) monolith photographs.
TG/DTA curve of a typical silica aerogel sample is demonstrated in Figure 4. Due to the hydrophobic –CH3 groups on the gel surface, the silica aerogel has hydrophobic nature after the surface modification reaction. As shown in Figure 4, there is only a negligible mass loss before 100°C, which is related to the evaporation of the adsorbed water (to the –OH groups). Because of oxidation of the –CH3 groups on the surface of the silica cluster under high temperatures (above 400°C), they gradually gained hydrophilic nature bringing about a sharp decrease in the thermogram. 19,21,38 Evaporation of the residual solvent and side products in the gel network structure causes weight loss before 250°C.
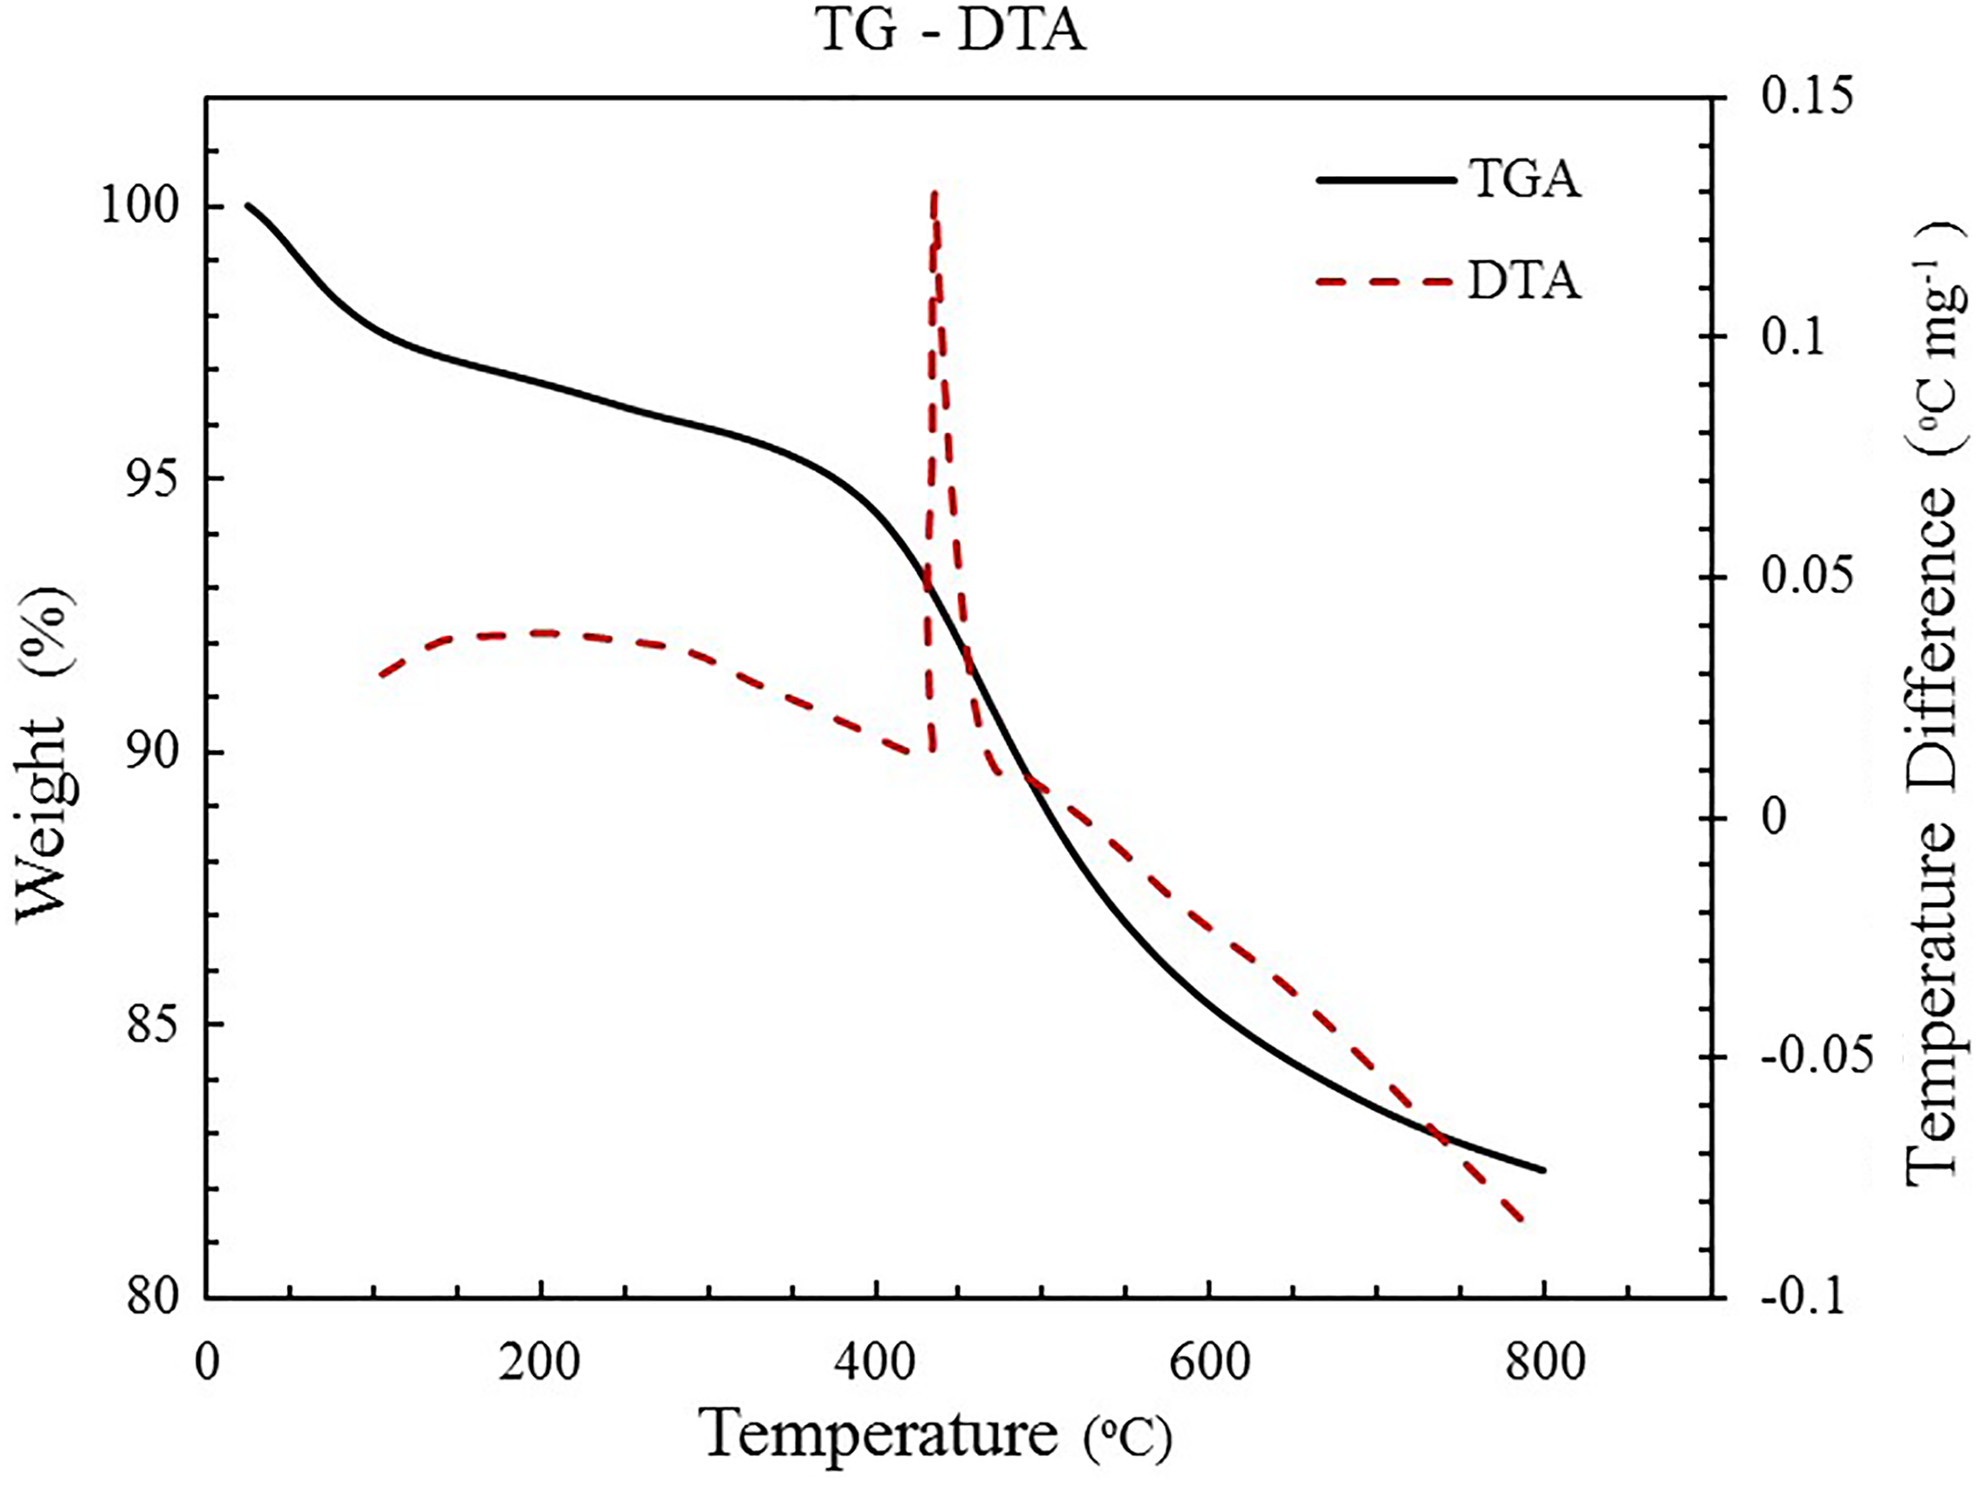
TG-DTA curve of a typical silica aerogel sample.
Furthermore, to evaluate hydrophobicity of the samples, in terms of retention of hydrophobicity, the hydrophobic silica aerogels were heat-treated from 100°C to 600°C in a furnace in air atmosphere. The visual hydrophobicity was tested with putting the aerogels on water. The results revealed that the aerogels maintain their hydrophobic properties at around 400°C. 39 Actually at high temperatures (up to 400°C), the –CH3 groups on the surface of the silica oxidize and gradually gain hydrophilic properties. However, the hydrophobicity of the aerogels can be tested by measuring the contact angle of water droplet on the aerogel surface. 45
The nitrogen adsorption–desorption isotherms of some silica aerogel samples are shown in Figure 5. The isotherms obtained for all samples are of type IV (according to IUPAC) which confirmed the mesoporosity of the materials. Furthermore, because of the capillary condensation, a hysteresis loop appeared in desorption cycle of isotherms. 46 According to IUPAC classification, the adsorption–desorption isotherm of the aerogel samples was type H1 which is often related to porous materials containing cylindrical pores open at both ends. 36,47 Also, the results of nitrogen adsorption–desorption isotherms indicated that all the synthesized samples had high specific surface area in the range of 584–660 m2 g−1 (Table 2).
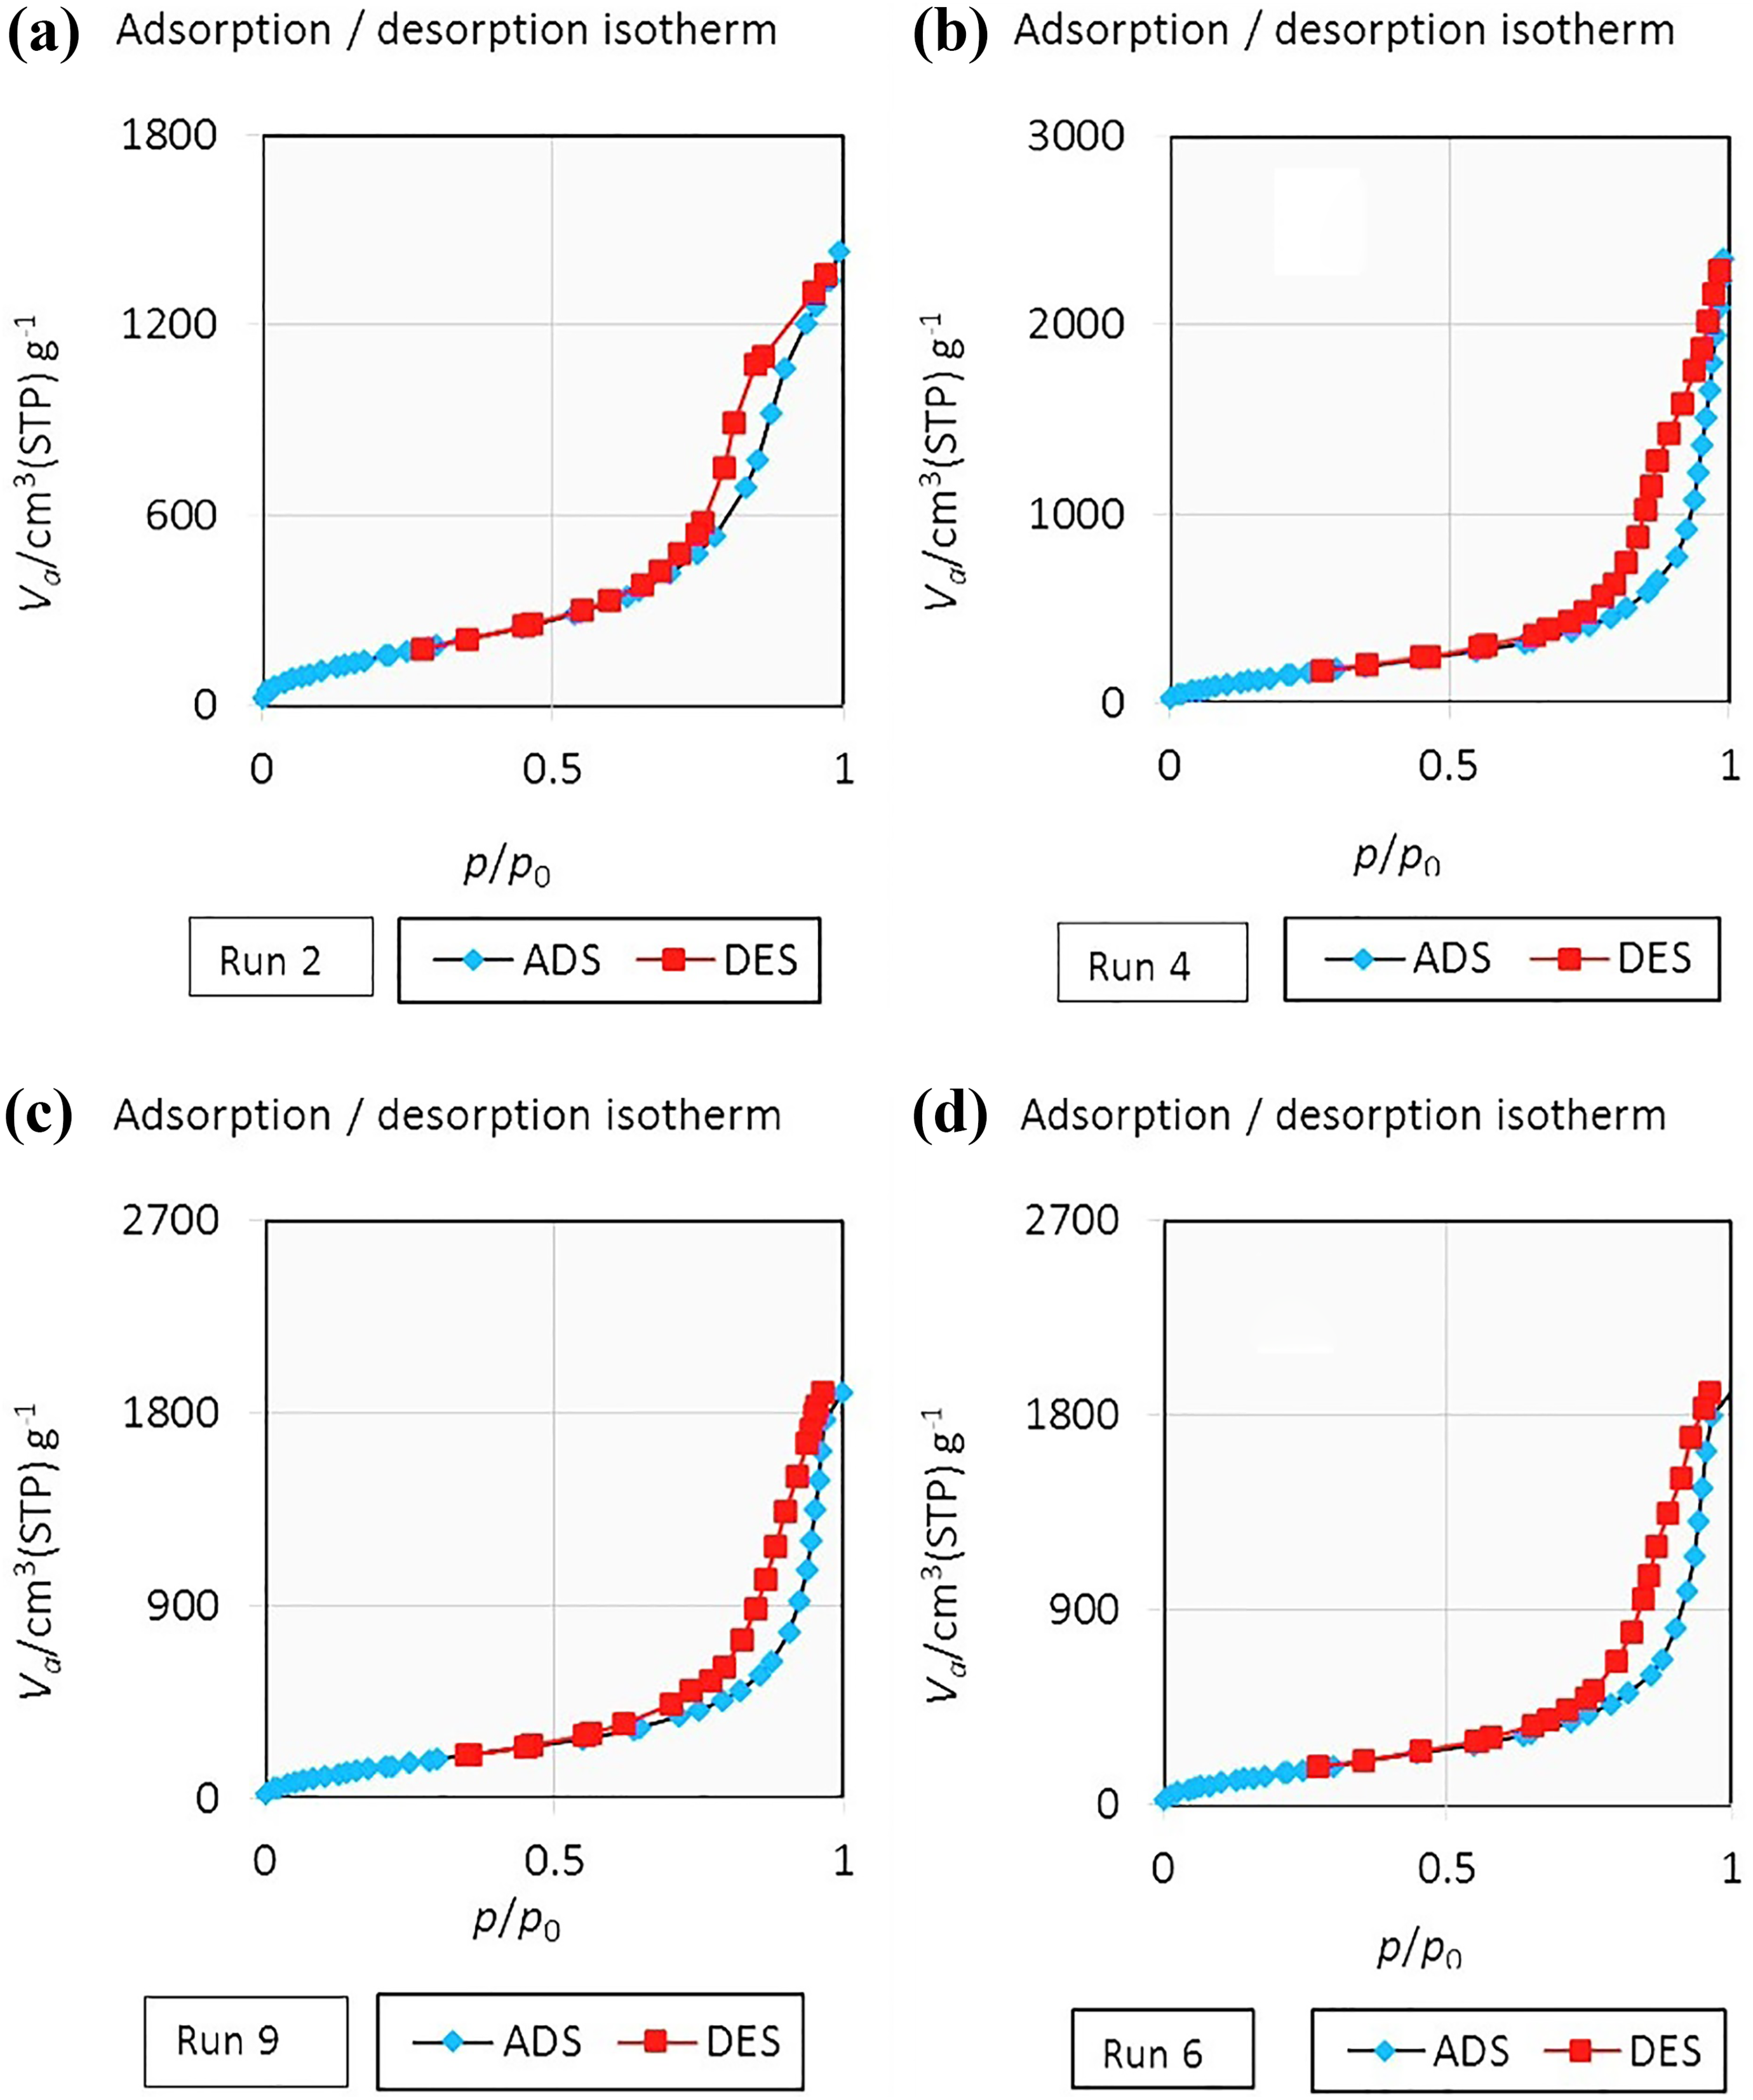
The N2 adsorption–desorption isotherm for some silica aerogel samples synthesized via ambient pressure drying, runs 2, 4, 6, and 9 (according to Table 2).
Figure 6(a) to (d) illustrates the PSD profiles (calculated from the BJH method and desorption isotherm data) of the aerogel samples synthesized by ambient drying method at various water:Na2SiO3 and TMCS:Na2SiO3 volume ratio as given in Table 2. All the samples displayed a wide peak in the mesoporous region (2–50 nm) which indicated that the synthesized aerogels preserved their structure even after drying at ambient pressure. Furthermore, the aerogel samples with high silica content (water:Na2SiO3 volume ratio equal to 4) showed relatively high pore size (Figure 6(d)). In addition, it was observed that increasing water:Na2SiO3 volume ratio from 4% to 8% followed by decreasing TMCS:Na2SiO3 volume ratio resulted in an aerogel network with smaller pore size and narrow PSD (Figure 6(b) and Table 2). Actually, the samples with higher TMCS:Na2SiO3 volume ratio (1.5–2.0) showed a relatively wider PSD with noteworthy number of pores up to 20 nm, as shown in Figure 6(a), (c), and (d) and Table 2. These results can be attributed to high surface modification of the hydrogels that reduces shrinkage significantly during ambient pressure drying, thereby preserving the pores with high diameter compared to those of synthesized at lower TMCS:Na2SiO3 volume ratio.

Pore size distribution profiles calculated from BJH method and desorption branch data for some silica aerogel samples synthesized via ambient pressure drying, runs 2, 4, 6, and 9.
Analysis of variance
RSM with CCD was used to investigate the simultaneous effect of processing variables, including water:Na2SiO3 and TMCS:Na2SiO3 volume ratio on textural properties of silica aerogels. The quality and accuracy of the achieved model related to each response was confirmed by analysis of variance (ANOVA) as listed in Tables 3 and 4. ANOVA results were reported based on 95% confidence level (α = 0.05). However, using ANOVA (Table 3), the statistical significance of each model using the values of regression and mean square of residual error was investigated. In other words, R 2 is a measure of the amount of variation around the mean explained by the model. Actually the equation of model is resolved using a statistical approach called the method of least square which is a multiple regression technique for fitting a mathematical model to a set of experimental data making the lowest residual possible. The residuals are the difference between the observed responses and the predicted responses. Finally, the importance of the first degree, second degree, and polynomial terms was determined. In general, a model can be fitted to the experimental data adequately, when the majority of variation observation be designated by the regression equation and other variation surely be due to the residuals. On the other hand, if the model offers a significant regression and a non-significant lack of fit, it can be fitted well to the experimental data.
Suggested model for each response followed by final equation in terms of coded factors and model summary statistics.
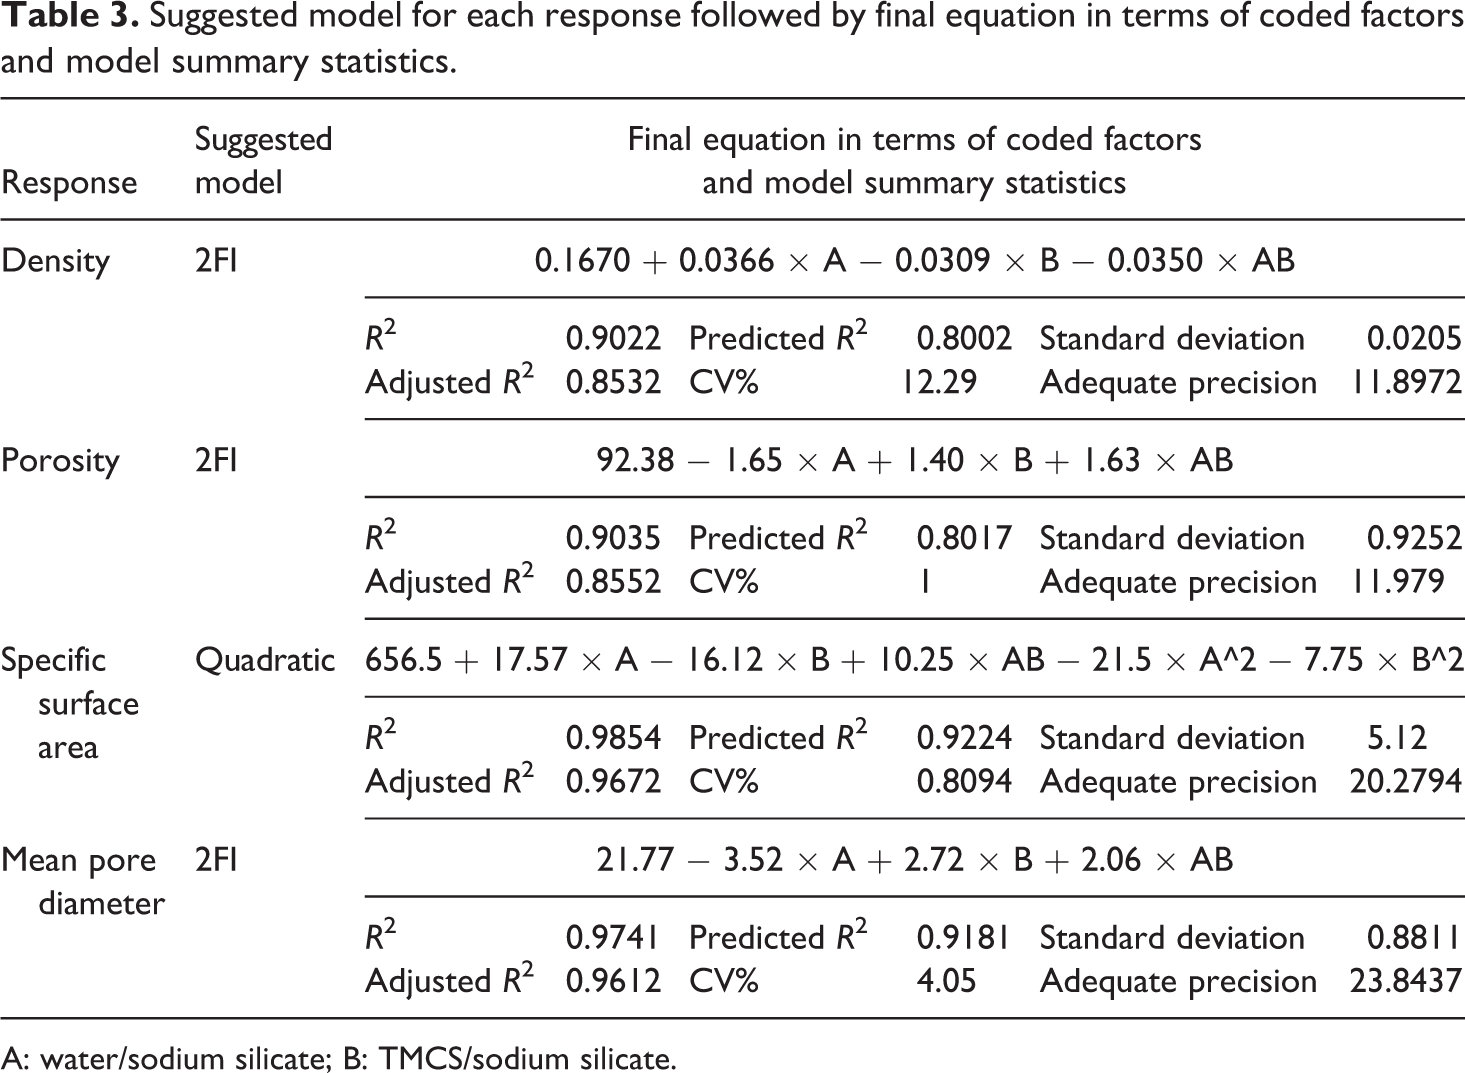
A: water/sodium silicate; B: TMCS/sodium silicate.
ANOVA and fit statistics for models.
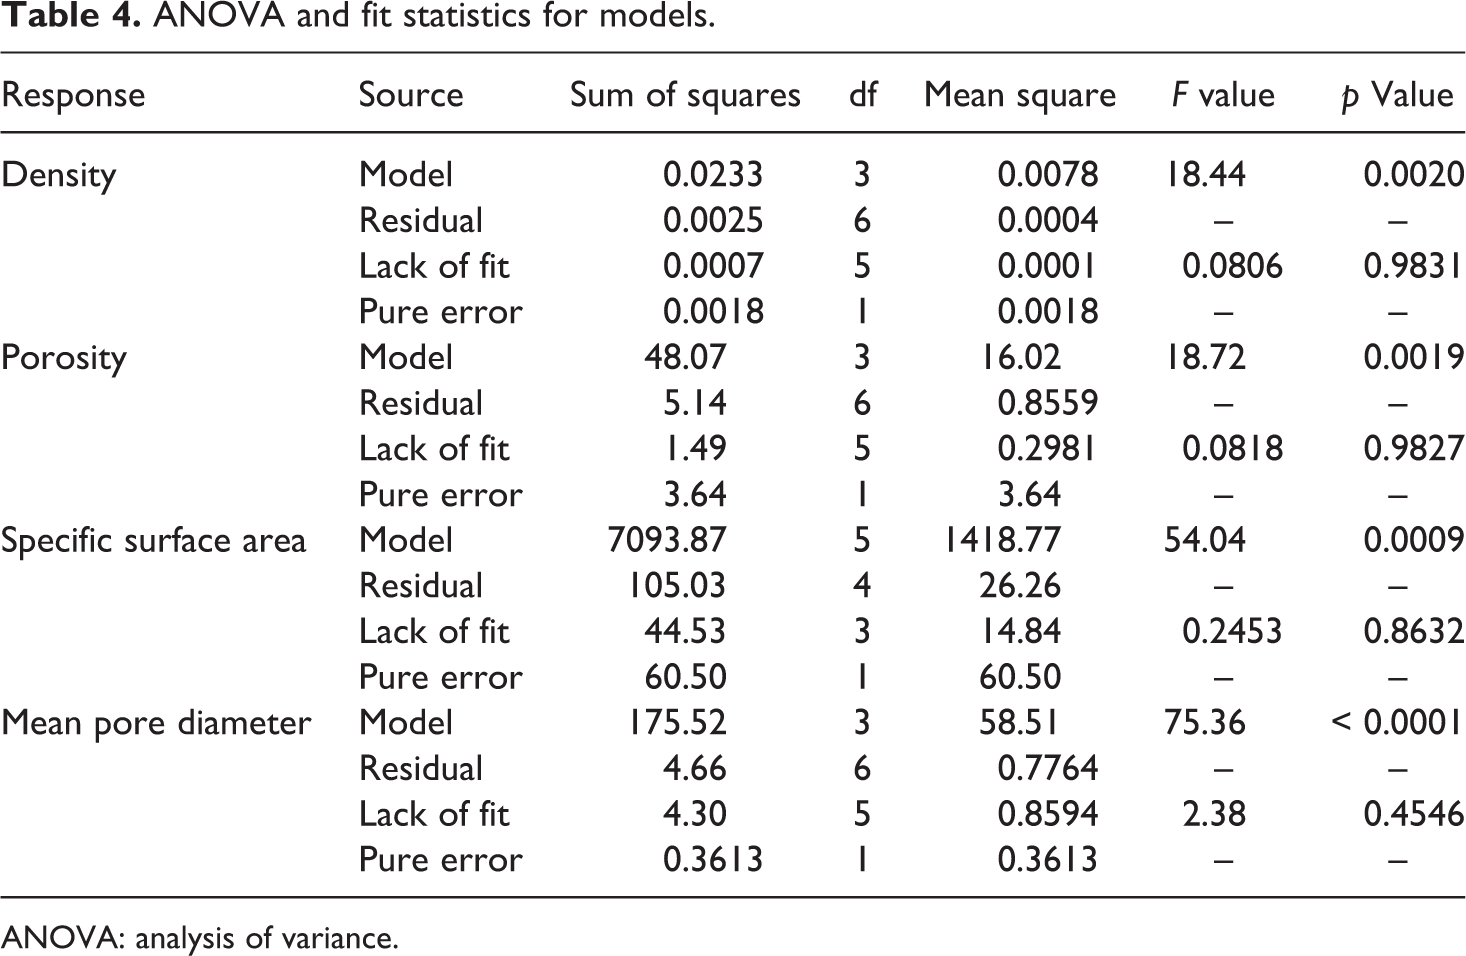
ANOVA: analysis of variance.
According to ANOVA’s table, a quadratic model can be used to fit sufficiently the response of the specific surface area with probability of more than 99%. It is important to note that the R 2 value for this response was 0.9854, indicating that 98.54% of the total variation in specific surface area was attributed to the independent variables and predicted model. Moreover, the standard deviation for this model was 5.12. In fact, higher R2 and smaller value of the standard deviation guarantee the closer predicted value to the actual one. 41,48
Furthermore, correlation magnitude of adjusted R 2 and predicted R 2 can be used to estimate adequacy of regression equation, so that higher values (close to unit) designate a better fitting between the observed and the predicted results. On the other hand, adjusted R 2 is a measure of the amount of variation around the mean defined by the model, adjusted for the number of terms in the model. Furthermore, predicted R 2 is a measure of the amount of variation in new data defined by the model. It is important to note that the predicted R 2 and the adjusted R 2 should be within 0.20 of each other. 42,43
As presented in Table 3, corresponding to the response of the specific surface area, values of adjusted R 2 (0.9672) and predicted R 2 (0.9224) were in reasonable agreement. In addition, the adequate precision of the specific surface area was 20.2794. The adequate precision is the signal-to-noise ratio which is determined by dividing the range of the predicted values (difference between the maximum and the minimum of the predicted response) at the design points to the average prediction error.
The adequate precision greater than 4 indicates that the mean of model is capable of providing proper performance according to the prediction. 32,33 Similarly, analysis of the related experimental data proved that density, porosity, and mean pore diameter response were well fitted to the related 2FI model with a probability of p > 99%. Furthermore, ANOVA results (Table 3) show that the R2 value for the responses of density, porosity, and mean pore diameter were 0.9022, 0.9035, and 0.9741, respectively. Further analysis of the gained results for these responses indicated that difference between the adjusted R 2 and predicted R 2 values of density, porosity, specific surface area, and mean pore diameter responses were negligible (<0.2), and the adequate precision of all related models were greater than 10. Therefore, it is confirmed that the models are adequate and the observed and predicted values are strongly correlated.
To fit the statistical models to the experimental data, the regression statistical significance and coefficients of the model were calculated according to p-value and F-value of each term (Table 4). The values of p < 0.05 suggest that the model terms are significant and the observations seldom happens by chance; this makes strong evidence against the null hypothesis. 41,49
The plot of residuals versus the predicted response for all responses revealed that all experimental data points are randomly distributed (Figure 7(a) to (d)). This suggests that these models are adequate. 50 Also, Figure 7 displays the correlation between the actual (observed) response values and predicted ones according to the related model equation. It confirms that the models were efficient in comparing the correlation between the variables.
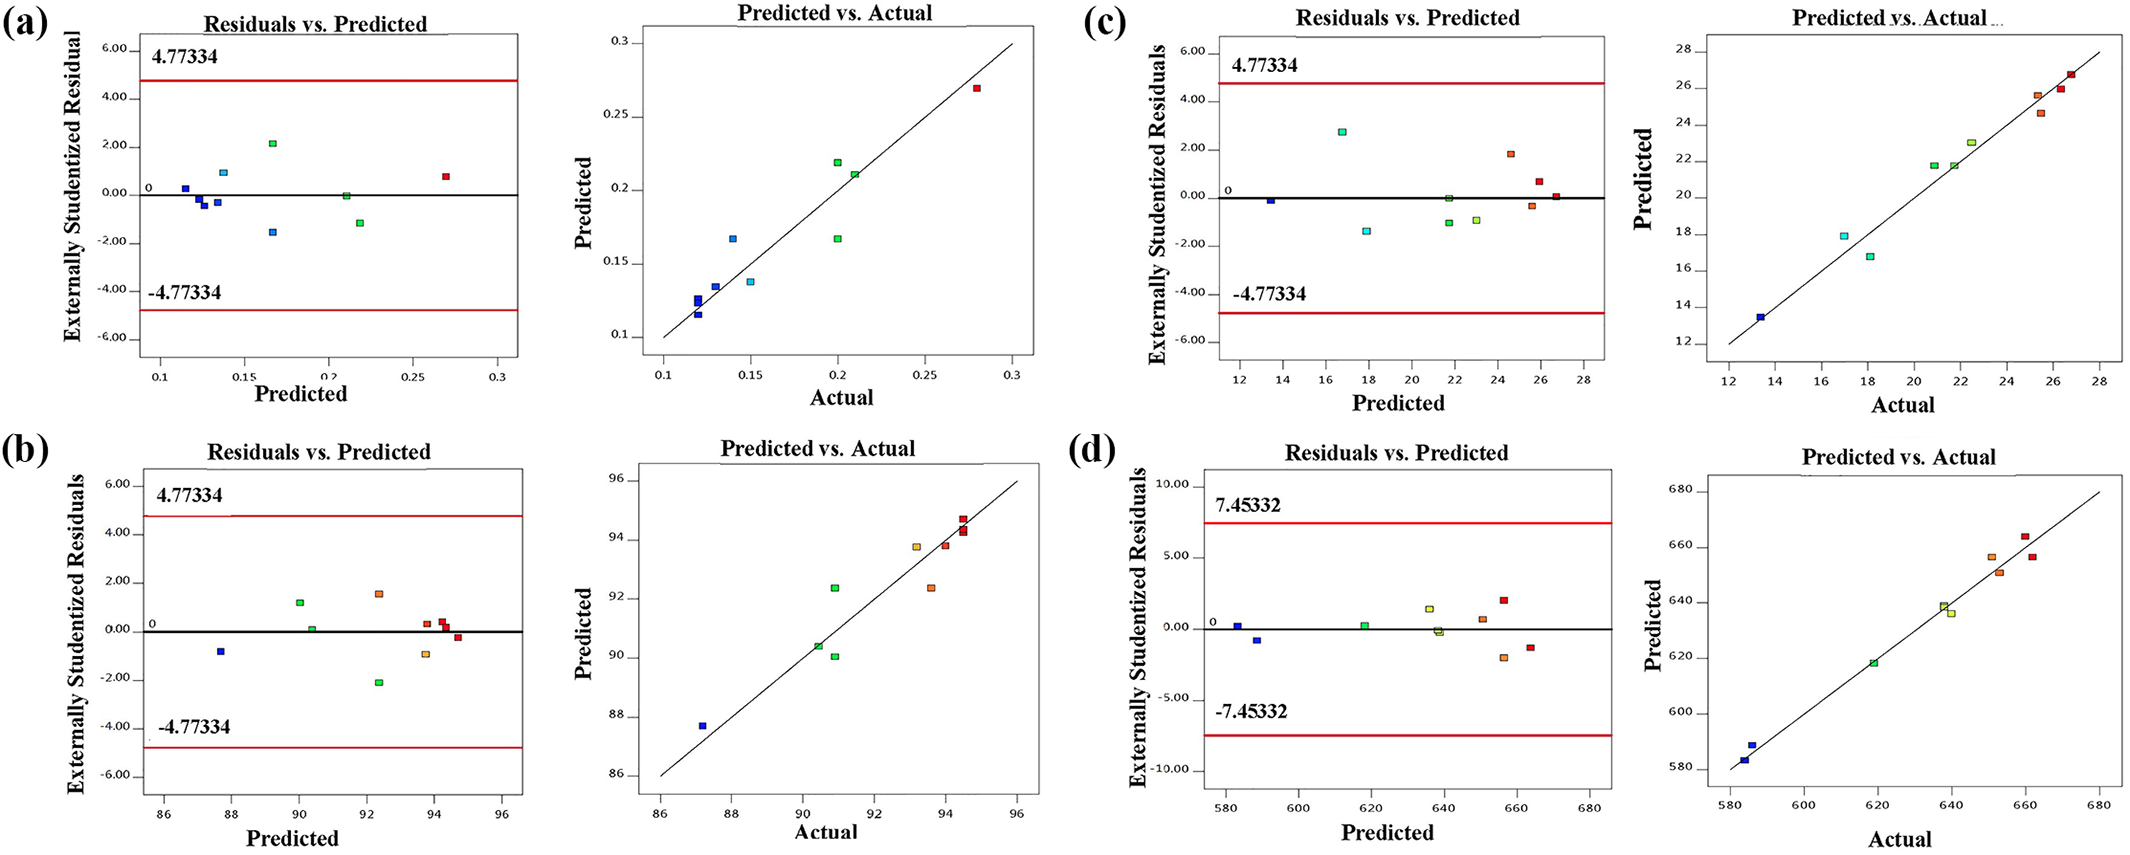
Plots of the residual versus the predicted response (left) and the actual versus the predicted response (right) for all the responses: (a) density, (b) porosity, (c) mean pore diameter, and (d) specific surface area.
3-D plots of all responses
Figure 8 displays 3-D plots for all responses, which shows the effect of change in the components ratio and interaction of variables on the magnitude of interesting response. According to Figure 8(a), it is obvious that at lower water:Na2SiO3 volume ratio (4–5), the density decreases and the lower value for density response (<0.3 g cm−3) is in blue region. In contrast, with increasing water:Na2SiO3 volume ratio (up to 6), density increases. As seen in 3-D plot of the porosity (Figure 8(b)), the highest values for porosity response (higher than 93%) can be achieved at the highest TMCS:Na2SiO3 (2.2) and at the lowest water:Na2SiO3 volume ratio (∼4). 3-D plot of the mean pore diameter (Figure 8(d)) displayed that the maximum value that can be obtained for this response was about 25 nm located at the lowest value of water:Na2SiO3 and highest value of TMCS:Na2SiO3 volume ratio. Furthermore, for high and low value of water:Na2SiO3 volume ratio, the specific surface area decreased (Figure 8(c)). Broadly speaking, it was found that by increasing the volume ratio of water:Na2SiO3 (6–7) followed by decreasing TMCS:Na2SiO3 volume ratio, the specific surface area was maximum (∼660 m2 g−1).
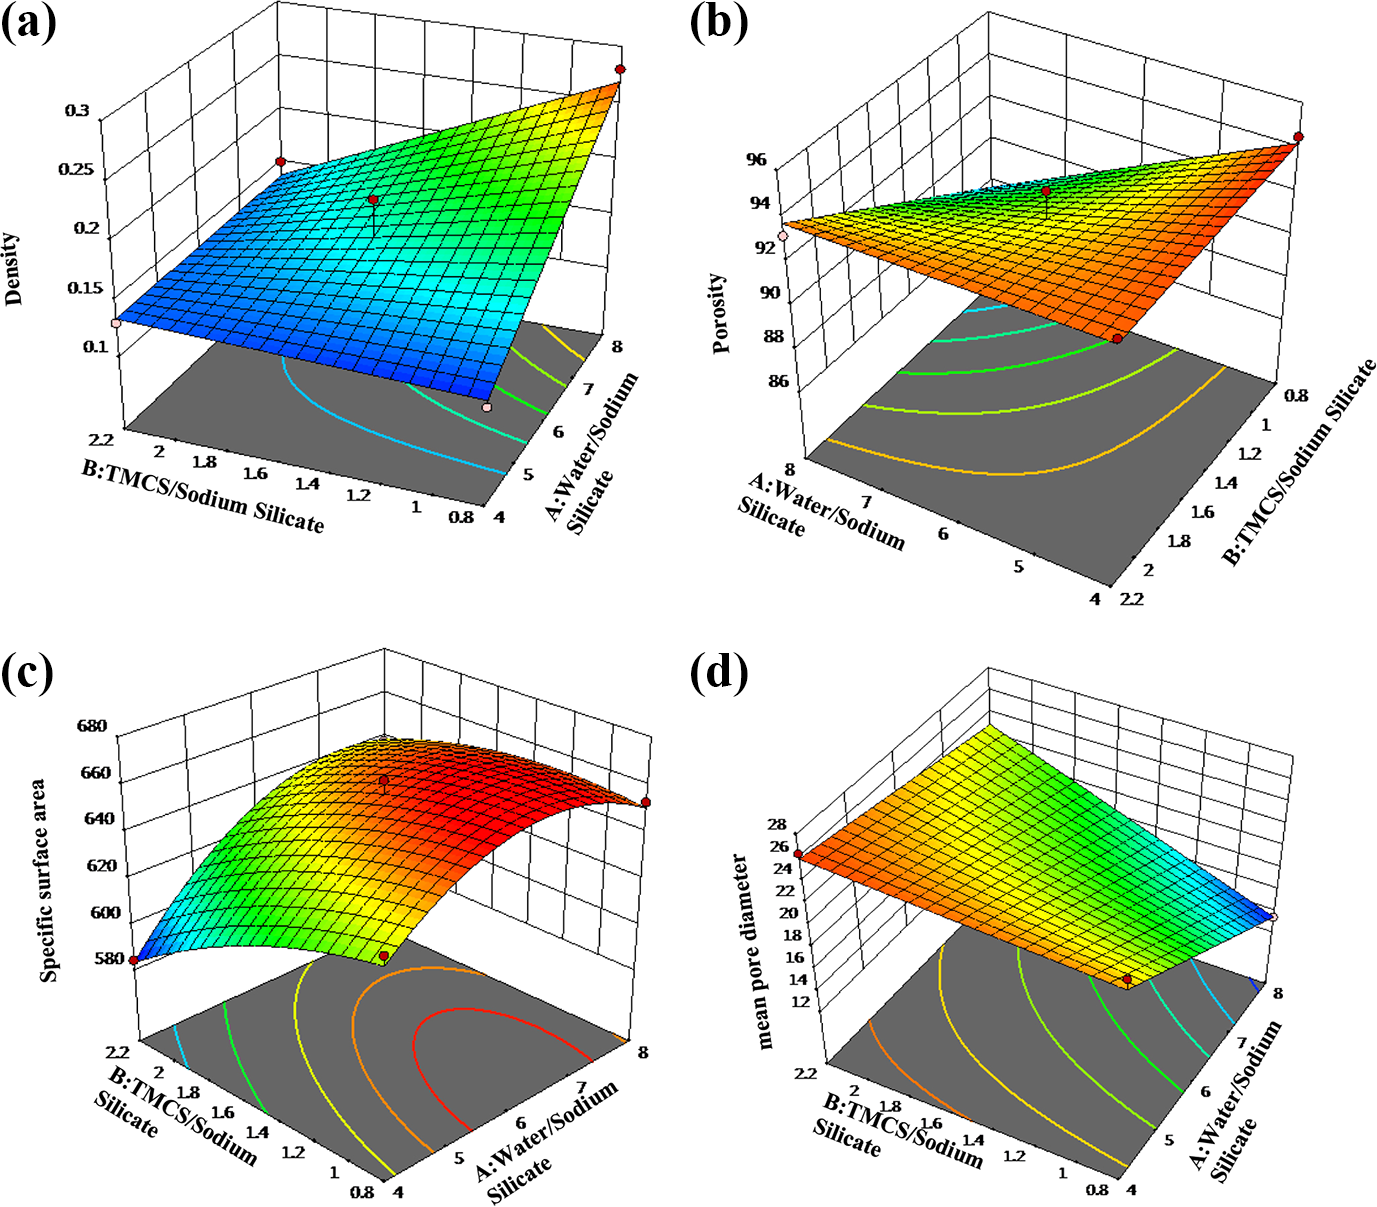
3-D plots for all responses: (a) density, (b) porosity, (c) specific surface area, and (d) mean pore diameter.
Our experiments are in line with the previous results. 2,20,21,51 Rao et al. found that the best volume ratio of water to sodium silicate (wt% of silica) is 4, which is the lowest density, while the aerogels with higher amount of water had a denser solid network and their porosity reduced. 52,21 Not surprisingly, our experiments prove that as water/Na2SiO3 volume ratio decreases (Figure 8), due to higher silica content in the sol, the rate of the gel formation increases. The results showed that particles with larger pore size can be produced as a result of the quick aggregation of the silica particles (Figure 8(d)). The samples with larger pore sizes preserve their structure against capillary forces induced by ambient pressure drying more than the ones containing smaller pores (Figure 8(b)). Besides, as water:Na2SiO3 volume ratio increases, connection between the silica particles diminishes. With reducing the mechanical strength of the aerogel network, pores will crumble by capillary forces induced by ambient pressure drying, bringing about increasing the density of the samples (Figure 8(a)).
To consider the effect of surface modification agent (TMCS) on the structural characteristics of the samples, TMCS:Na2SiO3 volume ratio was varied from 0.8 to 2.2 (Table 1). It was observed that with increasing TMCS:Na2SiO3 volume ratio, specific surface area decreases, while increasing water:Na2SiO3 volume ratio had an opposite effect (Figure 8(c)). Actually, when water:Na2SiO3 and TMCS:Na2SiO3 volume ratio were 6–7 and 0.8–1.4, respectively, specific area was maximum (660 m2 g−1). This is due to the fact that at this range, surface modification of the hydrogels has been carried out successfully. At higher volume ratio of TMCS:Na2SiO3 (>2), there is an excessive amount of surface modification agent throughout the material. Therefore, due to the rapid modification reaction between TMCS and surface groups, the capillary pressure is very intensive which causes the crackdown of the gel structure. 19 However, these findings are in contradiction with some previous results reported in the literature in which surface modification has been carried out with higher amount of TMCS. 21,52 For example, Rao et al. performed the surface modification reaction of the silica aerogels with varying TMCS:Na2SiO3 molar ratio (from 4.8 to 12), and it was recognized that with increasing TMCS:Na2SiO3 molar ratio up to 12, porosity, pore volume, and contact angle of the samples increase. 21 It seems that further data collection would be needed to determine exactly how the simultaneous change of TMCS and water combined with other variables (type of catalyst and alcohol) can affect the structural characteristics of the silica aerogels.
Optimization of all responses
Design Expert Software was employed to optimize the combination of the variables to provide the optimum responses for the application of the aerogels as thermal insulation additives. So far, many attempts have been made with the purpose of studying of the thermal conductivity within the aerogel structure. 53 –56 The effective total thermal conductivity in the aerogel structure strongly depends on solid backbone, porosity, and mean pore diameter of the synthesized aerogel. 57 It is generally believed that aerogels which consist of considerable porosity (>90%) and a nanostructure with pore sizes smaller than mean free path of the air molecules (preferably pore sizes between 4 nm and 20 nm) can extensively suppress the heat transfer through their network. 57,58 Furthermore, lower density of the material guarantees that the contribution of its solid backbone in heat transfer by conduction mechanism is negligible. This is the reason for the fact that the most commercially appropriate super-insulating silica aerogels have densities between 0.08 g cm−3 and 0.2 g cm−3. 57
Briefly, a nanoporous material as a good thermal insulator should have minimum density (<0.2 g cm−3), 59 maximum pore volume 60 , and mean pore diameter between 4 nm and 20 nm 58,61 with a reasonable specific surface area. 57 However, Spagnol et al. reported that the contribution of the heat transfer through gaseous phase (62%) is higher than that via solid phase (24%) and radiation mechanism (14%). 62 Therefore, these constraints were considered to optimize the basic variables that are water and surface modification agent. According to the desired goal, the solution with the most desirability was chosen (Table 5), which is displayed by a flag on the overlay plot (Figure 9). Therefore, for producing a sample with minimum density as much as possible, maximum porosity, mean pore diameter in the range of 4–20 nm, and appropriate specific surface area, water:Na2SiO3 and TMCS:Na2SiO3 volume ratio were chosen as 8 and 1.6, respectively, in the optimal formulation. As listed in Table 5, there is a satisfactory agreement between the obtained experimental data and the predicted value of the model denoting that the developed model was reasonably accurate.
The validation of RSM for prediction and optimization of all responses.
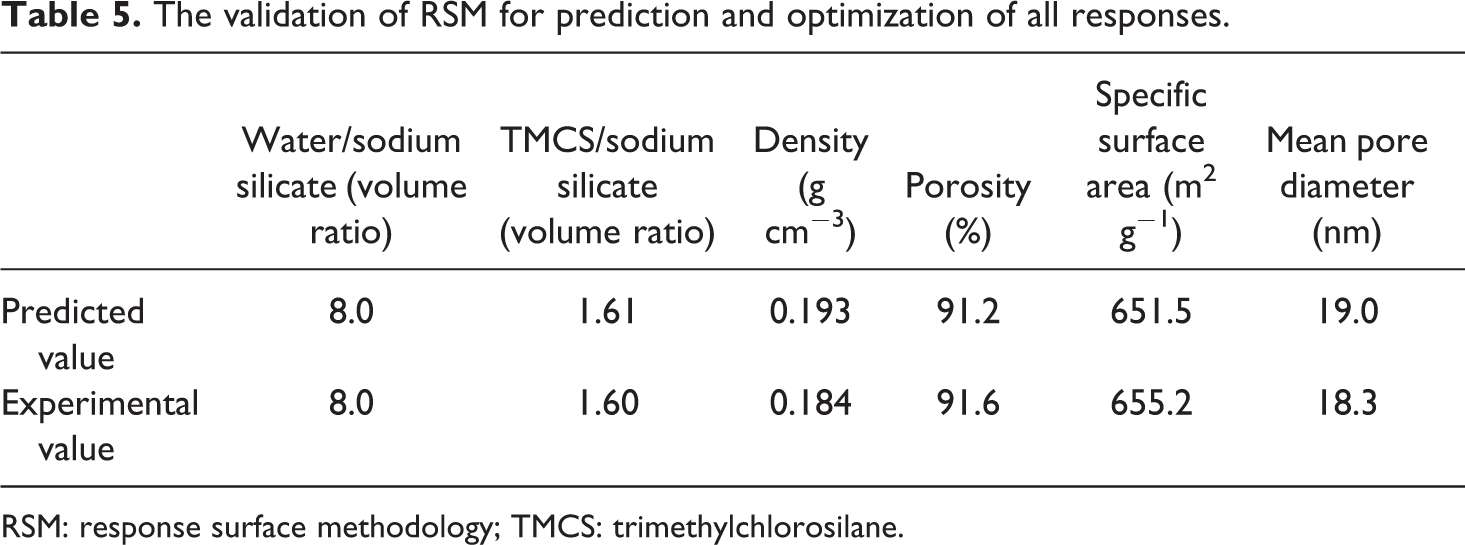
RSM: response surface methodology; TMCS: trimethylchlorosilane.
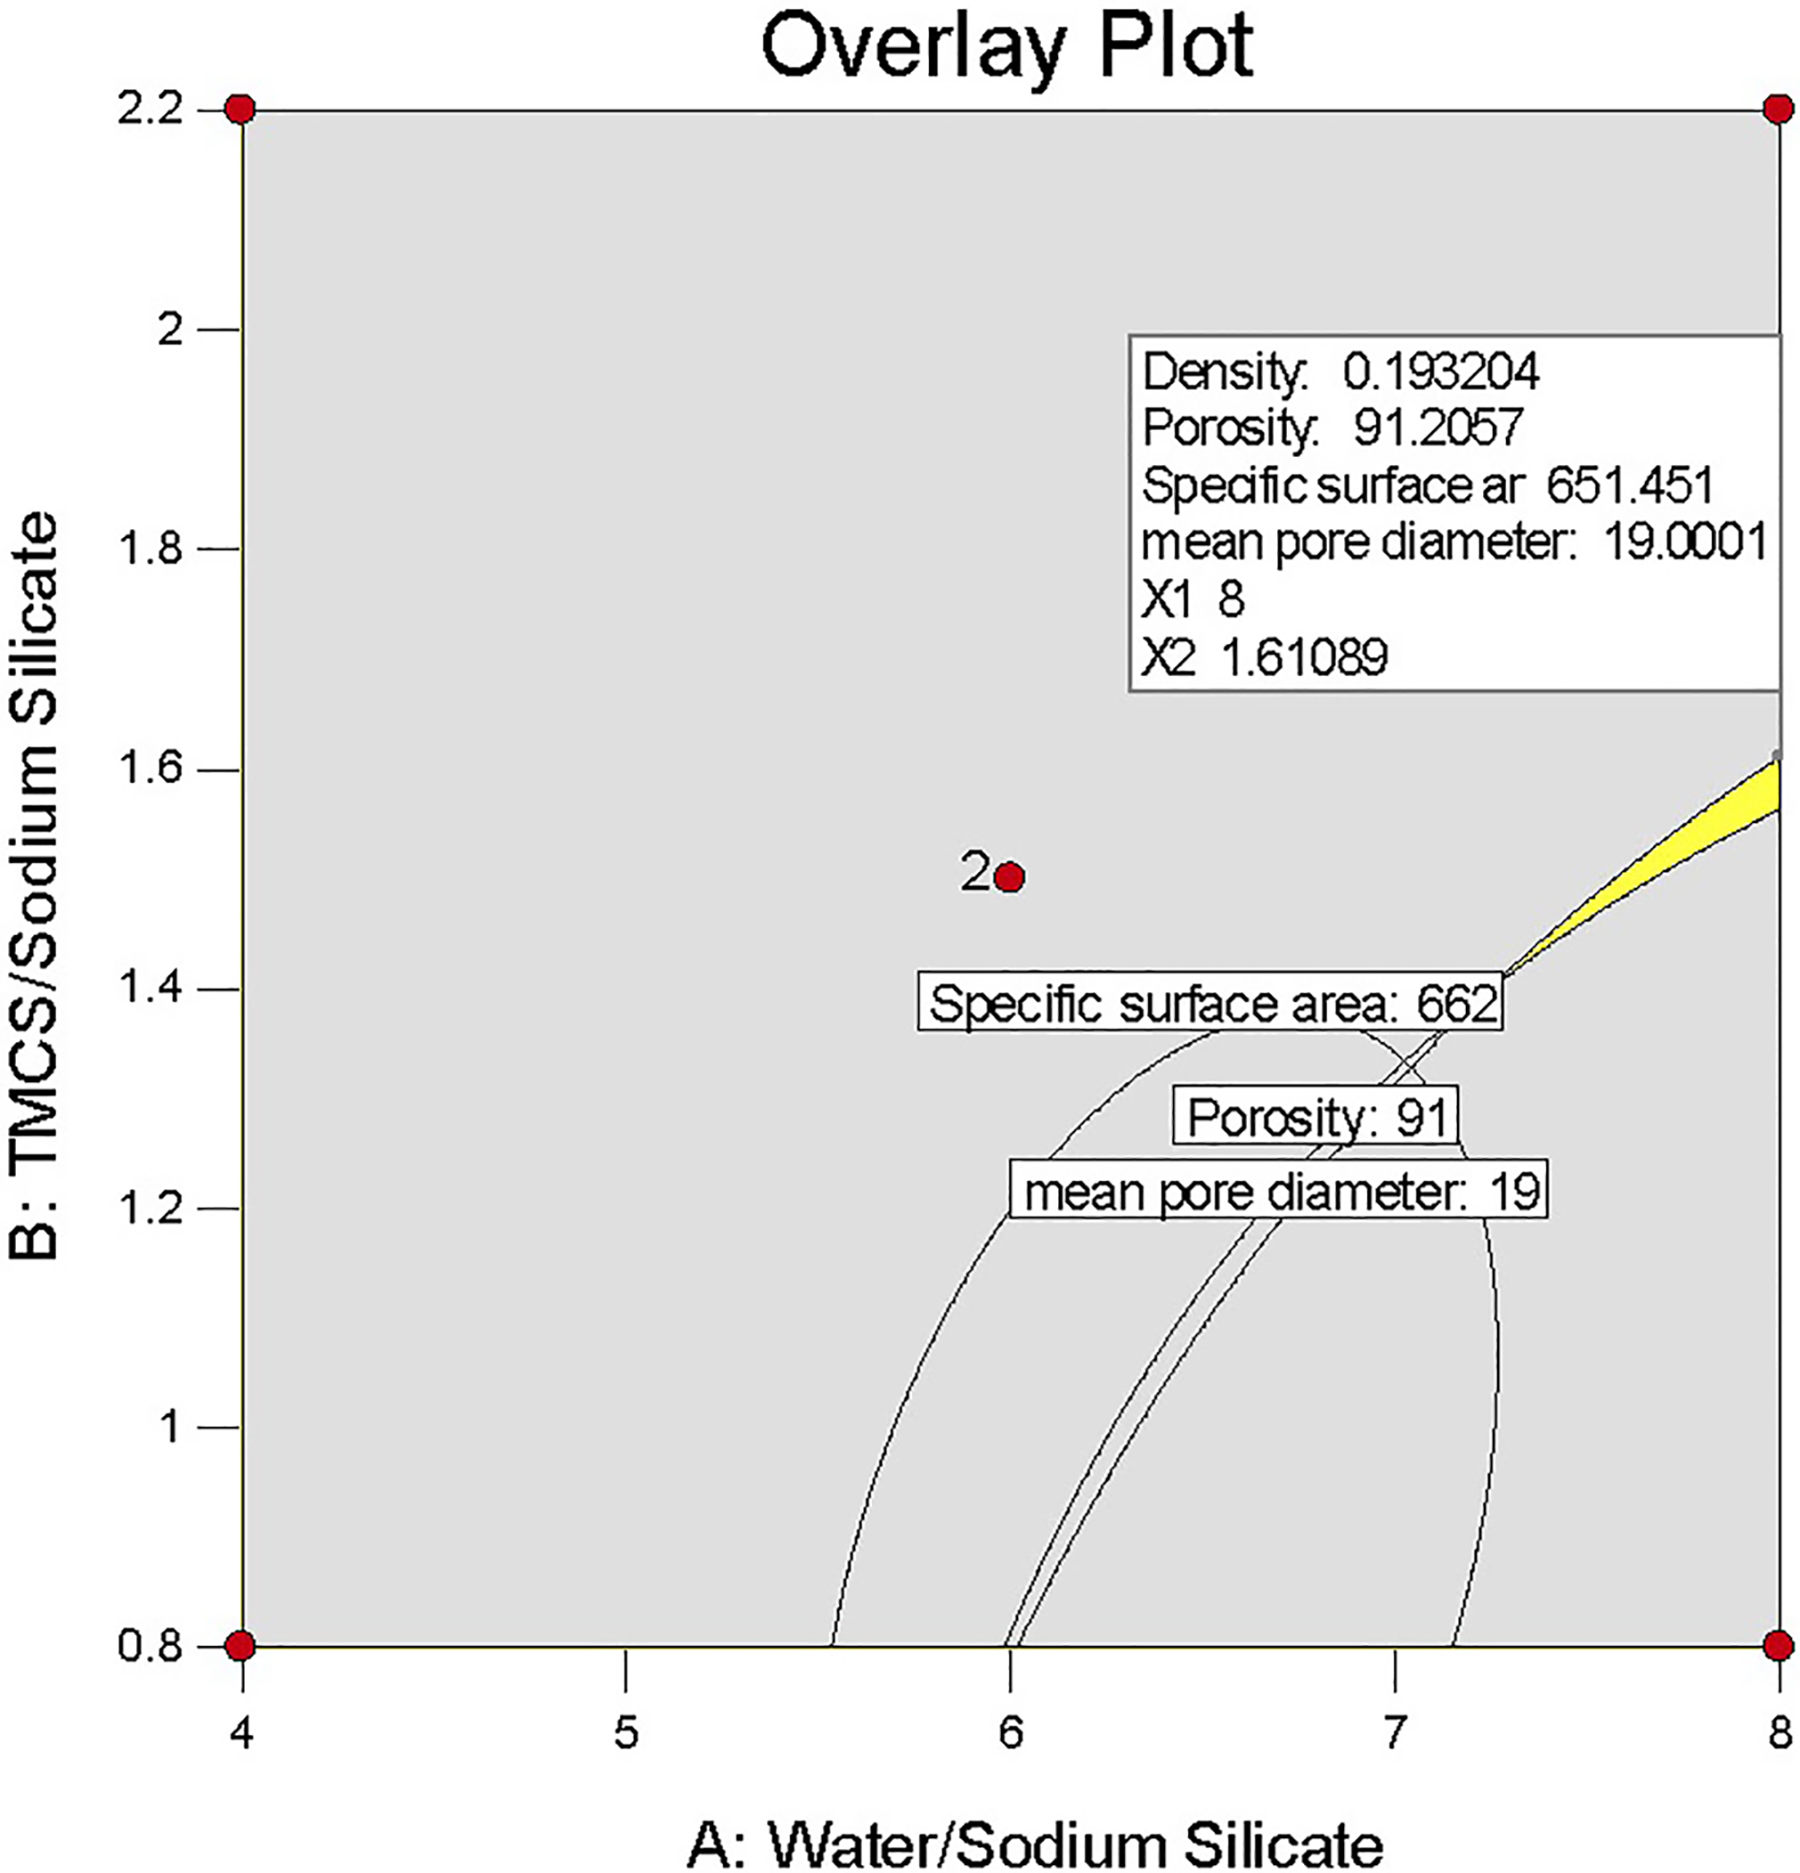
The overlay plot of the selected optimum condition. The sweet spot is highlighted in yellow.
Conclusion
In summary, the main purpose of the present study was to obtain ambient pressure dried sodium silicate-based aerogels with tailored properties that can be used as ideal additives for heat insulators. RSM in combination with CCD was employed to study the effect of independent variables on the porous properties of silica aerogels. The results showed that the increasing water:Na2SiO3 volume ratio (to about 8) at TMCS:Na2SiO3 volume ratio equal to 1.6 led to the decrease in the mean pore diameter of the aerogels (<20 nm), while the porosity and specific surface area of the aerogels remained high sufficiently. Such a porous structure can be taken into account as a potential candidate for thermal insulation applications. Using low-cost precursors and ambient pressure drying method combined with utilizing RSM for producing silica aerogels is a key step toward commercializing these materials with regard to the desired application area. The thermal properties and the insulation performance of the composites containing these aerogels will be investigated in our next article.